Embed Size (px)
Citation preview
*Corresponding author. Tel.: #1-614-292-1970; fax: #1-614-292-2359.
E-mail address: [email protected] (R.M. Stulz)q We are grateful to Jan Jindra, Dong Lee, and Gueorgui Slavov for research assistance. We
received valuable comments from Warren Bailey, Joshua Feuerman, John Gri$n, CampbellHarvey, Andrew Karolyi, Andy Lo, Anil Makhija, N. Prabhala, G. William Schwert, MichaelRashes, Andrei Shleifer, Robert Shiller, Russ Wermers, Ingrid Werner, an anonymous referee, andseminar participants at the Federal Reserve Board, Korea University, London Business School,MIT, Seoul National University, The Ohio State University, Virginia Tech University, YaleUniversity, University of California at Berkeley, World Bank, and participants at meetings of theNBER Asset Pricing Group, Q-Group, and the Korean Finance Association.
Journal of Financial Economics 54 (1999) 227}264
Do foreign investors destabilize stock markets?The Korean experience in 1997q
Hyuk Choe!, Bong-Chan Kho!, ReneH M. Stulz",#,*!Seoul National University, College of Business Administration, Seoul, South Korea
"Department of Finance, Fisher College of Business, The Ohio State University, 1775 College Road,Columbus, OH 43210-1144, USA
#The National Bureau of Economic Research, 1050 Massachusetts Avenue, Cambridge, MA 02138, USA
Received 24 June 1998; received in revised form 21 January 1999
Abstract
This paper examines the impact of foreign investors on stock returns in Korea fromNovember 30, 1996 to the end of 1997 using order and trade data. We "nd strongevidence of positive feedback trading and herding by foreign investors before the periodof Korea's economic crisis. During the crisis period, herding falls, and positive feedbacktrading by foreign investors mostly disappears. We "nd no evidence that trades byforeign investors had a destabilizing e!ect on Korea's stock market over our sampleperiod. In particular, the market adjusted quickly and e$ciently to large sales by foreigninvestors, and these sales were not followed by negative abnormal returns. ( 1999Elsevier Science S.A. All rights reserved.
PACS: G11; G15; G28
Keywords: Foreign investors; Positive feedback trading; Herding; East Asian crisis
0304-405X/99/$ - see front matter ( 1999 Elsevier Science S.A. All rights reserved.PII: S 0 3 0 4 - 4 0 5 X ( 9 9 ) 0 0 0 3 7 - 9

1Cross-border equity #ows are dwarfed by other cross-border capital #ows [see Stulz (1999) forsome data] but no other #ows are documented at the trade level, so we could not conduct our studyon non-equity transactions by foreign investors.
2Stulz (1999) provides a review of the earlier studies that use monthly data. Bailey et al. (1998)investigate the Tequila e!ect focusing on order-imbalances on the NYSE without being able todistinguish trades by foreign and domestic investors. They "nd no signi"cant evidence of such ane!ect for foreign stocks traded on the NYSE.
1. Introduction
In the second half of 1997, it became extremely common for political leadersas well as journalists to argue that foreign investors exert a destabilizingin#uence on emerging market economies. Foreign investors were often blamedfor the dramatic di$culties of the East Asian countries and for the collapse oftheir currencies and stock markets. For instance, Stiglitz (1998) calls for greaterregulation of capital #ows, arguing that &2developing countries are morevulnerable to vacillations in international #ows than ever before'. Academicshave pointed out that foreign investors could have a destabilizing e!ect fora variety of reasons. Dornbusch and Park (1995) argue that foreign investorspursue strategies that make stock prices overreact to changes in fundamentalsand more recently Radelet and Sachs (1998) attribute the East Asian economiccrisis to "nancial panic. If foreign investors can indeed destabilize economies,the bene"ts from opening markets to investors from all countries are substan-tially weakened and perhaps reversed. It is therefore crucially important tounderstand whether this is the case.
This paper examines the impact of foreign investors on stock returns in Koreaover the period from November 30, 1996, to the end of 1997.1 In 1996, Koreawas bigger than Mexico but smaller than Canada in terms of GDP and of stockmarket capitalization. Our sample period includes Korea's dramatic economiccrisis during the last few months of 1997. A good measure of the intensity of thiscrisis is that a dollar invested in Korea's stock market index on October 1, 1997would have been worth 35 cents on the last day of trading of 1997. Informationfor each trade on the Korea Stock Exchange allows us to classify buying andselling investors into three categories: Korean individual investors, Koreaninstitutional investors, and foreign investors.
These data enable us to investigate the pattern and impact of net purchases byinstitutions, individuals, and foreign investors during the trading day as well asacross days. Since the data include the time that an order arrives at the market,we can identify all trades that are initiated by foreign investors. We can thereforeinvestigate stock returns around the time of trades initiated by foreign investors.Furthermore, a number of studies, e.g., Bohn and Tesar (1996) and Clark andBerko (1996), show a positive contemporaneous relation between equity #owsand stock returns using monthly data.2 Such a relation could hold if foreign
228 H. Choe et al. / Journal of Financial Economics 54 (1999) 227}264

3Nofsinger and Sias (1999) make a similar point concerning the assessment of herding bydomestic institutional investors using low-frequency (monthly or yearly) data. They note thatherding measured this way is consistent with positive feedback trading at high frequency as well aswith domestic institutional investors having a permanent impact on prices.
investors buy following positive returns and sell following negative returns, ifforeign investors have a permanent impact on stock prices, and/or if the foreigninvestors are good market timers and invest before prices increase.3 With ourdata, we can di!erentiate between these possible views of the relation betweenequity #ows and stock prices.
It is often argued that the trades of foreign investors are highly correlated, sothat they buy and sell as a herd. For instance, Krugman (1997) describes moneymanagers as &an extremely dangerous #ock of "nancial sheep'. This herdingcould make trades by foreign investors destabilizing because foreign investorsend up trading as a group, thereby creating disarray and possibly panic in themarkets that they exit and overheating in the markets that they enter. Toinvestigate herding, we use the measures developed in Lakonishok et al. (1992)and Wermers (1999) and "nd them to be signi"cantly positive. These herdingmeasures are large for stocks of all sizes compared to the herding measures forinstitutional investors in the U.S. During the Korean crisis period, the herdingmeasures appear to decrease when we look either at all foreign investors or onlyU.S. investors. The fact that these measures do not decrease for the larger stocksin our sample suggests that one possible reason for the decrease in herding isthat lower liquidity during the crisis may have limited the trading of foreigninvestors.
Dornbusch and Park (1995) and others contend that the trades of foreigninvestors are a!ected by past returns, so that they buy when prices haveincreased and sell when they have fallen. Such a practice is called positivefeedback trading, and it would lead to the herding we document. Theoreticalmodels have shown that investors who buy as prices increase and sell as pricesdecrease can exert a destabilizing in#uence on the stock market. DeLong et al.(1990) o!er an analysis of these potential destabilizing e!ects of positive feed-back trading. We investigate the period before the Korean crisis separately fromthe period during the crisis. Before the crisis, we "nd clear evidence of positivefeedback trading: foreign investors buy (sell) more Korean stocks on daysfollowing an increase (decrease) in the market as a whole and they buy (sell)Korean shares that outperformed (underperformed) the market over the pre-vious day. This evidence is consistent with the evidence of Froot et al. (1998).They investigate the relation between equity #ows and stock index returns withtrades of the institutions using State Street Bank & Trust as their repository, andthey conclude that past returns explain 60}85% of the quarterly covariancebetween stock index returns and equity #ows. When we turn to the crisis period,
H. Choe et al. / Journal of Financial Economics 54 (1999) 227}264 229

the evidence of positive feedback trading becomes much weaker. In particular,the sign of the previous day's market return has no information for the trades offoreign investors on the next day. We also "nd that the sign of the previous day'sstock return is not helpful in predicting the trades of foreign investors in thatstock the next day.
In theoretical models, concerns that positive feedback trading and herdinghave a destabilizing impact on prices arise because positive feedback traders canpush prices away from fundamentals when they form a herd. The argument isthat traders can make money by buying following price increases regardless ofwhether the price increases are rational or not because positive feedback traderswill push prices higher. Investors trading on fundamentals might make money inthe long run by selling short when prices are too high. Unfortunately for theseinvestors, positive feedback trading can keep prices increasing long enough toforce them to liquidate their positions before they start making pro"ts. Theargument that positive feedback trading and herding are destabilizing thereforeimplies that prices exhibit momentum. In other words, if positive feedbacktraders are selling, prices keep falling. For at least two reasons, however, positivefeedback trading and herding are not necessarily destabilizing. First, investorstrading on fundamentals may be su$ciently powerful in the markets to preventprices from moving away from fundamental values. Second, positive feedbacktraders may be trading in response to information about fundamentals, so thattheir trading does not drive prices away from fundamentals. Empirical researchis therefore required to settle the issue of whether positive feedback trading andherding are destabilizing.
To examine whether the trading practices of foreign investors are destabiliz-ing, we conduct two distinct event studies. In the "rst study, we measureabnormal returns for the 11 "ve-minute intervals centered on intervals withlarge foreign trades for the stocks in our sample. In the second study, we usedays instead of "ve-minute intervals. The hypothesis that foreign trades aredestabilizing can be rejected if additional price movements in the same directionas the price impact of the trades do not follow large foreign trades. In otherwords, if further price drops do not follow a large foreign sale, we conclude thatnet selling by foreign investors is not destabilizing. Presumably, one might beable to construct scenarios in which rational pricing implies momentum. Fromthe perspective of this study, however, the absence of momentum following largetrades by foreign investors means that we can reject the hypothesis that thesetrades are destabilizing.
Considering "rst the analysis using intraday data, we "nd that large buytrades initiated by foreign investors are associated with a stock price increase forthe "ve minutes during which the large buy trade takes place and during thenext "ve minutes. Thereafter, there are no positive signi"cant returns. Large selltrades initiated by foreign investors are associated with a stock price decline thatis partially reversed over the next 25 minutes of trading. The last three months of
230 H. Choe et al. / Journal of Financial Economics 54 (1999) 227}264

4 Interestingly, the price impact around large foreign trades is not very di!erent from the evidencefor block trades in the U.S. For example, Holthausen et al. (1990) "nd that most of the e!ect ofa large block trade on the NYSE is permanent and takes place with the trade itself.
1997 do not seem to di!er from the rest of the sample with respect to theintraday returns surrounding large purchases or sales initiated by foreigninvestors.4 None of this evidence suggests that sales by foreign investors havea destabilizing impact.
When we look at daily returns, we focus on all trades by foreign investorsrather than only the trades they initiate. We "nd that the signi"cantly positivereturns on days with large net foreign buying of a stock are followed by reversalsprior to the last three months of 1997, but not during the Korean crisis period.Rather surprisingly, days with large net foreign selling of a stock have a positivemarket-adjusted return before the crisis period. Such a result is consistent withtrades by Korean individuals having a much stronger impact on returns thantrades by foreign investors. Days with large net selling by foreign investors aredays with large net buying by Korean individuals. Based on our evidence, theimpact of domestic buying on stock returns dominates the impact of foreignselling. During the last three months of 1997, days with large foreign net sellingdo not have signi"cant market-adjusted returns; even raw returns on these daysare not signi"cantly negative. There is therefore no convincing evidence thatforeign investors play a destabilizing role.
An interesting feature of the Korean stock market is the existence of dailyprice limits on individual stocks. The daily return of individual stocks cannotexceed 8% in absolute value during our sample period. Price limits make it morelikely that we will "nd e!ects consistent with a destabilizing in#uence of foreigninvestors because, on average, a stock that has fallen 8% in one day is likely tohave a negative return the next day. Hence, whenever foreign investors trade ondays when the limit is hit, one would expect a negative return the next day ratherthan a reversal. As discussed later, our conclusions are not a!ected by theexistence of price limits.
The paper proceeds as follows. In Section 2, we introduce our data andpresent information on foreign holdings of stocks. In Section 3, we test forherding. In Section 4, we investigate whether foreign investors engage in positivefeedback trading and how their trading compares to domestic trading. InSection 5, we look at the intraday and daily returns associated with large foreigntrades. We conclude in Section 6.
2. The Korea Stock Exchange and sample construction
The Korea Stock Exchange (KSE) holds two trading sessions on each week-day: a morning session and an afternoon session. The morning session operates
H. Choe et al. / Journal of Financial Economics 54 (1999) 227}264 231

from 9:30 through 11:30, and the afternoon session starts at 13:00 and closes at15:00. Batch auctions are used three times a day to determine the opening pricesof each session and the daily closing prices. There are no trades during the lastten minutes of each day, when orders are collected for the closing batch auctionat 15:00. Trading prices during the rest of the trading hours are determined bycontinuous (or non-batch) auction. On Saturdays, there is only a morningsession and the closing price is determined by the batch auction. The KSE doesnot have designated market makers. Buyers and sellers meet via the AutomatedTrading System (ATS). Before November 25, 1996, only limit orders wereallowed, but since then markets orders have been allowed as well.
The database used is the intersection of two databases with raw data providedby the KSE and compiled by the Institute of Finance and Banking (IFB) atSeoul National University. The "rst database includes all transactions on theKSE for the period from 1993 to 1997. This database has each order time-stamped as of the time that it arrives at the exchange and as of the time that theorder is executed. The data provide information on the country of residence ofinvestors as well as on whether they are individuals or institutions. The seconddatabase has daily foreign ownership data from November 30, 1996, through theend of 1997 for all stocks listed on the KSE. Foreign investors in Korea mustregister with the Securities Supervisory Board (SSB) and obtain an ID numberbefore they can start trading stocks. The SSB uses this ID number to ensure thatthe foreign ownership limit for each company and each foreign investor is notexceeded by informing the KSE whether a foreign order satis"es the companyand investor limits. The ownership limit for each individual foreign investor was5% of a "rm's shares until May 2, 1997, when it increased to 6%. It thenincreased to 7% on November 3, and to 50% on December 11, 1997. Inaddition, foreign investors as a group could not own more than 20% of a "rm'sshares. This aggregate ownership limit on foreign investors increased to 23% onMay 2, 1997, to 26% on November 3, 1997, and "nally to 50% on December 11,1997. Foreign investors are not allowed to sell shares short. There is no record ofdaily foreign ownership available prior to November 30, 1996. Since we needboth databases for our study, we are therefore constrained to use the sampleperiod of the daily foreign ownership database. One limitation of the foreignownership database is that it is possible that trades we identify as foreign tradesare actually trades by Korean investors who set up a foreign nominee companyto trade on the KSE.
Over our sample period there are three Korean American DepositoryReceipts (ADRs) trading on the NYSE in addition to the Korea Fund. At theend of 1996, the shares corresponding to the ADRs represent a small fraction ofthe outstanding shares of the "rms that have issued ADRs (2.3% for Kepco,5.2% for Posco, and 1.8% for SK Telecom). Our data exclude New Yorktrading. If Korean residents trade in New York, we have no way of knowing it.This may not be important, however, because all ADRs are treated as shares
232 H. Choe et al. / Journal of Financial Economics 54 (1999) 227}264

held by foreign investors that count towards the foreign ownership limit. Inaddition, New York trading does not appear to be important. NYSE ADR dailytrading represents less than 20% of the daily trading volume in Korea of thecompany's stock for the whole sample period and less than 10% during thecrisis.
We conduct our analysis on two types of trades. First, we use all trades,regardless of who initiates the trade. Since we are concerned about the impact oftrades by foreign investors on prices, we would like to identify those trades thatare most likely to a!ect prices. Thus, we consider what we call price-settingtrades. For NYSE data, it is common to identify the initiating party of a tradeusing a tick test such as the one proposed by Lee and Ready (1991). There is noneed for a tick test with our data because we know which party initiates thetrade. A buy-side (sell-side) price-setting trade for foreign investors is a trade inwhich the foreign investors' buy (sell) order comes after the sell-side (buy-side)order and hence makes the trade possible. For price-setting trades, we cantherefore only consider trades that take place during the non-batch auctionperiod. We consider split trades originated from one order as one trade irre-spective of whether we consider all trades or only price-setting trades.
The sample of stocks we use throughout the paper contains 414 of the 762stocks listed on the KSE at the end of November 1996 and is constructed asfollows. We start from the common stocks whose foreign investment ceiling was20% at the end of November 1996. Government-operated "rms and "rms withdirect foreign investment had a di!erent ceiling and were excluded. A largenumber of stocks have infrequent trading by foreign investors. We thereforerequire stocks to have more than 20 days of foreign price-setting trades fromDecember 2, 1996 to October 31, 1997. We also exclude 48 stocks that were atthe foreign ownership limit on December 2, 1996. Since foreign investors cannotbuy shares of these stocks on the exchange, we cannot use them for tests thatrequire foreign investors to be able to both buy and sell shares. These 48 stocksare interesting because they are larger "rms. The capitalization of the stocks atthe limit on December 2, 1996, is on average 521 billion Won and in total 21%of the market's capitalization, in contrast to the capitalization of the stocks inour sample which is on average 159 billion Won and in total 55% of themarket's capitalization. Since the ownership limits are higher during the crisisperiod and are no longer binding, we discuss results of an analysis of the impactof trades by foreign investors on the 48 stocks during the crisis.
Our dataset misses two types of transactions by foreign investors. First,foreign investors could buy Korean shares from other foreign investors on theover-the-counter market by o!ering a premium. Such trades enabled investorsindexing to a Korean benchmark to do so when stocks in the benchmarkwere at the foreign ownership limit. There would seem to be no reason forforeign investors to use the over-the-counter market for stocks where foreignownership is below the aggregate foreign investment ceiling. Consequently,
H. Choe et al. / Journal of Financial Economics 54 (1999) 227}264 233

over-the-counter trades should not be relevant for our sample. Second, foreigninvestors could enter into over-the-counter derivatives transactions functionallyequivalent to trades in Korean shares, such as equity swaps on the KOSPIindex. Such transactions are not included in our dataset. Discussions withpractitioners suggest that such swap transactions occurred during the crisisperiod between equity portfolio managers and hedge funds.
Table 1 provides information on foreign ownership by size deciles at the endof November 1996 as well as information on foreign volume and foreignprice-setting volume for the period from December 2, 1996 to December 27,1997. As documented by Kang and Stulz (1997) for Japan, foreign ownership isstrongly positively related to size. For the smallest decile of Korean stocks,median foreign ownership is 2.09%. It increases to 13.48% for the largest decile.The average foreign ownership is 3.16% for the smallest decile and 11.89% forthe largest decile. Overall, average foreign ownership is 6.47% and medianforeign ownership is 4.52%. Although we do not reproduce these results ina table, we "nd that the median market model beta of the stocks held by foreigninvestors is 1.05 and the mean beta (against the KOSPI index) is 1.01. There istherefore no evidence that foreign investors choose stocks that have di!erentsystematic risk than the typical stock. Table 1 shows that foreign investors arenot trading disproportionately relative to their ownership, and the volume oftheir price-setting trades is not disproportionate either. These results contrastwith the results of Tesar and Werner (1995) who "nd that the turnover rates offoreign investors in Canada, the U.K., and the U.S. are higher than the turnoverrates of domestic investors in these markets.
It is useful to compare foreign ownership in our sample to foreign ownershipin the market as a whole. The average foreign ownership across the samplestocks is higher at the beginning of our sample period (6.47%) than in themarket as a whole (5.69%). In contrast, value-weighted foreign ownership,de"ned as the value of shares held by foreign investors divided by the marketcapitalization, is higher in the market as a whole (12.00%) than in our sample(9.38%). The di!erence between the equal-weighted and value-weightedmeasures arises because foreign investors hold more stocks in large companiesand the foreign ownership limit is more likely to be binding for large capitaliza-tion stocks than for other stocks.
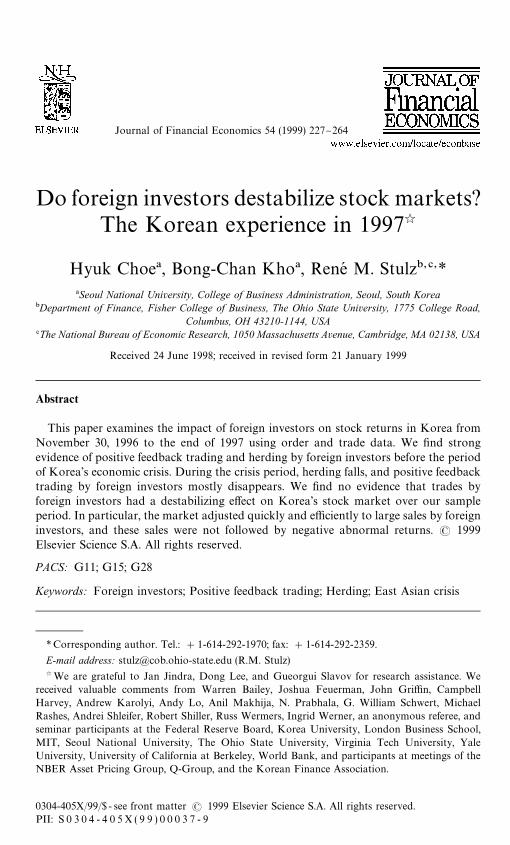
Fig. 1 shows the time-series of the KOSPI index, the Won/USD exchangerate, and various measures of foreign ownership. In our sample, foreign inves-tors hold 4.62% of a "rm's shares on average at the end of the sample period ascompared to 6.47% at the beginning of the sample period. The same pattern,though less pronounced, holds for the market as a whole, where average foreignownership falls from 5.69% to 5.04%. Using a value-weighted measure offoreign ownership, however, there is no drop in ownership for the market aswhole. For the market as a whole, foreign investors own 12.00% of the marketcapitalization at the start of our sample period and 14.73% at the end. In
234 H. Choe et al. / Journal of Financial Economics 54 (1999) 227}264

Tab
le1
Fore
ign
ow
ner
ship
,per
cent
age
ofdai
lytr
ade
volu
me
and
price
-set
ting
trad
evo
lum
efo
rth
ree
types
ofi
nve
stor
sat
the
KSE
from
Dec
.2,1
996
toD
ec.2
7,19
97.
The
sam
ple
consist
sof
414
com
mon
stock
sse
lect
edfrom
all7
62co
mm
onst
ockslis
ted
onth
eK
SEon
Nov.
30,1
996.
The
sam
ple
stoc
ksar
eth
ose
that
dono
thit
the
fore
ign
inve
stm
ent
ceili
ngof
20%
asof
Nov.
30,19
96.Sto
cks
with
ceili
ngs
oth
erth
an20
%ar
eex
clude
d(e
.g.,
those
with
fore
ign
dire
ctin
vest
men
tsh
ares
orgo
vern
men
t-op
erat
ed"rm
s).T
he
sam
ple
stock
sal
sohav
em
ore
than
20day
sof
fore
ign
pric
e-se
ttin
gtr
ades
from
Dec
.2,1
996
toO
ct.
31,19
97.T
heta
ble
show
sav
erag
esofth
efo
reig
now
ners
hip
acro
ssth
e41
4st
ocks
bysize
dec
ileas
ofN
ov.30
,19
96.A
lso
pre
sent
edar
eth
eav
erag
eper
centa
gesofd
aily
trad
evo
lum
ean
dpr
ice-
sett
ing
trad
evo
lum
eat
trib
uted
toin
stitutions,
indi
vidua
ls,a
nd
fore
igner
sfrom
Dec
.2,1
996
toD
ec.2
7,19
97.
Aprice
-set
ting
buy
(sel
l)tr
ade
isde"
ned
asa
trad
ew
here
the
buy
-sid
e(sel
l-side
)ord
eris
rece
ived
atth
eex
chan
gela
terth
anth
ese
ll-side
(buy
-sid
e)ord
er.
Firm
size
Dec
ileFore
ign
ow
ners
hip
(%)
Per
cent
age
ofda
ily
trad
evo
lum
e(%
)P
erce
nta
geofdai
lypr
ice-
sett
ing
volu
me
(%)
dof
stock
sM
ean
Med
ian
Sto
ck-d
ays
Inst
itution
Indi
vidua
lFore
igne
rSto
ck-d
ays
Inst
itution
Indi
vidua
lFore
igne
r
1(S
mal
lest
)41
3.16
2.09
12,6
816.
4191
.43
1.33
11,4
036.
2292
.04
1.10
241
4.31
2.77
12,6
228.
7387
.92
2.19
12,3
508.
0189
.04
2.03
342
5.94
3.95
12,7
889.
9986
.38
2.75
12,2
109.
3887
.43
2.53
441
5.37
3.74
12,7
0411
.27
85.3
32.
4612
,234
10.6
186
.13
2.35
542
4.95
3.50
12,9
6012
.21
83.3
93.
2612
,450
11.7
084
.13
3.12
641
5.13
3.49
12,7
1113
.08
82.2
63.
4912
,463
12.6
182
.87
3.54
742
6.08
4.11
12,9
9013
.49
81.2
83.
8012
,764
12.8
782
.09
3.80
841
8.22
6.23
12,7
4417
.10
76.7
44.
8312
,050
17.1
576
.67
5.01
942
9.64
8.85
13,0
8717
.64
73.6
27.
3412
,847
17.7
973
.91
7.22
10(L
arge
st)
4111
.89
13.4
812
,753
18.6
067
.31
12.8
612
,711
18.6
167
.87
12.4
4
All
(414
stock
s)41
46.
474.
5212
8,04
012
.87
81.5
44.
4412
3,48
212
.58
82.0
74.
37
H. Choe et al. / Journal of Financial Economics 54 (1999) 227}264 235

Fig. 1. Time-series plots of the daily foreign ownership for 414 stocks by three groups (F1}F3) basedon their foreign ownership rankings as of Nov. 30, 1996, the daily value-weighted foreign ownershipcomputed as total value of foreign holdings to total market value (for 762 common stocks), theKOSPI daily index, and the Won/USD daily exchange rates for the period from Nov. 30, 1996 toDec. 27, 1997.
contrast, in our sample, foreign investors own 9.38% at the start of our sampleperiod and 9.04% at the end. It is important to note, however, that whilethe share of the market capitalization held by foreign investors increased for themarket as a whole, the dollar value of the Korean shares held by foreigninvestors fell dramatically because of the fall both in equity values and in thedollar price of the Won, which is documented in Fig. 1.
3. Do foreign investors herd?
In this section, we evaluate the extent to which foreign investors herd bothbefore and during the crisis period. There is a growing theoretical and empiricalliterature on herding. Recent papers by Nofsinger and Sias (1999) and Wermers(1999) contain overviews of the theoretical and empirical literatures on herding.In this literature, herding can be the outcome of investors using the sameinformation to trade or the product of irrational psychological factors. Our testsof herding take the narrow and simple view of herding that is prevalent in theempirical literature. We consider that foreign investors herd if they tradesimilarly over a short interval of time, namely a day. We therefore do not test
236 H. Choe et al. / Journal of Financial Economics 54 (1999) 227}264

5Trading from Malaysia is unlikely to be trading by Malaysian investors. The government ofMalaysia established in 1990 an international o!shore "nancial center in the federal territory ofLabuan, which a lawyer described to us as the equivalent of the Cayman Islands in the Asia-Paci"cregion. Although we cannot identify Korean investors using the Labuan "nancial center to trade inKorea under nominee names, our results do not change even after excluding Malaysian investors asa whole.
alternate models in which herding takes place over longer periods of time in thispaper. Such tests would be useful, but the crisis period is too short to make itpossible to implement such tests. Investigating herding would not be veryinteresting if there were few foreign investors. This is not the case. At the end of1996, there were 5,294 registered foreign investors. Interestingly, this numberincreased sharply over the last two years. In June 1998, there were 7,998registered foreign investors. At that time, U.S. investors represented 37.7% ofthe total number of foreign investors.
As a starting point for our investigation, Table 2 provides statistics for tradingby foreign investors during our whole sample period for the 414 stocks in oursample. For the 16 countries with trading reported separately, we "nd that 14countries are net sellers of shares. More importantly, when we compute thedollar value of shares sold and the dollar value of shares bought for each of the16 countries using Won transaction prices and daily exchange rates, we "nd thatthe dollar value of the purchases exceeds the dollar value of the sales for onlyfour countries. The preponderance of net selling cannot be explained by chanceat reasonable signi"cance levels if the sign of the net trading is random acrossinvestors. This result is, however, consistent with herding. Most of the trading isdone by investors from the U.K., U.S., and Malaysia.5 The U.S. investors buyand sell the most shares. U.S. investors sell more shares than they buy, but thevalue of their purchases exceeds the value of their sales because they buy higherpriced shares than they sell. The U.K. investors trade less but their net selling ofshares is dramatic compared to the net selling of shares of U.S. investors. TheU.K. investors bought 64 million shares, but sold 123 million shares. Finally, theMalaysian investors are the second most active group of investors. Investorsfrom Germany and Taiwan actually bought more shares than they sold. We alsoconstructed but do not report a table like Table 2 for the 762 stocks traded onthe Korea Stock Exchange. The results for that table are similar to those shownhere, except that the dollar amount of net selling is smaller. The reason for that isthat foreign investors bought more shares of the stocks at the foreign ownershiplimit as that limit was relaxed.
To investigate whether foreign investors herd, we follow the approach ofLakonishok et al. (1992) and Wermers (1999) to estimate the importance ofherding. We compute their herding measure using a daily horizon and treat eachtrade on a day as made by a di!erent foreign investor since we do not haveidenti"cations for individual foreign investors. Speci"cally, the herding measure
H. Choe et al. / Journal of Financial Economics 54 (1999) 227}264 237

Tab
le2
Tra
ding
activi
tyoffo
reig
nin
vest
ors
by
coun
try
atth
eK
SE
from
Dec
.2,
1996
toD
ec.27
,199
7.
For
each
ofth
efo
reig
nbuy
and
sell
trad
esat
the
KSE
from
Dec
.2,
1996
toD
ec.
27,
1997
,th
efo
reig
nin
vest
or's
count
ryis
iden
ti"ed
usin
gth
eco
rres
pond
ing
code
sin
the
IFB
/KSE
dat
abas
e.The
sam
ple
stock
sin
clude
414
stock
sse
lect
edfrom
all7
62co
mm
on
stock
slis
ted
onth
eK
SEon
Nov.
30,1
996.
The
table
show
sth
etr
adin
gvo
lum
eby
fore
ign
inve
stor
sag
greg
ated
acro
ssth
eirco
untr
iesan
dex
pres
sed
both
inte
rmsoft
hou
sand
sof
shar
esan
ddolla
rs.The
dolla
rvo
lum
eis
valu
edat
each
tran
sact
ion
price
inK
ore
anW
onan
dth
enco
nver
ted
into
dol
lars
using
the
dai
lyex
chan
gera
te.
Fore
ign
inve
stors'
countr
y
Shar
esboug
htShar
esso
ldN
etbo
ugh
tA
mount
bough
tA
mount
sold
Net
boug
ht
('000
shrs
)(%
)('0
00sh
rs)
(%)
('000
shrs
)('0
00U
$)(%
)('0
00U
$)(%
)('0
00U
$)
US
132,
019
(31.
1)14
8,03
1(2
5.1)
!16
,012
1934
,366
(28.
6)15
93,4
86(2
1.2)
340,
880
UK
64,4
34(1
5.2)
123,
394
(20.
9)!
58,9
6010
36,6
13(1
5.3)
1400
,242
(18.
6)!
363,
629
Irel
and
45,2
86(1
0.7)
72,6
74(1
2.3)
!27
,388
893,
825
(13.
2)11
44,7
44(1
5.2)
!25
0,91
9G
erm
any
1,04
8(0
.2)
856
(0.1
)19
212
,841
(0.2
)10
,848
(0.1
)1,
993
Fra
nce
4,95
3(1
.2)
6,94
9(1
.2)
!1,
996
76,7
96(1
.1)
83,9
51(1
.1)
!7,
155
Can
ada
14,2
54(3
.4)
16,9
16(2
.9)
!2,
662
165,
873
(2.4
)16
8,01
9(2
.2)
!2,
146
Swiss
7,45
8(1
.8)
17,4
24(3
.0)
!9,
966
124,
681
(1.8
)22
1,78
0(2
.9)
!97
,099
Net
herlan
ds
3,20
1(0
.8)
8,75
8(1
.5)
!5,
557
61,0
74(0
.9)
92,0
28(1
.2)
!30
,954
Luxe
mbou
rg12
,574
(3.0
)14
,659
(2.5
)!
2,08
520
6,82
0(3
.1)
183,
421
(2.4
)23
,399
Aust
ralia
6,74
1(1
.6)
10,0
57(1
.7)
!3,
316
95,8
19(1
.4)
124,
544
(1.7
)!
28,7
25N
ewZea
land
5,38
0(1
.3)
7,99
8(1
.4)
!2,
618
122,
664
(1.8
)12
5,55
6(1
.7)
!2,
892
Japa
n1,
758
(0.4
)3,
482
(0.6
)!
1,72
428
,460
(0.4
)32
,726
(0.4
)!
4,26
6M
alay
sia
105,
666
(24.
9)13
3,53
6(2
2.6)
!27
,870
1674
,544
(24.
7)19
82,0
99(2
6.3)
!30
7,55
5Tai
wan
1,27
8(0
.3)
595
(0.1
)68
314
,418
(0.2
)7,
793
(0.1
)6,
625
Singa
pore
2,68
5(0
.6)
3,88
4(0
.7)
!1,
199
52,4
09(0
.8)
70,0
46(0
.9)
!17
,637
Hong
Kon
g1,
049
(0.2
)2,
535
(0.4
)!
1,48
617
,607
(0.3
)26
,874
(0.4
)!
9,26
7O
ther
s(3
1co
untr
ies)
14,6
59(3
.5)
17,9
99(3
.1)
!3,
340
252,
122
(3.7
)25
7,63
6(3
.4)
!5,
514
Tota
l42
4,44
3(1
00.0
)58
9,74
7(1
00.0
)!
165,
304
6770
,932
(100
.0)
7525
,793
(100
.0)
!75
4,86
1
238 H. Choe et al. / Journal of Financial Economics 54 (1999) 227}264

is computed as Dpit!E(p
it)D!EDp
it!E(p
it)D, where p
itis the proportion of
foreign investors buying stock i on day t among all foreign investors trading thatstock on that day, E(p
it) is the expected proportion of foreign investors buying
on day t relative to all foreign investors. EDpit!E(p
it)D is an adjustment factor
computed assuming that in the absence of herding the number of foreigninvestors with net purchases follows a binomial distribution that we compute asin Wermers (1999). We compute this herding measure for each stock each dayusing all 414 stocks. We then create portfolios based on size and past-weekreturns and take an average across stocks for each portfolio. The portfolios areequally weighted and rebalanced every week.
Table 3 shows estimates of the herding measure using all foreign investors. Itis immediately apparent that the herding measures were uniformly positivebefore the Korean crisis. Wermers (1999) provides herding measures for U.S.mutual funds from 1975 to 1994. He splits his sample across size quintiles andpast-return quintiles. Looking at his data across all funds, the highest herdingmeasure he "nds is 8.39%, except for the smallest stocks. In contrast, before thecrisis, no herding measure we report is below 20%. Wermers (1999) looks atherding over a quarter. In contrast, we measure herding on a daily basis. Whenmeasured over longer time intervals, herding could increase if not all institutionsthat move in the same direction do so on the same day or it could decrease ifsimilar trades by institutions lead some institutions to trade in the oppositedirection. The "rst possibility would seem to be more important than the secondone, so that we may understate herding. In contrast to Wermers (1999), it doesnot seem that herding is systematically related to prior return or size. Whilethere is strong evidence of herding prior to the Korean crisis, there is noevidence that herding is more important during the crisis period. Twenty-four of25 measures are lower during the crisis period than before and 18 are signi"-cantly lower at the 10% level using t-tests for mean di!erences. As explainedearlier, though, herding does not have to be destabilizing.
In Table 3, we treat each purchase as a purchase by a distinct foreign investor,which may overstate the degree of herding, since the same foreign investor maybuy or sell the same stock several times during the same day. One way we avoidthis problem is to investigate herding across classes of foreign investors ratherthan across all foreign investors. Using the identi"cation codes in our data forthe country of residence as well as the investor type, we attribute each trade byforeign investors to one of 658 classes based on both 47 countries and 14investor types. Foreign investors are divided into resident and non-resident. Theclasses of non-resident foreign investors are individuals, banks, insurance com-panies, securities "rms, mutual funds divided into two types (corporate types,which issue stocks, and contract types, which issue bene"ciary certi"cates withgenerally a stated maturity), other corporations, non-resident Korean investors,and pension funds. (Non-resident Korean investors account for less than 1/100of 1% of the shares sold by foreign investors.) There are also "ve classes of
H. Choe et al. / Journal of Financial Economics 54 (1999) 227}264 239

Tab
le3
Lak
oni
shok
etal
.(19
92)he
rdin
gm
easu
res
(inper
centg
es)fo
rfo
reig
nin
vest
ors
bysize
and
past
-wee
kre
turn
por
tfolios
on
the
KSE
stoc
ks
To
com
put
eher
din
gm
easu
resfo
rfo
reig
nin
vest
ors
,eac
hof
thefo
reig
nbu
yan
dse
lltr
ades
on
asa
mple
oft
he41
4st
ock
sat
theK
SE
from
Dec
.2,1
996
toD
ec.2
7,19
97is
assu
med
toorigi
nat
efrom
ase
par
ate
fore
ign
inve
stor
,us
ing
the
iden
ti"ca
tion
code
sin
the
IFB
/KSE
data
bas
e.The
herd
ing
mea
sure
for
agi
ven
stock
-day
isth
enco
mpu
ted
asDp
it!E
(pit)D!
EDp
it!
E(p
it)D,w
here
p itis
the
pro
port
ion
offo
reig
nin
vest
ors
buyi
ng
stoc
kion
day
tam
ong
allfo
reig
nin
vest
ors
trad
ing
that
stoc
kon
that
day
,E(p
it)is
the
expec
ted
pro
port
ion
offo
reig
nin
vest
orsbuy
ing
onth
atda
yre
lative
toal
lfo
reig
nin
vest
ors
active
on
that
day
,and
EDp
it!E
(pit)D
isth
ead
just
men
tfa
ctorco
mput
edund
erth
ehy
pot
hes
isth
atin
the
abse
nce
ofh
erdin
gth
enum
berofp
urc
hase
sis
binom
ially
distr
ibute
d.T
hest
ock
isex
clude
dif
itis
trad
edby
less
than
two
fore
ign
inve
stor
son
day
t.The
herd
ing
mea
sure
com
pute
dab
ove
forea
chst
ock
-day
isth
enav
erag
edw
ithi
nsize
and
pas
t-w
eek
retu
rnpo
rtfo
lios(b
oth
inte
rmsoft
he
U.S
.dol
lar),w
hich
are
reba
lance
dev
ery
wee
k.The
t-st
atistics
for
the
mea
ns
are
pre
sent
edin
par
enth
eses
,an
dth
enu
mber
ofst
ock
-day
sar
epr
esen
ted
belo
wth
et-st
atistics
.Tes
tst
atistics
for
di!
eren
cein
mea
ns
(ass
umin
gun
equal
varian
ces)
and
med
ians
(using
the
Wilco
xon
rank-
sum
test
)ac
ross
two
subp
erio
ds
are
pres
ente
din
bra
ces
and
brac
kets
,res
pect
ivel
y.
Pas
t-w
eek
retu
rnpo
rtfo
lio
Bef
ore
Kore
anC
risis
(Dec
.2,1
996}
Sep
t.30
,199
7)D
urin
gK
ore
anC
risis
(Oct
.1,1
997}
Dec
.27
,199
7)D
i!er
ence
inm
eans
and
med
ians
(bef
ore
-after
)
S1 (Sm
alle
stC
ap)
S2S3
S4S5 (L
arge
stC
ap.)
S1 (Sm
alle
stC
ap.)
S2S3
S4S5 (L
arge
stC
ap.)
S1 (Sm
alle
stC
ap.)
S2S3
S4S5 (L
arge
stC
ap.)
P1
22.8
5723
.36
22.8
4723
.234
21.8
0619
.495
18.8
8417
.684
16.8
7818
.483
M1.6
8NM2
.40N
M3.1
3NM5
.65N
M3.6
5N(L
ow
est)
(28.
59)
(33.
30)
(35.
69)
(41.
22)
(50.
59)
(10.
60)
(10.
94)
(11.
64)
(17.
32)
(23.
08)
[2.9
1][3
.85]
[4.3
8][7
.25]
[4.9
9]41
355
061
688
514
8911
411
614
928
141
8
P2
22.7
4324
.899
23.8
3121
.475
22.3
8119
.861
26.2
8218
.978
19.0
4918
.693
M1.4
6NM!
0.72
NM3
.17N
M1.8
9NM3
.69N
(29.
77)
(39.
33)
(37.
73)
(40.
57)
(49.
75)
(10.
88)
(14.
51)
(13.
61)
(16.
29)
(20.
97)
[2.3
2][!
0.07
][4
.80]
[3.7
3][5
.59]
458
545
573
971
1455
9413
919
326
444
4
P3
23.1
1124
.958
24.3
8923
.222
21.8
4516
.161
22.0
1619
.481
21.1
7818
.795
M3.0
7NM1
.41N
M3.1
0NM1
.51N
M3.1
6N(2
8.20
)(3
7.93
)(3
9.43
)(4
1.12
)(4
7.45
)(7
.66)
(11.
08)
(13.
37)
(17.
26)
(22.
12)
[4.0
5][2
.01]
[4.7
2][4
.03]
[4.9
6]36
551
864
687
514
4396
110
164
288
395
P4
24.8
1422
.355
24.4
8523
.174
23.2
4116
.058
16.4
6916
.729
16.9
7219
.484
M4.4
5NM3
.31N
M5.2
9NM5
.38N
M3.6
4N(3
6.50
)(3
2.16
)(4
1.65
)(4
0.32
)(5
3.94
)(8
.70)
(10.
07)
(12.
45)
(17.
00)
(20.
80)
[5.4
8][4
.46]
[7.6
7][7
.18]
[5.6
1]46
254
664
384
514
6287
117
174
287
425
P5
23.6
1623
.391
23.3
1323
.113
22.8
7423
.193
19.1
7517
.593
21.7
9121
.27
M0.1
6NM2
.11N
M3.2
8NM0
.96N
M1.4
8N(H
ighe
st)
(31.
85)
(29.
28)
(36.
58)
(41.
95)
(53.
10)
(9.4
1)(1
0.47
)(1
0.83
)(1
7.22
)(2
1.36
)[1
.02]
[3.7
2][5
.09]
[1.7
9][3
.24]
390
461
654
883
1461
9412
614
527
239
7
240 H. Choe et al. / Journal of Financial Economics 54 (1999) 227}264

resident foreign investors: individual, bank, insurance, securities "rms, and othercorporations. If the net purchase on a stock by one of the classes during a day ispositive (negative), we count it as a buy (sell) for the stock on that day by theclass of foreign investors, and then compute the herding measure as describedearlier. This approach aggregates all trades on a stock during a day by a class offoreign investors, e.g., U.S. mutual funds, in either one buy or one sell. Since weaggregate many buys and sells into one trade with this measure, it couldunderstate herding substantially by ignoring herding within classes. It is there-fore not surprising that Table 4 reports lower herding measures than Table 3.The average of the herding measures over all stock-days falls from 22.2% inTable 3 to 3.5% in Table 4. The magnitude of this average is more similar to thatof Wermers (1999), but remember that the herding measures of Table 4 representa lower bound for herding among foreign investors and that they are computedfor a day. Twenty-two out of 25 measures are signi"cantly positive at the 10%level before the crisis. Herding drops o! during the crisis, but not for the largeststocks. This is consistent with lower liquidity reducing the ability of foreigninvestors to trade in the smaller stocks.
4. Are foreign investors positive feedback traders?
Investors can be positive feedback traders for rational reasons or because ofbehavioral biases. Investors who pursue portfolio insurance strategies as well asinvestors with extrapolative expectations are positive feedback traders. Inves-tors with such strategies are often viewed as destabilizing because their sales leadthe market to fall further and their purchases increase prices further. Positivefeedback traders are often blamed for the stock market crash of 1987. In somemodels, positive feedback trading leads to bubbles, where prices depart fromfundamentals, and to crashes when bubbles burst. Besides contributing to thevolatility of stock returns, it is argued that such trading leads to destabilizingcapital #ows because equity investors rush into countries whose stock marketsare booming and #ee from countries whose stock markets are falling.
Foreign investors may act like positive feedback traders without destabilizingequity markets. One reason is that greater foreign ownership can lead to a lowerrisk premium for stocks in a country since the risks of these stocks can be bettershared internationally. Stulz (1998) provides an analysis of the relation betweenforeign ownership and the risk premium and a review of the evidence. Asa result, a period when foreign investors enter a market can also be a periodwhen the market is doing well because of these investors. Equity markets alsobecome more receptive to foreign investors as economies liberalize. Liberalizationitself leads to stock market appreciation and in this scenario this appreciation isfollowed by in#ows of foreign equity investments. Bekaert and Harvey (1998,2000) and Henry (2000) give evidence on the relation between liberalization
H. Choe et al. / Journal of Financial Economics 54 (1999) 227}264 241

Tab
le4
Lak
oni
shok
etal
.(19
92)he
rdin
gm
easu
res
(inper
centa
ges)
for
fore
ign
inve
stor
clas
ses
by
size
and
past
-wee
kre
turn
port
folio
son
the
KSE
stock
s.
To
com
pute
herd
ing
mea
sure
sfo
rfo
reig
nin
vest
or
clas
ses,
each
offo
reig
nbuy
and
sell
trad
eson
asa
mple
ofth
e41
4st
ock
sat
the
KSE
from
Dec
.2,1
996
toD
ec.2
7,19
97is
attr
ibut
edto
one
ofth
efo
reig
nin
vest
or
clas
ses
(658
clas
ses
acro
ss47
count
ries
and
14in
vest
or
type
s),u
sing
the
iden
ti"ca
tion
codes
inth
eIF
B/K
SEdat
abas
e.T
heher
din
gm
easu
refo
ra
give
nst
ock
-day
isth
enco
mpu
ted
asDp
it!
E(p
it)D!EDp
it!
E(p
it)D,
whe
rep it
isth
epr
opor
tion
offo
reig
nin
vest
orcl
asse
snet
buyi
ng
stock
ion
day
tam
ong
all
fore
ign
inve
stor
clas
sestr
adin
gth
atst
ock
on
that
day
,E(p
it)i
sth
eex
pect
edpr
opor
tion
off
orei
gnin
vest
orcl
asse
sne
tbuyi
ng
on
that
day
rela
tive
toal
lfor
eign
inve
storcl
asse
sac
tive
,and
EDp
it!E(p
it)Dis
thead
just
men
tfac
torco
mput
edund
erth
enul
lofn
oher
din
gth
atth
enum
ber
ofn
etbuy
ing
clas
sesis
bin
omia
llydistr
ibute
d.T
hest
ock
isex
clud
edif
ittr
aded
by
less
than
two
fore
ign
inve
stor
clas
seson
day
t.T
he
her
din
gm
easu
reco
mpute
dab
ove
forea
chst
ock
-day
isth
enav
erag
edw
ithi
nsize
and
pas
t-w
eek
retu
rnpo
rtfo
lios
(bot
hin
term
softh
eU
.S.dol
lar),w
hic
har
ere
bal
ance
deq
ual
lyev
ery
wee
k.The
t-st
atistics
for
the
mea
nsar
epr
esen
ted
inpa
renth
eses
,an
dth
enu
mber
ofst
ock
-day
sar
epr
esen
ted
bel
ow
the
t-st
atistics
.Tes
tst
atistics
fordi!er
ence
inm
eans(a
ssum
ing
uneq
ualv
aria
nce
s)an
dm
edia
ns(u
sing
the
Wilc
oxon
rank
-sum
test
)acr
osstw
osu
bpe
riod
sar
epr
esen
ted
inbr
aces
and
bra
cket
s,re
spec
tive
ly.
Pas
t-w
eek
retu
rnpo
rtfo
lio
Bef
ore
Kore
anC
risis
(Dec
.2,
1996}Se
pt.30
,199
7)D
urin
gK
ore
anC
risis
(Oct
.1,
1997}D
ec.27
,199
7)D
i!er
ence
inm
eans
and
med
ians
(bef
ore
-dur
ing)
S1 (Sm
alle
stC
ap.)
S2S3
S4S5 (L
arge
stC
ap.)
S1 (Sm
alle
stC
ap.)
S2S3
S4S5 (L
arge
stC
ap.)
S1 (Sm
alle
stC
ap.)
S2S3
S4S5 (L
arge
stC
ap.)
P1
6.94
29.
351
3.87
02.
482
2.57
40.
869
4.73
4!
0.52
15.
472
2.44
8M1
.79N
M1.5
1NM2
.44N
M!1.
52N
M0.1
1N(L
ow
est)
(4.0
4)(5
.61)
(3.0
9)(2
.53)
(4.1
8)(0
.30)
(1.8
5)(!
0.40
)(3
.22)
(2.4
3)[1
.68]
[1.4
4][1
.83]
[!1.
54]
[0.0
3]12
614
424
738
672
529
5496
119
213
P2
4.12
96.
352
2.41
60.
224
3.88
64.
626
5.24
91.
433
3.59
63.
909
M!0.
17N
M0.4
5NM0
.47N
M!1.
95N
M!0.
02N
(2.6
2)(4
.68)
(1.9
6)(0
.28)
(6.3
9)(1
.92)
(2.5
8)(0
.85)
(2.3
5)(4
.13)
[0.0
4][0
.50]
[0.1
8][!
2.05
][!
0.01
]15
522
526
151
478
740
7889
135
264
P3
4.34
46.
427
2.34
12.
491
3.16
52.
854
8.26
10.
524
0.69
43.
901
M0.3
8NM!
0.64
NM0
.94N
M1.0
3NM!
0.59
N(2
.17)
(4.3
9)(1
.98)
(2.4
8)(4
.50)
(0.8
3)(3
.38)
(0.3
4)(0
.48)
(3.7
7)[0
.29]
[!0.
30]
[0.6
3][0
.63]
[!0.
48]
112
201
254
363
639
3044
9810
720
3
P4
8.23
65.
855
3.35
33.
907
3.65
41.
236
1.22
80.
941
1.03
56.
488
M2.4
0NM1
.74N
M1.1
9NM1
.73N
M!2.
09N
(4.4
6)(3
.99)
(2.6
5)(4
.10)
(5.6
4)(0
.55)
(0.5
5)(0
.59)
(0.7
6)(5
.45)
[2.1
2][1
.36]
[1.0
2][1
.37]
[!1.
64]
126
202
237
399
729
3755
9315
124
2
P5
2.59
20.
522
4.54
14.
294
3.50
16.
098
3.78
55.
389
2.30
74.
235
M!0.
68N
M!1.
11N
M!0.
36N
M1.1
3NM!
0.53
N(H
ighe
st)
(1.3
3)(0
.32)
(3.9
2)(4
.32)
(5.5
6)(1
.28)
(1.5
5)(2
.63)
(1.5
9)(3
.41)
[!0.
33]
[!1.
29]
[!0.
23]
[0.7
6][!
0.28
]10
515
426
438
373
322
5697
118
193
242 H. Choe et al. / Journal of Financial Economics 54 (1999) 227}264

Fig. 2. Time-series plots of the daily foreign net buy-sell volume in shares (order imbalances) forthe 414 sample stocks, the KOSPI daily index, and the Won/USD daily exchange rates for theperiod of Nov. 30, 1996 to Dec. 27, 1997.
and stock market appreciation. Finally, in models that emphasize informationasymmetries between domestic and foreign investors, as in Brennan and Cao(1997), foreign investors learn more from stock returns than domestic investorsdo because stock prices impound the information that domestic investors have,so price increases reveal the domestic investors' favorable information to foreigninvestors. Since this information leads investors to have more favorable expecta-tions for stock returns, it leads them to invest more without acting irrationally.
Fig. 1 suggests that, if positive feedback trading by foreign investors hada signi"cant impact on stock price behavior in Korea, it must have been subtlerthan implied by the most aggressive critiques of the in#uence of foreign inves-tors. Fig. 2 shows the net buying of foreign investors on a daily basis. It is clearthat, starting with the end of September 1997, foreign investors are net sellersevery day for the stocks in our sample. This is consistent with a withdrawal offoreign equity investors. It has to be kept in mind, however, that when we lookat levels of foreign ownership there is simply no collapse so that foreign investorsmust have bought stocks that were at the foreign ownership limit at the end of1996 and sold stocks in our sample. At the same time, the behavior of the foreigninvestors in Fig. 2 is largely consistent with the view that these investors sell infalling markets and buy in rising markets. The periods of mostly foreign netbuying occur when stock prices are increasing, and the periods of persistent netselling by foreign investors are periods of falling stock prices.
H. Choe et al. / Journal of Financial Economics 54 (1999) 227}264 243

6Note that there is no reason for the averages to sum to zero across trader types.
To investigate whether the impression of positive feedback trading given byFig. 2 is statistically signi"cant, we consider the price-setting order imbalance ofinvestors, conditioning on the sign of the market return of the prior day, of thesame day, and of the next day. A stock's price-setting order imbalance iscomputed as the price-setting buy volume minus the price-setting sell volume bya class of investors for a day normalized by the stock's average daily price-setting volume over the sample period. In Table 5, we show equally-weightedaverages of the normalized price-setting order imbalances across stocks.6 Thereis evidence that foreign investors buy following a positive market return and sellfollowing a negative market return before the Korean crisis. The same is true,however, for Korean individual investors. The contemporaneous relation be-tween order imbalance and the sign of the market return is dramatic for Koreanindividual investors. The order imbalances are much smaller in absolute valuefor foreign investors and institutional investors. Finally, there are no signi"cantdi!erences between order imbalances for positive or negative lead marketreturns for either domestic investors or foreign investors.
The results for the Korean crisis period are quite di!erent for foreign inves-tors. Irrespective of the market return, foreign investors are net sellers of sharesfollowing days with positive market returns. This is not surprising in light ofFig. 2. What is surprising, though, is that foreign investors sell more when themarket is doing well than when it is doing poorly. Foreign investors havea signi"cantly higher sell-order price-setting imbalance if the market was up theprevious day than if it was down and they have a signi"cantly higher sell-orderimbalance if the market is up the same day than if it is down. Table 5 providesevidence that during the crisis Korean individual investors acted like positivefeedback traders while foreign investors did not. Since domestic individualinvestors have large price-setting net buy order imbalances when the market wasup the previous day or is up the same day, foreign investors are selling the mostwhen domestic demand is the highest. This cannot be viewed as destabilizingbehavior.
We also investigate the relation between the sign of the market return andtotal order imbalances but do not report the results. The results for foreigninvestors similarly support the positive feedback trading hypothesis. The keydi!erence in the results has to do with Korean individual investors. The totalorder imbalances of Korean individual investors are systematically positiveboth before and during the crisis, thus absorbing the negative order imbalancesof Korean institutions and foreign investors.
Western business hours are over when the Korean stock market is open. Thisraises the question of whether returns on Korean shares observed in New Yorka!ect the trading of foreign investors in Korea. We "nd that an equally weighted
244 H. Choe et al. / Journal of Financial Economics 54 (1999) 227}264

Tab
le5
Price
-set
ting
order
imbal
ance
s(]
100)
and
mar
ket
retu
rns
atth
eK
SE
from
Dec
.2,1
996
toD
ec.27
,19
97.
Theprice
-set
ting
ord
erim
bal
ance
forea
choft
he41
4st
ock
son
day
tis
com
put
edas
dai
lyprice
-set
ting
buy
volu
mele
sspr
ice-
settin
gse
llvo
lum
eat
trib
ute
dto
each
type
ofin
vest
or(in
stitut
ions,
indi
vidual
s,an
dfo
reig
ner
s),a
ndth
ennor
mal
ized
by
the
stock's
aver
age
dai
lyprice
-set
ting
volu
me
ove
rth
epe
riod
from
Dec
.2,1
996
toD
ec.2
7,19
97.T
heta
ble
show
sm
eans
ofth
eda
ily
norm
aliz
edord
erim
bala
nce
(]10
0)on
day
sof
(lagg
ed,c
urre
nt,
and
lead
)mar
ket
incr
ease
san
dde
crea
ses,
sepa
rate
ly,w
ith
the
KO
SP
Iin
dex
asth
em
arket
.A
t-te
stfo
rth
em
ean
di!
eren
ceis
repor
ted
inpa
rent
hes
es.
Mar
ket
retu
rns
(1)
Inst
itutions
ord
erim
bal
ance
(2)
Indiv
idua
lsord
erim
bal
ance
(3)
For
eign
ers
ord
erim
bal
ance
Tes
tof
(3)!
(1)
Tes
tof
(3)!
(2)
Bef
ore
the
Kor
ean
Cri
sis
(Dec
.2,
1996}
Sept
.30
,19
97)
R.t~
1'0
(108
day
s;43
,278
stock
-day
s)!
0.55
90.
471
0.19
0(3
.60)
(!1.
25)
(0
(134
day
s;52
,970
stock
-day
s)!
0.84
1!
0.35
9!
0.14
3(3
.40)
(1.0
8)t-st
atistics
for
mea
ndi!
eren
ce(1
.12)
(3.1
8)(2
.23)
R.t'
0(1
09day
s;43
,652
stoc
k-day
s)!
0.16
25.
004
0.22
1(1
.51)
(!20
.05)
(0
(133
day
s;52
,596
stoc
k-day
s)!
1.17
3!
4.12
7!
0.17
1(5
.96)
(21.
19)
t-st
atistics
for
mea
ndi!
eren
ce(3
.84)
(34.
74)
(2.6
0)R
.t`
1'0
(109
day
s;43
,040
stock
-day
s)!
0.58
0!
0.18
10.
064
(2.5
6)(1
.10)
(0
(133
day
s;53
,208
stock
-day
s)!
0.82
30.
172
!0.
039
(4.5
9)(!
1.05
)t-st
atistics
for
mea
ndi!
eren
ce(0
.91)
(!1.
35)
(0.6
9)
Dur
ing
the
Kor
ean
Cri
sis
(Oct
.1,
1997}D
ec.
27,
1997
)
R.t~
1'0
(29
days
;11
,022
stock
-day
s)!
7.81
05.
561
!2.
955
(7.9
6)(!
8.92
)(
0(4
3da
ys;15
,846
stock
-day
s)!
2.18
8!
0.38
1!
1.60
6(1
.69)
(!2.
30)
t-st
atistics
for
mea
ndi!
eren
ce(!
10.5
7)(5
.98)
(!2.
96)
R.t'
0(2
9da
ys;10
,923
stoc
k-da
ys)
!8.
005
13.5
50!
3.13
0(8
.62)
(!19
.07)
(0
(43
days
;15
,945
stoc
k-da
ys)
!2.
089
!5.
817
!1.
494
(1.5
7)(7
.32)
t-st
atistics
for
mea
ndi!
eren
ce(!
10.8
0)(1
9.87
)(!
4.05
)R
.t`
1'0
(30
days
;11
,133
stock
-day
s)!
6.51
45.
651
!2.
104
(7.2
0)(!
8.81
)(
0(4
2da
ys;15
,735
stock
-day
s)!
3.06
5!
0.48
7!
2.19
9(2
.55)
(!2.
90)
t-st
atistics
for
mea
ndi!
eren
ce(!
6.33
)(6
.37)
(0.2
2)
H. Choe et al. / Journal of Financial Economics 54 (1999) 227}264 245

portfolio of the returns of Korean ADRs for the NYSE trading day has noinformation for trading by foreign investors in Korea. In contrast, however, thereturn on the Korea Fund seems to a!ect trading by foreign investors in Korea.A positive (negative) open-to-close return on the Korea Fund is associated witha positive (negative) foreign order imbalance in Korea the next day. Thedi!erence in foreign order imbalances following a positive or negative open-to-close return on the Korea Fund is signi"cant at the 10% level.
The fact that Western business hours are over when the Korean stock marketopens creates the concern that the opening batch auction may be important forforeign investors. Results that use price-setting trades do not include thatauction. In our sample of all trades by foreign investors, less than 5% of thetrades by these investors take place during that auction. We neverthelessinvestigate the trades during the opening batch auction. Though we do notreport these results, they are consistent with the results we have discussed. Themean order imbalance of foreign investors across stocks is positively related tothe previous trading day market return, but not during the crisis period.Interestingly, this mean order imbalance is not related to the overnight marketreturn. In contrast, the overnight market return has a positive e!ect on theopening trades of Korean individuals and a negative e!ect on the opening tradesof Korean institutions.
Table 5 provides evidence on positive feedback strategies that are conditionedon the sign of the market return. The rationale for this dichotomous approach isthat it is unlikely that foreigners are going to sell twice as much if the marketfalls by 6% instead of 3%. With this approach, we do not have to take a positionon the precise relation between trades and the size of the market return. We alsoinvestigate a model in which trading depends linearly on the level of the marketreturn. In results not reported, we estimate a pooled regression of daily price-setting order imbalances of individual stocks (normalized by daily averageprice-setting volume of the stock over our sample period) of the three groups oftraders on the market return of the previous day and the current day. We useinteractive dummy variables to evaluate di!erences in the impact of marketreturns on the trading of the three groups of investors. There is clear evidence ofpositive feedback trading by foreign investors in these regressions for thepre-crisis period, but it disappears for the crisis period. If we use the pooledregressions to estimate the impact of the daytime returns of the Korea Fund onthe NYSE on trading by foreign investors in Korea, there is a positive insigni"c-ant e!ect both before and during the crisis. This suggests that the previoustrading-day return on the Korean stock market has more in#uence on tradingby foreign investors than the previous trading-day return of the Korea Fund onthe NYSE for the period before the crisis.
In Table 6, we investigate the extent of positive feedback trading usingindividual stock returns rather than market returns. In Tables 6 and 7, we usethe total order imbalances to include the opening and closing sessions. The
246 H. Choe et al. / Journal of Financial Economics 54 (1999) 227}264

Tab
le6
Ord
erim
bal
ance
s(]
100)
and
indi
vidu
alst
ock
s'la
gged
exce
ssre
turn
sov
erm
arke
tre
turn
sat
the
KSE
from
Dec
.2,
1996
toD
ec.27
,19
97.
The
orde
rim
bala
nce
forea
choft
he
414
stock
son
day
tis
com
pute
das
dai
lybu
yvo
lum
ele
ssse
llvo
lum
eat
trib
ute
dto
each
type
ofin
vest
or(in
stitutions,
indiv
idua
ls,a
ndfo
reig
ners
),an
dth
enno
rmal
ized
by
the
stoc
k'sav
erag
edai
lyvo
lum
eove
rth
eper
iod
from
Dec
.2,1
996
toD
ec.2
7,19
97.T
heta
ble
show
sm
eansofth
eda
ily
norm
aliz
edor
der
imba
lanc
es(]
100)
for
qui
ntile
por
tfol
ios
ofst
ock
s,P1(
low
est)
thro
ugh
P5(
hig
hes
t),f
orm
edbas
edon
lagg
edex
cess
retu
rnsov
erm
arke
tre
turn
s(K
OSPIin
dex
),w
hic
har
ere
bala
nced
daily
.The
t-st
atistics
ofth
em
eans
are
pres
ente
din
par
enth
eses
,and
t-te
stsfo
rth
em
ean
di!
eren
ceac
ross
di!er
entin
vest
or
type
sar
eal
sore
port
edin
par
enth
eses
.
Prior-
day
retu
rnpor
tfol
ios
Num
ber
ofda
ys(1
)In
stitutions
ord
erim
bal
ance
(2)In
divi
dua
lsord
erim
bal
ance
(3)Fore
igne
rsord
erim
bal
ance
Tes
tof
(3)!
(1)
Tes
tof
(3)!
(2)
Bef
ore
the
Kor
ean
cris
is(D
ec.
2,19
96}Se
pt.
30,
1997
)
Rit~
1!R
.t~
1P1
(Low
est)
241
!1.
230
(!7.
08)
2.16
7(1
0.97
)!
1.00
6(!
8.42
)(1
.06)
(!13
.75)
P2
241
!0.
469
(!3.
25)
0.62
8(3
.72)
!0.
258
(!2.
49)
(1.1
9)(!
4.47
)P3
241
!0.
036
(!0.
22)
0.00
9(0
.05)
!0.
075
(!0.
58)
(!0.
18)
(!0.
39)
P4
241
0.05
0(0
.29)
!0.
464
(!2.
83)
0.42
1(3
.12)
(1.7
0)(4
.16)
P5
(Hig
hest
)24
1!
0.41
2(!
1.88
)!
0.18
1(!
0.71
)0.
394
(2.3
1)(2
.91)
(1.8
8)P5!
P1
0.81
8(2
.93)
!2.
348
(!7.
29)
1.40
0(6
.72)
Dur
ing
the
Kor
ean
cris
is(O
ct.
1,19
97}
Dec
.27
,19
97)
Rit~
1!R
mt~
1P1
(Low
est)
72!
3.79
6(!
4.06
)5.
982
(5.4
4)!
2.58
7(!
6.25
)(1
.18)
(!7.
29)
P2
72!
2.38
8(!
2.48
)4.
650
(4.1
9)!
2.64
4(!
6.49
)(!
0.24
)(!
6.17
)P3
72!
2.75
9(!
2.86
)4.
570
(4.5
6)!
2.08
8(!
5.92
)(0
.65)
(!6.
27)
P4
72!
1.13
5(!
0.84
)2.
858
(2.0
8)!
1.97
3(!
6.93
)(!
0.61
)(!
3.44
)P5
(Hig
hest
)72
!2.
709
(!3.
66)
3.40
2(3
.83)
!1.
191
(!2.
63)
(1.7
5)(!
4.61
)P5-
P1
1.08
7(0
.91)
!2.
580
(!1.
82)
1.39
6(2
.28)
H. Choe et al. / Journal of Financial Economics 54 (1999) 227}264 247

Tab
le7
Cro
ss-s
ection
alav
erag
esof
regr
essions
oford
erim
bal
ance
s(]
100)
on
indi
vidu
alst
ock
retu
rns,
mar
ket
retu
rns,
and
FX
retu
rnsat
the
KSE
from
Dec
.2,1
996
toD
ec.27
,199
7.
The
ord
erim
bala
nce
for
each
ofth
e41
4st
ocks
on
day
tis
com
put
edas
dai
lybu
yvo
lum
ele
ssse
llvo
lum
eat
trib
uted
toea
chty
pe
ofin
vest
or
(inst
itutions,
indiv
idua
ls,a
ndfo
reig
ners
),an
dth
enno
rmal
ized
by
the
stoc
k's
aver
age
dai
lyvo
lum
eov
erth
epe
riod
from
Dec
.2,1
996
toD
ec.2
7,19
97.T
heta
ble
show
sth
ecr
oss
-sec
tion
alav
erag
esofre
gres
sion
sof
the
norm
aliz
edord
erim
bal
ance
s(]
100)
ofea
chin
vest
or
type
for
each
stoc
kon
the
stoc
k's
retu
rns,
mar
ket
retu
rns
(KO
SPI
inde
x),an
dW
on/U
SD
FX
retu
rns.
Eac
hst
ock
retu
rnis
calc
ulat
edas
Rit"
ln(P
it/Pit~
1)]10
0,an
dth
eFX
retu
rns
iss t"
ln(S
t/St~
1)]10
0w
her
eSt"
(Won
/USD
) 5.The
tabl
epre
sents
cros
s-se
ctio
nal
mea
ns
ofth
ees
tim
ated
para
met
ers
acro
sssa
mple
stoc
ks.T
he
t-st
atistics
ofth
ecr
oss
-sec
tion
alm
eans
are
pres
ente
din
pare
nthes
es,a
nd
t-te
sts
for
the
mea
ndi!
eren
cein
the
estim
ated
par
amet
ers
acro
ssdi!
eren
tin
vest
orty
pes
are
also
repor
ted
inpa
rent
hes
es.
Dep
ende
ntva
riab
le:
Norm
aliz
edord
erim
bal
ance
Cro
ss-s
ection
alm
eans
ofslop
eco
e$ci
ents
(t-st
atistics
)fo
rA
vera
geA
dj.R
2
Num
berof
stoc
ks
Con
stan
tR
it~1
Rit
Rit`
1R
.5~
1R
.5
R.5`
1s t~
1s t
s t`1
Bef
ore
the
Kor
ean
cris
is(D
ec.
2,19
96}Se
pt.
30,
1997
)
(1)In
stitution's
order
imbal
ance
!0.
383
0.07
0!
0.32
4!
0.15
2!
0.15
5!
0.04
30.
328
0.42
40.
294
!0.
743
0.02
041
4(!
3.26
)(1
.93)
(!7.
09)
(!4.
38)
(!2.
53)
(!0.
71)
(5.5
8)(1
.38)
(1.1
5)(!
2.26
)
(2)In
divi
dua
l'sor
der
imbal
ance
0.39
4!
0.26
30.
055
0.26
40.
172
0.48
6!
0.50
1!
0.44
6!
0.44
00.
412
0.04
041
4(2
.66)
(!6.
04)
(0.9
3)(7
.46)
(2.4
6)(6
.15)
(!7.
98)
(!1.
22)
(!1.
59)
(1.1
5)
(3)Fore
igne
r's
ord
erim
bal
ance
!0.
083
0.19
90.
337
!0.
109
!0.
026
!0.
472
0.19
60.
136
!0.
084
0.12
20.
025
414
(!0.
72)
(6.7
0)(7
.87)
(!4.
25)
(!0.
44)
(!7.
14)
(3.7
8)(0
.45)
(!0.
39)
(0.5
5)
t-st
atistics
for
mea
ndi!
eren
ce:(
3)!
(1)
(1.8
3)(2
.77)
(10.
55)
(0.9
9)(1
.51)
(!4.
77)
(!1.
69)
(!0.
67)
(!1.
13)
(2.1
8)
t-st
atistics
for
mea
ndi!
eren
ce:(
3)!
(2)
(!2.
54)
(8.7
6)(3
.84)
(!8.
53)
(!2.
16)
(!9.
30)
(8.5
6)(1
.23)
(1.0
2)(!
0.69
)
t-st
atistics
for
mea
ndi!
eren
ce:(
2)!
(1)
(4.1
1)(!
5.89
)(5
.06)
(8.3
9)(3
.52)
(5.3
0)(!
9.64
)(!
1.83
)(!
1.95
)(2
.38)
248 H. Choe et al. / Journal of Financial Economics 54 (1999) 227}264

Dur
ing
the
Kor
ean
cris
is(O
ct.
1,19
97}D
ec.
27,
1997
)
(1)In
stitution's
ord
erim
bala
nce
!2.
747
0.28
7!
0.10
0!
0.14
2!
0.92
7!
0.54
40.
035
!0.
196
!0.
167
!0.
044
0.10
941
3(!
6.52
)(3
.17)
(!0.
72)
(!1.
54)
(!7.
78)
(!3.
62)
(0.3
6)(!
2.38
)(!
1.64
)(!
0.77
)
(2)In
divi
dual's
ord
erim
bala
nce
4.80
8!
0.42
9!
0.12
10.
215
1.01
01.
090
!0.
108
0.22
7!
0.00
30.
018
0.11
641
3(9
.53)
(!4.
80)
(!0.
89)
(2.2
8)(8
.49)
(7.0
1)(!
1.04
)(1
.96)
(!0.
03)
(0.3
0)
(3)Fore
igner's
ord
erim
bala
nce
!2.
262
0.15
90.
235
!0.
077
!0.
116
!0.
511
0.10
1!
0.06
00.
066
0.02
60.
045
413
(!8.
57)
(2.6
7)(4
.05)
(!1.
98)
(!2.
11)
(!7.
27)
(1.7
9)(!
0.79
)(1
.70)
(0.5
6)
t-st
atistics
for
mea
ndi!er
ence
:(3
)!(1
)(0
.97)
(!1.
18)
(2.2
2)(0
.64)
(6.1
7)(0
.19)
(0.5
8)(1
.22)
(2.1
4)(0
.95)
t-st
atistics
for
mea
ndi!er
ence
:(3
)!(2
)(!
12.4
2)(5
.47)
(2.4
0)(!
2.87
)(!
8.59
)(!
9.38
)(1
.77)
(!2.
08)
(0.6
3)(0
.11)
t-st
atistics
for
mea
ndi!er
ence
:(2
)!(1
)(1
1.50
)(!
5.63
)(!
0.11
)(2
.71)
(11.
50)
(7.5
6)(!
1.00
)(2
.98)
(1.1
3)(0
.75)
H. Choe et al. / Journal of Financial Economics 54 (1999) 227}264 249

results are similar if we use only price-setting imbalances. We proceed as follows.On a given day, we compute each stock's return in excess of the market. We rankthese excess returns and form "ve portfolios each day. For each portfolio, wethen compute the average of the normalized order imbalance of the stocks in theportfolio for the following day. The table shows that for foreign investors beforethe crisis the order imbalance increased monotonically with the stock returns onthe previous day. The di!erence in order imbalance between the two extremeportfolios is highly signi"cant. This evidence strongly supports the positivefeedback trading hypothesis. In general, the order imbalances fall for individualsand increase for institutions as one moves towards the portfolio with the highestreturn. This is consistent with individuals being contrarians and institutionsbeing positive feedback traders. However, institutions have sell-order imbalan-ces for all portfolios except the fourth portfolio. When we turn to the results forthe crisis period, the order imbalances generally increase for foreign investors asone moves from portfolio 1 to portfolio 5, but foreign investors are net sellers forall portfolios. Institutions are also net sellers, but the absolute value of theirorder imbalances "rst falls and then increases. Domestic individuals are netbuyers, but they buy more of the stocks that have performed poorly. Except forthe best-performing portfolio, the order imbalances of foreign investors andinstitutional investors are not statistically di!erent both before and during thecrisis. In contrast, the order imbalances of foreign investors are signi"cantlydi!erent from the order imbalances of Korean individual investors for allportfolios but the middle one before the crisis and for all portfolios during thecrisis.
We have now seen results relating order imbalances to the performance of themarket and to the performance of individual stocks. We try to assess the relativeimportance of the market return and individual stock returns by estimatingregressions of individual common stock order imbalances on measures of themarket return, the stock return, and the foreign exchange return. In all ourregressions, we include lagged, contemporaneous, and leading values ofour independent variables. The average regression coe$cients are reported inTable 7. Before the crisis, the average coe$cient of the lagged individual stockreturn for foreign order imbalances is positive and signi"cant, as one wouldexpect if foreign investors are positive feedback traders. The coe$cient of thelagged market return is negative and insigni"cant. This suggests that positivefeedback trading is driven by individual stock returns rather than the marketreturn. The foreign exchange returns do not seem to a!ect trading by foreigninvestors. Korean individual investors are again contrarian with respect toindividual stock returns, but seem to be positive feedback traders with respect tothe market return. Korean institutions are positive feedback traders for indi-vidual stocks and contrarian with respect to the market. During the crisis,foreign investors are still positive feedback traders at the individual stock level,but now they are signi"cantly contrarian at the market level. As a result,
250 H. Choe et al. / Journal of Financial Economics 54 (1999) 227}264

7Bailey et al. (1998) "nd stronger evidence of a positive relation between currency depreciationand sales of equities using high-frequency data for Mexican ADRs and closed-end funds trading onthe NYSE. They "nd that Peso depreciation is accompanied by an increase in transactions at the bidrelative to transactions at the ask for these securities over half-hour intervals from December 21,1994 to April 30, 1995.
a stock's negative return has no impact on a stock's order imbalance if themarket has a similar negative return. The lagged foreign exchange return doesnot matter, but there is weak evidence that the contemporaneous foreignexchange return has a positive e!ect, so that a depreciation is correlated withselling by foreign investors.7 For the crisis period, Korean individual investorsare also contrarians with respect to individual stock returns, but positivefeedback traders with respect to the market return. Again, Korean institutionsbehave in the opposite way and more like foreign investors. We also estimate theregressions of Table 7 with dummy variables for stocks a!ected by price limits atthe end of the previous trading day, but our inferences do not change.
One concern with our tests of positive feedback trading is that we focus onnormalized trades. The normalization by average price-setting volume that weuse is helpful in understanding the importance of positive feedback tradingrelative to trading volume. We investigated whether the results that we reporthold if we use dependent variables that are not normalized. In particular, werepeated all our tests using the fraction of the sum of the purchases and salesattributed to each type of investor (institutions, individuals, and foreigners) asthe dependent variable. All our results hold up using this approach. They alsohold if we use the price-setting purchases and sales. One might also be concernedthat we condition on Won returns in our tests. Table 7 suggests that exchangerate returns are unlikely to a!ect our results. To make sure, we have alsochecked the results of Table 5 conditioning on dollar market returns, and wereach the same conclusions. Finally, all our tests use daily data. Tests thatexamine the existence of positive feedback trading over longer intervals wouldbe useful, but we leave those for further research. Such tests would not enable usto study the crisis period separately as we did with daily data because therewould be too few observations.
5. Do foreign investors have a destabilizing in6uence?
We have now seen that there is strong evidence of positive feedback tradingand herding on the part of foreign investors, especially before the Korean crisis.The last question we want to address is whether these investors have a de-stabilizing in#uence. With the data available, we can address this issue bylooking at whether large trading imbalances by foreign investors are followed byprice continuations and by an increase in volatility. For that purpose, we
H. Choe et al. / Journal of Financial Economics 54 (1999) 227}264 251

conduct two event studies. The "rst study uses intraday returns, and the seconduses daily returns. Our approach complements the studies that focus on theimpact of capital market liberalization on stock market volatility. These studiesgenerally "nd that opening a stock market to foreign investors does not increaseits volatility [see Stulz (1999) for a review and Bekaert and Harvey (2000) formore recent evidence], but they do not directly consider whether trades byforeign investors can have a destabilizing impact. As discussed earlier, there aretax advantages for Korean investors trading out of Malaysia and Ireland. Inresults not reported here, we perform all the tests of this section excluding tradesfrom Malaysia and Ireland. Our results are unchanged. We also perform theevent studies during the crisis period for the 48 stocks that are at the ownershiplimit at the start of our sample period and "nd that trades by foreign investorshave less impact on these stocks than on our sample stocks.
5.1. Intraday event study
We divide each day into 46 "ve-minute intervals from 9:30 to 15:00, treatingthe time interval of 11:30}13:05 as a single interval containing the lunch breakand similarly the time interval of 14:45}15:00, which contains an order collectionperiod for the close. We exclude Saturdays since we have much less freedom inchoosing an event that has a su$cient number of intraday intervals prior to andafter an event. For each of the intervals for each of the 414 stocks over thesample period, we compute foreign order imbalances by subtracting foreign sellvolume from foreign buy volume during the interval. We then select the "veintervals for net buy (positive) imbalances and net sell (negative) imbalanceswith the largest foreign order imbalances in absolute value for each of the 414stocks. For each of the selected events, we examine stock returns from theprevious "fth (!5) to the subsequent "fth (#5) interval surrounding the event.To avoid crossing day boundaries when we examine !5 to #5 intervals, theevents are selected from the seventh interval (10:00}10:05) through the 41stinterval (14:20}14:25), excluding the 25th interval (11:30}13:05), which containsa batch auction period. Among the events selected above, we exclude those withforeign order imbalances less than 1,000 shares in absolute value. The abovesampling procedure is also applied to the case of the foreign price-settingvolume.
Table 8 describes the samples constructed with our procedure. We report theresults for the whole sample, the subperiod before the crisis, and the crisisperiod. Though we study the returns around the events using all the largestimbalances as well as the largest price-setting imbalances, we report only theresults for the largest price-setting imbalances. These are trades initiated byforeign investors, so we expect the impact of their imbalances to be the largest.For each class of events, we report raw returns, mean-adjusted returns, and theabsolute value of the mean-adjusted returns as a measure of volatility. We
252 H. Choe et al. / Journal of Financial Economics 54 (1999) 227}264

Table 8Descriptive statistics of large foreign order imbalances (in shares) in "ve-minute intervals.
For each of the 414 stocks at the KSE from Dec. 2, 1996 to Dec. 27, 1997, the foreign orderimbalance (buy volume less sell volume) within a "ve-minute trading interval during continuousauction sessions (excluding Saturdays) is computed in two ways: one is based on all foreign tradesand the other based on foreign price-setting trades. Among these, "ve intervals with the largest orderimbalances in terms of net buy, net sell, price-setting net buy, and price-setting net sell are selectedfor each stock, but excluding those with less than 1,000 shares. The results are presented below forthe full sample period and two subperiods before and during the Korean crisis.
Descriptivestatistics
Net buy order imbalances Net sell order imbalances
Fullsample
Beforecrisis
Duringcrisis
Fullsample
Beforecrisis
Duringcrisis
Nobs 1,970 1,685 285 2,009 1,444 565Mean 19,860 20,132 18,255 20,964 16,255 33,000Maximum 2,000,000 2,000,000 292,760 1,387,500 315,840 1,387,500Q3 15,100 15,000 17,020 19,790 15,000 30,000Median 6,180 6,140 6,810 8,160 6,990 12,000Q1 3,000 3,000 3,890 4,000 3,685 5,000Minimum 1,000 1,000 1,000 1,000 1,000 1,000
Descriptivestatistics
Price-setting net buy order imbalances Price-setting net sell order imbalances
Fullsample
Beforecrisis
Duringcrisis
Fullsample
Beforecrisis
Duringcrisis
Nobs 1,826 1,595 231 1,915 1,386 529Mean 17,849 17,103 22,998 16,602 14,070 23,235Maximum 2,000,000 2,000,000 463,000 1,387,500 316,400 1,387,500Q3 13,070 12,250 16,970 14,230 11,140 20,000Median 5,490 5,330 6,140 5,590 5,000 9,000Q1 2,700 2,610 3,000 3,000 2,900 3,820Minimum 1,000 1,000 1,000 1,000 1,000 1,000
obtain mean-adjusted returns by subtracting the sample mean return for thestock on the same day of the week and same time of day over the whole sampleperiod as the event return to control for the well-known day-of-the-week e!ectas well as the time-of-the-day e!ect.
Panel A of Table 9 presents the returns for the "ve-minute intervals forthe "ve intervals preceding the event and the "ve intervals after it. It isimmediately apparent that the largest price-setting net buy order imbalancesoccur following positive returns for the stock, so that foreigners buy follow-ing price increases. The price increase continues for one period after the pur-chase by foreign investors, but then the returns are insigni"cantly di!erent
H. Choe et al. / Journal of Financial Economics 54 (1999) 227}264 253

Tab
le9
Intr
aday
retu
rns
and
vola
tility
(%)ar
ound"ve
-min
ute
inte
rval
sof
larg
efo
reig
nprice
-set
ting
ord
erim
bala
nce
s.
The
fore
ign
pric
e-se
ttin
gor
der
imbal
ance
withi
na"ve
-min
ute
trad
ing
inte
rval
dur
ing
continuous
auct
ion
sess
ions
for
each
ofth
e41
4st
ock
sat
the
KSE
from
Dec
.2,1
996
toD
ec.2
7,19
97,e
xclu
ding
Satu
rday
s,is
com
pute
das
fore
ign
price
-set
ting
buy
volu
me
less
price
-set
ting
sell
volu
me.
The
sam
ple
sin
Pan
elsA
and
Bco
mprise
the"ve
inte
rval
sw
ith
the
larg
estprice
-set
ting
netbu
yan
dnet
sell
orde
rim
bal
ance
s,re
spec
tive
ly,f
orea
chst
ock,b
ute
xclu
ding
thos
eofl
essth
an1,
000
shar
es.T
heM
ean-
adjr
etfo
rea
chin
terv
alis
them
ean
ofth
ein
terv
alre
turn
forth
est
ock
exce
edin
gth
em
ean
obse
rved
on
thesa
meda
yoft
hew
eek
and
sam
etim
eofda
yove
rth
esa
mple
per
iod,an
dth
eDM
ean-a
djre
tDis
am
easu
reof
vola
tilit
yco
mput
edas
the
mea
nofab
solu
teva
lues
ofth
em
ean-a
dju
sted
retu
rns.
The
CA
R(0
,5)is
the
cum
ula
tive
retu
rns
from
inte
rval
s0
thro
ugh
5,an
dth
et-st
atistics
are
report
edin
par
enth
eses
.
Mea
nst
atistics
5-m
inute
inte
rval
sre
lative
toth
efo
reig
nnet
buy
ord
erim
bala
nce
(inte
rval
0)C
AR
(0,5
)
!5
!4
!3
!2
!1
01
23
45
Pan
elA
.F
ive-
min
ute
retu
rns
and
vola
tili
ty(%
)ar
ound
larg
efo
reig
npr
ice-
sett
ing
net
buy
orde
rim
bala
nces
Ful
lpe
riod
(Dec
.2,
1996
toD
ec.
27,
1997
;N"
1,82
6)
Raw
ret
0.05
90.
065
0.02
10.
072
0.15
50.
649
0.10
90.
004
!0.
005
!0.
015
!0.
015
0.72
8(3
.19)
(3.4
2)(1
.01)
(3.1
3)(6
.22)
(17.
60)
(5.2
3)(0
.15)
(!0.
21)
(!0.
62)
(!0.
66)
(14.
91)
Mea
n-ad
jre
t0.
057
0.06
60.
024
0.07
50.
157
0.64
80.
107
0.00
7!
0.00
3!
0.01
4!
0.01
20.
733
(3.1
4)(3
.51)
(1.1
5)(3
.31)
(6.3
9)(1
7.75
)(5
.20)
(0.3
1)(!
0.12
)(!
0.59
)(!
0.57
)(1
5.18
)
DMea
n-ad
jre
tD0.
401
0.39
60.
427
0.46
40.
516
0.95
90.
483
0.50
50.
449
0.48
10.
429
Bef
ore
the
Kor
ean
cris
is(D
ec.
2,19
96to
Sept
.30
,19
97;
N"
1,59
5)
Raw
ret
0.06
30.
058
0.04
80.
085
0.17
40.
574
0.12
30.
025
0.00
5!
0.01
4!
0.03
50.
679
(3.4
6)(3
.34)
(2.6
1)(4
.34)
(8.0
5)(1
7.54
)(5
.79)
(1.0
9)(0
.24)
(!0.
64)
(!1.
88)
(14.
80)
Mea
n-ad
jre
t0.
062
0.05
90.
052
0.08
80.
176
0.57
50.
122
0.02
90.
007
!0.
012
!0.
033
0.68
7(3
.39)
(3.4
1)(2
.80)
(4.5
2)(8
.26)
(17.
74)
(5.7
9)(1
.24)
(0.3
3)(!
0.58
)(!
1.79
)(1
5.14
)
DMea
n-ad
jre
tD0.
391
0.36
80.
390
0.42
90.
476
0.87
60.
474
0.47
80.
434
0.44
90.
389

Dur
ing
the
Kor
ean
cris
is(O
ct.
1,19
97to
Dec
.27
,19
97;
N"
231)
Raw
ret
0.02
60.
114
!0.
167
!0.
021
0.02
51.
166
0.01
2!
0.14
7!
0.07
0!
0.02
20.
125
1.06
4(0
.36)
(1.2
6)(!
1.60
)(!
0.17
)(0
.20)
(6.4
6)(0
.16)
(!1.
55)
(!0.
87)
(!0.
18)
(1.0
7)(4
.86)
Mea
n-ad
jre
t0.
026
0.11
8!
0.16
7!
0.01
20.
027
1.15
30.
004
!0.
141
!0.
067
!0.
025
0.12
91.
052
(0.3
7)(1
.32)
(!1.
61)
(!0.
10)
(0.2
1)(6
.46)
(0.0
5)(!
1.49
)(!
0.85
)(!
0.21
)(1
.11)
(4.8
5)
DMea
n-ad
jre
tD0.
470
0.58
90.
680
0.70
00.
795
1.53
30.
545
0.69
20.
552
0.70
40.
705
Pan
elB
.F
ive-
min
ute
retu
rns
and
vola
tili
ty(%
)ar
ound
larg
efo
reig
npr
ice-
sett
ing
net
sell
orde
rim
bala
nces
Ful
lpe
riod
(Dec
.2,
1996
toD
ec.
27,
1997
;N"
1,91
5)
Raw
ret
0.04
3!
0.00
80.
005
!0.
021
0.06
1!
0.63
90.
203
0.10
30.
053
0.04
90.
013
!0.
218
(1.7
9)(!
0.31
)(0
.25)
(!0.
91)
(2.6
1)(!
17.4
3)(6
.94)
(4.4
7)(2
.51)
(2.3
7)(0
.58)
(!4.
86)
Mea
n-a
djre
t0.
042
!0.
003
0.01
0!
0.01
50.
065
!0.
630
0.20
30.
103
0.05
30.
051
0.01
6!
0.20
4(1
.76)
(!0.
14)
(0.4
8)(!
0.64
)(2
.80)
(!17
.36)
(7.0
2)(4
.51)
(2.5
3)(2
.47)
(0.6
9)(!
4.61
)
DMea
n-ad
jre
tD0.
452
0.47
40.
444
0.47
70.
535
0.95
90.
581
0.48
30.
460
0.45
00.
463
Bef
ore
the
Kor
ean
cris
is(D
ec.
2,19
96to
Sept
.30
,19
97;
N"
1,38
6)
Raw
ret
0.05
30.
020
0.02
50.
015
0.07
8!
0.48
70.
200
0.08
30.
044
0.04
60.
023
!0.
091
(2.7
2)(0
.92)
(1.1
5)(0
.70)
(3.1
9)(!
14.2
3)(7
.52)
(3.5
9)(2
.04)
(2.1
3)(1
.02)
(!1.
98)
Mea
n-ad
jre
t0.
051
0.02
30.
028
0.02
20.
083
!0.
478
0.20
20.
085
0.04
40.
048
0.02
5!
0.07
5(2
.65)
(1.0
7)(1
.30)
(1.0
2)(3
.40)
(!14
.14)
(7.6
3)(3
.67)
(2.0
5)(2
.23)
(1.1
5)(!
1.64
)
DMea
n-ad
jre
tD0.
374
0.41
60.
407
0.42
80.
503
0.82
60.
512
0.45
80.
429
0.42
00.
407
Dur
ing
the
Kor
ean
cris
is(O
ct.
1,19
97to
Dec
.27
,19
97;
N"
529)
Raw
ret
0.01
8!
0.08
0!
0.04
7!
0.11
50.
018
!1.
037
0.20
90.
154
0.07
80.
057
!0.
011
!0.
551
(0.2
6)(!
1.22
)(!
1.00
)(!
1.94
)(0
.31)
(!10
.84)
(2.6
3)(2
.71)
(1.5
0)(1
.17)
(!0.
18)
(!5.
12)
Mea
n-a
djre
t0.
020
!0.
073
!0.
038
!0.
110
0.02
0!
1.02
70.
207
0.15
10.
077
0.05
7!
0.00
9!
0.54
4(0
.28)
(!1.
12)
(!0.
82)
(!1.
90)
(0.3
6)(!
10.8
4)(2
.63)
(2.6
8)(1
.50)
(1.1
9)(!
0.15
)(!
5.13
)
DMea
n-ad
jre
tD0.
658
0.62
40.
538
0.60
40.
618
1.30
70.
761
0.54
90.
541
0.53
00.
610

from zero. There is a large contemporaneous positive return with the event,so the large foreign net buy imbalance is associated with a large stock return.If there is positive information in the foreign net buy imbalance, it gets im-pounded in prices immediately, since "ve minutes later prices seem to haveadjusted. The absolute "ve-minute return is obviously large for the event period,but there is little evidence of a persistent sharp increase in volatility followingthe event.
The patterns for events before the Korean crisis are quite similar to those wehave just discussed for the whole sample period. The volatility "ve periods afterthe event is back to where it was "ve periods before the event. The patternsduring the crisis are di!erent, however. First, there is no longer any evidencethat foreign net buy imbalances follow positive returns. Second, the impact ofthe event is larger. Third, the event seems to have no positive e!ect on sub-sequent returns. In particular, the return for the "rst period following the eventis not signi"cantly positive.
Although we do not report these results in a table, we perform severaladditional investigations to check the robustness of our conclusions. First,we compute returns around the largest net buy imbalances instead of the largestprice-setting net buy imbalances. The only noticeable di!erence is thatthe event returns are substantially smaller. For the whole sample period,the average mean-adjusted return is 0.347%, in contrast to 0.648% inTable 9. This is not surprising, since the sample in Table 9 uses only tradesinitiated by foreign investors. Either way, it is clear that there is a signi"cantpositive return associated with the event. There is no evidence that large tradesby foreign investors are associated with positive signi"cant mean-adjustedreturns beyond the next "ve minutes, so the market adjusts quickly and e$cient-ly to the trades by these investors. Second, we estimate returns splittingthe sample between stocks that hit the price limit during or at the end of thetrading day and those that do not. Price limits do not appear to a!ect ourresults.
Panel B of Table 9 shows the analysis for the largest price-setting net sellevents. One would expect this panel to have results that are symmetric to thosein Panel A. Surprisingly, this is not the case. Looking at the subperiod before thecrisis, the returns are not negative before the event. In fact, the returns in theperiod immediately before the event are signi"cantly positive. There is a largenegative return associated with the event. In absolute value, it is slightly lessthan the return for the event in Panel A. We observe signi"cant positive returnsfor four periods after the event. As a result, the cumulative return associatedwith the event is small in absolute value and insigni"cant for mean-adjustedreturns. Although there is at best a small permanent e!ect of sales by foreigninvestors, there is a temporary e!ect that is consistent with a reward for thosewho provide the liquidity to the market. It seems, therefore, that selling byforeign investors is followed by a reversal that is quite substantial in relation to
256 H. Choe et al. / Journal of Financial Economics 54 (1999) 227}264

the event return. The evidence is similar on days that end with the price limitbeing binding. On these days, the positive returns following the event arenot signi"cant, but the price impact of foreign sales is completely reversed25 minutes after the sale.
The patterns during the crisis are similar to those before the crisis, except thatthe event return is larger in absolute value. As a result, the reversals end upo!setting about half the price impact of the sale. Neither before nor during thecrisis is there evidence that large foreign sales lead to a period of signi"cantnegative mean-adjusted returns. During the crisis, the largest net sell imbalanceshave an average mean-adjusted return of !1.027%, while the largest net buyimbalances have an average mean-adjusted return of 1.153%. There is thereforeno evidence that sales by foreign investors lead to disproportionate eventreturns compared to purchases by foreign investors. Results are similar on dayswith binding price limits.
The evidence on the largest net sales by foreigners is comparable to theevidence for block sales in the U.S. Holthausen et al. (1990) investigate theadjustment of prices to block sales since block sales are initiated by the seller.They consider the 50 largest downtick transactions for 109 "rms selectedrandomly from December 1, 1982 to January 31, 1984. They "nd that the tradeimpact of the block trade is a mean-adjusted return of !1.23% and that it isfollowed by a signi"cant mean-adjusted return of 0.28%. Strikingly, we "ndsimilar stock price impacts for large sales by foreign investors in Korea, since weobserve a mean-adjusted return of !1.027% for the "ve minutes when largesales take place followed by a mean-adjusted return of 0.207% over the next "veminutes.
5.2. Interday event study
The sampling procedure for daily events is similar to the one described earlier.That is, we compute daily foreign order imbalances by subtracting foreign sellvolume from foreign buy volume for the day for each of the 414 stocks(excluding Saturdays). We then select the "ve trading days with the largestabsolute-value order imbalance for each of the 414 stocks. For each of theselected events, we examine stock returns from the previous "fth (!5) tothe subsequent "fth (#5) trading day surrounding the event day. Among theselected events, we exclude those with daily foreign order imbalances less than10,000 shares in absolute value. The above sampling procedure is also applied tothe daily foreign price-setting volume. We ignore batch auction trades for thecase of the price-setting volume, since it is impossible to de"ne price-settingvolume during batch auctions.
In the daily event study, we present the results using the "ve largest imbalan-ces rather than the "ve largest price-setting imbalances for two reasons. First, asdiscussed above, for the price-setting imbalances we cannot capture all the
H. Choe et al. / Journal of Financial Economics 54 (1999) 227}264 257

Table 10Descriptive statistics of daily large foreign order imbalances (in shares)
For each of the 414 stocks at the KSE from Dec. 2, 1996 to Dec. 27, 1997, the daily foreign orderimbalance (buy volume less sell volume) is computed in two ways: one is based on all foreign trades,and the other based on foreign price-setting trades. Among these, "ve days with the largest orderimbalances in terms of net buy, net sell, price-setting net buy, and price-setting net sell are selectedfor each stock, but excluding those with less than 10,000 shares. The results are presented below forthe full sample period and two subperiods before and during the Korean crisis
Descriptivestatistics
Net buy order imbalances Net sell order imbalances
Fullsample
Beforecrisis
Duringcrisis
Fullsample
Beforecrisis
Duringcrisis
Nobs 1,397 1,201 196 1,588 1,079 509Mean 87,572 86,552 93,822 89,061 66,178 137,569Maximum 5,832,980 5,832,980 989,380 2,773,950 2,289,390 2,773,950Q3 59,000 54,380 109,415 71,920 56,160 120,280Median 27,000 26,250 31,315 32,835 29,500 50,500Q1 15,000 15,000 16,285 19,225 17,140 23,940Minimum 10,000 10,000 10,000 10,000 10,000 10,000
Descriptivestatistics
Price-setting net buy order imbalances Price-setting net sell order imbalances
Fullsample
Beforecrisis
Duringcrisis
Fullsample
Beforecrisis
Duringcrisis
Nobs 952 816 136 1,113 749 364Mean 59,306 56,398 76,751 62,526 47,473 93,500Maximum 2,016,630 2,016,630 649,500 2,230,130 1,038,260 2,230,130Q3 50,000 48,905 73,500 55,400 43,500 85,610Median 23,770 22,860 31,750 25,470 21,930 35,580Q1 14,380 14,180 15,890 15,220 14,660 17,195Minimum 10,000 10,000 10,000 10,000 10,000 10,000
imbalance in a day because we cannot include the batch auction in our samplingprocedure. Second, foreign imbalances over a day are publicized in Korea, sothat information as to whether foreign investors sold or bought is generallyavailable by the next day. This information concerns foreign imbalances asa whole rather than foreign price-setting imbalances. Table 10 summarizes thesamples. All the mean and median imbalances increase after the crisis, but theincrease is more dramatic for the net sell imbalances, where the mean more thandoubles. Table 11 presents our results, which now include market-adjustedreturns.
From Panel A, we can see that before the crisis foreign investors buystocks that have done well over recent days. Both the mean-adjusted and the
258 H. Choe et al. / Journal of Financial Economics 54 (1999) 227}264

Tab
le11
Dai
lyre
turn
san
dvo
latilit
y(%
)ar
ound
day
sof
larg
efo
reig
nord
erim
bala
nces
.
Theda
ilyfo
reig
nord
erim
bala
nce
forea
chof
the41
4st
ocksat
the
KSE
from
Dec
.2,1
996
toD
ec.2
7,19
97,e
xclu
din
gSa
turd
ays,
isco
mpu
ted
asda
ilyfo
reig
nbuy
volu
mele
ssse
llvo
lum
e.T
hesa
mpl
esin
Pan
elsA
and
Bco
mpr
iseth
e"ve
days
with
thela
rges
tne
tbuy
and
net
sell
orde
rim
bal
ance
s,re
spec
tive
ly,s
elec
ted
forea
chst
ock,
excl
udi
ng
those
with
less
than
10,0
00sh
ares
.The
Mea
n-ad
jret
forea
chda
yis
them
ean
oft
hedai
lyre
turn
forth
est
ock
exce
edin
gth
em
ean
obse
rved
on
the
sam
eday
ofth
ew
eek
ove
rth
esa
mpl
epe
riod,a
ndth
eM
arket
-adjre
tis
the
mea
nofth
edai
lyre
turn
exce
edin
gth
eK
OSPI
index
retu
rn.T
heDM
ean-a
djre
tDis
am
easu
reof
vola
tilit
yco
mpu
ted
asth
em
ean
ofa
bsolu
teva
lues
oft
he
mea
n-a
djus
ted
retu
rns.
The
CA
R(0
,1)i
sth
ecu
mul
ativ
ere
turn
sfrom
day
s0
to1,
and
the
t-st
atistics
are
report
edin
par
enth
eses
.
Mea
nst
atistics
Day
sre
lative
toth
efo
reig
nne
tbuy
orde
rim
bal
ance
(day
0)C
AR
(0,1
)
!5
!4
!3
!2
!1
01
23
45
Pan
elA
.D
aily
retu
rns
and
vola
tili
ty(%
)ar
ound
larg
efo
reig
nne
tbu
yor
der
imba
lanc
es
Ful
lpe
riod
(Dec
.2,
1996
toD
ec.
27,
1997
;N"
1,39
7)
Raw
ret
0.22
70.
297
0.22
70.
640
1.01
61.
340
!0.
344
!0.
306
!0.
369
!0.
252
!0.
353
0.99
6(2
.13)
(2.7
6)(2
.17)
(5.8
5)(8
.76)
(12.
11)
(!3.
30)
(!2.
91)
(!3.
46)
(!2.
37)
(!3.
29)
(6.0
9)
Mea
n-ad
jre
t0.
561
0.61
50.
608
1.01
01.
363
1.65
9!
0.02
60.
017
0.00
40.
098
!0.
028
1.63
3(5
.18)
(5.6
6)(5
.71)
(9.1
4)(1
1.56
)(1
4.84
)(!
0.24
)(0
.16)
(0.0
3)(0
.90)
(!0.
26)
(9.8
8)
Mar
ket
-adjre
t0.
302
0.37
70.
238
0.56
90.
924
1.51
2!
0.24
4!
0.30
0!
0.21
5!
0.00
3!
0.17
01.
267
(3.2
9)(4
.04)
(2.6
0)(6
.02)
(9.1
7)(1
5.16
)(!
2.70
)(!
3.29
)(!
2.39
)(!
0.03
)(!
1.85
)(8
.77)
DMea
n-ad
jre
tD3.
062
3.10
63.
037
3.20
43.
535
3.51
03.
001
2.97
13.
016
3.06
13.
061
Bef
ore
the
Kor
ean
cris
is(D
ec.
2,19
96to
Sept
.30
,19
97;
N"
1,20
1)
Raw
ret
0.58
20.
613
0.45
40.
740
1.31
21.
718
!0.
217
!0.
382
!0.
348
!0.
123
!0.
271
1.50
2(5
.93)
(6.1
4)(4
.60)
(7.2
3)(1
2.00
)(1
6.67
)(!
2.21
)(!
3.90
)(!
3.49
)(!
1.22
)(!
2.73
)(1
0.07
)
Mea
n-ad
jre
t0.
925
0.94
20.
851
1.12
11.
661
2.04
60.
107
!0.
056
0.03
60.
237
0.05
72.
154
(9.2
6)(9
.32)
(8.5
1)(1
0.86
)(1
4.91
)(1
9.62
)(1
.08)
(!0.
56)
(0.3
5)(2
.31)
(0.5
7)(1
4.29
)
Mar
ket
-adjre
t0.
486
0.49
80.
388
0.62
61.
108
1.69
6!
0.21
9!
0.34
9!
0.24
5!
0.05
6!
0.21
51.
477
(5.2
7)(5
.33)
(4.3
4)(6
.68)
(11.
19)
(17.
73)
(!2.
38)
(!3.
86)
(!2.
73)
(!0.
62)
(!2.
35)
(10.
74)
DMea
n-ad
jre
tD2.
690
2.71
52.
676
2.80
93.
196
3.23
42.
599
2.53
62.
606
2.67
92.
609

Dur
ing
the
Kor
ean
cris
is(O
ct.
1,19
97to
Dec
.27
,19
97;
N"
196)
Raw
ret
!1.
951
!1.
639
!1.
163
0.02
9!
0.79
2!
0.97
8!
1.12
40.
157
!0.
493
!1.
042
!0.
854
!2.
102
(!4.
51)
(!3.
77)
(!2.
73)
(0.0
6)(!
1.71
)(!
2.23
)(!
2.60
)(0
.35)
(!1.
10)
(!2.
41)
(!1.
84)
(!3.
08)
Mea
n-a
djre
t!
1.67
0!
1.38
8!
0.88
10.
325
!0.
460
!0.
716
!0.
842
0.46
0!
0.19
4!
0.75
9!
0.55
2!
1.55
8(!
3.82
)(!
3.17
)(!
2.04
)(0
.70)
(!0.
98)
(!1.
63)
(!1.
92)
(1.0
1)(!
0.43
)(!
1.74
)(!
1.19
)(!
2.26
)
Mar
ket
-adjre
t!
0.82
9!
0.36
3!
0.68
30.
218
!0.
205
0.38
3!
0.39
70.
001
!0.
028
0.32
40.
108
!0.
014
(!2.
63)
(!1.
08)
(!1.
98)
(0.6
2)(!
0.55
)(0
.98)
(!1.
27)
(0.0
0)(!
0.09
)(0
.89)
(0.3
2)(!
0.02
)
DMea
n-ad
jre
tD5.
342
5.50
25.
249
5.62
75.
617
5.20
55.
460
5.63
85.
529
5.40
25.
827
Pan
elB
.D
aily
retu
rns
and
vola
tili
ty(%
)ar
ound
larg
efo
reig
nne
tse
llor
der
imba
lanc
es
Ful
lpe
riod
(Dec
.2,
1996
toD
ec.
27,
1997
;N"
1,58
8)
Raw
ret
!0.
334
!0.
325
!0.
638
!0.
639
!0.
151
0.49
70.
152
!0.
390
!0.
452
!0.
454
!0.
464
0.64
8(!
3.15
)(!
3.02
)(!
5.69
)(!
5.51
)(!
1.24
)(4
.12)
(1.3
3)(!
3.52
)(!
4.17
)(!
4.14
)(!
4.26
)(3
.66)
Mea
n-a
djre
t!
0.03
80.
009
!0.
242
!0.
290
0.16
10.
824
0.46
7!
0.04
7!
0.05
7!
0.09
1!
0.15
71.
291
(!0.
36)
(0.0
8)(!
2.13
)(!
2.47
)(1
.31)
(6.7
5)(4
.03)
(!0.
42)
(!0.
53)
(!0.
82)
(!1.
42)
(7.1
5)
Mar
ket
-adjre
t!
0.09
0!
0.09
3!
0.28
5!
0.32
3!
0.09
40.
266
0.37
30.
037
!0.
064
!0.
230
!0.
221
0.63
9(!
1.02
)(!
1.03
)(!
3.08
)(!
3.47
)(!
0.87
)(2
.39)
(3.8
6)(0
.40)
(!0.
73)
(!2.
48)
(!2.
45)
(4.0
7)
DMea
n-ad
jre
tD3.
304
3.31
03.
471
3.65
23.
927
4.06
43.
665
3.47
43.
384
3.37
73.
371

Tab
le11
(con
tinu
ed)
Mea
nst
atistics
Day
sre
lative
toth
efo
reig
nne
tbuy
orde
rim
bala
nce
(day
0)C
AR
(0,1
)
!5
!4
!3
!2
!1
01
23
45
Bef
ore
the
Kor
ean
cris
is(D
ec.
2,19
96to
Sept
.30
,19
97;
N"
1,07
9)
Raw
ret
0.38
90.
361
!0.
024
!0.
104
0.42
40.
744
0.31
8!
0.30
5!
0.23
9!
0.28
2!
0.21
21.
062
(3.7
1)(3
.42)
(!0.
22)
(!0.
94)
(3.4
5)(5
.79)
(2.7
3)(!
2.76
)(!
2.38
)(!
2.80
)(!
2.01
)(5
.88)
Mea
n-ad
jre
t0.
703
0.71
20.
403
0.26
50.
752
1.08
60.
648
0.04
20.
175
0.09
90.
110
1.73
3(6
.60)
(6.6
4)(3
.62)
(2.3
7)(6
.08)
(8.3
7)(5
.46)
(0.3
8)(1
.73)
(0.9
7)(1
.03)
(9.4
3)
Mar
ket
-adjre
t0.
293
0.26
10.
008
!0.
054
0.39
50.
657
0.44
6!
0.12
1!
0.13
7!
0.24
8!
0.19
11.
104
(3.0
5)(2
.67)
(0.0
8)(!
0.53
)(3
.36)
(5.4
6)(4
.13)
(!1.
17)
(!1.
50)
(!2.
64)
(!1.
97)
(6.6
1)
DMea
n-ad
jre
tD2.
668
2.68
72.
751
2.76
93.
180
3.53
73.
025
2.80
82.
540
2.50
52.
623
Dur
ing
the
Kor
ean
cris
is(O
ct.
1,19
97to
Dec
.27
,19
97;
N"
509)
Raw
ret
!1.
865
!1.
778
!1.
940
!1.
773
!1.
368
!0.
028
!0.
201
!0.
572
!0.
903
!0.
817
!0.
999
!0.
229
(!8.
10)
(!7.
49)
(!7.
70)
(!6.
59)
(!5.
09)
(!0.
11)
(!0.
79)
(!2.
25)
(!3.
45)
(!3.
08)
(!3.
93)
(!0.
58)
Mea
n-a
djre
t!
1.60
9!
1.48
2!
1.61
1!
1.46
6!
1.09
20.
269
0.08
3!
0.23
5!
0.54
9!
0.49
3!
0.72
20.
352
(!6.
89)
(!6.
18)
(!6.
31)
(!5.
39)
(!4.
03)
(1.0
3)(0
.32)
(!0.
92)
(!2.
08)
(!1.
85)
(!2.
81)
(0.8
7)
Mar
ket
-adjre
t!
0.90
20.
843
!0.
906
!0.
896
!1.
131
!0.
562
0.21
80.
374
0.09
0!
0.19
2!
0.28
3!
0.34
5(!
5.07
)(!
4.55
)(!
4.93
)(!
4.64
)(!
5.00
)(!
2.43
)(1
.11)
(1.9
1)(0
.47)
(!0.
92)
(!1.
47)
(!1.
03)
DMea
n-ad
jre
tD4.
651
4.63
04.
995
5.52
25.
511
5.18
15.
023
4.88
55.
175
5.22
54.
956

market-adjusted returns are signi"cantly positive every day before the event. Onthe day of the event, there is a large positive signi"cant abnormal return. Incontrast to the intraday results, however, there are reversals over the next "vedays when we use raw or market-adjusted returns. During the crisis, foreignersno longer appear to buy following positive signi"cant abnormal returns. Fur-thermore, there is no signi"cant impact on the day of the event. Using market-adjusted returns, there is no reversal following the event. The same results applyto days when the price limit is in force at the end of the day.
As with the intraday results, there is a noticeable lack of symmetry betweennet buy and net sell events. For net sell events, we have the surprising resultbefore the crisis that on net sell days market-adjusted returns are positive. Thisagain suggests that what matters when foreigners sell is that domestic investorsbuy. The positive market-adjusted return is surrounded by days with positivemarket-adjusted returns. There are, however, signi"cant negative market-ad-justed returns on days #4 and #5. When we look at days when the price limitis hit, the results are similar. When we look at the crisis period, we "nd thatforeign investors sell following signi"cant negative market-adjusted returns.There is a negative market-adjusted return on the event day, and it is followedby "ve days without a signi"cant negative market-adjusted return. The market-adjusted return on the day that foreign investors sell and on each of the next "vedays is smaller in absolute value than the market-adjusted return of any of the"ve days that precede the event day. There is no permanent signi"cant negativee!ect following large sales by foreign investors. For the sample of events inwhich the price limit is hit on the event day, the pattern is similar, but themarket-adjusted returns are insigni"cant except for a positive signi"cant mar-ket-adjusted return on day #2. Overall, there is no evidence that large foreignsales directly cause falling stock prices.
6. Conclusion
In this paper, we use a large sample of Korean stocks to explore how foreigninvestors trade and how they impact stock prices. We "nd evidence that, beforethe Korean crisis over the last months of 1997, foreign investors engage inpositive feedback trading and herd. During the crisis, the evidence of positivefeedback trading is much weaker. There is no evidence that herding is moreimportant during the crisis period, and some evidence that it is less important.Neither positive feedback trading nor herding, however, are necessarily de-stabilizing. When we investigate the impact of episodes of heavy foreign tradingon stock prices during the day, or across days, no convincing case can be madethat foreign equity investors play a destabilizing role in the equity markets.Although policymakers are often concerned about foreign equity investorsbecause they can withdraw their capital from a country rapidly, it is important
262 H. Choe et al. / Journal of Financial Economics 54 (1999) 227}264

to remember that equity markets have built-in mechanisms that can makeforeign equity investors stay when creditors do not. In e$cient markets, assetprices fall to re#ect new adverse public information even in the absence of trades.After the new information is incorporated into prices, the incentive to sell is nolonger as powerful, since one sells at a fair price. With bank loans, however,this mechanism does not work. Loans still have to be paid in full even afteradverse information becomes known, so that a creditor wants to take his moneyout while he can, before the loan has to be renegotiated or the "rm goesbankrupt.
References
Bailey, W., Chan, K., Chung, Y.P., 1998. Depository receipts, country funds, and the Peso crash: theintraday evidence. Unpublished Paper. Cornell University.
Bekaert, G., Harvey, C.R., 1998. Capital #ows and the behavior of emerging market equity returns.Unpublished Working Paper. Duke University.
Bekaert, G., Harvey, C.R., 2000. Foreign speculators and emerging equity markets. Journal ofFinance, forthcoming.
Bohn, H., Tesar, L., 1996. U.S. equity investment in foreign markets: portfolio rebalancing or returnchasing? American Economic Review 86, 77}81.
Brennan, M.J., Cao, H.H., 1997. International portfolio investment #ows. Journal of Finance 52,1851}1880.
Clark, J. Berko E., 1996. Foreign investment #uctuations and emerging market stock returns: thecase of Mexico. Unpublished Working Paper. Federal Reserve Bank of New York.
DeLong, J.B., Shleifer, A., Summers, L.H., Walmann, R.J., 1990. Positive feedback investmentstrategies and destabilizing rational speculators. Journal of Finance 45, 379}395.
Dornbusch, R., Park, Y.C., 1995. Financial integration in a second-best world: are we still sure aboutour classical prejudices. In: Dornbusch, R., Park, Y.C. (Eds.), Financial Opening: Policy Lessonsfor Korea. Korea Institute of Finance, Seoul, Korea.
Froot, K., O'Connell, P.G.J., Seasholes, M.S., 1998. The portfolio #ows of international investors.Unpublished Working Paper. Harvard University.
Henry, P.B., 2000. Stock market liberalization, economic reform, and emerging market equity prices.Journal of Finance, forthcoming.
Holthausen, R.W., Leftwich, R.W., Mayers, D., 1990. Large-block transactions, the speed ofresponse, and temporary and permanent stock-price e!ects. Journal of Financial Economics 26,71}95.
Kang, J.-K., Stulz, R.M., 1997. Why is there a home bias? An analysis of foreign portfolio equityownership in Japan. Journal of Financial Economics 46, 2}28.
Krugman, P., 1997. Seven habits of highly defective investors. Fortune, December 27.Lakonishok, J., Shleifer, A., Vishny, R.W., 1992. The impact of institutional trading on stock prices.
Journal of Financial Economics 32, 23}43.Lee, C.M.C., Ready, M.A., 1991. Inferring trade direction from intraday data. Journal of Finance 46,
733}746.Nofsinger, J.R., Sias, R.W., 1999. Herding and feedback trading by institutional and individual
investors. Journal of Finance, forthcoming.Radelet, S., Sachs, J., 1998. The onset of the East Asian "nancial crisis. Unpublished Working Paper.
Harvard University.Stiglitz, J., 1998. Boats, planes and capital #ows. Financial Times, March 25.
H. Choe et al. / Journal of Financial Economics 54 (1999) 227}264 263

Stulz, R.M., 1998. Globalization of equity markets and the cost of capital. Unpublished WorkingPaper. The Ohio State University.
Stulz, R.M., 1999. International portfolio #ows and security markets. In: Feldstein, M. (Ed.),International Capital Flows. University of Chicago Press, Chicago, IL.
Tesar, L.L., Werner, I.M., 1995. Home bias and high turnover. Journal of International Money andFinance 14, 467}492.
Wermers, R, 1999. Mutual fund herding and the impact on stock prices. Journal of Finance 54,581}622.
264 H. Choe et al. / Journal of Financial Economics 54 (1999) 227}264