Embed Size (px)
Citation preview
8/3/2019 DNH Sri Lanka Weekly 17-21 October 2011
http://slidepdf.com/reader/full/dnh-sri-lanka-weekly-17-21-october-2011 1/11
21-Oct
Prime Lending Rate (Avg. Weighted) 9.21%
Deposit Rate (Avg. Weighted) 6.48%
Treasury Bill Rate (360 Days) 7.34%
Dollar Denominated Bond Rate 6.25%
LKR/US$ (Selling Rate) 111.05
LKR/EURO (Selling Rate) 154.00
14-Oct 21-Oct WoW%
Sri Lanka - ASPI 6550 6357 -2.9
India - Sensex 17083 16785 -1.7
Pakistan - KSE 100 11992 11525 -3.9
Taiwan Weighted 7358 7255 -1.4
Singapore - Straits Times 2744 2712 -1.2
Hong Kong - Hang Seng 18502 18026 -2.6
D N H
M A R K
E T W
A T C H
Sri Lanka Weekly
Market Indices
In the absence of any significant news, the
Sri Lanka bourse continued its downward
trajectory with the ASPI and MPI losing
2.9% and 3.5%WOW to close at 6357 and
5675 respectively. With the majority of
investors sitting in the wings, turnover
dropped to its lowest level in recent
months, falling to LKR4.4 bn (-
35.3%WoW) with the only notable trades
recorded by John Keells Holdings, Colombo
Land and HVA Foods which collectively
accounted for 14% of the week’s total.
Global markets meanwhile traded largely
lower during the week as a result of
Moody’s cut of Spain’s credit rating to A1
Global Markets
17-21 October 2011
Market Performance
Interest Rates & Currencies
32.
14.3
12.8
9.4
-50.0
-37.5
-32.4
-25.0
Infrastructure
SMB Leasing (X)
Colombo Investment Trust
Ceylinco Ins. (X)
Serendib Land
Kalamazoo
Miramar
SMB Leasing (W 0016)
Gainers & Losers (%)
from Aa2 and the rating agency’s
war ning that it may lower France’ s
rating amid growing eurozone debt
concerns.
DNH Financial (Pvt) Ltd.
www.dnhfinancial.com
+94-11-5700777
This Week
Prv. Week WoW%
ASPI 6,357 6,550 -2.9
MPI 5,675 5,878 -3.5
Turnover (bn) 4.4 6.8 -35.3
Foreign Purchases (mn) 425 1213 -65.0
Foreign Sales (mn) 755 621 21.6
Traded Companies 253 255 -0.8
Market PER (X) 16.35 16.84 -2.9
Market Cap (LKR bn) 2,283 2,353 -3.0
Market Cap (US$ bn) 20.6 21.2 -3.0
Dividend Yield (%) 1.66 1.61 3.1
Price to Book (X) 2.07 2.13 -2.8
8/3/2019 DNH Sri Lanka Weekly 17-21 October 2011
http://slidepdf.com/reader/full/dnh-sri-lanka-weekly-17-21-october-2011 2/11
Page 2Sri Lanka Weekly17-21 October 2011
Market Performance
All eyes are now however focused on
Sunday’s EU meeting as investors wait with
bated breath in the hopes of securing a muchneeded panacea to the region’s crisis.
Kicking off the 3Q2011 corporate results
season, Piramal Glass released its results
recording a 25% jump in revenues and 54%
rise in earnings on the back of increased
volume growth notwithstanding relatively
higher input prices. Benefiting from the
robust growth in the local economy, we
expect the majority of the 3Q2011 corporate
results to record double digit quality
earnings growth as a result of higher
volumes and improved margins.
While the market PE on the local bourse has
been on a declining trend, we believe that
the current multiple of 16X does not fully
reflect the valuations of a number of
fundamentally strong stocks which aretrading at multiples of below 10X. With
investors having pushed up the price of
lower quality companies during the
2009/2010 bull run, an opportunity to invest
in companies of higher fundamental value
now exists with significant upside potential
of reversing relative underperformance.With
trading volumes showing increasing signs of
declining, we believe that the market iscoming close to a consolidation point before
changing course to a rerating. With the
majority of 3Q2011 results yet to be
released, we advise investors to take
advantage of this window period to select
stocks that are likely to outperform based
on solid intrinsic values.
Looking beyond the reported numbers
While the majority of economic indicators
point to a strong acceleration in the
domestic economy, we attempted to defy
the skeptics and look beyond the reportednumbers and test out the figures once and
for all. With the Sri Lankan economy
growing at an amazing 8.3%, it was highly
important for us to determine the extent of
the trickle down effect on the masses,
especially the middle income class that
accounts for the majority of the population
and whose consumer patterns will largely
fuel future economic growth and shape its
trajectory.
A Random walk down Colombo
We started our journey with the dine-outs.
Restaurants are generally a good proxy of
consumer spending and a reasonably
reliable indicator of economic momentum in
the country. Having stopped by several ofColombo’s restaurants, both fine dining and
low to mid end quick service
establishments, we were not surprised by
our findings. Most restaurants were full,
notably fine dining areas. What was
interesting to note was that up to 75-90% of
guests at city five star restaurants were
locals indicating that disposable incomes
were rising with domestic consumers clearly
not in a hurry to tie up their purse strings
against the backdrop of international
recessionary pressures and a slowdown in
global consumption.
8/3/2019 DNH Sri Lanka Weekly 17-21 October 2011
http://slidepdf.com/reader/full/dnh-sri-lanka-weekly-17-21-october-2011 3/11
Page 3Sri Lanka Weekly17-21 October 2011
Checking in to hotels
It is definitely encouraging to note that
tourist arrivals to Sri Lanka is growing at
strong double digit rates, notwithstanding a
slowdown in the global travel industry andtourists becoming more value conscious
with their tourist dollars. While foreign
tourists have traditionally been responsible
for high hotel occupancy levels, a recent
development has been the increasing take
up of hotel rooms by local guests, a trend
that clearly reveals a specific rise in the
disposable income of selected consumer
segments.
While this is not uncommon in the case of
resort hotels which normally experience a
flurry of local guests during the weekends,
this appears to be a new phenomenon for
the city hotels whose live-in guests have
traditionally being wholly foreign visitors.
Time to indulge in some luxury?
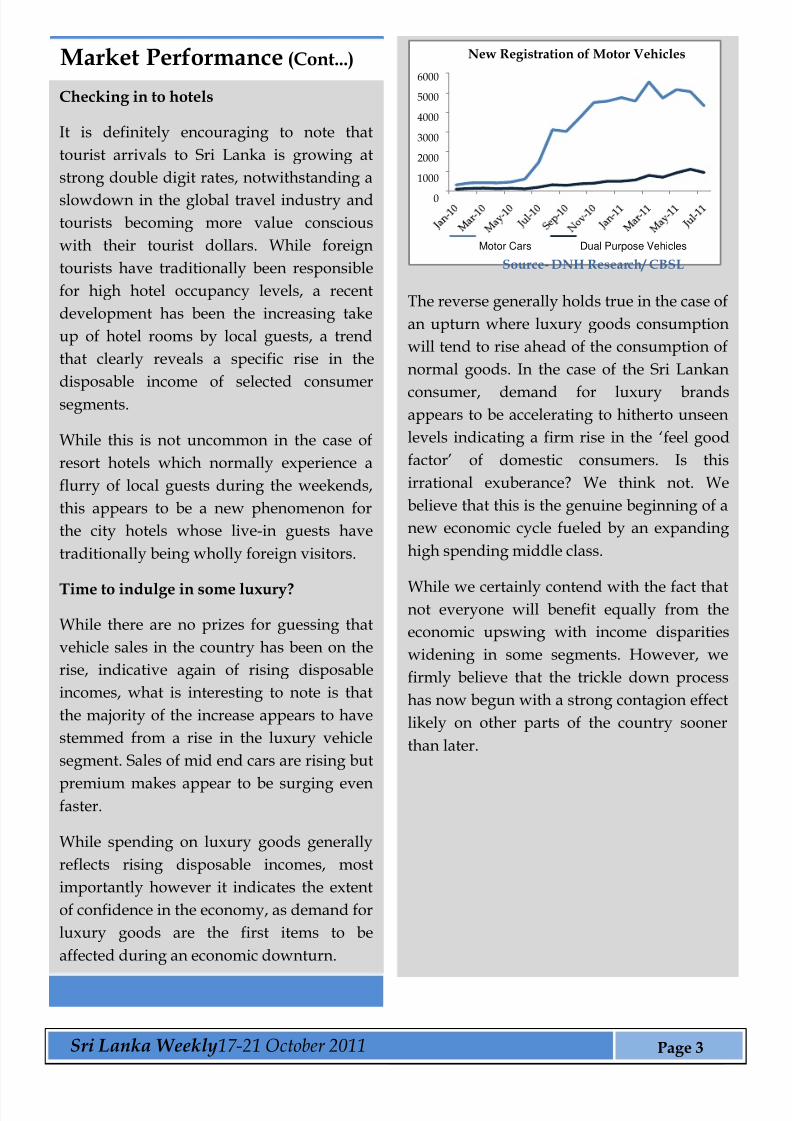
While there are no prizes for guessing that
vehicle sales in the country has been on the
rise, indicative again of rising disposable
incomes, what is interesting to note is that
the majority of the increase appears to have
stemmed from a rise in the luxury vehicle
segment. Sales of mid end cars are rising but
premium makes appear to be surging evenfaster.
While spending on luxury goods generally
reflects rising disposable incomes, most
importantly however it indicates the extent
of confidence in the economy, as demand for
luxury goods are the first items to be
affected during an economic downturn.
Market Performance (Cont...)
The reverse generally holds true in the case of
an upturn where luxury goods consumption
will tend to rise ahead of the consumption of
normal goods. In the case of the Sri Lankan
consumer, demand for luxury brandsappears to be accelerating to hitherto unseen
levels indicating a firm rise in the ‘feel good
factor’ of domestic consumers. Is this
irrational exuberance? We think not. We
believe that this is the genuine beginning of a
new economic cycle fueled by an expanding
high spending middle class.
While we certainly contend with the fact thatnot everyone will benefit equally from the
economic upswing with income disparities
widening in some segments. However, we
firmly believe that the trickle down process
has now begun with a strong contagion effect
likely on other parts of the country sooner
than later.
0
1000
2000
3000
4000
5000
6000
New Registration of Motor Vehicles
Motor Cars Dual Purpose Vehicles
Source- DNH Research/ CBSL
8/3/2019 DNH Sri Lanka Weekly 17-21 October 2011
http://slidepdf.com/reader/full/dnh-sri-lanka-weekly-17-21-october-2011 4/11
Page 4Sri Lanka Weekly17-21 October 2011
Outbound not just inbound tourism is on the
rise
While inbound tourist traffic has clearly seen a
prolific rise, outbound tourism appears to beenjoying similar growth. While we do agree
that this is partly due to a general decline in
the price of holiday packages, the volume of
traffic nevertheless indicates that domestic
consumers do have pockets deep enough to
indulge in an overseas leisure experience and
we expect this trend to only increase going
forward.
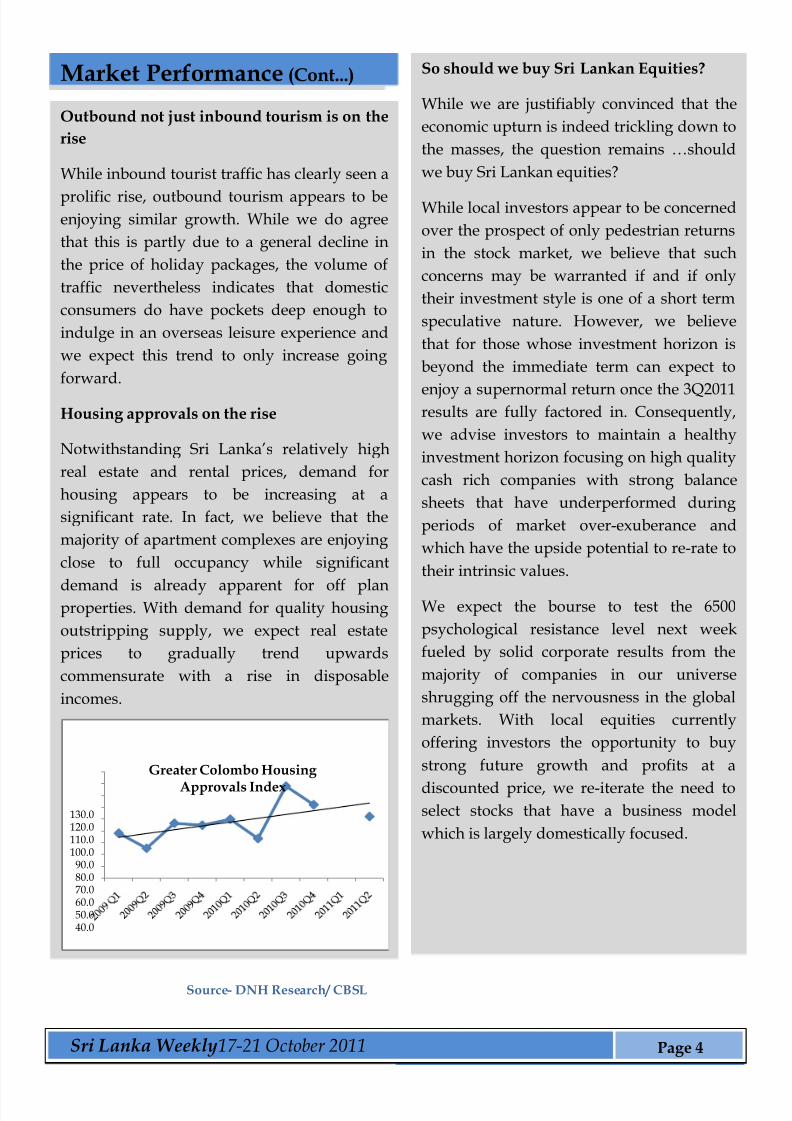
Housing approvals on the rise
Notwithstanding Sri Lanka’s relatively high
real estate and rental prices, demand for
housing appears to be increasing at a
significant rate. In fact, we believe that the
majority of apartment complexes are enjoying
close to full occupancy while significant
demand is already apparent for off planproperties. With demand for quality housing
outstripping supply, we expect real estate
prices to gradually trend upwards
commensurate with a rise in disposable
incomes.
40.050.060.070.080.090.0
100.0110.0120.0130.0
Greater Colombo Housing
Approvals Index
Source- DNH Research/ CBSL
Market Performance (Cont...) So should we buy Sri Lankan Equities?
While we are justifiably convinced that the
economic upturn is indeed trickling down to
the masses, the question remains …should
we buy Sri Lankan equities?
While local investors appear to be concerned
over the prospect of only pedestrian returns
in the stock market, we believe that such
concerns may be warranted if and if only
their investment style is one of a short term
speculative nature. However, we believe
that for those whose investment horizon is
beyond the immediate term can expect to
enjoy a supernormal return once the 3Q2011results are fully factored in. Consequently,
we advise investors to maintain a healthy
investment horizon focusing on high quality
cash rich companies with strong balance
sheets that have underperformed during
periods of market over-exuberance and
which have the upside potential to re-rate to
their intrinsic values.
We expect the bourse to test the 6500
psychological resistance level next week
fueled by solid corporate results from the
majority of companies in our universe
shrugging off the nervousness in the global
markets. With local equities currently
offering investors the opportunity to buy
strong future growth and profits at a
discounted price, we re-iterate the need toselect stocks that have a business model
which is largely domestically focused.
8/3/2019 DNH Sri Lanka Weekly 17-21 October 2011
http://slidepdf.com/reader/full/dnh-sri-lanka-weekly-17-21-october-2011 5/11
Page 5Sri Lanka Weekly17-21 October 2011
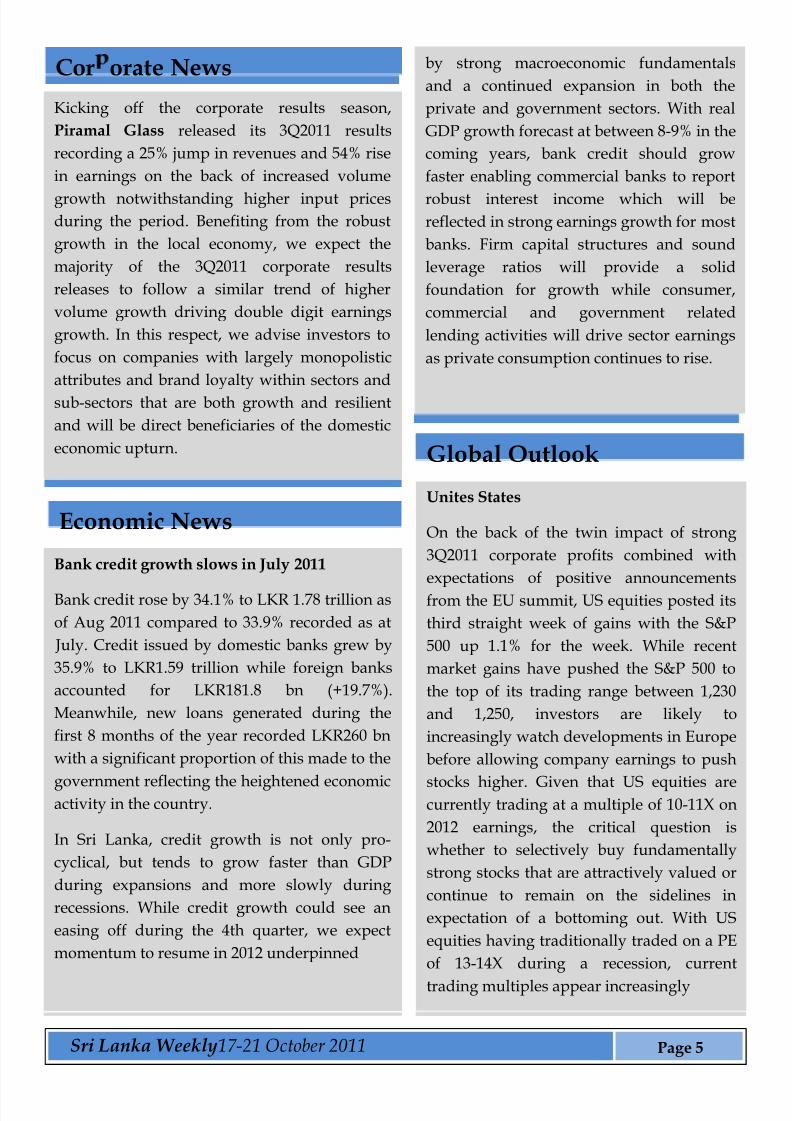
Kicking off the corporate results season,
Piramal Glass released its 3Q2011 results
recording a 25% jump in revenues and 54% rise
in earnings on the back of increased volume
growth notwithstanding higher input pricesduring the period. Benefiting from the robust
growth in the local economy, we expect the
majority of the 3Q2011 corporate results
releases to follow a similar trend of higher
volume growth driving double digit earnings
growth. In this respect, we advise investors to
focus on companies with largely monopolistic
attributes and brand loyalty within sectors and
sub-sectors that are both growth and resilient
and will be direct beneficiaries of the domestic
economic upturn.
by strong macroeconomic fundamentals
and a continued expansion in both the
private and government sectors. With real
GDP growth forecast at between 8-9% in the
coming years, bank credit should grow
faster enabling commercial banks to report
robust interest income which will bereflected in strong earnings growth for most
banks. Firm capital structures and sound
leverage ratios will provide a solid
foundation for growth while consumer,
commercial and government related
lending activities will drive sector earnings
as private consumption continues to rise.
Cor orate News
Economic News
Bank credit growth slows in July 2011
Bank credit rose by 34.1% to LKR 1.78 trillion as
of Aug 2011 compared to 33.9% recorded as at
July. Credit issued by domestic banks grew by
35.9% to LKR1.59 trillion while foreign banks
accounted for LKR181.8 bn (+19.7%).
Meanwhile, new loans generated during the
first 8 months of the year recorded LKR260 bn
with a significant proportion of this made to the
government reflecting the heightened economicactivity in the country.
In Sri Lanka, credit growth is not only pro-
cyclical, but tends to grow faster than GDP
during expansions and more slowly during
recessions. While credit growth could see an
easing off during the 4th quarter, we expect
momentum to resume in 2012 underpinned
Global Outlook
Unites States
On the back of the twin impact of strong
3Q2011 corporate profits combined with
expectations of positive announcements
from the EU summit, US equities posted its
third straight week of gains with the S&P
500 up 1.1% for the week. While recent
market gains have pushed the S&P 500 to
the top of its trading range between 1,230
and 1,250, investors are likely to
increasingly watch developments in Europe
before allowing company earnings to push
stocks higher. Given that US equities arecurrently trading at a multiple of 10-11X on
2012 earnings, the critical question is
whether to selectively buy fundamentally
strong stocks that are attractively valued or
continue to remain on the sidelines in
expectation of a bottoming out. With US
equities having traditionally traded on a PE
of 13-14X during a recession, current
trading multiples appear increasingly
8/3/2019 DNH Sri Lanka Weekly 17-21 October 2011
http://slidepdf.com/reader/full/dnh-sri-lanka-weekly-17-21-october-2011 6/11
Page 6Sri Lanka Weekly17-21 October 2011
attractive for certain counters.
Notwithstanding market valuations, it may
take more than an attractive PE to lure
investors into equities with strong positive
signals from the EU Summit likely to be adeciding factor.
Eurozone
Eurozone equities traded with a downward
bias as investors sat in the wings ahead of the
EU meeting on Sunday where talks are to be
held by the region’s policymakers on how to
contain the ongoing debt crisis. The Eurostoxx
50 consequently declined by 1.3% during the
week led mainly by declines in the DAX and
FTSE 100. Notwithstanding the prospect of a
possible positive outcome at the EU meetings,
Germany and France still appear to be at
relative disagreement on how to scale up the
European Financial Stability Facility and how
to cut Greek debt. Europe’s economic roller-
coaster ride meanwhile continued during theweek with Moody’s downgrading Spain’s
credit rating by two notches to A1 from Aa2
followed by downgrades by S&P and Fitch. In
addition, Moody’s has also warned France that
by backing the European rescue fund, its own
credit rating could be at risk. While a positive
trajectory for the markets could eventuate
following Sunday’s EU summit
announcements, the medium to longer termoutlook remains merky given the highly
complicated structure of the euro zone and the
difficulty in swift implementation of any
decisions reached.
Asia
Asian equities closed the week on a neutral
note ahead of the Eurozone’s crucial
meeting on Sunday aimed at finding a
solution to Europe’s debt crisis.
Consequently, the Asia Pacific index closedmarginally lower to end the week down
0.9%. Stocks suffered on Thursday in the
run-up to the weekend’s scheduled EU
summit as a barrage of conflicting headlines
pointed to discord between key parties and
delays in announcing a plan. Meanwhile
China announced during the week that it
would allow four of its local governments to
begin issuing their own debt widely seen asa boost for the Chinese banking sector and
the broader economy especially after Beijing
released lower than expected 3Q2011
economic growth figures which showed
Chinese GDP growth slowing down to 9.1%
compared to market expectations of 9.2%
and higher. The figures may stoke concerns
that a slowdown in orders from the U.S. and
Europe could be denting Chinese growth
while stubbornly high inflationary figures
could also pose a challenge.
Global Outlook
8/3/2019 DNH Sri Lanka Weekly 17-21 October 2011
http://slidepdf.com/reader/full/dnh-sri-lanka-weekly-17-21-october-2011 7/11
Page 7Sri Lanka Weekly17-21 October 2011
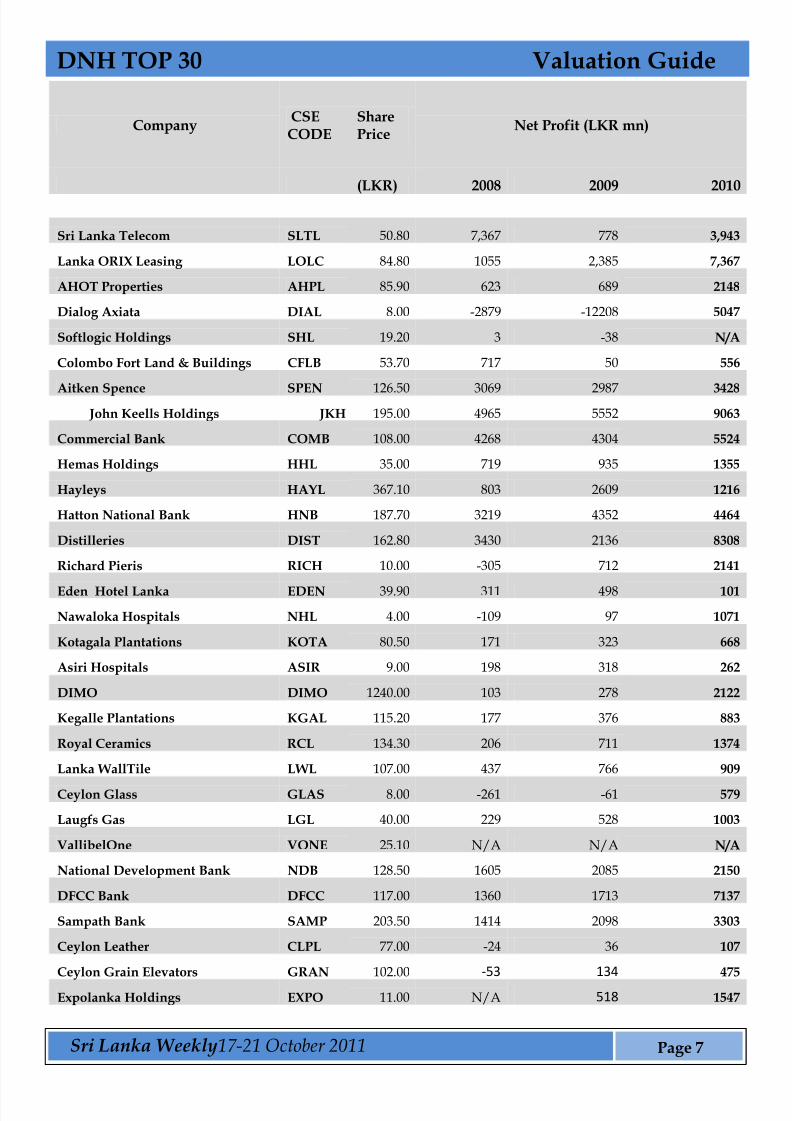
CompanyCSECODE
SharePrice
Net Profit (LKR mn)
(LKR) 2008 2009 2010
Sri Lanka Telecom SLTL 50.80 7,367 778 3,943
Lanka ORIX Leasing LOLC 84.80 1055 2,385 7,367
AHOT Properties AHPL 85.90 623 689 2148
Dialog Axiata DIAL 8.00 -2879 -12208 5047
Softlogic Holdings SHL 19.20 3 -38 N/A
Colombo Fort Land & Buildings CFLB 53.70 717 50 556
Aitken Spence SPEN 126.50 3069 2987 3428 John Keells Holdings JKH 195.00 4965 5552 9063
Commercial Bank COMB 108.00 4268 4304 5524
Hemas Holdings HHL 35.00 719 935 1355
Hayleys HAYL 367.10 803 2609 1216
Hatton National Bank HNB 187.70 3219 4352 4464
Distilleries DIST 162.80 3430 2136 8308
Richard Pieris RICH 10.00 -305 712 2141
Eden Hotel Lanka EDEN 39.90 311 498 101
Nawaloka Hospitals NHL 4.00 -109 97 1071
Kotagala Plantations KOTA 80.50 171 323 668
Asiri Hospitals ASIR 9.00 198 318 262
DIMO DIMO 1240.00 103 278 2122
Kegalle Plantations KGAL 115.20 177 376 883
Royal Ceramics RCL 134.30 206 711 1374
Lanka WallTile LWL 107.00 437 766 909
Ceylon Glass GLAS 8.00 -261 -61 579
Laugfs Gas LGL 40.00 229 528 1003
VallibelOne VONE 25.10 N/A N/A N/A
National Development Bank NDB 128.50 1605 2085 2150
DFCC Bank DFCC 117.00 1360 1713 7137
Sampath Bank SAMP 203.50 1414 2098 3303
Ceylon Leather CLPL 77.00 -24 36 107
Ceylon Grain Elevators GRAN 102.00 -53 134 475
Expolanka Holdings EXPO 11.00 N/A 518 1547
DNH TOP 30 Valuation Guide
8/3/2019 DNH Sri Lanka Weekly 17-21 October 2011
http://slidepdf.com/reader/full/dnh-sri-lanka-weekly-17-21-october-2011 8/11
Page 8Sri Lanka Weekly17-21 October 2011
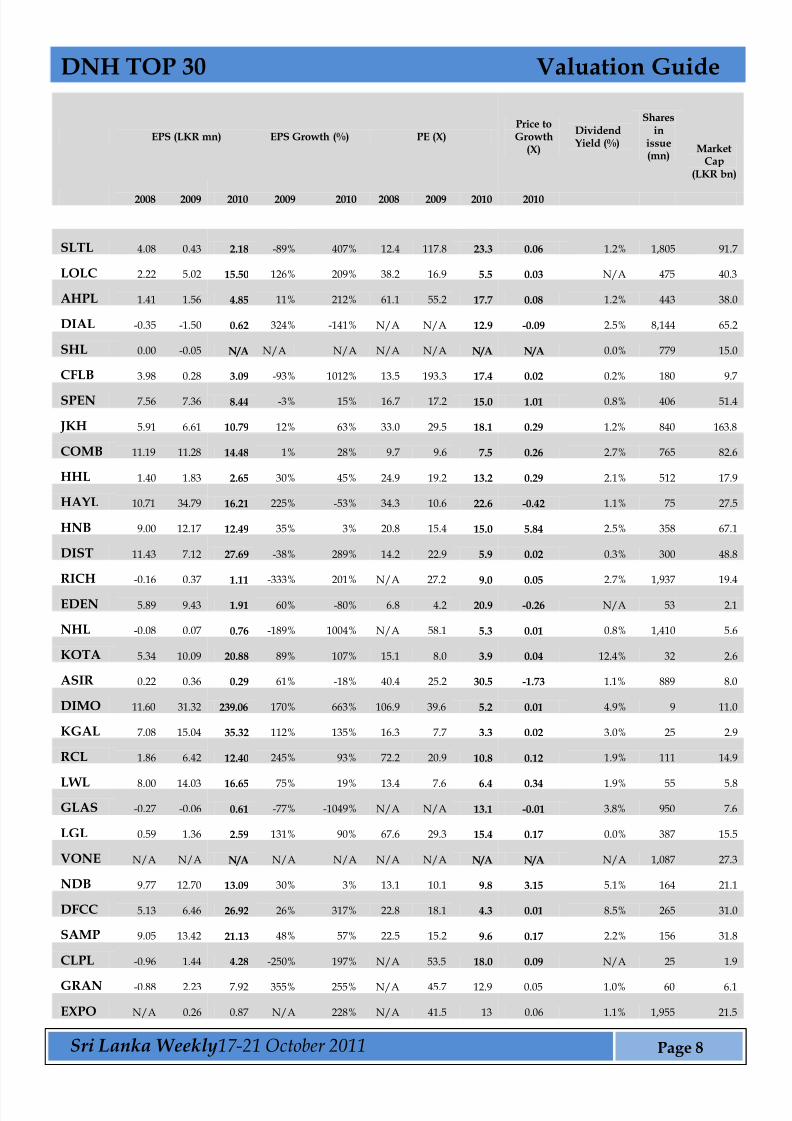
EPS (LKR mn) EPS Growth (%) PE (X)Price toGrowth
(X)
DividendYield (%)
Sharesin
issue(mn)
MarketCap
(LKR bn)
2008 2009 2010 2009 2010 2008 2009 2010 2010
SLTL 4.08 0.43 2.18 -89% 407% 12.4 117.8 23.3 0.06 1.2% 1,805 91.7
LOLC 2.22 5.02 15.50 126% 209% 38.2 16.9 5.5 0.03 N/A 475 40.3
AHPL 1.41 1.56 4.85 11% 212% 61.1 55.2 17.7 0.08 1.2% 443 38.0
DIAL -0.35 -1.50 0.62 324% -141% N/A N/A 12.9 -0.09 2.5% 8,144 65.2
SHL 0.00 -0.05 N/A N/A N/A N/A N/A N/A N/A 0.0% 779 15.0
CFLB 3.98 0.28 3.09 -93% 1012% 13.5 193.3 17.4 0.02 0.2% 180 9.7
SPEN 7.56 7.36 8.44 -3% 15% 16.7 17.2 15.0 1.01 0.8% 406 51.4
JKH 5.91 6.61 10.79 12% 63% 33.0 29.5 18.1 0.29 1.2% 840 163.8
COMB 11.19 11.28 14.48 1% 28% 9.7 9.6 7.5 0.26 2.7% 765 82.6
HHL 1.40 1.83 2.65 30% 45% 24.9 19.2 13.2 0.29 2.1% 512 17.9
HAYL 10.71 34.79 16.21 225% -53% 34.3 10.6 22.6 -0.42 1.1% 75 27.5
HNB 9.00 12.17 12.49 35% 3% 20.8 15.4 15.0 5.84 2.5% 358 67.1
DIST 11.43 7.12 27.69 -38% 289% 14.2 22.9 5.9 0.02 0.3% 300 48.8
RICH -0.16 0.37 1.11 -333% 201% N/A 27.2 9.0 0.05 2.7% 1,937 19.4
EDEN 5.89 9.43 1.91 60% -80% 6.8 4.2 20.9 -0.26 N/A 53 2.1
NHL -0.08 0.07 0.76 -189% 1004% N/A 58.1 5.3 0.01 0.8% 1,410 5.6
KOTA 5.34 10.09 20.88 89% 107% 15.1 8.0 3.9 0.04 12.4% 32 2.6
ASIR 0.22 0.36 0.29 61% -18% 40.4 25.2 30.5 -1.73 1.1% 889 8.0
DIMO 11.60 31.32 239.06 170% 663% 106.9 39.6 5.2 0.01 4.9% 9 11.0
KGAL 7.08 15.04 35.32 112% 135% 16.3 7.7 3.3 0.02 3.0% 25 2.9
RCL 1.86 6.42 12.40 245% 93% 72.2 20.9 10.8 0.12 1.9% 111 14.9
LWL 8.00 14.03 16.65 75% 19% 13.4 7.6 6.4 0.34 1.9% 55 5.8
GLAS -0.27 -0.06 0.61 -77% -1049% N/A N/A 13.1 -0.01 3.8% 950 7.6
LGL 0.59 1.36 2.59 131% 90% 67.6 29.3 15.4 0.17 0.0% 387 15.5
VONE N/A N/A N/A N/A N/A N/A N/A N/A N/A N/A 1,087 27.3
NDB 9.77 12.70 13.09 30% 3% 13.1 10.1 9.8 3.15 5.1% 164 21.1
DFCC 5.13 6.46 26.92 26% 317% 22.8 18.1 4.3 0.01 8.5% 265 31.0
SAMP 9.05 13.42 21.13 48% 57% 22.5 15.2 9.6 0.17 2.2% 156 31.8
CLPL -0.96 1.44 4.28 -250% 197% N/A 53.5 18.0 0.09 N/A 25 1.9
GRAN -0.88 2.23 7.92 355% 255% N/A 45.7 12.9 0.05 1.0% 60 6.1
EXPO N/A 0.26 0.87 N/A 228% N/A 41.5 13 0.06 1.1% 1,955 21.5
DNH TOP 30 Valuation Guide
8/3/2019 DNH Sri Lanka Weekly 17-21 October 2011
http://slidepdf.com/reader/full/dnh-sri-lanka-weekly-17-21-october-2011 9/11
Page 9Sri Lanka Weekly17-21 October 2011
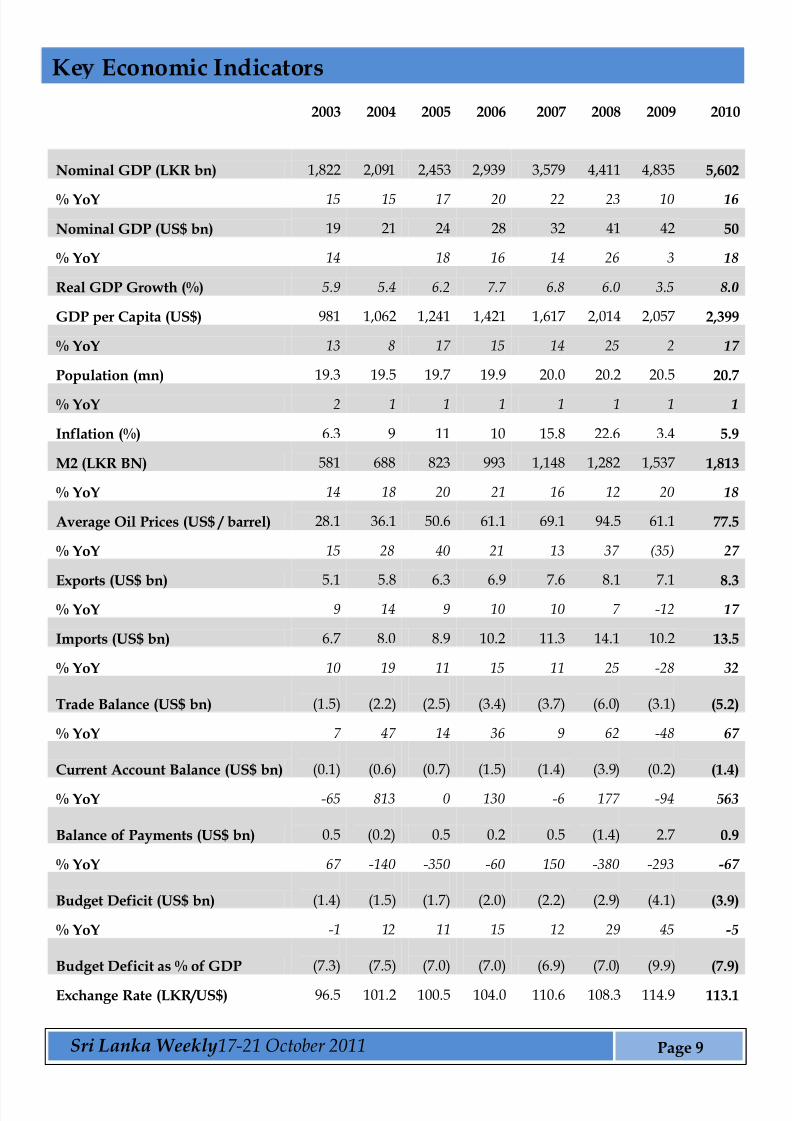
2003 2004 2005 2006 2007 2008 2009 2010
Nominal GDP (LKR bn) 1,822 2,091 2,453 2,939 3,579 4,411 4,835 5,602
% YoY 15 15 17 20 22 23 10 16
Nominal GDP (US$ bn) 19 21 24 28 32 41 42 50
% YoY 14 18 16 14 26 3 18
Real GDP Growth (%) 5.9 5.4 6.2 7.7 6.8 6.0 3.5 8.0
GDP per Capita (US$) 981 1,062 1,241 1,421 1,617 2,014 2,057 2,399
% YoY 13 8 17 15 14 25 2 17
Population (mn) 19.3 19.5 19.7 19.9 20.0 20.2 20.5 20.7
% YoY 2 1 1 1 1 1 1 1
Inflation (%) 6.3 9 11 10 15.8 22.6 3.4 5.9
M2 (LKR BN) 581 688 823 993 1,148 1,282 1,537 1,813
% YoY 14 18 20 21 16 12 20 18
Average Oil Prices (US$ / barrel) 28.1 36.1 50.6 61.1 69.1 94.5 61.1 77.5
% YoY 15 28 40 21 13 37 (35) 27
Exports (US$ bn) 5.1 5.8 6.3 6.9 7.6 8.1 7.1 8.3
% YoY 9 14 9 10 10 7 -12 17
Imports (US$ bn) 6.7 8.0 8.9 10.2 11.3 14.1 10.2 13.5
% YoY 10 19 11 15 11 25 -28 32
Trade Balance (US$ bn) (1.5) (2.2) (2.5) (3.4) (3.7) (6.0) (3.1) (5.2)
% YoY 7 47 14 36 9 62 -48 67
Current Account Balance (US$ bn) (0.1) (0.6) (0.7) (1.5) (1.4) (3.9) (0.2) (1.4)
% YoY -65 813 0 130 -6 177 -94 563
Balance of Payments (US$ bn) 0.5 (0.2) 0.5 0.2 0.5 (1.4) 2.7 0.9
% YoY 67 -140 -350 -60 150 -380 -293 -67
Budget Deficit (US$ bn) (1.4) (1.5) (1.7) (2.0) (2.2) (2.9) (4.1) (3.9)
% YoY -1 12 11 15 12 29 45 -5
Budget Deficit as % of GDP (7.3) (7.5) (7.0) (7.0) (6.9) (7.0) (9.9) (7.9)
Exchange Rate (LKR/US$) 96.5 101.2 100.5 104.0 110.6 108.3 114.9 113.1
Ke Economic Indicators
8/3/2019 DNH Sri Lanka Weekly 17-21 October 2011
http://slidepdf.com/reader/full/dnh-sri-lanka-weekly-17-21-october-2011 10/11
Page 10Sri Lanka Weekly17-21 October 2011
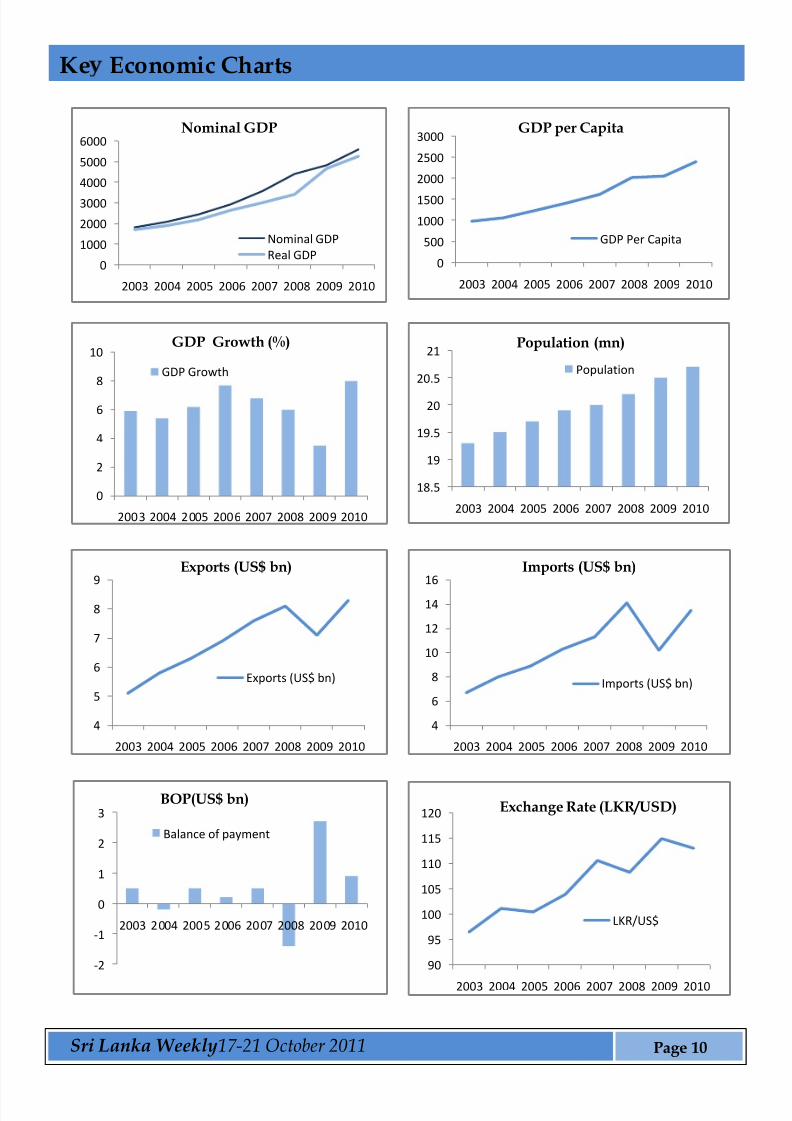
0
1000
2000
3000
4000
5000
6000
2003 2004 2005 2006 2007 2008 2009 2010
Nominal GDP
Nominal GDP
Real GDP0
500
1000
1500
2000
2500
3000
2003 2004 2005 2006 2007 2008 2009 2010
GDP per Capita
GDP Per Capita
0
2
4
6
8
10
2003 2004 2005 2006 2007 2008 2009 2010
GDP Growth (%)
GDP Growth
18.5
19
19.5
20
20.5
21
2003 2004 2005 2006 2007 2008 2009 2010
Population (mn)
Population
4
5
6
7
8
9
2003 2004 2005 2006 2007 2008 2009 2010
Exports (US$ bn)
Exports (US$ bn)
4
6
8
10
12
14
16
2003 2004 2005 2006 2007 2008 2009 2010
Imports (US$ bn)
Imports (US$ bn)
-2
-1
0
1
2
3
2003 2004 2005 2006 2007 2008 2009 2010
BOP(US$ bn)
Balance of payment
90
95
100
105
110
115
120
2003 2004 2005 2006 2007 2008 2009 2010
Exchange Rate (LKR/USD)
LKR/US$
Ke Economic Charts
8/3/2019 DNH Sri Lanka Weekly 17-21 October 2011
http://slidepdf.com/reader/full/dnh-sri-lanka-weekly-17-21-october-2011 11/11
Page 11Sri Lanka Weekly17-21 October 2011
Disclaimer
This Review is prepared and issued by DNH Financial (Pvt.) Ltd. (DNH) based on information in the public domain, internally developed and other sources, believed to be correct. Although all reasonable carehas been taken to ensure the contents of the Review are accurate, DNH and/or its Directors,employees, are not responsible for the correctness, usefulness, reliability of same. DNH may act as a
Broker in the investments which are the subject of this document or related investments and may haveacted on or used the information contained in this document, or the research or analysis on which it isbased, before its publication. DNH and/or its principal, their respective Directors, or Employees may alsohave a position or be otherwise interested in the investments referred to in this document. This is not anoffer to sell or buy the investments referred to in this document. This Review may contain data which areinaccurate and unreliable. You hereby waive irrevocably any rights or remedies in law or equity you haveor may have against DNH with respect to the Review and agree to indemnify and hold DNH and/or its principal, their respective directors and employees harmless to the fullest extent allowed by law regarding all matters related to your use of this Review.No part of this document may be reproduced, distributed or published in whole or in part by any means to any other person for any purpose without prior permission.DNH Financial is a fully owned subsidiary of Environmental Resources Investment PLC(ERI).
Contacts
Sales Desk: +94115700707, +94115732222, +94115700777
Branch Sales: Negombo- +94 31-5676451, Jaffna-+94212224929
Research:+94115700726
Website: www.dnhfinancial.com
E- mail: [email protected]
Head Office Branch Service Center
Level 16, West Tower,
World Trade Centre,
Colombo-01, Sri Lanka.
No.72, Palaly Road,
Iluppaiyadi Junction,
Jaffna.
No. 142, Greens Rd,
Negombo.