Embed Size (px)
Citation preview
Nove mogućnosti u prevenciji ateroskleroze djelovanjem na LDL kolesterol
Prof.dr.sc. Luka Zaputović, dr.med.
Zavod za kardiovaskularne bolesti
Klinički bolnički centar Rijeka
Medicinski fakultet, Sveučilište u Rijeci
Godišnji kongres Hrvatskog društva za vaskularnu kirurgiju
Opatija, 23. svibnja, 2019.
2
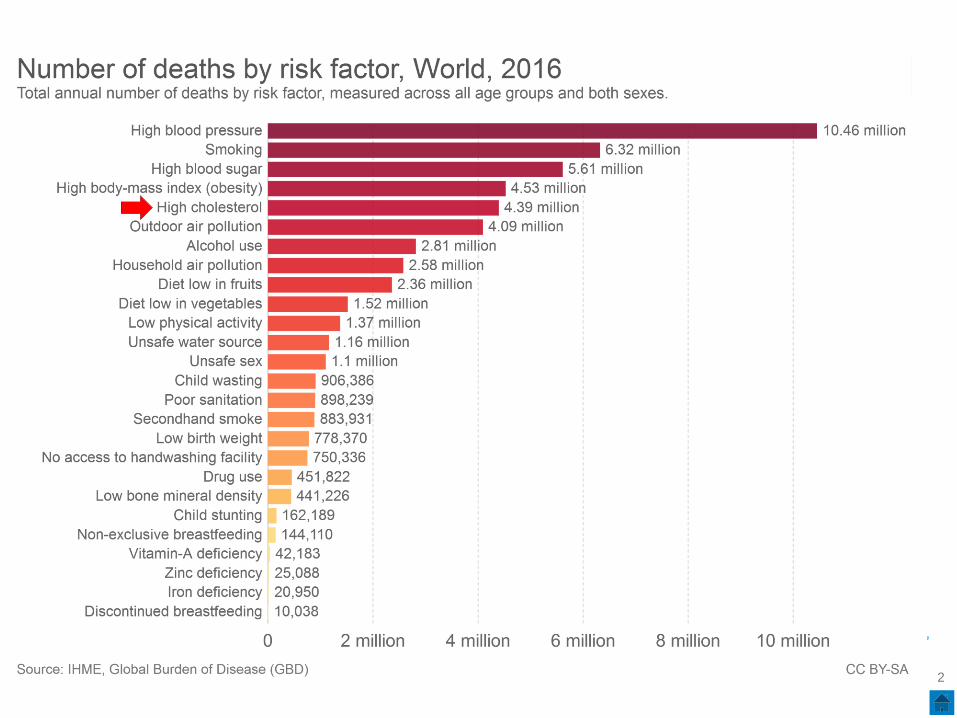
High LDL-C levels increase risk across all types of ASCVD
Incidence (per 1,000 person-years) per LDL-C Quartile
Mean LDL-C quartiles (mmol/L)
1 2 3 4
2.7 3.6 4.2 5.3
Person –years 64,431 64,547 62,053 63,574
Incidence (per 1,000 person years)
CAD (N = 2332) 5.77 8.24 10.09 12.62
Ischemic stroke (N = 268) 0.67 1.05 1.10 1.40
Hemorrhagic stroke (N = 117) 0.45 0.43 0.45 0.50
Abdominal aneurysm (N = 143) 0.42 0.56 0.58 0.69
PAD (N = 227) 0.70 0.67 1.05 1.16
ASCVD = atherosclerotic cardiovascular disease; CAD = coronary artery disease; LDL-C = low-density lipoprotein cholesterol;
PAD = peripheral arterial disease.
Stoekenbroek RM, et al. Eur Heart J. 2016;37:880-889.
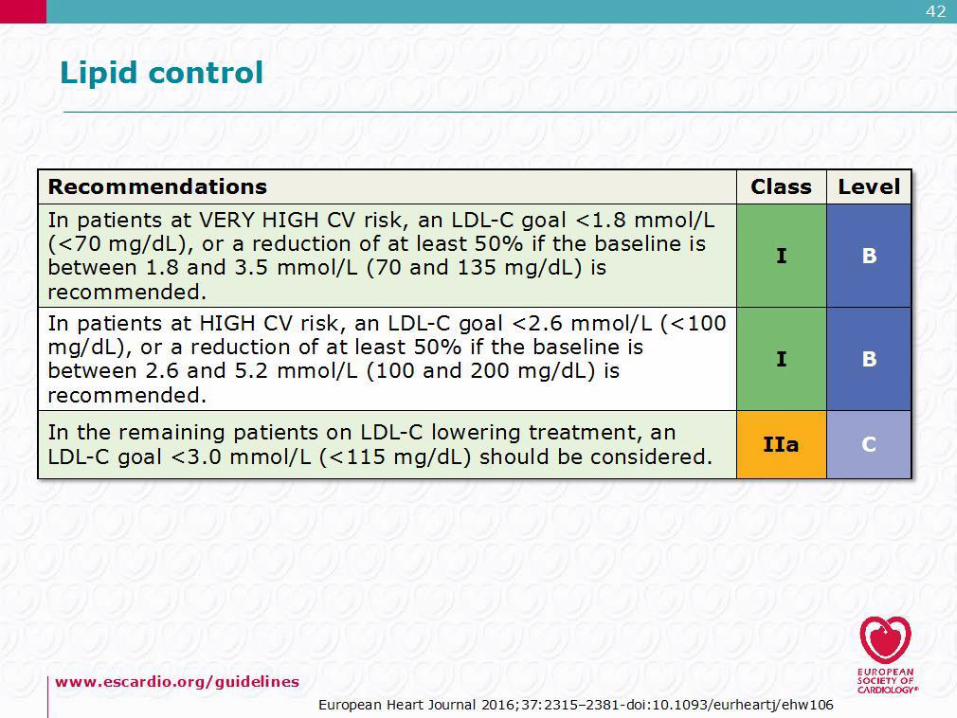
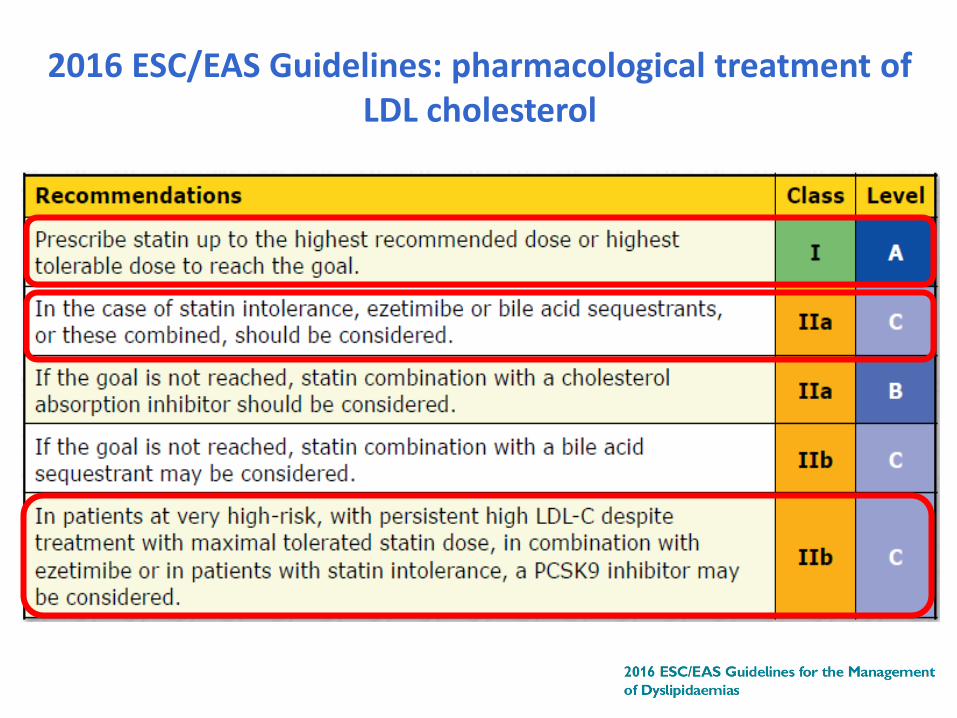
2016 ESC/EAS Guidelines: pharmacological treatment of LDL cholesterol
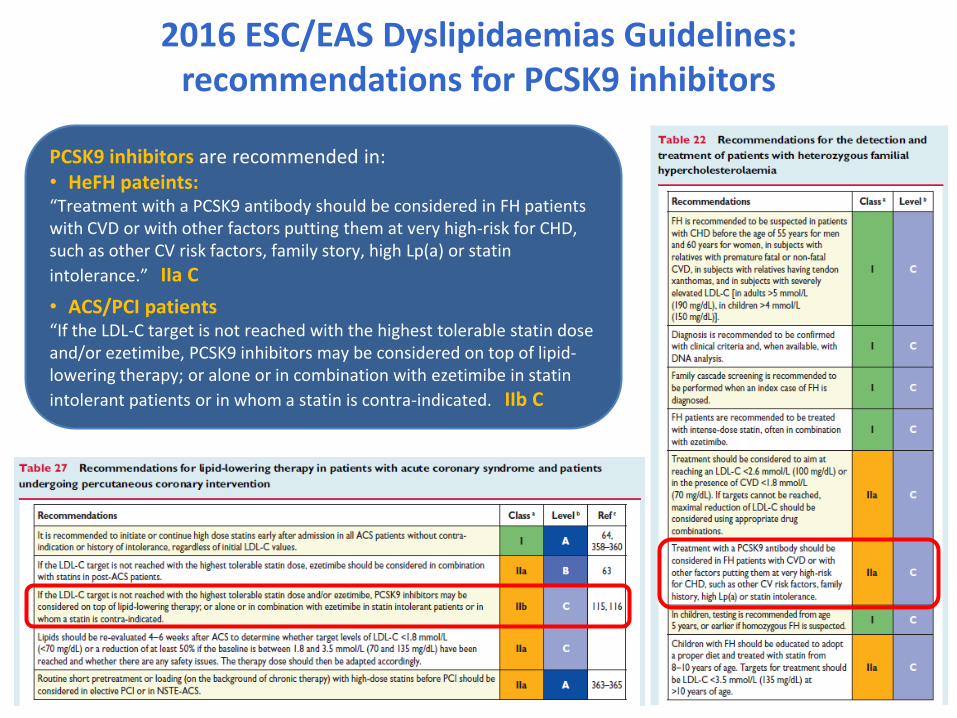
2016 ESC/EAS Dyslipidaemias Guidelines: recommendations for PCSK9 inhibitors
PCSK9 inhibitors are recommended in: • HeFH pateints: “Treatment with a PCSK9 antibody should be considered in FH patients with CVD or with other factors putting them at very high-risk for CHD, such as other CV risk factors, family story, high Lp(a) or statin
intolerance.” IIa C
• ACS/PCI patients “If the LDL-C target is not reached with the highest tolerable statin dose and/or ezetimibe, PCSK9 inhibitors may be considered on top of lipid-lowering therapy; or alone or in combination with ezetimibe in statin
intolerant patients or in whom a statin is contra-indicated. IIb C
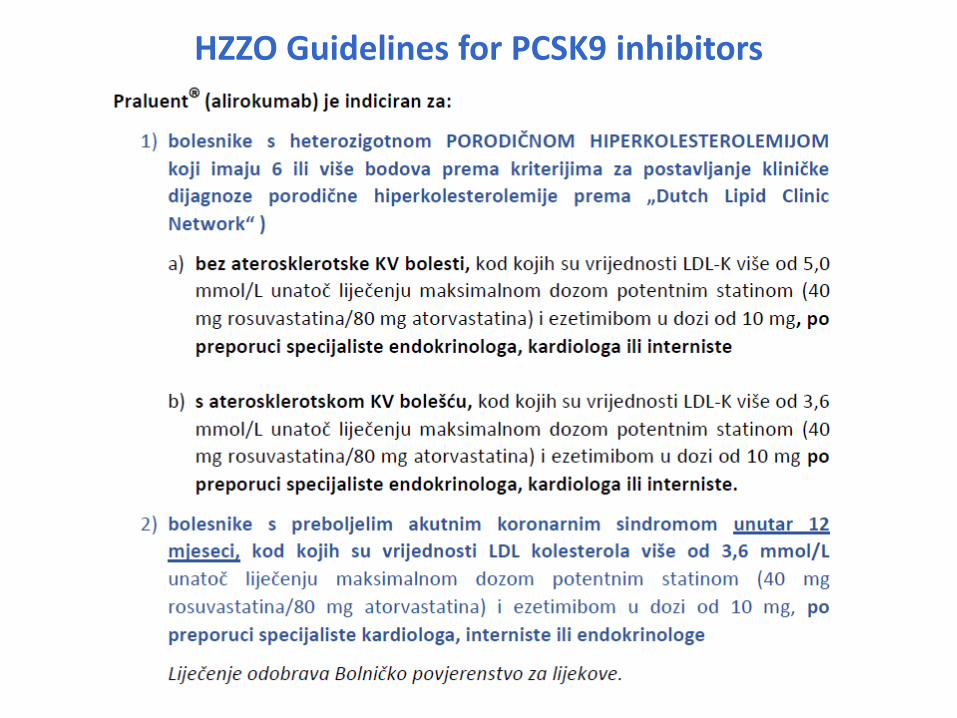
HZZO Guidelines for PCSK9 inhibitors
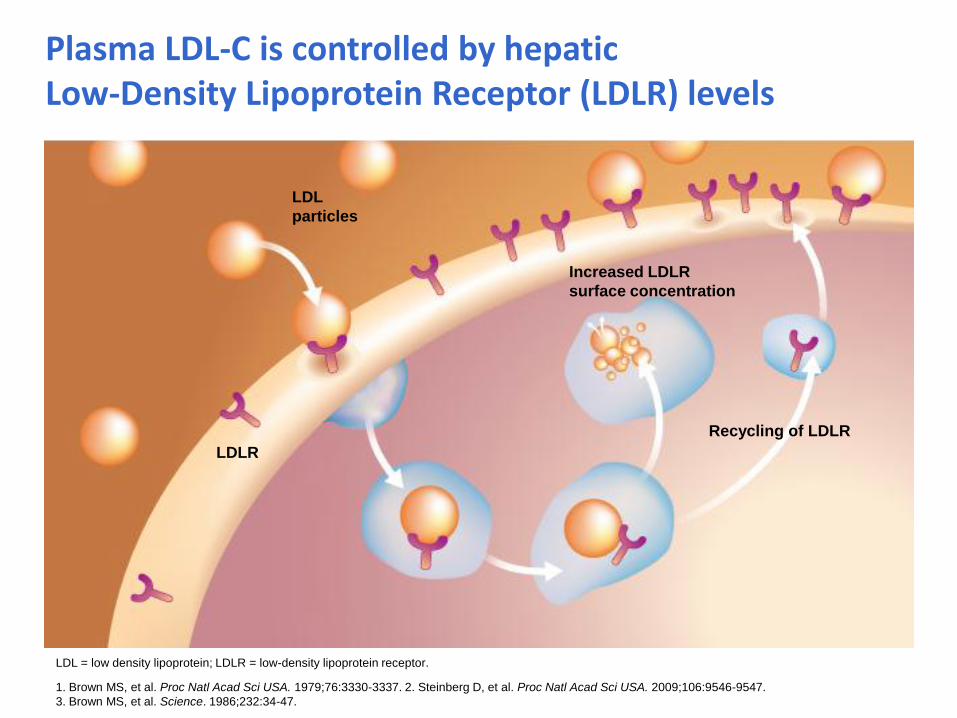
Plasma LDL-C is controlled by hepatic Low-Density Lipoprotein Receptor (LDLR) levels
1. Brown MS, et al. Proc Natl Acad Sci USA. 1979;76:3330-3337. 2. Steinberg D, et al. Proc Natl Acad Sci USA. 2009;106:9546-9547.
3. Brown MS, et al. Science. 1986;232:34-47.
LDL = low density lipoprotein; LDLR = low-density lipoprotein receptor.
Recycling of LDLR
Increased LDLR
surface concentration
LDL
particles
LDLR
LDLR
PCSK9
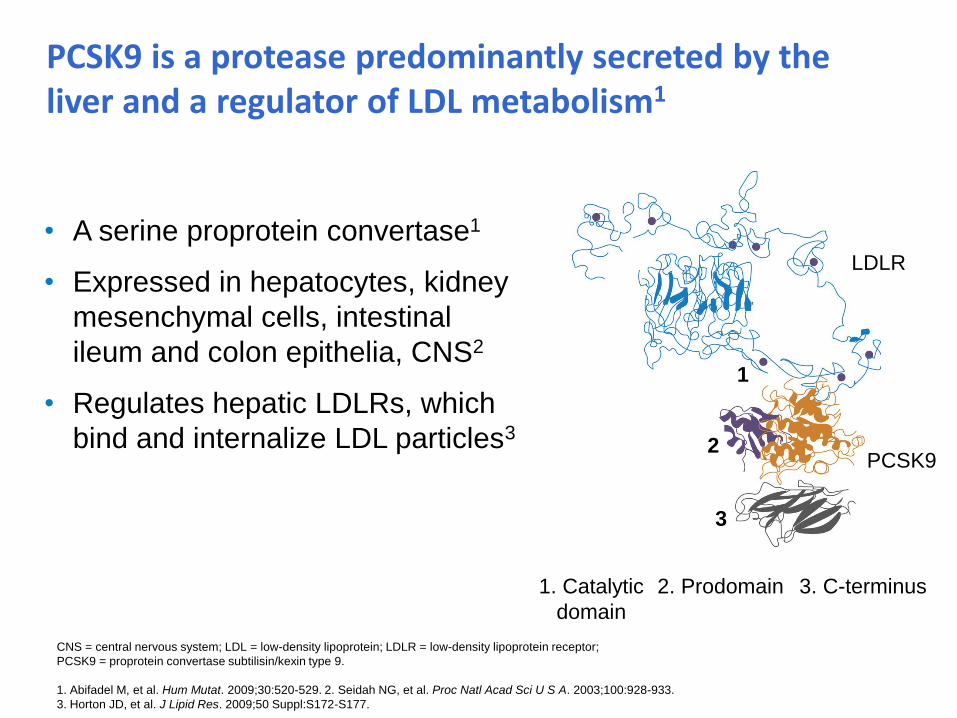
3. C-terminus 2. Prodomain 1. Catalytic
domain
PCSK9 is a protease predominantly secreted by the liver and a regulator of LDL metabolism1
• A serine proprotein convertase1
• Expressed in hepatocytes, kidney
mesenchymal cells, intestinal
ileum and colon epithelia, CNS2
• Regulates hepatic LDLRs, which
bind and internalize LDL particles3
1
2
3
CNS = central nervous system; LDL = low-density lipoprotein; LDLR = low-density lipoprotein receptor;
PCSK9 = proprotein convertase subtilisin/kexin type 9.
1. Abifadel M, et al. Hum Mutat. 2009;30:520-529. 2. Seidah NG, et al. Proc Natl Acad Sci U S A. 2003;100:928-933.
3. Horton JD, et al. J Lipid Res. 2009;50 Suppl:S172-S177.
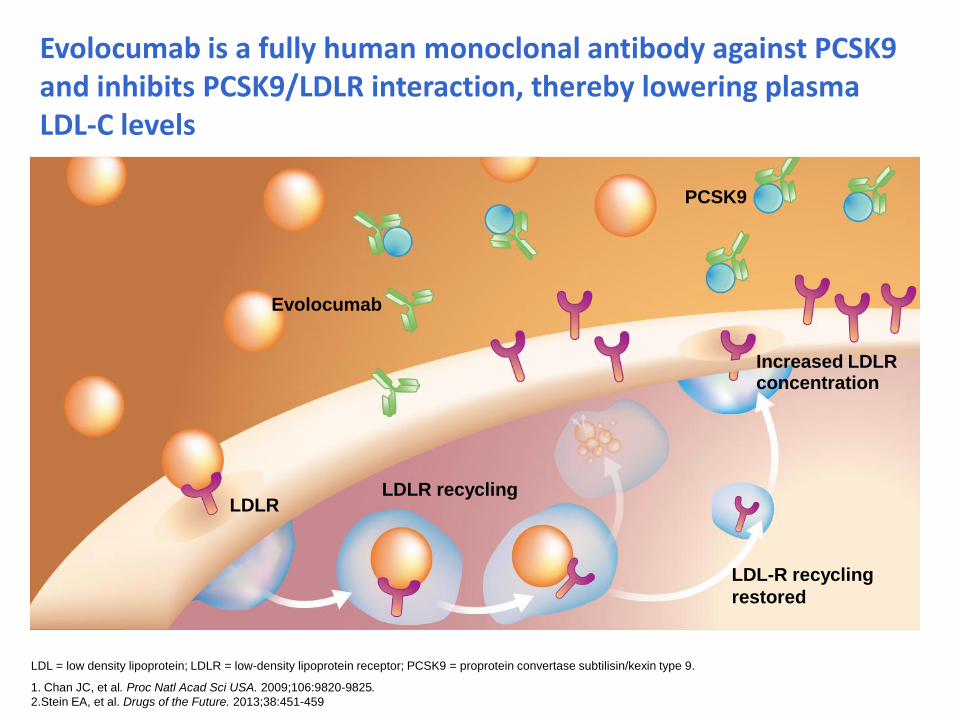
Evolocumab is a fully human monoclonal antibody against PCSK9 and inhibits PCSK9/LDLR interaction, thereby lowering plasma LDL-C levels
1. Chan JC, et al. Proc Natl Acad Sci USA. 2009;106:9820-9825.
2.Stein EA, et al. Drugs of the Future. 2013;38:451-459
Evolocumab
Increased LDLR concentration
LDLR recycling LDLR
PCSK9
LDL-R recycling
restored
LDL = low density lipoprotein; LDLR = low-density lipoprotein receptor; PCSK9 = proprotein convertase subtilisin/kexin type 9.
Evolocumab and clinical outcomes in patients with cardiovascular disease
Sabatine MS, et al. N Engl J Med. 2017;376:1713-1722.
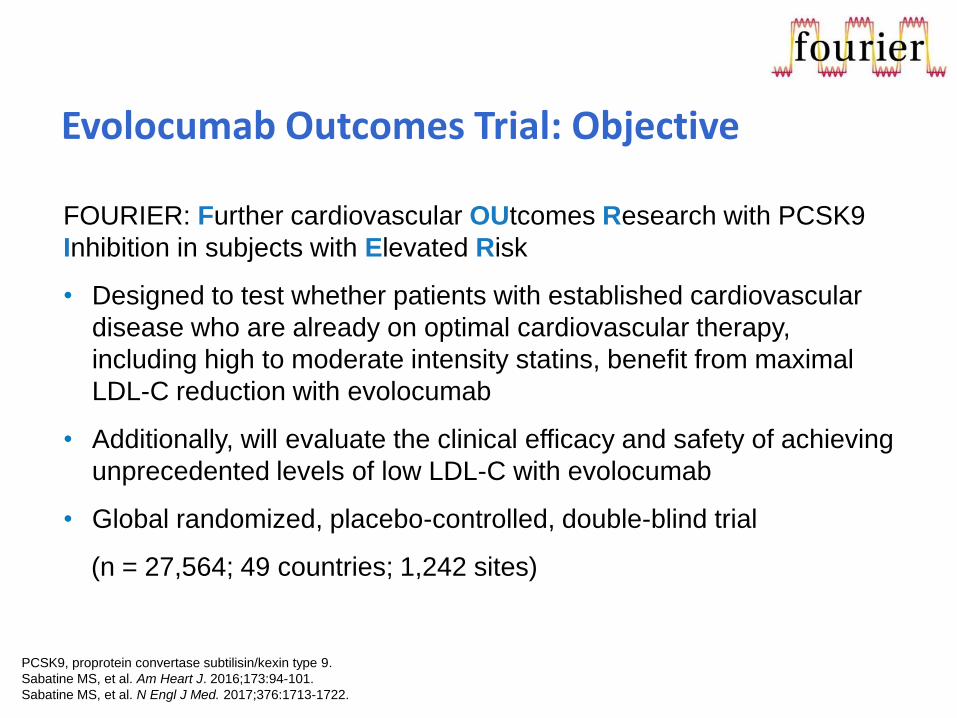
FOURIER: Further cardiovascular OUtcomes Research with PCSK9
Inhibition in subjects with Elevated Risk
• Designed to test whether patients with established cardiovascular
disease who are already on optimal cardiovascular therapy,
including high to moderate intensity statins, benefit from maximal
LDL-C reduction with evolocumab
• Additionally, will evaluate the clinical efficacy and safety of achieving
unprecedented levels of low LDL-C with evolocumab
• Global randomized, placebo-controlled, double-blind trial
(n = 27,564; 49 countries; 1,242 sites)
PCSK9, proprotein convertase subtilisin/kexin type 9.
Sabatine MS, et al. Am Heart J. 2016;173:94-101.
Sabatine MS, et al. N Engl J Med. 2017;376:1713-1722.
Evolocumab Outcomes Trial: Objective
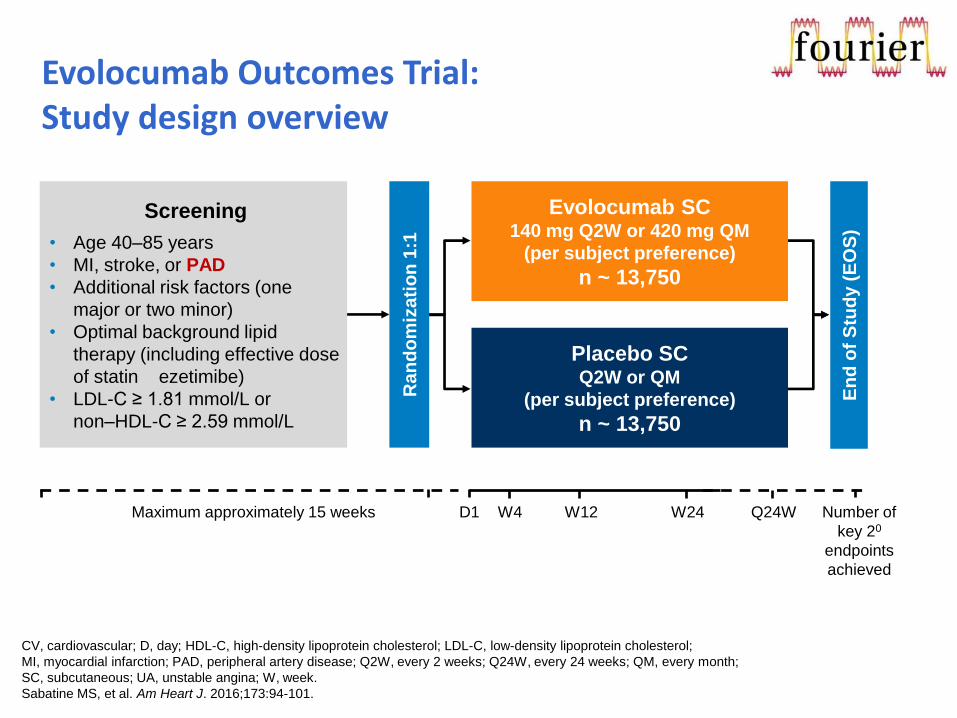
Evolocumab Outcomes Trial: Study design overview
Screening
• Age 40–85 years
• MI, stroke, or PAD
• Additional risk factors (one
major or two minor)
• Optimal background lipid
therapy (including effective dose
of statin ezetimibe)
• LDL-C ≥ 1.81 mmol/L or
non–HDL-C ≥ 2.59 mmol/L
Evolocumab SC 140 mg Q2W or 420 mg QM
(per subject preference)
n ~ 13,750
Placebo SC Q2W or QM
(per subject preference)
n ~ 13,750 R
an
do
miz
ati
on
1:1
En
d o
f S
tud
y (
EO
S)
Maximum approximately 15 weeks D1 W4 W12 W24 Q24W Number of
key 20
endpoints
achieved
CV, cardiovascular; D, day; HDL-C, high-density lipoprotein cholesterol; LDL-C, low-density lipoprotein cholesterol;
MI, myocardial infarction; PAD, peripheral artery disease; Q2W, every 2 weeks; Q24W, every 24 weeks; QM, every month;
SC, subcutaneous; UA, unstable angina; W, week.
Sabatine MS, et al. Am Heart J. 2016;173:94-101.
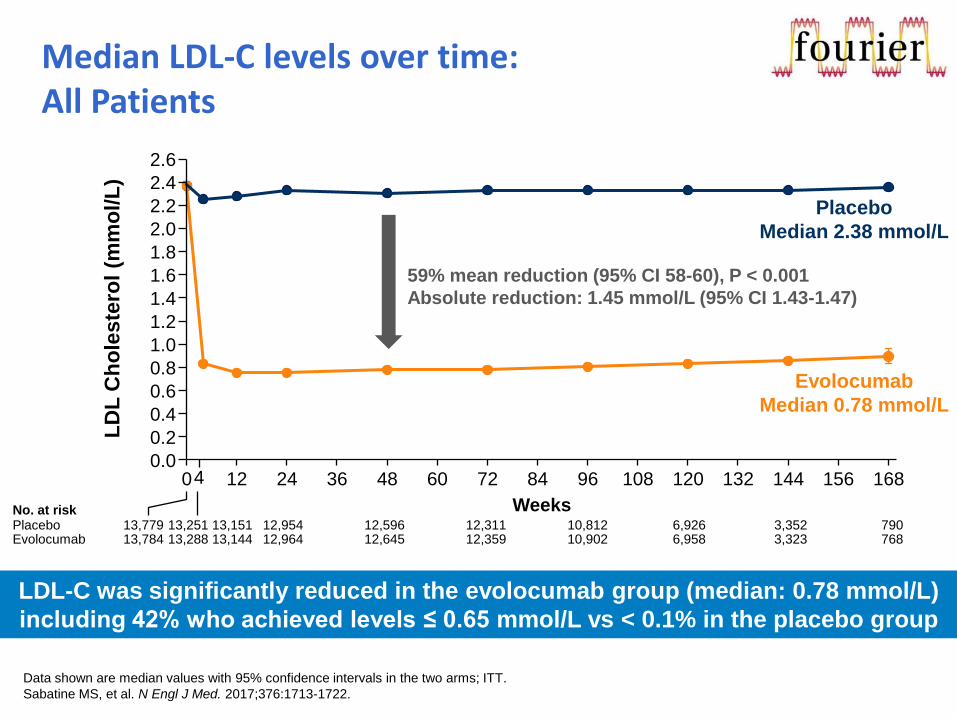
Median LDL-C levels over time: All Patients
LDL-C was significantly reduced in the evolocumab group (median: 0.78 mmol/L)
including 42% who achieved levels ≤ 0.65 mmol/L vs < 0.1% in the placebo group
Data shown are median values with 95% confidence intervals in the two arms; ITT.
Sabatine MS, et al. N Engl J Med. 2017;376:1713-1722.
13,251 13,151 12,954 12,596 12,311 10,812 6,926 3,352 790 13,779 Placebo 13,288 13,144 12,964 12,645 12,359 10,902 6,958 3,323 768 13,784 Evolocumab
No. at risk
4 0 12 24 36 48 60 72 84 96 108 120 132 144 156 168
LD
L C
ho
leste
rol
(mm
ol/L
)
Weeks
59% mean reduction (95% CI 58-60), P < 0.001
Absolute reduction: 1.45 mmol/L (95% CI 1.43-1.47)
2.4
2.2
2.0
1.8
1.6
1.4
1.2
1.0
0.8
0.6
0.4
0.2
0.0
2.6
Placebo
Median 2.38 mmol/L
Evolocumab
Median 0.78 mmol/L
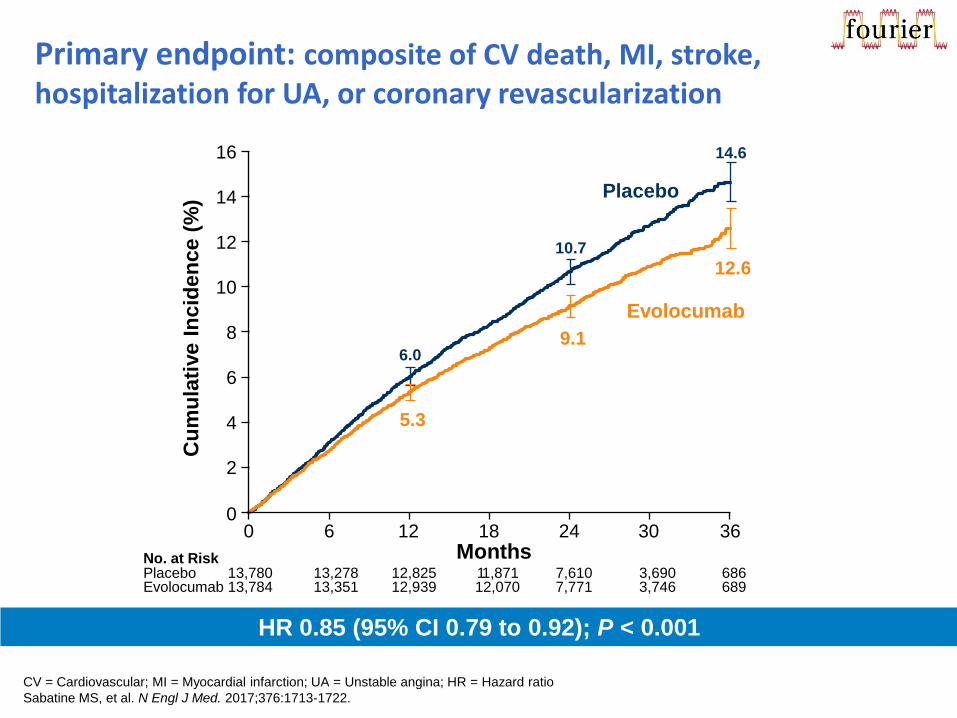
Primary endpoint: composite of CV death, MI, stroke, hospitalization for UA, or coronary revascularization
HR 0.85 (95% CI 0.79 to 0.92); P < 0.001
CV = Cardiovascular; MI = Myocardial infarction; UA = Unstable angina; HR = Hazard ratio
Sabatine MS, et al. N Engl J Med. 2017;376:1713-1722.
6.0
10.7
14.6
5.3
9.1
12.6
No. at Risk Placebo 13,780 13,278 12,825 1 1,871 7,610 3,690 686 Evolocumab 13,784 13,351 12,939 12,070 7,771 3,746 689
Cu
mu
lati
ve I
ncid
en
ce (
%) Placebo
Evolocumab
0
2
4
6
8
10
12
14
16
0 6 18 12 24 36 30 Months
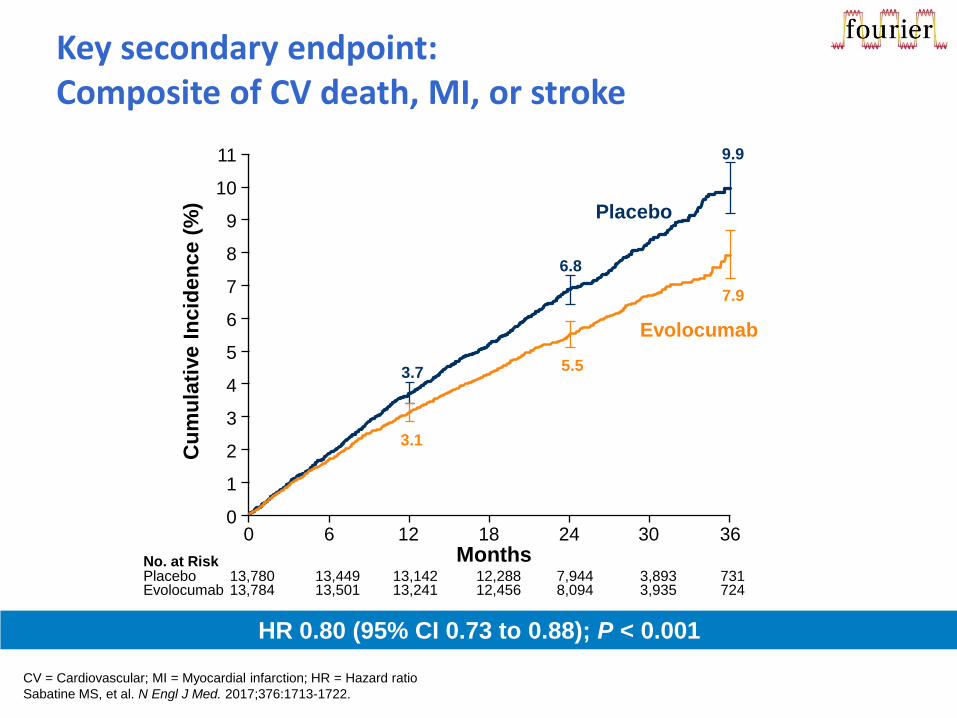
3.7
6.8
9.9
Key secondary endpoint: Composite of CV death, MI, or stroke
HR 0.80 (95% CI 0.73 to 0.88); P < 0.001
No. at Risk Placebo Evolocumab
Cu
mu
lati
ve I
ncid
en
ce (
%) Placebo
Evolocumab
Months
0
2
4
6
8
9
10
11
0 6 18 12 24 36 30
1
3
5
7
13,780 13,449 13,142 12,288 7,944 3,893 731 13,784 13,501 13,241 12,456 8,094 3,935 724
3.1
5.5
7.9
CV = Cardiovascular; MI = Myocardial infarction; HR = Hazard ratio
Sabatine MS, et al. N Engl J Med. 2017;376:1713-1722.
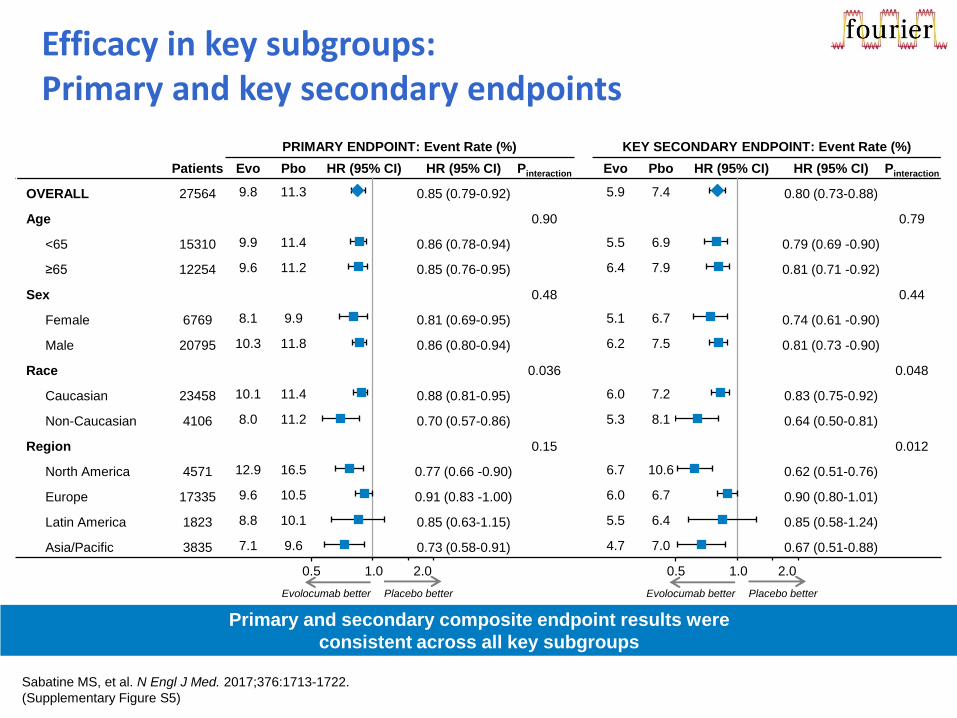
PRIMARY ENDPOINT: Event Rate (%) KEY SECONDARY ENDPOINT: Event Rate (%)
Patients Evo Pbo HR (95% CI) HR (95% CI) Pinteraction Evo Pbo HR (95% CI) HR (95% CI) Pinteraction
OVERALL 27564 9.8 11.3 0.85 (0.79-0.92) 5.9 7.4 0.80 (0.73-0.88)
Age 0.90 0.79
<65 15310 9.9 11.4 0.86 (0.78-0.94) 5.5 6.9 0.79 (0.69 -0.90)
≥65 12254 9.6 11.2 0.85 (0.76-0.95) 6.4 7.9 0.81 (0.71 -0.92)
Sex 0.48 0.44
Female 6769 8.1 9.9 0.81 (0.69-0.95) 5.1 6.7 0.74 (0.61 -0.90)
Male 20795 10.3 11.8 0.86 (0.80-0.94) 6.2 7.5 0.81 (0.73 -0.90)
Race 0.036 0.048
Caucasian 23458 10.1 11.4 0.88 (0.81-0.95) 6.0 7.2 0.83 (0.75-0.92)
Non-Caucasian 4106 8.0 11.2 0.70 (0.57-0.86) 5.3 8.1 0.64 (0.50-0.81)
Region 0.15 0.012
North America 4571 12.9 16.5 0.77 (0.66 -0.90) 6.7 10.6 0.62 (0.51-0.76)
Europe 17335 9.6 10.5 0.91 (0.83 -1.00) 6.0 6.7 0.90 (0.80-1.01)
Latin America 1823 8.8 10.1 0.85 (0.63-1.15) 5.5 6.4 0.85 (0.58-1.24)
Asia/Pacific 3835 7.1 9.6 0.73 (0.58-0.91) 4.7 7.0 0.67 (0.51-0.88)
Efficacy in key subgroups: Primary and key secondary endpoints
Sabatine MS, et al. N Engl J Med. 2017;376:1713-1722.
(Supplementary Figure S5)
Primary and secondary composite endpoint results were
consistent across all key subgroups
0.5 1.0 2.0
Evolocumab better Placebo better
0.5 1.0 2.0
Evolocumab better Placebo better
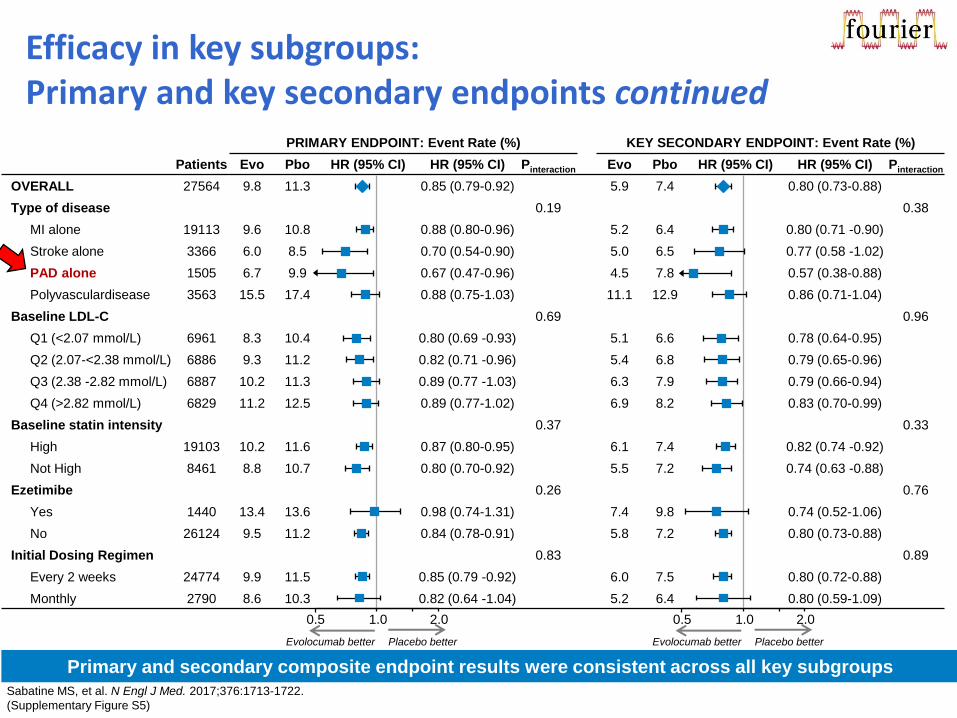
PRIMARY ENDPOINT: Event Rate (%) KEY SECONDARY ENDPOINT: Event Rate (%)
Patients Evo Pbo HR (95% CI) HR (95% CI) Pinteraction Evo Pbo HR (95% CI) HR (95% CI) Pinteraction
OVERALL 27564 9.8 11.3 0.85 (0.79-0.92) 5.9 7.4 0.80 (0.73-0.88)
Type of disease 0.19 0.38
MI alone 19113 9.6 10.8 0.88 (0.80-0.96) 5.2 6.4 0.80 (0.71 -0.90)
Stroke alone 3366 6.0 8.5 0.70 (0.54-0.90) 5.0 6.5 0.77 (0.58 -1.02)
PAD alone 1505 6.7 9.9 0.67 (0.47-0.96) 4.5 7.8 0.57 (0.38-0.88)
Polyvasculardisease 3563 15.5 17.4 0.88 (0.75-1.03) 11.1 12.9 0.86 (0.71-1.04)
Baseline LDL-C 0.69 0.96
Q1 (<2.07 mmol/L) 6961 8.3 10.4 0.80 (0.69 -0.93) 5.1 6.6 0.78 (0.64-0.95)
Q2 (2.07-<2.38 mmol/L) 6886 9.3 11.2 0.82 (0.71 -0.96) 5.4 6.8 0.79 (0.65-0.96)
Q3 (2.38 -2.82 mmol/L) 6887 10.2 11.3 0.89 (0.77 -1.03) 6.3 7.9 0.79 (0.66-0.94)
Q4 (>2.82 mmol/L) 6829 11.2 12.5 0.89 (0.77-1.02) 6.9 8.2 0.83 (0.70-0.99)
Baseline statin intensity 0.37 0.33
High 19103 10.2 11.6 0.87 (0.80-0.95) 6.1 7.4 0.82 (0.74 -0.92)
Not High 8461 8.8 10.7 0.80 (0.70-0.92) 5.5 7.2 0.74 (0.63 -0.88)
Ezetimibe 0.26 0.76
Yes 1440 13.4 13.6 0.98 (0.74-1.31) 7.4 9.8 0.74 (0.52-1.06)
No 26124 9.5 11.2 0.84 (0.78-0.91) 5.8 7.2 0.80 (0.73-0.88)
Initial Dosing Regimen 0.83 0.89
Every 2 weeks 24774 9.9 11.5 0.85 (0.79 -0.92) 6.0 7.5 0.80 (0.72-0.88)
Monthly 2790 8.6 10.3 0.82 (0.64 -1.04) 5.2 6.4 0.80 (0.59-1.09)
Efficacy in key subgroups: Primary and key secondary endpoints continued
Sabatine MS, et al. N Engl J Med. 2017;376:1713-1722.
(Supplementary Figure S5)
0.5 1.0 2.0
Evolocumab better Placebo better
0.5 1.0 2.0
Evolocumab better Placebo better
Primary and secondary composite endpoint results were consistent across all key subgroups
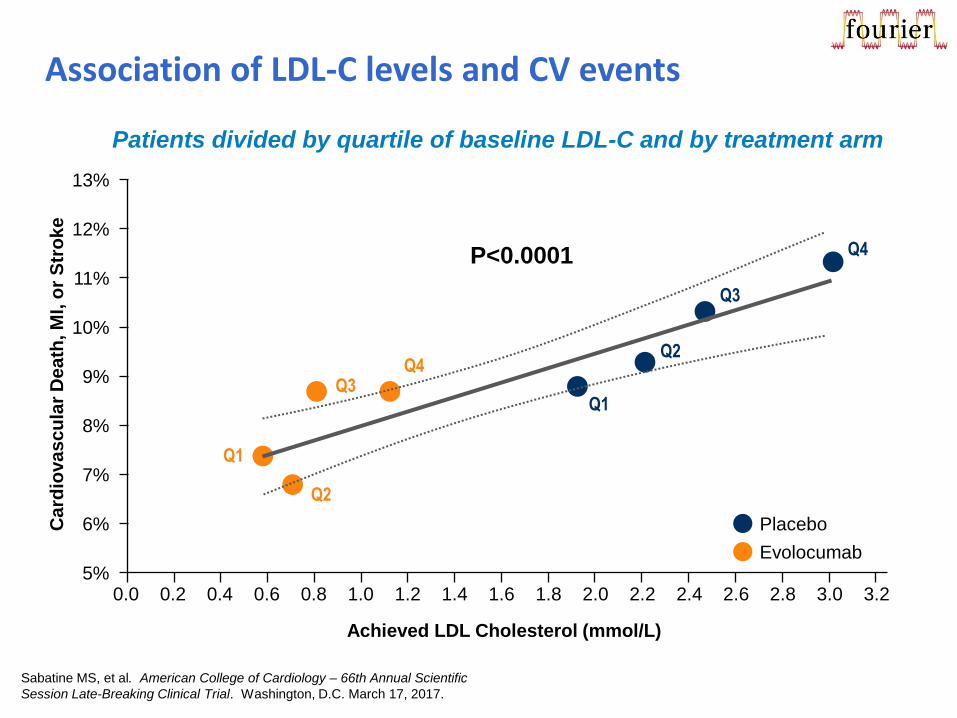
Association of LDL-C levels and CV events
P<0.0001 Q4
Q3
Q2
Q1
Q4 Q3
Q2
Q1
Placebo
Evolocumab
13%
12%
11%
10%
9%
8%
7%
6%
5%
Achieved LDL Cholesterol (mmol/L)
Card
iovascu
lar
Death
, M
I, o
r S
tro
ke
Patients divided by quartile of baseline LDL-C and by treatment arm
Sabatine MS, et al. American College of Cardiology – 66th Annual Scientific
Session Late-Breaking Clinical Trial. Washington, D.C. March 17, 2017.
2.4 2.2 2.0 1.8 1.6 1.4 1.2 1.0 0.8 0.6 0.4 0.2 0.0 2.6 3.2 3.0 2.8
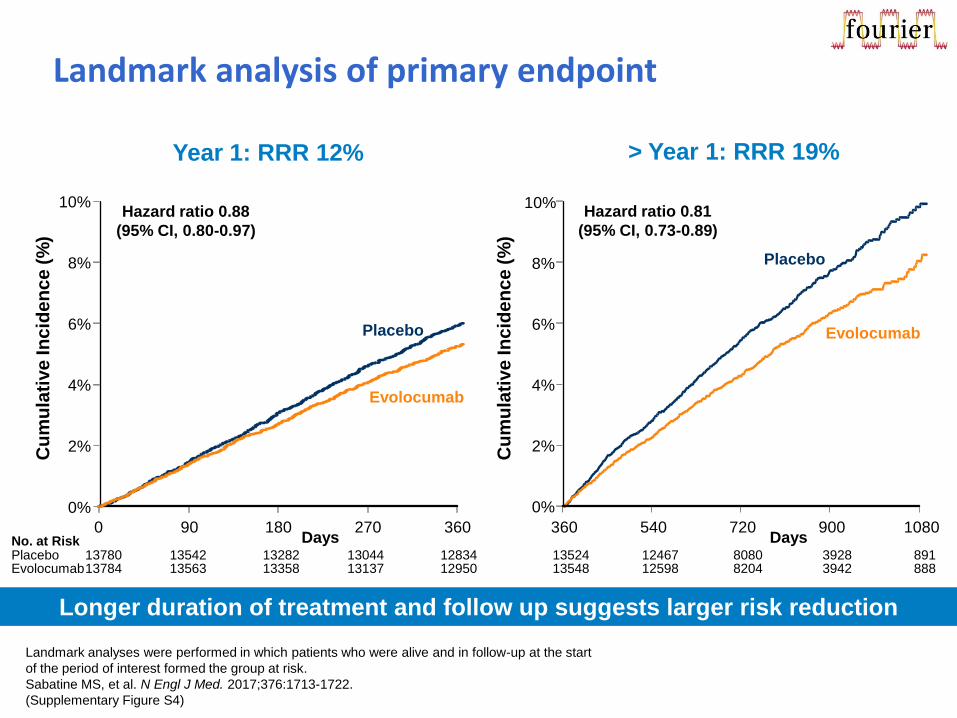
Landmark analysis of primary endpoint
Year 1: RRR 12% > Year 1: RRR 19%
Longer duration of treatment and follow up suggests larger risk reduction
Evolocumab
Cu
mu
lati
ve
In
cid
en
ce
(%
)
0%
2%
4%
6%
8%
10%
0 90 180 270 360 Days No. at Risk
Placebo 13780 13542 13282 13044 12834 Evolocumab 13784 13563 13358 13137 12950
Placebo
Hazard ratio 0.88
(95% CI, 0.80-0.97)
13524 12467 8080 3928 891 13548 12598 8204 3942 888
0%
2%
4%
6%
8%
10%
360 540 720 900 1080
Cu
mu
lati
ve
In
cid
en
ce
(%
)
Days
Placebo
Evolocumab
Hazard ratio 0.81
(95% CI, 0.73-0.89)
Landmark analyses were performed in which patients who were alive and in follow-up at the start
of the period of interest formed the group at risk.
Sabatine MS, et al. N Engl J Med. 2017;376:1713-1722.
(Supplementary Figure S4)
13780 13617 13453 13291 13148 13784 13636 13505 13357 13248
13524 12609 8250 4056 925 13548 12721 8359 4051 911
0%
2%
4%
6%
8%
360 540 720 900 1080
Cu
mu
lati
ve
In
cid
en
ce
(%
)
Days
Placebo
Evolocumab
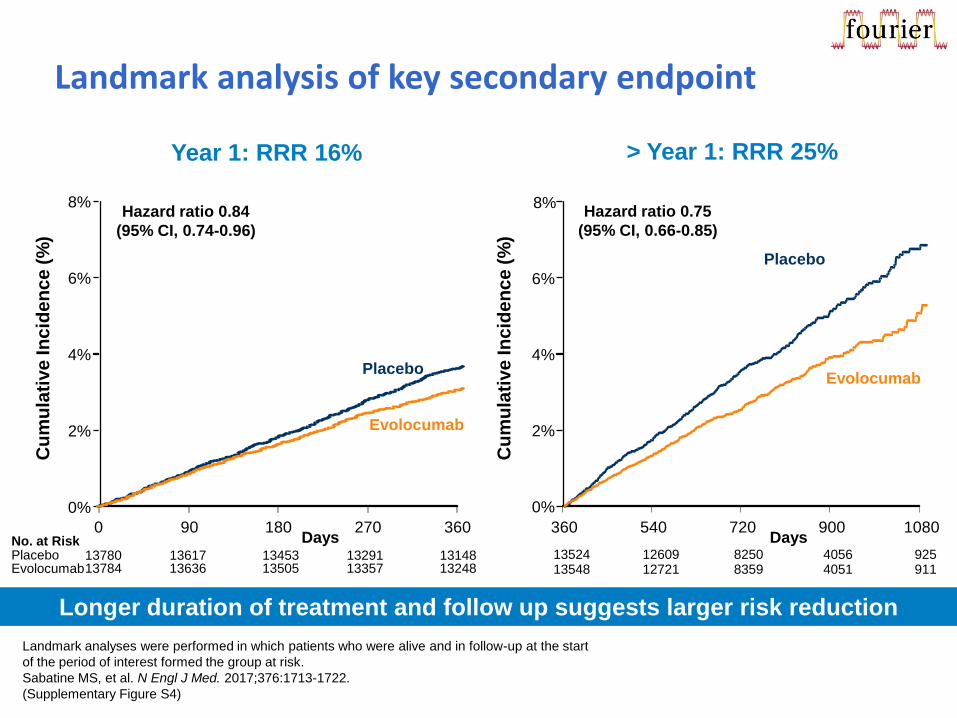
Hazard ratio 0.75
(95% CI, 0.66-0.85)
Landmark analysis of key secondary endpoint
> Year 1: RRR 25%
Evolocumab
Cu
mu
lati
ve
In
cid
en
ce
(%
)
0%
2%
4%
6%
8%
0 90 180 270 360 Days No. at Risk
Placebo Evolocumab
Placebo
Hazard ratio 0.84
(95% CI, 0.74-0.96)
Longer duration of treatment and follow up suggests larger risk reduction
Year 1: RRR 16%
Landmark analyses were performed in which patients who were alive and in follow-up at the start
of the period of interest formed the group at risk.
Sabatine MS, et al. N Engl J Med. 2017;376:1713-1722.
(Supplementary Figure S4)
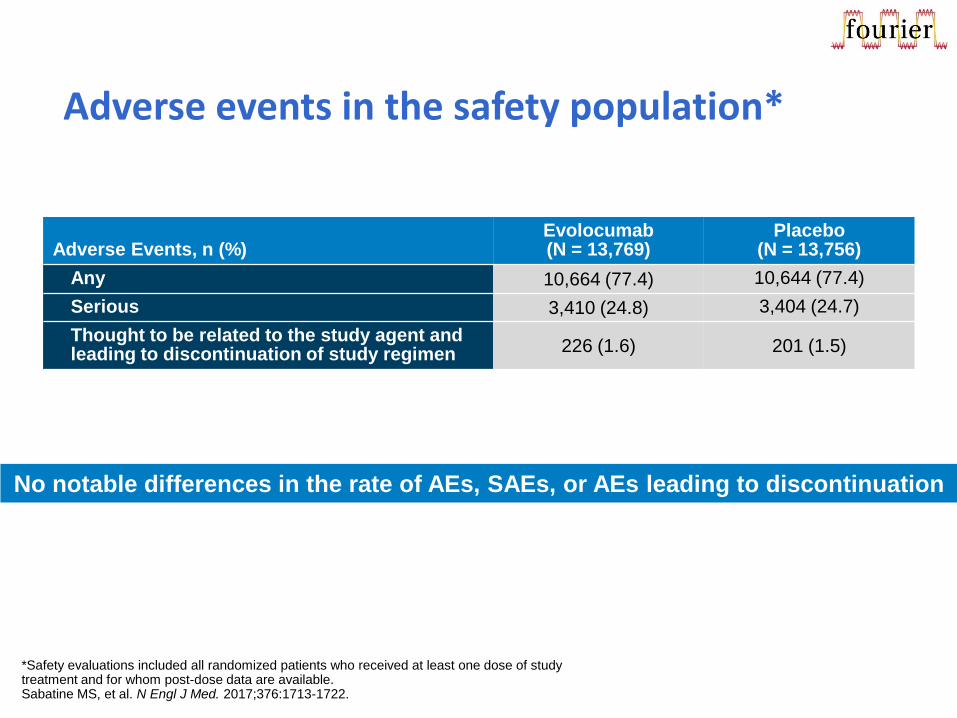
Adverse events in the safety population*
Adverse Events, n (%) Evolocumab (N = 13,769)
Placebo (N = 13,756)
Any 10,664 (77.4) 10,644 (77.4)
Serious 3,410 (24.8) 3,404 (24.7)
Thought to be related to the study agent and leading to discontinuation of study regimen 226 (1.6) 201 (1.5)
No notable differences in the rate of AEs, SAEs, or AEs leading to discontinuation
*Safety evaluations included all randomized patients who received at least one dose of study treatment and for whom post-dose data are available. Sabatine MS, et al. N Engl J Med. 2017;376:1713-1722.
PAD sub-analysis
Bonaca MP, et al. Circulation. 2017. November 13. doi:10.1161/CIRCULATIONAHA.117.032235.
[Epub ahead of print].
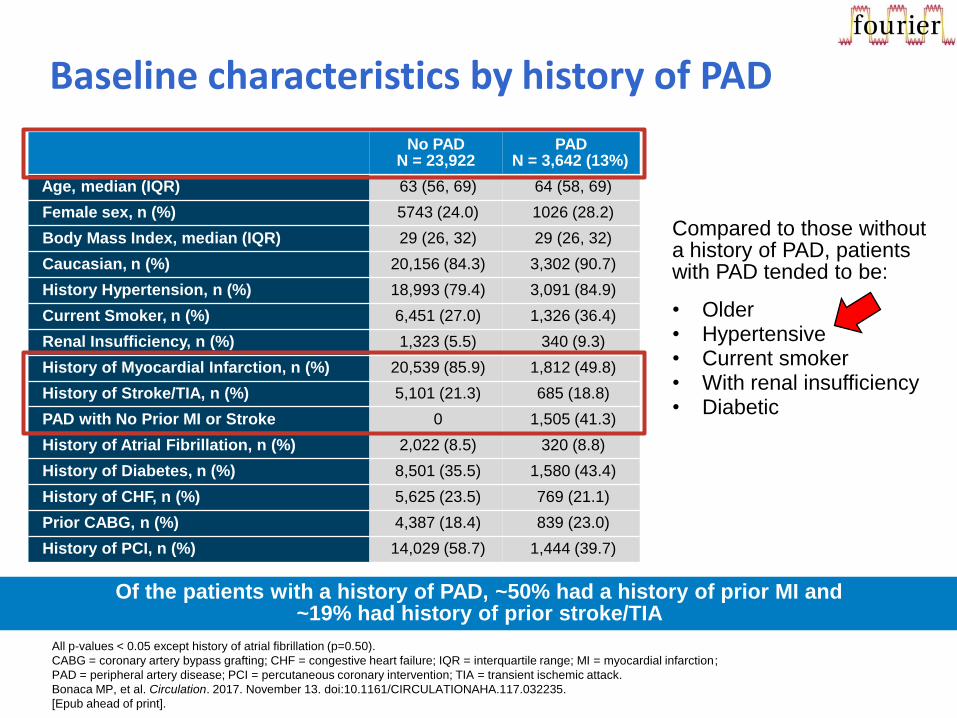
Baseline characteristics by history of PAD
All p-values < 0.05 except history of atrial fibrillation (p=0.50).
CABG = coronary artery bypass grafting; CHF = congestive heart failure; IQR = interquartile range; MI = myocardial infarction;
PAD = peripheral artery disease; PCI = percutaneous coronary intervention; TIA = transient ischemic attack.
Bonaca MP, et al. Circulation. 2017. November 13. doi:10.1161/CIRCULATIONAHA.117.032235.
[Epub ahead of print].
Of the patients with a history of PAD, ~50% had a history of prior MI and ~19% had history of prior stroke/TIA
No PAD N = 23,922
PAD N = 3,642 (13%)
Age, median (IQR) 63 (56, 69) 64 (58, 69)
Female sex, n (%) 5743 (24.0) 1026 (28.2)
Body Mass Index, median (IQR) 29 (26, 32) 29 (26, 32)
Caucasian, n (%) 20,156 (84.3) 3,302 (90.7)
History Hypertension, n (%) 18,993 (79.4) 3,091 (84.9)
Current Smoker, n (%) 6,451 (27.0) 1,326 (36.4)
Renal Insufficiency, n (%) 1,323 (5.5) 340 (9.3)
History of Myocardial Infarction, n (%) 20,539 (85.9) 1,812 (49.8)
History of Stroke/TIA, n (%) 5,101 (21.3) 685 (18.8)
PAD with No Prior MI or Stroke 0 1,505 (41.3)
History of Atrial Fibrillation, n (%) 2,022 (8.5) 320 (8.8)
History of Diabetes, n (%) 8,501 (35.5) 1,580 (43.4)
History of CHF, n (%) 5,625 (23.5) 769 (21.1)
Prior CABG, n (%) 4,387 (18.4) 839 (23.0)
History of PCI, n (%) 14,029 (58.7) 1,444 (39.7)
Compared to those without a history of PAD, patients with PAD tended to be:
• Older • Hypertensive • Current smoker • With renal insufficiency • Diabetic
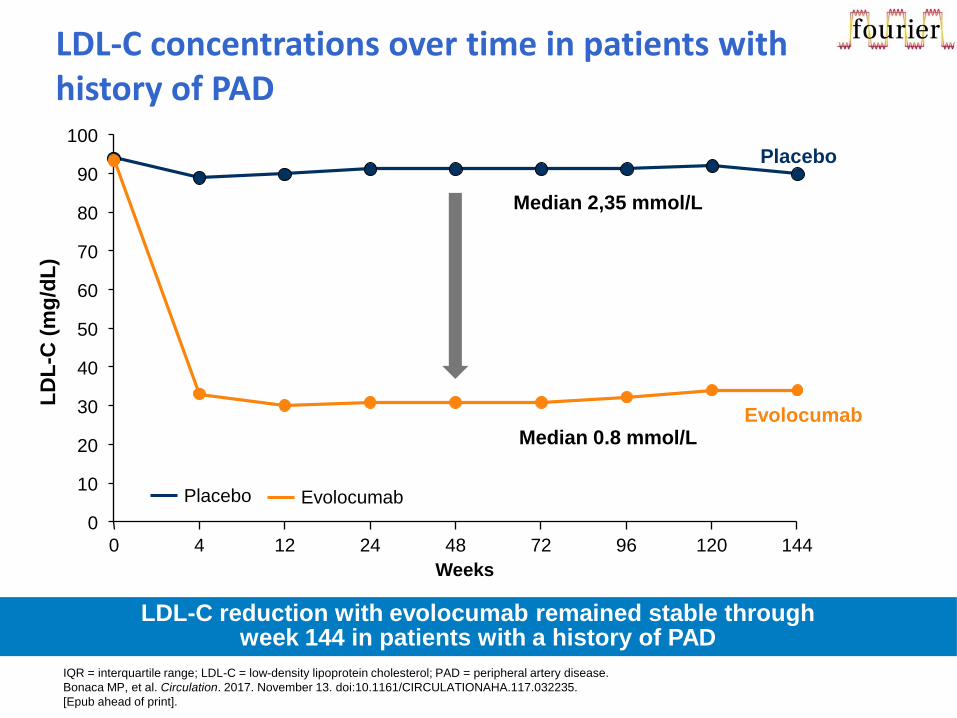
LD
L-C
(m
g/d
L)
Evolocumab
0
10
20
30
40
50
60
70
80
90
100
0 4 12 24 48 72 96 144
Weeks
Placebo
Median 0.8 mmol/L
Median 2,35 mmol/L
120
Evolocumab Placebo
LDL-C reduction with evolocumab remained stable through week 144 in patients with a history of PAD
IQR = interquartile range; LDL-C = low-density lipoprotein cholesterol; PAD = peripheral artery disease.
Bonaca MP, et al. Circulation. 2017. November 13. doi:10.1161/CIRCULATIONAHA.117.032235.
[Epub ahead of print].
LDL-C concentrations over time in patients with history of PAD
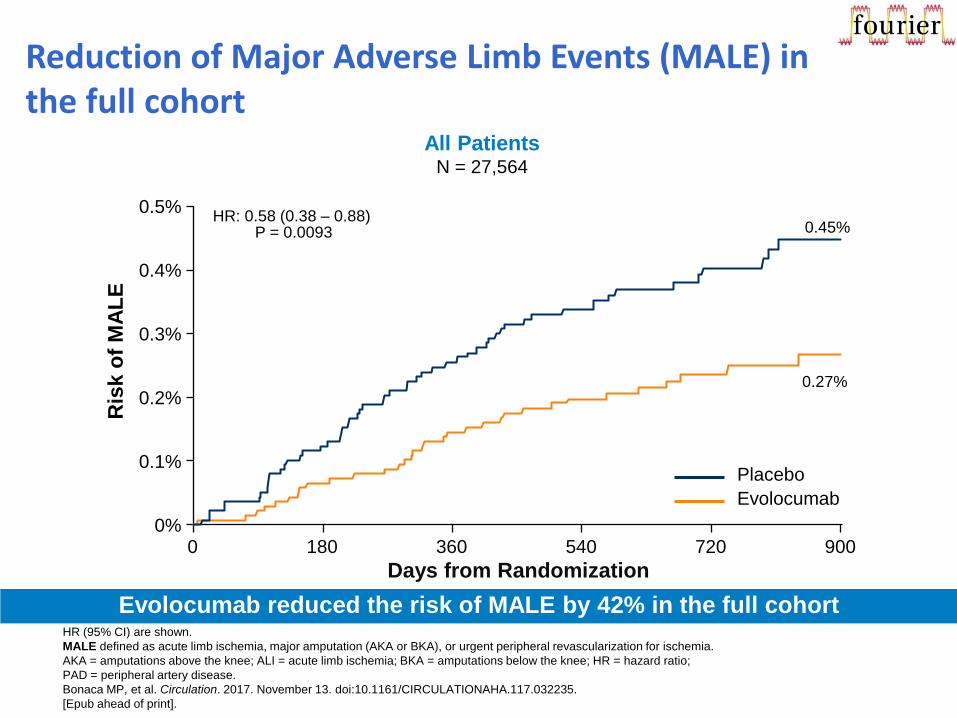
Reduction of Major Adverse Limb Events (MALE) in the full cohort
Evolocumab reduced the risk of MALE by 42% in the full cohort HR (95% CI) are shown.
MALE defined as acute limb ischemia, major amputation (AKA or BKA), or urgent peripheral revascularization for ischemia.
AKA = amputations above the knee; ALI = acute limb ischemia; BKA = amputations below the knee; HR = hazard ratio;
PAD = peripheral artery disease.
Bonaca MP, et al. Circulation. 2017. November 13. doi:10.1161/CIRCULATIONAHA.117.032235.
[Epub ahead of print].
All Patients N = 27,564
Days from Randomization
0.45%
0.27%
HR: 0.58 (0.38 – 0.88) P = 0.0093
0%
0.1%
0.2%
0.3%
0.4%
0.5%
0 180 360 540 720 900
Ris
k o
f M
AL
E
Evolocumab
Placebo
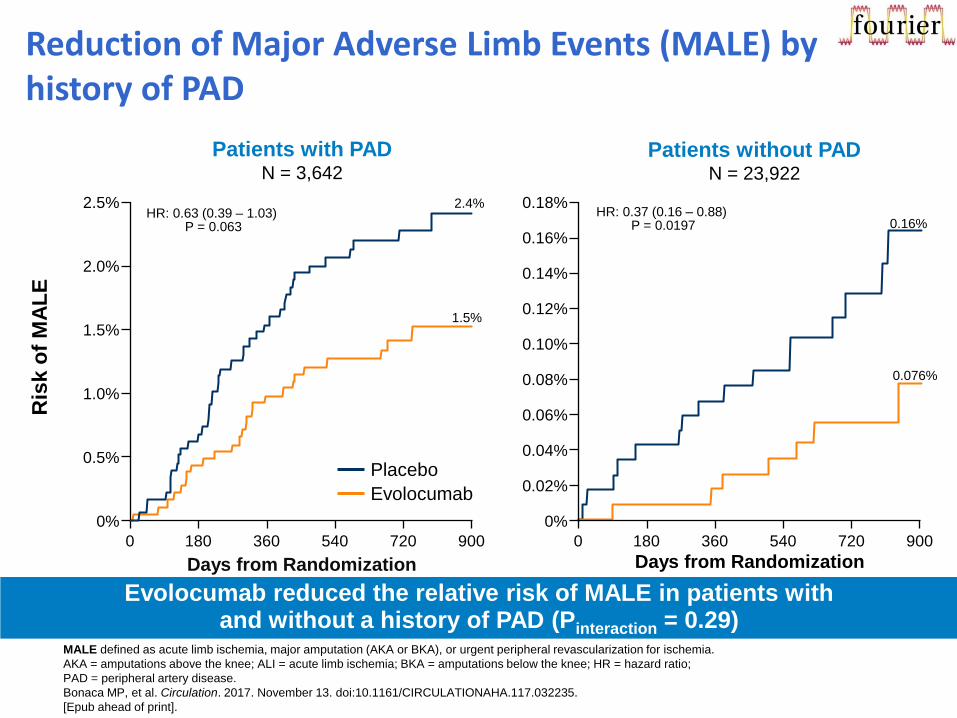
Reduction of Major Adverse Limb Events (MALE) by history of PAD
Evolocumab reduced the relative risk of MALE in patients with and without a history of PAD (Pinteraction = 0.29)
MALE defined as acute limb ischemia, major amputation (AKA or BKA), or urgent peripheral revascularization for ischemia.
AKA = amputations above the knee; ALI = acute limb ischemia; BKA = amputations below the knee; HR = hazard ratio;
PAD = peripheral artery disease.
Bonaca MP, et al. Circulation. 2017. November 13. doi:10.1161/CIRCULATIONAHA.117.032235.
[Epub ahead of print].
Ris
k o
f M
AL
E
Evolocumab
Placebo
0%
0.02%
0.06%
0.10%
0.14%
0.18%
0 180 360 540 720 900
Patients without PAD N = 23,922
Days from Randomization
0.16%
0.076%
HR: 0.37 (0.16 – 0.88) P = 0.0197
0.04%
0.08%
0.12%
0.16%
0%
0.5%
1.0%
1.5%
2.0%
2.5%
0 180 360 540 720 900
Patients with PAD N = 3,642
2.4%
1.5%
HR: 0.63 (0.39 – 1.03) P = 0.063
Days from Randomization
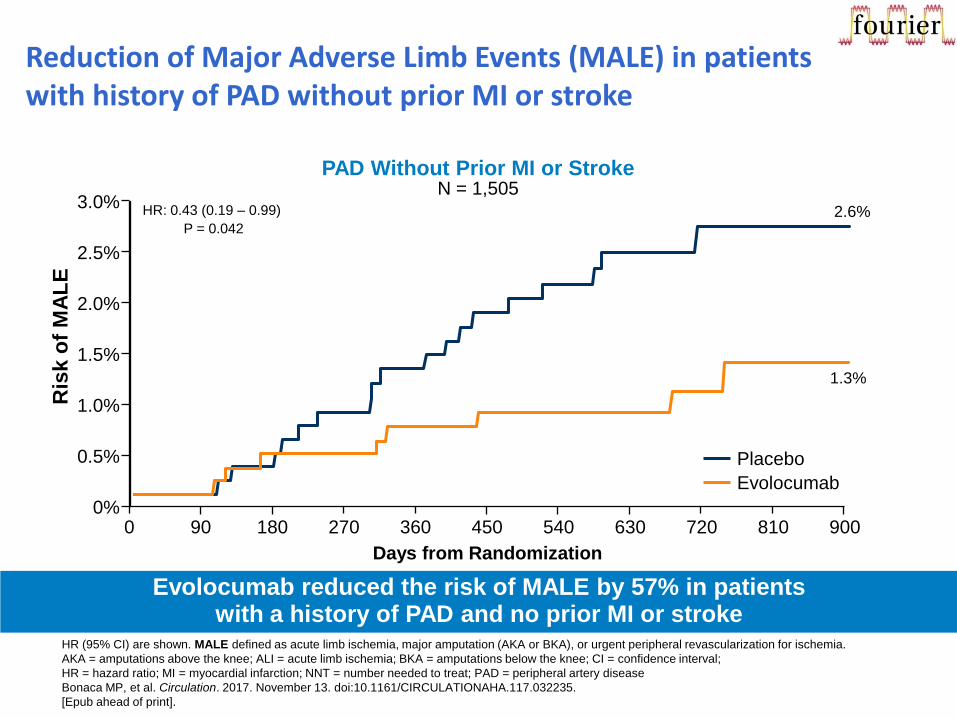
Reduction of Major Adverse Limb Events (MALE) in patients with history of PAD without prior MI or stroke
Evolocumab reduced the risk of MALE by 57% in patients with a history of PAD and no prior MI or stroke
Ris
k o
f M
AL
E
0%
0.5%
1.0%
2.0%
3.0%
0 90 180 270 900
PAD Without Prior MI or Stroke N = 1,505
1.5%
2.5%
360 540 720 450 630 810
2.6%
1.3%
Evolocumab
Placebo
HR (95% CI) are shown. MALE defined as acute limb ischemia, major amputation (AKA or BKA), or urgent peripheral revascularization for ischemia.
AKA = amputations above the knee; ALI = acute limb ischemia; BKA = amputations below the knee; CI = confidence interval;
HR = hazard ratio; MI = myocardial infarction; NNT = number needed to treat; PAD = peripheral artery disease
Bonaca MP, et al. Circulation. 2017. November 13. doi:10.1161/CIRCULATIONAHA.117.032235.
[Epub ahead of print].
Days from Randomization
HR: 0.43 (0.19 – 0.99)
P = 0.042
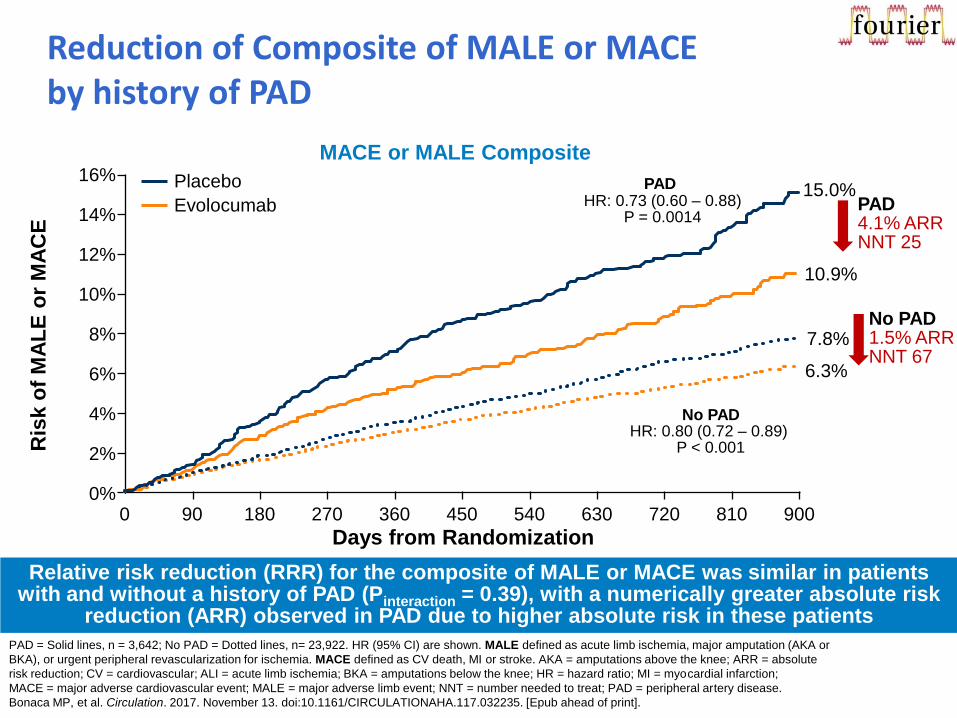
Reduction of Composite of MALE or MACE by history of PAD
MACE or MALE Composite
Days from Randomization
15.0%
10.9%
PAD HR: 0.73 (0.60 – 0.88)
P = 0.0014
No PAD HR: 0.80 (0.72 – 0.89)
P < 0.001
PAD 4.1% ARR NNT 25
No PAD 1.5% ARR NNT 67
0 90 180 270 360 450 540 630 720 810 900 0%
2%
4%
6%
8%
10%
12%
14%
16%
7.8%
6.3%
Evolocumab
Placebo
Ris
k o
f M
AL
E o
r M
AC
E
PAD = Solid lines, n = 3,642; No PAD = Dotted lines, n= 23,922. HR (95% CI) are shown. MALE defined as acute limb ischemia, major amputation (AKA or
BKA), or urgent peripheral revascularization for ischemia. MACE defined as CV death, MI or stroke. AKA = amputations above the knee; ARR = absolute
risk reduction; CV = cardiovascular; ALI = acute limb ischemia; BKA = amputations below the knee; HR = hazard ratio; MI = myocardial infarction;
MACE = major adverse cardiovascular event; MALE = major adverse limb event; NNT = number needed to treat; PAD = peripheral artery disease.
Bonaca MP, et al. Circulation. 2017. November 13. doi:10.1161/CIRCULATIONAHA.117.032235. [Epub ahead of print].
Relative risk reduction (RRR) for the composite of MALE or MACE was similar in patients with and without a history of PAD (Pinteraction = 0.39), with a numerically greater absolute risk
reduction (ARR) observed in PAD due to higher absolute risk in these patients
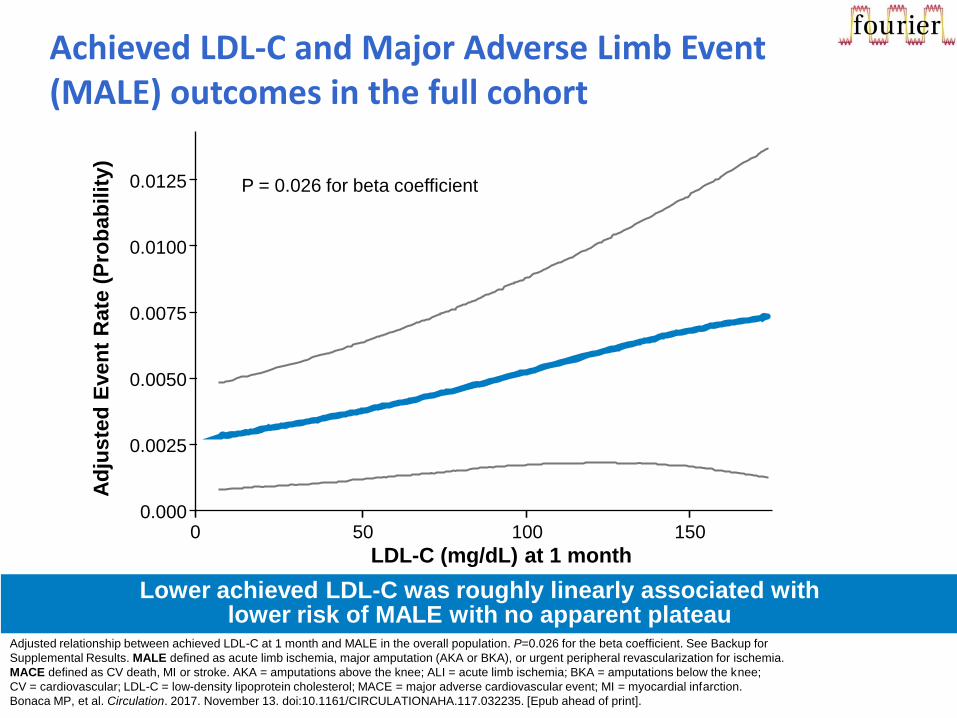
Adjusted relationship between achieved LDL-C at 1 month and MALE in the overall population. P=0.026 for the beta coefficient. See Backup for
Supplemental Results. MALE defined as acute limb ischemia, major amputation (AKA or BKA), or urgent peripheral revascularization for ischemia.
MACE defined as CV death, MI or stroke. AKA = amputations above the knee; ALI = acute limb ischemia; BKA = amputations below the knee;
CV = cardiovascular; LDL-C = low-density lipoprotein cholesterol; MACE = major adverse cardiovascular event; MI = myocardial infarction.
Bonaca MP, et al. Circulation. 2017. November 13. doi:10.1161/CIRCULATIONAHA.117.032235. [Epub ahead of print].
Achieved LDL-C and Major Adverse Limb Event (MALE) outcomes in the full cohort
Lower achieved LDL-C was roughly linearly associated with lower risk of MALE with no apparent plateau
0 50 100 150
LDL-C (mg/dL) at 1 month
0.000
0.0050
0.0075
0.0100
0.0125 P = 0.026 for beta coefficient
0.0025
Ad
jus
ted
Even
t R
ate
(P
rob
ab
ilit
y)
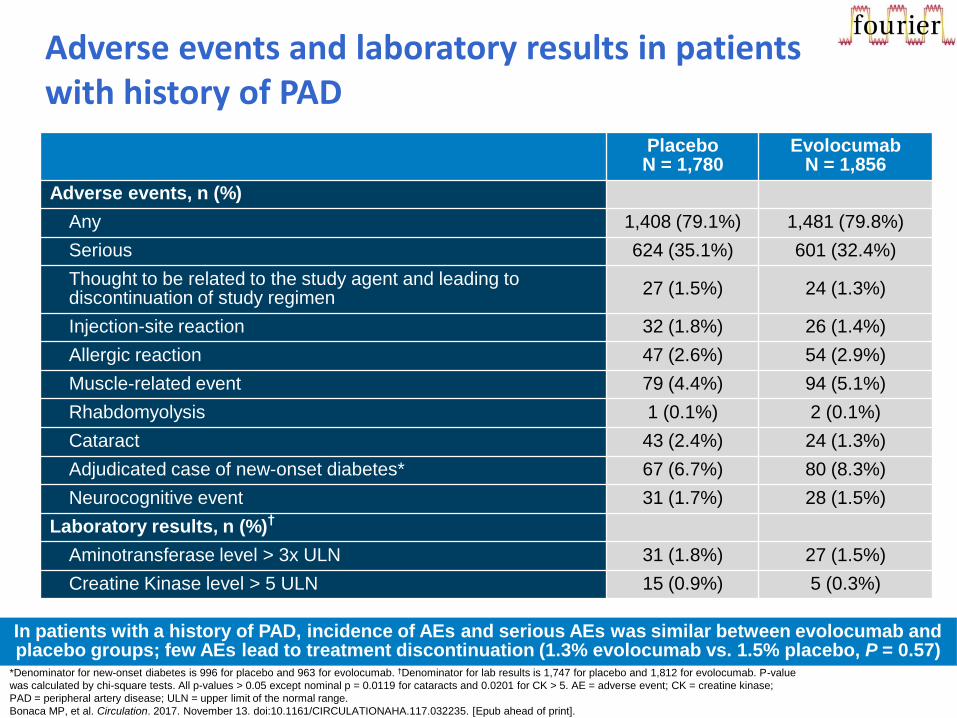
Adverse events and laboratory results in patients with history of PAD
In patients with a history of PAD, incidence of AEs and serious AEs was similar between evolocumab and placebo groups; few AEs lead to treatment discontinuation (1.3% evolocumab vs. 1.5% placebo, P = 0.57)
Placebo N = 1,780
Evolocumab N = 1,856
Adverse events, n (%)
Any 1,408 (79.1%) 1,481 (79.8%)
Serious 624 (35.1%) 601 (32.4%)
Thought to be related to the study agent and leading to discontinuation of study regimen
27 (1.5%) 24 (1.3%)
Injection-site reaction 32 (1.8%) 26 (1.4%)
Allergic reaction 47 (2.6%) 54 (2.9%)
Muscle-related event 79 (4.4%) 94 (5.1%)
Rhabdomyolysis 1 (0.1%) 2 (0.1%)
Cataract 43 (2.4%) 24 (1.3%)
Adjudicated case of new-onset diabetes* 67 (6.7%) 80 (8.3%)
Neurocognitive event 31 (1.7%) 28 (1.5%)
Laboratory results, n (%)†
Aminotransferase level > 3x ULN 31 (1.8%) 27 (1.5%)
Creatine Kinase level > 5 ULN 15 (0.9%) 5 (0.3%)
*Denominator for new-onset diabetes is 996 for placebo and 963 for evolocumab. †Denominator for lab results is 1,747 for placebo and 1,812 for evolocumab. P-value
was calculated by chi-square tests. All p-values > 0.05 except nominal p = 0.0119 for cataracts and 0.0201 for CK > 5. AE = adverse event; CK = creatine kinase;
PAD = peripheral artery disease; ULN = upper limit of the normal range.
Bonaca MP, et al. Circulation. 2017. November 13. doi:10.1161/CIRCULATIONAHA.117.032235. [Epub ahead of print].
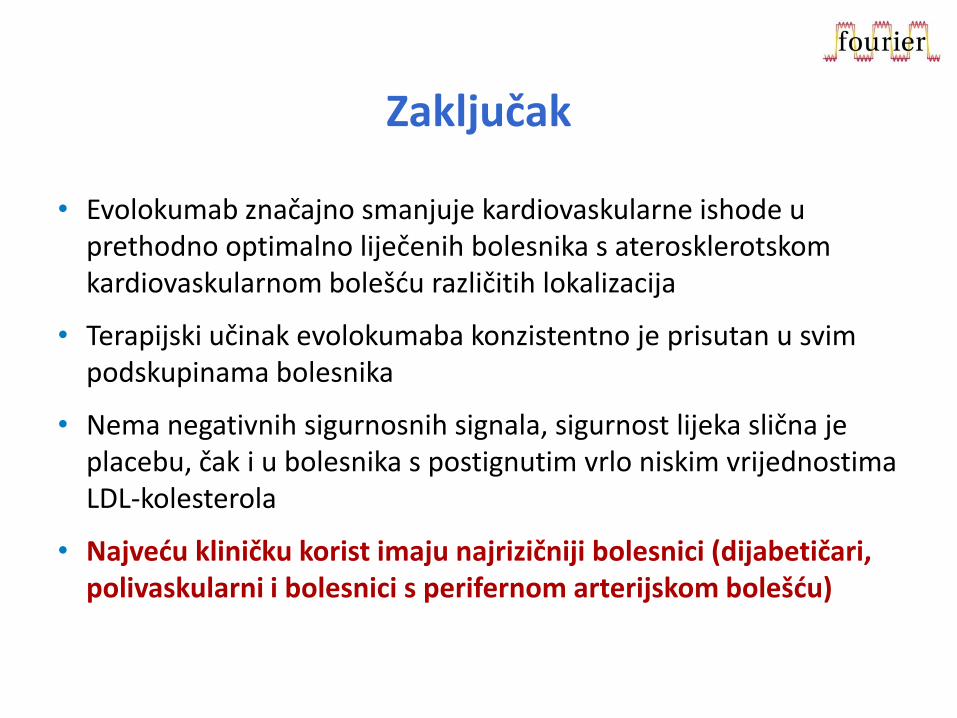
Zaključak
• Evolokumab značajno smanjuje kardiovaskularne ishode u prethodno optimalno liječenih bolesnika s aterosklerotskom kardiovaskularnom bolešću različitih lokalizacija
• Terapijski učinak evolokumaba konzistentno je prisutan u svim podskupinama bolesnika
• Nema negativnih sigurnosnih signala, sigurnost lijeka slična je placebu, čak i u bolesnika s postignutim vrlo niskim vrijednostima LDL-kolesterola
• Najveću kliničku korist imaju najrizičniji bolesnici (dijabetičari, polivaskularni i bolesnici s perifernom arterijskom bolešću)