Embed Size (px)
Citation preview
The Regents of the University of Colorado, a body corporate, contracting on behalfof the University of Colorado at Boulder for the benefit of INSTAAR
Diversity Patterns in Relation to the Environment in Alpine Tundra Ecosystems of NorthernNorwayAuthor(s): Jörg Löffler and Roland PapeSource: Arctic, Antarctic, and Alpine Research, Vol. 40, No. 2 (May, 2008), pp. 373-381Published by: INSTAAR, University of ColoradoStable URL: http://www.jstor.org/stable/20181801 .
Accessed: 14/06/2014 10:15
Your use of the JSTOR archive indicates your acceptance of the Terms & Conditions of Use, available at .http://www.jstor.org/page/info/about/policies/terms.jsp
.JSTOR is a not-for-profit service that helps scholars, researchers, and students discover, use, and build upon a wide range ofcontent in a trusted digital archive. We use information technology and tools to increase productivity and facilitate new formsof scholarship. For more information about JSTOR, please contact [email protected].
.
INSTAAR, University of Colorado and The Regents of the University of Colorado, a body corporate,contracting on behalf of the University of Colorado at Boulder for the benefit of INSTAAR are collaboratingwith JSTOR to digitize, preserve and extend access to Arctic, Antarctic, and Alpine Research.
http://www.jstor.org
This content downloaded from 195.78.108.199 on Sat, 14 Jun 2014 10:15:33 AMAll use subject to JSTOR Terms and Conditions
Arctic, Antarctic, and Alpine Research, Vol. 40, No. 2, 2008, pp. 373-381
Diversity Patterns in Relation to the Environment in Alpine Tundra Ecosystems of Northern Norway
J?rg L?ffler*^ and Roland Pape*%
*Department of Geography, University of Bonn, Meckenheimer Allee 166, D
53115 Bonn, Germany
f Corresponding author:
Abstract
We analyzed diversity patterns of alpine tundra ecosystems along environmental
gradients. We hypothesized that alpine diversity is affected by climate at local and
regional scales, nutrient availability, soil moisture, and disturbance related to
herbivory. In all, 232 samples in 11 study areas in Troms and Finnmark counties were analyzed with regard to a- and ?-diversity of vascular plants and lichens.
Relationships between a-diversity and environmental variables were analyzed by
regression trees, ?-diversity defined as species turnover was investigated using
indirect ordination methods. Sites with non-acidic soil parent material showed
highest species densities. Lowest species numbers were typical for extreme
topographic positions. Heavily grazed samples showed less species numbers and
coverage percentage of vegetation. The number of graminoid species was found to be
highest in areas of high grazing pressure. We concluded that a-diversity was
controlled by growing season, snow cover, pH, soil moisture, disturbance,
temperature, and precipitation, stressing the importance of multi-factorial
approaches in diversity studies. Determinants of ?-diversity were predominantly
local environmental conditions, whereas regional conditions were less important.
DOI: 10.1657/1523-0430(06-097)[LOEFFLER]2.0.CO;2
Introduction
Mountains are widely recognized as containing highly diverse
and species rich ecosystems (e.g., Diaz et al., 2003; K?rner, 2004).
Topographic gradients condensed over short distances are capable
of producing unique hotspots of biodiversity. Commonly,
environmental heterogeneity is expected to be positively correlated
with species numbers (Rosenzweig, 1995; K?rner, 2004). But, at
the same time, high mountain ecosystems are in general quite
sensitive and highly vulnerable to environmental changes, for
instance slow land degradation due to human activities with all the
attendant socioeconomic consequences (Messerli and Ives, 1997).
Furthermore, many studies suggest that high elevation environ
ments are among the most sensitive to climatic changes occurring on a global scale. Relatively small perturbations in global
processes can cascade down to produce large changes in most of
the interdependent patterns and processes, from the hydrological
cycle to the complex fauna and flora, and the people that depend on those resources (e.g., Thompson, 2000; Beniston, 2003). The
human welfare and especially the water supply depend directly or
indirectly on the functional integrity of mountain ecosystems with
vegetation as their key component (K?rner, 2004). As such, plant
diversity provides an insurance against system failure by
functional redundancy in traits (K?rner, 2004). The understanding
and explanation of mechanisms that control diversity is critical for
predicting changes in diversity patterns resulting from changes in
land use or a changing climate (Walker, 1995).
Patterns of spatial and temporal variations in species richness
and diversity as well as their relationship to underlying environ
mental variables within arctic and alpine regions have recently
attracted considerable interest by ecologists and biogeographers
(Heikkinen and Neuvonen, 1997; Gough et al., 2000; Moser et al.,
2005). The compressed climatic gradient, sharp ecotones, and
altitudinal gradients are useful for investigating patterns in species
richness, as a changing climate may lead to the migration of
species (Lomolino, 2001; Grytnes, 2003; Fosaa, 2004; S?nchez Gonz?les and L?pez-Mata, 2005).
Focusing on determinants of species diversity, an appro
priate consideration of scaling issues is inevitable (Rosenzweig,
1995). K?rner (1995) defined in his assessment of causes of alpine plant diversity a set of "sieves" acting at different
spatial scales. In a global context, harsh environmental conditions
present in arctic-alpine landscapes require plants to possess
evolutionary adaptations to low temperatures and short growing
seasons, resulting in a small overall species pool (K?rner, 2003).
At finer scales, environmental heterogeneity gains importance. At
regional scale, soil parent material (Molau, 2003) and grazing
pressure are likely to affect diversity patterns. For instance,
moderate herbivory in productive areas is assumed to increase
biodiversity, whereas diversity is reduced due to herbivory in less
productive habitats (Austrheim and Eriksson, 2001). At local
scale, differentiations in topography and associated changes in
snow cover and soil moisture are important determinants of
diversity (e.g., Gould and Walker, 1999; K?rner, 2004). Thus, at
local scale, both sets of determinants, regional and local as well as
their interaction, may control diversity and need to be taken into
account to understand diversity patterns (Gough et al., 2000;
Holten, 2003). Pausas and Austin (2001) point out that species richness
patterns in relation to the environment need to be understood
before drawing conclusions on the effect of biodiversity in
ecosystem processes. They criticize that despite species richness
being governed by two or more environmental gradients, diversity
studies in relation to environmental gradients have mainly been
single-factor studies. Pausas and Austin (2001) concluded with a
suggestion of potential approaches when studying species richness
? 2008 Regents of the University of Colorado J. L?ffler and R. Pape / 373 1523-0430/08 $7.00
This content downloaded from 195.78.108.199 on Sat, 14 Jun 2014 10:15:33 AMAll use subject to JSTOR Terms and Conditions
16? E 21? E 26? E 31? E
70? N
400 km 16? E
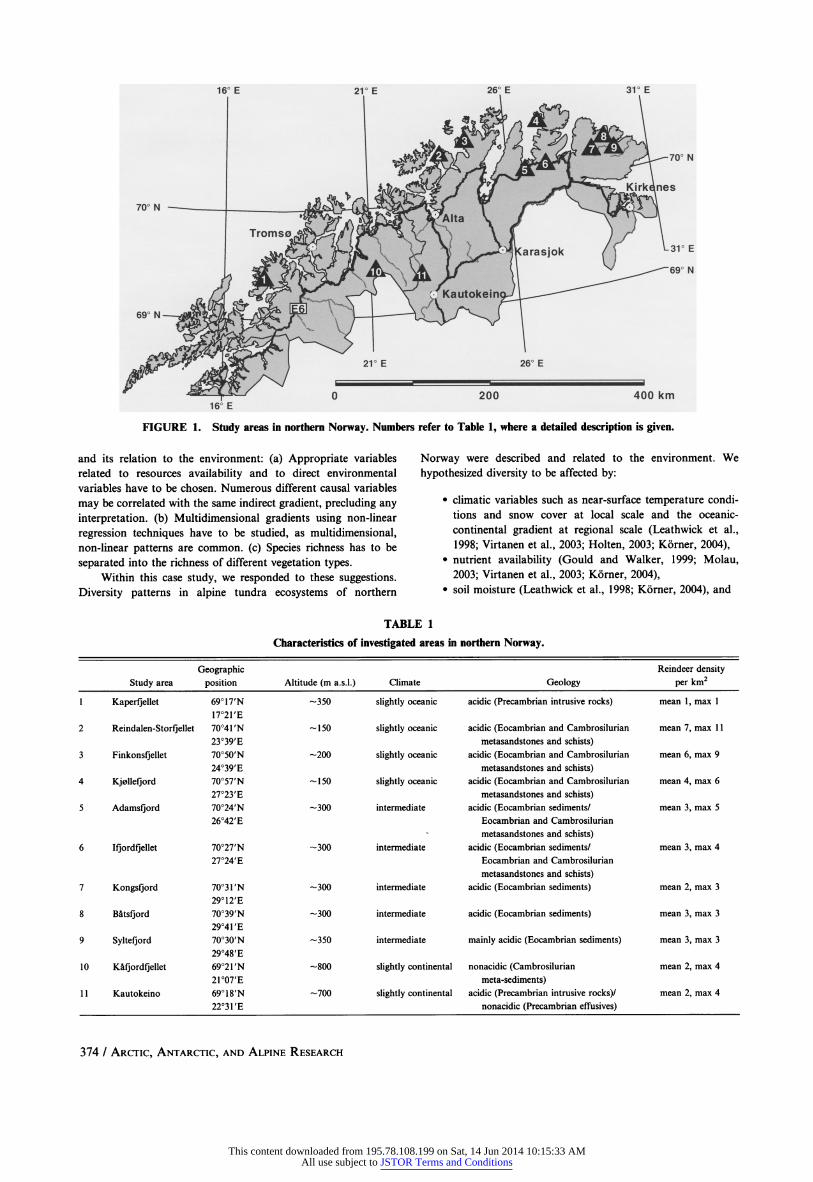
FIGURE 1. Study areas in northern Norway. Numbers refer to Table 1, where a detailed description is given.
and its relation to the environment: (a) Appropriate variables
related to resources availability and to direct environmental
variables have to be chosen. Numerous different causal variables
may be correlated with the same indirect gradient, precluding any
interpretation, (b) Multidimensional gradients using non-linear
regression techniques have to be studied, as multidimensional,
non-linear patterns are common, (c) Species richness has to be
separated into the richness of different vegetation types.
Within this case study, we responded to these suggestions.
Diversity patterns in alpine tundra ecosystems of northern
Norway were described and related to the environment. We
hypothesized diversity to be affected by:
climatic variables such as near-surface temperature condi
tions and snow cover at local scale and the oceanic
continental gradient at regional scale (Leathwick et al.,
1998; Virtanen et al., 2003; Holten, 2003; K?rner, 2004), nutrient availability (Gould and Walker, 1999; Molau,
2003; Virtanen et al., 2003; K?rner, 2004),
soil moisture (Leathwick et al., 1998; K?rner, 2004), and
TABLE 1
Characteristics of investigated areas in northern Norway.
Study area Geographic
position Altitude (m a.s.l.) Climate Geology
Reindeer density
per km2
9
10
11
Kaperfjellet
Reindalen-Storfjellet
Finkonsfjellet
Kjollefjord
Adamsfjord
Ifjordfjellet
Kongsfjord
B?tsfjord
Syltefjord
K?fjordfjellet
Kautokeino
69?17'N
17?21'E
70?41'N
23?39'E
70?50'N
24?39'E
70?57'N
27?23'E
70?24'N
26?42'E
70?27'N
27?24'E
70?31'N
29?12'E
70?39'N
29?41'E
70?30'N
29?48'E
69?21'N
21?07'E
69?18'N
22?31'E
?350 slightly oceanic
? 150 slightly oceanic
?200 slightly oceanic
? 150 slightly oceanic
?300 intermediate
-300
-300
-300
-350
-800
-700
intermediate
intermediate
intermediate
intermediate
slightly continental
slightly continental
acidic (Precambrian intrusive rocks) mean 1, max 1
acidic (Eocambrian and Cambrosilurian mean 7, max 11
metasandstones and schists) acidic (Eocambrian and Cambrosilurian mean 6, max 9
metasandstones and schists) acidic (Eocambrian and Cambrosilurian mean 4, max 6
metasandstones and schists) acidic (Eocambrian sediments/ mean 3, max 5
Eocambrian and Cambrosilurian
metasandstones and schists)
acidic (Eocambrian sediments/ mean 3, max 4
Eocambrian and Cambrosilurian
metasandstones and schists)
acidic (Eocambrian sediments) mean 2, max 3
acidic (Eocambrian sediments) mean 3, max 3
mainly acidic (Eocambrian sediments) mean 3, max 3
nonacidic (Cambrosilurian mean 2, max 4
meta-sediments)
acidic (Precambrian intrusive rocks)/ mean 2, max 4
nonacidic (Precambrian effusives)
374 / Arctic, Antarctic, and Alpine Research
This content downloaded from 195.78.108.199 on Sat, 14 Jun 2014 10:15:33 AMAll use subject to JSTOR Terms and Conditions
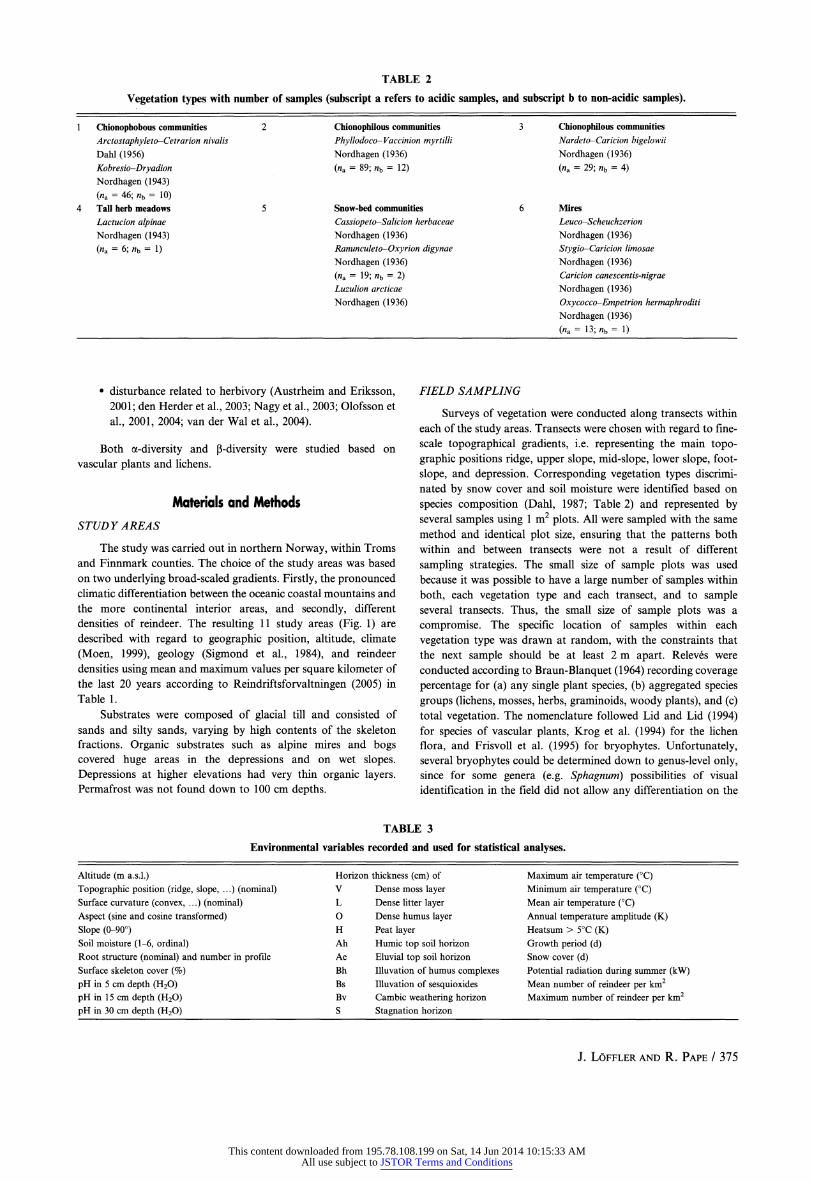
TABLE 2
Vegetation types with number of samples (subscript a refers to acidic samples, and subscript b to non-acidic samples).
1 Chionophobous communities
Arctostaphyleto-Cetrarion nivalis
Dahl (1956)
Kobresio-Dryadion
Nordhagen (1943)
(?a =
46; nh = 10)
4 Tall herb meadows
Lactucion alpinae
Nordhagen (1943)
(?a =
6; ?b = 1)
Chionophilous communities
Phyllodoco- Vaccinion myrtilli
Nordhagen (1936)
(?a =
89; nh =
12)
Snow-bed communities
Cassiopeto-Salicion herbaceae
Nordhagen (1936)
Ranunculeto-Oxyrion digynae
Nordhagen (1936)
(?a =
19; nh =
2) Luzulion arcticae
Nordhagen (1936)
Chionophilous communities
Nardeto-Caricion bigelowii
Nordhagen (1936)
(?a =
29; nh =
4)
Mires
Leuco-Scheuchzerion
Nordhagen (1936)
Stygio-Caricion limosae
Nordhagen (1936) Caricion canescentis-nigrae
Nordhagen (1936)
Oxycocco-Empetrion hermaphroditi
Nordhagen (1936)
(?a =
13; ?b =
1)
disturbance related to herbivory (Austrheim and Eriksson,
2001; den Herder et al., 2003; Nagy et al., 2003; Olofsson et
al., 2001, 2004; van der Wal et al., 2004).
Both a-diversity and ?-diversity were studied based on
vascular plants and lichens.
Materials and Methods
STUDY AREAS
The study was carried out in northern Norway, within Troms
and Finnmark counties. The choice of the study areas was based
on two underlying broad-scaled gradients. Firstly, the pronounced
climatic differentiation between the oceanic coastal mountains and
the more continental interior areas, and secondly, different
densities of reindeer. The resulting 11 study areas (Fig. 1) are
described with regard to geographic position, altitude, climate
(Moen, 1999), geology (Sigmond et al., 1984), and reindeer densities using mean and maximum values per square kilometer of
the last 20 years according to Reindriftsforvaltningen (2005) in Table 1.
Substrates were composed of glacial till and consisted of
sands and silty sands, varying by high contents of the skeleton
fractions. Organic substrates such as alpine mires and bogs
covered huge areas in the depressions and on wet slopes.
Depressions at higher elevations had very thin organic layers.
Permafrost was not found down to 100 cm depths.
FIELD SAMPLING
Surveys of vegetation were conducted along transects within
each of the study areas. Transects were chosen with regard to fine
scale topographical gradients, i.e. representing the main topo
graphic positions ridge, upper slope, mid-slope, lower slope, foot
slope, and depression. Corresponding vegetation types discrimi
nated by snow cover and soil moisture were identified based on
species composition (Dahl, 1987; Table 2) and represented by several samples using 1 m2 plots. All were sampled with the same
method and identical plot size, ensuring that the patterns both
within and between transects were not a result of different
sampling strategies. The small size of sample plots was used
because it was possible to have a large number of samples within
both, each vegetation type and each transect, and to sample
several transects. Thus, the small size of sample plots was a
compromise. The specific location of samples within each
vegetation type was drawn at random, with the constraints that
the next sample should be at least 2 m apart. Relev?s were
conducted according to Braun-Blanquet (1964) recording coverage
percentage for (a) any single plant species, (b) aggregated species
groups (lichens, mosses, herbs, graminoids, woody plants), and (c)
total vegetation. The nomenclature followed Lid and Lid (1994) for species of vascular plants, Krog et al. (1994) for the lichen
flora, and Frisvoll et al. (1995) for bryophytes. Unfortunately,
several bryophytes could be determined down to genus-level only,
since for some genera (e.g. Sphagnum) possibilities of visual
identification in the field did not allow any differentiation on the
TABLE 3
Environmental variables recorded and used for statistical analyses.
Altitude (m a.s.l.)
Topographic position (ridge, slope, ...) (nominal) Surface curvature (convex, ...) (nominal)
Aspect (sine and cosine transformed)
Slope (0-90?) Soil moisture (1-6, ordinal) Root structure (nominal) and number in profile Surface skeleton cover (%)
pH in 5 cm depth (H20)
pH in 15 cm depth (H20)
pH in 30 cm depth (H20)
Horizon thickness (cm) of
V Dense moss layer L Dense litter layer O Dense humus layer H Peat layer Ah Humic top soil horizon
Ae Eluvial top soil horizon
Bh Illuvation of humus complexes Bs Illuvation of sesquioxides Bv Cambie weathering horizon
S Stagnation horizon
Maximum air temperature (?C) Minimum air temperature (?C) Mean air temperature (?C) Annual temperature amplitude (K) Heatsum > 5?C (K) Growth period (d) Snow cover (d) Potential radiation during summer (kW)
Mean number of reindeer per km2
Maximum number of reindeer per km2
J. L?FFLER AND R. PAPE / 375
This content downloaded from 195.78.108.199 on Sat, 14 Jun 2014 10:15:33 AMAll use subject to JSTOR Terms and Conditions
T
<=p
Vegetation type
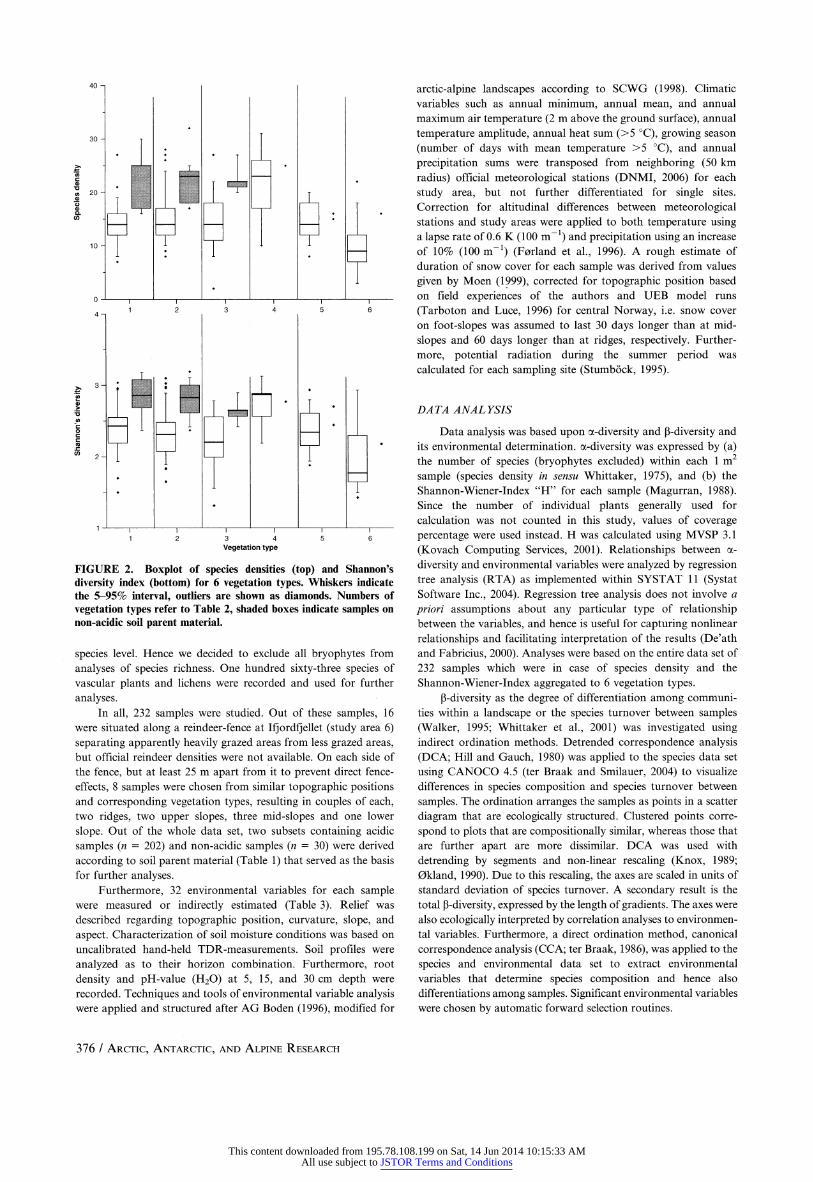
FIGURE 2. Boxplot of species densities (top) and Shannon's
diversity index (bottom) for 6 vegetation types. Whiskers indicate
the 5-95% interval, outliers are shown as diamonds. Numbers of
vegetation types refer to Table 2, shaded boxes indicate samples on
non-acidic soil parent material.
species level. Hence we decided to exclude all bryophytes from
analyses of species richness. One hundred sixty-three species of
vascular plants and lichens were recorded and used for further
analyses.
In all, 232 samples were studied. Out of these samples, 16
were situated along a reindeer-fence at If] ordfjeilet (study area 6)
separating apparently heavily grazed areas from less grazed areas,
but official reindeer densities were not available. On each side of
the fence, but at least 25 m apart from it to prevent direct fence
effects, 8 samples were chosen from similar topographic positions
and corresponding vegetation types, resulting in couples of each,
two ridges, two upper slopes, three mid-slopes and one lower
slope. Out of the whole data set, two subsets containing acidic
samples (n =
202) and non-acidic samples (n =
30) were derived
according to soil parent material (Table 1) that served as the basis
for further analyses.
Furthermore, 32 environmental variables for each sample were measured or indirectly estimated (Table 3). Relief was
described regarding topographic position, curvature, slope, and
aspect. Characterization of soil moisture conditions was based on
uncalibrated hand-held TDR-measurements. Soil profiles were
analyzed as to their horizon combination. Furthermore, root
density and pH-value (H20) at 5, 15, and 30 cm depth were
recorded. Techniques and tools of environmental variable analysis were applied and structured after AG Boden (1996), modified for
arctic-alpine landscapes according to SCWG (1998). Climatic
variables such as annual minimum, annual mean, and annual
maximum air temperature (2 m above the ground surface), annual
temperature amplitude, annual heat sum (>5 ?C), growing season
(number of days with mean temperature >5 ?C), and annual
precipitation sums were transposed from neighboring (50 km
radius) official meteorological stations (DNMI, 2006) for each
study area, but not further differentiated for single sites.
Correction for altitudinal differences between meteorological
stations and study areas were applied to both temperature using a lapse rate of0.6K(100m_1) and precipitation using an increase
of 10% (100 m-1) (Forland et al., 1996). A rough estimate of
duration of snow cover for each sample was derived from values
given by Moen (1999), corrected for topographic position based
on field experiences of the authors and UEB model runs
(Tarboton and Luce, 1996) for central Norway, i.e. snow cover
on foot-slopes was assumed to last 30 days longer than at mid
slopes and 60 days longer than at ridges, respectively. Further
more, potential radiation during the summer period was
calculated for each sampling site (Stumb?ck, 1995).
DATA ANALYSIS
Data analysis was based upon a-diversity and ?-diversity and
its environmental determination, a-diversity was expressed by (a)
the number of species (bryophytes excluded) within each 1 m2
sample (species density in sensu Whittaker, 1975), and (b) the
Shannon-Wiener-Index "H" for each sample (Magurran, 1988).
Since the number of individual plants generally used for
calculation was not counted in this study, values of coverage
percentage were used instead. H was calculated using MVSP 3.1
(Kovach Computing Services, 2001). Relationships between a
diversity and environmental variables were analyzed by regression
tree analysis (RTA) as implemented within SYSTAT 11 (Systat Software Inc., 2004). Regression tree analysis does not involve a
priori assumptions about any particular type of relationship
between the variables, and hence is useful for capturing nonlinear
relationships and facilitating interpretation of the results (De'ath
and Fabricius, 2000). Analyses were based on the entire data set of
232 samples which were in case of species density and the
Shannon-Wiener-Index aggregated to 6 vegetation types.
?-diversity as the degree of differentiation among communi
ties within a landscape or the species turnover between samples
(Walker, 1995; Whittaker et al., 2001) was investigated using
indirect ordination methods. Detrended correspondence analysis
(DCA; Hill and Gauch, 1980) was applied to the species data set
using CANOCO 4.5 (ter Braak and Smilauer, 2004) to visualize
differences in species composition and species turnover between
samples. The ordination arranges the samples as points in a scatter
diagram that are ecologically structured. Clustered points corre
spond to plots that are compositionally similar, whereas those that
are further apart are more dissimilar. DCA was used with
detrending by segments and non-linear rescaling (Knox, 1989;
Okland, 1990). Due to this rescaling, the axes are scaled in units of
standard deviation of species turnover. A secondary result is the
total ?-diversity, expressed by the length of gradients. The axes were
also ecologically interpreted by correlation analyses to environmen
tal variables. Furthermore, a direct ordination method, canonical
correspondence analysis (CCA; ter Braak, 1986), was applied to the
species and environmental data set to extract environmental
variables that determine species composition and hence also
differentiations among samples. Significant environmental variables
were chosen by automatic forward selection routines.
376 / Arctic, Antarctic, and Alpine Research
This content downloaded from 195.78.108.199 on Sat, 14 Jun 2014 10:15:33 AMAll use subject to JSTOR Terms and Conditions
Mean=18.853 SD=5.618 N=232
Mean=15.724 SD=2.955
N=58
Mean=16.419 SD=3.034
N=93
Mean=17.282 SD=4.382
N=181
Growing season < 93 d _l_
Mean=24.431 SD=6.001
N=51
Snow cover < 200 d
Mean=18.193 SD=5.326
Mean=17.571 SD=2.842
N=35
Mean=18.800 SD=6.233
N=10
Mean=16.512 SD=5.996
N=41
Mean=14.781 SD=2.338
N=32
SKEL < 25% _J_
Mean=16.885 SD=3.254
N=26
pH15<5.2
Mean=16.556 SD=2.382
N=18
Mean=18.647 SD=2.957
N=17
Tmean < 0.497 ?C
_l_
Mean=19.660 SD=4.203
N=47
Mean=13.000 SD=5.129
N=14
MOIST <
_l_
Mean=18.333 SD=5.664
N=27
Tmean < 0.676 ?C I
| Nlean=13.765 SD=1.855
N=17
Growing season < 98 d
| Mean=15.933 SD=2.344
N=15
Mean=15.286 SD=2.614
N=14
pH15<4.8 _I_
Mean=17.389 SD=3.648
N=18
Mean=21.069 SD=3.945
N=29
PREC < 860 mm
Mean=18.750 SD=2.989
N=12
Mean=17.176 SD=5.199
N=17
Mean=20.300 SD=6.147
N=10
Mean=19.545 SD=3.417
N=11
Mean=25.805 SD=5.139
N=41
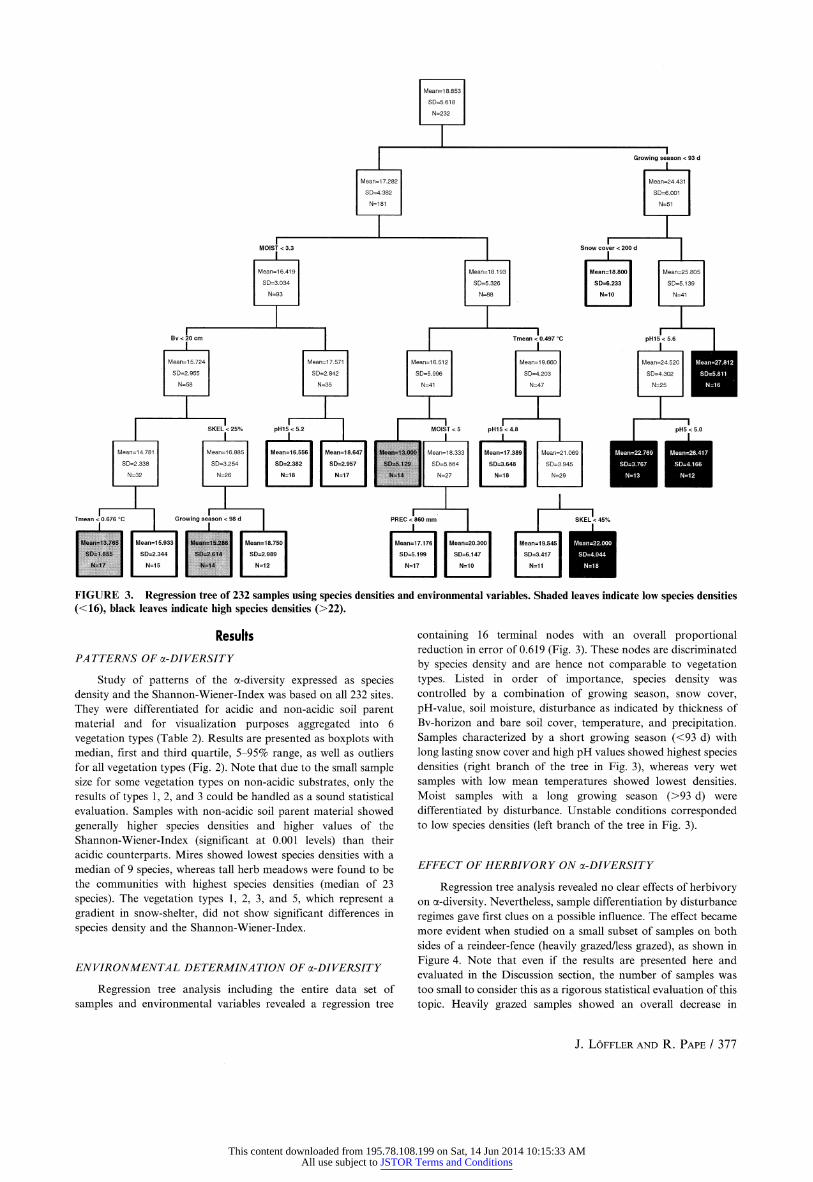
FIGURE 3. Regression tree of 232 samples using species densities and environmental variables. Shaded leaves indicate low species densities
(<16), black leaves indicate high species densities (>22).
Results
PATTERNS OF (^-DIVERSITY
Study of patterns of the a-diversity expressed as species
density and the Shannon-Wiener-Index was based on all 232 sites.
They were differentiated for acidic and non-acidic soil parent
material and for visualization purposes aggregated into 6
vegetation types (Table 2). Results are presented as boxplots with
median, first and third quartile, 5-95% range, as well as outliers
for all vegetation types (Fig. 2). Note that due to the small sample size for some vegetation types on non-acidic substrates, only the
results of types 1, 2, and 3 could be handled as a sound statistical
evaluation. Samples with non-acidic soil parent material showed
generally higher species densities and higher values of the
Shannon-Wiener-Index (significant at 0.001 levels) than their
acidic counterparts. Mires showed lowest species densities with a
median of 9 species, whereas tall herb meadows were found to be
the communities with highest species densities (median of 23
species). The vegetation types 1, 2, 3, and 5, which represent a
gradient in snow-shelter, did not show significant differences in
species density and the Shannon-Wiener-Index.
ENVIRONMENTAL DETERMINATION OF ol-DIVERSITY
Regression tree analysis including the entire data set of
samples and environmental variables revealed a regression tree
containing 16 terminal nodes with an overall proportional
reduction in error of 0.619 (Fig. 3). These nodes are discriminated
by species density and are hence not comparable to vegetation
types. Listed in order of importance, species density was
controlled by a combination of growing season, snow cover,
pH-value, soil moisture, disturbance as indicated by thickness of
Bv-horizon and bare soil cover, temperature, and precipitation.
Samples characterized by a short growing season (<93 d) with
long lasting snow cover and high pH values showed highest species
densities (right branch of the tree in Fig. 3), whereas very wet
samples with low mean temperatures showed lowest densities.
Moist samples with a long growing season (>93 d) were
differentiated by disturbance. Unstable conditions corresponded to low species densities (left branch of the tree in Fig. 3).
EFFECT OF HERBIVORY ON a-DIVERSITY
Regression tree analysis revealed no clear effects of herbivory on a-diversity. Nevertheless, sample differentiation by disturbance
regimes gave first clues on a possible influence. The effect became
more evident when studied on a small subset of samples on both
sides of a reindeer-fence (heavily grazed/less grazed), as shown in
Figure 4. Note that even if the results are presented here and
evaluated in the Discussion section, the number of samples was
too small to consider this as a rigorous statistical evaluation of this
topic. Heavily grazed samples showed an overall decrease in
J. L?ffler and R. Pape / 377
This content downloaded from 195.78.108.199 on Sat, 14 Jun 2014 10:15:33 AMAll use subject to JSTOR Terms and Conditions
20+"
?
I
"S" 1 i i
all bryophytes
350-r
300-I
250
200
150
100
50
0
herba ous plants
graminoids woody plante
140
120
100
80
60
40
20
0
bryophytes herbaceous plants
graminoids woody plants
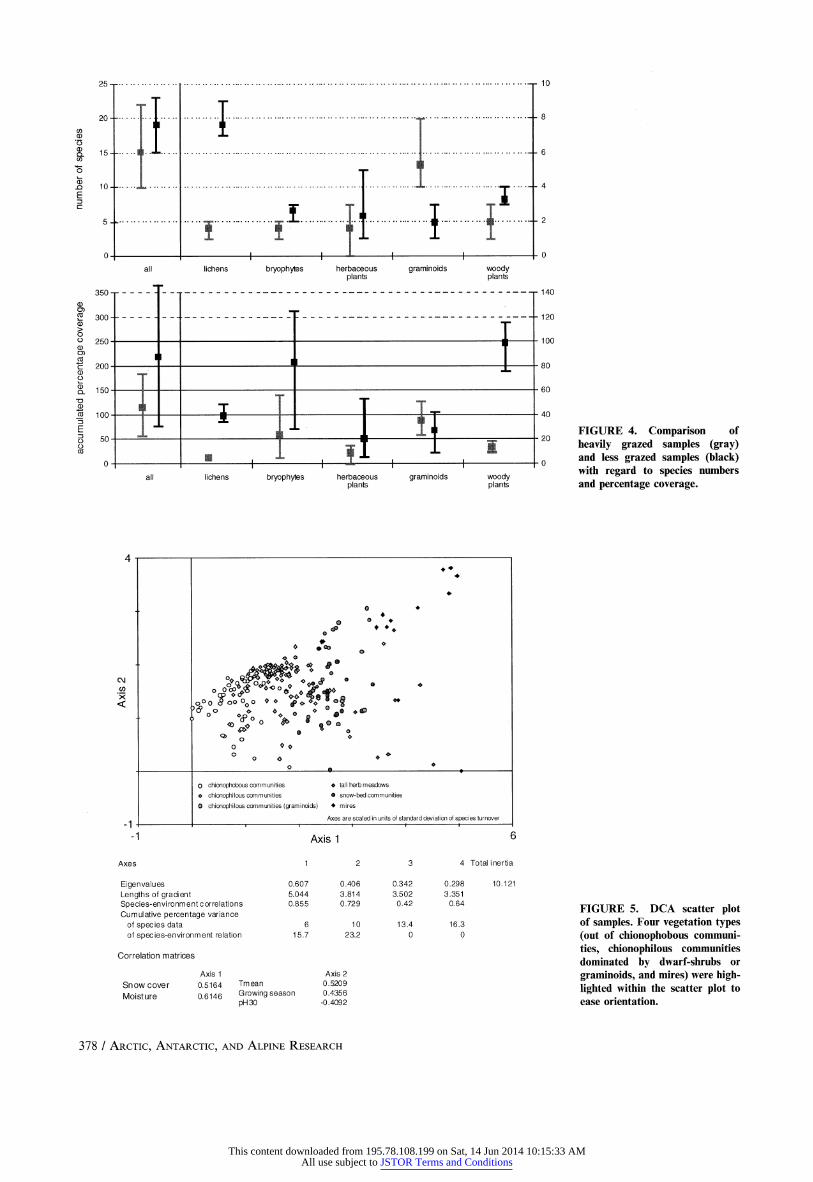
FIGURE 4. Comparison of
heavily grazed samples (gray) and less grazed samples (black) with regard to species numbers
and percentage coverage.
x <
>
*'
?oo ooo *
v ?
? *
^ } ? Q
0
O chionophobous communities
chionophilous communities ? chionophilous communities (graminoids)
tall herb meadows a snow-bed communities
mires
Axes are scaled in units of standard deviation of species turnover
-1 Axis 1
Axes 4 Total inertia
Eigenvalues 0.607
Lengths of gradient 5.044
Species-environment correlations 0.855 Cumulative percentage variance
of species data 6 of species-environment relation 15.7
Correlation matrices
Snow cover
Moisture
Axis 1 0.5164 Tmean
0 6146 Growing season pH30
0.406 3.814 0.729
10 23.2
Axis 2 0.5209 0.4356 -0.4092
0.342 3.502
0.42
13.4 0
0.298 10.121 3.351
0.64
16.3 0
FIGURE 5. DCA scatter plot of samples. Four vegetation types
(out of chionophobous communi
ties, chionophilous communities
dominated by dwarf-shrubs or
graminoids, and mires) were high
lighted within the scatter plot to
ease orientation.
378 / Arctic, Antarctic, and Alpine Research
This content downloaded from 195.78.108.199 on Sat, 14 Jun 2014 10:15:33 AMAll use subject to JSTOR Terms and Conditions
Axis 1 2.5
Axes
Eigenvalues Species-environment correlations
Cumulative percentage variance of species data of species-environment relation
0.393 0.833
3.9 28.6
0.282 0.829
6.7 49.2
0.181 0.745
8.5 62.5
0.124 0.666
4 Total inertia
10.121
9.7 71.5
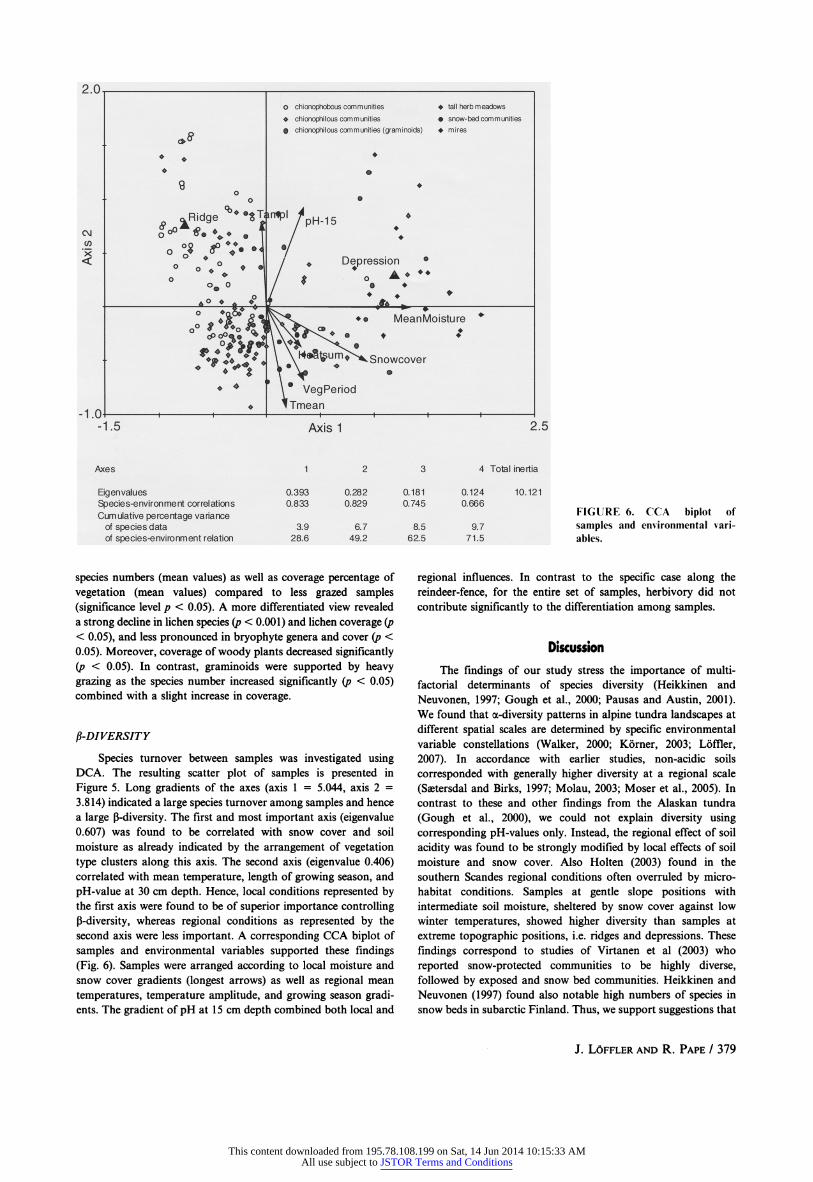
FIGURE 6. CCA biplot of
samples and environmental vari
ables.
species numbers (mean values) as well as coverage percentage of
vegetation (mean values) compared to less grazed samples
(significance level p < 0.05). A more differentiated view revealed
a strong decline in lichen species (p < 0.001) and lichen coverage (p < 0.05), and less pronounced in bryophyte genera and cover {p <
0.05). Moreover, coverage of woody plants decreased significantly
(p < 0.05). In contrast, graminoids were supported by heavy
grazing as the species number increased significantly (p < 0.05)
combined with a slight increase in coverage.
?-DIVERSITY
Species turnover between samples was investigated using
DCA. The resulting scatter plot of samples is presented in
Figure 5. Long gradients of the axes (axis 1 = 5.044, axis 2 =
3.814) indicated a large species turnover among samples and hence
a large ?-diversity. The first and most important axis (eigenvalue
0.607) was found to be correlated with snow cover and soil
moisture as already indicated by the arrangement of vegetation
type clusters along this axis. The second axis (eigenvalue 0.406)
correlated with mean temperature, length of growing season, and
pH-value at 30 cm depth. Hence, local conditions represented by
the first axis were found to be of superior importance controlling
?-diversity, whereas regional conditions as represented by the
second axis were less important. A corresponding CCA biplot of
samples and environmental variables supported these findings
(Fig. 6). Samples were arranged according to local moisture and
snow cover gradients (longest arrows) as well as regional mean
temperatures, temperature amplitude, and growing season gradi ents. The gradient of pH at 15 cm depth combined both local and
regional influences. In contrast to the specific case along the
reindeer-fence, for the entire set of samples, herbivory did not
contribute significantly to the differentiation among samples.
Discussion
The findings of our study stress the importance of multi
factorial determinants of species diversity (Heikkinen and
Neuvonen, 1997; Gough et al., 2000; Pausas and Austin, 2001).
We found that a-diversity patterns in alpine tundra landscapes at
different spatial scales are determined by specific environmental
variable constellations (Walker, 2000; K?rner, 2003; L?ffler,
2007). In accordance with earlier studies, non-acidic soils
corresponded with generally higher diversity at a regional scale
(Saetersdal and Birks, 1997; Molau, 2003; Moser et al., 2005). In
contrast to these and other findings from the Alaskan tundra
(Gough et al., 2000), we could not explain diversity using
corresponding pH-values only. Instead, the regional effect of soil
acidity was found to be strongly modified by local effects of soil moisture and snow cover. Also Holten (2003) found in the
southern Scandes regional conditions often overruled by micro
habitat conditions. Samples at gentle slope positions with
intermediate soil moisture, sheltered by snow cover against low
winter temperatures, showed higher diversity than samples at
extreme topographic positions, i.e. ridges and depressions. These
findings correspond to studies of Virtanen et al (2003) who
reported snow-protected communities to be highly diverse,
followed by exposed and snow bed communities. Heikkinen and
Neuvonen (1997) found also notable high numbers of species in snow beds in subarctic Finland. Thus, we support suggestions that
J. L?FFLER AND R. PAPE / 379
This content downloaded from 195.78.108.199 on Sat, 14 Jun 2014 10:15:33 AMAll use subject to JSTOR Terms and Conditions
both regional and local effects on diversity have to be considered
(Gough et al., 2000).
In general, the effect of herbivory on the maintenance
of plant diversity in alpine environments is inadequately
understood (Erschbamer et al., 2003). Proulx and Mazumder
(1998) hypothesized that grazing decreases species richness in
nutrient-poor environments while in nutrient rich environments
plant species richness is increased. According to Erschbamer
et al. (2003) alpine environments offer an excellent model
system to further test general productivity-diversity hypotheses.
Our study revealed clues on an overall reduction of diversity
and percentage cover of vegetation due to heavy grazing at
nutrient-poor sites. We found only the number of graminoid
species that could be supported by grazing pressure, whereas
lichens suffered most. Former studies proved that combined
trampling and grazing by reindeer led to an almost complete
removal of the lichen carpet (L?ffler, 2000, 2004; Boudreau and
Payette, 2004). Furthermore, negative effects of grazing on lichens,
bryophytes, herbaceous plants and woody plants were found,
whereas graminoids benefited from herbivory (Cr?te et al., 2001).
According to van der Wal et al. (2004) grazing and trampling were
instrumental in reducing the depth of the moss layer, which raised
soil temperature from which graminoids benefited in particular.
Thus, an increased herbivory impact allowed the development of
grass-rich tundra at the expense of lichens, bryophytes and woody
plants (e.g. Olofsson et al., 2001). Interestingly, similar results were
achieved in our approach using a relatively small number of samples.
In contrast to our hypotheses, that the oceanic-continental
gradient determines the ?-diversity of plant species, we found a
large species turnover primarily due to local topographic
heterogeneity, whereas regional conditions were of minor impor
tance. This high level of ?-diversity in alpine tundra landscapes is
thus due to topographic heterogeneity and associated differenti
ations in microclimatic conditions, soil moisture, soil types, and
snow cover (Richter, 2001).
Concluding, we related diversity patterns of vascular plants,
bryophytes, and lichens to their environmental conditions as an
example of an alpine tundra ecosystem. Facing the revealed
importance of local conditions, the explained variance is expected
to suffer from the lack of sample-specific microclimatic data.
Moreover, biotic interspecific competition was assumed to gain
importance when regarding one-square-meter plots (Gough et al.,
2000), but remained unaccounted for. Methodically, this study
emphasized the necessity to account for several determinants of
diversity and their analyses in a non-linear way, as multidimen
sional, non-linear patterns are too common in nature.
Acknowledgments The German Research Association (DFG) and Color Line
AS, Oslo, kindly supported the research in northern Norway. A
research grant to J. L?ffler was provided by the Stifterverband f?r die Deutsche Wissenschaft. The authors thank Dr. A. Blume for
field assistance, Dr. O.-D. Finch, Dr. D. Wundram, and O. R??ler
for critical discussions on the manuscript. Two anonymous
reviewers kindly improved the paper.
References Cited
AG Boden, 1996: Bodenkundliche Kartieranleitung. Stuttgart: Schweizerbart.
Austrheim, G., and Eriksson, O., 2001: Plant species diversity and
grazing in the Scandinavian mountains?Patterns and processes at different spatial scales. Ecography, 24: 683-695.
Beniston, M., 2003: Climatic change in mountain regions. A
review of possible impacts. Climatic Change, 59: 5-31.
Boudreau, S., and Payette, S., 2004: Caribou-induced changes in
species dominance of lichen woodlands: an analysis of plant remains. American Journal of Botany, 91(3): 422^29.
Braun-Blanquet, J., 1964: Pflanzensoziologie: Grundz?ge der
Vegetationskunde. Wien: Springer.
Cr?te, M., Ouellet, J.-P., and Lesage, L., 2001: Comparative effects on plants of caribou/reindeer, moose and white-tailed
deer herbivory. Arctic, 54(4): 407^417.
Dahl, E., 1956: Rondane. Mountain vegetation in south Norway and its relation to the environment. Skrifter utgitt av Det
Norske videnskaps-akademi i Oslo. I. Matematisk-naturvidens
kapelig klasse 3, Oslo.
Dahl, E., 1987: Alpine-subalpine plant communities of south
Scandinavia. Phytocoenologia, 15(4): 455-484.
De'ath, G., and Fabricius, K. E., 2000: Classification and
regression trees: a powerful yet simple technique for the analysis of complex ecological data. Ecology, 81: 3178-3192.
den Herder, M., Kyt?viita, M.-M., and Niemel?, P., 2003: Growth
of reindeer lichens and effects of reindeer grazing on ground cover vegetation in a Scots pine forest and a subarctic heathland
in Finnish Lapland. Ecography, 26: 3-12.
Diaz, H. F., Grosjean, M., and Graumlich, L., 2003: Climate
variability and change in high elevation regions: past, present and future. Climatic Change, 59: 1-4.
DNMI, 2006: Climatic data for Norway (http://www.eklima.no). Accessed 15 September 2006.
Erschbamer, B., Virtanen, R., and Nagy, L., 2003: The impact of
vertebrate grazers on vegetation in European high mountains.
In Nagy, L., Grabherr, G., K?rner, C, and Thompson, D. B. A.
(eds.), Alpine biodiversity in Europe. Ecological Studies 167.
Berlin: Springer, 379-396.
Forland, E. J., Allerup, P., Dahlstr?m, B., Elomaa, E., J?nsson, T.,
Madsen, H., Per?l?, J., Rissanen, P., Vedin, H., and Vejen, F.,
1996: Manual for operational correction of Nordic precipitation data. DNMI-Report, 24/96.
Fosaa, A. M., 2004: Biodiversity patterns of vascular plant species in mountain vegetation in the Faeroe Islands. Diversity and
Distributions, 10: 217-223.
Frisvoll, A. A., Elvebakk, A., Flatberg, K. I., and Okland, R. H.,
1995: Sjekkliste over norke mosar. vitskapleg og norsk
namneverk. Norsk institute for naturforskining (NINA) Tema
hefte, 4: 1-104.
Gough, L., Shaver, G. R., Carroll, J., Royer, D. L., and
Laundre, J. A., 2000: Vascular plant species richness in Alaskan
arctic tundra: the importance of soil pH. Journal of Ecology, 88:
54-66.
Gould, W. A., and Walker, M. D., 1999: Plant communities and
landscape diversity along a Canadian Arctic river. Journal of
Vegetation Science, 10: 537-548.
Grytnes, J. A., 2003: Species-richness patterns of vascular plants
along seven altitudinal transects in Norway. Ecography, 26:
291-300.
Heikkinen, R. K., and Neuvonen, S., 1997: Species richness of
vascular plants in the subarctic landscape of northern Finland:
modelling relationships to the environment. Biodiversity and
Conservation, 6: 1181-1201.
Hill, M. O., and Gauch, H. G., 1980: Detrended correspondence
analysis: an improved ordination technique. Vegetatio, 42:
47-58.
Holten, J. I., 2003: Altitude ranges and spatial patterns of alpine
plants in northern Europe. In Nagy, L., Grabherr, G.,
K?rner, C, and Thompson, D. B. A. (eds.), Alpine biodiversity in Europe. Ecological Studies 167. Berlin: Springer, 173-184.
Knox, R., 1989: Effects of detrending and rescaling on corre
spondence analysis: solution stability and accuracy. Vegetatio, 83: 129-136.
K?rner, C, 1995: Alpine plant diversity: a global survey and
functional interpretations. In Chapin, F. S., and K?rner, C.
380 / Arctic, Antarctic, and Alpine Research
This content downloaded from 195.78.108.199 on Sat, 14 Jun 2014 10:15:33 AMAll use subject to JSTOR Terms and Conditions
(eds.), Arctic and alpine biodiversity. Ecological Studies 113.
Berlin: Springer, 45-62.
K?rner, C, 2003: Alpine plant life: functional plant ecology of high mountain ecosystems. Berlin: Springer.
K?rner, C, 2004: Mountain biodiversity, its causes and function.
Ambio, Special Report 13: 11-17. Kovach Computing Services, 2001: Multivariate statistical pack
age MVSP 3.1 (http://www.kovcomp.com/). Accessed 28 April 2006.
Krog, H., Osthagen, H., and Tonsberg, T., 1994: Lavflora. Norske
busk- og bladlav. Oslo: Universitetsforlaget.
Leathwick, J. R., Burns, B. R., and Clarkson, B. D., 1998:
Environmental correlates of tree alpha-diversity in New Zealand
primary forests. Ecography, 21: 235-246.
Lid, J., and Lid, D. T., 1994: Norsk flora. Oslo: Det Norske Samlaget.
L?ffler, J., 2000: High mountain ecosystems and landscape
degradation in northern Norway. Mountain Research and
Development, 20: 356-363.
L?ffler, J., 2004: Degradation of high mountain ecosystems in
northern Europe. Journal of Mountain Science, 2: 97-115.
L?ffler, J., 2007: Reindeer grazing changes diversity patterns in arctic
alpine landscapes of northern Norway. Die Erde, 138: 215-233.
Lomolino, M. V., 2001: Elevation gradients of species-diversity: historical and prospective views. Global Ecology and Biogeog
raphy, 10: 9-13.
Magurran, A. E., 1988: Ecological diversity and its measurement.
London: Croom Helm.
Messerli, B., and Ives, J. D., 1997: Mountains of the world: A global
priority. New York: Parthenon.
Moen, A., 1999: National atlas of Norway: vegetation. Honefoss:
Norwegian Mapping Authority.
Molau, U., 2003: Overview: patterns in diversity. In Nagy, L.,
Grabherr, G., K?rner, C, and Thompson, D. B. A. (eds.),
Alpine biodiversity in Europe. Ecological Studies 167. Berlin:
Springer, 125-132.
Moser, D., Dullinger, S., Englisch, T., Nikifeld, H., Plutzar, C,
Sauberer, N., Zechmeister, H. G., and Grabherr, G., 2005:
Environmental determinants of vascular plant species richness
in the Austrian Alps. Journal of Biogeography, 32: 1117-1127.
Nagy, L., Grabherr, G., K?rner, C, and Thompson, D. B. A.,
2003: Alpine biodiversity in space and time: a synthesis. In
Nagy, L., Grabherr, G., K?rner, C, and Thompson, D. B. A.
(eds.), Alpine biodiversity in Europe. Ecological Studies 167.
Berlin: Springer, 453^464.
Nordhagen, R., 1936: Versuch einer Einteilung der subalpinen
alpinen Vegetation Norwegens. Bergen: Bergens Museums
Arbok, Naturvidensk, rekke 1936(7): 1-88.
Nordhagen, R., 1943: Sikilsdalen og Norges Fjellbeiter, en
plantessosiologisk monografi. Bergen: Bergens Museums Skrif
ter, 22 pp.
Olofsson, J., Kitti, H., Rautiainen, P., Stark, S., and Oksanen, L., 2001: Effects of summer grazing by reindeer on composition of
vegetation, productivity and nitrogen cycling. Ecography, 24:
13-24.
Olofsson, J., Stark, S., and Oksanen, L., 2004: Reindeer influence
on ecosystem processes in the tundra. Oikos, 105: 386-396.
Okland, R. H., 1990: Vegetation ecology: theory, methods and
applications with reference to Fennoscandia. Sommerfeltia
Supplement, 1: 1-233.
Pausas, J. G., and Austin, M. P., 2001: Patterns of plant species richness in relation to different environments: an appraisal. Journal of Vegetation Science, 12: 153-166.
Proulx, M., and Mazumder, A., 1998: Reversal of grazing impact on plant species richness in nutrient-poor vs. nutrient-rich
ecosystems. Ecology, 79: 2581-2592.
Reindriftsforvaltningen, 2005: Ressursregnskap for reindriftsn rin
gen. For reindrifts?ret 1. april 2003-31. mars 2004. Alta:
Reindriftsforvaltningen.
Richter, M., 2001: Zonal features of phytodiversity under natural
conditions and under human impact?A comparative survey.
In Barthlott, W., and Winiger, M. (eds.), Biodiversity. A
challenge for development research and policy. Berlin: Springer, 83-109.
Rosenzweig, M. L., 1995: Species diversity in space and time.
Cambridge: Cambridge University Press.
Saetersdal, M., and Birks, H. J. B., 1997: A comparative ecological
study of Norwegian mountain plants in relation to possible future climatic change. Journal of Biogeography, 24: 127-152.
S?nchez-Gonz?les, A., and L?pez-Mata, L., 2005: Plant species richness and diversity along an altitudinal gradient in the Sierra
Nevada, Mexico. Diversity and Distributions, 11: 567-575.
SCWG [Soil Classification Working Group], 1998: The Canadian
system of soil classification. Ottawa: Research Branch Agricul ture and Agri-Food, Publication 1646.
Sigmond, E., Gustavson, M., and Roberts, D., 1984: Berggrunns kart over Norge?M. 1:1.000.000. Trondheim: Norges geolo
giske undersokelse.
Stumb?ck, M., 1995: Ein computergest?tztes Modell zur Berech
nung der potentiellen Glo-balstrahlung im Mikrorelief und seine
Anwendung in S?dgr?nland. Bremen: Norden, 10: 37-46.
Systat Software Ine, 2004: SYSTAT 11 (http://www.systat.com). Accessed 13 October 2006.
Tarboton, D. G., and Luce, C. H., 1996: Utah energy balance
snow accumulation and melt model (UEB). Computer model
technical description and users guide. Utah Water Research
Laboratory and USDA Forest Service Intermountain Research
Station (http://www.engineering.usu.edu/cee/faculty/dtarb/snow/
snowrep.pdf). Accessed 15 September 2006.
ter Braak, C. J. F., 1986: Canonical correspondence analysis: a
new eigenvector technique for multivariate direct gradient
analysis. Ecology, 67: 1167-1179.
ter Braak, C. J. F., and Smilauer, P., 2004: Canoco for Windows
4.5 (http://www.canoco.com). Accessed 13 October 2006.
Thompson, L. G., 2000: Ice core evidence for climate changes in
the tropics: implications for our future. Quaternary Science
Reviews, 19: 19-35.
van der Wal, R., Bardgett, R. D., Harrison, K. A., and Stien, A., 2004: Vertebrate herbivores and ecosystem control: cascading effects of faeces on tundra ecosystems. Ecography, 27: 242-252.
Virtanen, R., Dirnb?ck, T., Dullinger, S., Grabherr, G., Pauli, H.,
Staudinger, M., and Villar, L., 2003: Patterns in plant species richness of European high mountain vegetation. In Nagy, L.,
Grabherr, G., K?rner, C, and Thompson, D. B. A. (eds.),
Alpine biodiversity in Europe. Ecological Studies 167 Berlin:
Springer, 149-172.
Walker, D. A., 2000: Hierarchical subdivision of Arctic tundra
based on vegetation response to climate, parent material and
topography. Global Change Biology, 6(Suppl. 1): 19-34.
Walker, M. D., 1995: Patterns and causes of Arctic plant
community diversity. In Chapin, F. S., and K?rner, C. (eds.), Arctic and alpine biodiversity. Ecological Studies 113. Berlin:
Springer, 3-20.
Whittaker, R. H., 1975: Communities and ecosystems. Houndmills:
Macmillan.
Whittaker, R. J., Willis, K. J., and Field, R., 2001: Scale and
species richness: towards a general, hierarchical theory of species
diversity. Journal of Biogeography, 28: 453-470.
Ms accepted June 2007
J. L?ffler and R. Pape / 381
This content downloaded from 195.78.108.199 on Sat, 14 Jun 2014 10:15:33 AMAll use subject to JSTOR Terms and Conditions