Embed Size (px)
Citation preview
Diversification into Bioenergy A market study from the perspective of SKF Master of Science Thesis in the Management and Economics of Innovation Programme FREDRIK HANSSON STAFFAN MARKLUND Department of Technology Management and Economics Division of Innovation Engineering and Management CHALMERS UNIVERSITY OF TECHNOLOGY Göteborg, Sweden, 2012 Report No. E 2012:094

ii
iii
MASTER’S THESIS E 2012:094
Diversification into Bioenergy A market study from the perspective of SKF
FREDRIK HANSSON STAFFAN MARKLUND
Tutor, Chalmers: Magnus Holmén Tutor, company: Stefan Karlsson
Department of Technology Management and Economics Division of Innovation Engineering and Management
CHALMERS UNIVERSITY OF TECHNOLOGY Göteborg, Sweden 2012
iv
Diversification into Bioenergy Fredrik Hansson, Staffan Marklund © Fredrik Hansson & Staffan Marklund, 2012 Master’s Thesis E 2012:094 Department of Technology Management and Economics Division of Innovation Engineering and Management Chalmers University of Technology SE-412 96 Göteborg, Sweden Telephone: + 46 (0)31-772 1000 Chalmers Reproservice Göteborg, Sweden 2012

v
Abstract During the last decades, because of an increasing competition and increasing pace of change, many companies are considering diversification of their business. Some diversification processes result in new profit market and some end up in failure of allocating the company’s resources. There is a lack of knowledge in how to deal with, and further improve, the evolving bioenergy market. The purpose of the report is to investigate in what aspects a supplier should consider if they want to diversify their products and services to the bioenergy market. This report aims at answer the purpose through investigating the bearing supplier, SKF. The overall research question of this thesis is how can an ecosystem analysis and market mapping be combined to describe the bioenergy market and serve as a decision base for a diversification process? This report’s theoretical framework will show that mapping of the market size integrated with an ecosystem analysis will serve as a useful decision basis for a diversification process. The theoretical framework considers value creation and value capture as a basis for innovation and the ability to find markets that fit with the company’s core competencies. The conclusion of this report is that the bioenergy market mapping should be divided into useful segments and it should primarily contain of quantitative data but also additional qualitative data. The bioenergy market should be mapped into three major segments; biofuels, biomass and waste to energy. The conclusion of the ecosystem analysis is that value that can be captured and created is primarily through increased service products and network effects. The combining of market mapping and the ecosystem analysis offer a valid strategic decision basis for the diversification process. Dependent on the investigated market, four different kinds of diversification strategies is possible: keystone strategy, market penetration strategy, low-cost strategy and differentiation strategy. These different strategy processes offers unique possibilities and challenges. The keystone strategy will focus on an innovation-based diversification. The market penetration strategy will have the challenge of immature markets and un-standardized ways of communication. The low-cost strategy will imply focus on a large market share. The differentiation strategy must be pursued and obtained through a unique market position.

vi
Acknowledgements We have received lots encouragement and guiding during the process of writing this master thesis. Everybody cannot be mentioned in this text, but there are a few persons that deserve extra notification: First and foremost, thanks to our supervisors at Chalmers and SKF.
Thank you Magnus Holmen, for guiding the process of writing a master thesis and for challenging the purpose of the thesis over and over (and over) again. We may not have seen it at that time, but we know now that is has lead to a better final product. Additional thanks for our meetings and your always so funny “non-PC” comments.
Thank you Stefan Karlsson, for giving us the chance to perform this thesis at SKF. Thank you for providing us with useful information and necessary contacts at SKF and for guiding us through the value creation process. Thanks to Chalmers University of Technology and the Department of Technology Management and Economics for providing an excellent education, through which the quality standard of the report is set. Thanks to the CBI department for setting the scope of the thesis and providing us with useful academic inputs. Thanks to SKF for providing excellent facilities to work in and for hosting the master thesis. Special regards to all the employees that has helped us with our interviews. Finally, thank you Arvind for the tremendous support and guiding through many administrative gates and problems during the way. We will always turn to you for support in critical situations. Gothenburg, November 2012
vii
TABLE OF CONTENTS 1. INTRODUCTION ....................................................................................................................... 1 1.1 RESEARCH QUESTION ................................................................................................................................ 2 1.2 DELIMITATIONS .......................................................................................................................................... 3 1.3 THESIS STRUCTURE ................................................................................................................................... 4
2. THE BIOENERGY MARKET ................................................................................................... 5 2.1 DEFINITION OF BIOENERGY ..................................................................................................................... 5 2.2 THE BIOENERGY MARKET ........................................................................................................................ 5 2.2.1 Bioenergy Market Size ................................................................................................................ 5 2.2.2 Geographical Markets ................................................................................................................. 7 2.2.3 Market Trends ................................................................................................................................ 7
2.3 TECHNOLOGIES ........................................................................................................................................... 8 2.3.1 Maturity curve of Bioenergy Technologies ..................................................................... 16
2.4 APPLICATIONS .......................................................................................................................................... 16 2.5 THE VALUE CHAIN OF BIOENERGY MARKET ...................................................................................... 21 2.6 THE STUDY COMPANY –SKF .................................................................................................................. 22 2.6.1 Product platforms ...................................................................................................................... 22
3 METHOD .................................................................................................................................... 23 3.1 RESEARCH QUESTION .............................................................................................................................. 23 3.2 VALIDITY, REPEATABILITY AND RELIABILITY .................................................................................... 25 3.3 CONSTRUCTION OF METHOD FOR MAPPING THE BIOENERGY MARKET ....................................... 25 3.4 METHOD FOR MAPPING THE BIOENERGY MARKET .......................................................................... 26 3.4.1 Part I: Setting scope and module creation ...................................................................... 27 3.4.2 Part II: Module calculation .................................................................................................... 29 3.4.3 Part III: Evaluation of Information .................................................................................... 31 3.4.4 The process of weighting ......................................................................................................... 32
3.5 MODEL FOR THE BIOENERGY MARKET POTENTIAL .......................................................................... 32 3.6 CONSTRUCTING THE ECOSYSTEMS ........................................................................................................ 33
4. THEORETICAL FRAMEWORK ............................................................................................ 34 4.1 DIVERSIFICATION ..................................................................................................................................... 34 4.2 DEFINITION OF ECOSYSTEM ................................................................................................................... 35 4.3 CONSTRUCTING AN ECOSYSTEM ........................................................................................................... 36 4.3.1 Risk and health of an ecosystem .......................................................................................... 36
4.4 VALUE CREATION AND CAPTURE ........................................................................................................... 37 4.5 DIVERSIFICATION INTO AN ECOSYSTEM .............................................................................................. 39
5. ANALYSIS ................................................................................................................................. 41 5.1 MAPPING OF THE BIOENERGY MARKET .............................................................................................. 41 5.2 THE ECOSYSTEM ....................................................................................................................................... 44 5.2.1 Health of the ecosystem ........................................................................................................... 48 5.2.2 Value creation .............................................................................................................................. 49 5.2.3 Value capture ............................................................................................................................... 50
5.3 MAPPING OF POTENTIAL DIVERSIFICATION ........................................................................................ 51 6. DISCUSSION ............................................................................................................................. 54 7. CONCLUSIONS ......................................................................................................................... 56 REFERENCES ................................................................................................................................... 58

viii
APPENDIX ........................................................................................................................................... I APPENDIX I, MARKET ......................................................................................................................................... I APPENDIX II, TECHNOLOGIES ......................................................................................................................... II APPENDIX III, INTERVIEWS ........................................................................................................................... III APPENDIX IV, ECOSYSTEM RELATIONS. ....................................................................................................... IV Eco 1, The networks of the ecosystems! ............................................................................................ IV Eco 2, Cash flows ......................................................................................................................................... IV Eco 3, Innovation relations ..................................................................................................................... IV Eco 4, Integrated relations. .................................................................................................................... IV Eco 5, The total out-‐mapped value chain. ........................................................................................ IV Example of Calculation of Variance. ................................................................................................... IV
ix
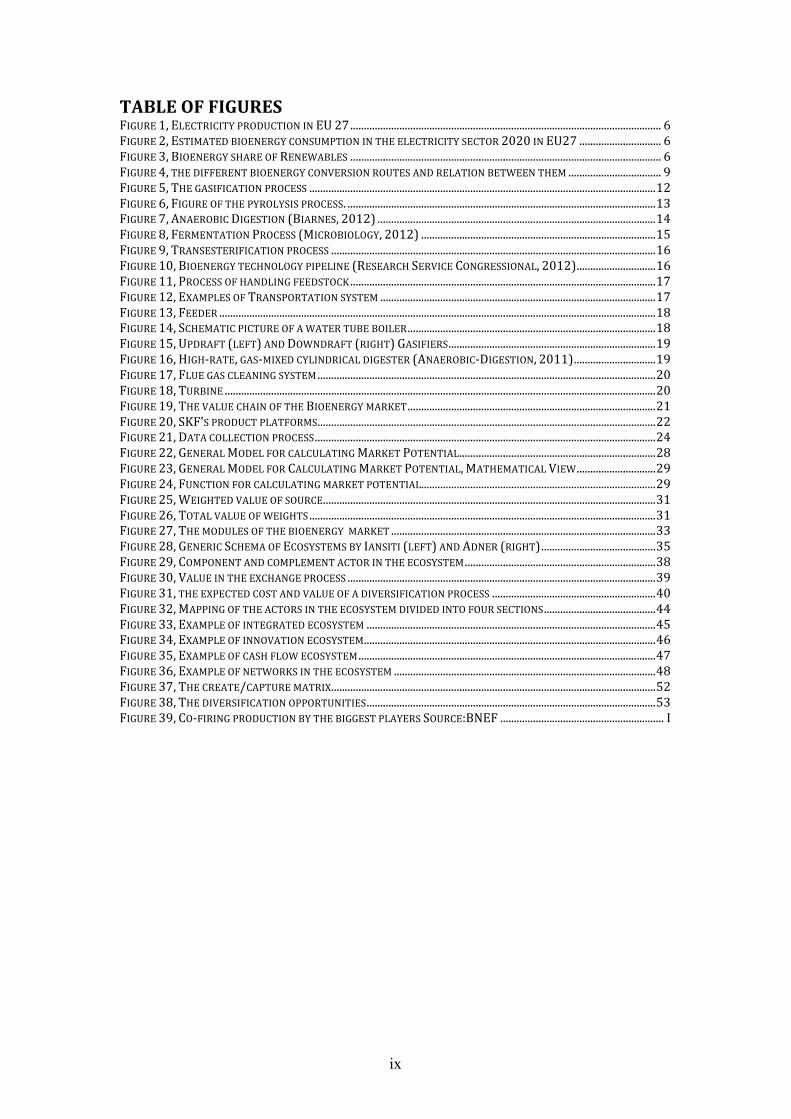
TABLE OF FIGURES FIGURE 1, ELECTRICITY PRODUCTION IN EU 27 .................................................................................................................. 6 FIGURE 2, ESTIMATED BIOENERGY CONSUMPTION IN THE ELECTRICITY SECTOR 2020 IN EU27 .............................. 6 FIGURE 3, BIOENERGY SHARE OF RENEWABLES .................................................................................................................. 6 FIGURE 4, THE DIFFERENT BIOENERGY CONVERSION ROUTES AND RELATION BETWEEN THEM .................................. 9 FIGURE 5, THE GASIFICATION PROCESS ............................................................................................................................... 12 FIGURE 6, FIGURE OF THE PYROLYSIS PROCESS. ................................................................................................................. 13 FIGURE 7, ANAEROBIC DIGESTION (BIARNES, 2012) ...................................................................................................... 14 FIGURE 8, FERMENTATION PROCESS (MICROBIOLOGY, 2012) ...................................................................................... 15 FIGURE 9, TRANSESTERIFICATION PROCESS ....................................................................................................................... 16 FIGURE 10, BIOENERGY TECHNOLOGY PIPELINE (RESEARCH SERVICE CONGRESSIONAL, 2012) ............................. 16 FIGURE 11, PROCESS OF HANDLING FEEDSTOCK ................................................................................................................ 17 FIGURE 12, EXAMPLES OF TRANSPORTATION SYSTEM ..................................................................................................... 17 FIGURE 13, FEEDER ................................................................................................................................................................ 18 FIGURE 14, SCHEMATIC PICTURE OF A WATER TUBE BOILER ........................................................................................... 18 FIGURE 15, UPDRAFT (LEFT) AND DOWNDRAFT (RIGHT) GASIFIERS ............................................................................ 19 FIGURE 16, HIGH-‐RATE, GAS-‐MIXED CYLINDRICAL DIGESTER (ANAEROBIC-‐DIGESTION, 2011) .............................. 19 FIGURE 17, FLUE GAS CLEANING SYSTEM ............................................................................................................................ 20 FIGURE 18, TURBINE .............................................................................................................................................................. 20 FIGURE 19, THE VALUE CHAIN OF THE BIOENERGY MARKET ........................................................................................... 21 FIGURE 20, SKF'S PRODUCT PLATFORMS ............................................................................................................................ 22 FIGURE 21, DATA COLLECTION PROCESS ............................................................................................................................. 24 FIGURE 22, GENERAL MODEL FOR CALCULATING MARKET POTENTIAL ........................................................................ 28 FIGURE 23, GENERAL MODEL FOR CALCULATING MARKET POTENTIAL, MATHEMATICAL VIEW ............................. 29 FIGURE 24, FUNCTION FOR CALCULATING MARKET POTENTIAL ...................................................................................... 29 FIGURE 25, WEIGHTED VALUE OF SOURCE .......................................................................................................................... 31 FIGURE 26, TOTAL VALUE OF WEIGHTS ............................................................................................................................... 31 FIGURE 27, THE MODULES OF THE BIOENERGY MARKET ................................................................................................. 33 FIGURE 28, GENERIC SCHEMA OF ECOSYSTEMS BY IANSITI (LEFT) AND ADNER (RIGHT) .......................................... 35 FIGURE 29, COMPONENT AND COMPLEMENT ACTOR IN THE ECOSYSTEM ...................................................................... 38 FIGURE 30, VALUE IN THE EXCHANGE PROCESS ................................................................................................................. 39 FIGURE 31, THE EXPECTED COST AND VALUE OF A DIVERSIFICATION PROCESS ............................................................ 40 FIGURE 32, MAPPING OF THE ACTORS IN THE ECOSYSTEM DIVIDED INTO FOUR SECTIONS ......................................... 44 FIGURE 33, EXAMPLE OF INTEGRATED ECOSYSTEM .......................................................................................................... 45 FIGURE 34, EXAMPLE OF INNOVATION ECOSYSTEM ........................................................................................................... 46 FIGURE 35, EXAMPLE OF CASH FLOW ECOSYSTEM ............................................................................................................. 47 FIGURE 36, EXAMPLE OF NETWORKS IN THE ECOSYSTEM ................................................................................................ 48 FIGURE 37, THE CREATE/CAPTURE MATRIX ....................................................................................................................... 52 FIGURE 38, THE DIVERSIFICATION OPPORTUNITIES .......................................................................................................... 53 FIGURE 39, CO-‐FIRING PRODUCTION BY THE BIGGEST PLAYERS SOURCE:BNEF ............................................................ I

x
TABLE OF TABLES TABLE 1, BIOENERGY DIVISIONS ........................................................................................................................................... 10 TABLE 2, EXAMPLE OF MODULE FOR MAPPING ................................................................................................................... 30 TABLE 3, SOURCES WITH CONTRADICITVE DATA ............................................................................................................... 30 TABLE 4, MAPPED GEOGRAPHICAL MARKETS ..................................................................................................................... 41 TABLE 5, MAPPED TECHNOLOGY MARKETS ....................................................................................................................... 42 TABLE 6, MAPPED APPLICATION MARKETS ....................................................................................................................... 42 TABLE 7, MAPPED REVENUE MARKETS .............................................................................................................................. 43 TABLE 8, MAPPED OPERATION AND MAINTANANCE ........................................................................................................ 44
1
1. Introduction The markets of renewable energy have been growing rapidly during the last decade and many companies have gained great market shares trough successful diversification and positioning strategies as more environmental-friendly companies. The renewable energy market has also shown examples of companies failing to understand the industry’s parameters, such as important actors, maturity of the market and technology drivers. Because of these parameters the renewable markets have become an uncertain market. The markets do still represent great opportunities for those companies who manage to have a successful diversification process. The renewable market consists of five major dominant energy markets; wind energy, solar energy, hydropower, geo thermal energy and bioenergy. This report will focus on the bioenergy market regarding the market’s structure and current eco-system. The bioenergy industry has been growing rapidly over the last decades. However, there are more barriers to pass for the industry to become a mature and stable market for business. One of these barriers is to make the bioenergy industry a more attractive market for companies to invest in. According to Michael Taylor, head of IRENA, renewables in general and bioenergy in specific, suffer from lack of objective and up-to-date data. This creates uncertainty of where the market is headed and lots of investments have been lost due to this cause (Taylor, 2012). The bioenergy market consists of several technologies, each one in a different technological maturity stage. Due to this fact it has, up until today, been very few providers of technology, consultancy and “total solutions”. For a company focused on technology with specific deliveries to the bioenergy market there is a lot of uncertainty. Several different technologies are still developing and which ones that will prevail as the dominant design are yet unknown (AEBIOM, 2011). During the last decades, because of an increasing competition and increasing pace of change, many companies are considering diversification of their business. Some diversification processes result in new profit markets and some end up in failure of allocating the company’s resources. A diversification can either increase the market share and the company’s strength or, if done poorly, weaken the company’s market share. There are some strategy models, such as Porter’s generic strategies and Ansoff’s product/market strategies, which are explaining the logic of diversification. These models explain the logic and the major steps in the diversification process, but they do not consider if the market is appropriate for diversification. A complete model for diversification should both consider the process of diversification as well as the attractiveness of the new market. This thesis will provide a framework for the diversification process by completing the models by Porter and Ansoff with the addition of literature regarding ecosystem and value creation and capture. As will be shown in the theoretical framework a value chain analysis or using the five forces model to analyze the differentiation opportunities is not sufficient to cover a diversification decision. Today, there is currently no model or theory explaining how a supplier organization should undertake the process and evaluate the attractiveness of the overall industry of diversification into a new industry. The overall aim of this report is to provide such a framework.

2
Industries are today complex and models like value chain or supply chain may not be sufficient enough to analyze the attractiveness of the market. Companies are looking for short return on investment periods and non-risk diversifications. From these needs, theories like value networks and innovation networks have evolved. The possibility for a dynamic capability and the possibility to innovate and capture value have been important factors for a successful diversification. Companies looking to diversify face two choices; either diversify into a known existing market or focus on blue ocean strategy and try to innovate a new market and create new market value. SKF is currently facing a diversification decision regarding the bioenergy market. SKF is a Swedish based company that is a technical and knowledge supplier regarding rotation mechanics. By 2011 the company had net sales of 66 216 MSEK and an operating margin of 14.5%, with industrial distribution as its major customer segment (29%). The energy segment, where renewables are included, represented 6 percent of the total sales. SKF has during the last years focused their attention more to the renewable energy sector. The main focal areas have been wind turbines, ocean energy and solar energy. This report is divided into two major segments and will provide a detailed model for how to make a structured decision about diversification into the bioenergy market. The first part covers a model for how to map the different divisions of the bioenergy market. The second part concerns a framework for constructing and analyzing an ecosystem. First, the research question and problem will be formulated to guide the purpose and aim of the report. Second a brief overview of the technologies and application within the bioenergy industry will be provided to serve as an empirical background for the bioenergy market mapping. Finally, an analysis regarding ecosystem and the market mapping will serve as a decision basis for the diversification process.
1.1 Research Question This master thesis will provide a framework for diversifying into the bioenergy market by using the example of SKF. The thesis will investigate how companies need to address ecosystems and market size in the decision making process of how to diversifying into the bioenergy market. The purpose of the report is to investigate how a technology provider can diversify into the bioenergy market. This report aims at answer the purpose through investigating the bearing supplier, SKF. There is an uncertainty regarding the emergence of the bioenergy market and how to consider the upcoming opportunities and risks. The area of diversification is one of the most common areas in strategic literature. The products and markets study made by Ansoff was one of the first models defining the concept of diversification (Wiltbank, 2004) (Ansoff, 1957). Studies and theories regarding value networks and ecosystem have during recent years been popular and have replaced the more simplistic literature such as Porter’s value chain (Adner, 2006) (Iansiti & Levien, 2004). The literature of diversification and ecosystem is widespread although there has been no extensive literature regarding ecosystem and the diversification into the bioenergy market. The literature written on diversification is mainly focused on agriculture diversification or government energy diversification (Curtis, 2006) (Domac, 2005). There is a lack in literature regarding
3
how a technology provider could benefit from a diversification into the bioenergy market. This thesis intends to extend the research made on the diversification into the bioenergy market by answering the research question stated below. In order to describe the diversification possibilities this thesis will elaborate on the topics of; value creation and capture, ecosystem, related diversification, innovation capabilities, component and complement actor and market mapping. The research question that should be answer by this study is; - How can an ecosystem analysis and market mapping be combined to describe the bioenergy market and serve as a decision base for a diversification process? In order to answer the research question this report will investigate both the attractiveness of the market, such as size and potential market share, trough a market mapping. It will also investigate the barriers to entry regarding the ecosystem and what the diversification possibilities are. Hence, the following three questions will be addressed; Sub question 1: How should the bioenergy market be mapped in order to describe the value of the market? The first sub question will be answered by a market mapping in chapter five. As will be seen in this chapter the mapping will consist of divisions and modules, the market size will be the total value of the mapped divisions and the value within the divisions will be calculated through the constructed method described in the method chapter and chapter five. Sub question 2: How is the ecosystem of the bioenergy market constructed? The second sub question will be addressed in chapter five. As will be seen in chapter five, the bioenergy market consists of several important ecosystems. The empirical data for constructing the ecosystem will be described in chapter two. The results of sub question two will be the basis for a diversification analysis. For the ecosystem to be more useful for a diversification process, sub question three will be addressed. Sub question 3: What value can be created and captured in the ecosystem of the bioenergy market? The third sub question will be addressed through the theoretical framework in chapter four and an ecosystem analysis in chapter five. The theoretical framework will discuss the concepts of value creation, value capture and ecosystems. In addition to this, the chapter will also entail literature regarding related diversification. The analysis of each question will serve as the foundation for the diversification analysis, presented in the last section of the analysis.
1.2 Delimitations This report will focus on the bioenergy industry, defining the industry as the operations, sales and markets for transaction. The report will have its focus on the bioenergy plant, considering in-house storage, energy conversion applications and power train applications. The report will not consider the generation of feedstock
4
material, neither the different process used for preparing the feedstock outside the plant. The report will focus on the supply and value chain conditions of the bioenergy plants and will hence not elaborate on the technical issues regarding efficiency and energy conversion. Due to the geographical conditions plant visits will be done in the authors’ areas, Gothenburg in Sweden and Newcastle in Australia. Due to the time frame of this work some figures will be estimated, creating a lack of validity in some areas of the research. Furthermore, the study will mainly reflect the situation for manufacturing companies and the results will be less applicable for other actors. As will be shown in chapter two, the bioenergy market is divided in three sub-markets; waste to energy, biomass and biofuels. This study will not elaborate thoroughly in the biofuels market due to its specific and complex nature and due to the conditions for research at the study company, SKF.
1.3 Thesis Structure The thesis is divided into seven chapters; introduction, the bioenergy market, method, theoretical framework, analysis, discussion and conclusion. The chapters within the thesis are organized as follows: The bioenergy market chapter is an introduction to the market features, technologies and application of the bioenergy industry. This is an empirical data chapter where the information is gathered from both secondary and primary data sources. The findings presented in this chapter will be empirical findings for the analysis chapter. In the method chapter the research design of the thesis is presented together with the data collection methods. Furthermore a thorough description of the process for mapping the bioenergy market outlined. This process refers to the analysis of the bioenergy market mapping in the analysis chapter. The theoretical framework aims at presenting a frame for a diversification process and ecosystem in order to create a foundation for a structured analysis. The framework will be used for the ecosystem analysis and diversification analysis. The analysis chapter has three parts. First, a mapping of the bioenergy market is outlined. The information is derived from the empirical findings in the bioenergy market chapter and the process described in the method chapter. The second part is an analysis of the ecosystem, based on the theoretical framework and the interviews regarding ecosystem and the distribution of value in the bioenergy market. The third and conclusive part describes the diversification possibilities and is based on the two initial parts of analysis and will be the foundation for a diversification decision. The discussion chapter will view the analysis from the perspective of the studied company, SKF. A discussion regarding their possibilities of a related diversification will be presented. Finally, the conclusion chapter will outline the key findings of the thesis and will answer to the research question in a structured and informative way.
5
2. The bioenergy market This chapter will present the bioenergy market, its facts and figures as well as how it is divided, both technology-wise and geographically. The chapter will also aim to explain the main technologies used and how they correlate with applications, services and business opportunities. The data present will later serve as empirical findings for the analysis of the market, the ecosystem and the diversification process. The chapter will start with definition of the industry, the difference between bioenergy, biomass and biofuels, as well as the major markets of the world. These facts will later serve as empirical structure for market calculation and mapping of the ecosystem.
2.1 Definition of Bioenergy According to the EU energy research department, bioenergy is defined as The conversion of biomass resources such as agricultural and forest residues, organic municipal waste and energy crops into useful energy carriers including heat, electricity and transport fuels. The feedstock, often named biomass, is defined by EU’s renewable energy directive (2009/28/EC) as The biodegradable fraction of products, waste and residues from biological origin from agriculture (including vegetal and animal substances), forestry and related industries including fisheries and aquaculture, as well as the biodegradable fraction of industrial and municipal waste Europe is in the midst of a dramatic energy transition, away from fossil fuels, and in some cases also from nuclear power, to renewable energy. Bioenergy is the major renewable energy source, accounting for almost 70 percent of European renewables, and showing steady growth (AEBIOM report 2011).
2.2 The Bioenergy Market The bioenergy market consists of several different divisions and technologies, described in Table 1. The figures and numbers presented in this report are presented to align with the report’s definition of divisions and technologies.
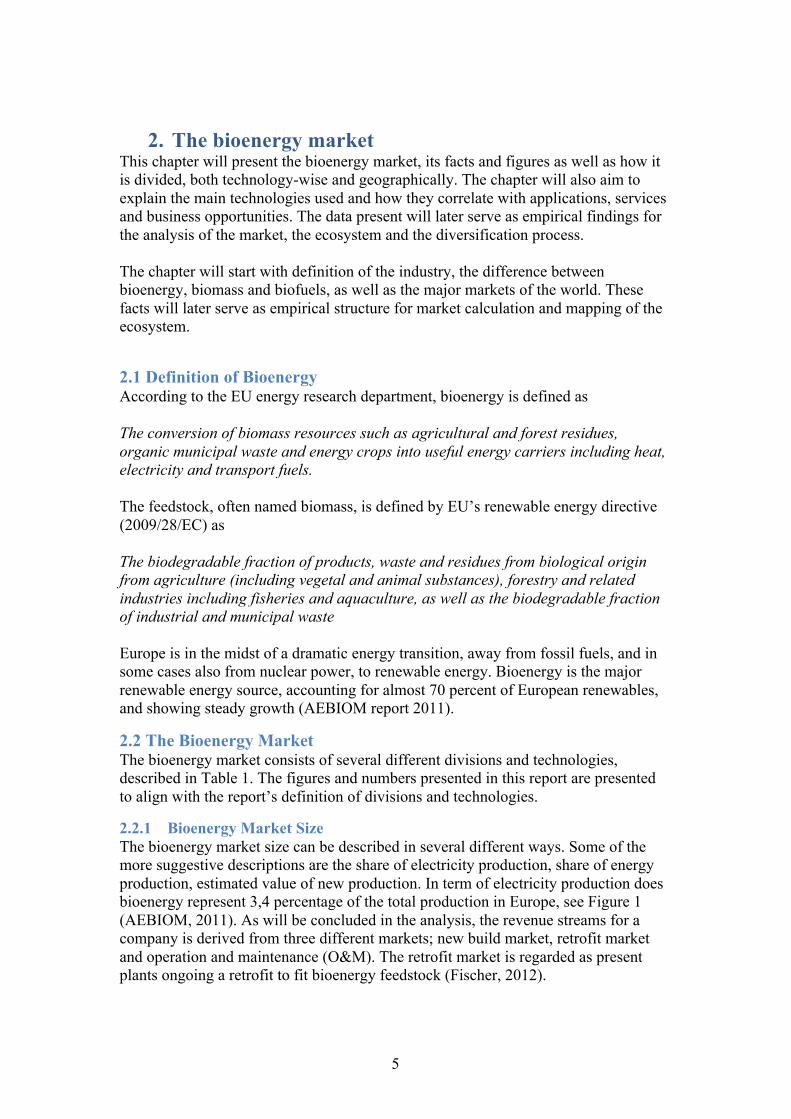
2.2.1 Bioenergy Market Size The bioenergy market size can be described in several different ways. Some of the more suggestive descriptions are the share of electricity production, share of energy production, estimated value of new production. In term of electricity production does bioenergy represent 3,4 percentage of the total production in Europe, see Figure 1 (AEBIOM, 2011). As will be concluded in the analysis, the revenue streams for a company is derived from three different markets; new build market, retrofit market and operation and maintenance (O&M). The retrofit market is regarded as present plants ongoing a retrofit to fit bioenergy feedstock (Fischer, 2012).

6
Figure 1, Electricity production in EU 27
The estimated growth of the industry is mainly driven by the 20-2020 goals (Langue, 2012). In 2020 bioenergy is estimated to stand for 6,5 percent of the total electricity production or 93 percent growth from the current share. This represents an annual estimated growth rate of 7%.
Figure 2, Estimated bioenergy consumption in the electricity sector 2020 in EU27
The total energy production share of bioenergy is much higher than the electricity production. In 2010, bioenergy represent 10 percent of the total energy production in Europe. The main reason for this is heat production, which is a major part of the bioenergy production. Bioenergy stand for 69 percent of the total energy production from renewable energy in Europe (AEBIOM, 2011) (Langue, 2012), see Figure 3.
Figure 3, Bioenergy share of Renewables
Biomass and Waste
69% Solar 2%
Geothermal 4%
Hydro Power 18%
Wind Energy 7%
7
The development of bioenergy technology and efficiency process has stagnated and the cost of production of bioenergy has levelled during the last years (Rybczynska, 2012). There are no longer any significant cost reductions in the major technologies. Because of the maturity of the technologies within the bioenergy industry, much focus has recently been put upon the supply chain system (Taluchi, 2012) (Rybczynska, 2012). The challenges with the supply chain have many of its routes within the properties of the biomass feedstock. The energy density of biomass feedstock is in general much lower than for example coal. Coal has an energy density of 22Gj/ton versus biomass with an average of 5Gj/ton. This has implications for the entire bioenergy market structure. The lower energy density sets limitations in form of the price of transportation is higher compared too many of the non-renewable feedstock alternatives. Furthermore this requires pretreatment of the feedstock and in some ways geographical limitations with more local production in smaller power plants (Sandrup, 2012).
2.2.2 Geographical Markets The spread and penetration of different technologies and divisions are dependent on the geographical location. Europe is considered as the major market for the biomass division. The intensity of biomass to power plants in Europe has its route in the feedstock capabilities in Europe. There are, for instance, large areas of forest industries in northern Europe and large areas of agriculture industries in central Europe (Sandrup, 2012) (Rybczynska, 2012). Germany and United Kingdom are the major growing markets in Europe. Their investments recall for almost half of all the investments made in Europe during the last six years within biomass and waste to energy. UK has especially large ambitions due to an upcoming close down of main parts of coal plants until 2015. This will imply conversions of coal plants to biomass plants, rebuilds to co-firing plants and new builds of biomass plants. According to NNFCC might bioenergy employ 50,000 people in UK by 2020 (Bioenergy Insight, 2012). Sweden and Finland are big markets in northern Europe. They are, however, well established and mature markets. The growth rate in Sweden is lower than many other countries in Europe (AEBIOM, 2011). US and Brazil are the major market and drivers for the biofuel division. These two countries were responsible for 87% of total production of biofuels in 2011 (RFA, 2012). China and India are becoming important geographical upcoming markets. Both China and India has a large amount of bioenergy plants, with most of the plants scaled as small or medium size (Rybczynska, 2012).
2.2.3 Market Trends Some general trends for the bioenergy market have been identified. Firstly, there are indications that the bioenergy new built projects tend to get bigger. The number of announced new built of small plants are decreasing (Hostert, 2012). However, Metso Power, Areva and IMS are indicating that the demand for small complete biomass plants in some parts of Europe is increasing (Fischer, 2012). Secondly, during the last years there has been a need to convert coal plants into bioenergy plants. The process

8
of change is fast and usually takes less than twelve months. The output capacity of the bioenergy plant is however substantially lower than for the original coal plant (Hostert, 2012). As mentioned earlier the supply of feedstock is a major challenge for the bioenergy industry. The biggest hinder for the trend of increased size is the transportation costs of biomass feedstock. Many of the major plant builders agrees that the biggest problem they will face for the development of the bioenergy is to find enough sustainable biomass supply routes (Bioenergy Insight, 2012).
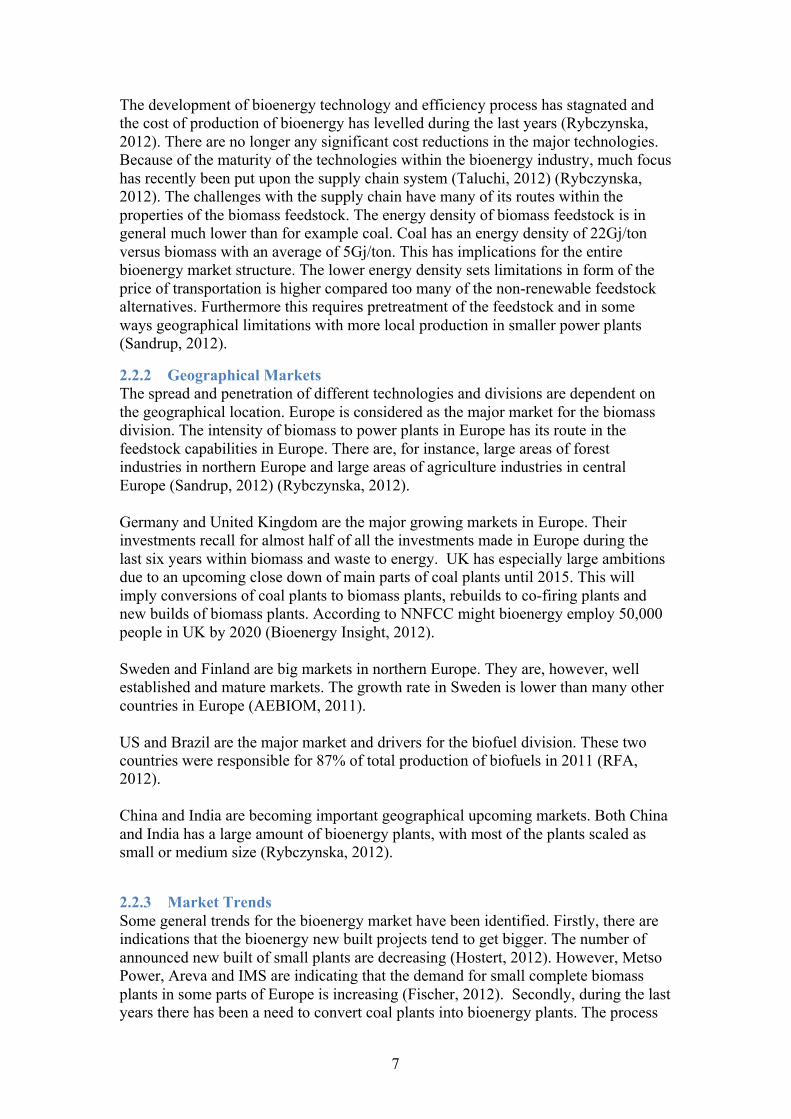
2.3 Technologies In this chapter we present the different technologies and their potential as a bioenergy renewable technology. Firstly the basic principles behind the technologies will be presented, followed by an overview of the actual technologies and finally a mapping of the major applications within the technologies. The technologies will serve as a background for understanding how the market and the ecosystems are built up. There are three different definitions that are commonly misunderstood that explain conversion of biomass feedstock in different ways. Co-firing is the combination of more than one type of feedstock. Most often referred to as combustion of biomass and coal in a coal plant. Co-generation or CHP (Combined Heat and Power) is the process in a plant where both electricity and heat is extracted and used as energy sources. Combined Cycle is the combination of both a gas and steam turbine. The gas-fired turbine generator produces primary power. The steam turbine is driven by the waste heat to produce secondary power (Guru, 2008) (Zafar, 2012). Bioenergy Conversion Routes In Figure 4, the major conversion routes within the bioenergy industry are described. There are several routes of interest, where the combustion route is the most common technology. The different routes could be logically grouped in several different ways. The grouping after feedstock, technology process and final product represent a simplified but informative image of the complex bioenergy industry. In this report the technologies will be presented separately and then the major application within a general bioenergy plant will be explained. A presentation of how the different divisions, technologies and applications are related can be seen in Table 1, Bioenergy divisions.
9
Figure 4, the different bioenergy conversion routes and relation between them
Bioenergy divisions In order to understand the bioenergy market it is first important to understand that the market consist of three sub markets, called bioenergy division. The divisions will give indications for both what feedstock that is used and what criterions there are for the different types of conversion technology. The three divisions are Biomass, Waste to Energy and Biofuels. The Biomass division includes solid biomass that is converted through a thermo chemical process to produce heat and electricity. The Waste to Energy division is using organic waste and manure as feedstock, uses several different conversion technologies and can either have biofuels or heat and electricity as the end product. Biofuels, can have several different feedstock but the end result is always a biofuel; biogas, biodiesel or ethanol.

10
Table 1, Bioenergy divisions
Thermochemical and Biochemical conversion The different technologies within the bioenergy section can be divided into two segments; either a biochemical process or a thermochemical process. The thermochemical conversion technologies consist of combustion, gasification, pyrolysis and co-firing. The biochemical conversion technologies consist of anaerobic digestion, fermentation and transesterification (Biomass-Energy-Center, 2011). The thermochemical technologies are mechanical intensive and the biochemical technologies are more based on chemistry. After the review of the technologies, this report will mainly focus on the thermochemical technologies, hence these have a more substantial connection to the study company’s, SKF’s, current business. Thermochemical conversion technologies Combustion/Incineration Combustion is a thermochemical process, refereeing to rapid oxidation of feedstock places in a combustion chamber. Combustion can either use fossil fuels, such as coal or coke, or biofuels (biomass), such as wood or charcoal, as feedstock. Bioenergy combustion, on an industrial scale, can use many different types of feedstock, including wood, charcoal agricultural residues, municipal waste. The end result of the conversion process can be hot air, hot water, steam and finally electricity. Combustion technology is present in the waste to energy and the biomass division. In the chamber the biomass is exposed to heat to get rid of water. When all the water has been removed the pyrolysis process begins, turning the biomass in to char. The char is then, in presence of oxygen, oxidized, a process referred to as flaming combustion. If the combustion is completed the char will turn in to heat, water and
Mapping
14
Technologies Bioenergy divisions
Waste to energy Biomass Biofuels
Feedstock Organic waste
Manure Pellets Wood Straw
Oil crops Sugar
Starch plants Cereals
Technologies Incineration Gasification
Pyrolysis Anaerobic digestion
Fermentation
Pyrolysis Gasification Combustion (Co-firing)
Fermentation Transesterfication
Hydrolysis Gasification
Energy Provided Vapor Heat
Electricity Biogas
(Ethanol)
Vapor Heat
Electricity
Liquid biofuels Biogas
Biodiesel
11
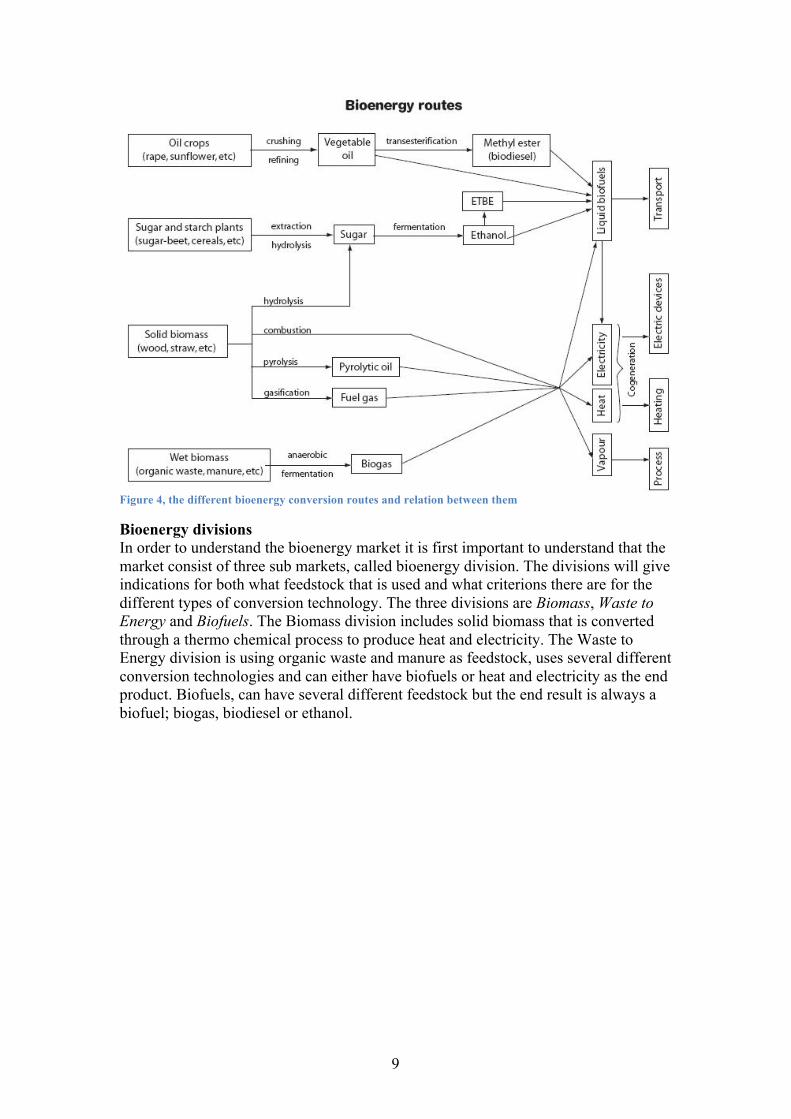
carbon dioxide. As long as every surface of the feedstock gets in contact with oxygen will the combustion be complete (Prabhu, 2012). Biomass combustion can normally produce up to 25 percent electricity from a steam turbine. However, by using a combined heat and power cycle (CHP or cogeneration) the system efficiency can be up to 80 percent. That is, 80 percent of the potential energy from the feedstock is converted into useful energy, electricity and heat (Guru, 2008).
Figure 7, Combustion chamber (Kujus, 2012)
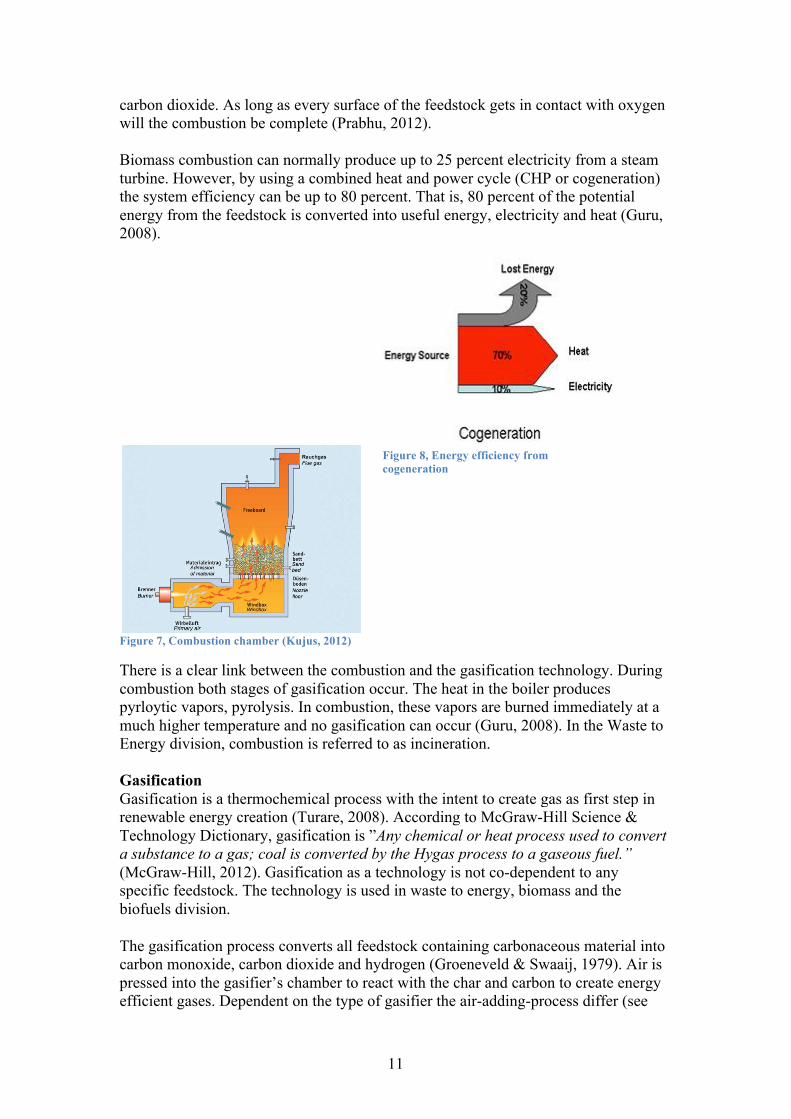
There is a clear link between the combustion and the gasification technology. During combustion both stages of gasification occur. The heat in the boiler produces pyrloytic vapors, pyrolysis. In combustion, these vapors are burned immediately at a much higher temperature and no gasification can occur (Guru, 2008). In the Waste to Energy division, combustion is referred to as incineration. Gasification Gasification is a thermochemical process with the intent to create gas as first step in renewable energy creation (Turare, 2008). According to McGraw-Hill Science & Technology Dictionary, gasification is ”Any chemical or heat process used to convert a substance to a gas; coal is converted by the Hygas process to a gaseous fuel.” (McGraw-Hill, 2012). Gasification as a technology is not co-dependent to any specific feedstock. The technology is used in waste to energy, biomass and the biofuels division. The gasification process converts all feedstock containing carbonaceous material into carbon monoxide, carbon dioxide and hydrogen (Groeneveld & Swaaij, 1979). Air is pressed into the gasifier’s chamber to react with the char and carbon to create energy efficient gases. Dependent on the type of gasifier the air-adding-process differ (see
Figure 8, Energy efficiency from cogeneration

12
applications, gasifier). The mix of gases is called syngas and can be used to create either methanol or synthetic fuel but can also be burnt directly in gas engines. The possibilities of the products from gasification are one of its advantages. The technology has been used for almost 200 years and due to shortage of resources during the World War II it reoccurred in the automotive sector as a primary source of energy (Rajvanshi, 1986).
Figure 5, The gasification process
There are many new gasification technologies emerging (see Figure 10, Bioenergy technology pipeline). Atmospheric biomass gasification and pressurized gasification are both in the development and demonstration stage. New research has also been made on integrated biomass gasification fuel cell mostly to decrease the cost of small scale plants that has been proven to be economically inefficient (Wade, 1998) Pyrolysis Pyrolysis is, as well as combustion and gasification, a thermochemical process. The name is derived from greek where pyro means fire and lysis separate (wiki). The definition of the pyrolysis process is a thermo-chemical decomposition process in which organic material is converted into a carbon-rich solid and volatile matter by heating in the absence of oxygen. The process can either be done as fast or slow dependent on the added heat and the mixture of feedstock and char (Brownsort, 2009). Pyrolysis is used as a technology in both waste to energy and the biomass division of the bioenergy market. The feedstock is therefore either waste or solid such as, sprout, willows or other regional wood. The Pyrolysis process starts with a feedstock and with applied heat a result of char, liquid and gas can be used for creating energy. The liquid is often called pyrolytic oil (or pyrolysis oil) and has many useful entities for the production of energy. The residue, char, is of high carbon content and some time has as much as 50% of the original feedstock’s carbon content. The resulting gas combination is named syngas and can be used for energy conversion (Brownsort, 2009). Pyrolysis, as a chemical process, has been used for retaining charcoal for more than 30000 years. The process has later evolved into use as a renewable energy technology (Brownsort, 2009). The technology has reached deployment stage, as can be seen in Figure 10.

13
Figure 6, Figure of the pyrolysis process.
Co-Firing Co-firing is a combustion process using a combination of feedstock. Co-firing of biomass as secondary fuel in a coal-burning power plants is the most common co-firing process. By using the combination of biomass and coal the emissions can be reduced (Guru, 2008). There are several limitations to how much biomass that can be used in co-firing. 1-5 percent biomass works for all coal plants without any modifications of the conversion process. Low-fraction co-firing (~5 percent) appears to cause no noticeable problems with the equipment. In some cases up to 10 percent without any improvements have been reported (Ciolkosz, 2010). The first problem that occurs when increasing the amount of biomass used is, according to Anthony Callen at Wales Point, that the size of the wood chips after the mill is too big. Today the wood fibers go through the same mills as the coal. The coal is grained from 50mm to 200micrometer in the mills, while the wood is still big and in form of fibers. At Wales point they have 6 *2 mills and by replacing one of them to a biomass grinder. Callen (2012) thinks that they could use up to 20% biomass. To obtain this level, a new separate feeder track would also need to be built (Callen, 2012). One other problem with using biomass as feedstock is that the ash from biomass is different from coal. Coal has much higher ash content than biomass but the biomass ash is forming “slagging” products within the boiler. Conventional combustion equipment is not designed for burning biomass. Therefore modification of the boiler might be needed when using higher percentage of biomass. This is a problem for high percentage of biomass (30 percent or higher) (Guru, 2008). Other technical issues that hinder the percentage of biomass is:
• Complete combustion and well mixing in boiler • Fouling and corrosion of the boiler (alkalis, chlorine) • Ash utilization (un-burnt carbon, contamination) • Negative impact on flue gas cleaning (SCR DeNO )
One way of increasing the percentage of biomass is by torrefraction, a mild version of pyrolysis. This method might change how much biomass they can feed into the mills at Wales Point, but they don’t know anything about this right now, but they are
14
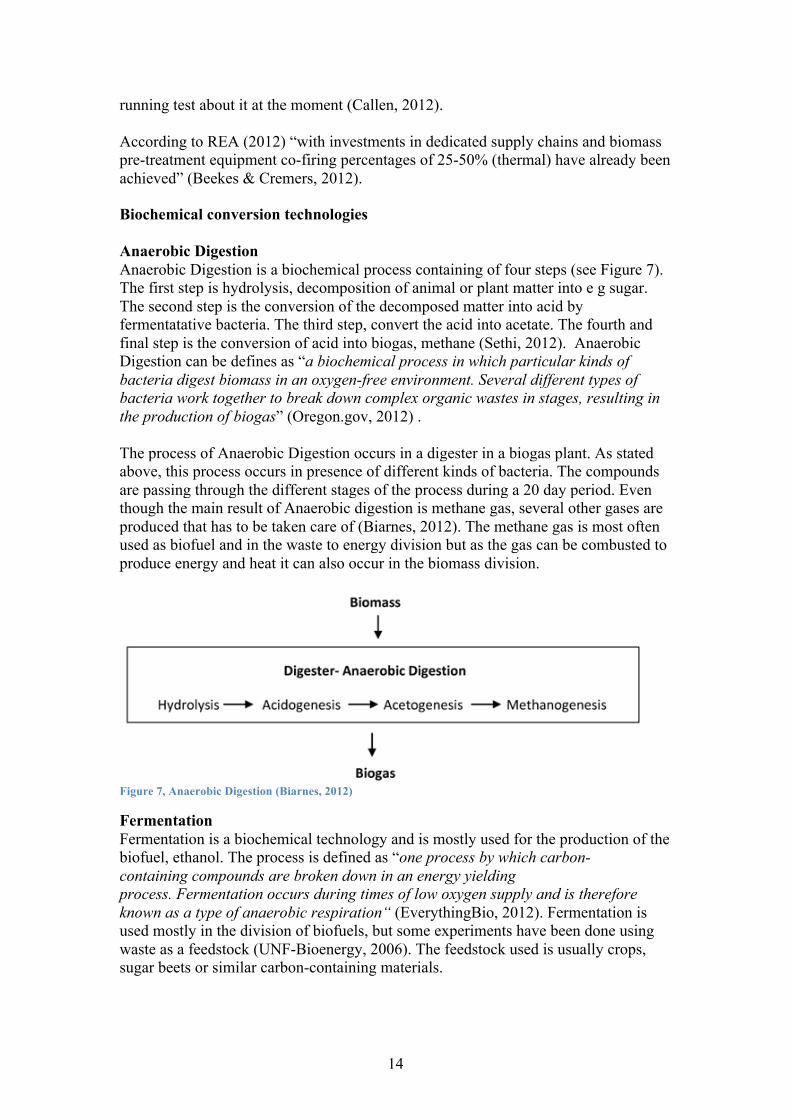
running test about it at the moment (Callen, 2012). According to REA (2012) “with investments in dedicated supply chains and biomass pre-treatment equipment co-firing percentages of 25-50% (thermal) have already been achieved” (Beekes & Cremers, 2012). Biochemical conversion technologies Anaerobic Digestion Anaerobic Digestion is a biochemical process containing of four steps (see Figure 7). The first step is hydrolysis, decomposition of animal or plant matter into e g sugar. The second step is the conversion of the decomposed matter into acid by fermentatative bacteria. The third step, convert the acid into acetate. The fourth and final step is the conversion of acid into biogas, methane (Sethi, 2012). Anaerobic Digestion can be defines as “a biochemical process in which particular kinds of bacteria digest biomass in an oxygen-free environment. Several different types of bacteria work together to break down complex organic wastes in stages, resulting in the production of biogas” (Oregon.gov, 2012) . The process of Anaerobic Digestion occurs in a digester in a biogas plant. As stated above, this process occurs in presence of different kinds of bacteria. The compounds are passing through the different stages of the process during a 20 day period. Even though the main result of Anaerobic digestion is methane gas, several other gases are produced that has to be taken care of (Biarnes, 2012). The methane gas is most often used as biofuel and in the waste to energy division but as the gas can be combusted to produce energy and heat it can also occur in the biomass division.
Figure 7, Anaerobic Digestion (Biarnes, 2012)
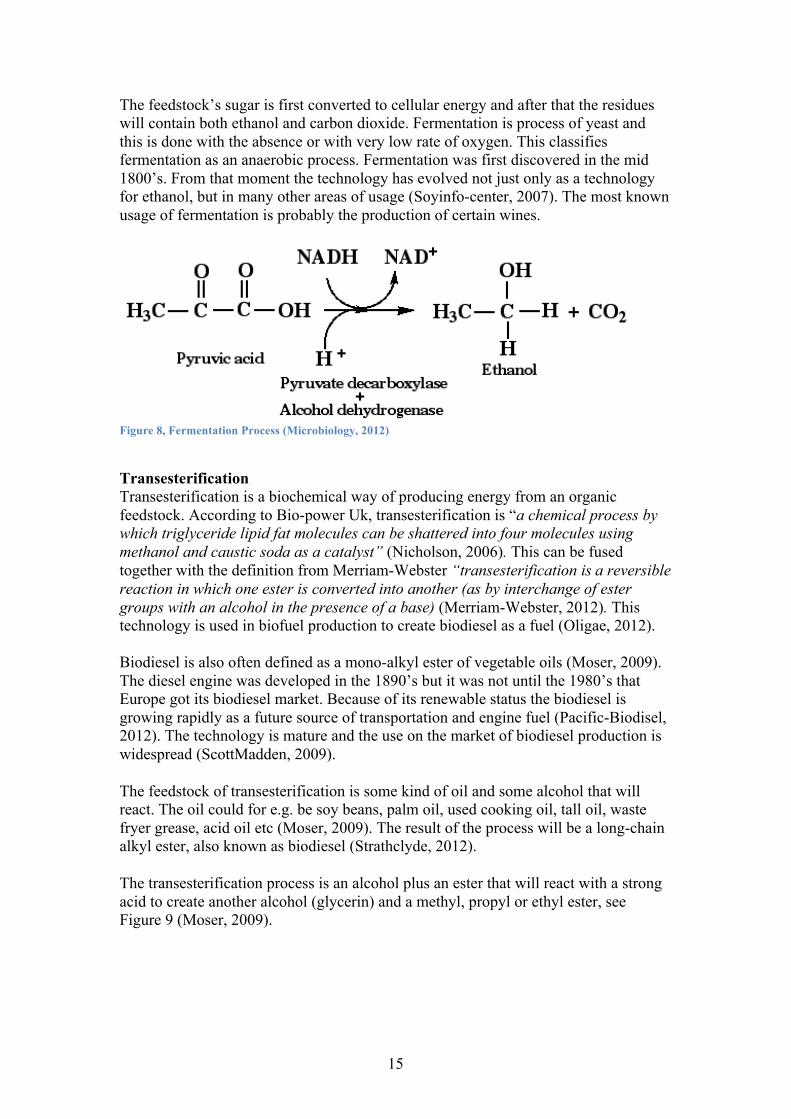
Fermentation Fermentation is a biochemical technology and is mostly used for the production of the biofuel, ethanol. The process is defined as “one process by which carbon-containing compounds are broken down in an energy yielding process. Fermentation occurs during times of low oxygen supply and is therefore known as a type of anaerobic respiration“ (EverythingBio, 2012). Fermentation is used mostly in the division of biofuels, but some experiments have been done using waste as a feedstock (UNF-Bioenergy, 2006). The feedstock used is usually crops, sugar beets or similar carbon-containing materials.
15
The feedstock’s sugar is first converted to cellular energy and after that the residues will contain both ethanol and carbon dioxide. Fermentation is process of yeast and this is done with the absence or with very low rate of oxygen. This classifies fermentation as an anaerobic process. Fermentation was first discovered in the mid 1800’s. From that moment the technology has evolved not just only as a technology for ethanol, but in many other areas of usage (Soyinfo-center, 2007). The most known usage of fermentation is probably the production of certain wines.
Figure 8, Fermentation Process (Microbiology, 2012)
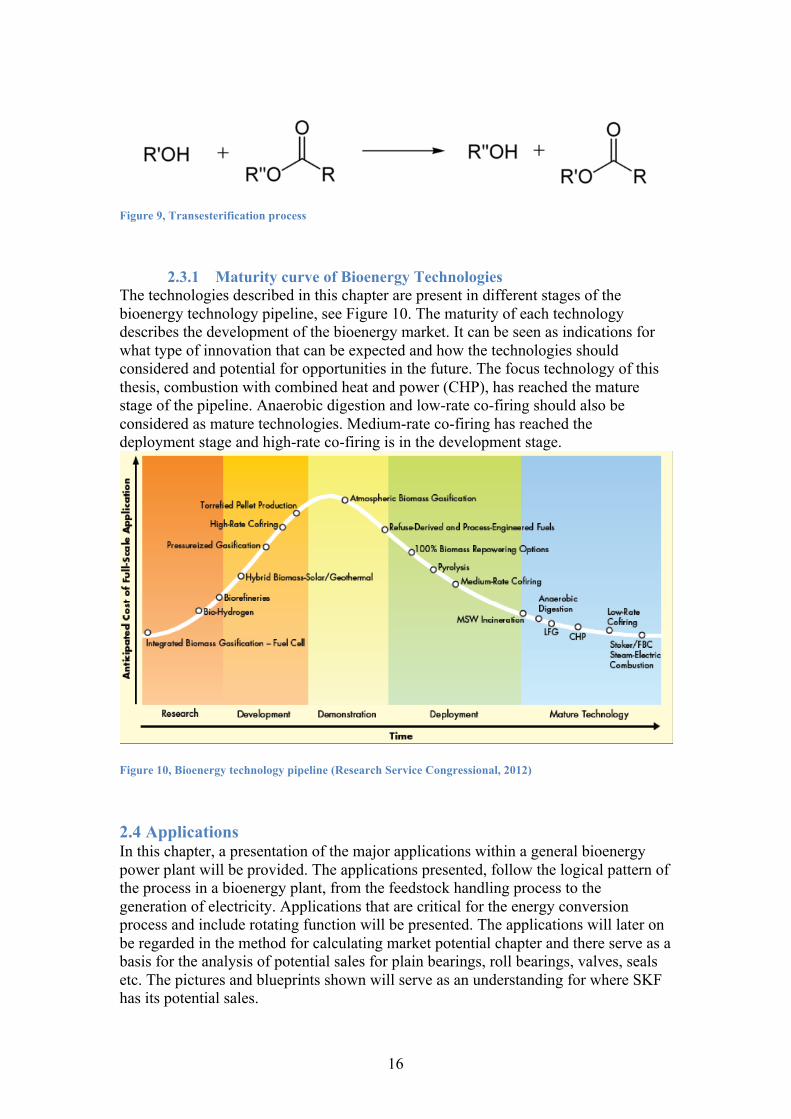
Transesterification Transesterification is a biochemical way of producing energy from an organic feedstock. According to Bio-power Uk, transesterification is “a chemical process by which triglyceride lipid fat molecules can be shattered into four molecules using methanol and caustic soda as a catalyst” (Nicholson, 2006). This can be fused together with the definition from Merriam-Webster “transesterification is a reversible reaction in which one ester is converted into another (as by interchange of ester groups with an alcohol in the presence of a base) (Merriam-Webster, 2012). This technology is used in biofuel production to create biodiesel as a fuel (Oligae, 2012). Biodiesel is also often defined as a mono-alkyl ester of vegetable oils (Moser, 2009). The diesel engine was developed in the 1890’s but it was not until the 1980’s that Europe got its biodiesel market. Because of its renewable status the biodiesel is growing rapidly as a future source of transportation and engine fuel (Pacific-Biodisel, 2012). The technology is mature and the use on the market of biodiesel production is widespread (ScottMadden, 2009). The feedstock of transesterification is some kind of oil and some alcohol that will react. The oil could for e.g. be soy beans, palm oil, used cooking oil, tall oil, waste fryer grease, acid oil etc (Moser, 2009). The result of the process will be a long-chain alkyl ester, also known as biodiesel (Strathclyde, 2012). The transesterification process is an alcohol plus an ester that will react with a strong acid to create another alcohol (glycerin) and a methyl, propyl or ethyl ester, see Figure 9 (Moser, 2009).
16
Figure 9, Transesterification process
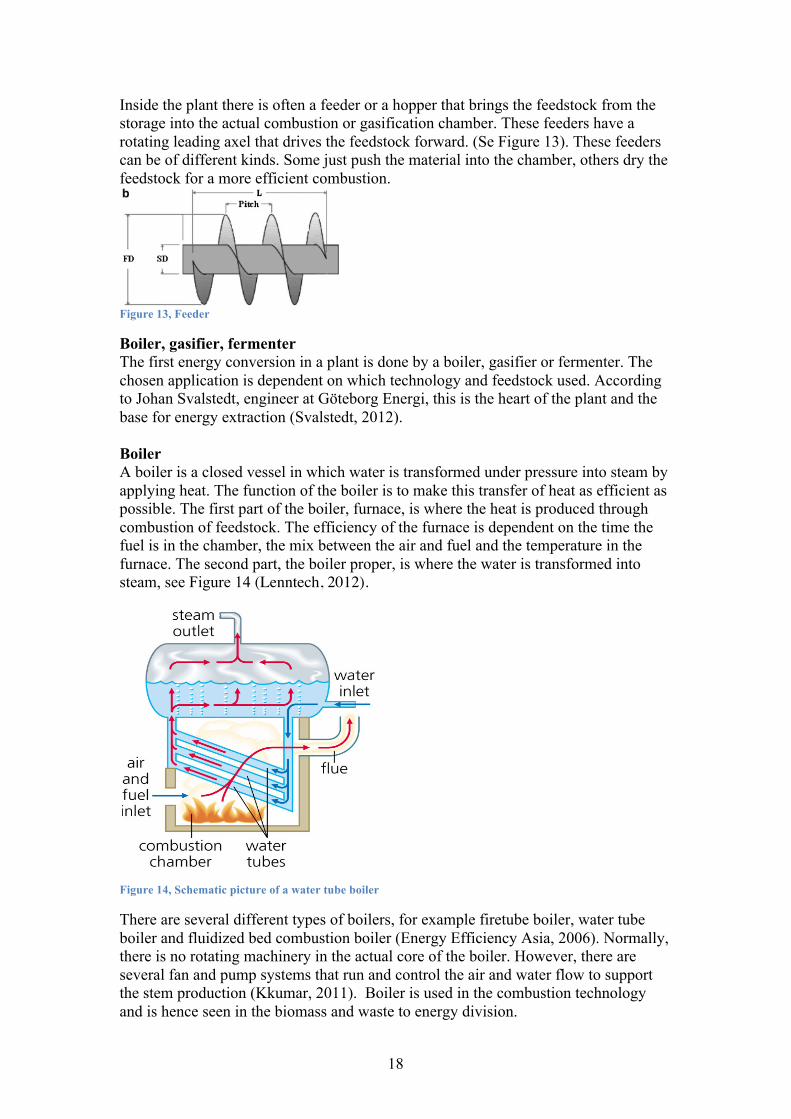
2.3.1 Maturity curve of Bioenergy Technologies The technologies described in this chapter are present in different stages of the bioenergy technology pipeline, see Figure 10. The maturity of each technology describes the development of the bioenergy market. It can be seen as indications for what type of innovation that can be expected and how the technologies should considered and potential for opportunities in the future. The focus technology of this thesis, combustion with combined heat and power (CHP), has reached the mature stage of the pipeline. Anaerobic digestion and low-rate co-firing should also be considered as mature technologies. Medium-rate co-firing has reached the deployment stage and high-rate co-firing is in the development stage.
Figure 10, Bioenergy technology pipeline (Research Service Congressional, 2012)
2.4 Applications In this chapter, a presentation of the major applications within a general bioenergy power plant will be provided. The applications presented, follow the logical pattern of the process in a bioenergy plant, from the feedstock handling process to the generation of electricity. Applications that are critical for the energy conversion process and include rotating function will be presented. The applications will later on be regarded in the method for calculating market potential chapter and there serve as a basis for the analysis of potential sales for plain bearings, roll bearings, valves, seals etc. The pictures and blueprints shown will serve as an understanding for where SKF has its potential sales.

17
Feedstock handling systems Before most bioenergy conversion process, all feedstock is milled, divided and distributed to create a more efficient bioenergy process. Sometimes these mills and stations appear at the sight of the bioenergy plant and sometimes they appear before for example at a material recycling facility (MRF). In some cases the feedstock is too large for the boiler or gasifier and the plant need to crush and refine the, in other cases the feedstock is delivered ready for direct combustion. A typical process of handling feedstock is shown in the Figure 11 below. This process is divided in seven steps with feeder, pulper, separator, storage tanks and cleaners as examples of applications involved in the process. These processes differ a lot, because of the different varieties of the feedstock and its quality to direct conversion (Cellwood, 2012).
Figure 11, Process of handling feedstock
Feedstock transportation systems After processing the feedstock it will be transported into the main part of the plant. These transportation systems can range from a few meters up to a couple of hundred. These transportation systems often have a built in fire-safety system with a fire wall in case the feedstock ignite (Svalstedt, 2012). An example of these types of transportation systems can be seen in Figure 12. These systems contain rotating parts and it is of great interest that these systems work and that the belt does not drift and get stuck. At the Sävenäs plant in Gothenburg they can store up to 24 hours of feedstock in the plant, if the transportation belt drift or get stuck they must stop the feedstock transportation for at least two hours. It is therefor important to have as maintenance free system as possible. (Svalstedt, 2012)
Figure 12, Examples of Transportation system
18
Inside the plant there is often a feeder or a hopper that brings the feedstock from the storage into the actual combustion or gasification chamber. These feeders have a rotating leading axel that drives the feedstock forward. (Se Figure 13). These feeders can be of different kinds. Some just push the material into the chamber, others dry the feedstock for a more efficient combustion.
Figure 13, Feeder
Boiler, gasifier, fermenter The first energy conversion in a plant is done by a boiler, gasifier or fermenter. The chosen application is dependent on which technology and feedstock used. According to Johan Svalstedt, engineer at Göteborg Energi, this is the heart of the plant and the base for energy extraction (Svalstedt, 2012). Boiler A boiler is a closed vessel in which water is transformed under pressure into steam by applying heat. The function of the boiler is to make this transfer of heat as efficient as possible. The first part of the boiler, furnace, is where the heat is produced through combustion of feedstock. The efficiency of the furnace is dependent on the time the fuel is in the chamber, the mix between the air and fuel and the temperature in the furnace. The second part, the boiler proper, is where the water is transformed into steam, see Figure 14 (Lenntech, 2012).
Figure 14, Schematic picture of a water tube boiler
There are several different types of boilers, for example firetube boiler, water tube boiler and fluidized bed combustion boiler (Energy Efficiency Asia, 2006). Normally, there is no rotating machinery in the actual core of the boiler. However, there are several fan and pump systems that run and control the air and water flow to support the stem production (Kkumar, 2011). Boiler is used in the combustion technology and is hence seen in the biomass and waste to energy division.
19
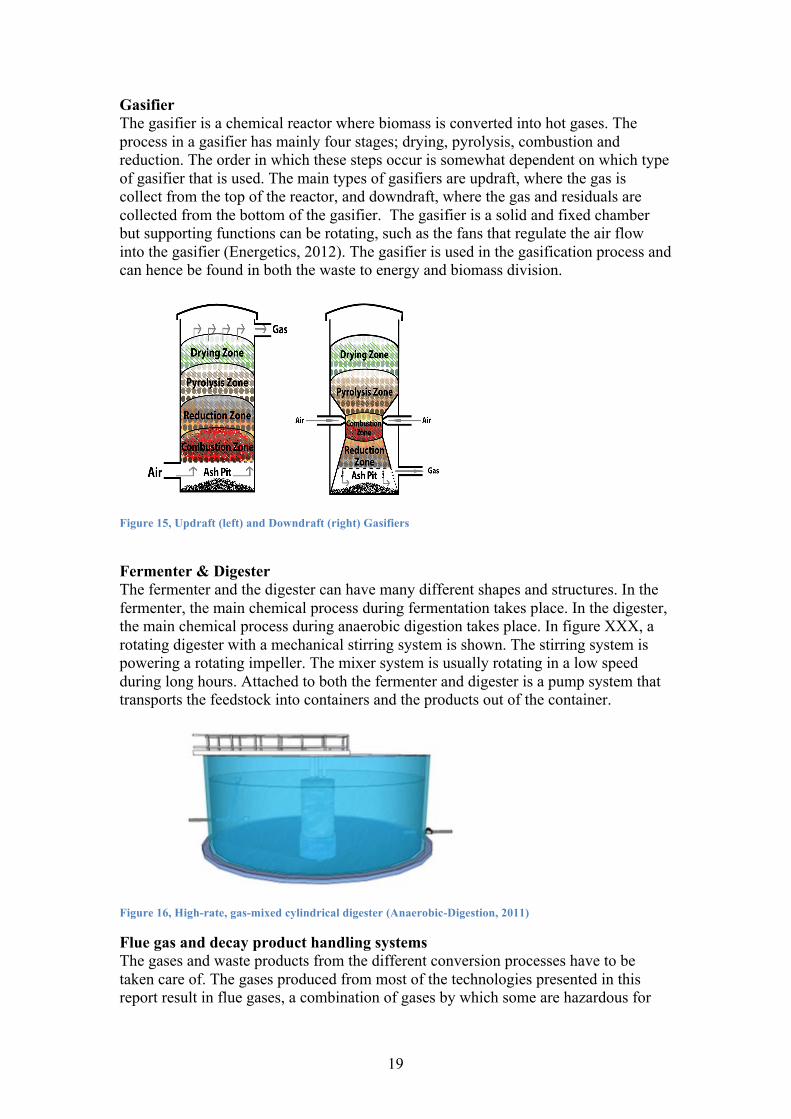
Gasifier The gasifier is a chemical reactor where biomass is converted into hot gases. The process in a gasifier has mainly four stages; drying, pyrolysis, combustion and reduction. The order in which these steps occur is somewhat dependent on which type of gasifier that is used. The main types of gasifiers are updraft, where the gas is collect from the top of the reactor, and downdraft, where the gas and residuals are collected from the bottom of the gasifier. The gasifier is a solid and fixed chamber but supporting functions can be rotating, such as the fans that regulate the air flow into the gasifier (Energetics, 2012). The gasifier is used in the gasification process and can hence be found in both the waste to energy and biomass division.
Figure 15, Updraft (left) and Downdraft (right) Gasifiers
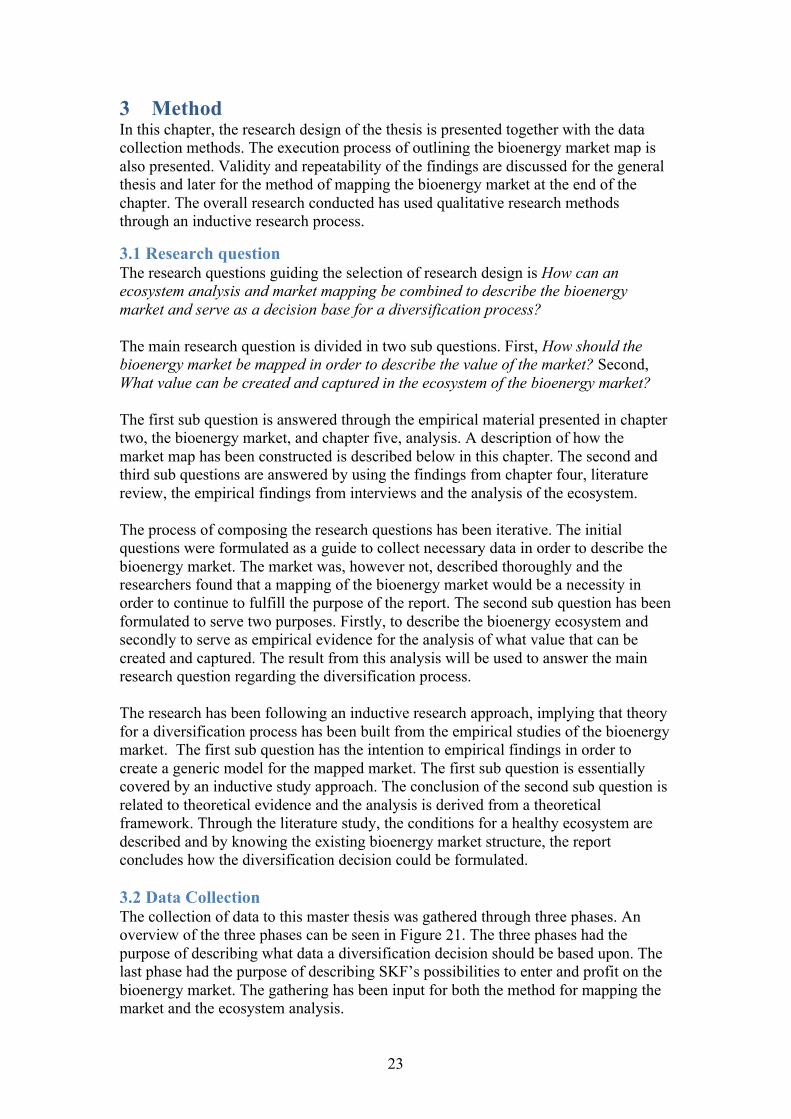
Fermenter & Digester The fermenter and the digester can have many different shapes and structures. In the fermenter, the main chemical process during fermentation takes place. In the digester, the main chemical process during anaerobic digestion takes place. In figure XXX, a rotating digester with a mechanical stirring system is shown. The stirring system is powering a rotating impeller. The mixer system is usually rotating in a low speed during long hours. Attached to both the fermenter and digester is a pump system that transports the feedstock into containers and the products out of the container.
Figure 16, High-rate, gas-mixed cylindrical digester (Anaerobic-Digestion, 2011)
Flue gas and decay product handling systems The gases and waste products from the different conversion processes have to be taken care of. The gases produced from most of the technologies presented in this report result in flue gases, a combination of gases by which some are hazardous for

20
the environment. The flue gas cleaning system presented in Figure 17 consist of a scrubber (red), a filter system often in form of a electrostatic precipitator (yellow), a sorbent bunker (blue) and a chimney (grey). Some types of filter system work as a vacuum cleaner and create an air flow that separates the ash and other solid material from the flue gas (BIOS, 2012). Other applications that can be included in the gas cleaning process are cyclone, gas cooler, ceramic filter, bag filter, compressor and shift reactor. The liquid residuals from this process are handled in a wastewater treatment system.
Figure 17, Flue gas cleaning system
Turbine and generator Turbine is a rotary application that extracts energy from a fluid flow such as gas, steam or wind. There are many different varieties of turbines but gas and steam are the most commonly used in bioenergy plants. The main function of a turbine in a bioenergy plant is to convert gas or steam into work. This work is generated to electricity trough a generator. A turbine contain at least one rotor blade area and this area is set to work by gas or steam that pressures the turbine rotor blades, and by this creating a rotating motion (Svalstedt, 2012). The turbine’s capacity varies from under 1MWe up to more than 300 MWe (Poyry, 2012) (Siemens, 2012). Turbines are involved in bioenergy plants that have the purpose of providing electricity. Therefore the main areas of usage are the divisions waste to energy and biomass.
Figure 18, Turbine
To generate the final steam or gas to actual electricity the end process is conversion through a generator. A generator (or electric generator) is a device that transfers mechanical energy into electrical energy. The generator and the turbine create a

21
complete system that in the end generates electricity. The process includes how steam is provided into the turbine and the rotating motion creates mechanical energy that in the end converts to electricity.
2.5 The Value Chain of Bioenergy Market Figure 19, is a representation of some of the important actors within the bioenergy value chain. In this section list with definitions of the actors of the value chain will be presented. The results from the value chain will later on serve as the core for mapping the ecosystem of the bioenergy market.
Figure 19, The value chain of the Bioenergy market
Equipment provider is defined as any supplier of parts to the application manufacturing. Supplies include SKF’s products, such as seals, bearings, valves, lubrication systems. Application provider is defined as manufacturer or assembler of equipment that will provide the plant with applications. Application providers represent tier 1 suppliers from the perspective of plant builder. Plant builder is defined as companies that build the plants. Plant builder could be consultants, plant owner, energy supplier or combinations of mentioned actors. Plant operator or plant owner are companies that own and/or run the operations of the plant. These actors could be the same as plant builder or energy supplier. Service providers are companies that deliver services to the plant. E.g. daily service, application yearly service, overhaul service, warranty service etc. Power or energy suppliers are the companies that transfer energy to the end customer through the power distribution grid. Energy supplier might be the same actor as the plant owner, operator or the plant builder.
Equipment*provider*
Applica3on*Provider* Plant*Builder* Plant*
operator*Service*Provider*
Power/energy*supplier*
Consumers*
Bearings*Seals*Valves*etc*
Turbine*Fan*Generator*Boiler*Fermenter*System*
Builder* Daily*opera3on*
Repair*Prepare*Monitor*Consultants**
Heat*Power*Electricity*Fuels*
Transporta3on*Households*Industries*Buildnings*

22
2.6 The study company –SKF SKF is an international supplier of bearings, lubrication, seals, mechatronics and services. The Swedish engineer Sven Wingquist who discovered the advantages of a self-aligning bearing founded the company in 1907. In 1910 SKF had 325 employees by whom 15% worked outside Sweden. Today, the company has 46 000 employees in over 32 countries and a turnover of 66 000 million SEK (SKF, 2012). SKF is a supplier to a wide range of industries. The company has during many years been an important development supplier of the automotive industry. During the last two decades SKF has focused more on renewable energy, where they have become an important actor for the development of the wind energy industry. SKF has not, so far, focused their attention on developing the bioenergy industry (SKF, 2012) .
2.6.1 Product platforms SKF have five platforms all connected to the company slogan; SKF – knowledge engineering. The five platforms are Seals, Bearing and units, Lubrication systems, Mechatronics and Services. SKF is the world’s only bearing manufacturer with capabilities in seal manufacturing.
Figure 20, SKF's product platforms
23
3 Method In this chapter, the research design of the thesis is presented together with the data collection methods. The execution process of outlining the bioenergy market map is also presented. Validity and repeatability of the findings are discussed for the general thesis and later for the method of mapping the bioenergy market at the end of the chapter. The overall research conducted has used qualitative research methods through an inductive research process.
3.1 Research question The research questions guiding the selection of research design is How can an ecosystem analysis and market mapping be combined to describe the bioenergy market and serve as a decision base for a diversification process? The main research question is divided in two sub questions. First, How should the bioenergy market be mapped in order to describe the value of the market? Second, What value can be created and captured in the ecosystem of the bioenergy market? The first sub question is answered through the empirical material presented in chapter two, the bioenergy market, and chapter five, analysis. A description of how the market map has been constructed is described below in this chapter. The second and third sub questions are answered by using the findings from chapter four, literature review, the empirical findings from interviews and the analysis of the ecosystem. The process of composing the research questions has been iterative. The initial questions were formulated as a guide to collect necessary data in order to describe the bioenergy market. The market was, however not, described thoroughly and the researchers found that a mapping of the bioenergy market would be a necessity in order to continue to fulfill the purpose of the report. The second sub question has been formulated to serve two purposes. Firstly, to describe the bioenergy ecosystem and secondly to serve as empirical evidence for the analysis of what value that can be created and captured. The result from this analysis will be used to answer the main research question regarding the diversification process. The research has been following an inductive research approach, implying that theory for a diversification process has been built from the empirical studies of the bioenergy market. The first sub question has the intention to empirical findings in order to create a generic model for the mapped market. The first sub question is essentially covered by an inductive study approach. The conclusion of the second sub question is related to theoretical evidence and the analysis is derived from a theoretical framework. Through the literature study, the conditions for a healthy ecosystem are described and by knowing the existing bioenergy market structure, the report concludes how the diversification decision could be formulated. 3.2 Data Collection The collection of data to this master thesis was gathered through three phases. An overview of the three phases can be seen in Figure 21. The three phases had the purpose of describing what data a diversification decision should be based upon. The last phase had the purpose of describing SKF’s possibilities to enter and profit on the bioenergy market. The gathering has been input for both the method for mapping the market and the ecosystem analysis.

24
The first phase had the purpose to serve as initial data to be able to set up a hypothesis regarding how to investigate the market and the ecosystem of the bioenergy industry. The data collected was market data from reports, as well as information regarding application and services gathered from interviews, reports and the World Bioenergy fair in Jönköping. The results of phase one, as will be shown in the Method for Calculating Market Potential chapter, was that the market for bioenergy should be divided into three sub-markets, Biomass, Waste to Energy and Biofuels. The purpose of the second phase, interviews regarding ecosystems and the value chain, was to map out the industry in a way possible to improve the accuracy of the diversification decision. The result of second phase was that the value chain of the bioenergy industry does not cover all aspects needed to make a diversification decision, such as; market drives, innovation capabilities, possible partnerships, stakeholders and cash flows. The third phase investigated the applications regarding SKF’s product platforms as well as customer and user problems regarding operation and maintenance. The primary data from second and third phase was then triangulated with the secondary data regarding the value chain, applications and market properties. The findings of the third phase were that SKF’s decision to diversify had to be based on the market size and the ecosystem structure, combined. The market size was dependent on both market figures, application information regarding hours of service and number of products sold per application. The ecosystem’s “value” was based on innovation opportunities and ability to capture or create value in both sales and relations.
Figure 21, Data collection process
The data collection is based on both primary and secondary data. The primary data has been collected in three different phases. Firstly, participation to the world
Primary'data'collec.on' Secondary'data'collec.on'
Interviews:'applica.ons'and'services.''Jönköping/fair:'Market'outlook'and'applica.ons'
Gathering'of'market'data;'size,'growth,'trends,'geographical'markets.'Gathering'of'technical'aspects'of'applica.ons'and'technologies.'
Phase'
1'
Interviews:/Ecosystem'and'Value'Chain'Interviews:/Market'size'and'figures'
Interviews:'Applica.ons'regarding'SKF’s'product'plaJorms.'Interviews:/Customers'problems'&'Maintenance'
Conclusion://Market'should'be'divided'in'
three'subMmarkets.''
Phase'
2'
Conclusion://Value'chain'does'not'cover'the'
complex'systems'of'bioenergy'plants'
Phase'
3'
Conclusion:/No'current'model'for'the'connec.on'between'diversifica.on'
possibility'and'market'size'+'eco'system.'
Triangula5on'of'primary'and'secondary'data'regarding'the'ecosystem'and'the'market'size.'
Collec5on'of'known'errors'and'problems'with'bioenergy'plant'opera5ons.'

25
bioenergy fair in Jönköping, which served as a good business insight with interviews, lectures and panel discussions. Secondly, interviews have been made with people regarding business insights. Plant owner, plant operators, application manufacturers reaching from Europe to US, as well as interviews with R&D departments and business analysts has been conducted. Thirdly, interviews have also been conducted internally at SKF, concerning their knowledge and resource capabilities. The total number of interviews for this thesis is 50 and conducted through open and semi-structured interviews. Secondary data is collected from research databases, companies’ websites, technology reports available online, blueprints of applications and discourses regarding market outlook.
3.2 Validity, Repeatability and Reliability According to Bryman and Bell’s (2007) the main types of validity are; construct validity, internal and external validity, discriminant validity, content validity and ecological validity. The validity is primarily connected to the conformance between the results and the usage of different research methods. The reliability of the research is defined as the conformance between results and usage of the same methods (Bryman & Bell, 2007) (Cepeda & Martin, 2005). The data of this thesis has primarily derived from qualitative methods, which according to Bryman and Bell (2007) affect the validity in a negative way. However, by avoiding reliance on a single research method a high validity can still be ensured. This report aims a increasing the validity through triangulation of sources, which according to Jick (1979) can be done be either referring to a “between model” or a “within-method”. This report will use triangulation through the “within-method” to ensure conformance of the results. Triangulation will also be conducted within each step of the analysis, to ensure the validity of the sub conclusions drawn between the different parts of analysis (Bryman & Bell, 2007) (Jick, 1979). The results from this thesis correspond with previous studies, which according to Bryman and Bell (2007) promote reliability and external validity. However, being based primarily on qualitative research, repeatability of the results is a major issue. The repeatability of the method is strengthened by the reasonably thorough description of the construction of the method for mapping the bioenergy market. The ecosystem analysis and conclusions of the report have derived from personal interpretations of interview statements, implying a lower validity and reliability. The research questions have been clearly formulated and reviewed several times in order to create a systematic investigation for a validated thesis. The validity and reliability of the method for mapping market potential is discussed in more detail below (Cepeda & Martin, 2005) (Bryman & Bell, 2007).
3.3 Construction of Method for Mapping the Bioenergy Market Below follows a method review of the process of constructing a bioenergy market mapping. The generic model for mapping a market has been concluded through abduction from an empirical model and related theory.
26
The method for mapping of the bioenergy market has been developed through the empirical findings from both primary and secondary data. The primary data comes from interviews and has contributed with business insight and market data. The secondary data has contributed with definitions of divisions, technologies and market figures. As described in the introduction, the method has been developed due to a lack of methods for mapping and calculating the bioenergy market. Different sources of information have been used to be able to create different parts of the method. First, the divisions were formulated in accordance with Bloomberg New Energy Finance’s definition of the bioenergy market. Second, interviews with equipment manufacturers and plant operators have contributed with the input regarding the new build, retrofit and operation and maintenance (O&M) markets. Meetings and discussions during the World Bioenergy fair together with complimentary web searches resulted in an explanation of technologies used. Fourth, interviews with equipment manufacturer and complimentary web search resulted in the understanding of the applications. Finally, the internal interviews at SKF gave insight of application share and the potential value of future technology diversification. The different information providers have together given the researchers a unique insight into the value of sections and modules of the bioenergy market. This insight has been used to calculate the value of explicit parts of the market as well as the total market potential for SKF. Validity of the final method is ensured through triangulation of methods, thick descriptions and the chain of evidence presented. The construct validity is considered high as triangulation of the data gathering methods have been used. The construct validity of the calculations is further strengthened through the discussion regarding source valuation (see chapter 3.5.3). Thick descriptions of the sections and modules increase the internal validity. Each section of the method has been thoroughly explained in the bioenergy market chapter. The casual relation between the sections and modules has also been explained in detail. There is no plausible alternative method for mapping the bioenergy market that contradicts the information presented below. The generic model for calculating and mapping a market, see Figure 22, has been created from the knowledge of the bioenergy market. The process of abstracting a generic model from an empirical study can be seen as an abductive process. The construct validity of this model should therefore be considered as lower than the rest of the method. Furthermore is the generalization of the result from the bioenergy market questionable. The lack of corresponding theory is lowering the external validity of the method. However, the generic model still has the clear purpose to guide the readers through the logic behind the specific method of mapping the bioenergy market.
3.4 Method for Mapping the Bioenergy Market This method aims at developing and describing a model for market mapping with focus on the bioenergy market. According to the business dictionary market mapping
27
is initially defined as “a study of various market conditions that is plotted on a map…” (Businessdictionary, 2012). Previous literature on the subject is extensive, but most with the exception of focusing the calculations to market share of a focal company (Melitz, 2008) (Tronstad, 2008). This method will not only focus on market share, but also instead try to provide a framework for all types of market calculations of the bioenergy market, regardless of the focal company. In comparison to the studies done by Melitz (2008), this method does not consider the market as one fixed size. Instead, it will try to provide the reader with insights that a market consist of more than just one dimension and that measurement must be done with different focuses if they are to explain different facts about the market map. This method aims at assessing and explaining the question: How should the bioenergy market be mapped in order to describe the value of the market? This will be done by first creating a general method for assessing what aspects of a market that may be mapped and how the market mapping should be conducted. Secondly an analysis of how the sources should be evaluated will be provided. Finally an empirical example of the bioenergy market will be explained and analyzed.
3.4.1 Part I: Setting scope and module creation This section will provide a framework for how to set the scope of the mapped market and the general ideas of including modules in a calculation. The general model for mapping market potential is presented in Figure 22 and Figure 23. The model is used for mapping and calculations from the perspective of a focal company, further on denoted as Company A, preferable a supplier or sub supplier of industry. The general model will also be applicable for other types of companies and other industries. With this model a company will get a good understand of the different sections of the market and a validated and accurate value of the potential and/or the probable value of the studied market section. Figure 22, describes the sections needed to consider in order to have a calculative function, which is necessary to obtain a value of the market potential. This report claims that all market scopes must include the seven sections mentioned below. There are, off course, several shortcuts to calculate the market potential, which sometimes might be easier because of difficulties in obtaining the correct data. Estimations and generalizations will always be necessary in order to get a relevant cost-efficient calculation process. The first section of the model is the overall revenue of the total market for a certain year. This is the often the initial input of the model (or in some emerging markets, the data that is missing) and can be provided by global industry specific institutions or global statistic companies. The second section, user and geographical segments, refers to a distribution of the total market over specific and measurable user or geographical market. This could be data such as demographics, age segments, geographical markets by continents or the states of a country. The third section of the model, division/products, is the first section that considers focal companies internal structure. Many companies have product divisions that may or may not be applicable for the diversification process of interest. Some divisions and products will be profitable and some will not. By dividing the market calculation

28
by product or division the focal company will be able divide its markets in profitable and non-profitable. The fourth and fifth section, technologies and applications, distributes the total geographical markets for the specific divisions, over the different technologies and applications (parts of the technologies/divisions). The model is now, theoretically, presenting an opportunity to calculate all the applications of all the technologies in all the divisions and of all the geographical market. The last two sections can then be used for calculation Company A’s total potential market value by adding their potential share of each application and the probable market value by adding the probable market share compared to all competitors.
Figure 22, General Model for calculating Market Potential
In total, these seven sections will be sufficient for describing and calculating the actual potential and probable market size for Company A. The aforementioned model is dependent on the ability to create independent modules that represent parts within the sections. The modules will be based on the number of parts within a section and the number of sections the calculation will refer to. The model for creating a matrix system of modules is shown in Figure 23. The rows (j) of the model are the sections described in the figure above, whereas the columns (i) are the number of modules in each section. The number of section (j) is predefined in the general model, but might vary or be simplified in some cases. The number of modules (i) is, however, different for each section. It is the number of modules (i) that decides how complicated the mappings will be. An example of modules (i) in a section (j) can be the different number of geographical market considered, e g the total revenue of Europe, Asia, South America, North America, Africa and Oceania separately.
Overall'Revenue/'yearn'
Geographical'Markets'
Divisions/Products'
Technologies'
Applica=ons'
Share'of'Applica=on'
Market'share'
Market'growth,'size'and'repara=on'revenue'
Total'market'revenue/year'
Market'division'according'to'geographical'points'of'interest'
Market'division'according'to'technologies'
Revenue'stream'of'Company'A’s'possible'products/services'
Company'A’s'market'share'of'chosen'areas'
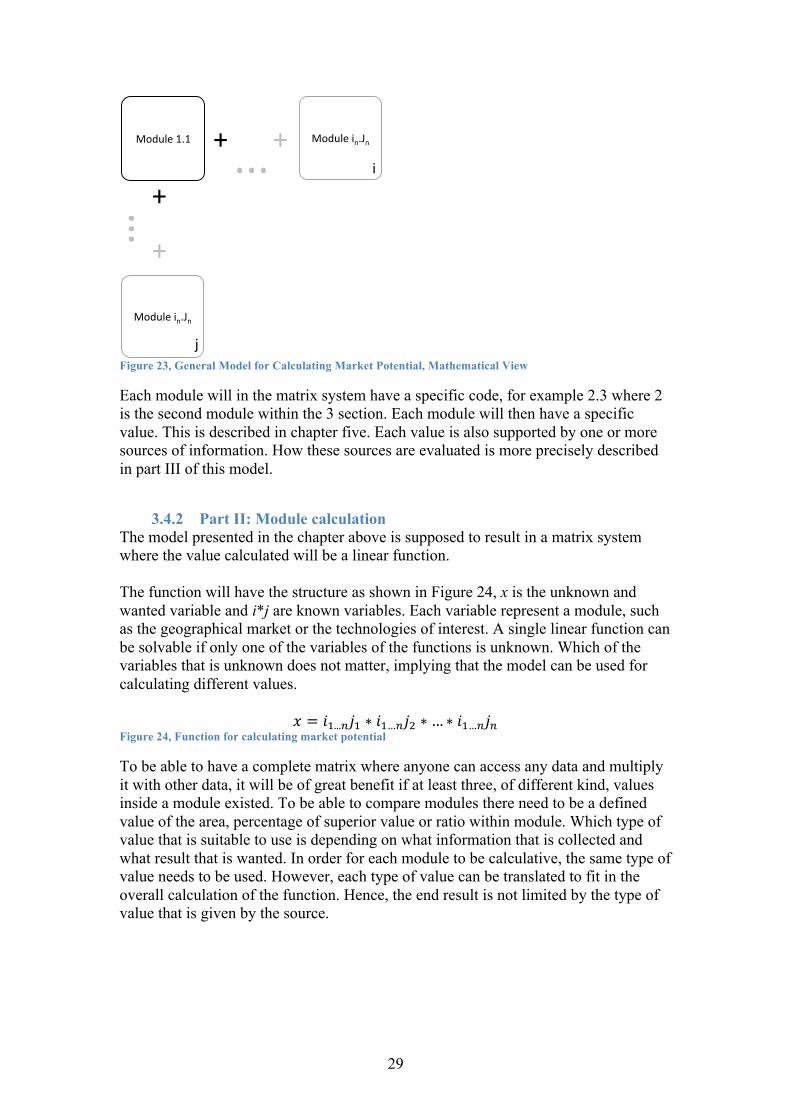
29
Figure 23, General Model for Calculating Market Potential, Mathematical View
Each module will in the matrix system have a specific code, for example 2.3 where 2 is the second module within the 3 section. Each module will then have a specific value. This is described in chapter five. Each value is also supported by one or more sources of information. How these sources are evaluated is more precisely described in part III of this model.
3.4.2 Part II: Module calculation The model presented in the chapter above is supposed to result in a matrix system where the value calculated will be a linear function. The function will have the structure as shown in Figure 24, x is the unknown and wanted variable and i*j are known variables. Each variable represent a module, such as the geographical market or the technologies of interest. A single linear function can be solvable if only one of the variables of the functions is unknown. Which of the variables that is unknown does not matter, implying that the model can be used for calculating different values.
𝑥 = 𝑖!...!𝑗! ∗ 𝑖!…!𝑗! ∗… ∗ 𝑖!…!𝑗! Figure 24, Function for calculating market potential
To be able to have a complete matrix where anyone can access any data and multiply it with other data, it will be of great benefit if at least three, of different kind, values inside a module existed. To be able to compare modules there need to be a defined value of the area, percentage of superior value or ratio within module. Which type of value that is suitable to use is depending on what information that is collected and what result that is wanted. In order for each module to be calculative, the same type of value needs to be used. However, each type of value can be translated to fit in the overall calculation of the function. Hence, the end result is not limited by the type of value that is given by the source.
Module'1.1' +' '' ''+' Module'in.Jn'...''
…'
+'''+'
Module'in.Jn'
i'
j'
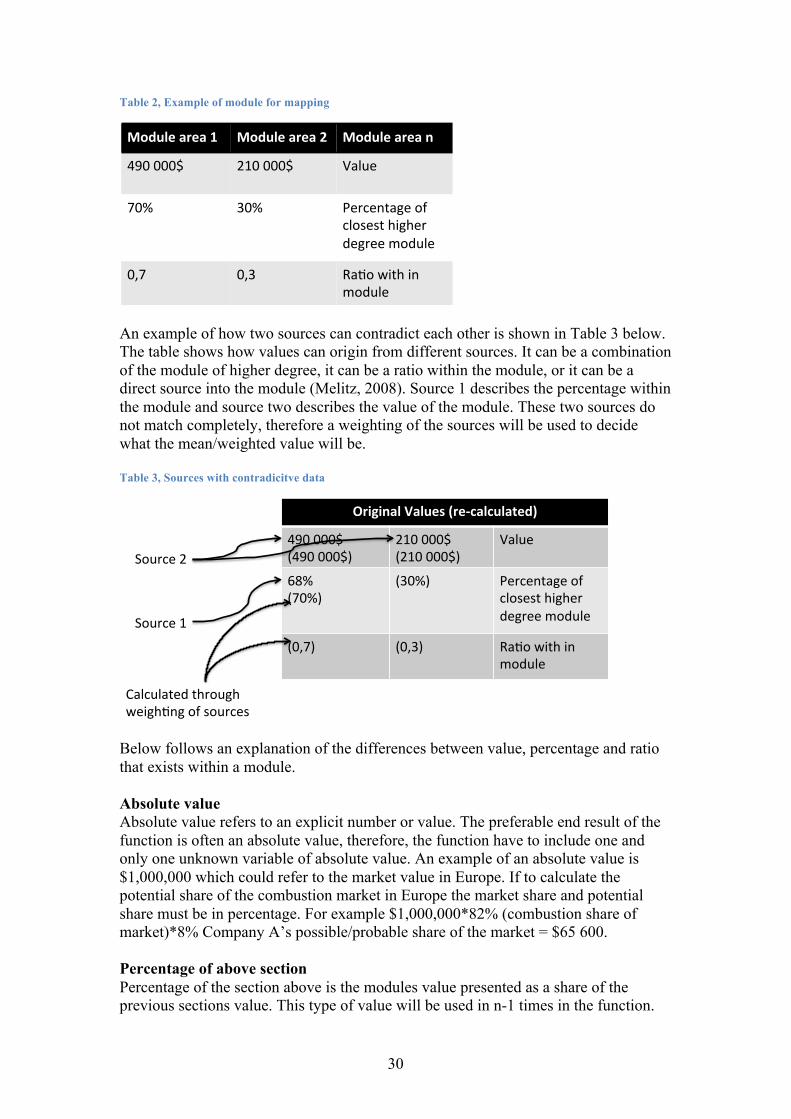
30
Table 2, Example of module for mapping
An example of how two sources can contradict each other is shown in Table 3 below. The table shows how values can origin from different sources. It can be a combination of the module of higher degree, it can be a ratio within the module, or it can be a direct source into the module (Melitz, 2008). Source 1 describes the percentage within the module and source two describes the value of the module. These two sources do not match completely, therefore a weighting of the sources will be used to decide what the mean/weighted value will be. Table 3, Sources with contradicitve data
Below follows an explanation of the differences between value, percentage and ratio that exists within a module. Absolute value Absolute value refers to an explicit number or value. The preferable end result of the function is often an absolute value, therefore, the function have to include one and only one unknown variable of absolute value. An example of an absolute value is $1,000,000 which could refer to the market value in Europe. If to calculate the potential share of the combustion market in Europe the market share and potential share must be in percentage. For example $1,000,000*82% (combustion share of market)*8% Company A’s possible/probable share of the market = $65 600. Percentage of above section Percentage of the section above is the modules value presented as a share of the previous sections value. This type of value will be used in n-1 times in the function.
Module'area'1' Module'area'2' Module'area'n!
490$000$$ 210$000$$$
Value$
70%$ 30%$ Percentage$of$closest$higher$degree$module$
0,7$ 0,3$ Ra?o$with$in$module$
Original'Values'(re3calculated)'
490$000$$(490$000$)$
210$000$$(210$000$)$
Value$
68%$(70%)$
(30%)$ Percentage$of$closest$higher$degree$module$
(0,7)$ (0,3)$ Ra?o$with$in$module$
Source$1$
Source$2$
Calculated$through$weigh?ng$of$sources$
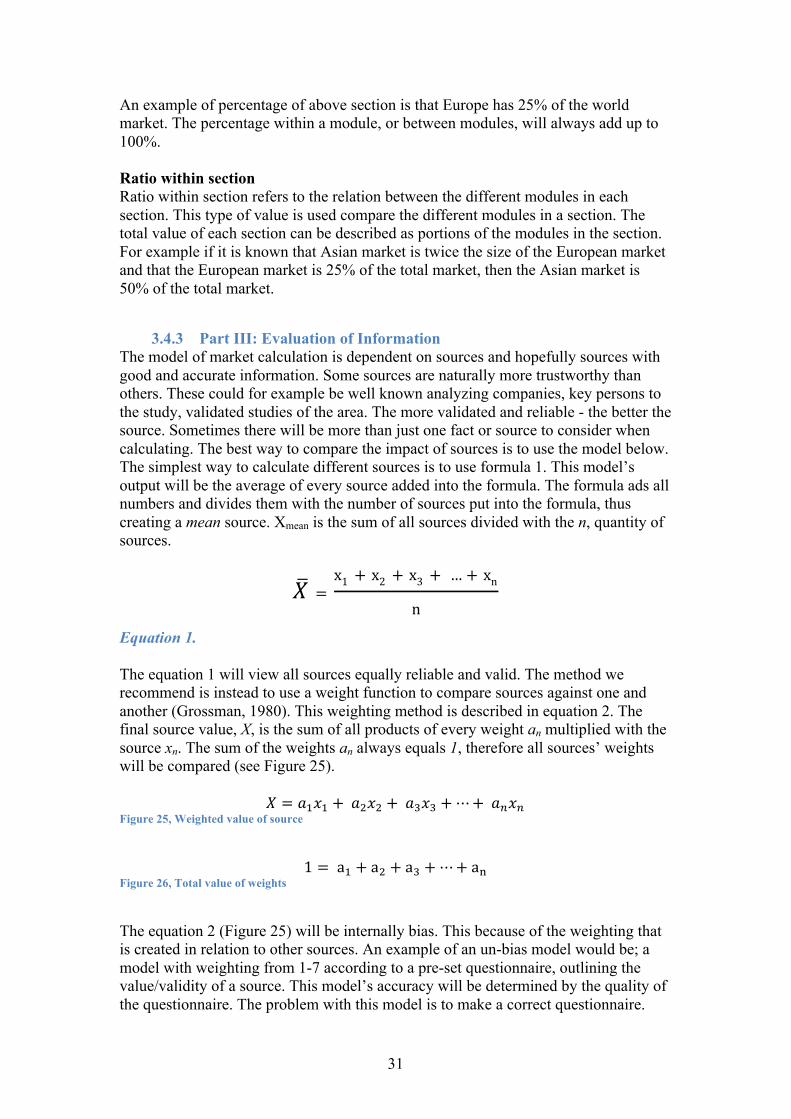
31
An example of percentage of above section is that Europe has 25% of the world market. The percentage within a module, or between modules, will always add up to 100%. Ratio within section Ratio within section refers to the relation between the different modules in each section. This type of value is used compare the different modules in a section. The total value of each section can be described as portions of the modules in the section. For example if it is known that Asian market is twice the size of the European market and that the European market is 25% of the total market, then the Asian market is 50% of the total market.
3.4.3 Part III: Evaluation of Information The model of market calculation is dependent on sources and hopefully sources with good and accurate information. Some sources are naturally more trustworthy than others. These could for example be well known analyzing companies, key persons to the study, validated studies of the area. The more validated and reliable - the better the source. Sometimes there will be more than just one fact or source to consider when calculating. The best way to compare the impact of sources is to use the model below. The simplest way to calculate different sources is to use formula 1. This model’s output will be the average of every source added into the formula. The formula ads all numbers and divides them with the number of sources put into the formula, thus creating a mean source. Xmean is the sum of all sources divided with the n, quantity of sources.
𝑋 =x1 + x2 + x3 + … + xn
n
Equation 1. The equation 1 will view all sources equally reliable and valid. The method we recommend is instead to use a weight function to compare sources against one and another (Grossman, 1980). This weighting method is described in equation 2. The final source value, X, is the sum of all products of every weight an multiplied with the source xn. The sum of the weights an always equals 1, therefore all sources’ weights will be compared (see Figure 25).
𝑋 = 𝑎!𝑥! + 𝑎!𝑥! + 𝑎!𝑥! +⋯+ 𝑎!𝑥! Figure 25, Weighted value of source
1 = a! + a! + a! +⋯+ a!
Figure 26, Total value of weights
The equation 2 (Figure 25) will be internally bias. This because of the weighting that is created in relation to other sources. An example of an un-bias model would be; a model with weighting from 1-7 according to a pre-set questionnaire, outlining the value/validity of a source. This model’s accuracy will be determined by the quality of the questionnaire. The problem with this model is to make a correct questionnaire.
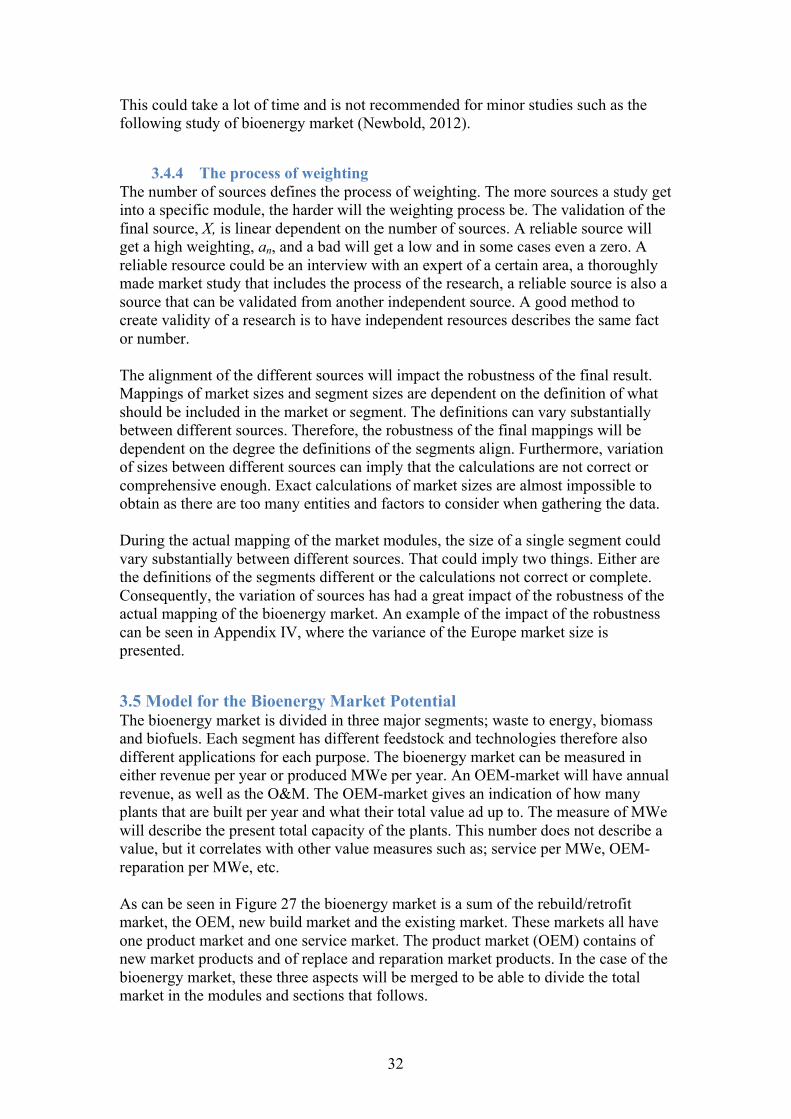
32
This could take a lot of time and is not recommended for minor studies such as the following study of bioenergy market (Newbold, 2012).
3.4.4 The process of weighting The number of sources defines the process of weighting. The more sources a study get into a specific module, the harder will the weighting process be. The validation of the final source, X, is linear dependent on the number of sources. A reliable source will get a high weighting, an, and a bad will get a low and in some cases even a zero. A reliable resource could be an interview with an expert of a certain area, a thoroughly made market study that includes the process of the research, a reliable source is also a source that can be validated from another independent source. A good method to create validity of a research is to have independent resources describes the same fact or number. The alignment of the different sources will impact the robustness of the final result. Mappings of market sizes and segment sizes are dependent on the definition of what should be included in the market or segment. The definitions can vary substantially between different sources. Therefore, the robustness of the final mappings will be dependent on the degree the definitions of the segments align. Furthermore, variation of sizes between different sources can imply that the calculations are not correct or comprehensive enough. Exact calculations of market sizes are almost impossible to obtain as there are too many entities and factors to consider when gathering the data. During the actual mapping of the market modules, the size of a single segment could vary substantially between different sources. That could imply two things. Either are the definitions of the segments different or the calculations not correct or complete. Consequently, the variation of sources has had a great impact of the robustness of the actual mapping of the bioenergy market. An example of the impact of the robustness can be seen in Appendix IV, where the variance of the Europe market size is presented.
3.5 Model for the Bioenergy Market Potential The bioenergy market is divided in three major segments; waste to energy, biomass and biofuels. Each segment has different feedstock and technologies therefore also different applications for each purpose. The bioenergy market can be measured in either revenue per year or produced MWe per year. An OEM-market will have annual revenue, as well as the O&M. The OEM-market gives an indication of how many plants that are built per year and what their total value ad up to. The measure of MWe will describe the present total capacity of the plants. This number does not describe a value, but it correlates with other value measures such as; service per MWe, OEM-reparation per MWe, etc. As can be seen in Figure 27 the bioenergy market is a sum of the rebuild/retrofit market, the OEM, new build market and the existing market. These markets all have one product market and one service market. The product market (OEM) contains of new market products and of replace and reparation market products. In the case of the bioenergy market, these three aspects will be merged to be able to divide the total market in the modules and sections that follows.
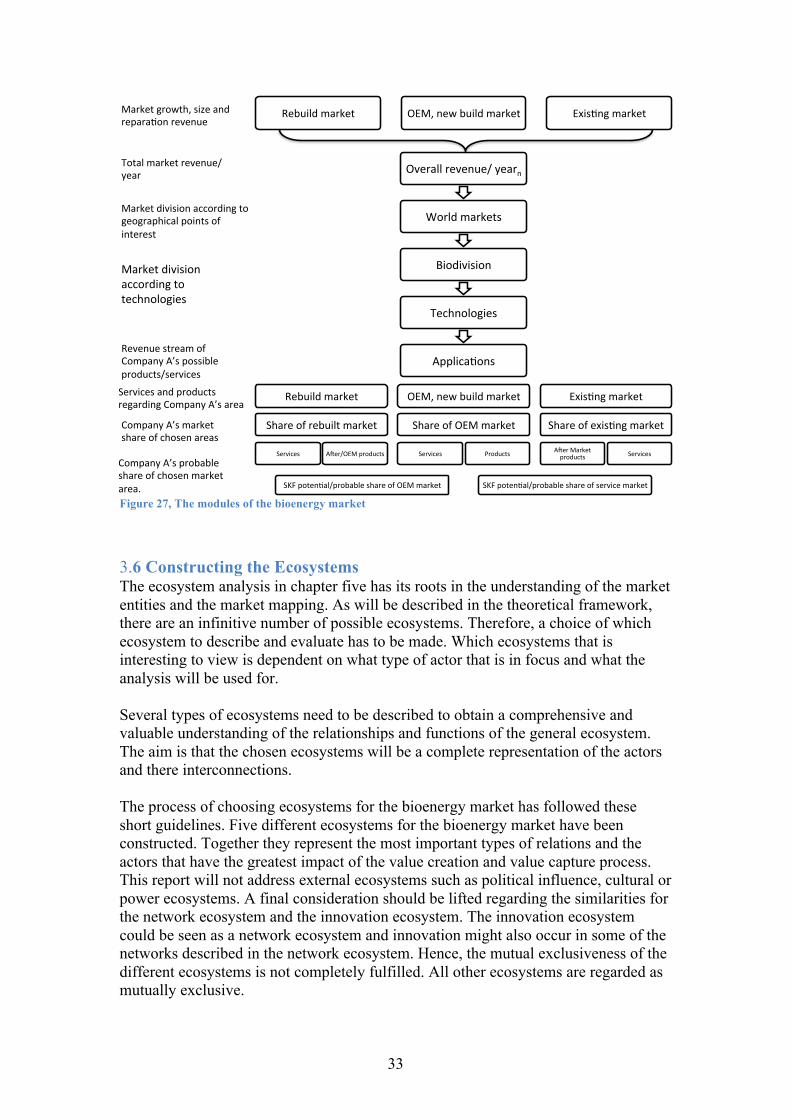
33
Figure 27, The modules of the bioenergy market
3.6 Constructing the Ecosystems The ecosystem analysis in chapter five has its roots in the understanding of the market entities and the market mapping. As will be described in the theoretical framework, there are an infinitive number of possible ecosystems. Therefore, a choice of which ecosystem to describe and evaluate has to be made. Which ecosystems that is interesting to view is dependent on what type of actor that is in focus and what the analysis will be used for. Several types of ecosystems need to be described to obtain a comprehensive and valuable understanding of the relationships and functions of the general ecosystem. The aim is that the chosen ecosystems will be a complete representation of the actors and there interconnections. The process of choosing ecosystems for the bioenergy market has followed these short guidelines. Five different ecosystems for the bioenergy market have been constructed. Together they represent the most important types of relations and the actors that have the greatest impact of the value creation and value capture process. This report will not address external ecosystems such as political influence, cultural or power ecosystems. A final consideration should be lifted regarding the similarities for the network ecosystem and the innovation ecosystem. The innovation ecosystem could be seen as a network ecosystem and innovation might also occur in some of the networks described in the network ecosystem. Hence, the mutual exclusiveness of the different ecosystems is not completely fulfilled. All other ecosystems are regarded as mutually exclusive.
Overall'revenue/'yearn'
World'markets'
Biodivision'
Technologies'
Applica;ons'
Rebuild'market'
Share'of'rebuilt'market'
Services' A@er/OEM'products'
OEM,'new'build'market'
Share'of'OEM'market'
Services' Products'
Exis;ng'market'
Share'of'exis;ng'market'
A@er'Market'products' Services'
SKF'poten;al/probable'share'of'OEM'market' SKF'poten;al/probable'share'of'service'market'
Rebuild'market' OEM,'new'build'market' Exis;ng'market'Market'growth,'size'and'repara;on'revenue'
Total'market'revenue/year'
Market'division'according'to'geographical'points'of'interest'
Market'division'according'to'technologies'
Revenue'stream'of'Company'A’s'possible'products/services'
Services'and'products'regarding'Company'A’s'area'
Company'A’s'market'share'of'chosen'areas'
Company'A’s'probable'share'of'chosen'market'area.'
34
4. Theoretical Framework This chapter aims at presenting a framework for diversification and ecosystem in order to create a foundation for a structured analysis. To explore the aforementioned research question a framework regarding ecosystem, value and diversification will be presented. This framework will later be used for an ecosystem analysis and diversification analysis in chapter five. The decision base for a diversification process is based on the quality of information and analysis regarding the industry or products of interest. One of the most frequently used models for describing an industry is Porter’s five forces model. This model aims at investigating the competition and the attractiveness of the market (Porter, 1987). A value chain analysis is also commonly used to understand and identify possibilities in the industry. This report claims that these models will not be sufficient to serve as a decision basis for a diversification process. Hence, this report will analyze the industry through the lens of a combination of diversification, value creation, value capture and ecosystem theory. The ecosystem theory will not only address the issues regarding supplier and buyer, instead the ecosystem will view the industry as a series of relations and value creation opportunities. A company’s survival and future growth is depending on its competitive advantage. The competitive advantage is depending on its ability to create more value than its competitors (Porter, 1987). Value creation is closely related to innovation and ability to find markets that fit with the company’s core competencies. The ability to growth is also depending on the ability to find new markets to present the company’s products and services. Many companies strive to be technology innovators and become first to market. This theoretical framework will initially highlight the issues of diversification and finally discuss the creation of an ecosystem and the concept of value.
4.1 Diversification Diversification is a concept used in corporate strategy to determine where and in what businesses to compete. The trend over the last decades has been less diversification and more focus on core competence. Companies that have succeeded with diversification strategies has gained larger market shares and strengthened the company’s market position (Sandström, 2012) (Rumelt, 1982). There are two different types of diversification. Related diversification refers to a new business where the company can use its former resources and knowledge to compete on the market. In literature, the concept has also been strongly connected to company growth (Björkdahl, 2007) (Teece, 1997). Unrelated diversification is related to a new business that the company does not have any knowledge of, example of this can be Volvo’s ownership of the food brand ABBA. The main reason for diversifying is to grow or reduce the risk of for e.g. a volatile market (Teece, 1997) (Sandström, 2012) (Björkdahl, 2007). According to Björkdahl (2007) the company’s pattern for diversification is connected to technology diversification. A technology diversification is a way to increase knowledge and competence in a new business area. The technology diversification is
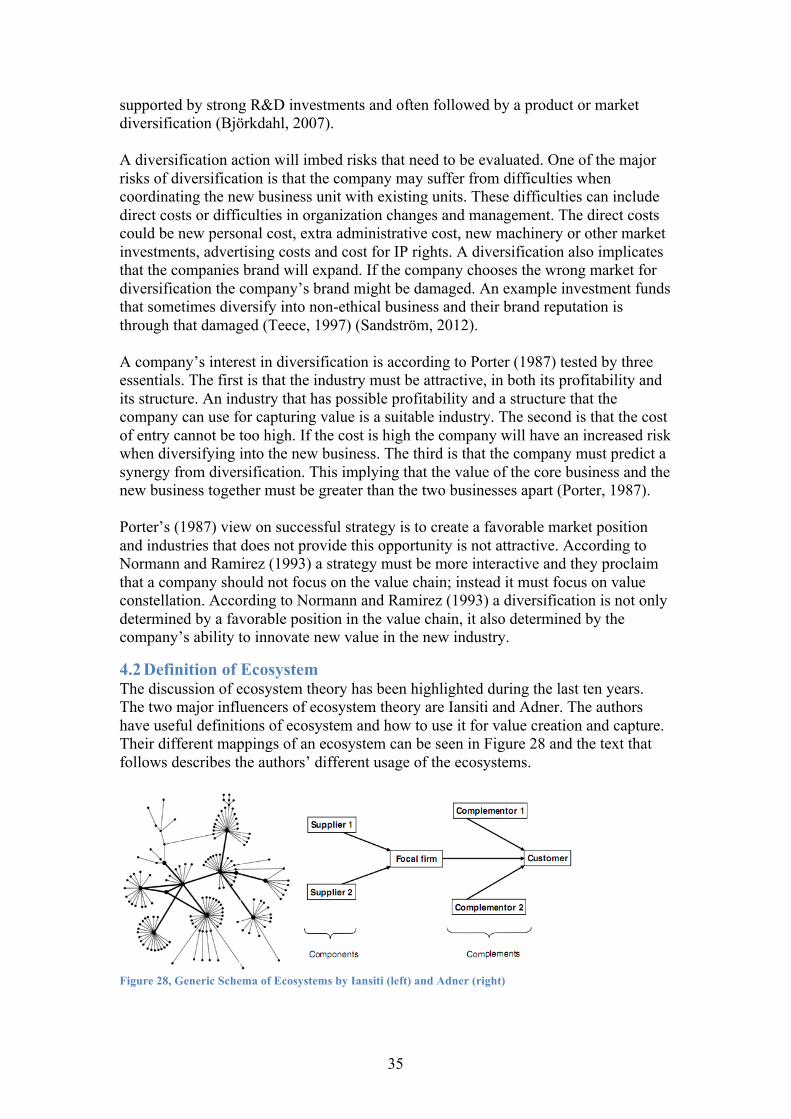
35
supported by strong R&D investments and often followed by a product or market diversification (Björkdahl, 2007). A diversification action will imbed risks that need to be evaluated. One of the major risks of diversification is that the company may suffer from difficulties when coordinating the new business unit with existing units. These difficulties can include direct costs or difficulties in organization changes and management. The direct costs could be new personal cost, extra administrative cost, new machinery or other market investments, advertising costs and cost for IP rights. A diversification also implicates that the companies brand will expand. If the company chooses the wrong market for diversification the company’s brand might be damaged. An example investment funds that sometimes diversify into non-ethical business and their brand reputation is through that damaged (Teece, 1997) (Sandström, 2012). A company’s interest in diversification is according to Porter (1987) tested by three essentials. The first is that the industry must be attractive, in both its profitability and its structure. An industry that has possible profitability and a structure that the company can use for capturing value is a suitable industry. The second is that the cost of entry cannot be too high. If the cost is high the company will have an increased risk when diversifying into the new business. The third is that the company must predict a synergy from diversification. This implying that the value of the core business and the new business together must be greater than the two businesses apart (Porter, 1987). Porter’s (1987) view on successful strategy is to create a favorable market position and industries that does not provide this opportunity is not attractive. According to Normann and Ramirez (1993) a strategy must be more interactive and they proclaim that a company should not focus on the value chain; instead it must focus on value constellation. According to Normann and Ramirez (1993) a diversification is not only determined by a favorable position in the value chain, it also determined by the company’s ability to innovate new value in the new industry.
4.2 Definition of Ecosystem The discussion of ecosystem theory has been highlighted during the last ten years. The two major influencers of ecosystem theory are Iansiti and Adner. The authors have useful definitions of ecosystem and how to use it for value creation and capture. Their different mappings of an ecosystem can be seen in Figure 28 and the text that follows describes the authors’ different usage of the ecosystems.
Figure 28, Generic Schema of Ecosystems by Iansiti (left) and Adner (right)

36
“A company's business ecosystem consists of all the companies, organizations or groups of people that directly or indirectly affect the company. Good examples include suppliers, distributors, creditors, technology providers, regulatory agencies, complementary product manufacturers, outsourcing companies, competitors and even customers. “(Iansiti & Levien, 2004) Iansiti and Levien (2004) explain an ecosystem through the analogy of a biological ecosystem. The similarities are that both company and species are dependent on each other for their mutual effectiveness and survival. The actors in the ecosystems share the fate with each other. If one actor in the ecosystem changes its role dramatically, all the actors in the ecosystems are affected (Iansiti & Levien, 2004).
4.3 Constructing an Ecosystem The way to create an ecosystem has to be simple in order for the result to be useful. The process should be structured and rational. The first step will often result in a list of the different relationships and interdependencies a company has. This list of actors should then be grouped into divisions with the same function within the ecosystem. The groups can then be mapped and the relationships between the groups can be explained. Important to notice is that each of these groups could be an ecosystem themselves. At the same time a weakness in any of the groups will be a weakness of the total ecosystem (Iansiti & Levien, 2004).
Only the most interesting interconnections should be mapped in an ecosystem. The complexity of an ecosystem could theoretically be infinitive. Therefore, in order for the ecosystem to be valuable, it has to be simplified. Only the actors with most effect on the focal company should be considered (Iansiti & Levien, 2004). From the perspective of Adner (2006) the process of mapping the company’s ecosystem is slightly more detailed. The first steps is to identify the different steps in which a new product has to be adopted followed by the complements needed. With this foundation for a map, an estimation of the possible delay of each actor will result in a useful calculation of a certain product delay. The calculation will result in an estimated time, when the considered product will reach the end consumer. This step is finally followed by a calculations of the risks inherited in each ecosystem (Adner, 2006).
4.3.1 Risk and health of an ecosystem According to Adner (2006) there are three kinds of risk in an ecosystem; initiative risks, interdependence risks and integration risks. Initiative risks include uncertainties of managing projects. Interdependence risks refer to uncertainties of coordination with other actor in the ecosystem. Integration risks are uncertainties during the adoption process through the value chain. With these risks in mind, the level of risk is depending on the market in which the organization is trying to diversify or innovate in (Adner, 2006). There are three measures that decide the health of the ecosystem: productivity, robustness, and niche creation. Productivity is the ability to constantly create innovations and transform technology into lower cost. Robustness is the amount of turbulence in the ecosystem. A robust ecosystem is more stable and has lower risk. The lower risk relate to the productiveness of the ecosystem. A robust ecosystem will
37
strengthen the relationships within the ecosystem. A way of deciding the robustness of an ecosystem is to look at the number of entries and exits in the ecosystem. Niche creation refers to the ability to create a niche for the ecosystem or simplified; changing the function of an ecosystem. Related to this is the ability to handle external influence on the ecosystem. The ability to create new functions in an ecosystem is depending on the ability to handle new technology and the ability to innovate (Iansiti & Levien, Strategy as ecology, 2004). “If benefits do not exceed costs at every adoption step, intermediaries will not move your offering down the line” (Adner, 2006). The only reason, for an actor in an ecosystem to change a relationship, is if there is an alternative with benefits that exceed the transaction and changing cost. As long as there are no problems, no obvious alternatives with major benefits and little turbulence, two actors with a relationship in an ecosystem will not be interested in breaking their bond. Adner (2006) further points out that this is true for all the steps in a value chain. The survival of an ecosystem is depending on the corporation between the actors in the ecosystem. Iansiti and Levien (2004) describe several strategies that companies can pursuit when acting in an ecosystem. The most beneficial strategy, according to Iansiti and Levien (2004), is the keystone strategy. The keystone strategy involves companies with great importance for the survival of the ecosystem. A keystone player has great knowledge and importance knowledge for the functions of the ecosystem. For an ecosystem to be healthy the keystone player has to create value within the ecosystem and share this value with the ecosystem. Creating value within the ecosystem is important because it makes the ecosystem evolve, be innovative and grow. The possibility of value creation will be incentive for new actors to enter the ecosystem. Without new value, the current actors of the ecosystem will leave the ecosystem. Iansiti and Levien (2004) further claim that the keystone player have to share the value that they create with the other actors in the ecosystem. This will ensure the attractiveness and survival of the ecosystem. Of course, this is a challenge for many companies, as this sharing of knowledge and value might invite competitors to their business (Iansiti & Levien, 2004).
4.4 Value creation and capture “Strategy is no longer a matter of positioning a fixed set of activities along a value chain. Increasingly, successful companies do not just add value, they reinvent it.” (Ramírez & Normann, 1993). This section will focus on the ability to create and capture value in an ecosystem. The theory will focus on the work of Adner and Kapoor (2010) and the theory of value done by Lepak (2007). “We use this ecosystem lens to consider two inter- related questions. First, how the structure of technological interdependence—the location of challenges relative to the focal firm—affects the benefit that accrues to technology leaders (i.e., firms that pioneer the introduction of new technology generations). Second, how the effectiveness of vertical integration as a strategy for managing technological interdependence changes over the course of a technology’s life cycle.” (Adner & Kapoor, 2010)
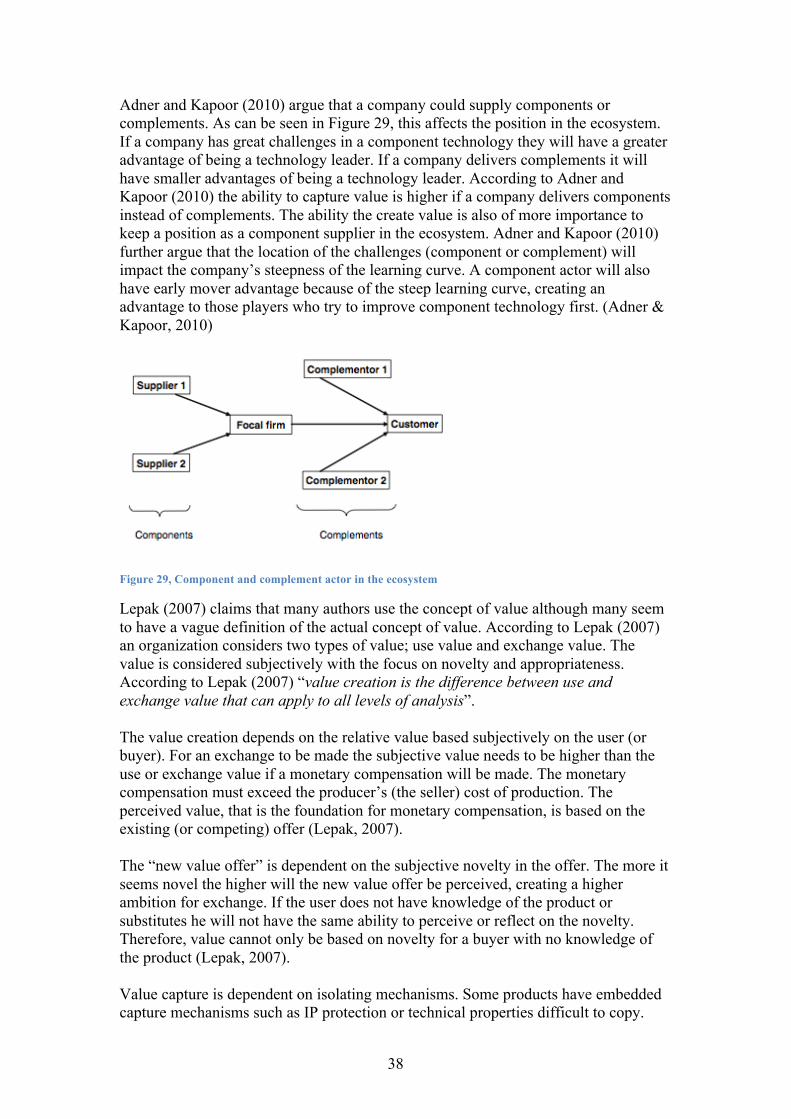
38
Adner and Kapoor (2010) argue that a company could supply components or complements. As can be seen in Figure 29, this affects the position in the ecosystem. If a company has great challenges in a component technology they will have a greater advantage of being a technology leader. If a company delivers complements it will have smaller advantages of being a technology leader. According to Adner and Kapoor (2010) the ability to capture value is higher if a company delivers components instead of complements. The ability the create value is also of more importance to keep a position as a component supplier in the ecosystem. Adner and Kapoor (2010) further argue that the location of the challenges (component or complement) will impact the company’s steepness of the learning curve. A component actor will also have early mover advantage because of the steep learning curve, creating an advantage to those players who try to improve component technology first. (Adner & Kapoor, 2010)
Figure 29, Component and complement actor in the ecosystem
Lepak (2007) claims that many authors use the concept of value although many seem to have a vague definition of the actual concept of value. According to Lepak (2007) an organization considers two types of value; use value and exchange value. The value is considered subjectively with the focus on novelty and appropriateness. According to Lepak (2007) “value creation is the difference between use and exchange value that can apply to all levels of analysis”. The value creation depends on the relative value based subjectively on the user (or buyer). For an exchange to be made the subjective value needs to be higher than the use or exchange value if a monetary compensation will be made. The monetary compensation must exceed the producer’s (the seller) cost of production. The perceived value, that is the foundation for monetary compensation, is based on the existing (or competing) offer (Lepak, 2007). The “new value offer” is dependent on the subjective novelty in the offer. The more it seems novel the higher will the new value offer be perceived, creating a higher ambition for exchange. If the user does not have knowledge of the product or substitutes he will not have the same ability to perceive or reflect on the novelty. Therefore, value cannot only be based on novelty for a buyer with no knowledge of the product (Lepak, 2007). Value capture is dependent on isolating mechanisms. Some products have embedded capture mechanisms such as IP protection or technical properties difficult to copy.
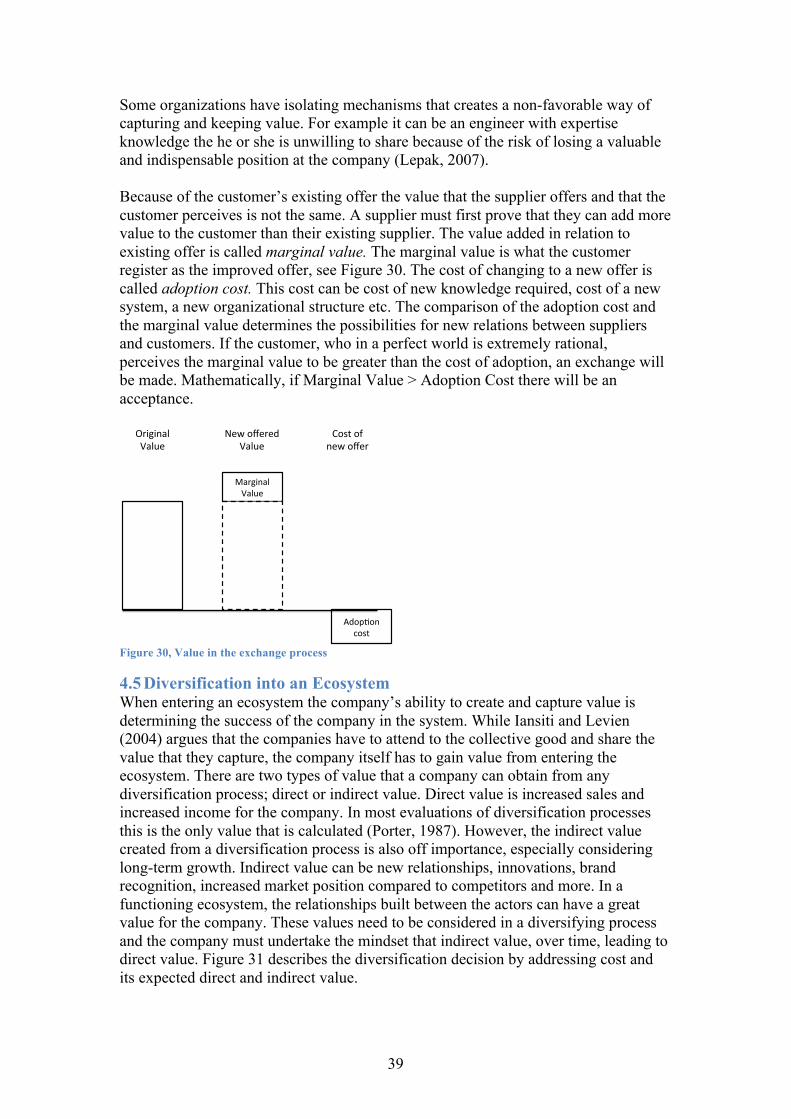
39
Some organizations have isolating mechanisms that creates a non-favorable way of capturing and keeping value. For example it can be an engineer with expertise knowledge the he or she is unwilling to share because of the risk of losing a valuable and indispensable position at the company (Lepak, 2007). Because of the customer’s existing offer the value that the supplier offers and that the customer perceives is not the same. A supplier must first prove that they can add more value to the customer than their existing supplier. The value added in relation to existing offer is called marginal value. The marginal value is what the customer register as the improved offer, see Figure 30. The cost of changing to a new offer is called adoption cost. This cost can be cost of new knowledge required, cost of a new system, a new organizational structure etc. The comparison of the adoption cost and the marginal value determines the possibilities for new relations between suppliers and customers. If the customer, who in a perfect world is extremely rational, perceives the marginal value to be greater than the cost of adoption, an exchange will be made. Mathematically, if Marginal Value > Adoption Cost there will be an acceptance.
Figure 30, Value in the exchange process
4.5 Diversification into an Ecosystem When entering an ecosystem the company’s ability to create and capture value is determining the success of the company in the system. While Iansiti and Levien (2004) argues that the companies have to attend to the collective good and share the value that they capture, the company itself has to gain value from entering the ecosystem. There are two types of value that a company can obtain from any diversification process; direct or indirect value. Direct value is increased sales and increased income for the company. In most evaluations of diversification processes this is the only value that is calculated (Porter, 1987). However, the indirect value created from a diversification process is also off importance, especially considering long-term growth. Indirect value can be new relationships, innovations, brand recognition, increased market position compared to competitors and more. In a functioning ecosystem, the relationships built between the actors can have a great value for the company. These values need to be considered in a diversifying process and the company must undertake the mindset that indirect value, over time, leading to direct value. Figure 31 describes the diversification decision by addressing cost and its expected direct and indirect value.
Marginal(Value(
Original(Value(
New(offered(Value(
Adop4on(cost(
Cost(of(new(offer(
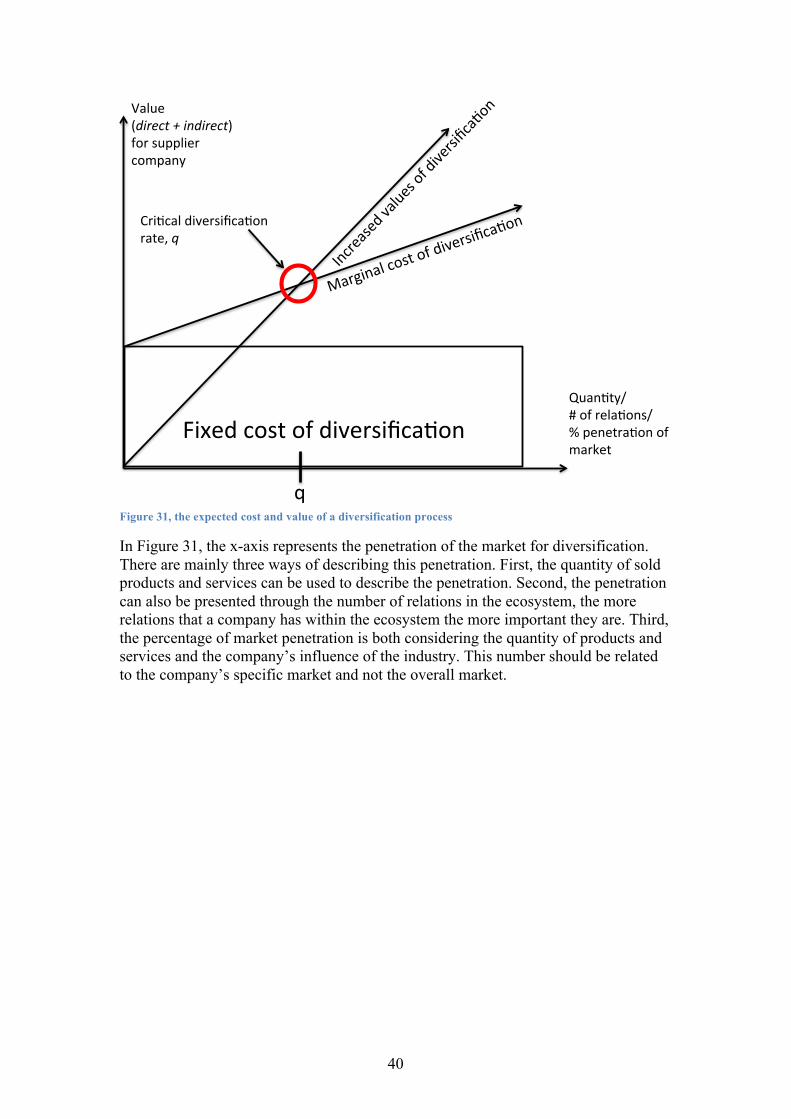
40
Figure 31, the expected cost and value of a diversification process
In Figure 31, the x-axis represents the penetration of the market for diversification. There are mainly three ways of describing this penetration. First, the quantity of sold products and services can be used to describe the penetration. Second, the penetration can also be presented through the number of relations in the ecosystem, the more relations that a company has within the ecosystem the more important they are. Third, the percentage of market penetration is both considering the quantity of products and services and the company’s influence of the industry. This number should be related to the company’s specific market and not the overall market.
Fixed&cost&of&diversifica0on&&
Marginal&cos
t&of&diversi
fica0on&
Increased&values&of&diversifica0on&
Quan0ty/&#&of&rela0ons/&%&penetra0on&of&market&
Value&&(direct'+'indirect)&for&supplier&company&
Cri0cal&diversifica0on&rate,&q'
q&

41
5. Analysis The analysis presented below is divided into three major areas. The first part is derived from empirical data from the market and is based on the market mapping in the method chapter. The second part is based on the theoretical framework described in chapter four and the data is derived from interviews regarding ecosystem and the distribution of value in the bioenergy market. The third and conclusive part is based on the two initial analysis parts and will be the foundation for a diversification decision.
5.1 Mapping of the Bioenergy Market This chapter aims to map five different aspects of the market. The geographical markets will map the global distribution, growth and the main technologies. The technology markets will map the share of plants, maturity and technology leaders. The application market will map the share of plant cost, average cost per MW and order specifications. The revenue markets will map where revenue is derived from and how it is distributed. The operation and maintenance will map the different aspects of service and its respectively unique procurement. Table 4 describes the different aspects and trends of the geographical markets. Europe is the biggest market with about 30 percent of the total value distributed. The US and the South American market are mostly focused on biofuels and more than 50 percent of the US revenue is derived from biofuels. Table 4, Mapped geographical markets
The technology markets are mapped in Table 5. Combustion is the main technology with 60 percent of the total market share. This technology is mainly used in the biomass division but also commonly adopted in waste to energy. Transesterification and fermentation is the main technology in the biofuels division. This is also one of the most R&D intensive technologies, which has resulted in new technology standards such as the second generation of biofuels. Europe in general and Sweden in particular is the technology leaders and known for the development of combustion and biogas technologies. Even though co-firing only represent five percent of the total market is this still an interesting segment. Co-firing’s connection to traditional non-renewable power plants and having UK as a core market is putting the segment in a unique position for companies with existing business in non-renewable energy.
Geographical,Markets,
Total&& Europe& Asia& US& South&America&
Emerging&&
Size&($bn)& 160& 50& 40& 35&(18)& 15& 20&
Share& 100%& 31%& 25%& 22%& 9%& 13%&
Annual&growth&& 10F15%& 16%&& 15%& 12,5%& 17%& 10F20%&
Dominant&Division& Biomass& Biomass&/
WtE& WtE& Biofuels& Biofuels& All&
Main&technologies& CombusQon& CombusQons& IncineraQon& Fermenta
Qon& FermentaQon& Anaerobic&DigesQon&
CharacterisQcs&& Diverse&market&
Technology&leader&&
Small&scale&plants&
Driver&for&biofuels&
Growing&market&
Small&scale&plants&and&growing&market&
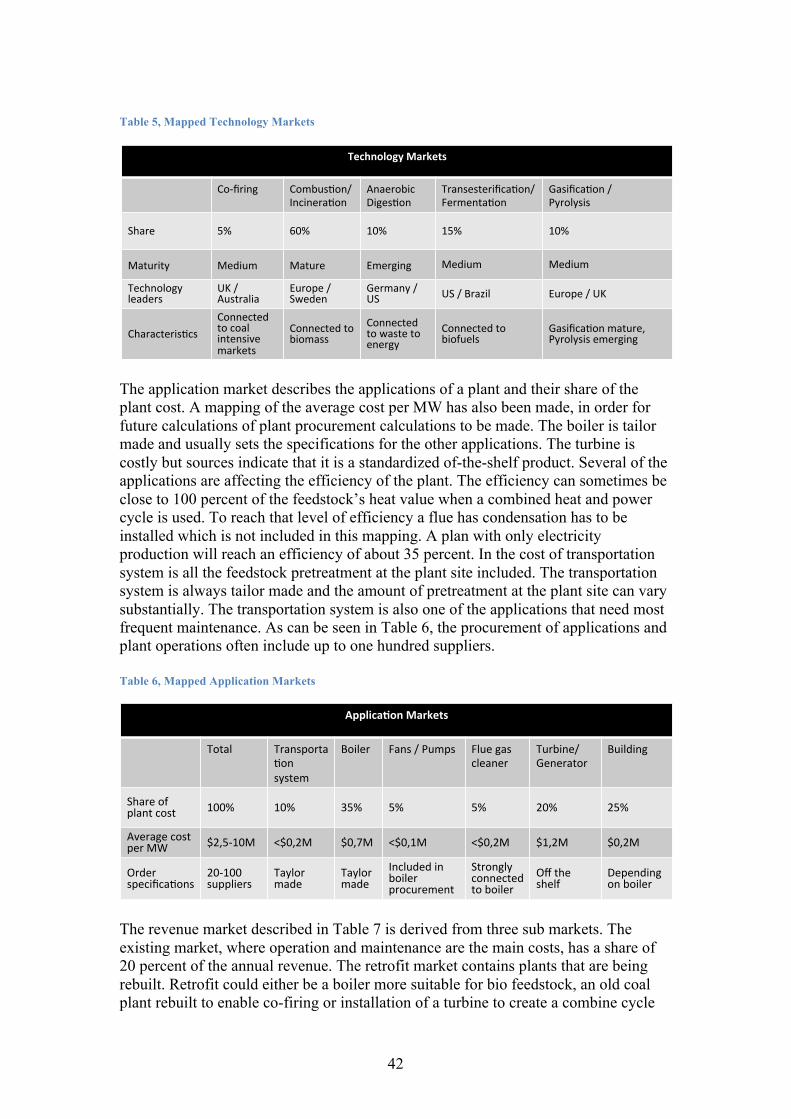
42
Table 5, Mapped Technology Markets
The application market describes the applications of a plant and their share of the plant cost. A mapping of the average cost per MW has also been made, in order for future calculations of plant procurement calculations to be made. The boiler is tailor made and usually sets the specifications for the other applications. The turbine is costly but sources indicate that it is a standardized of-the-shelf product. Several of the applications are affecting the efficiency of the plant. The efficiency can sometimes be close to 100 percent of the feedstock’s heat value when a combined heat and power cycle is used. To reach that level of efficiency a flue has condensation has to be installed which is not included in this mapping. A plan with only electricity production will reach an efficiency of about 35 percent. In the cost of transportation system is all the feedstock pretreatment at the plant site included. The transportation system is always tailor made and the amount of pretreatment at the plant site can vary substantially. The transportation system is also one of the applications that need most frequent maintenance. As can be seen in Table 6, the procurement of applications and plant operations often include up to one hundred suppliers. Table 6, Mapped Application Markets
The revenue market described in Table 7 is derived from three sub markets. The existing market, where operation and maintenance are the main costs, has a share of 20 percent of the annual revenue. The retrofit market contains plants that are being rebuilt. Retrofit could either be a boiler more suitable for bio feedstock, an old coal plant rebuilt to enable co-firing or installation of a turbine to create a combine cycle
Technology*Markets*
Co#firing* Combus-on//Incinera-on*
Anaerobic/Diges-on*
Transesterifica-on///Fermenta-on*
Gasifica-on////Pyrolysis*
Share/ 5%/ 60%/ 10%/ 15%/ 10%/
Maturity/ Medium/ Mature/ Emerging/ Medium/ Medium/
Technology/leaders/
UK///Australia/
Europe///Sweden/
Germany///US/ US///Brazil/ Europe///UK/
Characteris-cs//Connected/to/coal/intensive/markets//
Connected/to/biomass/
Connected/to/waste/to/energy/
Connected/to/biofuels/
Gasifica-on/mature,/Pyrolysis/emerging/
Applica'on*Markets*
Total& Transporta+on&
system&
Boiler&&
Fans&/&Pumps& Flue&gas&cleaner&
Turbine/&Generator&
Building&
Share&of&plant&cost& 100%& 10%& 35%& 5%& 5%& 20%& 25%&
Average&cost&per&MW& $2,5I10M& <$0,2M& $0,7M& <$0,1M& <$0,2M& $1,2M& $0,2M&
Order&specifica+ons&&
20I100&suppliers&
Taylor&made&
Taylor&made&
Included&in&boiler&procurement&
Strongly&connected&to&boiler&
Off&the&shelf&
Depending&on&boiler&&
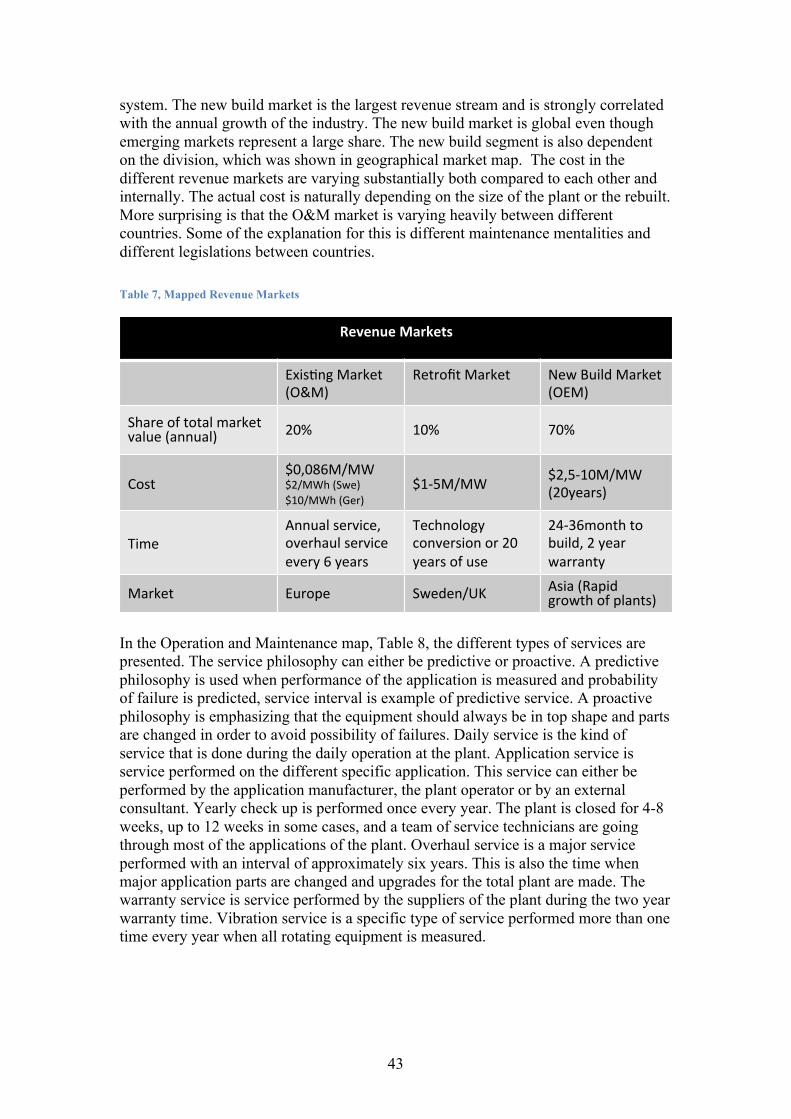
43
system. The new build market is the largest revenue stream and is strongly correlated with the annual growth of the industry. The new build market is global even though emerging markets represent a large share. The new build segment is also dependent on the division, which was shown in geographical market map. The cost in the different revenue markets are varying substantially both compared to each other and internally. The actual cost is naturally depending on the size of the plant or the rebuilt. More surprising is that the O&M market is varying heavily between different countries. Some of the explanation for this is different maintenance mentalities and different legislations between countries.
Table 7, Mapped Revenue Markets
In the Operation and Maintenance map, Table 8, the different types of services are presented. The service philosophy can either be predictive or proactive. A predictive philosophy is used when performance of the application is measured and probability of failure is predicted, service interval is example of predictive service. A proactive philosophy is emphasizing that the equipment should always be in top shape and parts are changed in order to avoid possibility of failures. Daily service is the kind of service that is done during the daily operation at the plant. Application service is service performed on the different specific application. This service can either be performed by the application manufacturer, the plant operator or by an external consultant. Yearly check up is performed once every year. The plant is closed for 4-8 weeks, up to 12 weeks in some cases, and a team of service technicians are going through most of the applications of the plant. Overhaul service is a major service performed with an interval of approximately six years. This is also the time when major application parts are changed and upgrades for the total plant are made. The warranty service is service performed by the suppliers of the plant during the two year warranty time. Vibration service is a specific type of service performed more than one time every year when all rotating equipment is measured.
Revenue&Markets&
Exis%ng(Market(
(O&M)&Retrofit(Market& New(Build(Market(
(OEM)&
Share(of(total(market(value((annual)(
20%( 10%( 70%(
Cost($0,086M/MW($2/MWh((Swe)(
$10/MWh((Ger)(
$1N5M/MW($2,5N10M/MW(
(20years)(
Time(
Annual(service,(
overhaul(service(
every(6(years(
Technology(
conversion(or(20(
years(of(use(
24N36month(to(
build,(2(year(
warranty(
Market( Europe( Sweden/UK(Asia((Rapid(growth(of(plants)(

44
Table 8, Mapped Operation and Maintanance
5.2 The ecosystem The ecosystem analysis aims at analyzing the health of the ecosystem and the value creation and capture possibilities of the ecosystem. The section is divided into three sub-sections; health of the ecosystem, value creation and value capture. Below follows an analysis of the bioenergy market’s ecosystems. The analyzed data is primarily based on interviews. The list of interviewees can be seen in appendix III. The ecosystem will be divided in five different mappings; overall players and supply chain, networks, cash flows, innovation relations and commonly integrated actors. The complete mappings can be seen in appendix IV. The general ecosystem, as can be seen in Figure 32, has its focal point at the application manufacturer and the ecosystem is divided into four sections; service and maintenance, support functions, the supply chain and influencers. The Figure 32 below describes the ecosystem and its actors, divided into four sections. The arrows describe the supply chain of products and applications.
Figure 32, Mapping of the actors in the ecosystem divided into four sections
Opera&on)&)Maintenance)(O&M))
Daily&service) Applica.on&service)
Yearly&Check5ups)
Overhaul&service&)
Warranty&Service)
Vibra.on&service)
Cost&structure&
$2/MWh&(Swe)&$10/MWh&(Ger)&
Applica.on&procurement&
Special&procurement&
Extra&service,¬&included&in&procurement&
Included&in&price&
One&.me&cost&
Philosophy& Predic.ve&Predic.ve/proac.ve&&
Predic.ve/proac.ve& Predic.ve& Proac.ve& Proac.ve&
Time& Every&day& Yearly&&&emergency& 458&weeks.& Every&6th&year& 2&years& 152&.mes&
per&year&
Applica'on*eq.*provider*
R&D*
Applica'on*manufacturer*
Applica'on*service*
Investors*
Plant*owner/operator*
Plant*Builder*
Energy*provider*
Feedstock*supplier*
Consultant* Overall*Plant*service*
Government*
Service*and*Maintenance*
Support*func'ons*
Influencers*
Suppor'ng*applica'on*
Manufacturer*
NonJgovernmental*organiza'ons*
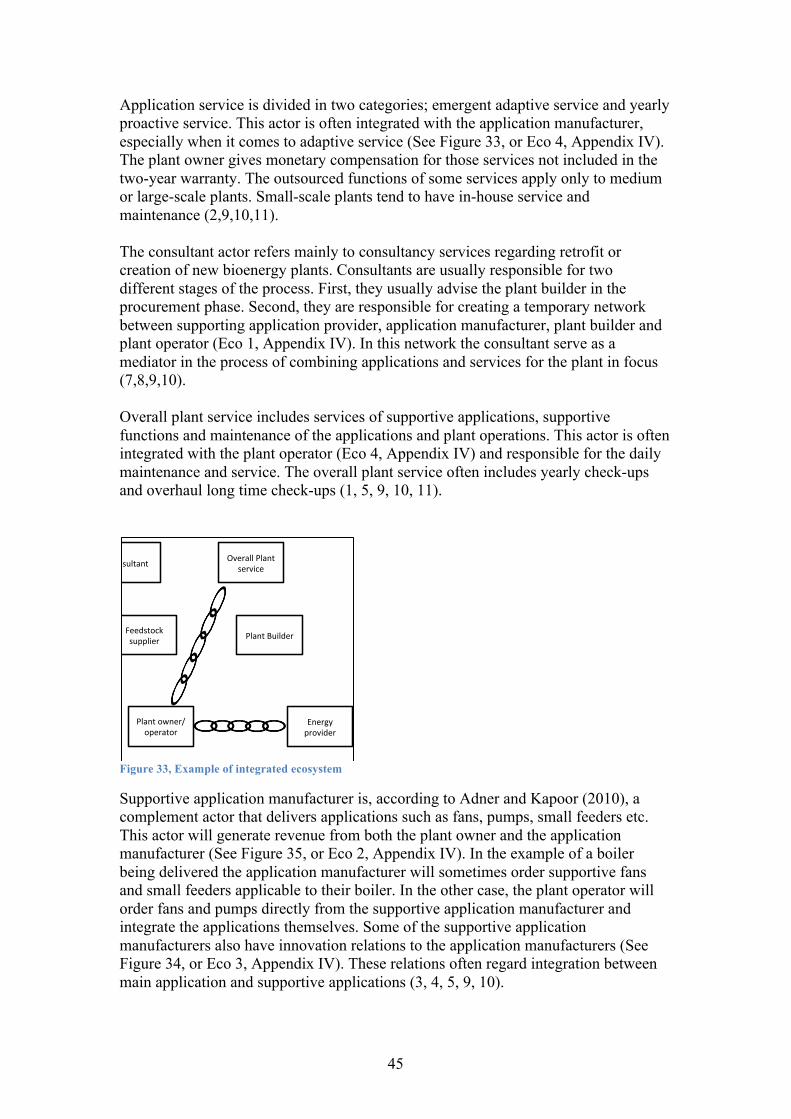
45
Application service is divided in two categories; emergent adaptive service and yearly proactive service. This actor is often integrated with the application manufacturer, especially when it comes to adaptive service (See Figure 33, or Eco 4, Appendix IV). The plant owner gives monetary compensation for those services not included in the two-year warranty. The outsourced functions of some services apply only to medium or large-scale plants. Small-scale plants tend to have in-house service and maintenance (2,9,10,11). The consultant actor refers mainly to consultancy services regarding retrofit or creation of new bioenergy plants. Consultants are usually responsible for two different stages of the process. First, they usually advise the plant builder in the procurement phase. Second, they are responsible for creating a temporary network between supporting application provider, application manufacturer, plant builder and plant operator (Eco 1, Appendix IV). In this network the consultant serve as a mediator in the process of combining applications and services for the plant in focus (7,8,9,10). Overall plant service includes services of supportive applications, supportive functions and maintenance of the applications and plant operations. This actor is often integrated with the plant operator (Eco 4, Appendix IV) and responsible for the daily maintenance and service. The overall plant service often includes yearly check-ups and overhaul long time check-ups (1, 5, 9, 10, 11).
Figure 33, Example of integrated ecosystem
Supportive application manufacturer is, according to Adner and Kapoor (2010), a complement actor that delivers applications such as fans, pumps, small feeders etc. This actor will generate revenue from both the plant owner and the application manufacturer (See Figure 35, or Eco 2, Appendix IV). In the example of a boiler being delivered the application manufacturer will sometimes order supportive fans and small feeders applicable to their boiler. In the other case, the plant operator will order fans and pumps directly from the supportive application manufacturer and integrate the applications themselves. Some of the supportive application manufacturers also have innovation relations to the application manufacturers (See Figure 34, or Eco 3, Appendix IV). These relations often regard integration between main application and supportive applications (3, 4, 5, 9, 10).
Applica'on*eq.*provider*
R&D*
Applica'on*manufacturer*
Applica'on*service*
Investors*
Plant*owner/operator*
Plant*Builder*
Energy*provider*
Feedstock*supplier*
Consultant* Overall*Plant*service*
Government*
Service*and*Maintenance*
Support*func'ons*
Influencers*
Suppor'ng*applica'on*
Manufacturer*
NonJgovernmental*organiza'ons*

46
Feedstock supplier is the actor that provides the plant with the feedstock. This actor has often a close relation to the plant operator, mainly because of the barriers to overcome concerning feedstock size, transportation, delivery, properties, measurement and handling. Because of the leveled cost of production the cost of feedstock transportation has become more noteworthy in order to decrease the overall cost (5, 7, 10, 11). Plant Builder is the actor that builds the plant. This actor is often considered to be at least handful of companies in the process of building. The actor often takes part in the temporary network regarding the plant build or retrofit (5,9,10).
Figure 34, Example of innovation ecosystem
Application equipment provider is a component actor that delivers equipment to the application manufacturer. Dependent on the nature of the actor, the application equipment provider is sometimes delivering both components to the application manufacturer and components to the supportive application manufacturer. By this, the company will gain a leading market position regarding both product delivery and the possibility for innovation relations (Eco 3, Appendix IV). The application equipment provider also has innovation relations with various R&D actors (2, 4, 5, 8, 9, 10). Application manufacturer is the focal actor of the mapped ecosystem. The actor delivers the main technologies such as boilers or turbines to the plants. It is also often responsible for service and maintenance of the delivered products. The application manufacturer will be responsible for the main parts of the cost of building a plant. Dependent on the application this cost varies between 10% and 50% of the total cost of the plant. The application manufacturer will also have many innovation relations and is one of the key players in developing the technology and cost structure of bioenergy plants (2, 5, 9, 10). Plant owner/operator covers some of the daily services and operations. This actor is often the key player in the procurement phase and the actor that needs to address the most stakeholders in a project. The plant owner/operator is often integrated with the energy provider (Eco 4, Appendix IV). Energy provider is, as mentioned above, often the same company as the owner/operator. The energy provider is often a company divided in two functions. Firstly, the company has a function of providing energy and dealing with consumers and government functions (Eco 2, Appendix IV). Secondly, the company often produces their own power in an individual division of the company. The energy provider will mainly provide heat, electricity or biofuels (2, 4, 5, 9, 10).
Applica'on*eq.*provider*
Suppor'ng*applica'on*
Manufacturer*
R&D*
Applica'on*manufacturer*
Applica'on*service*
Investors*
Plant*owner/operator*
Plant*Builder*
Energy*provider*
Feedstock*supplier*
Consultant* Overall*Plant*service*
Government*
Service*and*Maintenance*
Support*func'ons*
Influencers*
NonJgovernmental*organiza'ons*
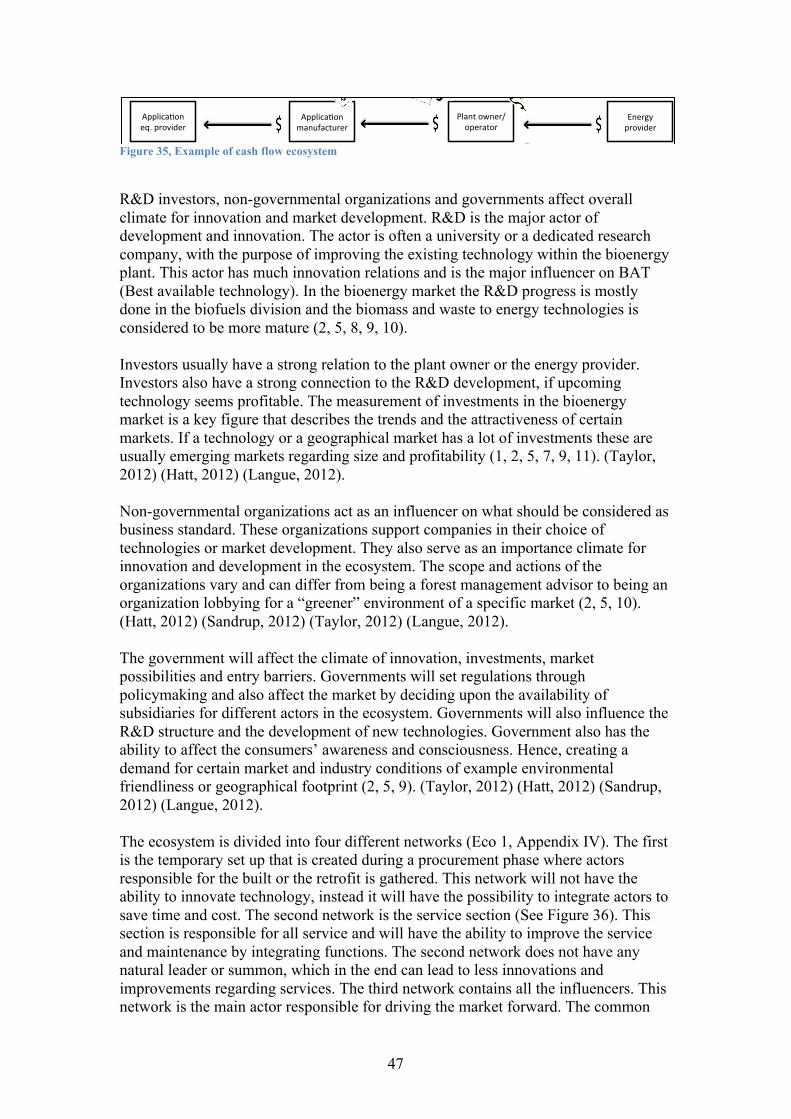
47
Figure 35, Example of cash flow ecosystem
R&D investors, non-governmental organizations and governments affect overall climate for innovation and market development. R&D is the major actor of development and innovation. The actor is often a university or a dedicated research company, with the purpose of improving the existing technology within the bioenergy plant. This actor has much innovation relations and is the major influencer on BAT (Best available technology). In the bioenergy market the R&D progress is mostly done in the biofuels division and the biomass and waste to energy technologies is considered to be more mature (2, 5, 8, 9, 10). Investors usually have a strong relation to the plant owner or the energy provider. Investors also have a strong connection to the R&D development, if upcoming technology seems profitable. The measurement of investments in the bioenergy market is a key figure that describes the trends and the attractiveness of certain markets. If a technology or a geographical market has a lot of investments these are usually emerging markets regarding size and profitability (1, 2, 5, 7, 9, 11). (Taylor, 2012) (Hatt, 2012) (Langue, 2012). Non-governmental organizations act as an influencer on what should be considered as business standard. These organizations support companies in their choice of technologies or market development. They also serve as an importance climate for innovation and development in the ecosystem. The scope and actions of the organizations vary and can differ from being a forest management advisor to being an organization lobbying for a “greener” environment of a specific market (2, 5, 10). (Hatt, 2012) (Sandrup, 2012) (Taylor, 2012) (Langue, 2012). The government will affect the climate of innovation, investments, market possibilities and entry barriers. Governments will set regulations through policymaking and also affect the market by deciding upon the availability of subsidiaries for different actors in the ecosystem. Governments will also influence the R&D structure and the development of new technologies. Government also has the ability to affect the consumers’ awareness and consciousness. Hence, creating a demand for certain market and industry conditions of example environmental friendliness or geographical footprint (2, 5, 9). (Taylor, 2012) (Hatt, 2012) (Sandrup, 2012) (Langue, 2012). The ecosystem is divided into four different networks (Eco 1, Appendix IV). The first is the temporary set up that is created during a procurement phase where actors responsible for the built or the retrofit is gathered. This network will not have the ability to innovate technology, instead it will have the possibility to integrate actors to save time and cost. The second network is the service section (See Figure 36). This section is responsible for all service and will have the ability to improve the service and maintenance by integrating functions. The second network does not have any natural leader or summon, which in the end can lead to less innovations and improvements regarding services. The third network contains all the influencers. This network is the main actor responsible for driving the market forward. The common
Applica'on*eq.*provider*
Suppor'ng*applica'on*
Manufacturer*
R&D*
Applica'on*manufacturer*
Applica'on*service*
Investors*
Plant*owner/operator*
Plant*Builder*
Energy*provider*
Feedstock*supplier*
Consultant* Overall*Plant*service*
Government*
Service*and*Maintenance*
Support*func'ons*
Influencers*
NonJgovernmental*organiza'ons*
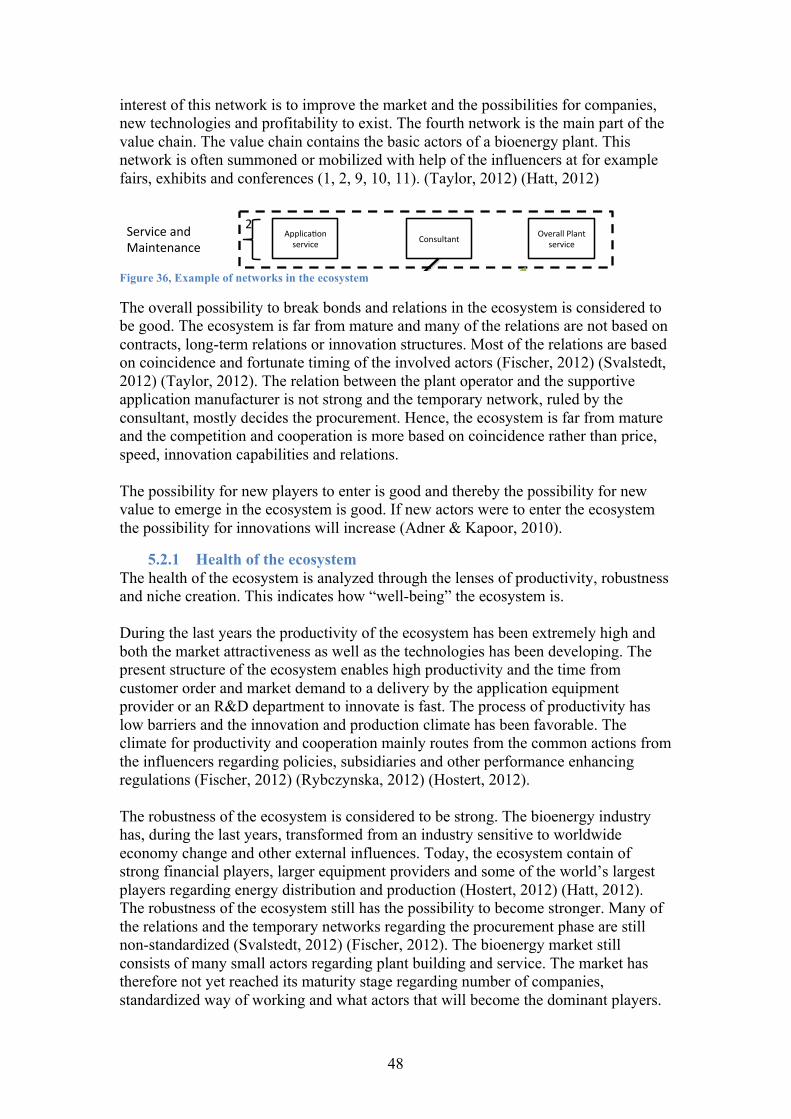
48
interest of this network is to improve the market and the possibilities for companies, new technologies and profitability to exist. The fourth network is the main part of the value chain. The value chain contains the basic actors of a bioenergy plant. This network is often summoned or mobilized with help of the influencers at for example fairs, exhibits and conferences (1, 2, 9, 10, 11). (Taylor, 2012) (Hatt, 2012)
Figure 36, Example of networks in the ecosystem
The overall possibility to break bonds and relations in the ecosystem is considered to be good. The ecosystem is far from mature and many of the relations are not based on contracts, long-term relations or innovation structures. Most of the relations are based on coincidence and fortunate timing of the involved actors (Fischer, 2012) (Svalstedt, 2012) (Taylor, 2012). The relation between the plant operator and the supportive application manufacturer is not strong and the temporary network, ruled by the consultant, mostly decides the procurement. Hence, the ecosystem is far from mature and the competition and cooperation is more based on coincidence rather than price, speed, innovation capabilities and relations. The possibility for new players to enter is good and thereby the possibility for new value to emerge in the ecosystem is good. If new actors were to enter the ecosystem the possibility for innovations will increase (Adner & Kapoor, 2010).
5.2.1 Health of the ecosystem The health of the ecosystem is analyzed through the lenses of productivity, robustness and niche creation. This indicates how “well-being” the ecosystem is. During the last years the productivity of the ecosystem has been extremely high and both the market attractiveness as well as the technologies has been developing. The present structure of the ecosystem enables high productivity and the time from customer order and market demand to a delivery by the application equipment provider or an R&D department to innovate is fast. The process of productivity has low barriers and the innovation and production climate has been favorable. The climate for productivity and cooperation mainly routes from the common actions from the influencers regarding policies, subsidiaries and other performance enhancing regulations (Fischer, 2012) (Rybczynska, 2012) (Hostert, 2012). The robustness of the ecosystem is considered to be strong. The bioenergy industry has, during the last years, transformed from an industry sensitive to worldwide economy change and other external influences. Today, the ecosystem contain of strong financial players, larger equipment providers and some of the world’s largest players regarding energy distribution and production (Hostert, 2012) (Hatt, 2012). The robustness of the ecosystem still has the possibility to become stronger. Many of the relations and the temporary networks regarding the procurement phase are still non-standardized (Svalstedt, 2012) (Fischer, 2012). The bioenergy market still consists of many small actors regarding plant building and service. The market has therefore not yet reached its maturity stage regarding number of companies, standardized way of working and what actors that will become the dominant players.
3""""""""
4""""
2"""
Applica+on"eq."provider"
Suppor+ng"applica+on"
Manufacturer"
R&D"
Applica+on"manufacturer"
Applica+on"service"
Investors"
Plant"owner/operator"
Plant"Builder"
Energy"provider"
Feedstock"supplier"
Consultant"Overall"Plant"
service"
Government"
1"
Service"and"Maintenance"
Support"func+ons"
Influencers"
NonNgovernmental"organiza+ons"
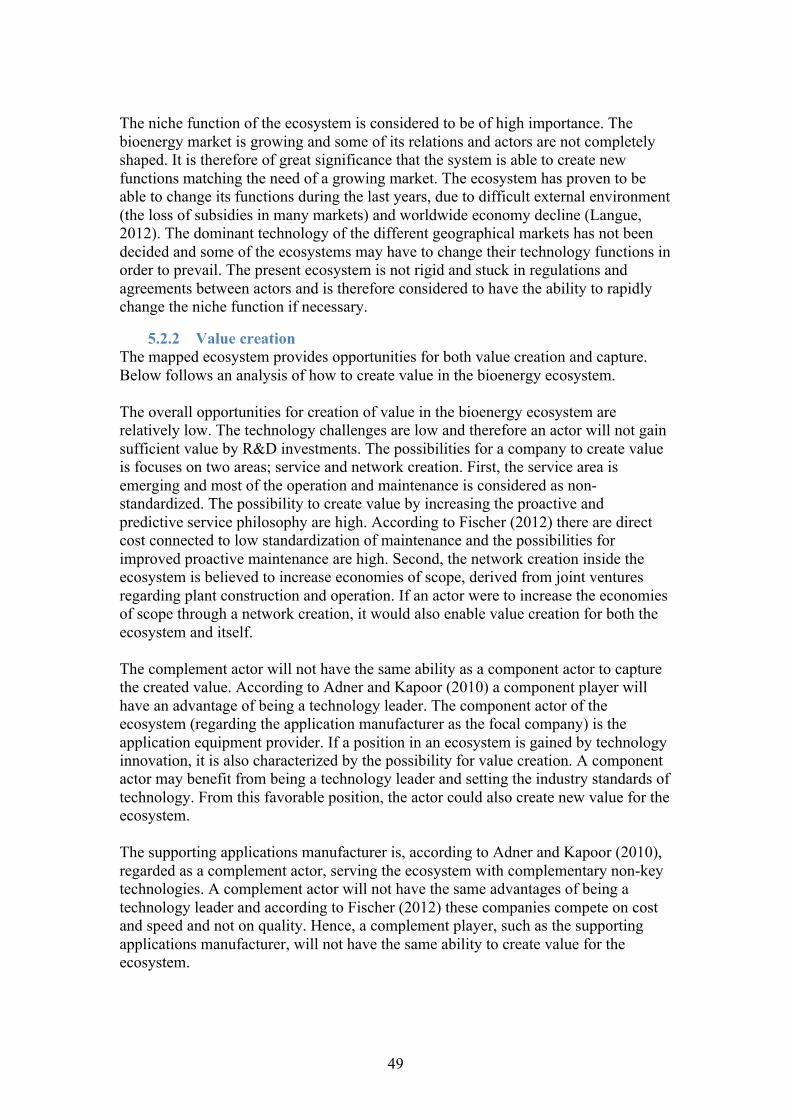
49
The niche function of the ecosystem is considered to be of high importance. The bioenergy market is growing and some of its relations and actors are not completely shaped. It is therefore of great significance that the system is able to create new functions matching the need of a growing market. The ecosystem has proven to be able to change its functions during the last years, due to difficult external environment (the loss of subsidies in many markets) and worldwide economy decline (Langue, 2012). The dominant technology of the different geographical markets has not been decided and some of the ecosystems may have to change their technology functions in order to prevail. The present ecosystem is not rigid and stuck in regulations and agreements between actors and is therefore considered to have the ability to rapidly change the niche function if necessary.
5.2.2 Value creation The mapped ecosystem provides opportunities for both value creation and capture. Below follows an analysis of how to create value in the bioenergy ecosystem. The overall opportunities for creation of value in the bioenergy ecosystem are relatively low. The technology challenges are low and therefore an actor will not gain sufficient value by R&D investments. The possibilities for a company to create value is focuses on two areas; service and network creation. First, the service area is emerging and most of the operation and maintenance is considered as non-standardized. The possibility to create value by increasing the proactive and predictive service philosophy are high. According to Fischer (2012) there are direct cost connected to low standardization of maintenance and the possibilities for improved proactive maintenance are high. Second, the network creation inside the ecosystem is believed to increase economies of scope, derived from joint ventures regarding plant construction and operation. If an actor were to increase the economies of scope through a network creation, it would also enable value creation for both the ecosystem and itself. The complement actor will not have the same ability as a component actor to capture the created value. According to Adner and Kapoor (2010) a component player will have an advantage of being a technology leader. The component actor of the ecosystem (regarding the application manufacturer as the focal company) is the application equipment provider. If a position in an ecosystem is gained by technology innovation, it is also characterized by the possibility for value creation. A component actor may benefit from being a technology leader and setting the industry standards of technology. From this favorable position, the actor could also create new value for the ecosystem. The supporting applications manufacturer is, according to Adner and Kapoor (2010), regarded as a complement actor, serving the ecosystem with complementary non-key technologies. A complement actor will not have the same advantages of being a technology leader and according to Fischer (2012) these companies compete on cost and speed and not on quality. Hence, a complement player, such as the supporting applications manufacturer, will not have the same ability to create value for the ecosystem.

50
The ecosystem mapped also contains several keystone actors. A keystone actor is defined as: “…great knowledge and importance knowledge for the functions of the ecosystem. For an ecosystem to be healthy the keystone player has to create value within the ecosystem and share this value…” The identified keystone actors are the government, the consultants, the plant owner/operator and the energy provider. The government has a continuous ability to share its knowledge and the ability to affect and create value. The role of the consultants is to share their knowledge and without this actor much of the key knowledge of plant building will be lost. The plant owner/operator and the energy provider is a key player regarding the plant operations and market demand. If these insights were shared with government and other influencers the ecosystem would probably increase its efficiency. The keystone actors are, per definition, not supposed to capture all of the value created. The position as a keystone actor will enable high value creation. Other actors with the possibility of being a keystone actor are the investors and the application equipment manufacturer (component actor). If the investors are inclined to share their insight of the market outlook, the ecosystem will be healthier and its ability to create value will increase. If treated correctly the component actor could have a strong effect on the produced value of the ecosystem. The component actor has high technology insight and expertise, and if the actor were to share this knowledge with application manufacturers and plant operators, energy could be saved and the cost of production could be decreased. If the component actor will be a keystone actor is dependent on the ability to capture the created value. If the component actor shares too much of the created value and business intelligence, it risks losing some of its major competitive advantages. The process of value creation and capture will also focus around the different networks inside the ecosystem. Some networks, such as the procurement network, will naturally have an ability to share value, thereby creating value for all the players of the network. The supply chain network will naturally have a resistance for sharing knowledge and value. The resistance for sharing is caused by the fear of a vertical integration by a company’s supplier or buyer.
5.2.3 Value capture The possibilities to capture value are dependent on several features within the ecosystem. The key ability to compete on the bioenergy market is not IP protection. The demand for best available technology (BAT) is low and therefore the incentives for innovation and IP rights are low. The value appropriation is therefore not singularly based on IP rights. The procurement of a plant is, as mentioned before, not standardized and mostly based on timing and coincidence. It is therefore hard for an actor to create strong relationships to increase its ability to capture future value. The possibilities for value capture will instead be focused on standardized markets. A standardized procurement will enhance a company’s ability to capture value. Therefore companies must try to

51
seek standardized environment where the basis of competition can be outlined and where it is not based on coincidence. The actor that has the main possibility for technology value capture is the application equipment provider and the application manufacturer. If these component actors increase its technological advantage of a key technology, they will create a lock-in effect on the ecosystem. This meaning that the ecosystem will be dependent on the advantages of the key technology. In this case the actor has increased its chance of sustaining the value created.
5.3 Mapping of potential diversification This chapter aims at combining the findings and analysis regarding the bioenergy market mapping and the ecosystem analysis. The emphasis is on the possible level of value creation and value capture of the identified modules from the market mapping. The combination of these areas will be a direct answer to the thesis’s main research question. In order to describe the possibilities of diversification the value creation and capture matrix was created, see Figure 37. This matrix is the tool used for the analysis the different types of diversifications. The level of possible value creation and value capture is described on a scale from low to high. In Figure 37, the matrix is divided into four quadrants, each representing a different type of diversification. In the top right corner, keystone strategy is present. The opportunity for being a keystone actor occurs when there is a high possibility of value creation and high value capture. Keystone strategy implies an opportunity to become an important actor for innovation in the ecosystem. In the top left corner, there is an opportunity for a market penetration strategy. Market penetration strategy occurs when the possibility of innovation is high, value creation, but the possibility for capturing this value is lower. This situation often occurs when the market is immature and the ecosystem is not clearly defined. The challenge is to build a more stable ecosystem where the networks can benefit from stronger and more influential actors. Market penetration strategy is most commonly used in emerging market or undiscovered markets. In the bottom left corner, low-cost strategy is present. The level of value creation and value capture is low. Hence, the diversification process will not be valuable or critical for the focal company. Therefore, a low-cost strategy will serve as a possibility to gain large market shares. In the bottom right corner, differentiation strategy is situated. A differentiation strategy occurs when the possibility of value capture is high but the value creation is low. This implies that the focal firm should not focus on R&D but instead focus on creating beneficial relations and a different position on the market. The differentiation strategy will not have its main focus on technology innovation, instead it will focus on a unique market position that can obtain the value created.

52
Figure 37, The create/capture matrix
In Figure 38 the identified modules from the bioenergy market mapping has been converted to segments. Each circle in the figure represents a segment with a certain level of value creation and capture possibility. The high/low ranking is not absolute values but merely a relation between the different segments. High capture is defined as the ability to perform well and obtaining a favorable position in the ecosystem. High capture could also be obtained by being at the right place in the ecosystem and having the ability to keep customer. High capture is hence related to obtaining a sustainable position after the diversification process. High value creation is defined as the ability to improve technology or in other way create value for the actors in the ecosystem. High value creation does not imply high value capture. In Figure 38, the plotted segments give an indication for what type of strategy is suitable to use for a diversification. Each of the segments has been analyzed after the possibility for value creation and value capture separately. The report highlights that the positions are not absolute and are not the intention of the map, instead the focus of this analysis is the relation between the segments and in which quadrant they are positioned. The colors of the circles indicate from which section the segment is selected. Red color indicate the geographical segments, black color indicate the technological segments, blue color indicate the application segments and green color indicate the service segments. The size of the circle gives an indication for the value of the specific segment. The sizes range from small to large, where large has an annual value of more than $20bn and small circles has a lower annual value than $5bn.
Value Capture
Value Creation
Keystone((Strategy(
Differen0a0on(Strategy(
Market(penetra0on(Strategy(
Low6Cost(Strategy((
High
High
Low
Low
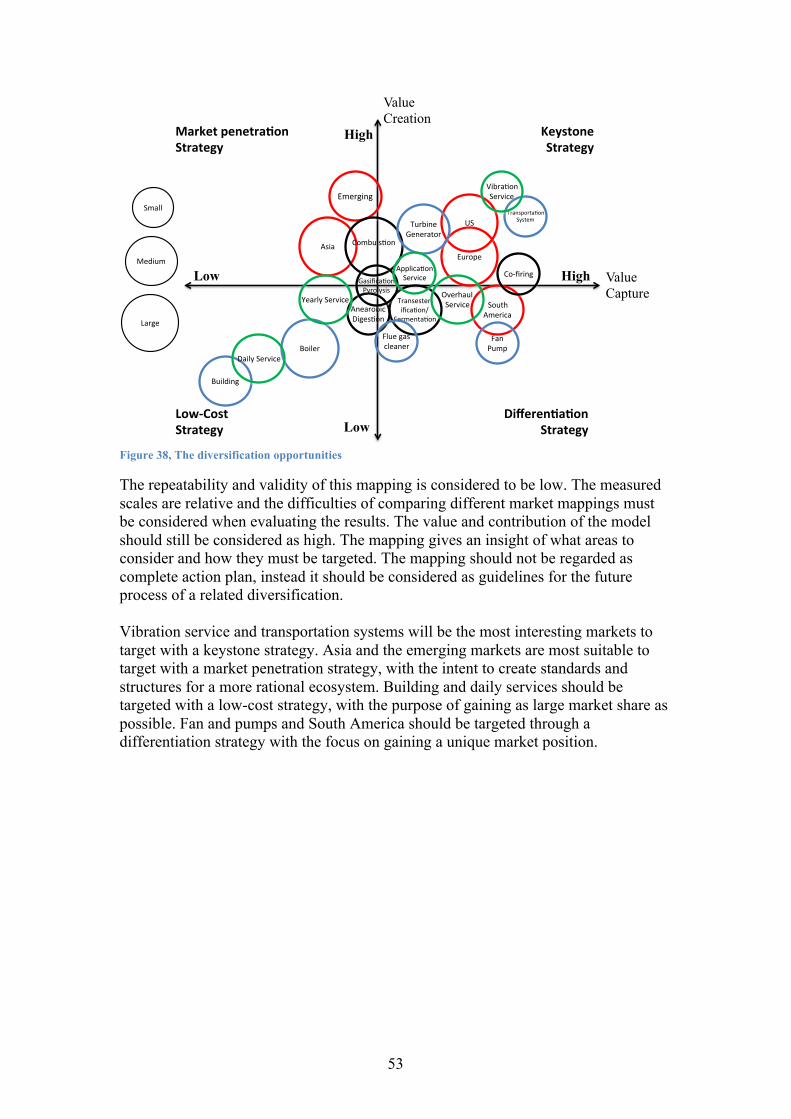
53
Figure 38, The diversification opportunities
The repeatability and validity of this mapping is considered to be low. The measured scales are relative and the difficulties of comparing different market mappings must be considered when evaluating the results. The value and contribution of the model should still be considered as high. The mapping gives an insight of what areas to consider and how they must be targeted. The mapping should not be regarded as complete action plan, instead it should be considered as guidelines for the future process of a related diversification. Vibration service and transportation systems will be the most interesting markets to target with a keystone strategy. Asia and the emerging markets are most suitable to target with a market penetration strategy, with the intent to create standards and structures for a more rational ecosystem. Building and daily services should be targeted with a low-cost strategy, with the purpose of gaining as large market share as possible. Fan and pumps and South America should be targeted through a differentiation strategy with the focus on gaining a unique market position.
Value Creation
Medium'
Large'
Small'
Europe'
US'
South''America'
Asia'
Emerging'
Combu's:on''
Transester<'ifica:on/''
Fermenta:on'
Co<firing'
Anearobic'Diges:on'
Gasifica:on'Pyrolysis'
Boiler'
Turbine'Generator'
Building'
Flue'gas'cleaner'
Fan'Pump'
Transporta:on'System'
Daily'Service'
Yearly'Service'
Applica:on'Service'
Overhaul''Service'
Vibra:on'Service'
Value Capture
High
High
Low
Low
Keystone((Strategy(
Differen0a0on(Strategy(
Market(penetra0on(Strategy(
Low6Cost(Strategy((
54
6. Discussion In this discussion chapter, the main purpose is to lift issues related to studied company SKF. The discussion will highlight opportunities and describe SKF’s role in the ecosystem. The discussion will conclude where in the eco system the company should enter and where they have the best opportunities. Several interesting implication for SKF can be drawn from the mapping of the bioenergy market. The bioenergy market is big enough for SKF to consider diversification. The size of the total market is extensive and the combustion segment, the European market and large parts of the service market separately are big enough to analyze further. The most suitable technological market segment for SKF is: co-firing and combustion. The size of the combustion segment is attractive and the technology is fairly mature. SKF does already have business within non-renewable energy industry and therefore the co-firing segment is attractive as it has strong connection to the non-renewable energy market. The next step after changing a coal plant to co-firing is to convert it completely to a biomass plant. Entering the co-firing segment might hence be a way into the biomass segment as well. Regarding the biofuel division, the processes are more chemical then mechanical implying that SKF’s competences are not central for this division. The pretreatment of the feedstock, such as grinding, would also be a suitable segment for SKF to consider, this segment is not covered in the thesis, as it is mostly externally located to the plant. Regarding the application segments, the transportation system and the turbines are most interesting from the perspective of SKF. The transportation system is interesting for two reasons. Firstly, the amount of rotating material is high and secondly because the need for maintenance of this application is big. The turbine is interesting because of the rotating nature of the turbine and generator. SKF has the knowledge to develop the quality of turbines, something they have shown in the wind turbine industry. The turbine is the key application for SKF to consider in a bioenergy power plant. The indications for that the turbine is of-the-shelf does however lower the degree of opportunity the turbine and generator imply. Service might represent a key segment for SKF to consider. SKF has traditionally obtained a larger share of the service cost than of the OEM cost for other industries. For example is the specific vibration service an area that is part of SKF’s core competencies. With SKF’s ability to develop more efficient and reliable rotating applications, the most technological evolved segment, with demands for higher efficiency, often represent great opportunities. That should imply that Europe and combustion could be good segments for SKF to enter the bioenergy market. However, the demand for efficiency is currently considered as low in these segments. Furthermore is the demand for unique rotating equipment low in the overall bioenergy market. There are few of SKF’s more technical and specially made products that are obviously demanded by major actors within the bioenergy market. There is a challenge for SKF to obtain a profitable position in the industry and this implies that the place to strive for in the ecosystem is not obvious.
55
The procurement of plants can either be made by the buyer, a keystone supplier or outsourced to a consultant. The most common is that the buyer is running the procurement or that the boiler supplier is the keystone supplier. This means that SKF has no direct critical product to offer the buyer or keystone supplier. Furthermore is the boiler seen as the heart of the plant and the turbine is described as an off-the-shelf product. Therefore, SKF has to find other ways to influence the market in order to become a valuable actor. SKF is able to apply their business and product portfolios to several types of actors in the ecosystem, namely; application equipment manufacturer, supportive application manufacturer, application service and overall service. This implies that SKF will have the ability to become a component and a complement actor at the same time. The complement actor usually competes on price and the component actor usually competes on a technology excellence. This enables a unique opportunity to consolidate the application equipment and the supportive applications in the same offer. SKF will then create a mini-monopoly regarding both the applications and knowledge. If SKF were to offer both components and complements the value capture possibilities will increase and the company’s motivation to share knowledge will increase. If SKF becomes a keystone actor in the ecosystem the company may get more industry power than most of the larger actors. If SKF becomes a keystone actor it will also have the possibility to control the service and maintenance of the different applications. The present industry and ecosystem have low technological challenges regarding components and therefore it will not be any great early mover advantage as if there were higher challenges. For SKF, this means that the company will not create a lock-in effect if they move early into the market. Instead, the company must strive to find other solutions that make them a key actor with indispensable knowledge and an indispensable position in the ecosystem. From the diversification analysis it can be concluded that some segments are more interesting to consider for SKF. The most suitable quadrant for SKF to be in is the technological diversification quadrant. One example of a good segment for SKF here is the application service segment. This specific segment is small in terms of value but because SKF is considered to be able to both create and capture value for the segment their opportunity here is big. If the company is able to both create and capture value in the specific segment, this might be a way for them to enter further into the industry and obtaining a preferable position in other segments as well. In total, the opportunities for SKF to diversify into the bioenergy market are existing but limited. The current situation is not demanding the highly technical services and products that SKF wants to provide but the future for the bioenergy market might represent greater opportunities in coming years. SKF has competencies that have the potential to improve the efficiency of the industry in several fields. By taking advantage of the structure of the ecosystem they will be able to obtain a preferable position in the industry.
56
7. Conclusions This chapter presents the conclusions of the research question together with the findings of the three sub questions. The overall research question of this study is: How can an ecosystem analysis and market mapping be combined to describe the bioenergy market and serve as a decision base for a diversification process? Sub question 1: How should the bioenergy market be mapped in order to describe the value of the market? The bioenergy market mapping should consider five different aspects:
• The validity of sources • Mapping of three technology divisions • Three different revenue streams • Co-dependent modules • The addition of qualitative data
The bioenergy market is an emerging market with several divisions and technologies. It is therefore important to have valid sources when mapping the market. This will increase the validity and usefulness of the result. The bioenergy market is clearly divided into three technology divisions; Biofuels, biomass and waste to energy. These three have different entities regarding feedstock, geographical footprint and future growth. It is therefore important that the mapping is divided into these three segments. The value is of the bioenergy market is derived from three different types of revenue streams; retrofit market, present market and new build market. In order for a company to describe the possibilities for value it needs to consider these three aspects of possible revenue streams. In order to make the results of the mapping useful, it is important that the mapping is divided into modules. These modules correspond to a unique segment where each module is independent. Calculation of the bioenergy market is not a sufficient mapping. There needs to be additional qualitative data such as trends or market indications. In order to be able to analyze the market mapping the data must contain of both quantitative and qualitative data. Sub question 2: How is the ecosystem of the bioenergy market constructed? The ecosystem of the bioenergy market has 13 main actors. These actors are: application service, consultant, overall plant service, supporting application manufacturer, feedstock supplier, plant builder, application equipment provider, application manufacturer, plant owner/operator, energy provider, R&D, investor, non-governmental organizations, government. The bioenergy market is best described through the ecosystem lenses of supply chain, cash flow, innovation relations, networks and integrated actors. These five ecosystems create a substantial base for the value creation and value capture analysis.
57
Sub question 2: What value can be created and captured in the ecosystem of the bioenergy market? The bioenergy does not offer much value creation through technology improvements. Instead, there are two major ways to create value; service and network creation. The service structure is not mature and an improved service will increase the value for the customers. Strengthened service structure will increase the applications’ operative length and the operative efficiency of the plant. In order to create value in the ecosystem networks may be created. This would save costs because of increased economies of scope. A company that takes an advantage of the economies of scope will also increase the value capture. The opportunities to capture value are the mature and large markets where a company can has the chance to differentiate to improve its possibilities to compete. These markets offer a structured basis for competition and in the long-term a company might even have the possibility to set new business standards. Overall research question: How can an ecosystem analysis and market mapping be combined to describe the bioenergy market and serve as a decision base for a diversification process? In order to combine the ecosystem analysis and market mapping the mapping must contain of both qualitative data such as talks about value and size, but also trends and qualitative data. The ecosystem analysis describes where and how to enter a through a unique strategy connected to a related diversification. The analysis also describes potential business areas and how to act in order to gain a favorable position in the ecosystem after the diversification. For a diversification decision it is important to combine the qualitative data of where and how the enter with the quantitative data such as value and size of the segments. One useful tool to do this is to describe the diversification possibilities in a create/capture matrix. In the case of the bioenergy market this will result in four different types of strategies; keystone strategy, market penetration strategy, low-cost strategy and differentiation strategy. Each of these different strategy processes offers unique possibilities and challenges. The keystone strategy will focus on an innovation-based diversification. The market penetration strategy will have the challenge of immature markets and un-standardized ways of communication. The low-cost strategy will imply focus on a large market share. The differentiation strategy must be pursued and obtained through a unique market position.
58
References
Adner, R. (2006). Match your innovation strategy to your innovation ecosystem. Harvard Business Review . Adner, R., & Kapoor, R. (2010). Value creation in innovation ecosystems: How the structure of technological interdependence affects firm performance in new technology generation. Strategic Management Journal , (31) 306-333. AEBIOM. (2011). 2011 AEBIOM Annual Statistical Report . Brussels: AEBIOM. Anaerobic-Digestion. (2011-10-06). Anaerobic Digestion. From http://aerobicdigestion.blogspot.se/ Ansoff, I. (1957). Strategies for Diversification,. Harvard Business Review , 113-124. Beekes, M., & Cremers, M. (2012-25-06). Torrefaction Cracks the Biomass Challenge. World.com . Biarnes, M. (2012-05-09). Biomass to Biogas—Anaerobic Digestion. From http://www.e-inst.com/biomass-to-biogas/ Bioenergy Insight. (2012-27-April). NNFCC report suggests bioenergy could employ 50,000 in UK by 2020. Bioenergy Insight . Biomass-Energy-Center. (2011). Conversion technologies. From http://www.biomassenergycentre.org.uk/portal/page?_pageid=75,15179&_dad=portal&_schema=PORTAL BIOS. (2012-14-09). Waste wood-fired combined heat, cooling and power. From http://www.bios-bioenergy.at/en/references/all-projects/fussach.html Björkdahl, J. (2007). Managing Value Creation and Appropriation. Chalmers . Blomberg New Energy Finance. (2012). Q2 2012 Bioenergy Insight. BNEF. Brownsort, P. (2009). Biomass Pyrolysis Process. Newcastle, England: UKBRC. Bryman, & Bell. (2007). Business Research Methods. Oxford: Oxfird University Press. Businessdictionary. (2012). Definition of market mapping. Retrieved 10 10, 2012, from Business Dictionary: (http://www.businessdictionary.com/definition/market-mapping.html Callen, A. (2012-03-05). Co-firing at Wales Point Australia. (F. Hansson, Interviewer) Cellwood. (2012-24-09). Bioenergy feedstock handling. Retrieved 2012-13-september from Cellwood systems: http://www.cellwood.se/English/Bioenergy.aspx Cepeda, G., & Martin, D. (2005). A review of case studies publishing in Management Decision 2003-2004 . Management Decision , 851-876. Ciolkosz, D. (2010). Co-fring Biomass with Coal . Pennsylvania: The Pennsylvania State University. Curtis, J. (2006). Bio-energy – opportunities for agriculture, industry, and waste management. Environmental Protection Agency. Domac, J. (2005, febryary). Socia-economic drivers in implementing bioenergy projects. Biomass & Bioenergy , 95-266. Energetics, M. (2012-13-09). Biomass and Biomethanization. From http://www.msetech.com/products-BIOMASS.htm
59
Energy Efficiency Asia. (2006). Type of boilers. From http://www.energyefficiencyasia.org/energyequipment/typesofboiler.html EverythingBio. (2012-05-09). Definition of Fermentation. From http://www.everythingbio.com/glos/definition.php?word=fermentation Fischer, M. (2012-18-09). Salesmanger for Services at Metso Power. (F. H. Marklund, Interviewer) Groeneveld, M., & Swaaij, W. (1979). Gasification of solid waste potential and application of co-current moving bed . Dept. of Chemical Engineering . Grossman, J. (1980). The first systems of Weighted differential and integral calculus. Guru, E. (2008 -04). Biomass - What is it and how can it be used? From http://energy-guru.com/Biomass%20Energy%20Information.htm# Hatt, A.-K. (2012, may 29). Swedish Energy system. (S. Marklund, Interviewer) Hostert, D. (2012-14-06). Biomass analysist - Bloomberg New Energy Finance. (F. H. Marklund, Interviewer) Iansiti, M., & Levien, R. (2004). Strategy as ecology. Harvard Business Review , 68-78. Iansiti, M., & Levien, R. (2004). The Keystone Advatage. London: Harvard business review. Jick, T. (1979). Mixing Qualitative and Quantitative Methods: Triangulation in Action. Administrative Science Quarterly , 602-611. . Kkumar, I. (2011-30-08). A presentation on boilers. From http://www.slideshare.net/jhanak1/boilers-ps-mrng-sessn Kujus, S. (2012). Eisenmann Waste Disposal, Fluidized Bed Incineration. From http://www.eisenmann.com/en/products-and-services/environmental-technology/waste-disposal/fluidized-bed-incineration.html Langue, F. P. (2012, may 29). EU ,20-20-20. (S. Marklund, Interviewer) Lenntech. (2012-13-09). Boiler feed water. From http://www.lenntech.com/applications/process/boiler/boiler-feed-water.htm Lepak, D. (2007). Value creation and capture: a mulilevel perspective. Academy of management review , 180-194. McGraw-Hill, S. &. (2012). Gasification. From http://www.answers.com/topic/gasification-2 Melitz, M. J. (2008). Market Size, Trade, and Productivity . Review of Economic Studies , 295-316. Merriam-Webster. (2012-05-09). Transesterfication. From http://www.oilgae.com/ref/glos/transesterification.html Microbiology, I. U. (2012-05-09). Microbial Metabolism. From http://www.micro.siu.edu/micr201/chapter8N.html Moser, R. (2009). Biodiesel production, properties and feedstocks. VitroCell.Dev.Biol , 45: 229-266. Newbold, P. (2012). Statistics for Business and Economics. Pearson Education Limited. Nicholson, J. (2006). Bio Power. Bio-Power-Uk. Oligae. (2012-05-09). Transesterification - Definition, Glossary, Details . From http://www.oilgae.com/ref/glos/transesterification.html Oregon.gov. (2012-05-09). Biogas Technology. From http://cms.oregon.gov/ENERGY/RENEW/Biomass/Pages/biogas.aspx Pacific-Biodisel. (2012-05-09). History of biodisel fuel. From http://www.biodiesel.com/index.php/biodiesel/history_of_biodiesel_fuel/
60
Porter, M. (1987). From Competitive Advantage to Corporate Strategy . Harvard Business Review , 43-59. Poyry. (2012-12-09). Poyry, Kraft Biofuel-fired Power Plant, Pietarsaari, Finland. Retrieved 2012-13-september from Poyry: http://www.poyry.com/projects/alholmens-kraft-biofuel-fired-power-plant-pietarsaari-finland Prabhu, H. (2012-03). Combustion Fundamental. From http://www.slideshare.net/janapra/biomass-combustion Rajvanshi, K. (1986). Biomass, Gasification. In Alternative Energy in Agriculture (pp. 83-102). Maharashtra, India. Ramírez, & Normann. (1993). From Value Chain to Value Constellation: Designing Interactive Strategy. Harvard Business Review , 65-77. Research Service Congressional. (2012-03-06). Biomass Feedstocks for Biopower in the United States. From http://www.eoearth.org/article/Biomass_Feedstocks_for_Biopower:_Background_and_Selected_Issues RFA. (2012). 2012 Ethanol Industry Outlook. Renewable Fuel Association . Rumelt, R. P. (1982). Diversification strategy and profitability. Strategic management journal , 359-369. Rybczynska, A. (2012, 06 14). Insights of Bioenergy. (S. M. Hansson, Interviewer) Sandrup, A. (2012, may 20). Market potential, Lantmännen. (S. Marklund, Interviewer) Sandström, C. (2012, januay 21). Diversification and Integration. Lecture . Gothenburg. ScottMadden. (2009). Biodisel technologies and business considerations. ScottMadden. Sethi, P. (2012-07-09). Anaerobic Digestion. From California Energy Commission: http://www.energy.ca.gov/biomass/anaerobic.html Siemens. (2012-12-09). Energy siemes gas turbines. Retrieved 2012 -13-september from Siemens energy: http://www.energy.siemens.com/hq/en/power-generation/gas-turbines/ SKF. (2012-25-09). About SKF. Retrieved 2012-15-september from SKF.com: http://www.skf.com/portal/skf/home Soyinfo-center. (2007). A Brief History of Fermentation, East and West. From http://www.soyinfocenter.com/HSS/fermentation.php Steiner, J. (2012, may 30). Biogas in Germany. (S. Marklund, Interviewer) Strathclyde, U. (2012-05-09). What is Biodisel. From http://www.esru.strath.ac.uk/EandE/Web_sites/02-03/biofuels/what_biodiesel.htm Svalstedt, J. (2012, september). How Göteborg Energi has built Sävenäsverket. (M. Hansson, Interviewer) Gothenburg. Taluchi, B. (2012, may 29). Technology roadmap for heat and power. (S. Marklund, Interviewer) Taylor, M. (2012, may 30). IRENA, work for Renewables. (S. Marklund, Interviewer) Teece. (1997). Dynamic Capabilities and Strategic Management. Strategic Management Journal , 509-533. Tronstad, R. (2008). Evaluating Market Size . Department of Agricultural and Resource Economics University of Arizona . Turare, C. (2008). Gasification Process. From http://cturare.tripod.com/pro.htm UNF-Bioenergy. (2006). Biomass Conversion Technologies. UNF. Wade, A. (1998). Analysis of Two Biomass Gasification/ Fuel Cell Scenarios for Small-Scale Power Generation. National Renewable Energy Laboratory .

61
Wiltbank, R. (2004). What to do next? The case for non-predictive strategy. Strategic Management Journal . Zafar, S. (2012-10-08). Biomass CHP Technologies. From http://www.salmanzafar.org/biomass-chp-technologies/

I
Appendix Appendix I, Market
Biomass and Waste Solar Geothermal
Hydro Power
Wind Energy
104,7 2,4 5,8 28,1 11,4
69% 2% 4%
18%
7%
Bioenergy share of Renewables (2009)
Biomass and Waste
Solar
Geothermal
Hydro Power
Wind Energy
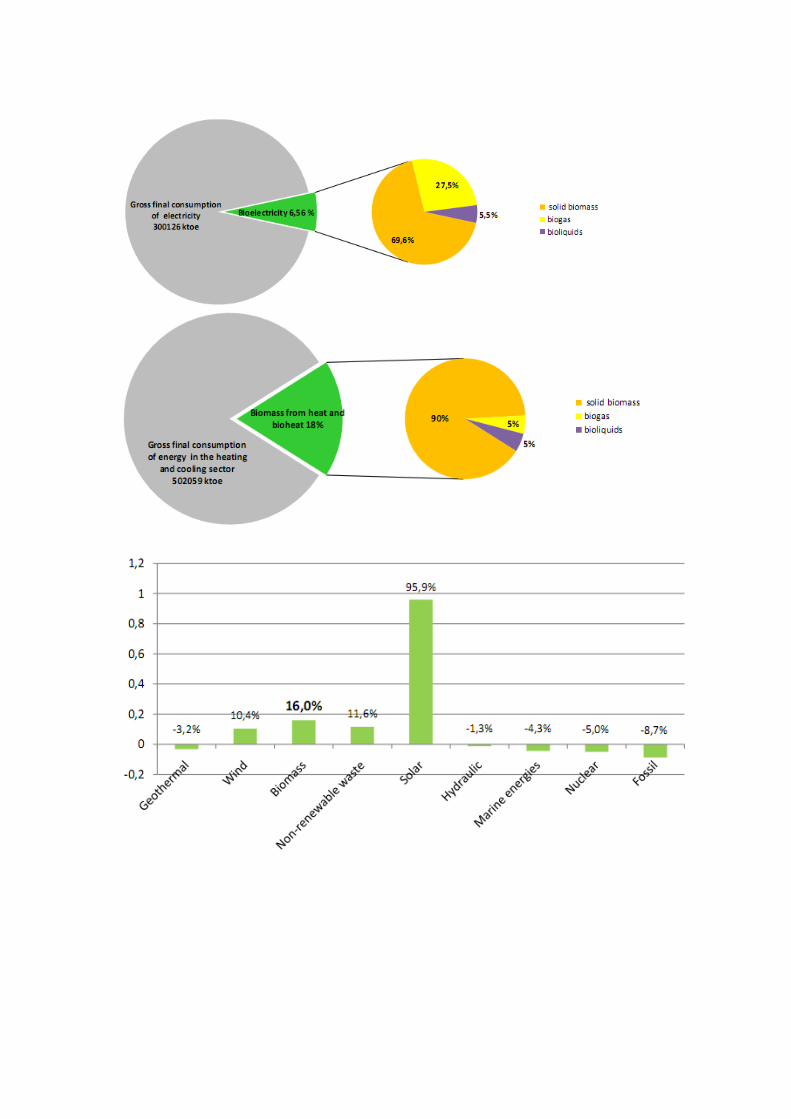
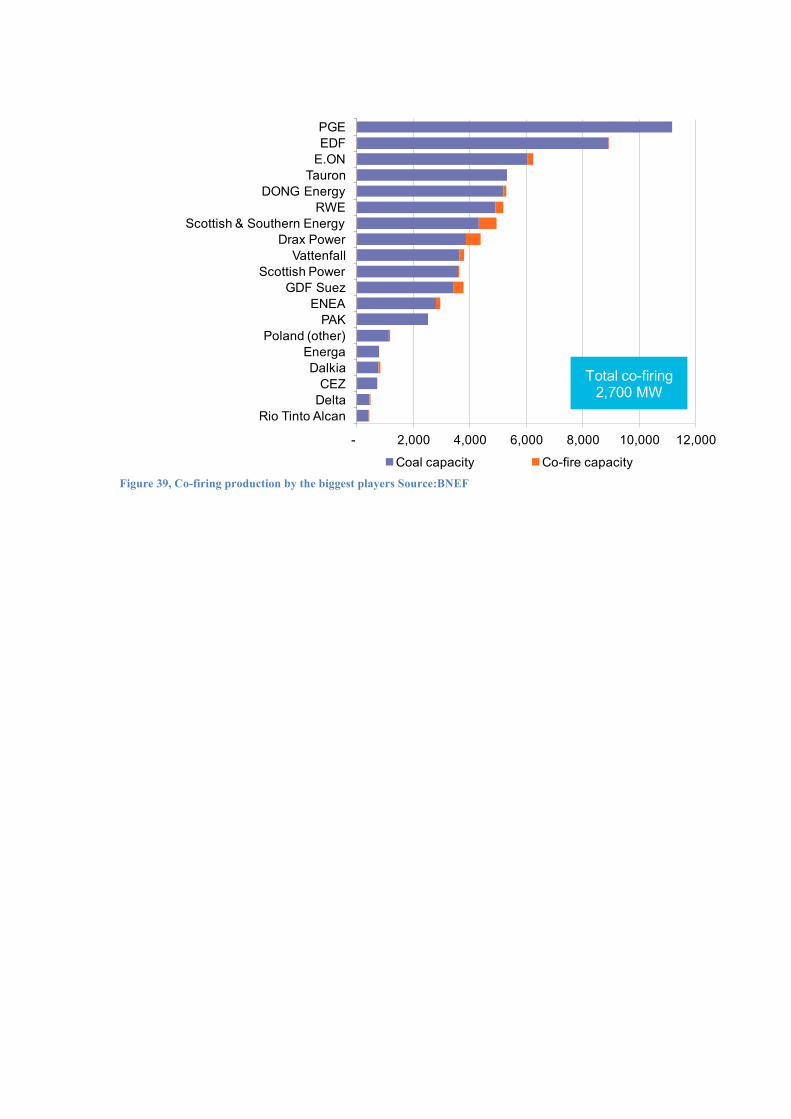
Figure 39, Co-firing production by the biggest players Source:BNEF
- 2,000 4,000 6,000 8,000 10,000 12,000
Rio Tinto AlcanDeltaCEZ
DalkiaEnerga
Poland (other)PAK
ENEAGDF Suez
Scottish PowerVattenfall
Drax PowerScottish & Southern Energy
RWEDONG Energy
TauronE.ONEDFPGE
Coal capacity Co-fire capacity
Total co-firing2,700 MW
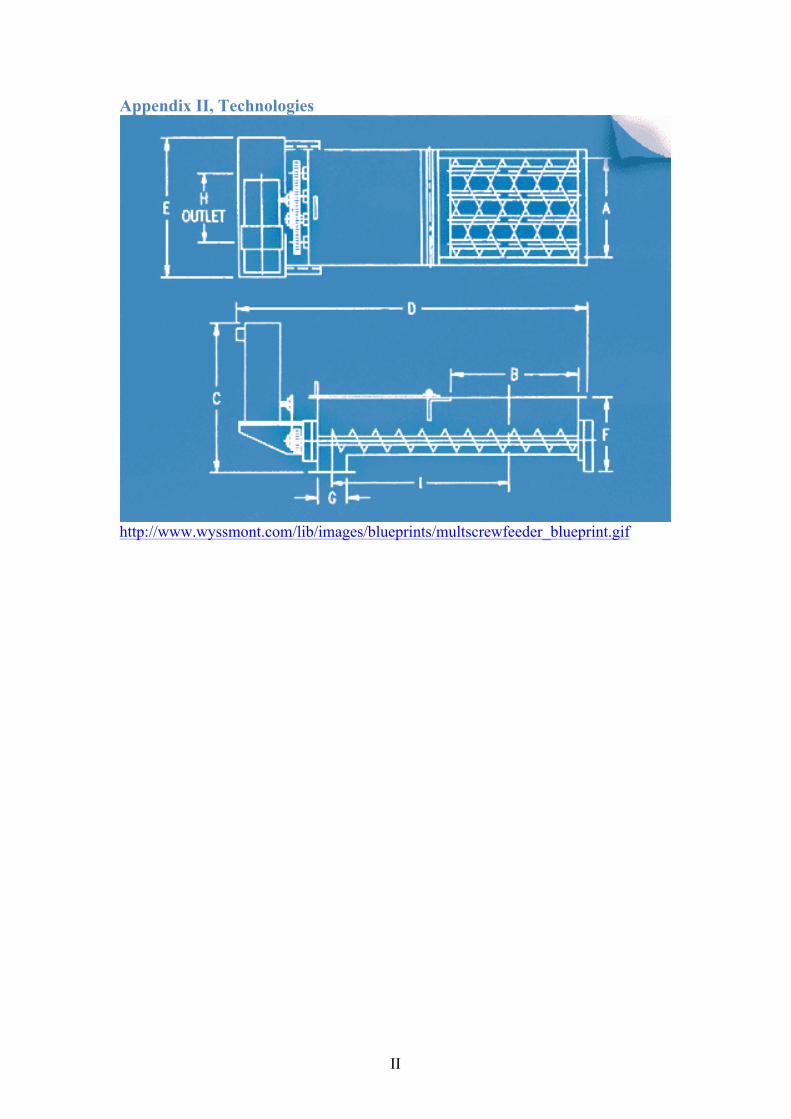
II
Appendix II, Technologies
http://www.wyssmont.com/lib/images/blueprints/multscrewfeeder_blueprint.gif

III
Appendix III, Interviews Sources:
1. Stefan Karlsson, SKF 2. Alexandra & David, BNEF. 3. Dennis Dolphin, Hurst Boiler 4. Anthony Callen, Delta Electrics 5. Eric Zinn, Göteborg Energy 6. Caroline Sagne, Areva 7. Bedhad Motagheri, University of New Castle 8. Pekka, Andritz boiler 9. Magnus Fisher, Metso 10. Johan Svalstedt, Göteborg Energi 11. LMS-interview, Tony Bodeece 12. Jan Brännström, Mölndal Energi 13. Hans Wendeberg, SKF 14. Lars-Erik Heed, SKF

IV
Appendix IV, Ecosystem relations.
Eco 1, The networks of the ecosystems!
3""""""""
4""""
2"""
Applica+on"eq."provider"
Suppor+ng"applica+on"
Manufacturer"
R&D"
Applica+on"manufacturer"
Applica+on"service"
Investors"
Plant"owner/operator"
Plant"Builder"
Energy"provider"
Feedstock"supplier"
Consultant"
Ins+tu+ons"
Overall"Plant"service"
Government"
1"
Service"and"Maintenance"
Support"func+ons"
Influencers"

Eco 2, Cash flows
Eco 3, Innovation relations
Applica'on*eq.*provider*
Suppor'ng*applica'on*
Manufacturer*
R&D*
Applica'on*manufacturer*
Applica'on*service*
Investors*
Plant*owner/operator*
Plant*Builder*
Energy*provider*
Feedstock*supplier*
Consultant*
Ins'tu'ons*
Overall*Plant*service*
Government*
Service*and*Maintenance*
Support*func'ons*
Influencers*
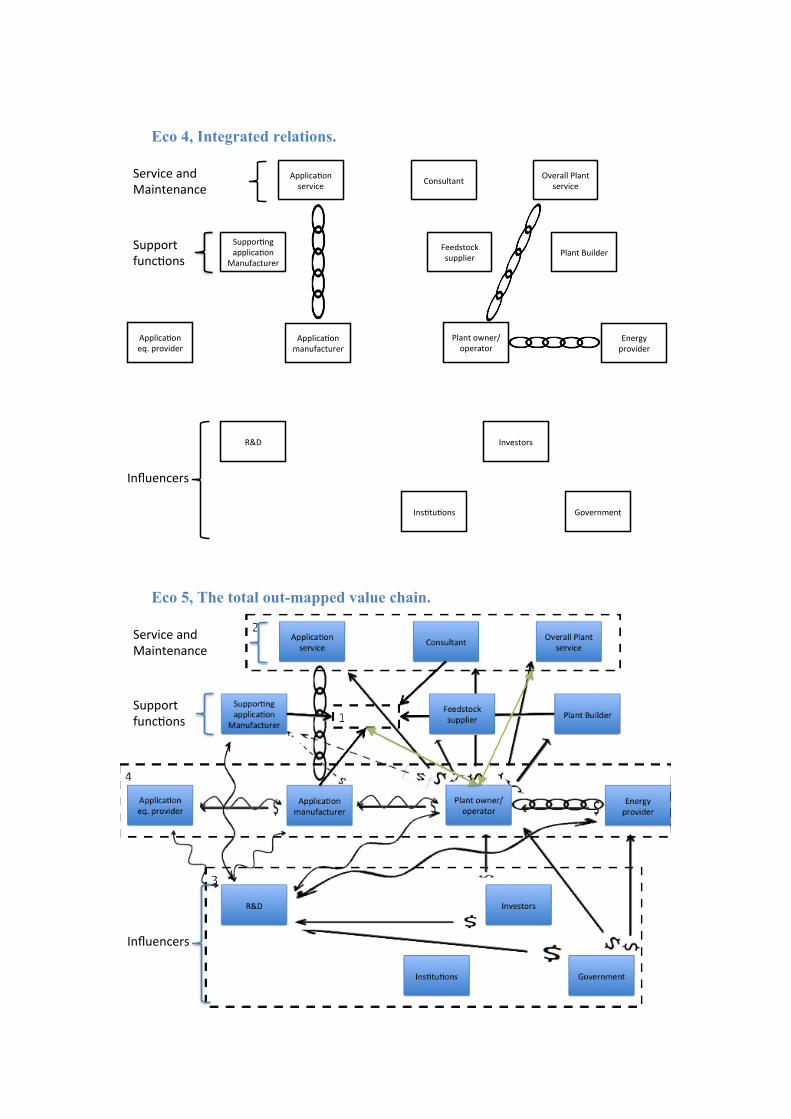
Eco 4, Integrated relations.
Eco 5, The total out-mapped value chain.
Applica'on*eq.*provider*
R&D*
Applica'on*manufacturer*
Applica'on*service*
Investors*
Plant*owner/operator*
Plant*Builder*
Energy*provider*
Feedstock*supplier*
Consultant*
Ins'tu'ons*
Overall*Plant*service*
Government*
Service*and*Maintenance*
Support*func'ons*
Influencers*
Suppor'ng*applica'on*
Manufacturer*
Service'and'Maintenance'
Support'func1ons'
Influencers'
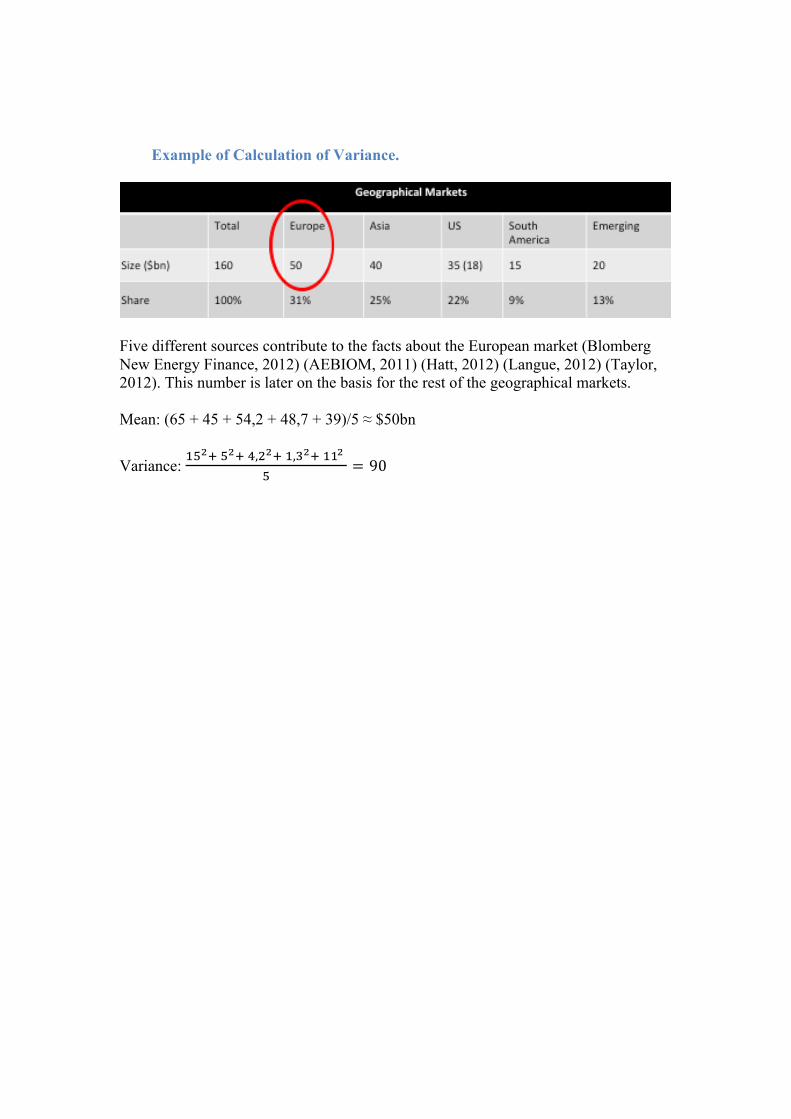
Example of Calculation of Variance.
Five different sources contribute to the facts about the European market (Blomberg New Energy Finance, 2012) (AEBIOM, 2011) (Hatt, 2012) (Langue, 2012) (Taylor, 2012). This number is later on the basis for the rest of the geographical markets. Mean: (65 + 45 + 54,2 + 48,7 + 39)/5 ≈ $50bn
Variance: !"!! !!! !,!!! !,!!! !!!
!= 90