Embed Size (px)
Citation preview
Cell Stem Cell, Volume 18
Supplemental Information
Divergent lncRNAs Regulate Gene Expression
and Lineage Differentiation in Pluripotent Cells
Sai Luo, J. Yuyang Lu, Lichao Liu, Yafei Yin, Chunyan Chen, Xue Han, BohouWu, Ronggang Xu, Wei Liu, Pixi Yan, Wen Shao, Zhi Lu, Haitao Li, Jie Na, FuchouTang, Jianlong Wang, Yong E. Zhang, and Xiaohua Shen
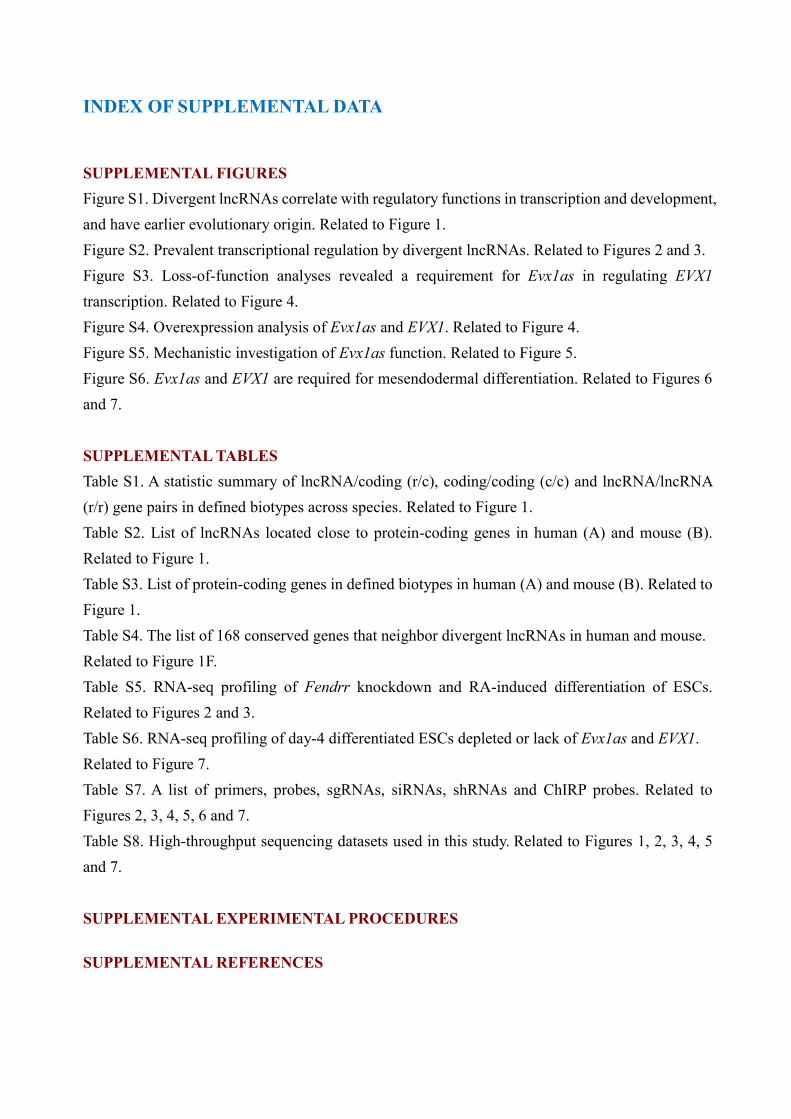
INDEX OF SUPPLEMENTAL DATA
SUPPLEMENTAL FIGURES
Figure S1. Divergent lncRNAs correlate with regulatory functions in transcription and development,
and have earlier evolutionary origin. Related to Figure 1.
Figure S2. Prevalent transcriptional regulation by divergent lncRNAs. Related to Figures 2 and 3.
Figure S3. Loss-of-function analyses revealed a requirement for Evx1as in regulating EVX1
transcription. Related to Figure 4.
Figure S4. Overexpression analysis of Evx1as and EVX1. Related to Figure 4.
Figure S5. Mechanistic investigation of Evx1as function. Related to Figure 5.
Figure S6. Evx1as and EVX1 are required for mesendodermal differentiation. Related to Figures 6
and 7.
SUPPLEMENTAL TABLES
Table S1. A statistic summary of lncRNA/coding (r/c), coding/coding (c/c) and lncRNA/lncRNA
(r/r) gene pairs in defined biotypes across species. Related to Figure 1.
Table S2. List of lncRNAs located close to protein-coding genes in human (A) and mouse (B).
Related to Figure 1.
Table S3. List of protein-coding genes in defined biotypes in human (A) and mouse (B). Related to
Figure 1.
Table S4. The list of 168 conserved genes that neighbor divergent lncRNAs in human and mouse.
Related to Figure 1F.
Table S5. RNA-seq profiling of Fendrr knockdown and RA-induced differentiation of ESCs.
Related to Figures 2 and 3.
Table S6. RNA-seq profiling of day-4 differentiated ESCs depleted or lack of Evx1as and EVX1.
Related to Figure 7.
Table S7. A list of primers, probes, sgRNAs, siRNAs, shRNAs and ChIRP probes. Related to
Figures 2, 3, 4, 5, 6 and 7.
Table S8. High-throughput sequencing datasets used in this study. Related to Figures 1, 2, 3, 4, 5
and 7.
SUPPLEMENTAL EXPERIMENTAL PROCEDURES
SUPPLEMENTAL REFERENCES
A B C
D
E F
0
0.1
0.2
0.3
0.4
1 2 3 4 5 6 7 8 9 10 11
Rat
io o
f tot
al ln
cRN
As
Evolutionary age assignment
XHlincRNA
G
Figure S1
-1 -0.5 0 0.5 1 -1 -0.5 0 0.5 1
XIXO
XH
XIXO
0
0.5
1
1
.5
Den
sity 0
0.5
1
1
.5
0
0.5
1
1.5
human mouse
0
0.5
1
1
.5
XO XO
SUSU
Pearson correlation coefficient (c.c)
lncRNA / coding (XH, XT, XI, SD)lncRNA / coding (XO, SU)coding / coding(XH, XT, XIO, SDU) lincRNA / coding
XT
XI
SD
XH
XT
XI
SD
XH XHc/c XT XI XO SD SU
0 5 10 15 20[-log10(p value)]
123/77696/556
82/475219/1720
49/28493/594
99/670 333/1110
199/569125/854
mouse
GO of protein-coding genes neighboring XH lncRNAs (mouse)
050
250
150
Human
Rhesus
Rabbit
Mouse
X.tropicalis
Zebrafish
Chimp Orangutan Gibbon
Marmoset
Guinea PigRat
Horse Dog Cow ElephantOpossum PlatypusChicken Zebra finch
Stickleback Tetraodon
Lizard
myr
450
350300
200
400
100
0
2
3
45
6 78 910 1112
1
13
Armadillo (dasNov3)Manatee (triMan1)
Opossum (monDom5)Tasmanian devil (sarHar1)Platypus (ornAna1)Chicken (galGal4)Painted turtle (chrPic2)X.tropicalis (xenTro3)Fugu (fr3)Zebrafish (danRer7)
Mouse (mm10)Rat (rn5)Naked mole rat (hetGla2)Squirrel (speTri2)Human (hg19)Rhesus (rheMac3)Marmoset (calJac3)Dog (canFam3)Cow (bosTau7)
myr
nervous system developmentcell differentiation
developmental processembryonic development
organ morphogenesispattern specification process
transcriptionpositive regulation of transcription
sequence-specific DNA bindingtranscription factor activity
lincRNA
−1.0 −0.5 0.0 0.5 1.0
0.0
0.2
0.4
0.6
0.8
1.0
Pearson Correlation Coefficient
1.0
123456−10
Cumu
lative
Fra
ction
[(#
of p
airs
) / (t
otal
# o
f gen
es)]
0
0.1
0.2human (hg19)
0
0.1
0.2
Rat
io
mouse (mm10)
XHXH
c/cXH
r/r XTXT
c/cXT
r/r XOXI
Oc/cXI
Or/rXI SUSD
Uc/c
SDUr
/r
SD
Pea
rson
cor
rela
tion
coef
ficie
ncy
with
Fen
drr
(c.c
)
distance (kb) between Fendrr and nearby protein-coding transcripts
E
C
Figure S2
ESC neural / extraembryonic endodermRA
N2B27
Rel
ativ
e ex
pres
sion
0
2
Cacng6as Cacng6
Ctrl sh1
sh2 sh3
*
0
1
2
Plekhd1as Plekhd1
Ctrl sh1 sh2
0
1
2
Atrnas Atrn
Ctrl sh1
0
1
2
Graspas Grasp
Ctrl sh1 sh2
0
2
Rbm27as Rbm27
Ctrl
shRbm27as
0
1
2
Bcat2as Bcat2
Ctrl sh1
**
**
** * *
* *
*
Rel
ativ
e ex
pres
sion
Cancer cell (MCF7)GF
Rel
ativ
e ex
pres
sion
0
20000
40000
60000
80000
100000
0
1000
2000
3000
2ce
llm
oru
lab
lasto
cyst
2ce
llm
oru
lab
lasto
cyst
Gata6as GATA6
Rel
ativ
e ex
pres
sion
Rel
ativ
e ex
pres
sion
# of EGFP+;GATA6+ cells
total # of GATA6+cells= 50%
ii) GATA6as siRNA
& H2B-EGFP mRNA
i) scramble siRNA
& H2B-EGFP mRNA
Injecting RNA into
one cell of two-cell embryos blastocyst GATA6+ GFP+ GATA6+; GFP+
# of EGFP+;GATA6+ cells
total # of GATA6+cells< 50%
H
(i) (ii)
DESC neural / extraembryonic endoderm
RA
N2B27
0
0.5
1
1.5
CtrlshSox21as
Rel
ativ
e ex
pres
sion
0
0.5
1
1.5
Ctrl
shLhx1os
0
0.5
1
1.5
CtrlshIer2as
0
0.5
1
1.5
CtrlshZdhhc4as
* *
**
* *
*
*
I
0
0.5
1
1.5
shC
trl
shV
AT
1-1
shV
AT
1-2
shR
ND
2-1
shR
ND
2-2
shR
ND
2-3
VAT1 RND2
0
0.5
1
1.5
shC
trl
shC
EN
PQ
-1sh
CE
NP
Q-2
shM
UT
-1sh
MU
T-2
CENPQ MUT
0
0.5
1
1.5
shC
trl
shM
ED
29-1
shM
ED
29-2
shP
AF
1-1
shP
AF
1-2
shP
AF
1-3
MED29 PAF1
0
0.5
1
1.5
shC
trl
shR
RA
S
shS
CA
F1
RRASSCAF1
0
0.5
1
1.5
shC
trl
shN
ED
D8-
1
shN
ED
D8-
2
shN
ED
D8-
3
shG
MP
R2-
1
shG
MP
R2-
2
shG
MP
R2-
3
NEDD8 GMPR2
0
0.5
1
1.5
shC
trl
shV
PS
35-1
shV
PS
35-2
shO
RC
6
VPS35ORC6
**
0
0.5
1
1.5
shC
trl
shM
AG
T1
shC
OX
7B
MAGT1COX7B
*
0
0.5
1
1.5
shC
trl
shH
MM
R-1
shH
MM
R-2
shN
UD
CD
2-1
shN
UD
CD
2-2
HMMRNUDCD2
*
Rel
ativ
e ex
pres
sion
J
0
0.5
1
1.5
shC
trl
shS
MC
R8-
1
shS
MC
R8-
2
TOP3A SMCR8
0
0.5
1
1.5
shC
trl
shA
TP
5J-1
shA
TP
5J-2
shA
TP
5J-3
ATP5J GABPA
0
0.5
1
1.5
shC
trl
shA
TF
5-1
shA
TF
5-2
ATF5NUP62
0
0.5
1
1.5
2
shC
trl
shM
ED
25-1
shM
ED
25-2
shM
ED
25-3
FUZ MED25
Rel
ativ
e ex
pres
sion
Pearson correlation coefficiency with Fendrr (c.c)
A B
MouseHuman
A B
D
E
I
K
Figure S3
Rela
tive e
xpre
ssio
n
J
0
50
100
150
a b nc
Evx1as
WT Evx1as-null
0
50
100
150
200
250
a b nc
EVX1
WT Evx1as-null
Rela
tive e
xpre
ssio
n
*
*
*
*
CRISPR - on
Evx1as
Knock-outs
C
D A
B
KO #1
KO #2,3,4
1f2r 3r 4r 1r 5r
SexA1 SexA1~7 kb
probe
Evx1as
EVX1E
FE
EVX1 Knock-outs
KO #1
KO #2,3,4
0
0.5
1
1.5
2
Evx1as-pre Evx1as EVX1-pre EVX1 T
nc c-sgRNA d-sgRNA
e-sgRNA f-sgRNA
C
#2 #3 #4 WT
Outside
PCR
Inside
PCR
1f/5r
1f/2r
1f/3r
KO clones
#1 WT #1 WT #1 WT #1 WT
Outside
PCR Inside PCR
1f/1r 1f/3r 1f/4r 1f/2r
1.1 kb
KO clone:
F G
* * **
Evx1as KO clones
WT #1 #2 #3 #4
WT
(~7 kb)KO
Southern blot
H
T
mRNAEVX1
pre-mRNA
EVX1
mRNA
Evx1as
pre-mature
RNA
Evx1as
RNA
B
NANOG OCT4
TCL1 T
WT
EV
X1
KI
Evx
1as
KI
WT
EV
X1
KI
Evx
1as
KI
Rela
tive e
xpre
ssio
n t
o W
TA
CAG PGK-hygro
loxP loxP5’ HA 3’ HA
b
loxP loxP
CAG5’ HA 3’ HA
a
PGK-hygro
CAG
CAG
Sca1
7 kb
probe
13.8 kb
10.1 kb
Nde1
Nde1
Nde1Sca1
Evx1as CAG KI
EVX1 CAG KI
+CRE
C
D
Figure S4
0
0.5
1
1.5
2
Evx1as(s) Evx1as(l) Evx1as(rs) Hottip GFP
REX1 expression
sgRNA(a) sgRNA(b) sgRNA(REX1)
F G
0
0.5
1
1.5Tethering of EVX1 RNA
EVX1-sgRNA(a)
EVX1-sgRNA(b)
EVX1-sgRNA(REX1)
Rela
tive e
xpre
ssio
n
Rela
tive e
xpre
ssio
n
EVX1
pre-mRNA
T
mRNA
0
1
2
EVX1-pre EVX1 T
Evx1as(l)-sgRNA(a)
Evx1as(l)-sgRNA(b)
Evx1as(l)-sgRNA(REX1)
Hottip-sgRNA(a)
Hottip-sgRNA(b)
Hottip-sgRNA(REX1)
RNA tethering
Rela
tive e
xpre
ssio
n
* *
EVX1
mRNA
T
mRNA
EVX1
pre-mRNA
*
(ii)
*
(i)
WT (13.8 kb)
WT 1 2 3 4 5 WT WT 1 2 3 4 5 WT
Evx1as CAG KI EVX1 CAG KI
EVX1 CAG KI
Evx1as CAG KI
KI clone #:
E
0%
50%
100%
D0 D4
statistic analysis of RNA FISH
none one spot two spots
n=12 n=54
C
Figure S5
Perc
enta
ge o
f cells
D
*
*
Fold
enrichm
ent
to G
AP
DH
D4 D4
Evx1as
D4
D0
DAPI
D0 D0
B
D0
merge
G
H J
M
0
20
40
60
nc promoter
D0
D4
Rela
tive e
xpre
ssio
n
MED12 ChIP
anti-MED12
K L RNA pull-down
anti-MED1
(i)
(iii)
F
SMC1
ChIA-PET
(ESCs, D0)
SOX2
KLF4
ESRRB
CDK8
CDK9
RING1B
CBX7
rep1 PETs
rep2 PETs
Interaction
seq tags
ChI
P-
seq
(ES
Cs,
D0)
(+)
(-)
Ribominus total
RNA-seq(No LIF, D4)
D0
D4
Evx1asEVX1
0-100
0-100
0-41
0-107
0-23
0-9
0-32
0-23
0-27
0-111
0-43
0-36
0-32
Evx1as
ChIRP-seq
(ii)
anti-MED1
2kb
0-30
0-30
D0
D4
Evx1as
ChIRP-seq
10kb
MACS PEAKS
Gene nameHOXA11
Hoxa11asHOXA13 Evx1as
EVX1
E
I
A
AEvx1as: y = -3.9307x + 42.226
R² = 0.9964, primer efficiency 89.8%
EVX1: y = -4.178x + 44.665R² = 0.9962, primer efficiency 86.8%
0
5
10
15
20
25
30
0 5 10
Raw
Ct va
lues
Log10 of copy numbers
Evx1as trendline
EVX1 trendline
C E
0
0.5
1
1.5
2PB-GFP PB-Evx1as
0
5
10
15
20
PB-GFP PB-Evx1as
Rela
tive e
xp
ressio
n
Rela
tive e
xpre
ssio
n
H
*
Figure S6
Evx1as EVX1
KO KD KO KD (no LIF, day 4)
B
(i) (ii)
Trans-overexpression of Evx1as (no LIF, day 4)
D
0
-0.8
Enrichment plot: ME-high genes
WT (D4) Evx1as KD (D4)
MSGN1
HOXB1
WNT5A
T
EVX1
SNAIL1
TGFB1
BMP2
FGF3
MSX1
GSC
LHX1
CXCR4
EOMES
GATA6
SOX17
FOXA2
OTX2
ZIC2
ZIC5
SOX1
NRTN
NDRG2
SOX2
FOXD3
UTF1
PDZD4
TET1
NANOG
ERAS
WT (D4) Evx1as-null (D4) WT (D4) Evx1as-null (D4)
500 79 75
Evx1as KO EVX1 KO
Downregulated genes compared to WT
(FPKM>1, fold change<-2, p<0.05)
F
Term p-value
Fold
Enrichment
GO:0009888~tissue development 2.38E-06 5.03
GO:0032502~developmental process 2.04E-06 2.42
GO:0007275~multicellular organismal development 1.36E-06 2.55
GO:0009653~anatomical structure morphogenesis 5.33E-05 3.29
GO:0048522~positive regulation of cellular process 1.00E-04 2.95
GO:0009887~organ morphogenesis 1.97E-04 4.25
GO:0007389~pattern specification process 2.04E-04 6.46
GO:0030154~cell differentiation 2.28E-04 2.63
GO:0003002~regionalization 3.02E-04 7.50
GO:0009790~embryonic development 5.15E-04 3.77
G
Enrichment plot: XEN-high genes Enrichment plot: NPC-high genes

SUPPLEMENTAL FIGURE LEGENDS
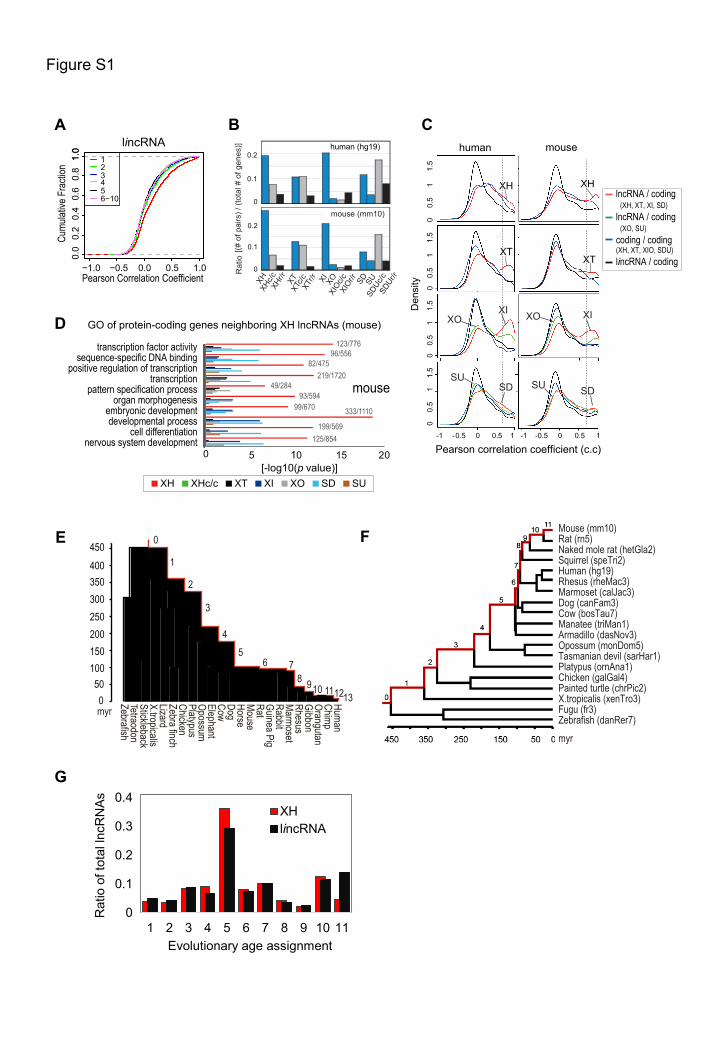
Figure S1. Divergent lncRNAs correlate with regulatory functions in transcription and development, and have
earlier evolutionary origin. Related to Figure 1.
(A) Expression correlation analysis of lincRNAs with their nearest ten neighbor genes across 23 human tissues.
(B) Ratios of corresponding gene pairs in the human and mouse genome. The biotypes without a suffix represent
neighboring lncRNA/coding gene pairs. Suffixes ‘c/c’ and ‘r/r’ represent nearby protein-coding/coding and
lncRNA/lncRNA pairs, respectively. ‘XIO’ and ‘SDU’ comprises antisense-inside/outside and sense-
downstream/upstream, respectively. The y axis shows ratios of gene pairs versus total numbers of lncRNAs (for
lncRNA/coding, lncRNA/lncRNA pairs) or protein-coding genes (for coding/coding pairs).
(C) Pearson coexpression correlation of gene pairs. Pairs of lincRNAs and the nearest protein coding genes (black
curves) and pairs of coding/coding gene pairs (blue) serve as controls. Dotted lines are set at c.c = 0.7. Comparing
lncRNA/coding pairs to two control pairs, antisense lncRNA/coding pairs exhibit significantly higher positive
correlation (Wilcoxon p<5x10⁻⁶ for XH in human and mouse, p<1x10⁻⁴ for human XT, XI, XO and SD pairs, and
p<2x10⁻⁷ for mouse XI pairs).
(D) GO analysis of protein-coding genes neighboring various biotypes of lncRNAs in mouse. Selected GO terms
(enrichment score>1.5, p<1x10⁻⁶) in XH lncRNAs are shown. Approximately 509 genes in mouse are related to
transcription and development.
(E) and (F) Vertebrate phylogenetic tree with human (E) or mouse (F) at the top. Branch numbers represent
evolutionary age assignments. Smaller numbers mean older or greater evolutionary origins. Species names and
corresponding genome assemblies are shown.
(G) Evolutionary age distributions of mouse lncRNAs. The origination time of each lncRNA was dated according to
the vertebrate phylogenetic tree in panel (F). To avoid bias caused by neighboring genes, sequences overlapping
with protein-coding exons were filtered out. The x axis shows the age assignment at which a lncRNA first appears.
The y axis shows the ratio of lncRNAs falling into a particular age assignment in the corresponding class of total
lncRNAs. Divergent XH lncRNAs exhibit a skewed distribution towards older or greater evolutionary ages (lower
numbers on the left) compared to lincRNAs. The mean evolutionary age of mouse divergent lncRNAs is
significantly older than that of lincRNAs (5.8 for XH versus 6.3 for lincRNAs, [Wilcoxon p < 3.4x10⁻⁹]).
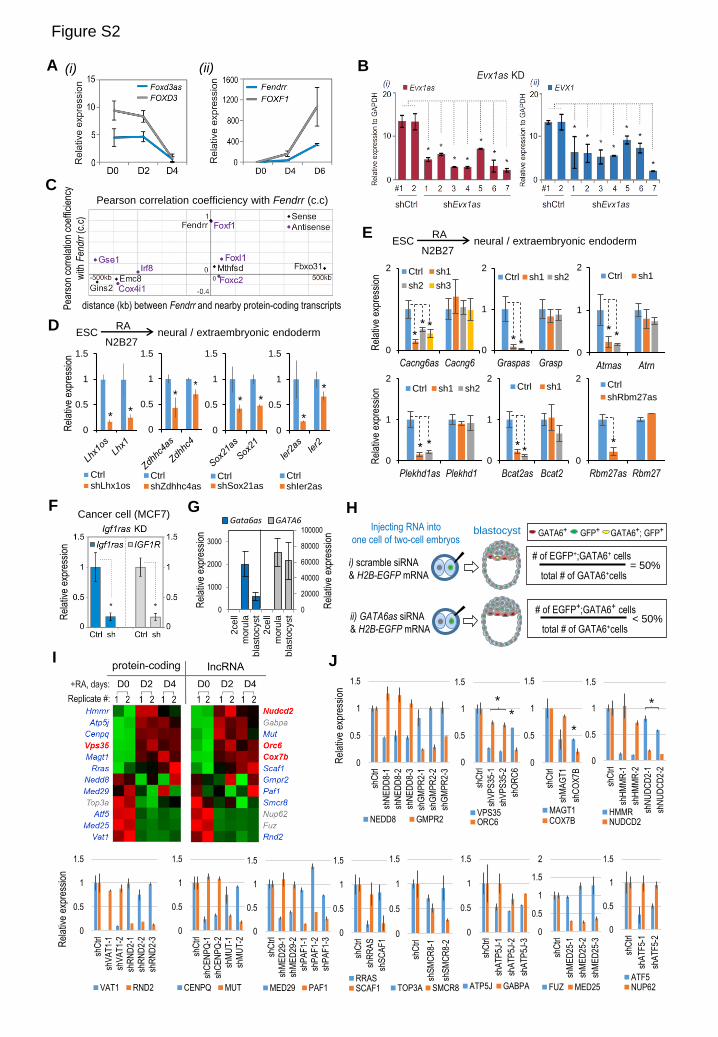
Figure S2. Prevalent transcriptional regulation by divergent lncRNAs. Related to Figures 2 and 3.
(A) Co-expression of two divergent gene pairs by RT-qPCR analysis during ESC differentiation induced by LIF
withdrawal (day 0 to 6, D0 to D6). Error bars represent standard deviations of mean expression normalized to
GADPH (n=3 biological replicates).
(B) RNAi knockdown (KD) of Evx1as led to attenuated activation of EVX1 in day 4-differentiated ESCs. To control
for possible off-target effects of RNAi, we expressed seven different Evx1as shRNAs by either retrovirus (#1-5)
or lentivirus (#6-7, also shown in Figure 2C) and observed consistent decreases in EVX1 mRNA upon Evx1as
depletion. ‘shCtrl’ is the scrambled shRNA control.
(C) Pearson correlation plot of coexpression of Fendrr and its nearby protein-coding genes (±500 kb) across 17 mouse
tissues and cell types.
(D) and (E) RNAi knockdown on day 2 of retinoic acid (RA)-induced differentiation in N2B27 medium towards neural
and extraembryonic endodermal lineages. In panel (D), knockdown of lncRNA Lhx1os, Sox21as, Zdhhc4as and
Ier2as caused downregulation of the corresponding divergent protein-coding gene, LHX1, SOX21, ZDHHC4 and
IER2, respectively. In panel (E), knockdown of lncRNA Cacng6as, Graspas, Plekhd1as, Bcat2as, Atrnas and
Rbm27as did not affect the corresponding divergent protein-coding gene.
(F) RNAi knockdown (KD) of Ifg1ras (RP11-35O15.1) downregulated the expression of IGF1R in MCF7 cells. In
panels (D, E and F), the y axis represents relative expression normalized to GADPH and the scramble control. Data
are shown as mean ± s.d. (n=4, including 2 independent knockdown and 2 technical replicates for each knockdown).
*p < 0.05.
(G) Co-activation of Gata6as and GATA6 during mouse embryonic development. The y axis represents fold changes
to 2-cell stage embryos. n=3 biological replicates.
(H) Schematic representation of two-cell injection experiment (related to Figures 3E and 3F). Scramble siRNA control
(siCtrl) or siRNAs against Gata6as or GATA6 were mixed with H2B-GFP mRNA and injected into one cell of
mouse embryos at the two-cell stage. H2B-GFP expression marks cells injected with siRNAs. Microinjected
embryos were cultured until blastocyst stage around E3.75 ~ E4, fixed and stained with anti-GATA6 antibody. In
each injected embryo, GATA6-positive and/or GFP-positive cells were counted. In scramble controls, the ratio of
cells expressing both GFP and GATA6 (GFP+; GATA6+) versus total numbers of cells expressing GATA6 (GATA6+)
should be equal to 50% because only one cell in the two-cell embryo is injected with GFP mRNA together with
siRNA. However, Gata6as RNAi embryos have a ratio lower than 50% as GATA6 expression is attenuated upon
Gata6as depletion.
(I) Heatmap of the expression of 12 randomly selected divergent coding/coding pairs. that we successfully knocked
down. Gene names in red indicate that mRNA gene knockdown affected the nearby mRNA, while the blue indicates
that mRNA gene knockdown failed to affect the nearby mRNA. Gene names in grey indicate genes that failed to
be knocked down by RNAi.
(J) The effects of knockdown of genes shown in panel (I) on their nearby gene expression. The y axis represents
relative mean expression normalized to GADPH and the scramble shRNA (Ctrl) cells. Data are shown as mean ±
SD (n=2 technical repeats). **indicates significant changes elicited by knockdown of a nearby mRNA gene (p <
0.05).
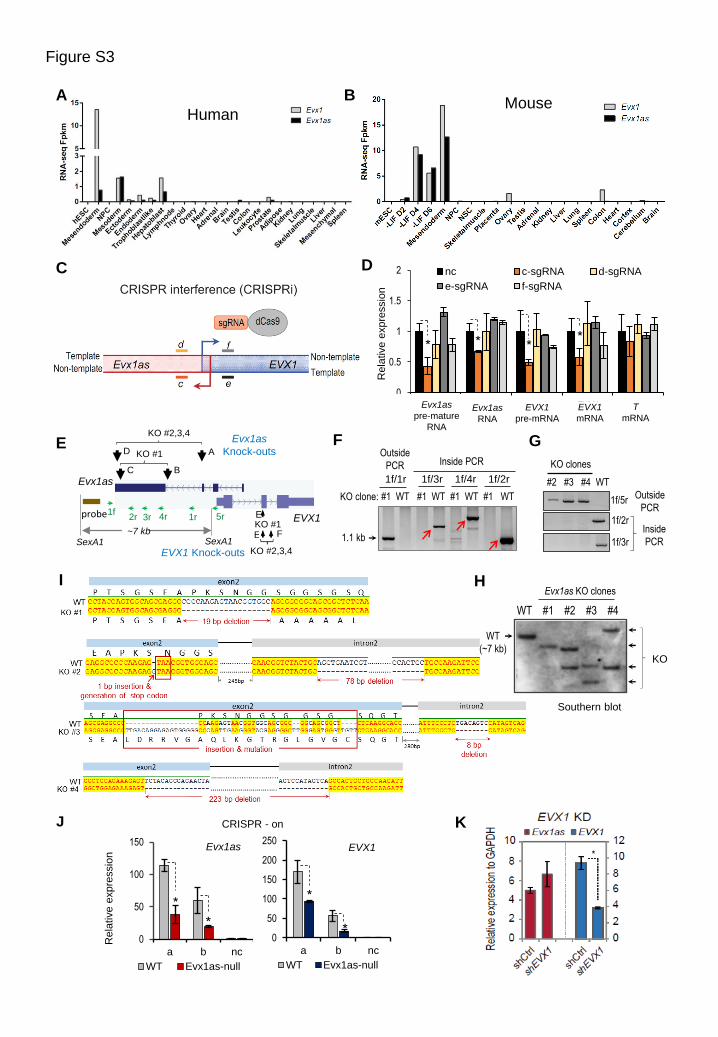
Figure S3. Loss-of-function analyses revealed a requirement for Evx1as in regulating EVX1 transcription.
Related to Figure 4.
(A) and (B) Highly correlated coexpression of Evx1as and EVX1 in human (A) and mouse (B). Both genes are highly
expressed in mesendoderm and mesoderm cells during early development, and are activated during ESC
differentiation at days 2, and 6 (D2, D4 and D6) induced by LIF withdrawal (-LIF).
(C) Schematic diagram of CRISPR inhibition (CRISPRi). To investigate the effect of transcription on nearby gene
regulation, we performed CRISPRi to inhibit elongation of Evx1as or EVX1 transcripts and assayed the effects on
the other gene’s expression during ESC differentiation. Relative locations of sgRNAs (c, d, e and f) are shown. The
sgRNA c and f target the non-template strand of Evx1as or EVX1, respectively. The sgRNAs d and e target the
template strand of Evx1as or EVX1, respectively.
(D) RT-qPCR analysis of CRISPRi on day-3 differentiation induced by LIF withdrawal. The y axis shows relative
expression normalized to GADPH and the control cells. The sgRNA c targeting the non-template strand of Evx1as
efficiently inhibited Evx1as transcription and significantly downregulated both pre-mRNA and mRNA levels of
EVX1. In contrast, the sgRNA d targeting the same region on the template strand (overlapped 9-bp with the sgRNA
c) did not affect Evx1as or EVX1 expression. In addition, the sgRNA f targeting the non-template strand of EVX1
moderately decreased EVX1 transcription, but failed to affect Evx1as expression
(E) Schematic diagram of Evx1as and EVX1 knockout strategies by CRISPR/Cas9. Two knockout strategies to delete
Evx1as. Knockout (KO) #1 was generated with the sgRNA pair B and C, while KOs #2, 3 and 4 were generated
with the sgRNA pair A and D. The relative positions of the probe used for southern blot analysis (brown bar) and
PCR primers (green arrows) are indicated. For EVX1 knock-outs, the sgRNA E was used to mutate EVX1 (KO #1).
The sgRNA pair E and F was used for KO #2, 3 and 4. EVX1 knockout mutations were confirmed by PCR and
sequencing shown in panel (I).
(F) PCR genotyping analysis of Evx1as-null ESCs (KO clone #1). PCR with the ‘Outside’ primers (1f and 1r) generated
a ~1.1 kb band representing the deletion allele. The wild-type allele would generate a ~3.3 kb band which is too
long to be detected due to the short extension time used (1 min). The ‘Inside’ PCR primers (1f with 3r, 4r or 2r)
detected the WT allele (indicated by red arrows) but failed to amplify deletion alleles.
(G) PCR genotyping analysis of Evx1as-null ESCs (KO clones #2-4). PCR with the ‘Outside’ primers (1f and 5r)
generated a ~800 bp band representing the deletion allele. The wild-type allele would generate a ~5.2 kb band, but
this is too long to be detected due to the short extension time used (1 min). The ‘Inside’ primers (1f and 2r/3r)
detected the WT allele but not the deletion alleles.
(H) Southern blotting of Evx1as-null clones. Genomic DNAs were digested by SexA1. The Southern probe is located
upstream of the deletion regions. The expected fragment sizes are ~7 kb for wild-type, ~4.8 kb for KO clone #1
and ~2.5 kb for KO clones #2-4. KO #1 shows one Southern band with the expected size (~4.8 kb). KO clones #2,
3 and 4 show the expected deletion in one allele but show various deletions or mutations in the other allele,
indicating imprecise cutting of CRISPR/Cas9 at the sgRNA targeting sites. Nevertheless, all four KO clones
showed blocked activation of Evx1as and EVX1 during ESC differentiation in Figure 4F.
(I) Sequencing analysis of the four EVX1 knockout ESC clones. Evx1as KO #1 has a 19-bp deletion in exon 2 of EVX1,
resulting in a frame shift and disrupted homeodomain of EVX1. KO #2 contains a 1-bp insertion in exon 2 and a
78-bp deletion in intron 2, resulting in a nonsense STOP codon. KO #3 contains a 57-bp sequence replacement and
insertion in exon 2 and an 8-bp deletion in intron 2. KO #4 contains a 223-bp deletion covering the splicing junction
of exon 2 and intron 2 of EVX1.
(J) Evx1as and EVX1 expression induced by CRISPR-on in wild-type (WT) and Evx1as-null ESCs. The y axis shows
relative expression normalized to GADPH and the wild-type cells.
(K) Knockdown of EVX1 by lentivirus-mediated RNAi failed to affect Evx1as expression in day 4 of ESC
differentiation. n=4 replicates, including four independent knockdown by two shRNAs against EVX1.
In panels (D and J-K), data are shown as mean ± SD (n=3 independent experiments unless otherwise indicated). *
indicates p < 0.05 compared to the control.
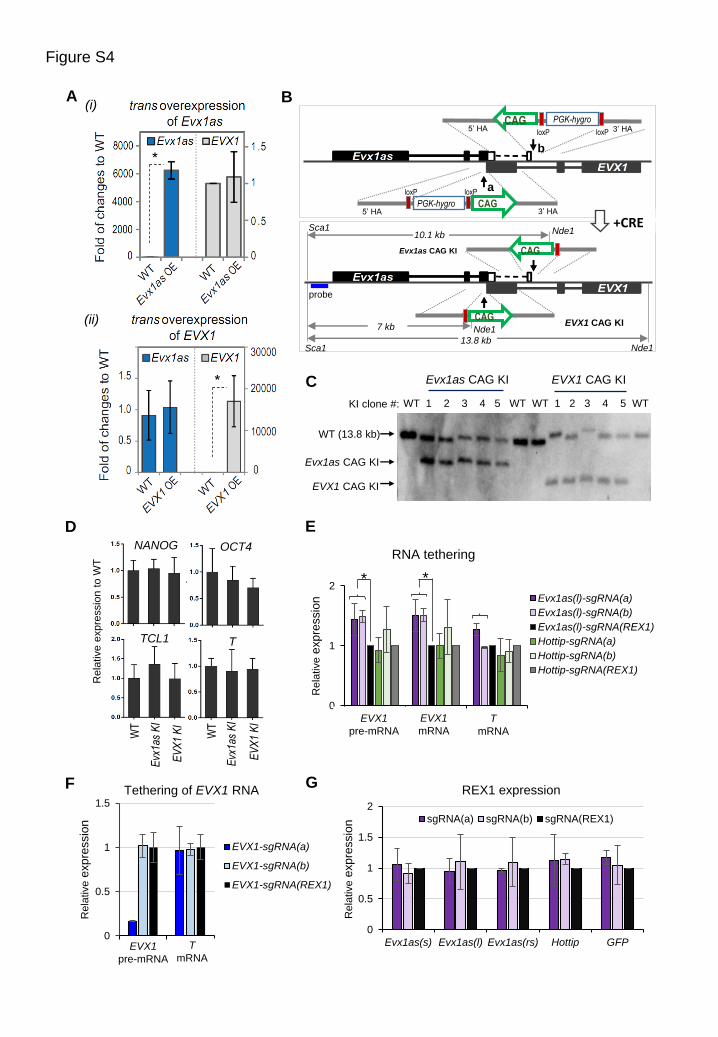
Figure S4. Overexpression analysis of Evx1as and EVX1. Related to Figure 4.
(A) Overexpression (OE) of Evx1as or EVX1 in trans by transposon-mediated random integration in ESCs had no
effect on the transcription of the other gene. Data are shown as mean ± s.d. (n=3, biological replicates). *p < 0.05
compared to WT ESCs.
(B) Schematic diagram of two-step generation of CAG-promoter knockin (KI) ESCs by CRISPR/Cas9. The sgRNAs
a and b, which target the corresponding insertion sites, were used to facilitate homologous recombination. CRE
recombinase was used to excise the PGK-hygromycin resistance gene cassette.
(C) Southern blot analysis of Evx1as and EVX1 CAG KI clones. Genomic DNA was digested with Sca1 and Nde1 and
hybridized with the probe shown in panel (B). The expected bands for wild-type, Evx1as CAG KI and EVX1 CAG
KI are ~13.8 kb, ~10.1 kb, and ~7.5 kb, respectively.
(D) Expression of pluripotency (NANOG, OCT4, TCL1) and mesendodermal (T) marker genes in knockin ESCs. Data
are shown as mean ± s.d. (n=4, biological replicates). The normal pluripotency program was observed in Evx1as
CAG KI ESCs, ruling out the possibility that a change in cellular state caused the change in EVX1 expression.
(E) The effect of tethering Evx1as transcripts (the long isoform) and HOTTIP to the Evx1as/EVX1 promoter region.
Relative positions of sgRNAs a and b fused to RNA are shown in Figure 4D. A sgRNA targeting a non-related
genomic sequence (the TSS of REX1) fused with RNA serves as the negative control. Tethering the long isoform
(l) of Evx1as RNA to the promoter of Evx1as/EVX1 significantly increased the levels of EVX1 pre-mRNAs and
mRNAs. In comparison, tethering the lncRNA HOTTIP known to be involved in transcription activation failed to
increase the levels of EVX1.
(F) The effect of tethering EVX1 transcripts to the Evx1as/EVX1 promoter region.
(G) RNA tethering had no effect on REX1 expression by RT-qPCR. As REX1 is highly expressed in pluripotent ESCs,
tethering Evx1as to its promoter cannot further enhance the transcription of REX1 because of its strong endogenous
promoter activity. In addition, Evx1as RNA transcripts specifically bind to its own locus and 3’ downstream regions
on chromatin, suggesting that its regulatory function may require specific genomic sequences or chromatin context.
The short (s) and long (l) isoforms, the reverse transcript of the short isoform (rs) of Evx1as, HOTTIP and GFP
were fused with the sgRNAs a, b and REX1. In panels (E-G), the y axis represents relative expression normalized
to the corresponding RNA transcripts tethered with the sgRNA(REX1). Data are shown as mean ± s.d. (n=3
independent transfection experiments).
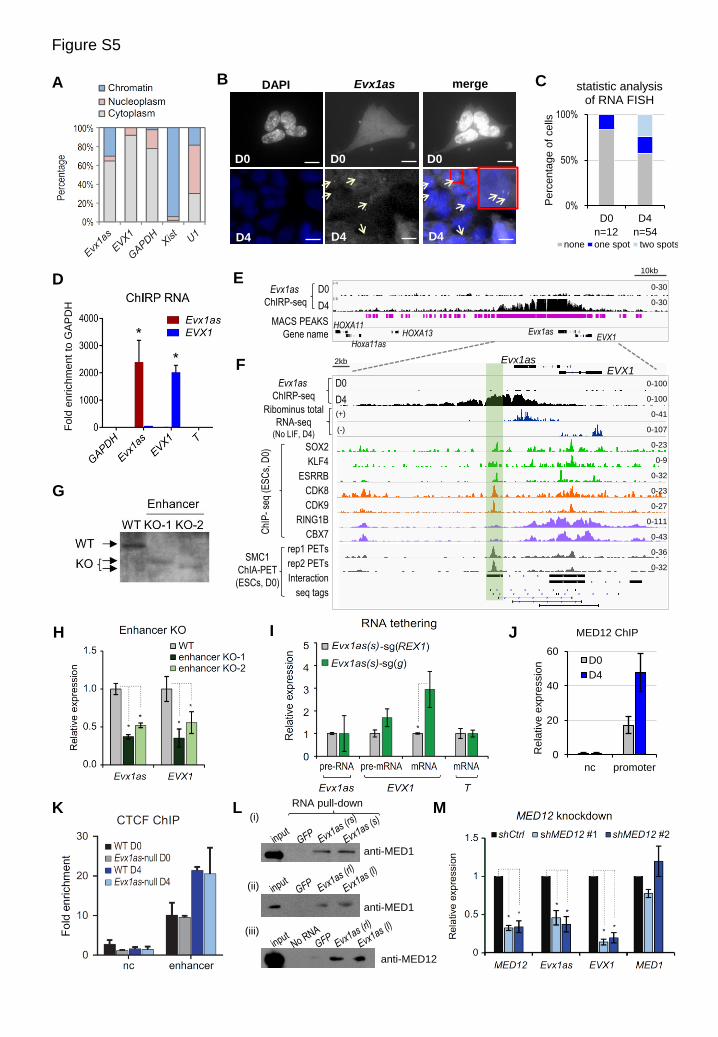
Figure S5. Mechanistic investigation of Evx1as function. Related to Figure 5.
(A) Subcellular distribution of Evx1as and EVX1 transcripts. GADPH, U1 and Xist RNAs serve as fractionation
controls for cytosolic, nuclear and chromatin fractions, respectively. Evx1as transcripts are detected in both the
cytoplasm and the nucleus, and nuclear Evx1as primarily binds to chromatin.
(B) RNA FISH of Evx1as RNA in undifferentiated (D0) and day 4 (D4)-differentiated ESCs. The big red box contains
an enlarged view of the small boxed area. Scale bar, 10 m. The pattern of two nuclear signals of Evx1as was only
observed in day-4 differentiated ESCs, but not in undifferentiated ESCs with negligible expression of Evx1as,
indicating the specificity of the FISH probes to recognize Evx1as RNA instead of its DNA locus. Cytosolic Evx1as
transcripts may be diffused in the cytoplasm, resulting in a low cytosolic concentration that is difficult to be
detected by FISH. So the results from RNA FISH and qPCR analysis are not contradictory to each other.
(C) A statistical summary of Evx1as RNA FISH shown in panel (B). Grey, dark blue and light blue boxes represent
ESCs that do not detect Evx1as, or detect one or two signal spots of Evx1as, respectively. Numbers of cells
analyzed are indicated.
(D) RT-qPCR analysis of RNA transcripts captured by ChIRP in day-4 differentiated ESCs. Evx1as probes specifically
pulled down Evx1as RNA, while EVX1 probes specifically pulled down EVX1 mRNA. GAPDH and T serve as
negative controls. The y axis shows fold enrichment normalized to GAPDH.
(E) Evx1as ChIRP-seq analysis in D0 and D4 differentiated ESCs. Peaks (p<1x10⁻⁵) called by MACS program are
shown by vertical bars in pink.
(F) The Evx1as/EVX1 locus in genome browser. Tracks of Evx1as ChIRP-seq (zoon-in view) are shown on the top.
Sequencing tracks of ribominus total RNA-seq performed on the SOLiD sequencing platform are shown below.
No or few signal reads are detected beyond the TES of Evx1as in total or polyA enriched RNA-seq. In comparison,
the ChIRP-seq signals extend >20 kb downstream of the Evx1as locus, reflecting chromatin association of Evx1as
transcripts rather than picking the full extent of Evx1as RNA transcription.
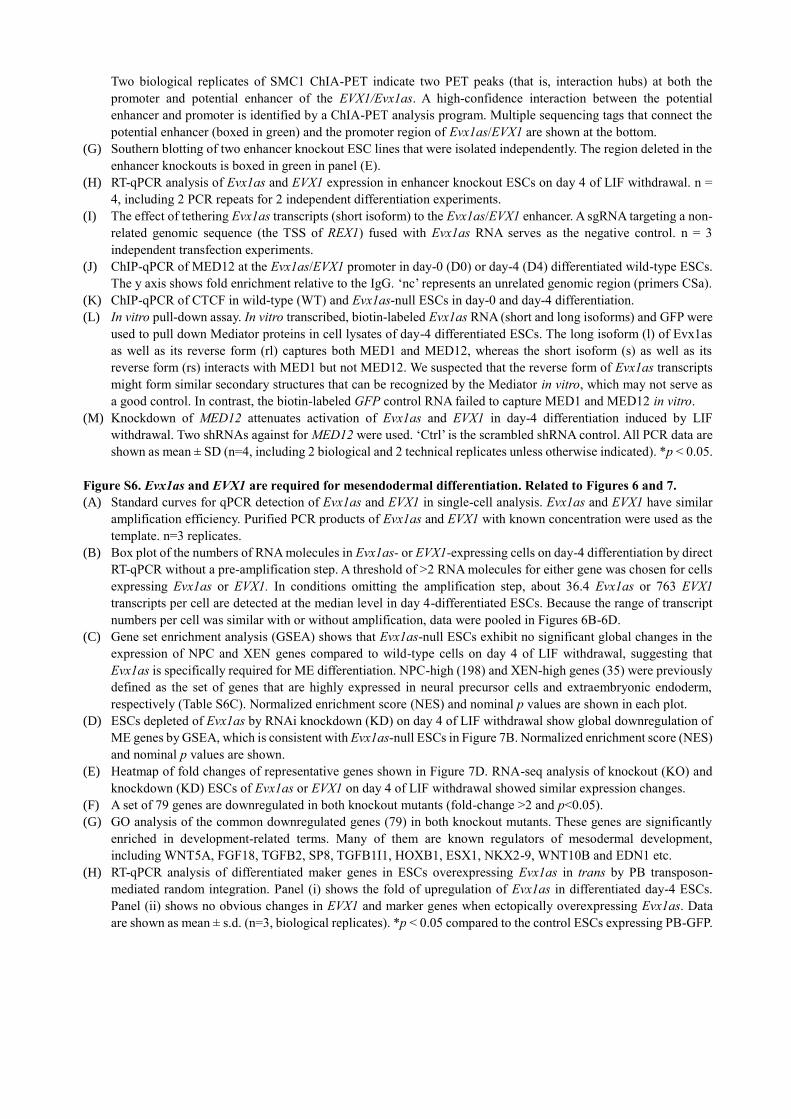
Two biological replicates of SMC1 ChIA-PET indicate two PET peaks (that is, interaction hubs) at both the
promoter and potential enhancer of the EVX1/Evx1as. A high-confidence interaction between the potential
enhancer and promoter is identified by a ChIA-PET analysis program. Multiple sequencing tags that connect the
potential enhancer (boxed in green) and the promoter region of Evx1as/EVX1 are shown at the bottom.
(G) Southern blotting of two enhancer knockout ESC lines that were isolated independently. The region deleted in the
enhancer knockouts is boxed in green in panel (E).
(H) RT-qPCR analysis of Evx1as and EVX1 expression in enhancer knockout ESCs on day 4 of LIF withdrawal. n =
4, including 2 PCR repeats for 2 independent differentiation experiments.
(I) The effect of tethering Evx1as transcripts (short isoform) to the Evx1as/EVX1 enhancer. A sgRNA targeting a non-
related genomic sequence (the TSS of REX1) fused with Evx1as RNA serves as the negative control. n = 3
independent transfection experiments.
(J) ChIP-qPCR of MED12 at the Evx1as/EVX1 promoter in day-0 (D0) or day-4 (D4) differentiated wild-type ESCs.
The y axis shows fold enrichment relative to the IgG. ‘nc’ represents an unrelated genomic region (primers CSa).
(K) ChIP-qPCR of CTCF in wild-type (WT) and Evx1as-null ESCs in day-0 and day-4 differentiation.
(L) In vitro pull-down assay. In vitro transcribed, biotin-labeled Evx1as RNA (short and long isoforms) and GFP were
used to pull down Mediator proteins in cell lysates of day-4 differentiated ESCs. The long isoform (l) of Evx1as
as well as its reverse form (rl) captures both MED1 and MED12, whereas the short isoform (s) as well as its
reverse form (rs) interacts with MED1 but not MED12. We suspected that the reverse form of Evx1as transcripts
might form similar secondary structures that can be recognized by the Mediator in vitro, which may not serve as
a good control. In contrast, the biotin-labeled GFP control RNA failed to capture MED1 and MED12 in vitro.
(M) Knockdown of MED12 attenuates activation of Evx1as and EVX1 in day-4 differentiation induced by LIF
withdrawal. Two shRNAs against for MED12 were used. ‘Ctrl’ is the scrambled shRNA control. All PCR data are
shown as mean ± SD (n=4, including 2 biological and 2 technical replicates unless otherwise indicated). *p < 0.05.
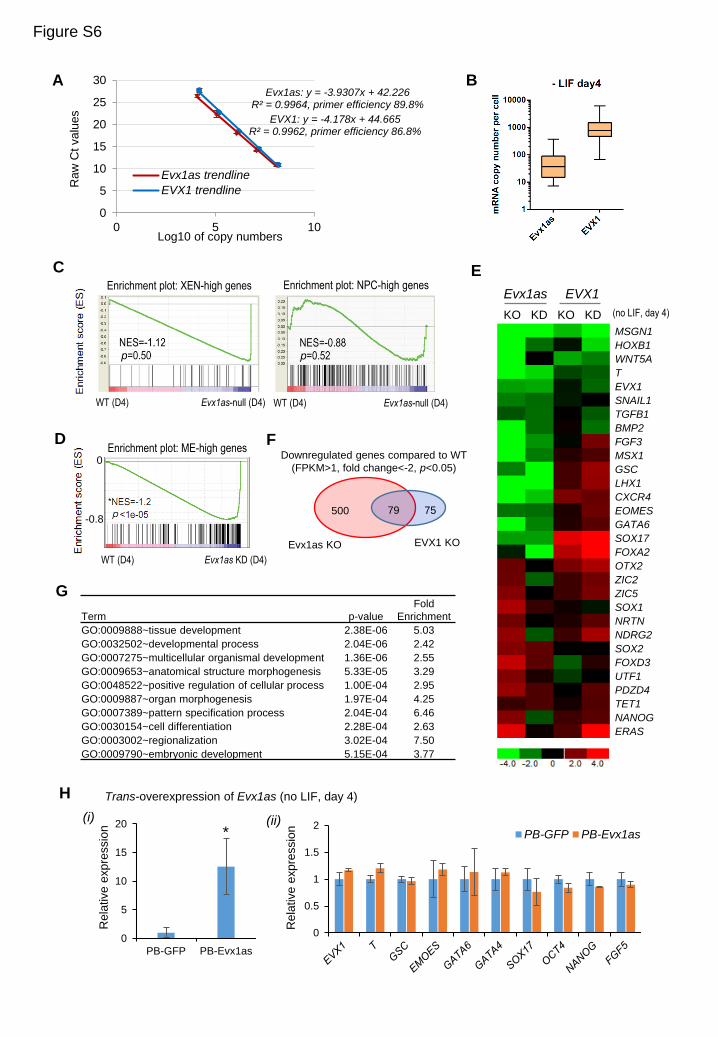
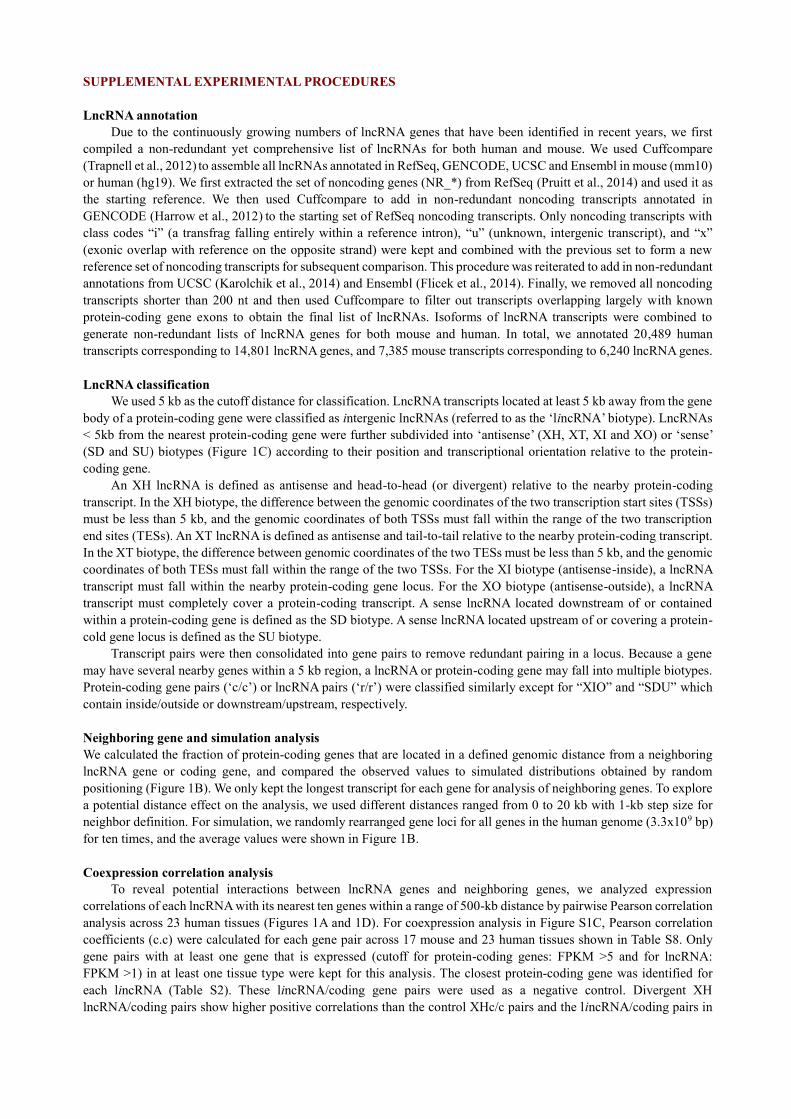
Figure S6. Evx1as and EVX1 are required for mesendodermal differentiation. Related to Figures 6 and 7.
(A) Standard curves for qPCR detection of Evx1as and EVX1 in single-cell analysis. Evx1as and EVX1 have similar
amplification efficiency. Purified PCR products of Evx1as and EVX1 with known concentration were used as the
template. n=3 replicates.
(B) Box plot of the numbers of RNA molecules in Evx1as- or EVX1-expressing cells on day-4 differentiation by direct
RT-qPCR without a pre-amplification step. A threshold of >2 RNA molecules for either gene was chosen for cells
expressing Evx1as or EVX1. In conditions omitting the amplification step, about 36.4 Evx1as or 763 EVX1
transcripts per cell are detected at the median level in day 4-differentiated ESCs. Because the range of transcript
numbers per cell was similar with or without amplification, data were pooled in Figures 6B-6D.
(C) Gene set enrichment analysis (GSEA) shows that Evx1as-null ESCs exhibit no significant global changes in the
expression of NPC and XEN genes compared to wild-type cells on day 4 of LIF withdrawal, suggesting that
Evx1as is specifically required for ME differentiation. NPC-high (198) and XEN-high genes (35) were previously
defined as the set of genes that are highly expressed in neural precursor cells and extraembryonic endoderm,
respectively (Table S6C). Normalized enrichment score (NES) and nominal p values are shown in each plot.
(D) ESCs depleted of Evx1as by RNAi knockdown (KD) on day 4 of LIF withdrawal show global downregulation of
ME genes by GSEA, which is consistent with Evx1as-null ESCs in Figure 7B. Normalized enrichment score (NES)
and nominal p values are shown.
(E) Heatmap of fold changes of representative genes shown in Figure 7D. RNA-seq analysis of knockout (KO) and
knockdown (KD) ESCs of Evx1as or EVX1 on day 4 of LIF withdrawal showed similar expression changes.
(F) A set of 79 genes are downregulated in both knockout mutants (fold-change >2 and p<0.05).
(G) GO analysis of the common downregulated genes (79) in both knockout mutants. These genes are significantly
enriched in development-related terms. Many of them are known regulators of mesodermal development,
including WNT5A, FGF18, TGFB2, SP8, TGFB1I1, HOXB1, ESX1, NKX2-9, WNT10B and EDN1 etc.
(H) RT-qPCR analysis of differentiated maker genes in ESCs overexpressing Evx1as in trans by PB transposon-
mediated random integration. Panel (i) shows the fold of upregulation of Evx1as in differentiated day-4 ESCs.
Panel (ii) shows no obvious changes in EVX1 and marker genes when ectopically overexpressing Evx1as. Data
are shown as mean ± s.d. (n=3, biological replicates). *p < 0.05 compared to the control ESCs expressing PB-GFP.
SUPPLEMENTAL EXPERIMENTAL PROCEDURES
LncRNA annotation
Due to the continuously growing numbers of lncRNA genes that have been identified in recent years, we first
compiled a non-redundant yet comprehensive list of lncRNAs for both human and mouse. We used Cuffcompare
(Trapnell et al., 2012) to assemble all lncRNAs annotated in RefSeq, GENCODE, UCSC and Ensembl in mouse (mm10)
or human (hg19). We first extracted the set of noncoding genes (NR_*) from RefSeq (Pruitt et al., 2014) and used it as
the starting reference. We then used Cuffcompare to add in non-redundant noncoding transcripts annotated in
GENCODE (Harrow et al., 2012) to the starting set of RefSeq noncoding transcripts. Only noncoding transcripts with
class codes “i” (a transfrag falling entirely within a reference intron), “u” (unknown, intergenic transcript), and “x”
(exonic overlap with reference on the opposite strand) were kept and combined with the previous set to form a new
reference set of noncoding transcripts for subsequent comparison. This procedure was reiterated to add in non-redundant
annotations from UCSC (Karolchik et al., 2014) and Ensembl (Flicek et al., 2014). Finally, we removed all noncoding
transcripts shorter than 200 nt and then used Cuffcompare to filter out transcripts overlapping largely with known
protein-coding gene exons to obtain the final list of lncRNAs. Isoforms of lncRNA transcripts were combined to
generate non-redundant lists of lncRNA genes for both mouse and human. In total, we annotated 20,489 human
transcripts corresponding to 14,801 lncRNA genes, and 7,385 mouse transcripts corresponding to 6,240 lncRNA genes.
LncRNA classification
We used 5 kb as the cutoff distance for classification. LncRNA transcripts located at least 5 kb away from the gene
body of a protein-coding gene were classified as intergenic lncRNAs (referred to as the ‘lincRNA’ biotype). LncRNAs
< 5kb from the nearest protein-coding gene were further subdivided into ‘antisense’ (XH, XT, XI and XO) or ‘sense’
(SD and SU) biotypes (Figure 1C) according to their position and transcriptional orientation relative to the protein-
coding gene.
An XH lncRNA is defined as antisense and head-to-head (or divergent) relative to the nearby protein-coding
transcript. In the XH biotype, the difference between the genomic coordinates of the two transcription start sites (TSSs)
must be less than 5 kb, and the genomic coordinates of both TSSs must fall within the range of the two transcription
end sites (TESs). An XT lncRNA is defined as antisense and tail-to-tail relative to the nearby protein-coding transcript.
In the XT biotype, the difference between genomic coordinates of the two TESs must be less than 5 kb, and the genomic
coordinates of both TESs must fall within the range of the two TSSs. For the XI biotype (antisense-inside), a lncRNA
transcript must fall within the nearby protein-coding gene locus. For the XO biotype (antisense-outside), a lncRNA
transcript must completely cover a protein-coding transcript. A sense lncRNA located downstream of or contained
within a protein-coding gene is defined as the SD biotype. A sense lncRNA located upstream of or covering a protein-
cold gene locus is defined as the SU biotype.
Transcript pairs were then consolidated into gene pairs to remove redundant pairing in a locus. Because a gene
may have several nearby genes within a 5 kb region, a lncRNA or protein-coding gene may fall into multiple biotypes.
Protein-coding gene pairs (‘c/c’) or lncRNA pairs (‘r/r’) were classified similarly except for “XIO” and “SDU” which
contain inside/outside or downstream/upstream, respectively.
Neighboring gene and simulation analysis
We calculated the fraction of protein-coding genes that are located in a defined genomic distance from a neighboring
lncRNA gene or coding gene, and compared the observed values to simulated distributions obtained by random
positioning (Figure 1B). We only kept the longest transcript for each gene for analysis of neighboring genes. To explore
a potential distance effect on the analysis, we used different distances ranged from 0 to 20 kb with 1-kb step size for
neighbor definition. For simulation, we randomly rearranged gene loci for all genes in the human genome (3.3x10⁹ bp)
for ten times, and the average values were shown in Figure 1B.
Coexpression correlation analysis
To reveal potential interactions between lncRNA genes and neighboring genes, we analyzed expression
correlations of each lncRNA with its nearest ten genes within a range of 500-kb distance by pairwise Pearson correlation
analysis across 23 human tissues (Figures 1A and 1D). For coexpression analysis in Figure S1C, Pearson correlation
coefficients (c.c) were calculated for each gene pair across 17 mouse and 23 human tissues shown in Table S8. Only
gene pairs with at least one gene that is expressed (cutoff for protein-coding genes: FPKM >5 and for lncRNA:
FPKM >1) in at least one tissue type were kept for this analysis. The closest protein-coding gene was identified for
each lincRNA (Table S2). These lincRNA/coding gene pairs were used as a negative control. Divergent XH
lncRNA/coding pairs show higher positive correlations than the control XHc/c pairs and the lincRNA/coding pairs in
both human and mouse (Wilcoxon p<5x10⁻⁶, Figure S1C).
Gene Ontology (GO) and phenotype ontology analysis
GO analysis was performed using DAVID bioinformatics tools (Huang da et al., 2009). We considered a particular
GO term to be significantly enriched if it has an enrichment score larger than 1.5 and a p value less than 1x10⁻⁶. A total
of 2,517 out of 2,714 protein-coding genes neighboring XH lncRNAs, 1,379 of 1,514 in XT, 2,154 of 2,325 in XI, 280
of 305 in XO, 1,369 of 1,509 in SD, 468 of 521 in SU, and 2,605 of 2,911 in XHc/c in human were annotated for GO
terms. GO analysis was performed similarly for mouse genes and genes that overlapped in both human and mouse.
We used GREAT (Genomic Regions Enrichment of Annotations Tool) (McLean et al., 2010) to analyze
mammalian phenotype ontology terms defined by Mouse Genome Informatics (MGI) on the above sets of protein-
coding genes associated with human lncRNA biotypes. Significantly enriched phenotype terms (hypergeometric p-
value <1x10⁻⁶) were selected and plotted based on [–log10(p value)] in Figure 1G.
Evolutionary age analysis. To gain perspective on the evolution of divergent lncRNAs, we dated lncRNA genes on
the vertebrate phylogenetic tree by following a previous strategy (Zhang et al., 2010). We filtered out sequences
overlapping with protein-coding exons to avoid bias caused by neighboring genes (Zhang et al., 2010). Out of all
vertebrate genome sequences targeted by the UCSC genome alignment pipeline, we chose a subset with relatively good
assembly quality (as revealed by larger contig N50s) as the outgroup species. For each gene of interest in human or
mouse, we inferred the phylogenetic distribution of its orthologs based on pair-wise syntenic genomic alignment from
the UCSC website and determined the time when this locus originated by following the parsimony rule. Since the
pipeline mainly depends on the chromosomal coordinates, overlapping exons between lncRNAs and coding genes were
removed first before orthology inference. Moreover, the pipeline works at the DNA sequence level and does not
consider whether the corresponding orthologous locus in each outgroup can be transcribed or not. Thus, the age
assignment represents a conservative or upper bound estimate of the time of origin of the gene of interest. In human,
divergent lncRNAs are more ancient, with a mean age of 4.79, than lincRNAs (mean age 5.73, Wilcoxon p<2.2x10⁻¹⁶)
and other lncRNA biotypes (mean ages ranging 4.85-5.11). Similarly in mouse, divergent lncRNAs have a mean age of
5.77 compared with 6.29 for lincRNA (Wilcoxon p<3.4x10⁻⁹) and 5.70-7.10 for other lncRNA biotypes.
ESC culture, differentiation and reprogramming
Wild-type (CJ9, 46C) and various knockout and knockin embryonic stem cells (ESCs) were cultured on gelatin-
coated plates in standard ESC medium consisting of DMEM (Cellgro) supplemented with 15% heat-inactivated fetal
bovine serum (Hyclone), 1% Glutamax (GIBCO), 1% Penicillin/Streptomycin (Cellgro), 1% nucleoside (Millipore),
0.1mM 2-mercaptoethanol (GIBCO), 1% MEM nonessential amino acids (Cellgro), and 1000U/ml recombinant
leukemia inhibitory factor (Millipore). Mesendodermal (ME) differentiation of ESCs was induced by LIF withdrawal.
ME cells were derived from ESCs carrying brachyury (T)-driven GFP and enriched by FACS sorting of day-6
differentiated ESCs positive for T-GFP expression (Shen et al., 2009; Shen et al., 2008). NPCs (neural precursor cells)
and NSCs (neural stem cells) were derived from 46C ESCs carrying a SOX1 promoter driven-GFP reporter (Conti et
al., 2005). For differentiation towards neural and extraembryonic endoderm lineages, 46C cells were plated in N2B27
medium supplemented with 2 M of retinoic acid (RA) (Okada et al., 2004; Yin et al., 2015; Ying and Smith, 2003).
Differentiated cells were harvested at the indicated time points from day 0 to day 6 for gene expression analysis.
Reprograming of pre-iPSCs to induced pluripotent stem cell (iPSC) was performed as described previously
(Fidalgo et al., 2012; Theunissen et al., 2011). The pre-iPSCs were first infected with lentivirus expressing a scramble
shRNA control or shRNAs against Ccnyl1as and then co-transfected with pBASE transposase and a PiggyBac (PB)
transposon carrying NANOG-expressing cassette. Transduced pre-iPSC cells were selected by puromycin (for RNAi)
and hygromycin (for PB-mediated NANOG overexpression) for >4 days and seeded (1×10⁵ cells per well) on a six-
well plate in ESC media (serum plus LIF) for 4 days, and then switched to serum-free N2B27 medium supplemented
with LIF and 2i (dual inhibition of mitogen-activated protein kinase signaling [PD0325901, 1 M)] and glycogen
synthase kinase-3 GSK3 [CHIR99021, 3 M] ). After 10 days in 2i/LIF medium, iPSC clones positive for OCT4-GFP
were picked, expanded and analyzed by RT-qPCR.
RNA interference (RNAi)
We randomly chose 41 divergent lncRNA genes among the list of lncRNAs that contain more than one exon and
are upregulated during RA-induced differentiation of ESCs with FPKM of a lncRNA >1 and FPKM of a paired protein-
coding gene >1. We constructed 3 shRNAs for each lncRNA and performed RNAi twice for a total of 123 shRNA
constructs. Only 16 lncRNAs were knocked down by at least one shRNA and 10 of them attenuated the transcription
of nearby coding gene.

For divergent protein-coding/coding pairs, we randomly picked 24 genes in 12 pairs that are expressed (FPKM>1)
during RA differentiation. We used 3 shRNAs for each protein-coding gene and performed RNAi for a total of 72
shRNA constructs. We successfully knocked down 20 genes in 12 pairs by at least one shRNA. Among them, only 4
protein-coding genes in 3 divergent pairs appeared to have a positive effect on nearby gene transcription upon depletion.
RNAi was performed as described previously (Shen et al., 2008). For Evx1as knockdown, we used both retrovirus-
mediated (LUMPIG vector) (Wang et al., 2007) and lentivirus-mediated (pLKO vector) (Moffat et al., 2006) RNAi. To
achieve consistent knockdown with high efficiency, we subsequently used lentivirus-mediated RNAi (pLKO) for other
RNAi experiments except for Gata6as. Lentivirus was packaged and generated in 293T cells. Infected ESCs or MCF7
were selected by puromycin for 48 hours before harvesting for RNA analysis. For differentiation experiments, infected
ESCs were lifted 48 hour post-selection by puromycin and plated at low density in various differentiation culture media
without addition of puromycin. Error bars were based on different shRNAs or independent infection experiments (n
3).
Microinjection of siRNAs into mouse zygotes was performed as described previously (Sharif et al., 2010). Mouse
zygotes or two-cell embryos from superovulated C57BL/6 females mated with CBA males were collected in fresh M2
medium. For RNA analysis shown in Figure 3D, 250 ng/l of scramble siRNA control or siRNAs against Gata6as were
injected into one-cell embryos. To study the effect of Gata6as knockdown on the number of cells expressing GATA6
shown in Figures 3E and 3F, we co-injected 250 ng/l of a scramble siRNA control or siRNAs against Gata6as or
GATA6 with H2B-GFP mRNA into one cell of two-cell embryos (Figure S2H). H2B-GFP expression marks the cells
that are injected with siRNAs. Five different siRNAs against Gata6as were separated into two shRNA pools for
injection. Microinjected zygotes (20-30 embryos per injection) were cultured in KSOM medium for 2-3 days.
Blastocysts were harvested for RNA analysis or fixed and stained with anti-GATA6 antibody (R&D Systems, AF1700).
For RT-qPCR of embryos, expression was normalized to TUB4 and error bars were calculated from four independent
microinjection experiments. Primers for shRNAs and siRNAs are listed in Table S7.
Antisense oligonucleotide (ASO) treatment
An alternative gene-silencing approach is based on treatment with locked nucleic acid-based anti-sense
oligonucleotide gapmers (ASOs), which induce RNA degradation by recruiting RNase H to their target RNAs in a
strand-specific manner (Wheeler et al., 2012). The mechanism is distinct from the RNAi approach, which involves
AGO/RISC complexes. As it is difficult to sustain the levels of transfected ASO necessary for efficient knockdown
during 4 days of ESC differentiation, we assayed the effect of ASO treatment of Evx1as while we artificially activated
Evx1as and EVX1 by CRISPR-on (Konermann et al., 2015). ASO treatment was performed as previously described
(Yin et al., 2012). We synthesized five antisense phosphorothioate-modified oligodeoxynucleotides (ASO) targeting
Evx1as RNA (BioSune, in Shanghai, China). In Figures 4E, 4G and 5D, five ASOs were mixed together for Evx1as
knockdown. The control ASO was the same as previously used (Yin et al., 2012). For ASO treatment in CRISPR-on
experiment, ESCs were first transfected with CRISPR-on components including dCas9-VP64, MS2-P65-HSF1 and
sgRNA (fused with MS2). After 12 hours of transfection, ESCs were transfected again with ASO (Lipofectamine 3000,
Life Technology). Transfected cells were then cultured for 2 days before harvest for RNA analysis.
CRISPR/Cas9-mediated knockout and knockin
Plasmids expressing Cas9 (Addgene ID 44758; ‘pST1374-N-NLS-flag-linker-Cas9’) and sgRNAs (‘pGL3-U6-
sgRNA’) were mixed in a 1:1 ratio and cotransfected into ESCs by lipofectamine 2000 (Mali et al., 2013; Shen et al.,
2013; Zhou et al., 2014) (Life Technologies, #200059-61). For knockout, Cas9 and two sgRNAs flanking the genomic
regions to be deleted were cotransfected into ESCs. For knockin, considering that CRISPR/Cas9-mediated excision in
a targeted genomic region might enhance the rate of homologous recombination in ESCs, we cotransfected a targeting
vector for homologous recombination with Cas9, one sgRNA that targets the site of insertion and one sgRNA that
targets the vector for linearization. Targeting plasmids contain a CAG promoter sequence and a hygromycin selection
cassette (PGK-hygro) which is flanked by two loxP sites and can be excised by CRE recombinase. The CAG and PGK-
hygro cassettes are flanked by 5’ and 3’ homology arms (~1 kb in length) which allow homologous recombination and
precise insertion into targeting sites.
ESCs were selected by puromycin (for Cas9-expressing cells) or hygromycin (for knockin vectors) 12 hours post
transfection for 2 days and a portion of them were subjected to genomic DNA isolation and PCR analysis of deletion
or insertion alleles. ESCs transfected with Cas9 alone were used as a negative control for PCR analysis. If deletion or
insertion was detected in mixed cells, ESCs were then plated at low density in 10-cm plates and clones were picked in
6-7 days. Individual ESC clones (24-96 clones) were picked, expanded and analyzed by PCR genotyping and Southern
blotting.
CAG knockin ESCs were transfected with CRE-GFP plasmids to excise the PGK-hygro cassette. CRE-GFP

positive cells were FACS sorted and plated. Single ESC clones were picked, expanded and analyzed by PCR. Primers
and sgRNA sequences are listed in Table S7.
CRISPR-mediated activation (CRISPR-on), interference (CRISPRi)
CRISPR-on was performed as previously described (Konermann et al., 2015). Plasmids expressing dCas9-VP64
(Addgene #61425), MS2-P65-HSF1 (Addgene #61426) and sgRNA (fused with MS2) (Addgene #61427) were
cotransfected into ESCs by lipofectamine 2000 (Life Technologies). ESCs were selected with hygromycin and
blasticidin for 2 days before RNA isolation and RT-qPCR analysis. All sgRNAs used for CRISPR-on are fused with an
MS2 aptamer.
CRISPRi was performed as previously described (Qi et al., 2013). It has been reported that cotransfection of
catalytically inactive CAS9 (dCAS9) with an sgRNA targeting the non-template DNA strand of a gene, but not the
template strand, can block elongation of transcripts (Qi et al., 2013; Rossi et al., 2015). Two sgRNAs were designed to
target the same DNA location which is ~52 bp downstream of Evx1as or EVX1 TSS, one targeting the non-template
strand which is expected to effectively inhibit transcription elongation of targeted genes and one targeting the template
strand which have no effect on transcription elongation. After one day of ESC differentiation induced by LIF withdrawal,
sgRNAs were co-transfected with dCas9. Transfected cells were harvested after 2 days for RT-qPCR.
RNA tethering
RNA-tethering was performed as previously described (Shechner et al., 2015). RNA is fused with an sgRNA at
its 5’ end and a U1 3’box at its 3’end. The short (s) and long (l) isoforms of Evx1as RNA as well as a control expressing
the reverse sequence (rs) of the Evx1as short isoform, GFP and HOTTIP RNA were fused to sgRNAs targeting to the
promoter, potential enhancer and a non-related region (the immediate upstream of the TSS of REX1). Then, the fusion
RNA-sgRNA constructs were co-transfected with dCas9 into ESCs for 2 days before harvest for RT-qPCR. The length
of RNA transcripts used in the tethering experiments is: 621 nt for Evx1as (s) or (rs); 2789 nt for Evx1as (l) or (rl);
2877 nt for EVX1; 1962 nt for the lncRNA HOTTIP; 720 nt for GFP RNA. Sequences for sgRNAs are listed in Table
S7.
Transposon-mediated overexpression
The full-length, long isoform of Evx1as in day-4 differentiated ESCs was cloned by 5’ and 3’ rapid amplification
of cDNA ends (RACE) (Takara, D315 and D314). The cDNA sequences of Evx1as and EVX1 were cloned into a
PiggyBac vector and placed downstream of the CAG promoter. Overexpression vectors were co-transfected with
pBASE transposase into ESCs. ESCs that stably express Evx1as or EVX1 through transposon-mediated random
insertion were selected by hygromycin and maintained for subsequent analyses. Primers for RACE are listed in Table
S7.
Single-cell and time-course expression analysis
Single-cell expression analysis was performed as described previously (Tang et al., 2010) (Kurimoto et al., 2007).
Briefly, cells were digested into single-cell suspensions. Single cells were manually picked, lysed in reverse
transcription buffer and used immediately for cDNA synthesis with oligo-dT primers by SuperScript III (Life
Technologies). The cDNA samples were subjected to a pre-amplification step (20 cycles) or directly used for real-time
qPCR detection (Bio-Rad, SybrGreen mix). Evx1as (Evx1as-rtf/r) and EVX1 (EVX1-rtf/r) primers show similar PCR
efficiencies (Figure S6A). PCR detection of GADPH was used as a loading control. Only cells with detectable GADPH
expression were counted and analyzed. In total, data from 64–285 single cells per time point were collected from three
independent differentiation experiments induced by LIF withdrawal. The number of RNA molecules per cell was
calculated based on standard curves plotted using purified PCR products from Evx1as and EVX1 cDNAs as the template.
We estimated that 5 femtograms of Evx1as or EVX1 template (purified PCR product) contained ~1.2 x 10⁴ molecules
(385 bp in length, MW ~2.5 x 10⁴/mol) or ~1.5 x 10⁴ molecules (306 bp in length, MW ~2.0 x 10⁴/mol), respectively.
A threshold of 2 RNA molecules per cell was chosen. Only if a cell population contain 5 cells in each time point,
median expression was calculated and considered biologically meaningful. Sporadic expression in 1~2 cells was not
counted. Because the range of transcript numbers per cell was similar with or without amplification (Figures 6D and
S6B), data from different experiments were pooled (Figures 6B-6D). When calculating the median transcript abundance
per cell, we only considered a population containing 5 cells as biologically meaningful.
Quantitative RT-qPCR analysis
Total RNA was treated with DNase I and reverse transcribed by SuperScript III (Life Technologies). To detect the
premature RNA of Evx1as and the pre-mRNA of EVX1, pairs of primers covering one exon-intron junction were used.
To detect the mature RNA or mRNA, pairs of primers covering two exons were used. Gene expression was normalized
to GADPH except for the Gata6as RNAi experiment in which expression was normalized to TUB4. Error bars in RT-
PCR analysis represent standard deviations of mean expression relative to GADPH or TUB4, or average fold changes
compared to the scrambled shRNA control. Primer sequences are listed in Table S7.
RNA-Seq and ChIP-seq data analysis
The RNA and DNA libraries were constructed by following Illumina library preparation protocols. High-
throughput sequencing was performed on a HiSeq2000 or 2500. Alignments of RNA-Seq data were performed using
Tophat v2.0.10 (Trapnell et al., 2012). Only those reads uniquely mapped to the reference genome were kept for further
analysis (Tophat parameter “–g 1”). Fragments Per Kilobase of exon model per Million mapped reads (FPKM) were
calculated by Cufflink 2.1.1 (Trapnell et al., 2012) to represent expression levels of transcripts.
The sets of genes highly expressed in ESCs (95 genes), mesendoderm (marked by brachyury (T)-driven GFP, ME-
high genes, 174) and neural precursor cells (marked by SOX1-driven GFP, NPC-high genes, 198) were selected as
previously described (Shen et al., 2009; Shen et al., 2008) (Table S6C). XEN-high genes (35) were enriched in
extraembryonic endoderm cells (Table S6C). Gene set enrichment analysis (GSEA) was performed as described
previously by comparing knockdown cells to the scramble shRNA control cells (Shen et al., 2009; Shen et al., 2008).
ChIP-seq reads were aligned to genome assemblies (hg19 or mm10) with no gaps by Bowtie2 v2.1.0 (Langmead
et al., 2009). Aligned files were further converted to bedgraph files with BEDTools (Quinlan and Hall, 2010). Average
ChIP-seq reads within 5-10 kb regions relative to TSSs were calculated and plotted in Figures 1H. All RNA-Seq and
ChIP-seq datasets used in this study are listed in Table S8.
Chromatin immunoprecipitation (ChIP), RNA immunoprecipitation (RIP) and Chromatin isolation by RNA
purification (ChIRP)
ChIP was performed as previously described (Shen et al., 2008) with antibodies for H3K4me3 (Abcam, ab8580),
H3K27ac (Abmart), MED12 (Bethyl labs,A300-774A), MED1 (Bethyl labs, A300-793A), CTCF (Millipore 07-729).
Fold enrichment was normalized to an unrelated genomic region (‘nc’, primers CSa) and the input. RIP was performed
as previously described (Yang et al., 2014). Fold enrichment was normalized to GAPDH.
ChIRP was performed as previously described (Yin et al., 2015). Briefly, 59-nt DNA probes were biotinylated by
terminal transferase (New England Biolabs). Sequential crosslinking was performed with the following steps: two
rounds of 300 mJ UV treatment on ice, treatment with 0.8% formaldehyde (FMA) for 10 minutes, treatment with 2 mM
dithiobis (succinimidyl propionate) (DSP) for 30 minutes, and treatment with 3.7% FMA for 10 minutes at room
temperature. Chromatin was sonicated to yield fragments of 2-5 kb in size. Hybridization, washing and elution steps
were performed as previously described; however, we added an additional stringent wash step (0.1x SSC). After elution
and reverse crosslinking, the DNA was subjected to qPCR analysis or sequencing library construction. The RNA was
also isolated for RT-qPCR analysis. To minimize non-specific targeting of ChIRP probes to chromatin DNA, we
performed Evx1as and EVX1 ChIRP in undifferentiated ESCs lacking both RNA transcripts. For ChIRP-Seq data anlysis,
raw reads were uniquely mapped to the mouse genome (mm9) using Bowtie v.1.0.0 (Langmead et al., 2009). Positive
peaks were identified with the MACS program by comparing D4 to D0 samples with a p-value cutoff of 1×10⁻⁵ (Zhang
et al., 2008). Fold enrichment of chromatin association of Evx1as or EVX1 was calculated by normalizing ChIRP signals
to undifferentiated ESCs and an unrelated genomic region (primers CSa) in order to minimize non-specific targeting of
ChIRP probes to chromatin. The probe and primer sequences are listed in Table S7.
Chromosome conformation capture (3C)
The 3C analysis was performed as previously described (Miele and Dekker, 2009). Briefly, 5x10⁶ undifferentiated
or day-4 differentiated ESCs (wild-type or Evx1as-null ESCs) were crosslinked with 1% FMA at room temperature for
10 min. After nuclear extraction by douncer homogenization, pellets were suspended in NEB buffer 3 with 0.1% SDS
at 65C for 30 min, and then quenched with 1% Triton X-100, added 200U of BglII and BclI to digest chromatin at
37C overnight. After digestion, 1% SDS was added to the reaction to inactivate enzymes at 65C for 30 min. The
reaction mix was diluted for 20-fold with DNA ligation buffer with 1% Triton X-100, and then added 1/40 volume of
T4 DNA ligase (4000U) at 16C for 4h. After reverse crosslink overnight by protease K, DNA was isolated by
phenol/chloroform extraction. A genomic DNA sequence covering the Evx1as/EVX1 locus and nearby regions was
amplified by PCR to normalize PCR efficiency for 3C primers. The DNA control was subjected to BglII and BclI
digestion, ligation and DNA extraction. Interaction frequencies were calculated by dividing the normalized ratios in the
chromatin samples to the level in the DNA control.
Nuclear run-on
Nuclear run-on was performed as previously described (Patrone et al., 2000). About 5x10⁷ ESCs were harvested
and washed with PBS for one run-on experiment. Cell pellets were added 1ml of lysis buffer (10 mM Tris-HCl, pH 7.4,
3 mM MgCl2, 10 mM NaCl, 150 mM sucrose and 0.5% NP-40) and incubated on ice for 5 min. After centrifugation at
250g, the pellet was washed with lysis buffer without NP-40 and re-suspended with 100 l nuclear storage buffer (50
mM Tris-HCl, pH 8.3, 40% glycerol, 5 mM MgCl2 and 0.1 mM EDTA). Equal volume of 2X transcription buffer (200
mM KCl, 20 mM Tris-HCl, pH8.0, 5 mM MgCl2, 4 mM DTT, 4 mM each of ATP, GTP and CTP, 200 mM sucrose and
20% glycerol) was added into nuclei and then supplied with 8 l biotin-16-UTP (10 mM, Roche). After incubation at
29C for 30 min, RNA was extracted by Trizol. About 50 l of M280 Dyna beads were washed with PBS, resuspended
into 50 l of 2X binding buffer (10 mM Tris-HCl, pH 7.5, 1 mM EDTA and 2 M NaCl), and then mixed with equal
volume of purified RNA. After incubation at RT for 4 hours, beads were washed twice with 2X SSC plus 15%
formamide, 2X SSC once and finally re-suspended in 30 l RNase-free water for RT-qPCR. RT-qPCR primers used to
detect premature RNA of Evx1as and the pre-mRNA of EVX1 were designed to cover one exon-intron junction, that is,
one primer locates in the intron and one in an adjacent exon.
Northern and southern blot analysis
Wild-type ESCs at days 0 and 4 of differentiation induced by LIF withdrawal were harvested for total RNA
isolation by Trizol (Life Technologies). The polyA+ RNA fractions were enriched using a Dynabeads mRNA
purification kit (Life Technologies). About 1 µg of polyA+ RNA was loaded per lane for northern blot analysis. For
southern blot analysis, 5-10 µg of digested genomic DNA from wild-type or mutant ESCs was loaded per lane.
Digoxigenin-labeled antisense RNA probe or DNA probes were used for northern or southern blotting, respectively.
For northern blot detection of Evx1as, the probe was a ~360-nt DIG-UTP labeled RNA probe that was in vitro
transcribed by MaxiScript T3 kit (Ambion, AM1316). Southern probes were DIG-dUTP-labeled DNA, ~800 bp in
length. Hybridization was done overnight at 68C or 42C for Northern or Southern blotting, respectively. After
washing, membranes were stained with anti-DIG-AP (Roche) and exposed to X-ray film. Primers for northern and
southern probes are listed in Table S8.
RNA fluorescence in situ hybridization (FISH)
FISH was performed according to the manufacturer’s protocol of Stellaris FISH probes (www.biosearchtech.com).
A total of 48 probes labeled with Quasar570 (Cy3 replacement) were used to target Evx1as transcripts. ESCs were
plated on cover glasses and differentiated for 4 days after LIF withdrawal. Cells were washed with PBS and fixed by
3.7% formaldehyde for 10 min at room temperature. Then washed with PBS and permeabilized with 70% ethanol at
4°C for at least an hour. After permeabilization, cells were washed with washing buffer (2X SSC contain 10%
formamide) and hybridized with 250 nM probes (2X SSC with 100 mg/mL dextran sulfate and 10% formamide) in a
dark humidified chamber at 37°C for 4 hours. Then washed twice and stained with 5 ng/mL DAPI in washing buffer at
37°C for 30 min. At last, coverslips were mounted by Fluoromount-G (Southern Biotech).
Subcellular fractionation
Subcellular fractionation was performed as described previously (Bhatt et al., 2012). Briefly, ESCs were
resuspended in cold cytoplasmic lysis buffer (containing 0.15% NP-40), laid onto cold sucrose buffer, and then
centrifuged to separate the cytoplasmic fraction from the nuclei. The nuclear pellet was resuspended in nuclear lysis
buffer (containing 0.5M urea, 0.5% NP40) and centrifuged. The soluble nucleoplasm fraction was extracted, then the
chromatin pellet was resuspended in PBS. RNA was extracted by TRIzol reagent (Life Technologies).
RNA pull-down
RNA pull down was performed as described previously (Carla et al., 2013). Briefly, biotinylated RNAs were
transcribed in vitro by T7 (sense RNA) or T3 (reverse RNA) polymerase according to the manufacturer’s protocol
(Ambion, AM1354 and AM1316). Biotin-16-UTPs (Roche) were added as 5% of UTP in the reactions. About 2 g of
biotinylated RNAs were heated for 10 min at 95°C, and then cooled down to room temperature in RNA structure buffer
(10 mM Tris pH 7, 0.1 M KCl, 10 mM MgCl2). About 5x10⁷ day-4 differentiated ESCs were used for each RNA pull-
down experiment. Cells were re-suspended in 2 ml PBS and added 8 ml nuclear isolation buffer (10 mM Tris pH 7.5, 5
mM MgCl2, 1% Triton-X100) followed by 20 min incubation on ice. Nuclei were pelleted by centrifugation at 2,500g
for 15 min and resuspended in 1ml RIP buffer (25 mM Tris pH 7, 0.15 M KCl, 0.5mM DTT, 0.5% NP-40, 1 mM PMSF,
cocktail and RNaseOut). After 20 stocks of homogenization by a dounce homogenizer and 10 min centrifugation at
13,000 rpm, the supernatant was collected as nuclear extract. Nuclear extract was pre-cleared by 30 l M280 beads
(Life technology) and 20 g yeast RNA for 1 hour at 4°C, and then incubated with 2 g biotinylated RNA at 4°C
overnight, followed by addition of 40 l equilibrated M280 beads for additional 3 hours at 4°C. After 4x10 min washes
by RIP buffer, proteins bound to RNA were eluted in 2% SDS sample buffer by heating at 95°C for 10 min, and then
analyzed by western blot.
SUPPLEMENTAL REFERENCES
Bhatt, D.M., Pandya-Jones, A., Tong, A.J., Barozzi, I., Lissner, M.M., Natoli, G., Black, D.L., and Smale, S.T. (2012).
Transcript dynamics of proinflammatory genes revealed by sequence analysis of subcellular RNA fractions. Cell 150,
279-290.
Conti, L., Pollard, S.M., Gorba, T., Reitano, E., Toselli, M., Biella, G., Sun, Y., Sanzone, S., Ying, Q.L., Cattaneo, E.,
et al. (2005). Niche-independent symmetrical self-renewal of a mammalian tissue stem cell. PLoS biology 3, e283.
Fidalgo, M., Faiola, F., Pereira, C.F., Ding, J., Saunders, A., Gingold, J., Schaniel, C., Lemischka, I.R., Silva, J.C., and
Wang, J. (2012). Zfp281 mediates Nanog autorepression through recruitment of the NuRD complex and inhibits somatic
cell reprogramming. Proceedings of the National Academy of Sciences of the United States of America 109, 16202-
16207.
Flicek, P., Amode, M.R., Barrell, D., Beal, K., Billis, K., Brent, S., Carvalho-Silva, D., Clapham, P., Coates, G.,
Fitzgerald, S., et al. (2014). Ensembl 2014. Nucleic acids research 42, D749-755.
Harrow, J., Frankish, A., Gonzalez, J.M., Tapanari, E., Diekhans, M., Kokocinski, F., Aken, B.L., Barrell, D., Zadissa,
A., Searle, S., et al. (2012). GENCODE: the reference human genome annotation for The ENCODE Project. Genome
research 22, 1760-1774.
Huang da, W., Sherman, B.T., and Lempicki, R.A. (2009). Systematic and integrative analysis of large gene lists using
DAVID bioinformatics resources. Nat Protoc 4, 44-57.
Karolchik, D., Barber, G.P., Casper, J., Clawson, H., Cline, M.S., Diekhans, M., Dreszer, T.R., Fujita, P.A., Guruvadoo,
L., Haeussler, M., et al. (2014). The UCSC Genome Browser database: 2014 update. Nucleic acids research 42, D764-
770.
Kurimoto, K., Yabuta, Y., Ohinata, Y., and Saitou, M. (2007). Global single-cell cDNA amplification to provide a
template for representative high-density oligonucleotide microarray analysis. Nat Protoc 2, 739-752.
Langmead, B., Trapnell, C., Pop, M., and Salzberg, S.L. (2009). Ultrafast and memory-efficient alignment of short
DNA sequences to the human genome. Genome biology 10, R25.
Mali, P., Esvelt, K.M., and Church, G.M. (2013). Cas9 as a versatile tool for engineering biology. Nature methods 10,
957-963.
McLean, C.Y., Bristor, D., Hiller, M., Clarke, S.L., Schaar, B.T., Lowe, C.B., Wenger, A.M., and Bejerano, G. (2010).
GREAT improves functional interpretation of cis-regulatory regions. Nature biotechnology 28, 495-501.
Miele, A., and Dekker, J. (2009). Mapping cis- and trans- chromatin interaction networks using chromosome
conformation capture (3C). Methods in molecular biology (Clifton, NJ 464, 105-121.
Moffat, J., Grueneberg, D.A., Yang, X., Kim, S.Y., Kloepfer, A.M., Hinkle, G., Piqani, B., Eisenhaure, T.M., Luo, B.,
Grenier, J.K., et al. (2006). A lentiviral RNAi library for human and mouse genes applied to an arrayed viral high-
content screen. Cell 124, 1283-1298.
Okada, A., Aoki, Y., Kushima, K., Kurihara, H., Bialer, M., and Fujiwara, M. (2004). Polycomb homologs are involved
in teratogenicity of valproic acid in mice. Birth defects research 70, 870-879.
Pruitt, K.D., Brown, G.R., Hiatt, S.M., Thibaud-Nissen, F., Astashyn, A., Ermolaeva, O., Farrell, C.M., Hart, J.,
Landrum, M.J., McGarvey, K.M., et al. (2014). RefSeq: an update on mammalian reference sequences. Nucleic acids
research 42, D756-763.
Qi, L.S., Larson, M.H., Gilbert, L.A., Doudna, J.A., Weissman, J.S., Arkin, A.P., and Lim, W.A. (2013). Repurposing
CRISPR as an RNA-guided platform for sequence-specific control of gene expression. Cell 152, 1173-1183.
Quinlan, A.R., and Hall, I.M. (2010). BEDTools: a flexible suite of utilities for comparing genomic features.
Bioinformatics 26, 841-842.
Sharif, B., Na, J., Lykke-Hartmann, K., McLaughlin, S.H., Laue, E., Glover, D.M., and Zernicka-Goetz, M. (2010). The
chromosome passenger complex is required for fidelity of chromosome transmission and cytokinesis in meiosis of
mouse oocytes. Journal of cell science 123, 4292-4300.
Shen, B., Zhang, J., Wu, H., Wang, J., Ma, K., Li, Z., Zhang, X., Zhang, P., and Huang, X. (2013). Generation of gene-
modified mice via Cas9/RNA-mediated gene targeting. Cell research 23, 720-723.
Shen, X., Liu, Y., Hsu, Y.J., Fujiwara, Y., Kim, J., Mao, X., Yuan, G.C., and Orkin, S.H. (2008). EZH1 Mediates
Methylation on Histone H3 Lysine 27 and Complements EZH2 in Maintaining Stem Cell Identity and Executing
Pluripotency. Mol Cell 32, 491-502.
Theunissen, T.W., van Oosten, A.L., Castelo-Branco, G., Hall, J., Smith, A., and Silva, J.C. (2011). Nanog overcomes
reprogramming barriers and induces pluripotency in minimal conditions. Curr Biol 21, 65-71.
Trapnell, C., Roberts, A., Goff, L., Pertea, G., Kim, D., Kelley, D.R., Pimentel, H., Salzberg, S.L., Rinn, J.L., and
Pachter, L. (2012). Differential gene and transcript expression analysis of RNA-seq experiments with TopHat and
Cufflinks. Nature Protocols 7, 562-578.

Wang, J., Theunissen, T.W., and Orkin, S.H. (2007). Site-directed, virus-free, and inducible RNAi in embryonic stem
cells. Proceedings of the National Academy of Sciences of the United States of America 104, 20850-20855.
Yang, Y.W., Flynn, R.A., Chen, Y., Qu, K., Wan, B., Wang, K.C., Lei, M., and Chang, H.Y. (2014). Essential role of
lncRNA binding for WDR5 maintenance of active chromatin and embryonic stem cell pluripotency. eLife 3, e02046.
Yin, Y., Yan, P., Lu, J., Song, G., Zhu, Y., Li, Z., Zhao, Y., Shen, B., Huang, X., Zhu, H., et al. (2015). Opposing Roles
for the lncRNA Haunt and Its Genomic Locus in Regulating HOXA Gene Activation during Embryonic Stem Cell
Differentiation. Cell stem cell 16, 504-516.
Ying, Q.L., and Smith, A.G. (2003). Defined conditions for neural commitment and differentiation. Methods in
enzymology 365, 327-341.
Zhang, Y., Liu, T., Meyer, C.A., Eeckhoute, J., Johnson, D.S., Bernstein, B.E., Nusbaum, C., Myers, R.M., Brown, M.,
Li, W., et al. (2008). Model-based analysis of ChIP-Seq (MACS). Genome biology 9, R137.
Zhang, Y.E., Vibranovski, M.D., Landback, P., Marais, G.A., and Long, M. (2010). Chromosomal redistribution of
male-biased genes in mammalian evolution with two bursts of gene gain on the X chromosome. PLoS biology 8.
Zhou, J., Wang, J., Shen, B., Chen, L., Su, Y., Yang, J., Zhang, W., Tian, X., and Huang, X. (2014). Dual sgRNAs
facilitate CRISPR/Cas9-mediated mouse genome targeting. The FEBS journal 281, 1717-1725.