Embed Size (px)
Citation preview
~ ) Pergamon Journal of Atmospheric and Terrestrial Physics, Vol. 57, No. 4, pp. 383-393, 1995
Copyright © 1994 Elsevier Science Ltd Printed in Great Britain. All rights reserved
0021~9169/95 $9.50+0.00
0021-9169(94)E0010-7
Diurnal tide in the Antarctic and Arctic mesosphere/lower thermosphere regions
G. J. FRASER,* Yu. I. PORTNYAGIN,t J. M. FORBES,~ R. A. VINCENT,§ I. A. LYSENKO~" and N. A. MAKAROVt
* Department of Physics and Astronomy, University of Canterbury, Christchurch, New Zealand ; l'Scientific Production Association "Typhoon", Obninsk, Russia; :~ Center for Space Physics and
Department of Electrical, Computer and Systems Engineering, Boston University, Boston, U.S.A. ; §Department of Physics and Mathematical Physics, University of Adelaide, South Australia
(Received in final form 15 November 1993; accepted 15 November 1993)
Abstract--The behaviour of the diurnal tide at 95 km over various years between 1965 and 1986 is studied using radar data from Heiss Island (81°N), Mawson (67°S), Molodezhnaya (68°S) and Scott Base (78°S). The observations are also compared with the model results of FORBES and HAGAN [(1988) Planet. Space Sci. 36, 579] figr the same latitudes. There are substantial fluctuations in amplitude and phase at all stations, particularly in winter. Phase fluctuations can be as large as a uniform random distribution over the 24-h cycle. In summer the phases of the meridional components are well defined and suggest the presence of a dominant symmetric mode. The meridional amplitudes are larger in summer whereas the zonal components have a greate:r variation and show no significant variation with season.
1. INTRODUCTION
The Middle Atmosphere Program included new observational campaigns on a global scale. The Atmospheric Tides Middle Atmosphere Program (ATMAP, see FOR~tES, 1989) resulted in co-ordinated studies of atmospheric tides in the mesosphere and lower thermosphere, and their comparison with tidal models.
This paper discusses the behaviour of the diurnal tide around 95 kin, as observed by radars at Heiss Island in the Arctic and Mawson, Molodezhnaya and Scott Base in the Antarctic (see Table 1). Observations from these radars, together with data from Poker Flat (65°N), have been used in recent studies of the prevailing winds (PORTNYAGIN et al., 1993a) and semi- diurnal tide (PORTNYAGIS et al., 1933b) which show good agreement between the two different radar tech- niques. This agreement is confirmed here.
2,~ OBSERVATIONS The meteor radars at Heiss Island and Molo-
dezhnaya (LYSENKO et al., 1979) have observations spanning a period of 20 yr, whereas the partial reflec- tion spaced antenna mode radars at Scott Base and Mawson have only been operating since late 1982 and mid-1984, respectively. As the meteor wind radars at Molodezhnaya and Heiss Island do not record height
information, their altitude range is determined by the distribution of meteor echoes. This distribution is approximately Gaussian with a mean of 95 km and a half width of 5-7 km. These values of mean height and vertical spread of meteor echoes are used in the companion analyses (PORTNYAGIN et al., 1993a, b) based on the same data set. They are also consistent with meteor heights observed at middle latitudes (e.g. STEEL and ELFORD, 1991; TAYLOR, 1991). ELFORD (1980) has shown that summer/winter differences in
Table 1
Radar characteristics
Years of Site Type* data
Heiss Islandf (HI) (8t°N, 58°E) M 1965-1986 Mawson~ (MA) (67°S, 63°E) S 1984-1986 Molodezhnaya:~ (MO) (68°S, 46°E) M 1967-1986 Scott Base (SB) (78°S, 167°E) S 1983-1984
* M--meteor wind radar ; S--MF partial reflection spaced antenna radar.
t In most figures the Heiss Island observations have been shifted by six months to match the equivalent Southern Hemisphere season.
:~ Mawson is approximately 1000 km east of M olodezhnaya.
383
384 G . J. FRASER et al.
atmospheric density and temperature near the meso- pause can lead to differences between the summer and winter distribution of observed meteor heights. Elford estimates the difference t o be about 5 km at high latitudes.
The measurements from the partial reflection radars at Mawson (MAcLEOD and VINCENT, 1985) and Scott Base (FRASER, 1989) have been weighted by the meteor echo distribution function to yield a height sampling profile equivalent to that of the meteor winds. The amplitude of tidal components with short vertical wavelengths will be reduced by such smooth- ing. As an example, assuming a Gaussian smooth- ing function with a 6 km r.m.s, half-width, a sinus- oidal wind profile with a vertical wavelength of 30 km has its amplitude reduced by a factor of two. The monthly mean values discussed here were determined by accumulating observations by time of day and calculating the diurnal variation over this 24-h inter- val. The large short-term variability (see Section 3 below) implies that the monthly mean amplitudes will be reduced by the phase variability. Consequently the
characteristics of the diurnal tide presented in this paper are biased strongly towards features with ver- tical wavelengths exceeding 30 km, and time scales-of several weeks.
The model used for comparison with the observed diurnal tides is that of FORBES and HAGAN (1988), based on work by FORBES (1982), Which includes the effects of mean winds, meridional temperature gradients, and mechanical and thermal dissipation. The mean winds introduce significant asymmetry in amplitude and phase about the equator during solstice conditions. The mean zonal wind and temperature structure is the same as that used by FORBES (1982). Seasonal symmetry is assumed in the model, with results for December given, i.e. summer in the Southern Hemisphere and winter in the Northern Hemisphere.
3. S H O R T - T E R M P E R S I S T E N C E
It is possible to estimate the variability of the diur- nal tide on time scales of the order of a few days
( o ) Z o n a l
4 0 ~ . . . . . . . . . . . . . . . . . . , j 2 4
k, - - AMPUTUOE -I 2 2 3 5 ~ - . PHASE " " t 2 0
x x x x x X x J
¢D x ~ x • 0 -o 2 0 ~ , " " " "]12
O r" , , , ~ , , , , , , , i , , , , I 0
30
2 8
26
2 4 U~ 2 2
"~" 2o
4
2 0
1 0 2 0 3 0 4 0 5 0 6 0 7 0
D o y (1 S e p f e m b e r - 3 0 N o v e m b e r )
80 90
( b ) M e r i d i o n o l
• x , x . , -~ x x x Xx z
1 2 . c
xx x
10 20 30 40 50 60 70 80 90 Day (1 S e p f e m b e r - 30 November)
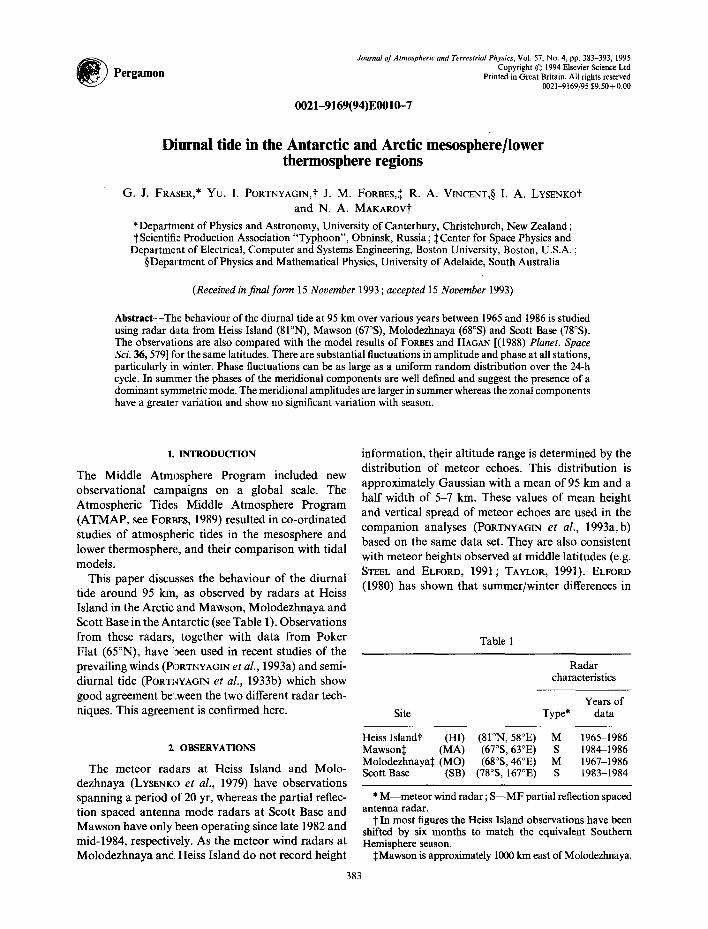
Fig. 1. Time series showing the day-to-day variabi l i ty of amplitude and phase o f the diurnal tide at Molodezhnaya in spring 1986.
2 4
2 2
2 0
1 8
1 4 " ~ o
10
8g 13 6 g 4
2
0
Antarctic and Arctic mesosphere/lower thermosphere regions 385
from time series comprising daily observations of the amplitude and phase: determined from 24 h of data at Molodezhnaya during summer, winter and spring. The observations from Molodezhnaya for spring (1 September-30 November 1986) are shown in Fig. 1. Considerable fluctua.tions in amplitude and phase are apparent. Experience from the ATMAP campaigns (e.g. FOR~ES, 1986) showed that four-day observation periods were too short to yield satisfactory steady- state tidal components. Consequently components calculated from one-day time series will contain sub- stantial transient components such as gravity waves and part-cycles of planetary waves. BERNARD (1981) showed that short term fluctuations in the meso- spheric semi-diurnal tide could be ascribed to changes in the relative amplitude and phase of various tidal modes, to longitudinal variations, and to local effects. Bernard studied the time scale of the fluctuations through the comp]lex autocorrelation function of differences from the (vector) mean amplitude and phase for the whole observation period.
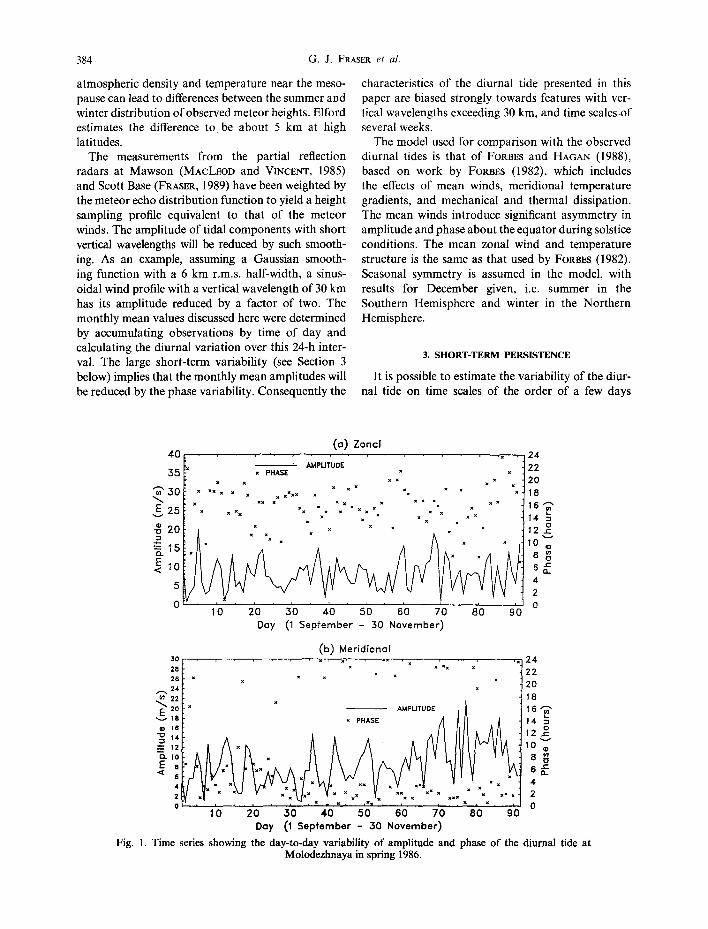
Figure 2 shows the results of a similar calculation
for 90 days of observations of the diurnal tide at Molodezhnaya. The complex value of the diurnal tide was calculated from the daily values of amplitude and phase. Mean values were then subtracted and the complex autocorrelation function calculated. The autocorrelation magnitudes mostly fall to a low value (~0.2) at a lag of one day, implying that successive daily values are almost independent. Such a rapid decrease in correlation suggests considerable fluc- tuation in amplitude and/or phase within the 24 h for which the tidal component was determined. However, in the meridional component, there is some evidence of structure on time scales of several days, assuming the consistency of the autocorrelation phase as a mea- sure of significance. BERNARD (1981) estimated that energy in the (1,1) mode would take approximately 12 days to travel around the globe. Recently, VIAL et
al. (1991) have made a numerical study of transient tidal forcing and found shorter set-up times of 6-8 day s, compared with BERNARD' S ( 1981) estimate of 12 days (these shorter set-up times reflect the influences of dissipation). The monthly vector means presented
(a) ZonQl I ,O 2 4 I
m , 9 ~ x ! 2 2 -o / !2o "~ , 8 MAGNITUDE
O 0'~ , 7 x x PHASE | 6 3
0 E .6 14~ t- .s 12
. 0 ,,..
~6 .4 10 "F
~ ,2 ~
°O i ' 4 ; g 1'0 1'2 1'4 16 0 Lag in days
(b) Meridionol
.~ .9 ~ 22 20 • 8 \ - - MAGNITUDE x
,7 16
o= ,s 12= "6 ,'= 110
. 3 B m 6r,
O ' '~ =' ' ' ' ' ' = ' ' ' ' ' ' 0 0 2 4 6 8 10 12 14 6
Log in doys
Fig. 2. The r~agnitude and phase of the complex autocorrelation function for the time series shown in Fig. 1,
386 G. J. FRASER et al.
in this paper should therefore be representative of the steady-state global scale modes, whereas fluctuations with periods less than ~ 10 days will have a large local component.
4. INTER-SEASONAL AND INTER-ANNUAL VARIABILITY
The remainder of this paper is concerned with monthly vector mean estimates from all four radars. There are long-term sequences available for Heiss Island (18-20 yr) and Molodezhnaya (13-20 yr), while the more recent data from Mawson and Scott Base are only available for 3-yr and 2-yr sequences, respectively.
The significance of the comparisons between years, sites and hemispheres will depend on the standard deviations of the relevant variable. There is a
sufficiently long sequence of data from Heiss Island and Molodezhnaya to provide a reasonable estimate of the standard deviation. Data for January, April, July and October are presented here as representative of the behaviour in the solstices and equinoxes.
The calculation of standard deviation (r.m.s differ- ence from the vector mean phase) is uncertain because of possible 2n ambiguities. For consistency, the esti- mates of the phase standard deviation in Table 2 were made from the monthly vector mean phases, adjusted by 2n to minimize differences from the long-term vec- tor mean for that month. The results must therefore be taken as a lower limit. For the meridional com- ponent at Molodezhnaya in July the standard devi- ation in phase is 7.3 h (Table 2). This estimate exceeds the population estimate (6.9 h) for a uniformly ran- dom distribution of phase over the 24 h (see also Fig. 6(b)) and indicates that the vector mean phase has
35
30
~" 25
E ~_~ 20
~ 1 5 . -
<
5
35
30
~" 25
E ,-- 20
=
5
(o) Zonal • , . , . . . , . . .
0 . . . . . . . H I MEAN 1965 -1985
0 - - H I MEAN 1985 -1984 • ~ H I IND IV IDUAL YEARS
1 2 3 4 5 6 7 8 9 10 11 12 Month (shifted 6 months)
(b) Meridionol , + . . . . . . . . . . . . . . . . & . . . . .
0 . . . . . . . H I MEAN 1965 -1985 0 - - HI MEAN 1983 -1984 + • - - H I IND IV IDUAL YEARS
.= .
i " = i
1 2 3 4 5 6 7 8 9 10 11 12 Month (shi f ted 6 months)
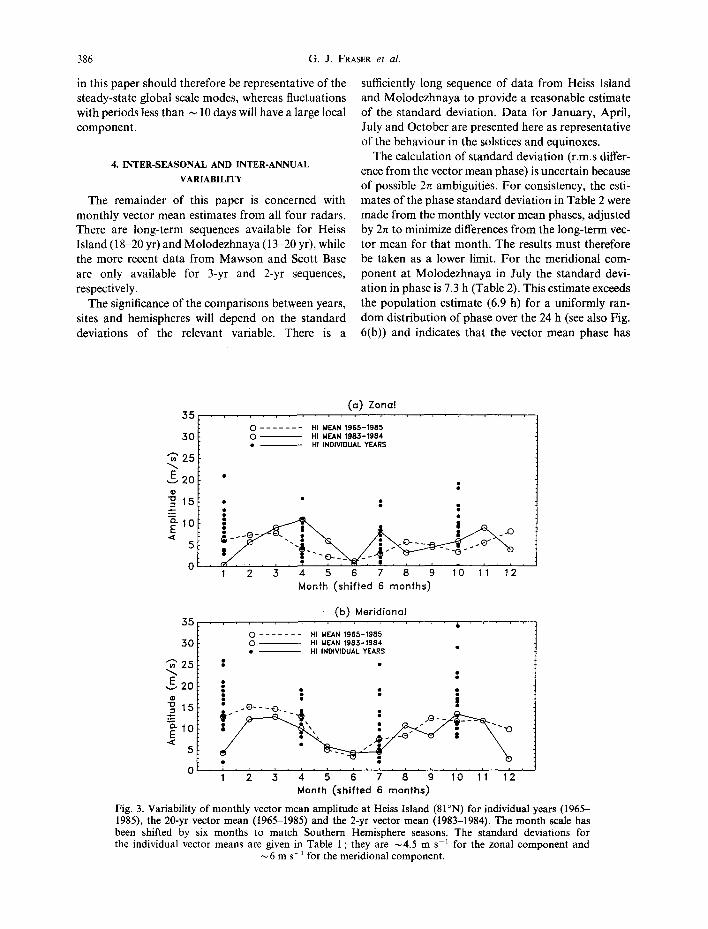
Fig. 3. Variability of monthly vector mean amplitude at Heiss Island (81°N) for individual years (1965- 1985), the 20-yr vector mean (1965-1985) and the 2-yr vector mean (1983-1984). The month scale has been shifted by six months to match Southern Hemisphere seasons. The standard deviations for the individual vector means are given in Table 1; they are ~4.5 m s -t for the zonal component and
6 m s- ~ for the meridional component.
Antarctic and Arctic mesosphere/lower thermosphere regions
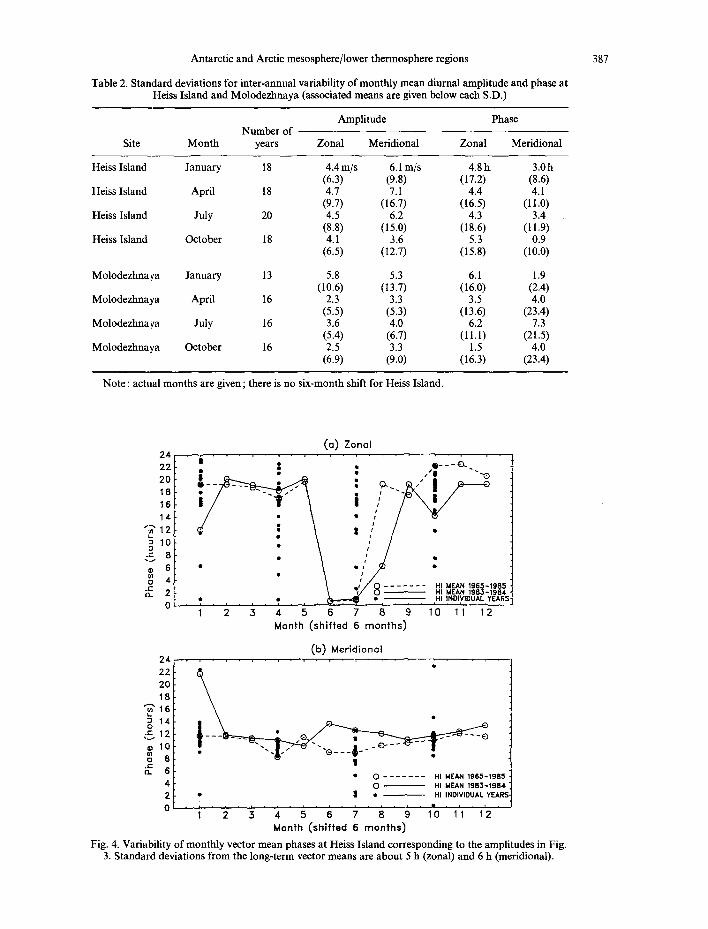
Table 2. Standard deviations for inter-annual variability of monthly mean diurnal amplitude and phase at Heiss Island and Molodezhnaya (associated means are given below each S.D.)
387
Amplitude Phase Number of
Site Month years Zonal Meridional Zonal Meridional
Heiss Island January 18 4,4 m/s 6.1 m/s 4.8 h 3.0 h (6.3) (9.8) (17.2) (8.6)
Heiss Island April 18 4.7 7.1 4.4 4.1 (9.7) (16.7) (16.5) (11.0)
Heiss Island July 20 4.5 6.2 4.3 3.4 (8.8) (15.0) (18.6) (11.9)
Heiss Island October 18 4.1 3.6 5.3 0.9 (6.5) (12.7) (15.8) (10.0)
Molodezhnaya January 13 5.8 5.3 6.1 1.9 (10.6) (13.7) (16.0) (2.4)
Molodezhnaya April 16 2.3 3.3 3.5 4.0 (5.5) (5.3) (13.6) (23.4)
Molodezhnaya July 16 3.6 4.0 6.2 7.3 (5.4) (6.7) (11.1) (21.5)
Molodezhnaya October 16 2.5 3.3 1.5 4.0 (6.9) (9.0) (16.3) (23.4)
Note : actual months are given ; there is no six-month shift for Heiss Island.
(a ) Zona l 2 4 ' l . . . . ' ~ ' l ' I I " I l ~ l I l I ' l I I I
$ ; e - - - o .
20 o
: \ I . 10 ~ • ,
° ! / , 2 ,:S 8 . ,, . 6 • =, •
0 4 • / . E • , . . . . . . I MEAN 1 9 6 5 - I g 8 5 [ L 2 I ~ 3 / 0 ~ HI MEAN 1@D3-1984.
• • ~ • ~ .HI INDI~/IDUAL YEARS 0 ' ' ' ~ . . . . . . . . . . . . . . . .
1 2 3 4 5 6 7 8 9 10 11 12 Month (sh i f ted 6 m o n t h s )
(b ) Mer id iona l 2 ~ ~ i l i , i l , i i I , i . . . . . . . . . . . . .
20 18
o 14 ~___ • . • . - - -E ) r 1 2 * : j
o 8 I
13= 6 • 0 . . . . . . . HI MEAN 1965-198S
4 0 ~ HI MEAN 1 9 8 3 - 1 9 8 4
2 • • e • ~ HI INDIVIDUAl YEARS
0 ; ' ' ' ' . . . . . . . . . . . . . • . . . . . 1 2 3 4 5 6 7 8 9 10 11 12
Month ( sh i f t ed 6 mon ths )
Fig. 4. Variability of monthly vector mean phases at Heiss Island corresponding to the amplitudes in Fig. 3. Standard deviations from the long-term vector means are about 5 h (zonal) and 6 h (mefidional).
388 G. J. FRASER et al.
little significance. This is possibly due to the low amplitude of this component in July (Fig. 5(b)) ; con- versely the low amplitude may be due to the wide range of phase fluctuations.
Figures 3 and 4 show the amplitude and the phase variability for the zonal and meridional components at Heiss Island. The time scale is shifted by six months to correspond with Southern Hemisphere seasons. Both components show a decrease in amplitude dur- ing the winter. The particularly low zonal amplitude in mid-winter (actual month December) appears in both the short-term and long-term vector means. AVERY et al. (1989) reported that in winter the phase structure of the diurnal tide at Mawson (67°S), Poker Flat (65°N) and Tromso (70°N) was less regular than in other seasons, and found phase gradients equi- valent to vertical wavelengths of 20-40 km. It is poss- ible then that the low amplitudes arise from a weak diurnal tide further diminished by the height-averaging discussed in Section 2. The influence of inter-annual variability is apparent in the differences between the 10-yr and 2-yr vector means.
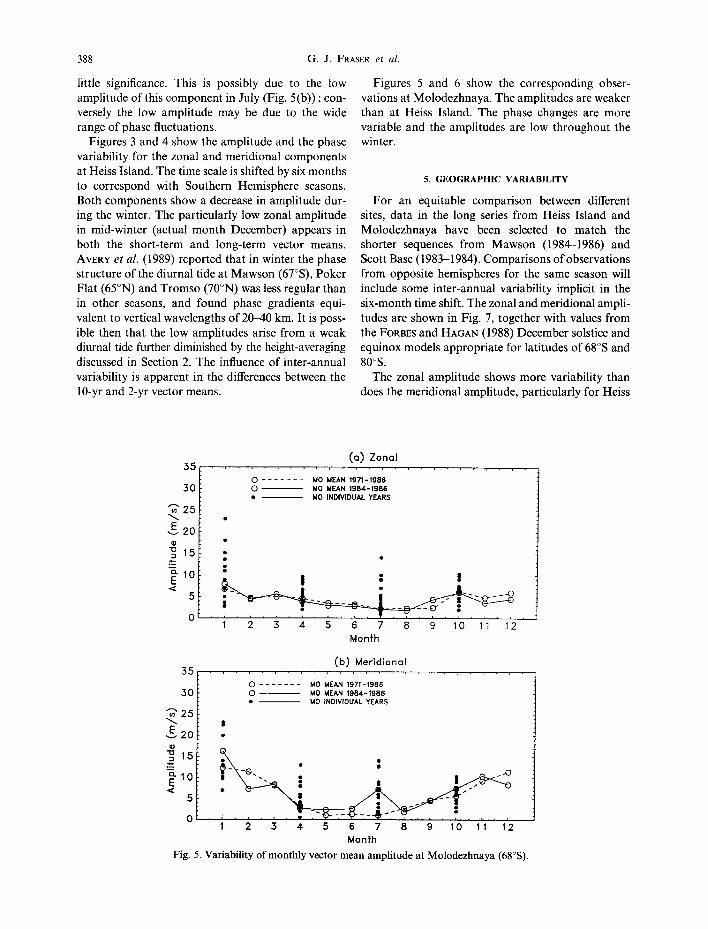
Figures 5 and 6 show the corresponding obser- vations at Molodezhnaya. The amplitudes are weaker than at Heiss Island. The phase changes are more variable and the amplitudes are low throughout the winter.
5. GEOGRAPHIC VARIABILITY
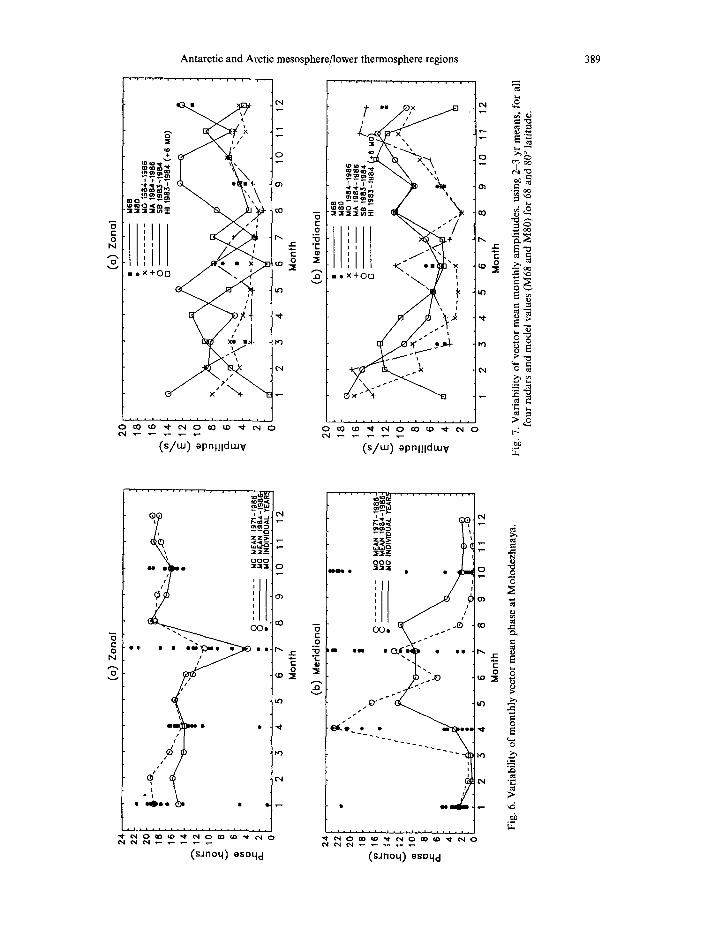
For an equitable comparison between different sites, data in the long series from Heiss Island and Molodezhnaya have been selected to match the shorter sequences from Mawson (1984-1986) and Scott Base (1983-1984). Comparisons of observations from opposite hemispheres for the same season will include some inter-annual variability implicit in the six-month time shift. The zonal and meridionat ampli- tudes are shown in Fig. 7, together with values from the FORBES and HAGAN (1988) December solstice and equinox models appropriate for latitudes of 68°S and 80°S.
The zonal amplitude shows more variability than does the meridional amplitude, particularly for Heiss
35
30
~" 25
E ~, 20
~-1o . <
5
35
(a) Zonal , . . . . . , . , • , . , .
0 . . . . . . . MO MEAN 1 9 7 1 - 1 9 8 6 0 - - MO MEAN 1 9 8 4 - 1 9 8 6 • - - MO INDIVIDUAL ' fEARS
= '
i , r , r , i , i , r , i , t , r , • , r , r
1 2 3 4 5 6 7 8 9 10 11 12 Month
(b) Meridional
3O
"~" 25
~ 20 - I
<
5
0 . . . . . . . MO MEAN 1 9 7 1 - 1 9 8 6 0 - - MO MEAN 1 9 8 4 - 1 9 8 6 • - - MO INDIVIDUAL YEARS
|
I •
G . • ~ . . @
1 2 3 4 5 6 7 8 9 10 11 12 Month
Fig. 5. Variability of monthly vector mean amplitude at Molodezhnaya (68°S).
t- O
N
Antarctic and Arctic mesosphere/lower thermosphere regions
0 uO ~o "~" c~ 0 ~0 t o "~ cq 0 e~
(~/w) ~pn~.!iduJ v
3 t- O
J[: I=
0
O)
aO
l,r)
0 aO ~, ",~I" ~ I 0 ~0 tO ",~- ~ I 0
( s / u J) ~pnl!iduJ Y
' r , '~
> ~ rz
389
O O 0
O0 • oO
e e , • • o m / ~ , . . . ~ • o, I~
~ 0 ~ o ~ o
(s~noq] oSQqd
c~
0 ooo
o ~ • ~ G ~ • oo
i ) . . ' 0
e ~ % • •
N
0 ' ~
IX) ,.-
tO
0
(sJnoq) esoqd
390 G. J. FRASER et al.
Island and Scott Base. The agreement between Molo- dezhnaya and Mawson is expected to be good as the stations are only 1000 km apart; the differences are not significant, given the standard deviations in Table 2. None of the stations shows a significant difference between winter and summer zonal amplitudes.
The meridional amplitudes show less variation, and show a decrease in amplitude during winter. The agreement between Heiss Island and Scott Base is good except in December and January. PORTNYAGIN e t al. (1993a) reported that large vertical gradients in the prevailing wind at Mawson can occur in summer, so that any shift in height of the meteor distribution (see Section 2 above), combined with inter-annual and inter-hemispheric variability, could lead to the observed difference. It is the similarity for the remain- der of the year which is surprising, as the observations were made in different hemispheres by different tech- niques, and six months apart.
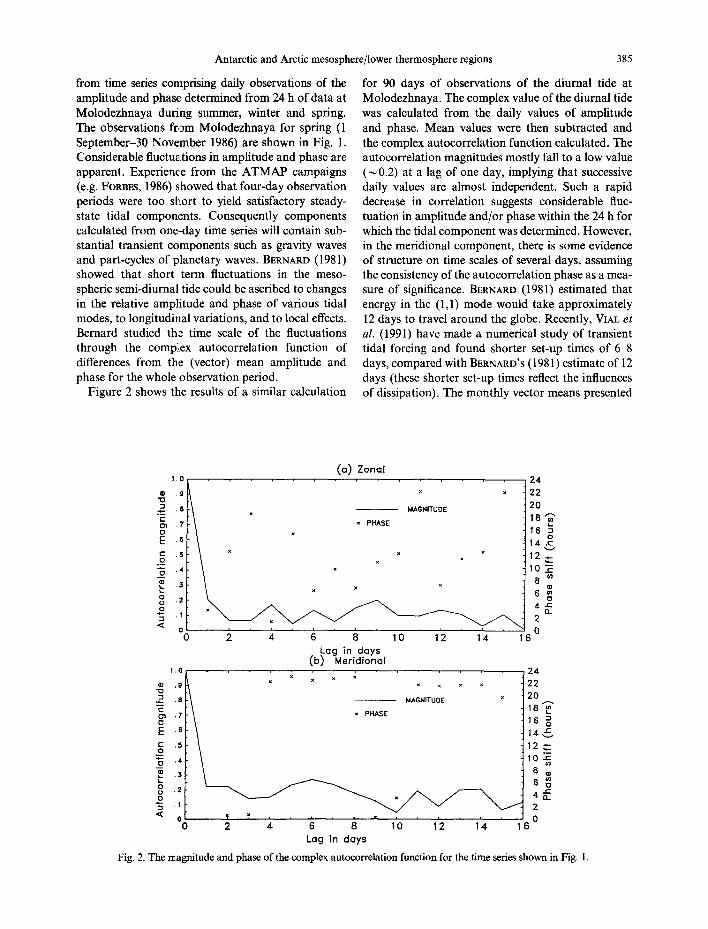
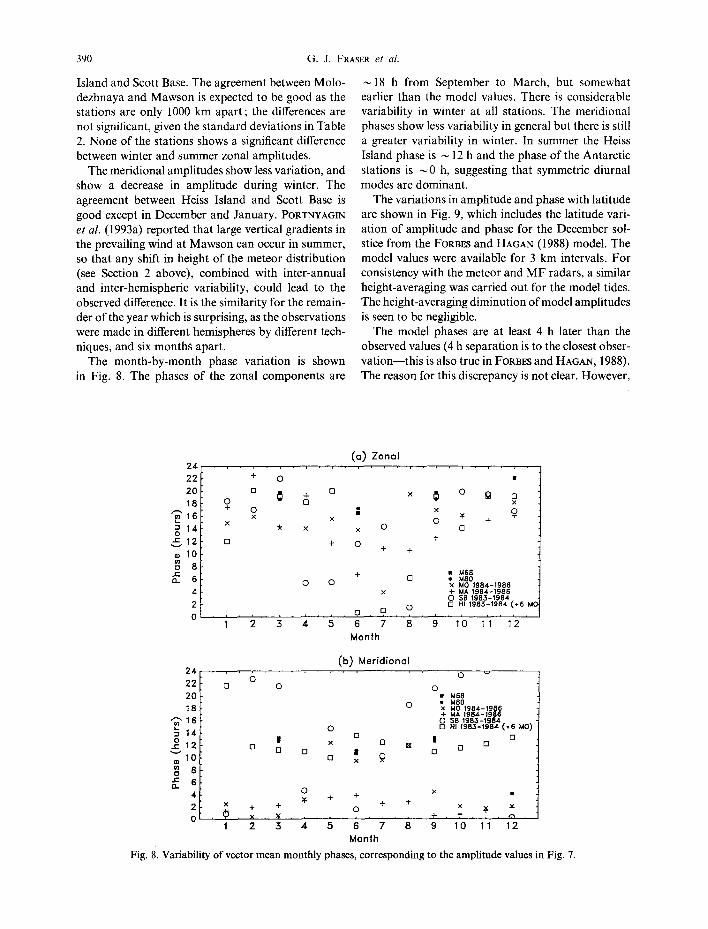
The month-by-month phase variation is shown in Fig. 8. The phases of the zonal components are
~18 h from September to March, but somewhat earlier than the model values. There is considerable variability in winter at all stations. The meridional phases show less variability in general but there is still a greater variability in winter. In summer the Heiss Island phase is ~ 12 h and the phase of the Antarctic stations is N0 h, suggesting that symmetric diurnal modes are dominant.
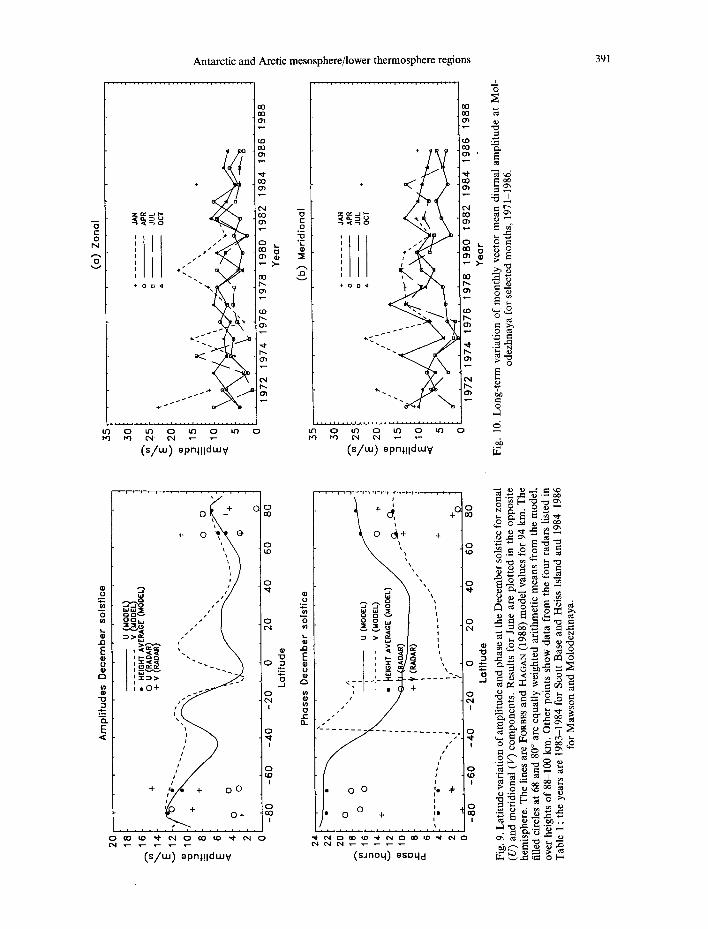
The variations in amplitude and phase with latitude are shown in Fig. 9, which includes the latitude vari- ation of amplitude and phase for the December sol- stice from the FORBES and HAGAN (1988) model. The model values were available for 3 km intervals. For consistency with the meteor and MF radars, a similar height-averaging was carried out for the model tides. The height-averaging diminution of model amplitudes is seen to be negligible.
The model phases are at least 4 h later than the observed values (4 h separation is to the closest obser- vat ion-this is also true in FORBES and HAGAN, 1988). The reason for this discrepancy is not clear. However,
2 4
2 2
2 0
1 8
"~'16 " 1 4 0
® 1 0
e -
,, 6
0 +
(a) Zonal . . . . . . , . , . ,
+ O
O X X
x x 0
+ 0 +
+
0 0 ×
~ , 9 , 1 2 3 4 5 6 7
M o n f h
, . , . , . , . ,
o g r: x x
x 0
0 + []
+
• )d68 [ ] • M80
X MO 1 9 8 4 - 1 9 8 6 t - MA 1 9 8 4 - 1 9 8 6 0 SB 1 9 8 3 - 1 9 8 4
O [ ] HI 1 9 8 3 - 1 9 8 4 ( * 6 MC
8 9 1 0 11 1 2
2 4
2 2
2 0
1 8
~ 8 o ~ 6
4. 2 0
(b ) M e r i d i o n o l
0 [ ] 0
0
II x [ ] O D [ ] n
0 • Id58
0 • M80 x MO 1 9 8 4 - 1 9 8 6 + IdA 1984m1986 0 SB 1 9 8 3 - 1 9 8 4
HI 1 9 8 3 - 1 9 8 4 ( .~6 MO)
II D D
O x
+ + + + 0 x ~
, x , ¥ . . . . . . . . . . . + , t , " ~9 " 1 2 3 4 5 6 7 8 9 1 0 1'1
M o n t h
Fig. 81 Variability o f vector m e a n month ly phases, corresponding to the ampl i tude values in Fig. 7.
"5 t- O
N
tO I,q
Antarctic and Arctic mesosphere/lower thermosphere regions
I o ~
0 tO 0 to 0 tO 0 tO ¢xl ~ ~
(s/uu) epnl!ldbu v
. . . . . . . . . . . . . . . . . . . . . . . . . . . . . . . . . .
÷
', - o o ' ~
0 ~
0 ~ .~, ,,,-,
tO 0 tO 0 tO 0 tO 0 ~
(s / tu) epnl!ldUJ v
391
~3 °--
0
E o
o o W
. o '1,l~,
I
• 0 + . ~ " ~
,,
/
j / /
+ 0 o
+ O +
0
0 to
0
0 c,I
0
0 ¢N
!
0
I
0 to
I
0 ~0
I
. . . . . . . :.-2. . . . . . . . . . 0 ~0 to ~ o,I 0 00 ~o ~" ¢N 0
( ~ ) gPnl!ldCUV
3
d
i /
0 0
0 0 +
i i
0 ( ~ + +
i
+
,/""" 1 ~ o I I
Io * I i
I
(sJnoq) g ' : O q d
0 O - - 0 ~
~ ~ ~ 4 ~ 0 o~ ~ o
"0 ~ < . - - 0
~ = ~ a ~
0 0 ~ O0 0
= ~ ~ - ~
~ . ~ , ~ o ~ . ~
i ,-1 -o .,= .,-., "~
I..~ ~ ..~ ~I O[ '~
392 G.J . FRASER et al.
E
35
30
25
20
15
10
5
(a) Zonal
a . . . . . . . JAN ($H) ('SUMMER) a - - APR (SH) + - - - - JUL (SH) (WINTER) o - - OCT (SH)
"
Us" \ ~, , ,3, o A. , ' A / b , / I \ o/,~, I~, \,~ \ ; cA , , l
2 1966 1968 1970 1972 1974 1976 1978 1980 1982 1984
Year
35
30
.~ 25 E
--- 20
" ,15
5
(b) Meridional . . . . . . . . . . . . . , ,
a . . . . . . . J A N (SH) (SUMMER) A A P R ( S H ) + - - - - JUL (SH) (WINTER)
= o O C T (SH)
,/\°. ,,,,
, r , i , i , i , i , i , i , i ,
0 '19'66' 19'68 1970 1972 1974 1976 1978 1980 1982 1984 Year
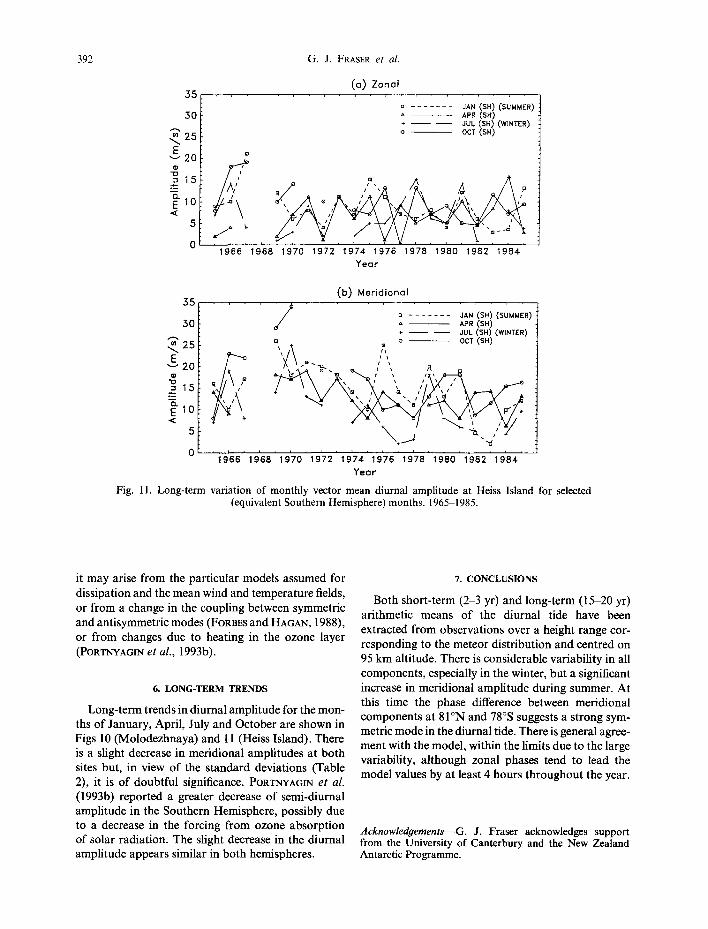
Fig. 11. Long-term variation of monthly vector mean diurnal amplitude at Heiss Island for selected (equivalent Southern Hemisphere) months, 1965-1985.
it may arise from the particular models assumed for dissipation and the mean wind and temperature fields, or from a change in the coupling between symmetric and antisymmetric modes (FORBES and HAGAN, 1988), or from changes due to heating in the ozone layer (PORTNYAGIN et al., 1993b).
6. LONG-TERM TRENDS
Long-term trends in diurnal amplitude for the mon- ths of January, April, July and October are shown in Figs 10 (Molodezhnaya) and 11 (Heiss Island). There is a slight decrease in meridional amplitudes at both sites but, in view of the standard deviations (Table 2), it is of doubtful significance. PORTNYAGIN et al.
(1993b) reported a greater decrease of semi-diurnal amplitude in the Southern Hemisphere, possibly due to a decrease in the forcing from ozone absorption of solar radiation. The slight decrease in the diurnal amplitude appears similar in both hemispheres.
7. CONCLUSIONS
Both short-term (2-3 yr) and long-term (15-20 yr) arithmetic means of the diurnal tide have been extracted from observations over a height range cor- responding to the meteor distribution and centred on 95 km altitude. There is considerable variability in all components, especially in the winter, but a significant increase in meridional amplitude during summer. At this time the phase difference between meridional components at 81°N and 78°S suggests a strong sym- metric mode in the diurnal tide. There is general agree- ment with the model, within the limits due to the large variability, although zonal phases tend to lead the model values by at least 4 hours throughout the year.
Acknowled#ements--G. J. Fraser acknowledges support from the University of Canterbury and the New Zealand Antarctic Programme.
Antarctic and Arctic mesosphere/lower thermosphere regions 393
J. M. Forbes acknowledges support under grant DPP- 8916343 from the U.S. National Science Foundation to Boston University.
R. A. Vincent acknowledges support from the Australian Research Council and Australian Antarctic Science Advisory Committee.
AVERY S. K., VINCEN']7 R. A., PHILLIPS A., MANSON A. H. and FRASER G. J.
BERNARD R. ELFORD W. G.
FORBES J. M. FORBES J. M. FORBES J. M. FORBES J. M. and HAGAN M. E. FRASER G. J. LYSENKO I. A., ORLYANSKY A. n . and
PORTNYAGIN YU. I. MACLEOD R. and VI~,~CENT R. A. PORTNYAGIN YD. I., FORBES J. M.-FRASER G. J.,
VINCENT R. A., AV~ERY S. K., LYSENKO I. A. and MAKAROV N. A.
PORTNYAGIN Yu. I., FORBES J. M.-FRASER G. J., VINCENT R. A., A~eRY S. K., LYSENKO I, A. and MAKAROV N. A.
STEEL D. I. and ELFORD W. G. TAYLOR A. D.
VIAL F., FORBES J. M and MIYAHARA S.
REFERENCES
1989 J. atmos, terr. Phys. 51, 595.
1981 J. atmos, terr. Phys. 43, 663. 1980 Solid Particles in the Solar System, I. HALLIDAY and
B. A. MCINTOSH (eds). D. Reidel, London. 1982 J. g¢ophys. Res. 87, 5222. 1986 Handbook for M A P 21, 56. 1989 J. atmos, terr. Phys. 51,553. 1988 Planet. Space Sci. 36, 579. 1989 Pure appl. Geophys. 130, 291. 1979 J. geomagn. Geoelect. 31, 411.
1985 1993a
J. atmos, terr. Phys. 47, 567. J. atmos, terr. Phys. 55, 827.
1993b J. atmos, terr. Phys. 55, 843.
1991 J. atmos, terr. Phys. 53, 409. 1991 A meteor orbit radar. Ph.D. thesis, University of
Canterbury, Christchurch, New Zealand. 1991 J. 9eophys. Res. 96, 1215.