Embed Size (px)
DESCRIPTION
planificacion de la distribucion incluyendo la incorporacion de lo la generacion distribuida
Citation preview
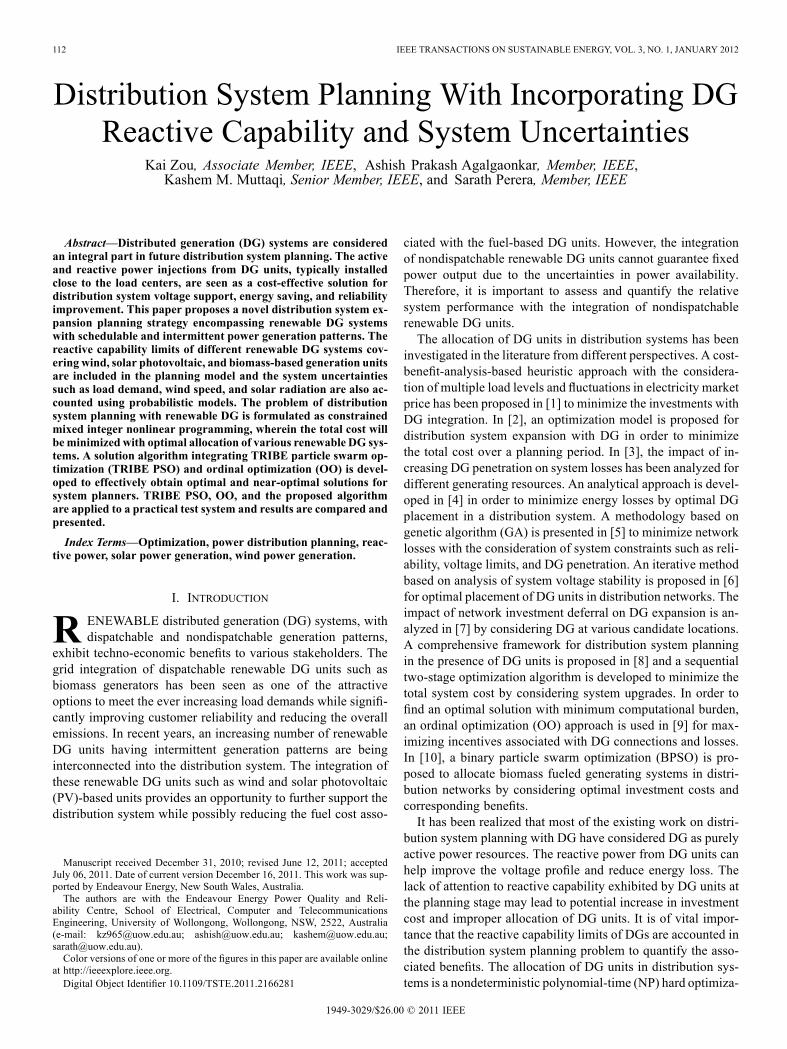
112 IEEE TRANSACTIONS ON SUSTAINABLE ENERGY, VOL. 3, NO. 1, JANUARY 2012
Distribution System Planning With Incorporating DGReactive Capability and System Uncertainties
Kai Zou, Associate Member, IEEE, Ashish Prakash Agalgaonkar, Member, IEEE,Kashem M. Muttaqi, Senior Member, IEEE, and Sarath Perera, Member, IEEE
Abstract—Distributed generation (DG) systems are consideredan integral part in future distribution system planning. The activeand reactive power injections from DG units, typically installedclose to the load centers, are seen as a cost-effective solution fordistribution system voltage support, energy saving, and reliabilityimprovement. This paper proposes a novel distribution system ex-pansion planning strategy encompassing renewable DG systemswith schedulable and intermittent power generation patterns. Thereactive capability limits of different renewable DG systems cov-ering wind, solar photovoltaic, and biomass-based generation unitsare included in the planning model and the system uncertaintiessuch as load demand, wind speed, and solar radiation are also ac-counted using probabilistic models. The problem of distributionsystem planning with renewable DG is formulated as constrainedmixed integer nonlinear programming, wherein the total cost willbeminimized with optimal allocation of various renewable DG sys-tems. A solution algorithm integrating TRIBE particle swarm op-timization (TRIBE PSO) and ordinal optimization (OO) is devel-oped to effectively obtain optimal and near-optimal solutions forsystem planners. TRIBE PSO, OO, and the proposed algorithmare applied to a practical test system and results are compared andpresented.
Index Terms—Optimization, power distribution planning, reac-tive power, solar power generation, wind power generation.
I. INTRODUCTION
R ENEWABLE distributed generation (DG) systems, withdispatchable and nondispatchable generation patterns,
exhibit techno-economic benefits to various stakeholders. Thegrid integration of dispatchable renewable DG units such asbiomass generators has been seen as one of the attractiveoptions to meet the ever increasing load demands while signifi-cantly improving customer reliability and reducing the overallemissions. In recent years, an increasing number of renewableDG units having intermittent generation patterns are beinginterconnected into the distribution system. The integration ofthese renewable DG units such as wind and solar photovoltaic(PV)-based units provides an opportunity to further support thedistribution system while possibly reducing the fuel cost asso-
Manuscript received December 31, 2010; revised June 12, 2011; acceptedJuly 06, 2011. Date of current version December 16, 2011. This work was sup-ported by Endeavour Energy, New South Wales, Australia.The authors are with the Endeavour Energy Power Quality and Reli-
ability Centre, School of Electrical, Computer and TelecommunicationsEngineering, University of Wollongong, Wollongong, NSW, 2522, Australia(e-mail: [email protected]; [email protected]; [email protected];[email protected]).Color versions of one or more of the figures in this paper are available online
at http://ieeexplore.ieee.org.Digital Object Identifier 10.1109/TSTE.2011.2166281
ciated with the fuel-based DG units. However, the integrationof nondispatchable renewable DG units cannot guarantee fixedpower output due to the uncertainties in power availability.Therefore, it is important to assess and quantify the relativesystem performance with the integration of nondispatchablerenewable DG units.The allocation of DG units in distribution systems has been
investigated in the literature from different perspectives. A cost-benefit-analysis-based heuristic approach with the considera-tion of multiple load levels and fluctuations in electricity marketprice has been proposed in [1] to minimize the investments withDG integration. In [2], an optimization model is proposed fordistribution system expansion with DG in order to minimizethe total cost over a planning period. In [3], the impact of in-creasing DG penetration on system losses has been analyzed fordifferent generating resources. An analytical approach is devel-oped in [4] in order to minimize energy losses by optimal DGplacement in a distribution system. A methodology based ongenetic algorithm (GA) is presented in [5] to minimize networklosses with the consideration of system constraints such as reli-ability, voltage limits, and DG penetration. An iterative methodbased on analysis of system voltage stability is proposed in [6]for optimal placement of DG units in distribution networks. Theimpact of network investment deferral on DG expansion is an-alyzed in [7] by considering DG at various candidate locations.A comprehensive framework for distribution system planningin the presence of DG units is proposed in [8] and a sequentialtwo-stage optimization algorithm is developed to minimize thetotal system cost by considering system upgrades. In order tofind an optimal solution with minimum computational burden,an ordinal optimization (OO) approach is used in [9] for max-imizing incentives associated with DG connections and losses.In [10], a binary particle swarm optimization (BPSO) is pro-posed to allocate biomass fueled generating systems in distri-bution networks by considering optimal investment costs andcorresponding benefits.It has been realized that most of the existing work on distri-
bution system planning with DG have considered DG as purelyactive power resources. The reactive power from DG units canhelp improve the voltage profile and reduce energy loss. Thelack of attention to reactive capability exhibited by DG units atthe planning stage may lead to potential increase in investmentcost and improper allocation of DG units. It is of vital impor-tance that the reactive capability limits of DGs are accounted inthe distribution system planning problem to quantify the asso-ciated benefits. The allocation of DG units in distribution sys-tems is a nondeterministic polynomial-time (NP) hard optimiza-
1949-3029/$26.00 © 2011 IEEE
ZOU et al.: DISTRIBUTION SYSTEM PLANNING WITH INCORPORATING DG REACTIVE CAPABILITY AND SYSTEM UNCERTAINTIES 113
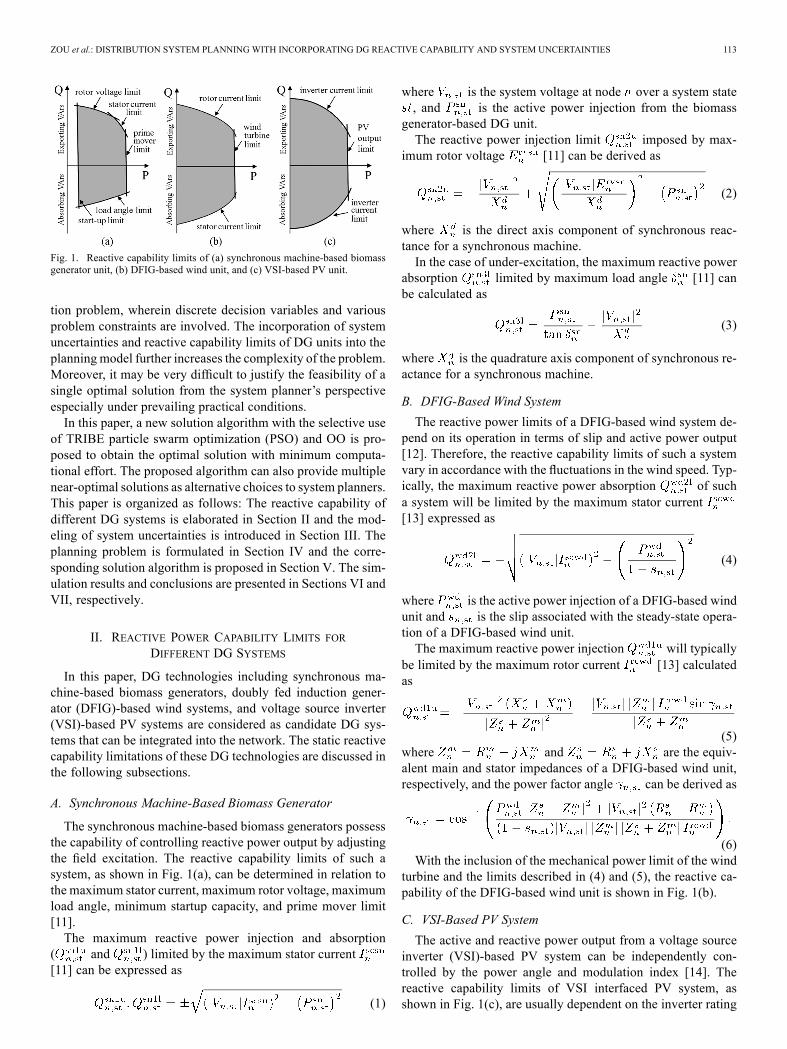
Fig. 1. Reactive capability limits of (a) synchronous machine-based biomassgenerator unit, (b) DFIG-based wind unit, and (c) VSI-based PV unit.
tion problem, wherein discrete decision variables and variousproblem constraints are involved. The incorporation of systemuncertainties and reactive capability limits of DG units into theplanning model further increases the complexity of the problem.Moreover, it may be very difficult to justify the feasibility of asingle optimal solution from the system planner’s perspectiveespecially under prevailing practical conditions.In this paper, a new solution algorithm with the selective use
of TRIBE particle swarm optimization (PSO) and OO is pro-posed to obtain the optimal solution with minimum computa-tional effort. The proposed algorithm can also provide multiplenear-optimal solutions as alternative choices to system planners.This paper is organized as follows: The reactive capability ofdifferent DG systems is elaborated in Section II and the mod-eling of system uncertainties is introduced in Section III. Theplanning problem is formulated in Section IV and the corre-sponding solution algorithm is proposed in Section V. The sim-ulation results and conclusions are presented in Sections VI andVII, respectively.
II. REACTIVE POWER CAPABILITY LIMITS FORDIFFERENT DG SYSTEMS
In this paper, DG technologies including synchronous ma-chine-based biomass generators, doubly fed induction gener-ator (DFIG)-based wind systems, and voltage source inverter(VSI)-based PV systems are considered as candidate DG sys-tems that can be integrated into the network. The static reactivecapability limitations of these DG technologies are discussed inthe following subsections.
A. Synchronous Machine-Based Biomass Generator
The synchronous machine-based biomass generators possessthe capability of controlling reactive power output by adjustingthe field excitation. The reactive capability limits of such asystem, as shown in Fig. 1(a), can be determined in relation tothe maximum stator current, maximum rotor voltage, maximumload angle, minimum startup capacity, and prime mover limit[11].The maximum reactive power injection and absorption
( and ) limited by the maximum stator current[11] can be expressed as
(1)
where is the system voltage at node over a system state, and is the active power injection from the biomass
generator-based DG unit.The reactive power injection limit imposed by max-
imum rotor voltage [11] can be derived as
(2)
where is the direct axis component of synchronous reac-tance for a synchronous machine.In the case of under-excitation, the maximum reactive power
absorption limited by maximum load angle [11] canbe calculated as
(3)
where is the quadrature axis component of synchronous re-actance for a synchronous machine.
B. DFIG-Based Wind System
The reactive power limits of a DFIG-based wind system de-pend on its operation in terms of slip and active power output[12]. Therefore, the reactive capability limits of such a systemvary in accordance with the fluctuations in the wind speed. Typ-ically, the maximum reactive power absorption of sucha system will be limited by the maximum stator current[13] expressed as
(4)
where is the active power injection of a DFIG-based windunit and is the slip associated with the steady-state opera-tion of a DFIG-based wind unit.The maximum reactive power injection will typically
be limited by the maximum rotor current [13] calculatedas
(5)where and are the equiv-alent main and stator impedances of a DFIG-based wind unit,respectively, and the power factor angle can be derived as
(6)With the inclusion of the mechanical power limit of the wind
turbine and the limits described in (4) and (5), the reactive ca-pability of the DFIG-based wind unit is shown in Fig. 1(b).
C. VSI-Based PV System
The active and reactive power output from a voltage sourceinverter (VSI)-based PV system can be independently con-trolled by the power angle and modulation index [14]. Thereactive capability limits of VSI interfaced PV system, asshown in Fig. 1(c), are usually dependent on the inverter rating
114 IEEE TRANSACTIONS ON SUSTAINABLE ENERGY, VOL. 3, NO. 1, JANUARY 2012
and the rated active power output of the PV cells [15]. Thelower and upper reactive capability limits imposed by theinverter current can be calculated as
(7)
where is the active power injection of a VSI-based solarPV unit.
III. MODELING OF INTERMITTENT RENEWABLE ENERGYGENERATION AND LOAD UNCERTAINTIES
In order to consider system uncertainties in terms of varyingwind speed, solar radiation, and load demand for planningstudies, the synthetic data generated based on the historicaldata can be used. In this paper, probabilistic models are usedto generate synthetic data and a clustering method is proposedto aggregate similar system states so as to reduce the computa-tional burden in the optimization process.
A. Probability Density Functions for Modeling Uncertainties
Probability density functions can be used to characterize thebehavior of time-varying variables (such as wind speed, solarradiation, and load demand) in a statistical manner. The prob-ability density function for each time-varying variable can beexpressed in a generalized form as [16]
(8)
where is a set ofstatistical parameters, is total number of terms in ,
is the weight in the th term satisfying, and is a sub-probability density function withstatistical mean and standard deviation in the th term of
.The general probability density function given in (8)
is a weighted sum of sub-probability distribution functions. Thetotal number and the type of each sub-probability distri-bution function may need to be guessed and pre-specified. The set of parameters in can be obtained by somewell-established approaches such as maximum-likelihood esti-mation (MLE), the method of least squares, and Bayesian sta-tistics [17]. Goodness-of-fit tests [18] should be carried out toidentify the most suitable number and type of sub-probabilitydistribution functions representing the statistical feature of thehistorical data.The most common practice for statistical modeling a time-
varying variable is to use a predefined type of single sub-dis-tribution function . Alternatively, a Gaussian mixturemodel with a prespecified number of Gaussian distribution func-tions can also be used if the single distribution function doesnot follow the statistical characteristic of a time-varying vari-able [19]. The statistics of time-varying wind speed, solar radi-ation, and load demand are commonly described by using prob-abilistic models based on the single sub-distribution function.
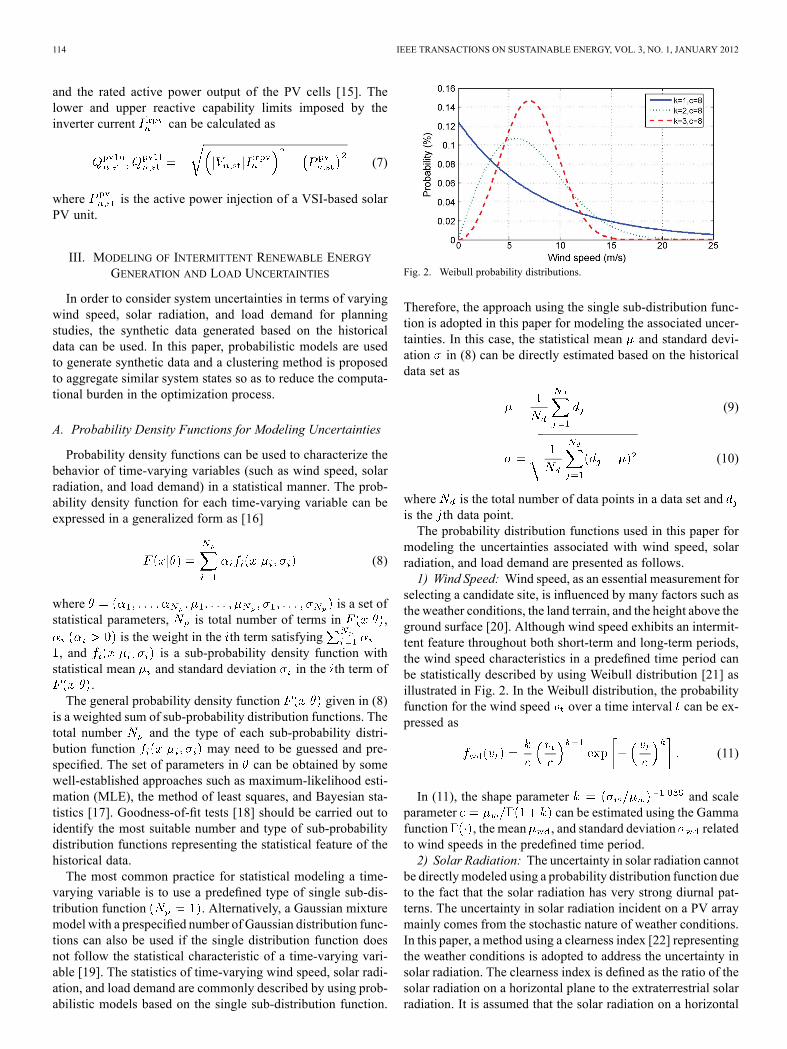
Fig. 2. Weibull probability distributions.
Therefore, the approach using the single sub-distribution func-tion is adopted in this paper for modeling the associated uncer-tainties. In this case, the statistical mean and standard devi-ation in (8) can be directly estimated based on the historicaldata set as
(9)
(10)
where is the total number of data points in a data set andis the th data point.The probability distribution functions used in this paper for
modeling the uncertainties associated with wind speed, solarradiation, and load demand are presented as follows.1) Wind Speed: Wind speed, as an essential measurement for
selecting a candidate site, is influenced by many factors such asthe weather conditions, the land terrain, and the height above theground surface [20]. Although wind speed exhibits an intermit-tent feature throughout both short-term and long-term periods,the wind speed characteristics in a predefined time period canbe statistically described by using Weibull distribution [21] asillustrated in Fig. 2. In the Weibull distribution, the probabilityfunction for the wind speed over a time interval can be ex-pressed as
(11)
In (11), the shape parameter and scaleparameter can be estimated using the Gammafunction , the mean , and standard deviation relatedto wind speeds in the predefined time period.2) Solar Radiation: The uncertainty in solar radiation cannot
be directly modeled using a probability distribution function dueto the fact that the solar radiation has very strong diurnal pat-terns. The uncertainty in solar radiation incident on a PV arraymainly comes from the stochastic nature of weather conditions.In this paper, a method using a clearness index [22] representingthe weather conditions is adopted to address the uncertainty insolar radiation. The clearness index is defined as the ratio of thesolar radiation on a horizontal plane to the extraterrestrial solarradiation. It is assumed that the solar radiation on a horizontal

ZOU et al.: DISTRIBUTION SYSTEM PLANNING WITH INCORPORATING DG REACTIVE CAPABILITY AND SYSTEM UNCERTAINTIES 115
Fig. 3. Beta probability distributions.
plane can be fully collected by the PV array, thus the solar radi-ation incident on the PV array can be evaluated as
(12)
where is the extraterrestrial solar radiation which can beaccurately calculated based on the site and the orbit of the earth,and is the clearness index.The random behavior of the clearness index can be statisti-
cally described by using the Beta distribution function [22], asshown in Fig. 3. In the Beta distribution, the probability functionfor the clearness index over a time interval can be expressedas
(13)
where the Beta parameters and can be obtained using themean and standard deviation of clearness index in a pre-defined time period
(14)
(15)
3) Load Demand: The Gaussian distribution uses as thelower limit and as the upper limit, which is not suitable forload representation. This is because load has specific minimumand maximum values. Therefore, a Gaussian distribution withspecified lower and upper limits [23] is used in this paper todescribe the variation of load demand over a period of time.Fig. 4 depicts a sample truncated Gaussian distribution. In thetruncated Gaussian distribution, the probability function for theloading level over a time interval can be expressed as
(16)where and are statistical mean and standard deviationof the load demand in a predefined period of time respectively,and and are minimum and maximum loading levels,respectively.
Fig. 4. Truncated Gaussian distribution.
B. Generation of Synthetic Data
The procedure to generate hourly average wind and solar PVgeneration levels, and loading levels over a planning period isas follows:Step 1) Divide the historical data into a specified number of
segments representing different probability distribu-tion patterns of time-varying variables such as windspeed, solar radiation, and load level. There will bemultiple data points for the same hour (consideringdata for every single day) over a month. The datapoints involved in each segment can be used to de-rive a probability distribution function for a partic-ular hour of a month. Accordingly, hourly measure-ment data for all the days over a year can be dividedinto 288 (which is 24 12) segments.
Step 2) Explore the most appropriate probability densityfunctions (pdfs) for fitting the statistical character-istics of historical data in each segment.
Step 3) Obtain the cumulative distribution functions (cdfs)and associated inverse cdfs based on the obtainedpdfs for each segment.
Step 4) Use the derived inverse cdfs to simulate hourly av-erage wind speed, solar radiation, and loading levelover a year.
Step 5) Multiply the hourly loading levels by a load growthfactor so as to consider the load growth in a year.
Step 6) Calculate the active power (in percentage of rated ca-pacity) generated by wind [24] and solar PV-basedunits [25] using the performance curves of theseunits.
Step 7) Combine the simulated hourly wind and solar PVgeneration levels, and average loading levels to formhourly system states (three dimensional data points)over the planning period.
C. Clustering of Similar System States
The evaluation of the fitness of a candidate planning optionassociated with all the system states over a specified planningperiod can pose heavy computational burden in the optimiza-tion process. The aggregation of similar system states by usingspecified number of representative states is one of the clusteringmethods that can be used to reduce the computational burden[26].
116 IEEE TRANSACTIONS ON SUSTAINABLE ENERGY, VOL. 3, NO. 1, JANUARY 2012
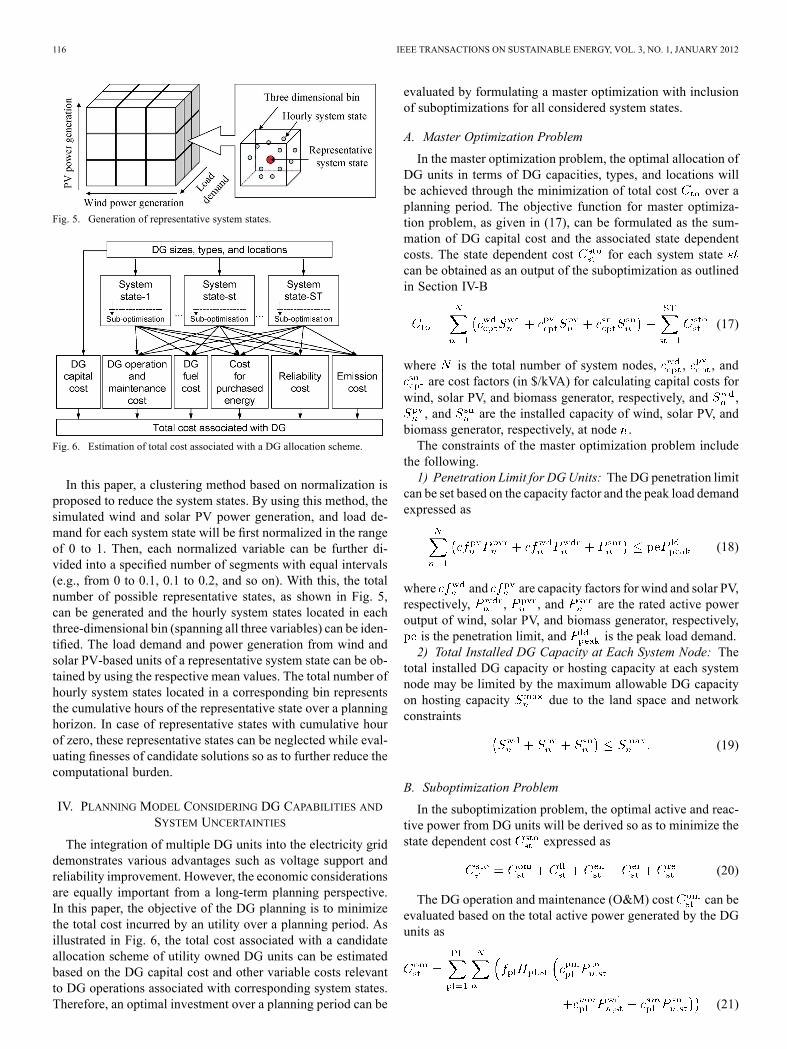
Fig. 5. Generation of representative system states.
Fig. 6. Estimation of total cost associated with a DG allocation scheme.
In this paper, a clustering method based on normalization isproposed to reduce the system states. By using this method, thesimulated wind and solar PV power generation, and load de-mand for each system state will be first normalized in the rangeof 0 to 1. Then, each normalized variable can be further di-vided into a specified number of segments with equal intervals(e.g., from 0 to 0.1, 0.1 to 0.2, and so on). With this, the totalnumber of possible representative states, as shown in Fig. 5,can be generated and the hourly system states located in eachthree-dimensional bin (spanning all three variables) can be iden-tified. The load demand and power generation from wind andsolar PV-based units of a representative system state can be ob-tained by using the respective mean values. The total number ofhourly system states located in a corresponding bin representsthe cumulative hours of the representative state over a planninghorizon. In case of representative states with cumulative hourof zero, these representative states can be neglected while eval-uating finesses of candidate solutions so as to further reduce thecomputational burden.
IV. PLANNING MODEL CONSIDERING DG CAPABILITIES ANDSYSTEM UNCERTAINTIES
The integration of multiple DG units into the electricity griddemonstrates various advantages such as voltage support andreliability improvement. However, the economic considerationsare equally important from a long-term planning perspective.In this paper, the objective of the DG planning is to minimizethe total cost incurred by an utility over a planning period. Asillustrated in Fig. 6, the total cost associated with a candidateallocation scheme of utility owned DG units can be estimatedbased on the DG capital cost and other variable costs relevantto DG operations associated with corresponding system states.Therefore, an optimal investment over a planning period can be
evaluated by formulating a master optimization with inclusionof suboptimizations for all considered system states.
A. Master Optimization Problem
In the master optimization problem, the optimal allocation ofDG units in terms of DG capacities, types, and locations willbe achieved through the minimization of total cost over aplanning period. The objective function for master optimiza-tion problem, as given in (17), can be formulated as the sum-mation of DG capital cost and the associated state dependentcosts. The state dependent cost for each system statecan be obtained as an output of the suboptimization as outlinedin Section IV-B
(17)
where is the total number of system nodes, , , andare cost factors (in $/kVA) for calculating capital costs for
wind, solar PV, and biomass generator, respectively, and ,, and are the installed capacity of wind, solar PV, and
biomass generator, respectively, at node .The constraints of the master optimization problem include
the following.1) Penetration Limit for DGUnits: The DG penetration limit
can be set based on the capacity factor and the peak load demandexpressed as
(18)
where and are capacity factors for wind and solar PV,respectively, , , and are the rated active poweroutput of wind, solar PV, and biomass generator, respectively,is the penetration limit, and is the peak load demand.2) Total Installed DG Capacity at Each System Node: The
total installed DG capacity or hosting capacity at each systemnode may be limited by the maximum allowable DG capacityon hosting capacity due to the land space and networkconstraints
(19)
B. Suboptimization Problem
In the suboptimization problem, the optimal active and reac-tive power from DG units will be derived so as to minimize thestate dependent cost expressed as
(20)
The DG operation and maintenance (O&M) cost can beevaluated based on the total active power generated by the DGunits as
(21)
ZOU et al.: DISTRIBUTION SYSTEM PLANNING WITH INCORPORATING DG REACTIVE CAPABILITY AND SYSTEM UNCERTAINTIES 117
where is the total number of planning years, is the presentworth factor of cost in a year , is total hours for a systemstate in a year , and , , and are cost factors(in $/kWh) for estimation of operation and maintenance (O&M)costs for wind, solar PV, and biomass generator, respectively.The total fuel cost of biomass generators can be estimated
based on their total energy generation in a planning horizon asformulated in
(22)
where is the cost factor (in $/kWh) for estimating fuel cost.The cost for purchased energy from grid can be assessed
in relation to the active power loss, the active power injectedby DG units, and the active power consumed by the loads asexpressed in
(23)
where is the cost factor (in $/kWh) for evaluating the costassociated with the purchased energy from grid, is a set offeeder sections, is the branch current, is the feederresistance, and is the load demand.The cost for emissions can be estimated associated with
the total energy imported from grid and the energy injected bybiomass-based generators as indicated in
(24)
where is the cost factor (in $/kg) for evaluating the cost as-sociated with emissions, and and are emission factors (inkg/kWh) of emissions associated with the actual energy con-sumption by the system and total energy supplied by biomassgenerators, respectively.The cost for system reliability is evaluated based on the
cost associated with energy not supplied (ENS) as calculated in
(25)
where is the cost factor (in $/kWh), derived from the prac-tical reliability studies conducted in Australia, for evaluating
the cost associated with system reliability, is the failurerate of a feeder section, is the probability of occurrenceof a system state, , , and are sets of systemnodes that can be restored after automatic switching, manualswitching, and repair, respectively, and , , and areautomated switching time, manual switching time, and repairtime, respectively.The constraints, to be accounted, in the suboptimization
problem include:1) System Voltage Limits: The nodal voltage magnitudes
should be within a specified bandwidth
(26)
where and are lower and upper voltage limits,respectively.2) Feeder Current Limit: The magnitudes of branch currentsshould be less than the overall current rating of the
corresponding branches
(27)
3) Power Factor Regulation for a DG Site: The operatingpower factor of a DG site may need to be regulated as per cor-responding standards
(28)
(29)
(30)
where is the specified lower limit of the operating powerfactor of a DG site, and are total active and reactivepower injections of a DG site respectively, , , and
are reactive power injections from wind, solar PV, andbiomass-based DG units, respectively.4) DG Reactive Capability Limits: The reactive power in-
jection and absorption of individual DG unit should be withinthe upper and lower limits associated with the steady-state DGoperation as discussed in Section II.
V. SOLUTION ALGORITHM
In this paper, a solution algorithm based on TRIBE PSO andOO is proposed in order to find an optimal solution for the for-mulated problem with high performance and accuracy. The pro-posed algorithm can also derive a set of near-optimal solutionsfor system planners to compare in case these solutions are prac-tically more feasible. In the proposed algorithm, TRIBE PSO isdedicated to exploring feasible candidate solutions through ap-proximate evaluation using a crude model to form a representa-tive set for OO. Subsequently, OO is used to allocate intensiveassessment using an accurate model for candidate solutions in-volved in a selected subset so as to find the optimal and near-op-timal solutions. In this paper, the crude and accurate models canbe built with the representative states determined based on thespecified number of segments for each normalized variable asdeveloped in Section III-C. The solution accuracy and computa-tional burden will be increased with the increase of the number
118 IEEE TRANSACTIONS ON SUSTAINABLE ENERGY, VOL. 3, NO. 1, JANUARY 2012
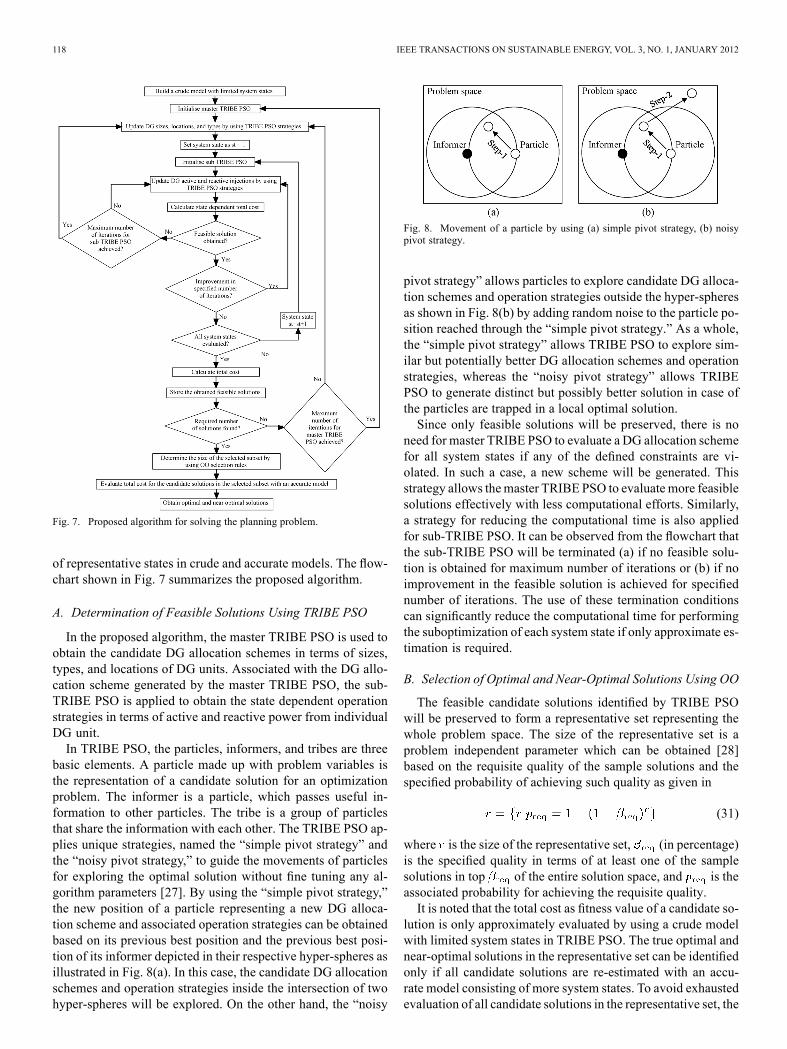
Fig. 7. Proposed algorithm for solving the planning problem.
of representative states in crude and accurate models. The flow-chart shown in Fig. 7 summarizes the proposed algorithm.
A. Determination of Feasible Solutions Using TRIBE PSO
In the proposed algorithm, the master TRIBE PSO is used toobtain the candidate DG allocation schemes in terms of sizes,types, and locations of DG units. Associated with the DG allo-cation scheme generated by the master TRIBE PSO, the sub-TRIBE PSO is applied to obtain the state dependent operationstrategies in terms of active and reactive power from individualDG unit.In TRIBE PSO, the particles, informers, and tribes are three
basic elements. A particle made up with problem variables isthe representation of a candidate solution for an optimizationproblem. The informer is a particle, which passes useful in-formation to other particles. The tribe is a group of particlesthat share the information with each other. The TRIBE PSO ap-plies unique strategies, named the “simple pivot strategy” andthe “noisy pivot strategy,” to guide the movements of particlesfor exploring the optimal solution without fine tuning any al-gorithm parameters [27]. By using the “simple pivot strategy,”the new position of a particle representing a new DG alloca-tion scheme and associated operation strategies can be obtainedbased on its previous best position and the previous best posi-tion of its informer depicted in their respective hyper-spheres asillustrated in Fig. 8(a). In this case, the candidate DG allocationschemes and operation strategies inside the intersection of twohyper-spheres will be explored. On the other hand, the “noisy
Fig. 8. Movement of a particle by using (a) simple pivot strategy, (b) noisypivot strategy.
pivot strategy” allows particles to explore candidate DG alloca-tion schemes and operation strategies outside the hyper-spheresas shown in Fig. 8(b) by adding random noise to the particle po-sition reached through the “simple pivot strategy.” As a whole,the “simple pivot strategy” allows TRIBE PSO to explore sim-ilar but potentially better DG allocation schemes and operationstrategies, whereas the “noisy pivot strategy” allows TRIBEPSO to generate distinct but possibly better solution in case ofthe particles are trapped in a local optimal solution.Since only feasible solutions will be preserved, there is no
need for master TRIBE PSO to evaluate a DG allocation schemefor all system states if any of the defined constraints are vi-olated. In such a case, a new scheme will be generated. Thisstrategy allows themaster TRIBE PSO to evaluate more feasiblesolutions effectively with less computational efforts. Similarly,a strategy for reducing the computational time is also appliedfor sub-TRIBE PSO. It can be observed from the flowchart thatthe sub-TRIBE PSO will be terminated (a) if no feasible solu-tion is obtained for maximum number of iterations or (b) if noimprovement in the feasible solution is achieved for specifiednumber of iterations. The use of these termination conditionscan significantly reduce the computational time for performingthe suboptimization of each system state if only approximate es-timation is required.
B. Selection of Optimal and Near-Optimal Solutions Using OO
The feasible candidate solutions identified by TRIBE PSOwill be preserved to form a representative set representing thewhole problem space. The size of the representative set is aproblem independent parameter which can be obtained [28]based on the requisite quality of the sample solutions and thespecified probability of achieving such quality as given in
(31)
where is the size of the representative set, (in percentage)is the specified quality in terms of at least one of the samplesolutions in top of the entire solution space, and is theassociated probability for achieving the requisite quality.It is noted that the total cost as fitness value of a candidate so-
lution is only approximately evaluated by using a crude modelwith limited system states in TRIBE PSO. The true optimal andnear-optimal solutions in the representative set can be identifiedonly if all candidate solutions are re-estimated with an accu-rate model consisting of more system states. To avoid exhaustedevaluation of all candidate solutions in the representative set, the

ZOU et al.: DISTRIBUTION SYSTEM PLANNING WITH INCORPORATING DG REACTIVE CAPABILITY AND SYSTEM UNCERTAINTIES 119
selection rules specified in OO can be applied to allocate inten-sive assessment for candidate solutions involved in a selectedsubset. The size of the selected subset can be determined [28]based on the size of the representative subset and the user-de-fined requirements in terms of the size of the “good enough”subset , the alignment level , and the alignment probability. The “good enough” subset is a set of top best solutions de-fined as satisfied solutions in the problem space. The alignmentlevel is the number of solutions involved in both selected subsetand the “good enough” subset. The alignment probability is theprobability that the specified alignment level is achieved. In thispaper, the size of the selected subset is estimated by using themethod based on the ordered performance curve (OPC), whichcan be obtained by sorting the solutions in the representative setaccording to their approximately evaluated fitness values. Theobtained OPC can be categorized into one of the five standardOPCs and the size of the selected subset can be accordingly de-termined [28] as
(32)
where , , , and are constants associated with the OPCshape, noise characteristics, and prespecified requirements.
VI. SIMULATION AND DISCUSSION
In this section, simulation studies are carried out in order to il-lustrate the proposed methodology for distribution system plan-ning with incorporating reactive capability of different DG sys-tems and system uncertainties.
A. Test System and Data
A rural 11-kV distribution system with a total length of 35 kmis derived from a practical distribution network in the Cattai re-gion of New South Wales, Australia. The diagrammatic repre-sentation of the test feeder is shown in Fig. 9. The average loaddemand of the test feeder is 590 kVA with an average powerfactor of 0.9 lagging. The substation voltage for the distribu-tion system is 10.7 kV set by the utility. The voltage limit isset to 5% of the nominal voltage in the simulation as one ofthe constraints. Moreover, it is also assumed that the feeder hasan annual load growth of 1% and the overall planning period is30 years. The corresponding data and DG parameters for costcalculations are given in the Appendix.In this paper, it is also assumed that the variation in load de-
mand at each load point has the same trend because of predom-inantly residential type. The daily average load demand, windspeed, and solar radiation for each month, derived based on his-torical data [29], [30], are shown in Fig. 10. These data sets areused as baseline data in the corresponding probabilistic modelsto generate synthetic data.
B. Parameters for the Proposed Solution Algorithm
The proposed method can be applied for determination ofboth single DG and multiple DG solutions. The number of DGunits has to be planned in advance at the planning stage. Fordemonstration of the capability of the proposed method, twonodes will be selected for installation of DG units. Three DG
Fig. 9. An 11-kV distribution system under study.
Fig. 10. Daily average load demand, wind speed, and solar radiation for 288time segments (24 hours 12 months).
types, including the synchronous machine-based biomass unit,the DFIG-based wind unit, and the VSI-based solar PV unit, areconsidered as candidate types for the planning. With the consid-eration of the land space limit, it is also assumed that single typeof DG unit can be installed at each node and the size of the DGunit at each node is within the limit between 100 and 1500 kVAwith discrete interval capacity of 100 kVA (15 discrete capacitylevels). Based on the combination theory, the total number ofplanning options can be calculated as
(33)
The exhaustive search for exact global minimum total costassociated with a DG allocation scheme in such large solutionspace is not practical due to immense computational burden.Instead, the exploration of a set of high quality solutions thatpotentially involve optimal and near-optimal solutions withhigh probability and reasonable computational time seems morepractical for system planners. For demonstration purposes, thespecified parameters used in proposed solution algorithm aregiven as follows:• A crude model is built with 125 representative states(5 segments for each normalized variable).
120 IEEE TRANSACTIONS ON SUSTAINABLE ENERGY, VOL. 3, NO. 1, JANUARY 2012
• An accurate model is built with 1000 representative states(10 segments for each normalized variable).
• A representative set is required that consists of top 1%solutions of the whole solution space withassociated probability of 99.99% .
• The “good enough” subset is defined as top 50 solutions ofthe representative set .
• The requisite alignment level is 3 .• The alignment probability is 95% .It is noted that the parameters are not limited to these values.
System planners can select more or less strict requirements asthey prefer.With the specified requirements, the size of the representa-
tive set can be obtained as per (31). Although the sizeof the representative set is very small as compared to the sizeof the whole solution space, it statistically guarantees proba-bility of 99.99% that at least one of the top 1% solutions willbe in the 917 sample solutions. These sample solutions will beobtained by TRIBE PSO with approximate evaluation of totalcosts associated with DG allocation schemes.Moreover, the sizeof the selected subset is obtained by (32) with a observedflat-shaped OPC and the predefined parameters. This means thatat least three solutions including one optimal and two near-op-timal solutions with the probability of 95% will be involved inthe “good enough” subset if only 88 candidate solutions are se-lected from the representative set for accurate evaluation.
C. Planning Options Obtained by the Proposed Algorithm
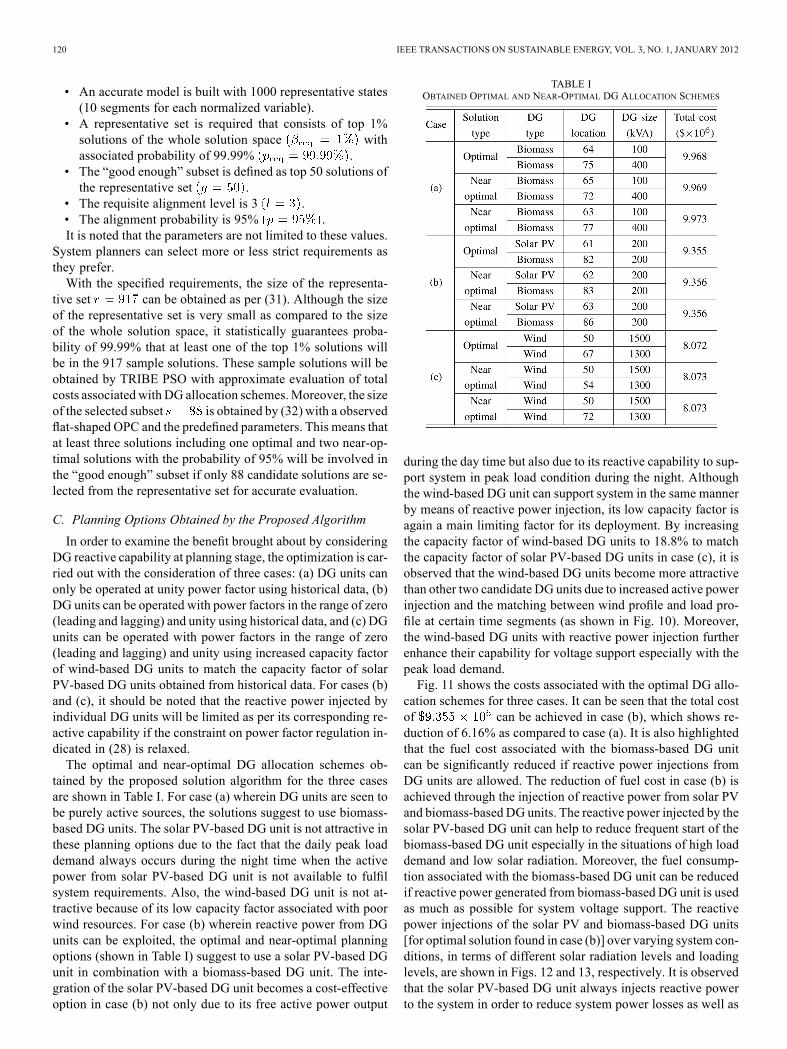
In order to examine the benefit brought about by consideringDG reactive capability at planning stage, the optimization is car-ried out with the consideration of three cases: (a) DG units canonly be operated at unity power factor using historical data, (b)DG units can be operated with power factors in the range of zero(leading and lagging) and unity using historical data, and (c) DGunits can be operated with power factors in the range of zero(leading and lagging) and unity using increased capacity factorof wind-based DG units to match the capacity factor of solarPV-based DG units obtained from historical data. For cases (b)and (c), it should be noted that the reactive power injected byindividual DG units will be limited as per its corresponding re-active capability if the constraint on power factor regulation in-dicated in (28) is relaxed.The optimal and near-optimal DG allocation schemes ob-
tained by the proposed solution algorithm for the three casesare shown in Table I. For case (a) wherein DG units are seen tobe purely active sources, the solutions suggest to use biomass-based DG units. The solar PV-based DG unit is not attractive inthese planning options due to the fact that the daily peak loaddemand always occurs during the night time when the activepower from solar PV-based DG unit is not available to fulfilsystem requirements. Also, the wind-based DG unit is not at-tractive because of its low capacity factor associated with poorwind resources. For case (b) wherein reactive power from DGunits can be exploited, the optimal and near-optimal planningoptions (shown in Table I) suggest to use a solar PV-based DGunit in combination with a biomass-based DG unit. The inte-gration of the solar PV-based DG unit becomes a cost-effectiveoption in case (b) not only due to its free active power output
TABLE IOBTAINED OPTIMAL AND NEAR-OPTIMAL DG ALLOCATION SCHEMES
during the day time but also due to its reactive capability to sup-port system in peak load condition during the night. Althoughthe wind-based DG unit can support system in the same mannerby means of reactive power injection, its low capacity factor isagain a main limiting factor for its deployment. By increasingthe capacity factor of wind-based DG units to 18.8% to matchthe capacity factor of solar PV-based DG units in case (c), it isobserved that the wind-based DG units become more attractivethan other two candidate DG units due to increased active powerinjection and the matching between wind profile and load pro-file at certain time segments (as shown in Fig. 10). Moreover,the wind-based DG units with reactive power injection furtherenhance their capability for voltage support especially with thepeak load demand.Fig. 11 shows the costs associated with the optimal DG allo-
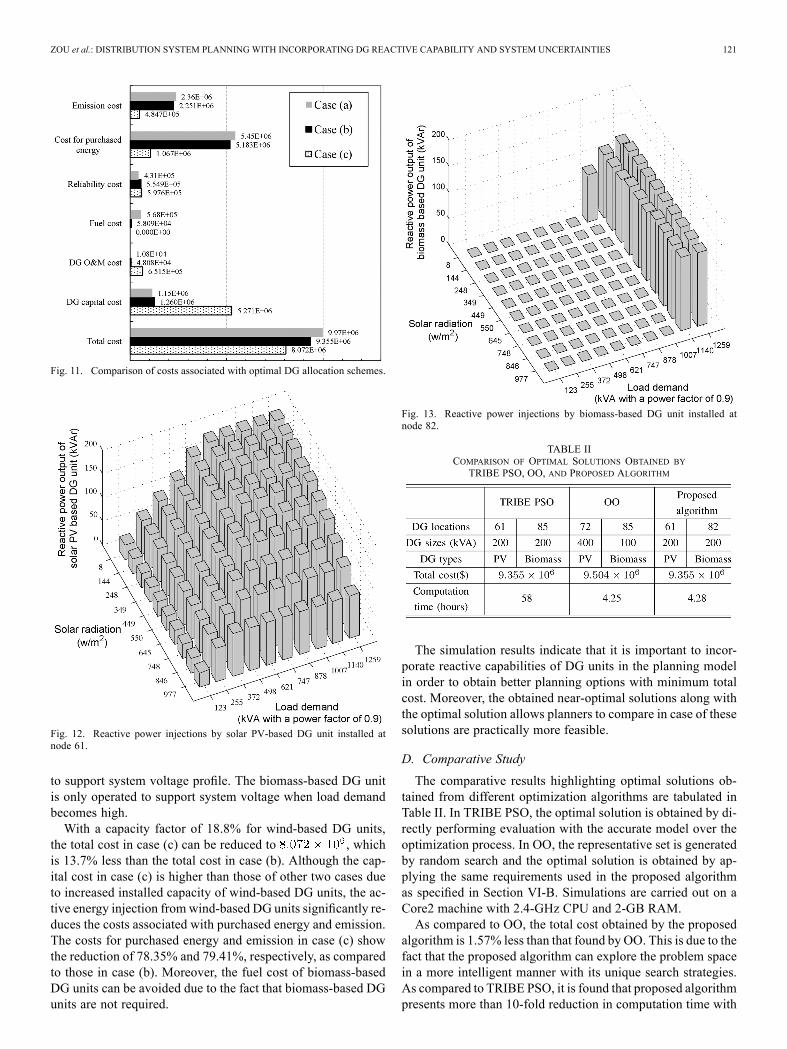
cation schemes for three cases. It can be seen that the total costof can be achieved in case (b), which shows re-duction of 6.16% as compared to case (a). It is also highlightedthat the fuel cost associated with the biomass-based DG unitcan be significantly reduced if reactive power injections fromDG units are allowed. The reduction of fuel cost in case (b) isachieved through the injection of reactive power from solar PVand biomass-based DG units. The reactive power injected by thesolar PV-based DG unit can help to reduce frequent start of thebiomass-based DG unit especially in the situations of high loaddemand and low solar radiation. Moreover, the fuel consump-tion associated with the biomass-based DG unit can be reducedif reactive power generated from biomass-based DG unit is usedas much as possible for system voltage support. The reactivepower injections of the solar PV and biomass-based DG units[for optimal solution found in case (b)] over varying system con-ditions, in terms of different solar radiation levels and loadinglevels, are shown in Figs. 12 and 13, respectively. It is observedthat the solar PV-based DG unit always injects reactive powerto the system in order to reduce system power losses as well as
ZOU et al.: DISTRIBUTION SYSTEM PLANNING WITH INCORPORATING DG REACTIVE CAPABILITY AND SYSTEM UNCERTAINTIES 121
Fig. 11. Comparison of costs associated with optimal DG allocation schemes.
Fig. 12. Reactive power injections by solar PV-based DG unit installed atnode 61.
to support system voltage profile. The biomass-based DG unitis only operated to support system voltage when load demandbecomes high.With a capacity factor of 18.8% for wind-based DG units,
the total cost in case (c) can be reduced to , whichis 13.7% less than the total cost in case (b). Although the cap-ital cost in case (c) is higher than those of other two cases dueto increased installed capacity of wind-based DG units, the ac-tive energy injection fromwind-based DG units significantly re-duces the costs associated with purchased energy and emission.The costs for purchased energy and emission in case (c) showthe reduction of 78.35% and 79.41%, respectively, as comparedto those in case (b). Moreover, the fuel cost of biomass-basedDG units can be avoided due to the fact that biomass-based DGunits are not required.
Fig. 13. Reactive power injections by biomass-based DG unit installed atnode 82.
TABLE IICOMPARISON OF OPTIMAL SOLUTIONS OBTAINED BY
TRIBE PSO, OO, AND PROPOSED ALGORITHM
The simulation results indicate that it is important to incor-porate reactive capabilities of DG units in the planning modelin order to obtain better planning options with minimum totalcost. Moreover, the obtained near-optimal solutions along withthe optimal solution allows planners to compare in case of thesesolutions are practically more feasible.
D. Comparative Study
The comparative results highlighting optimal solutions ob-tained from different optimization algorithms are tabulated inTable II. In TRIBE PSO, the optimal solution is obtained by di-rectly performing evaluation with the accurate model over theoptimization process. In OO, the representative set is generatedby random search and the optimal solution is obtained by ap-plying the same requirements used in the proposed algorithmas specified in Section VI-B. Simulations are carried out on aCore2 machine with 2.4-GHz CPU and 2-GB RAM.As compared to OO, the total cost obtained by the proposed
algorithm is 1.57% less than that found by OO. This is due to thefact that the proposed algorithm can explore the problem spacein a more intelligent manner with its unique search strategies.As compared to TRIBE PSO, it is found that proposed algorithmpresents more than 10-fold reduction in computation time with

122 IEEE TRANSACTIONS ON SUSTAINABLE ENERGY, VOL. 3, NO. 1, JANUARY 2012
negligible difference in total cost as compared to TRIBE PSO.As a whole, the proposed solution algorithm demonstrates itseffectiveness for finding the optimal or near-optimal solution bysuccessfully compromising the quality of the optimal solutionand the associated computation time.
VII. CONCLUSION
This paper has presented a new optimization framework fordistribution system planning with incorporating DG reactivecapability and system uncertainties. The reactive capabilitiesof renewable DG technologies including the synchronous ma-chine-based biomass generator, the DFIG-based wind unit, andthe VSI-based solar PV unit were considered in distributionsystem expansion planning. The system uncertainties associ-ated with the time-varying load demand and intermittent renew-able power generation in the planning framework have been ad-dressed and solutions using probabilistic models and clusteringtechnique have been developed. The integrated solution algo-rithm with TRIBE PSO and OO has been developed to deter-mine optimal and near-optimal solutions that provide the op-tions to the system operator to compare and decide for the bestfeasible solution for practical implementation. The total cost as-sociated with different DG systems, comprised of capital cost,operation and maintenance cost, reliability cost, cost of deferredenergy, and emission cost has beenminimized for evaluating op-timal allocation of DGs. The simulation results also highlightedthe reduction in total cost with the consideration of DG reactivecapabilities at the planning stage. It was also observed that thesolar PV and wind-based DG units can offset the biomass-basedgenerator with reactive capability considerations. The effective-ness of proposed solution algorithm in terms of computationaltime and accuracy has also been emphasized in this paper.
APPENDIX
A. Parameters for Cost Calculations
The parameters used for calculating various costs in thesimulation study are obtained based on the work of [31]–[34].The parameters as listed in Table III are assumed to be keptunchanged over the planning horizon. It is also assumed inthe planning horizon of 30 years that the annual average elec-tricity price will be linearly increased from $59/MW to$110/MW and the annual average carbon price will befrom $20/tonne to $67/tonne.
B. DG Parameters
It is assumed that the maximum active power output of a DGunit will be rated at 90% of the nominal DG capacity. The ma-chine parameters (on the generator kVA base) for different DGsystems are given below.1) Synchronous Machine-Based Biomass Generator: In this
paper, the synchronous machine-based biomass generator is ap-proximated as a cylindrical rotor machine [11]. The direct axisreactance of 1.54 pu is used. It is assumed that the maximumstator current is 1 pu and the maximum rotor voltageis 2.17 pu. The startup limit is assumed to be 30% of the nom-inal active real power output.
TABLE IIIPARAMETERS FOR CALCULATING CORRESPONDING COSTS
TABLE IVPARAMETERS FOR DFIG-BASED WIND UNITS
2) DFIG-Based Wind System: The parameters for modelingthe DFIG reactive capability curve is given in Table IV [13].It is assumed that the slip linearly changes from 0.25 to0.25 with the change of wind speed from the cut-in speed of
3.5 m/s to the rated speed of 12.5 m/s. For wind speed higherthan the rated speed of 12.5 m/s and less than the cutout speedof 25 m/s, the slip is assumed to be maintained at 0.25 throughpitch control.3) VSI-Based PV System: For VSI-based PV unit, it is as-
sumed that the rated inverter current is 1 pu.
ACKNOWLEDGMENT
The authors would like to thank Endeavour Energy personnelfor providing data and information related to the network.
REFERENCES[1] W. El-Khattam, K. Bhattacharya, Y. Hegazy, and M. M. A. Salama,
“Optimal investment planning for distributed generation in a compet-itive electricity market,” IEEE Trans. Power Del., vol. 19, no. 3, pp.1674–1684, Aug. 2004.
[2] W. El-Khattam, Y. G. Hegazy, and M. M. A. Salama, “An integrateddistributed generation optimization model for distribution system plan-ning,” IEEE Trans. Power Syst., vol. 20, no. 2, pp. 1158–1165, May2005.
[3] V. H.Mendez, J. R. Abbad, and T. G. S. Roman, “Assessment of energydistribution losses for increasing penetration of distributed generation,”IEEE Trans. Power Syst., vol. 21, no. 2, pp. 533–540, May 2006.
[4] T. Gozel and M. H. Hocaoglu, “An analytical method for the sizingand siting of distributed generators in radial systems,” Electric PowerSyst. Res., vol. 79, pp. 912–918, Jun. 2009.
[5] C. L. T. Borges and D. M. Falcao, “Optimal distributed generation al-location for reliability, losses, and voltage improvement,” Elect. PowerEnergy Syst., vol. 28, pp. 413–420, Jul. 2006.
[6] H. Hedayati, S. A. Nabaviniaki, and A. Akbarimajd, “A method forplacement of DG units in distribution networks,” IEEE Trans. PowerDel., vol. 23, no. 3, pp. 1620–1628, Jul. 2008.

ZOU et al.: DISTRIBUTION SYSTEM PLANNING WITH INCORPORATING DG REACTIVE CAPABILITY AND SYSTEM UNCERTAINTIES 123
[7] A. Piccolo and P. Siano, “Evaluating the impact of network invest-ment deferral on distributed generation expansion,” IEEETrans. PowerSyst., vol. 24, no. 3, pp. 1559–1567, Aug. 2009.
[8] A. Kumar and W. Gao, “Optimal distributed generation location usingmixed integer non-linear programming in hybrid electricity markets,”IET Gener. Trans. Distrib., vol. 4, pp. 281–298, Feb. 2010.
[9] R. A. Jabr and B. C. Pal, “Ordinal optimisation approach for locatingand sizing of distributed generation,” IET Gener. Trans. Distrib., vol.3, pp. 713–723, Aug. 2009.
[10] P. R. Lopez, M. G. Gonzalez, N. R. Reyes, and F. Jurado, “Optimiza-tion of biomass fuelled systems for distributed power generation usingparticle swarm optimization,” Elect. Power Syst. Res., vol. 78, pp.1448–1455, Aug. 2008.
[11] P. A. Lof, G. Andersson, and D. J. Hill, “Voltage dependent reactivepower limits for voltage stability studies,” IEEE Trans. Power Syst.,vol. 10, no. 1, pp. 220–228, Feb. 1995.
[12] R. J. Konopinski, P. Vijayan, and V. Ajjarapu, “Extended reactive ca-pability of DFIG wind parks for enhanced system performance,” IEEETrans. Power Syst., vol. 24, no. 3, pp. 1346–1355, Aug. 2009.
[13] T. Lund, P. Sorensen, and J. Eek, “Reactive power capability of a windturbine with doubly fed induction generator,”Wind Energy, vol. 10, pp.379–394, Apr. 2007.
[14] F. Delfino, G. B. Denegri, M. Invernizzi, R. Procopio, and G.Ronda, “A P-Q capability chart approach to characterize grid connectPV-units,” in Proc. CIGRE/IEEE PES Joint Symp., Calgary, Canada,Jul. 2009.
[15] L. J. Borle, M. S. Dymond, and C. V. Nayar, “Development and testingof a 20-kW grid interactive photovoltaic power conditioning system inWestern Australia,” IEEE Trans. Ind. Appl., vol. 33, no. 2, pp. 502–508,Mar. 1997.
[16] M. E. Tarter and M. D. Lock, Model-Free Curve Estimation. NewYork: Chapman & Hall, 1993.
[17] B. W. Silverman, Density Estimation for Statistics and Data Anal-ysis. London, U.K.: Chapman & Hall, 1986.
[18] R. D’Agostino and M. Stephens, Goodness-of-Fit Techniques. NewYork: Marcel Dekker, 1996.
[19] R. Singh, B. C. Pal, and R. A. Jabr, “Statistical representation of dis-tribution system loads using Gaussian mixture model,” IEEE Trans.Power Syst., vol. 25, no. 1, pp. 29–37, Feb. 2010.
[20] T. Burton, D. Sharpe, N. Jenkins, and E. Bossanyi, Wind Energy Hand-book. Hoboken, NJ: Wiley, 2001.
[21] S. H. Jangamshetti and V. G. Rau, “Optimum siting of wind turbinegenerators,” IEEE Trans. Energy Convers., vol. 16, no. 1, pp. 8–13,Mar. 2001.
[22] V. A. Graham and K. G. T. Hollands, “A method to generate synthetichourly solar radiation globally,” Solar Energy, vol. 44, pp. 333–341,1990.
[23] Y. V. Makarov, C. Loutan, M. Jian, and P. de Mello, “Operational im-pacts of wind generation on california power systems,” IEEE Trans.Power Syst., vol. 24, no. 2, pp. 1039–1050, May 2009.
[24] P. Giorsetto and K. F. Utsurogi, “Development of a new procedure forreliability modeling of wind turbine generators,” IEEE Trans. PowerAppl. Syst., vol. 102, no. 1, pp. 134–143, Jan. 1993.
[25] S. Conti and S. Raiti, “Probability load flow using monte carlo tech-niques for distribution networks with photovoltaic generators,” SolarEnergy, vol. 81, pp. 1473–1481, Dec. 2007.
[26] A. Pregelj, M. Begovic, and A. Rohatgi, “Quantitative techniques foranalysis of large data set in renewable distributed generation,” IEEETrans. Power Syst., vol. 19, no. 3, pp. 1277–1285, Aug. 2004.
[27] M. Clerc, “Tribes, a parameter free particle swarm optimizer,” in Proc.OEP’03, Paris, France, 2003.
[28] T. W. E. Lau and Y. C. Ho, “Universal alignment probabilities andsubset selection for ordinal optimization,” J. Optimization TheoryAppl., vol. 93, pp. 455–489, Jun. 1997.
[29] (2010) Bureau of Meteorology [Online]. Available: http://www.bom.gov.au/climate/how/contacts.shtml
[30] (2010) Surface Meteorology and Solar Energy [Online]. Available:http://eosweb.larc.nasa.gov/sse/
[31] Renewable Energy—A Contribution to Australia’s Environment andEconomic Sustainability McLennan Magasanik Associates Pty Ltd,Jun. 2006, Final Report to Renewable Energy Generators Australia.
[32] Benefit and Costs of the Expanded Renewable Energy TargetMcLennan Magasanik Associates Pty Ltd, Jan. 2009, Report toDepartment of Climate Change.
[33] Department of Climate Change and Energy Efficiency, National Green-house Accounts (NGA) Factors [Online]. Available: http://www.cli-matechange.gov.au/en/publications/greenhouse-acctg/national-green-house-factors.aspx
[34] R. N. Allan, R. Billinton, I. Sjarief, L. Goel, and K. S. So, “A reliabilitytest system for educational purpose—Basic distribution system dataand results,” IEEE Trans. Power Syst., vol. 6, no. 2, pp. 813–820, May1991.
Kai Zou (S’09–A’10) received the B.Eng. degree in electrical power engi-neering in 2005 from the Huazhong University of Science and Technology,China, and the M.Eng. degree in 2006 from the University of Wollongong,Australia. He is currently working toward the Ph.D. degree in the area of powerdistribution system planning and optimization with embedded generation atUniversity of Wollongong, Wollongong, Australia.
Ashish Prakash Agalgaonkar (M’09) received the Ph.D. degree from IndianInstitute of Technology-Bombay, Mumbai, India, in 2006.Currently, he is working as a Lecturer at the Endeavour Energy Power Quality
and Reliability Centre, School of Electrical, Computer, TelecommunicationsEngineering, University of Wollongong, Wollongong, Australia, where he alsoworked as a Postdoctoral Research Fellow from February 2008 to November2010. He was associated with the School of Engineering, University of Tas-mania, Australia, as a Postdoctoral Research Fellow from October 2007 to Jan-uary 2008. He also worked as a Scientist in the Energy Technology Centre,NTPC Limited, India, from 2005 to 2007. His research interests include loadmodeling, impact of distributed generation on distribution systems, micro-grids,and system stability.
Kashem M. Muttaqi (M’01–SM’05) received the Ph.D. degree from Multi-media University, Malaysia, in 2001.Currently, he is an Associate Professor at the School of Electrical, Com-
puter, and Telecommunications Engineering, University of Wollongong, Wol-longong, Australia. He was associated with the University of Tasmania, Aus-tralia as a Research Fellow/Lecturer/Senior Lecturer from 2002 to 2007, andwith the Queensland University of Technology, Australia as a Research Fellowfrom 2000 to 2002. Previously, he also worked for Multimedia University as aLecturer for three years. His special fields of interests include distributed gen-eration, renewable energy, distribution system automation, and power systemplanning.
Sarath Perera (M’95) received the B.Eng. degree in electrical power engi-neering from the University of Moratuwa, Sri Lanka, the M.Eng. degree fromthe University of New South Wales, Sydney, Australia, and the Ph.D. degreefrom the University of Wollongong, Wollongong, Australia.He was a Lecturer at the University ofMoratuwa. Currently he is an Associate
Professor with the University of Wollongong, where he is also the TechnicalDirector of the Endeavour Energy Power Quality and Reliability Centre.