Embed Size (px)
Citation preview

Distribution of the Number of Customers Served in an M/G/1 Retrial QueueAuthor(s): M. J. Lopez-HerreroSource: Journal of Applied Probability, Vol. 39, No. 2 (Jun., 2002), pp. 407-412Published by: Applied Probability TrustStable URL: http://www.jstor.org/stable/3216107 .
Accessed: 27/08/2013 13:11
Your use of the JSTOR archive indicates your acceptance of the Terms & Conditions of Use, available at .http://www.jstor.org/page/info/about/policies/terms.jsp
.JSTOR is a not-for-profit service that helps scholars, researchers, and students discover, use, and build upon a wide range ofcontent in a trusted digital archive. We use information technology and tools to increase productivity and facilitate new formsof scholarship. For more information about JSTOR, please contact [email protected].
.
Applied Probability Trust is collaborating with JSTOR to digitize, preserve and extend access to Journal ofApplied Probability.
http://www.jstor.org
This content downloaded from 131.211.208.19 on Tue, 27 Aug 2013 13:11:50 PMAll use subject to JSTOR Terms and Conditions

J. Appl. Prob. 39, 407-412 (2002) Printed in Israel
? Applied Probability Trust 2002
DISTRIBUTION OF THE NUMBER OF CUSTOMERS SERVED IN AN M/G/1 RETRIAL QUEUE
M. J. LOPEZ-HERRERO,* Universidad Complutense de Madrid
Abstract
We present a recursive method of computation for the probability that at most k customers were served during the busy period of an M/G/1 retrial queue.
Keywords: Retrial queue; busy period; number of customers served
AMS 2000 Subject Classification: Primary 60K25
1. Introduction
In retrial systems an arriving customer who finds the server busy is obliged to leave the service area and join a pool of unsatisfied customers called the 'orbit'. From the orbit, each customer reapplies for service after a random amount of time. Retrial queues have been used to model problems in telephone, computer and communication systems. A review of the main results and literature and a discussion of practical situations can be found in the monograph [9]. In addition, a complete bibliography is given in [1] and [2].
As occurs in classical models (see for instance [5], [7], [10], [11], and [13]), the system performance can be described in terms of its main characteristics, such us limit distribution, waiting time, busy period, number of customers served, etc. In this paper, an M/G/1 queue with exponential retrial times is considered. In particular, we focus on I, the number of customers served during the busy period, L; the system busy period is defined to be the period of time between an epoch when an arriving customer finds an empty system and the first departure epoch at which the system is empty again.
The analysis of I and L on retrial systems has been the subject of several papers. The joint Laplace transform was obtained by Falin in [8], the structure of the busy period was studied by Artalejo and Falin in [3], and in [4] Artalejo and Lopez-Herrero determined a closed expression for E[L2]. When exponential service times are considered, Choo and Conolly [6] developed a method for the calculation of the moments of L. Related to the number of customers served, the theoretical solution in terms of its Laplace transform presents important practical limitations. However, explicit formulae for the probabilities P{I = k} when k < 4, for E[12], and an estimation of maximum entropy for the distribution of I were obtained in [12].
This paper extends the previous work by reducing the distribution of I to the solution of a set of linear equations. Some numerical examples are also given.
2. Model description
We consider a single server queue to which customers arrive according to a Poisson process with rate X. Any arriving customer who finds the server busy joins the orbit. Each individual
Received 18 February 2002; revision received 17 April 2002. * Postal address: Escuela de Estadistica, Universidad Complutense de Madrid, 28040 Madrid, Spain. Email address: [email protected]
407
This content downloaded from 131.211.208.19 on Tue, 27 Aug 2013 13:11:50 PMAll use subject to JSTOR Terms and Conditions

408 M. J. LOPEZ-HERRERO
(0, j) O(1,j)
(0, j 01) (1,01)
(0, 1) . (1, 1)
FIGURE 1: State space and transitions.
customer in orbit generates a Poisson stream of rate A > 0 of repeated requests for service. The service times are independent with common probability distribution function B(x) (where B(0) = 0), Laplace-Stieltjes transform P(O), and mean l1. The flow of primary arrivals, the intervals between successive repeated attempts, and service times are assumed to be mutually independent.
At any arbitrary time t, the system is described in terms of the bidimensional process Y (t) = (C(t), N(t)), where C(t) is 0 or 1, according to whether the server is free or busy, and N(t) is the number of customers in orbit at time t. As is well known, the stability condition p = l01 guarantees that the limiting distribution of the process Y(t) exists and is positive. Figure 1 illustrates the transitions among the states in the process Y (t) for the pure Markovian case (that is, B(x) = 1 - exp{-vx}, v = 1/01).
3. Number of customers served: recurrent relation
In what follows, we assume that p < 1. We consider the Markov chain embedded at
departures epochs. Let us assume that at time t = 0 the system is empty, i.e. C (0) = N (0) = 0, and a single primary customer arrives at time t = 0. Then note that the busy period corresponds to the first return time of the state 0 in that chain.
Our main goal is to obtain a recursive scheme to compute the probability distribution of I. Firstly, we recall that the probability density {ck} of the number of arrivals during a service time is given by
ck = e-Xt dB(t), k > 0.
At any departure epoch we observe the number of customers in orbit and define x k),
1 < i < k, to be the conditional probability that, starting in the state i, the embedded chain reaches state 0 and the server gives service to at most k more customers. In other words, x (k) is the probability that, starting at a departure which leaves i customers behind, in the rest of the busy period up to k customers were served.
This content downloaded from 131.211.208.19 on Tue, 27 Aug 2013 13:11:50 PMAll use subject to JSTOR Terms and Conditions

The number of customers served in an M/G/1 retrial queue 409
The probability distribution of I has the following expression in terms of {x(k)}
P{I = 1} = co, (1) k-1
P{I< k} = co + cjxk-1),
k > 1. (2) j=1
The equation (1) is obtained by noting that no other customer arrives during the service time of the unique customer served. When k > 1, the event { I < k occurs when at least j < k - 1 customers arrive during the first service time and subsequently the system empties out by giving service to up to k - 1 more customers.
The probabilities {x(k)} are obtained from a recursive scheme which is derived as follows. For k = 1, the preceding departure left one customer in orbit. To serve at most one customer during the rest of the busy period it is necessary that the customer in orbit was the next entering service and, moreover, during that customer's service no other arrival occurs. Consequently, xI satisfies the equation
(1) x1
= co. (3)
For k > 2 a similar argument is used. We distinguish between the alternatives where the next customer served is a primary arrival or comes from the orbit. In either case, we partition the subsequent event on the number of arrivals that may occur during that service. The following linear equations are obtained in this way for the quantities {x(k)},
1 < i < k.
S+ -
cj-1 + c (k-1)for i = co + fori + 1, j=1
X (k) i (k-1) k-
cj-i + i cj-i+l (k-1) (4) I
cox•i-1 + x for 2 < i < k - 1,
j=i +
k ox(k-_l) for i = k. X + k -
For any fixed level k > 1, the equations (3) and (4) give a recursive scheme which can be written in matrix form as
xk Tk-1 k--
where xk is the vector with components {xk), 1 < i < k}, xk-1 represents the column vector (1, Xk-I)T and T is the k x k matrix
ai bil b12 ... bl,k-1 Sa2 b22 ... b2,k-1
T= 0 0 a3
with
i/Ic0 ai = for 1 < i < k,
bij = c i c for 1 < i < j < k- 1. X + i/I
This content downloaded from 131.211.208.19 on Tue, 27 Aug 2013 13:11:50 PMAll use subject to JSTOR Terms and Conditions
410 M. J. LOPEZ-HERRERO
In order to check the validity of the recursive scheme, we can observe that (1) and (2) when k < 4 lead, after some algebra, to the explicit expressions (3.1)-(3.4) in [12].
On the other hand, under high retrial intensity, the M/G/1 retrial queue approaches the classical M/G/1 queue (without retrials) operating under random order discipline [9]. Conse- quently, when A --+ o, the random variable I should have the same probabilistic behaviour as the number of customers served during the busy period of the classic M/G/1 queue. In this sense, numerical results in the next section show that (3) and (4) give probabilities which are asymptotically consistent with formula (5.157) in [11 ].
4. Numerical work
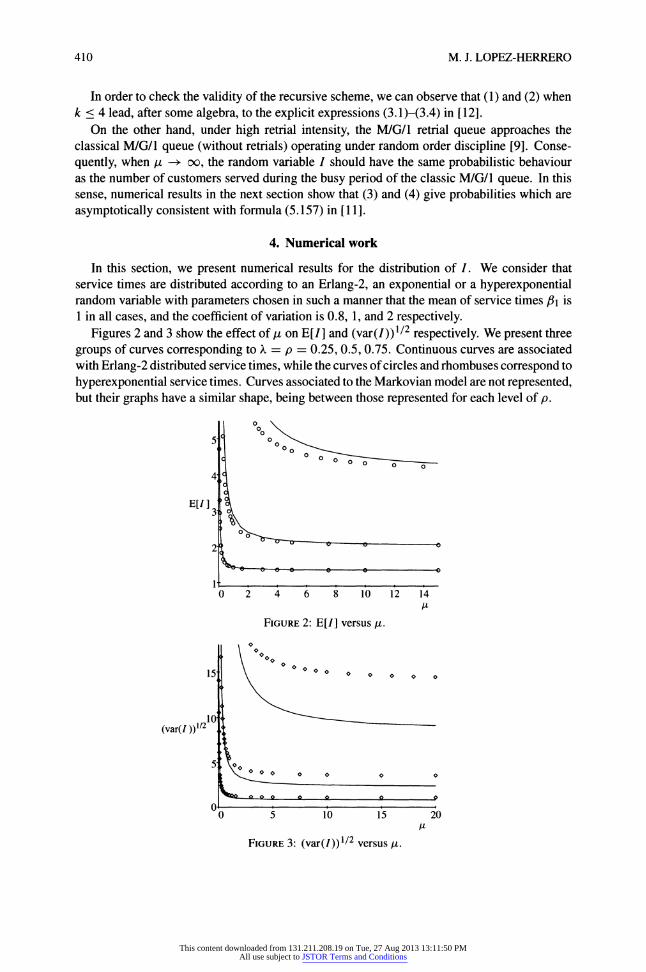
In this section, we present numerical results for the distribution of I. We consider that service times are distributed according to an Erlang-2, an exponential or a hyperexponential random variable with parameters chosen in such a manner that the mean of service times fl1 is 1 in all cases, and the coefficient of variation is 0.8, 1, and 2 respectively.
Figures 2 and 3 show the effect of A on E[I] and (var(I))1/2 respectively. We present three groups of curves corresponding to X = p = 0.25, 0.5, 0.75. Continuous curves are associated with Erlang-2 distributed service times, while the curves of circles and rhombuses correspond to hyperexponential service times. Curves associated to the Markovian model are not represented, but their graphs have a similar shape, being between those represented for each level of p.
0 00
4
E[I]3
2 o
S 0e , 00 , 1
0 2 4 6 8 10 12 14 It
FIGURE 2: E[I] versus tt.
15 o o o o o o
(var(Il))1/2
0 0 5 10 15 20
FIGURE 3: (var(I))1/2 versus tt.
This content downloaded from 131.211.208.19 on Tue, 27 Aug 2013 13:11:50 PMAll use subject to JSTOR Terms and Conditions

The number of customers served in an M/G/1 retrial queue 411
TABLE 1: Customers served distribution.
# 0.01 0.1 0.5 2 5 10 100
0.647249 0.647249 0.647249 0.647249 0.647249 0.647249 0.647249 I = 1 0.666666 0.666666 0.666666 0.666666 0.666666 0.666666 0.666666
0.727272 0.727272 0.727272 0.727272 0.727272 0.727272 0.727272
0.003136 0.026663 0.079990 0.127984 0.145436 0.152362 0.159184
I =2 0.002904 0.024691 0.074074 0.118518 0.134680 0.141093 0.147411 0.002514 0.021370 0.064112 0.102579 0.116567 0.122118 0.127586
0.002029 0.016986 0.049320 0.064377 0.068635 0.069964 0.071071 I = 3 0.001936 0.016199 0.043895 0.060283 0.063874 0.064929 0.065760
0.001821 0.014841 0.037796 0.048228 0.049327 0.049350 0.049139
0.001332 0.011847 0.031765 0.039568 0.039843 0.039598 0.039169 I = 4 0.001306 0.011505 0.030279 0.037199 0.037328 0.037063 0.036639
0.001331 0.010968 0.025583 0.028040 0.026850 0.026143 0.025338
0.000886 0.008835 0.023852 0.026838 0.025655 0.024926 0.024083 I = 5 0.000892 0.008682 0.022762 0.025321 0.024236 0.023589 0.022852
0.000982 0.008516 0.018824 0.018372 0.016849 0.016149 0.015428
0.000597 0.006927 0.018919 0.019299 0.017584 0.016737 0.015836 I = 6 0.000616 0.006862 0.018046 0.018281 0.016769 0.016037 0.015266
0.000730 0.006874 0.014622 0.013003 0.011590 0.011008 0.010440
0.000407 0.005640 0.015557 0.014421 0.012565 0.011738 0.010898
S=7 0.000430 0.005620 0.014823 0.013724 0.012107 0.011397 0.010681 0.000548 0.005722 0.011791 0.009708 0.008487 0.008018 0.007576
0.000281 0.004728 0.013120 0.011073 0.009251 0.008494 0.007751 I = 8 0.000304 0.004734 0.012485 0.010592 0.009011 0.008361 0.007722
0.000414 0.004881 0.009771 0.007535 0.006496 0.006116 0.005766
0.000196 0.004057 0.011270 0.008676 0.006965 0.006292 0.005651 I = 9 0.000216 0.004077 0.010711 0.008346 0.006862 0.006283 0.005732
0.000315 0.004248 0.008266 0.006020 0.005134 0.004821 0.004538
0.343882 0.267063 0.111954 0.040511 0.026812 0.022636 0.019105 I > 10 0.324724 0.250960 0.106255 0.041065 0.028462 0.024577 0.021262
0.264068 0.195303 0.081958 0.039238 0.031423 0.028999 0.026911
The behaviour of E[I] and (var(I))1/2 is similar, increasing with increasing traffic intensity and decreasing retrial rate. On the other hand, at any fixed A we observe that differences between the mean number of customers served and in the variability in both models are larger for high traffic intensities. Moreover, for values of L, not really small, we have that the mean number of customers served in the Erlangian model is bigger, and with less variability, than in the hyperexponential model; in addition, when A -+ oo, both E[I] and (var(I))1/2 are consistent with the characteristics of the corresponding standard model (without retrials).
Our numerical work also shows that the first and second order moments, E[I] and E[12], agree with the expressions (3.15) and (3.22) in [12].
The distribution of I is displayed on Table 1. For each A and each I, the three values given are, from top to bottom, the probabilities for the Erlangian, Markovian, and hyperexponential
This content downloaded from 131.211.208.19 on Tue, 27 Aug 2013 13:11:50 PMAll use subject to JSTOR Terms and Conditions

412 M. J. LOPEZ-HERRERO
models respectively. For this group of results the arrival rate was chosen so that the traffic intensity is p = 1 in all three models.
The behaviour of the probability distribution is essentially the same for these models. The most frequent number of customers served during the busy period is 1 and, according to (1), such a probability does not depend on the retrial rate. The high dispersion when A is small, indicated by Figure 3, is due to the smoothness of those distributions for I > 1. The initial idea of the decreasing behaviour of the probability that at least k, k > 1, customers were served in the busy period as a function of A can be visualized in Figures 2 and 3 and confirmed by the numerical results in Table 1.
Acknowledgement
This work was supported by the DGES through project 98-0837.
References
[1] ARTALEJO, J. R. (1999). Accessible bibliography on retrial queues. Math. Comput. Modelling 30, 1-6. [2] ARTALEJO, J. R. (1999). A classified bibliography of research on retrial queues: Progress in 1990-1999. Top 7,
187-211. [3] ARTALEJO, J. R. AND FALIN, G. I. (1996). On the orbit characteristics of the M/G/1 retrial queue. Naval Res.
Logistics 43, 1147-1161. [4] ARTALEJO, J. R. AND LOPEZ-HERRERO, M. J. (2000). On the busy period of the M/G/1 retrial queue. Naval Res.
Logistics 47, 115-127. [5] ARTALEJO, J. R. AND LOPEZ-HERRERO, M. J. (2001). Analysis of the busy period for the M/M/c queue: An
algorithmic approach. J. Appl. Prob. 38, 209-222. [6] CHOO, Q. H. AND CONOLLY, B. (1979). New results in the theory of repeated orders queueing systems. J. Appl.
Prob. 16, 631-640. [7] CONOLLY, B. AND CHAN, J. (1977). Generalised birth and queueing processes: Recent results. J. Appl. Prob. 9,
125-140. [8] FALIN, G. I. (1979). A single-line system with secondary orders. Eng. Cybern. 17, 76-83. [9] FALIN, G. I. AND TEMPLETON, J. G. C. (1997). Retrial Queues. Chapman and Hall, London.
[10] GHAHRAMANI, S. (1990). On remaining full busy periods of GI/G/c queues and their relation to stationary point processes. J. Appl. Prob. 27, 232-236.
[11] KLEINROCK, L. (1975). Queueing Systems, Vol. 1, Theory. John Wiley, New York. [12] LOPEZ-HERRERO, M. J. (2002). On the number of customers served in the M/G/1 retrial queue: First moments
and maximum entropy approach. Comput. Operat. Res. 29, 1739-1757. [13] NATVIG, B. (1975) On the waiting-time and busy period distributions for a general birth-and-death queueing
model. J. Appl. Prob. 12, 524-532.
This content downloaded from 131.211.208.19 on Tue, 27 Aug 2013 13:11:50 PMAll use subject to JSTOR Terms and Conditions


![A discrete-time Geo X G/1 retrial queue with control of admissionatarazanas.sci.uma.es/docs/tesisuma/16611299.pdf · 2007. 3. 28. · A discrete-time Geo[X]/G/1 retrial queue with](https://img.dokumen.tips/doc/110x75/60df6567779a33310f61416d/a-discrete-time-geo-x-g1-retrial-queue-with-control-of-2007-3-28-a-discrete-time.jpg)


![Vol. 4, Issue 4, April 2015 An M[X]/G/1 Retrial G-Queue ...€¦ · modelling neural networks. Wu and Lian (2013) analysed an M/G/1 retrial G queue with priority resume, Bernoulli](https://img.dokumen.tips/doc/110x75/5f51019c358979212476b395/vol-4-issue-4-april-2015-an-mxg1-retrial-g-queue-modelling-neural-networks.jpg)

![Tao Jiang , Baogui Xin , Baoxian Chang and Liwei Liu · Tao Jiang 1,*, Baogui Xin , Baoxian Chang2 and Liwei Liu3 Abstract. ... Liu et al. [20] studied an M/G/1 retrial G-queue with](https://img.dokumen.tips/doc/110x75/5ed38f653c5d095ede602177/tao-jiang-baogui-xin-baoxian-chang-and-liwei-liu-tao-jiang-1-baogui-xin-.jpg)
![Exploring mutexes, the Oracle RRDBMS retrial …Exploring mutexes, the Oracle RRDBMS retrial spinlocks (MEDIAS2012) 3 Fig. 2. Oracle mutex workflow. Oracle Wait Interface (OWI) [18]](https://img.dokumen.tips/doc/110x75/5e320b8bf5ef523f33254367/exploring-mutexes-the-oracle-rrdbms-retrial-exploring-mutexes-the-oracle-rrdbms.jpg)


![Vol. 4, Issue 4, April 2015 An M[X]/G/1 Retrial G …...modelling neural networks. Wu and Lian (2013) analysed an M/G/1 retrial G queue with priority resume, Bernoulli vacation and](https://img.dokumen.tips/doc/110x75/5fde13bbc61ed2381970cc55/vol-4-issue-4-april-2015-an-mxg1-retrial-g-modelling-neural-networks.jpg)


![An M/G/1 retrial G-queue with preemptive resume and ... · Jeyakumar[21]analyzedabulkqueuewithmultiplevacations,setuptimeswithN-policyandclosedowntimes. Inmostofthequeueingliterature,theserverisassumedtobealwaysavailable](https://img.dokumen.tips/doc/110x75/5ad8b2c47f8b9af9068dd98c/an-mg1-retrial-g-queue-with-preemptive-resume-and-21analyzedabulkqueuewithmultiplevacationssetuptimeswithn-policyandclosedowntimes.jpg)