Embed Size (px)
Citation preview
Zurich Open Repository andArchiveUniversity of ZurichMain LibraryStrickhofstrasse 39CH-8057 Zurichwww.zora.uzh.ch
Year: 2010
Computed tomography, cross sectional anatomy and measurements in thehead of normal goats
Makara, Mariano Andrés
Abstract: In der vorliegenden Studie wurden die Köpfe von 30 klinisch gesunden Saanenziegen mit einemKörpergewicht von 50 bis 80 kg mit der Mehrschicht- Computertomographie untersucht. Es wurdenQuerschnittbilder vor und nach der intravenösen Gabe von Kontrastmittel angefertigt. Anschließendwurden 13 Tiere euthanasiert und tiefgefroren, um 10 mm dicke anatomische Querschnitte der Köpfeherzustellen. Die korrespondierenden CT-Bilder und anatomischen Schnitte wurden verglichen und dieanatomischen Strukturen beschriftet. Die Ausdehnung der Sinus und ihrer Öffnungen wurden bestimmt.Die Dichte und Größe der Hypophyse sowie das Verhältnis Hypophysengröße/Hirnfläche wurde gemessen.Bei 2 Ziegen wurde auch eine dynamische CT-Kontrastuntersuchung der Hypophyse durchgeführt. Diemeisten Strukturen, die auf den anatomischen Schnitten gesehen wurden, wurden auch auf den CT-Bildern identifiziert. Der vorliegende Bildatlas und die Messungen können als Grundlage dienen, umErkrankungen im Kopfbereich der Ziege zu diagnostizieren. The present study was performed to providea detailed anatomic description and computed tomographic (CT) measurements of the structures ofthe head in 30 clinically normal Saanen goats weighing 50 to 80 kg. Pre- and post-contrast transverseimages of the head were obtained with a 40-slice CT scanner. Subsequently, 13 animals were euthanizedand frozen. The heads were then sliced into 10 mm transverse sections of which the caudal aspect wasphotographed. Corresponding CT and anatomic images were compared and labeled. The extensions ofthe frontal, maxillary, lacrimal and palatine sinuses and the width and location of the openings of themaxillary sinuses and the frontal sinuses were described. The pituitary density and dimensions, pituitaryheight/brain area ratio as well as the sum of the areas of the lateral ventricles/brain area ratio weremeasured. In two goats, dynamic CT of the hypophysis was performed. Most features of the head thatwere identified on anatomic sections could be identified on the corresponding CT scans. In conclusion,the CT images and measurements obtained in this study can be used as a reference for the evaluation ofthe head in goats with diseases in this region.
Other titles: Computertomographie, Querschnittanatomie und Messungen am Kopf bei normalen Ziegen
Posted at the Zurich Open Repository and Archive, University of ZurichZORA URL: https://doi.org/10.5167/uzh-41421DissertationPublished Version
Originally published at:Makara, Mariano Andrés. Computed tomography, cross sectional anatomy and measurements in thehead of normal goats. 2010, University of Zurich, Vetsuisse Faculty.
Departement für Nutztiere
der Vetsuisse-Fakultät Universität Zürich
Direktor: Prof. Dr. Dr. h. c. U. Braun
Abteilung für Bildgebende Diagnostik
der Vetsuisse-Fakultät Universität Zürich
Leitung: Prof. Dr. P. Kircher
_________________________________________________________________
Arbeit unter Leitung von Frau PD Dr. S. Ohlerth, Bildgebende Diagnostik
und Prof. Dr. Dr. h.c. U. Braun
Computed tomography, cross sectional anatomy and measurements
in the head of normal goats
Inaugural-Dissertation
zur Erlangung der Doktorwürde
der Vetsuisse-Fakultät Universität Zürich
vorgelegt von
Mariano Andrés Makara
Tierarzt
aus Buenos Aires, Argentinien
genehmigt auf Antrag von
Prof. Dr. Dr. h. c. U. Braun, Referent
Prof. Dr. H. Augsburger, Korreferent
Zürich 2010
Departement für Nutztiere
der Vetsuisse-Fakultät Universität Zürich
Direktor: Prof. Dr. Dr. h. c. U. Braun
2
Table of contents Page
Summary 3
Introduction 4
Materials and Methods 6
Results 9
Discussion 12
References 16
Figures 21
Acknowledgements 44
Curriculum vitae 45
3
Summary
The present study was performed to provide a detailed anatomic description and
computed tomographic (CT) measurements of the structures of the head in 30 clinically
normal Saanen goats weighing 50 to 80 kg. Pre- and post-contrast transverse images of the
head were obtained with a 40-slice CT scanner. Subsequently, 13 animals were euthanized
and frozen. The heads were then sliced into 10 mm transverse sections of which the caudal
aspect was photographed. Corresponding CT and anatomic images were compared and
labeled. The extensions of the frontal, maxillary, lacrimal and palatine sinuses and the width
and location of the openings of the maxillary sinuses and the frontal sinuses were described.
The pituitary density and dimensions, pituitary height/brain area ratio as well as the sum of
the areas of the lateral ventricles/brain area ratio were measured. In two goats, dynamic CT of
the hypophysis was performed. Most features of the head that were identified on anatomic
sections could be identified on the corresponding CT scans. In conclusion, the CT images and
measurements obtained in this study can be used as a reference for the evaluation of the head
in goats with diseases in this region.
4
Introduction
Goats are gaining acceptance as a model for biomedical research, for surgical training and for
teaching. They are used in medical, orthopedic, chemotherapeutic, and physiologic research
(Baisden et al., 1999; Fulton KL, 1994; Leung et al., 2001; Liu et al., 2008; ten Hallers et al.,
2007; ten Hallers et al., 2004). Additionally, the Saanen goat represents a popular dairy breed
in Switzerland and is commonly presented in the hospital population. The role of goats has
significantly changed in our society during the last years being increasingly considered
companion animals.
Computed tomography (CT) is a reliable, noninvasive technique for the evaluation of lesions
in the head region (Allen et al., 1987; Barrington, 1996; Bergman et al., 2000; Ducote et al.,
1999; Fike et al., 1981; Fike, 1986; Frazho et al., 2008; Gerros et al., 1998; Gonzalo-Orden et
al., 1999; Nykamp et al., 2001; Plummer S, 1992; Smallwood et al., 2002; Tidwell A, 1994;
Tietje et al., 1996; Vink-Nooteboom et al., 1998; Wolf M, 1995; Woods P, 1993). During
recent years, the technique has become available to veterinarians and some private veterinary
practices. In the veterinary literature, a number of publications describe the normal CT
anatomy of the head of horses (Morrow et al., 2000; Smallwood et al., 2002), dogs and cats.
The CT anatomy of the canine brain (De Rycke et al., 2005), pituitary gland (van der Vlugt-
Meijer et al., 2004; Van der Vlugt-Meijer et al., 2007), nasal cavity and paranasal sinuses (De
Rycke et al., 2003), middle and inner ear (Russo et al., 2002) and temporomandibular joint
(Schwarz et al., 2002) has been published. The anatomy of the feline nasal cavity and
paranasal sinuses (Losonsky, 1997), nasolacrimal drainage system (Noller et al., 2006) and
pituitary gland (Tyson et al., 2005) has also been reported by means of CT. A detailed
description of the communications of the normal equine nasal and paranasal cavities(Probst et
al., 2005) as well as CT measurements of the normal equine pituitary gland (McKlveen et al.,
2003) are available. Several pathologic conditions of the brain, ear, nasal and oral cavities,
paranasal sinuses and temporomandibular joint have been investigated and diagnosed by
5
means of CT in goats, horses, dogs, cats and sheep (Allen et al., 1987; Bergman et al., 2000;
Ducote et al., 1999; Fike et al., 1981; Fike, 1986; Frazho et al., 2008; Gerros et al., 1998;
Gonzalo-Orden et al., 1999; Marshall et al., 1995; Nykamp et al., 2001; Plummer S, 1992;
Tidwell A, 1994; Tietje et al., 1996; Vink-Nooteboom et al., 1998; Wolf M, 1995; Woods P,
1993). With regard to the caprine head, CT has proven to be useful in the diagnosis of
paranasal sinusitis (Barrington, 1996), primary brain neoplasia (Marshall et al., 1995) and a
cerebral abscess (Gerros et al., 1998). To accurately interpret CT scans, a thorough knowledge
of the anatomic features of clinically normal animals is a prerequisite. So far, there are no
reports in the literature about the normal CT anatomy of the head of goats.
Therefore, the purpose of this study was to provide a detailed anatomic description of the
structures of the head in clinically normal goats by means of CT for use by radiologists,
clinicians, researchers and veterinary students.
6
Materials and methods
For the present study, 30 dairy goats of the Saanen breed were included. Mean age of
the goats was 4.3 years (SD, 1.2 years). Mean body weight was 62.3 kg (SD, 7.9 kg). All
goats underwent a clinical examination, complete blood analysis, urinalysis, rumen fluid
analysis and parasitological fecal examination. None of the animals had a history of
neurological, upper airway or upper gastrointestinal tract disorders. Serological testing for
caprine arthritis and encephalitis had to be negative in all animals. The study was approved by
the Animal Ethics Council of the Canton of Zurich.
Each goat was anesthetized and positioned in sternal recumbency. Transverse
contiguous slices were obtained from the head. Technical settings were 120 KV, 350 mA, 1 s
tube rotation, and slice collimation of 0.6 cm. The CT study was performed with a multi-row
unit (Somatom Sensation Open, Siemens AG Medical Solutions, Switzerland). The data was
reconstructed to image series with 0.75 mm slice thickness using a medium-frequency image
reconstruction algorithm (soft tissue) and a high-frequency image reconstruction algorithm
(bone). Using the same settings, a post-contrast examination was performed in 11 animals.
The scan was started 120 seconds after injection of an ionic iodinated contrast medium at a
dosage of 700mg/kg using an automatic injector at a rate of 4ml/s into the jugular vein. For
the brain and skull, a soft tissue window (window width, 150 Hounsfield units; window level,
50 Hounsfield units) and a bone window (window width, 1500 Hounsfield units; window
level, 300 Hounsfield units) were used. For the nasal cavity, the bone window was applied.
For the pituitary gland, a different soft tissue window was used according to the literature
(window width, 250 Hounsfield units; window level, 80 Hounsfield units) (Auriemma,
Voorhout et al. 2007). Thirteen goats were euthanized immediately after the CT examination
and subsequently transferred into a freezer for at least 3 days. The rest of the animals were
slaughtered and no anatomical or pathological information was obtained. A band saw was
used to slice the frozen heads into contiguous 10 mm transverse (10 goats), and sagittal (3
7
goat) sections. Each anatomic frozen slice was cleaned with water, and the caudal aspect
photographed with a digital camera. For each photograph, a corresponding CT image was
selected. Matched pairs of images of the head were obtained at 16 transverse and 1 mid-
sagittal levels. The anatomic structures, identified on the photographs by use of anatomic
reference texts, were subsequently located on the corresponding CT images (with and without
contrast material).
On the transverse CT images, the extension of the frontal, maxillary, lacrimal and
palatine sinuses was evaluated. The premolars and molars were used as landmarks to estimate
the rostral and caudal extensions of the palatine sinus and caudal extension of the lacrimal
sinus. The infraorbital foramen was used as the landmark to estimate the rostral extension of
the maxillary sinus. The rostral contour of the orbit and the supraorbital foramen were used as
landmarks to define the rostral and caudal extensions of the frontal sinus respectively. The
width and location of the openings of the maxillary and frontal sinuses into the medial nasal
meatus relative to the premolars and molars were evaluated.
The maximum height, width and length of the pituitary gland were measured in the
post-contrast series from transverse and sagittal images. Three-dimensional volume
measurements were obtained by hand tracing the outlines of the pituitary gland in sequential
transverse images and by use of the workstation’s software (OsiriX Open Source™ Version
3.2.1, OsiriX Foundation, Switzerland) for volume determination. On the same image where
the pituitary height was measured, the brain area and the areas of the right and left lateral
ventricle were obtained by hand tracing the outlines of the brain and the lateral ventricles. The
computer automatically calculated the area. Then, the pituitary height/brain area ratio and the
sum of the areas of the lateral ventricles/brain area ratio were calculated. To evaluate the pre-
and post-contrast density of the pituitary gland, a round ROI was displayed on the gland
including as much gland tissue as possible without including surrounding structures.
8
In two goats a dynamic CT of the hypophysis was performed. A series of 10 dynamic
helical scans was performed at the level of the pituitary gland from rostral to caudal; the first
scan was obtained with the onset of the contrast medium injection. The interscan interval was
10 seconds. Density measurements (HU) and time-attenuation curves of the maxillary artery,
rete mirabile, the rostrodorsal and the dorsocaudal aspect of the pituitary gland were acquired.
The height and width of the pituitary gland were also measured from the anatomical
specimen using the slice containing the largest cross section of the pituitary gland. The rest of
the animals were slaughtered and no anatomical or pathological information was obtained.
Agreement between the anatomical and CT measurements of the pituitary gland was
analyzed with the Bland and Altman plot method (MedCalc Software, Version 11.2.1.0,
Belgium).
9
Results
All the anatomical specimens and the CT examinations were reviewed but only
selected images are presented. Sixteen transverse CT planes of the head were obtained and
matched with their corresponding anatomic sections (Figures 1-16). Of the sagittal sections,
only the midsagittal plane is presented (Figure 17). In general, structures identified on the
anatomic sections were also identified on the corresponding CT images without and with
contrast material.
On evaluation of the post-contrast images, the salivary glands, lymph nodes, blood
vessels and intracranial structures such as the hypophysis and the falx cerebri were much
more distinct compared to the pre-contrast CT images. For example, although the pituitary
fossa was easily identified in the pre-contrast study, the contours of the pituitary gland could
hardly be depicted due to the minimal difference in density between the gland and the
surrounding cavernous sinus (Figure 11). On the post-contrast images, the pituitary gland was
identified in all animals due to a different degree of enhancement of the hypophysis compared
to the surrounding cavernous sinus.
The extension of the sinuses was bilaterally symmetrical, therefore only one
measurement of the rostral extension and one measurement of caudal extension of each sinus
are provided. The palatine sinus extended 0.5 cm rostral to the maxillary second premolar
(P2) in 4 animals, to the level of P2 in 18 animals, to a level between P2 and third premolar
(P3) in 6 animals and to the level of P3 in 2 animals (Figure 18). The palatine sinus extended
caudally to the level of the third maxillary molar (M3) in 24 animals and to the level of a line
between second maxillary premolar (M2) and M3 in 6 animals (Figure 18). The lacrimal sinus
extended to the level of M3 in 13 animals, 0.5 cm caudally to M3 in 6 animals, 1 cm caudally
to M3 in 8 animals, 1.5 cm caudally to M3 in 2 animals and 2 cm caudally to M3 in 1 animal
(Figure 1). The opening of the maxillary sinus into the nasal cavity was located at the level of
fourth premolar (P4) in 15 animals and at first maxillary molar (M1) in 15 animals. The mean
10
width of the opening between the maxillary sinus and the nasal cavity (Figure 19) was 0.15
cm (SD, 0.16 cm). The lateral compartment of the frontal sinus always extended a few
millimeters rostral compared to the medial compartment. Considering that this minimal
difference in extension is clinically irrelevant, only the measurement of the lateral
compartment was presented. The rostral contour of the orbit was used as the landmark to
measure the rostral extension of the frontal sinuses. In 5 animals the frontal sinus extended 1
cm, in 6 animals 2 cm, in 11 animals 3 cm, in 6 animals 4 cm and in 2 animal 5 cm to the
rostral aspect of the orbit. The frontal sinus extended 5 cm caudally to the supraorbital
foramen in 1 animal, 6 cm in 12 animals, 7 cm in 10 animals and 8 cm in 7 animals (Figure
18). The opening of the frontal sinus into the nasal cavity was located at the level of M2 in 16
animals, at the level of a line between M2 and M3 in 7 animals and to the level of M3 in 7
animals. The mean width of the openings of the lateral and medial compartments of the
frontal sinus into the nasal cavity was 0.17 cm (SD, 0.6 cm).
Mean CT measurements for the pituitary gland were: height 1.0 cm (SD, 0.16 cm);
width 1.0 cm (SD, 0.1 cm) and length 1.6 cm (SD, 0.22 cm). Mean pituitary gland volume
was 0.8 cm3 (SD, 0.2 cm
3). Mean brain area was 22.0 cm
2 (SD, 1.57 cm
2). Mean pituitary
height/ brain area ratio was 0.45 mm-1
(SD, 0.06 mm-1
). Mean area of the right and left lateral
ventricle was 0.36 cm2 (SD, 0.1 cm
2) and 0.38 cm
2 (SD, 0.11 cm
2), respectively. The sum of
the areas of the lateral ventricles/brain area ratio was 0.03 (SD, 0.01). In 2 goats the lateral
ventricles could not be detected. Mean pre- and post-contrast pituitary density was 52 HU
(SD, 5 HU) and 108 HU (SD, 12 HU), respectively.
Both dynamic CT studies of the pituitary gland presented the same pattern with an
early enhancement of the maxillary arteries, the rete mirabile, the intracranial part of the
internal carotid arteries and caudodorsal aspect of the pituitary gland with a time to peak
enhancement 30 seconds after the start of the contrast medium injection (Figure 21). This was
followed by a focal area of strong enhancement located in the rostrodorsal aspect of the
11
pituitary gland with a time to peak enhancement of 40 seconds (Figure 21). On the last images
of the dynamic study obtained 90 seconds after the contrast administration, the gland
presented a homogeneous enhancement. In the anatomic specimen, all pituitary glands
appeared normal macroscopically. Measurements of the pituitary height and width were
obtained from 11 animals, in 2 goats the pituitary gland was sliced only in its most rostral
aspect and therefore, they were excluded. Mean anatomic height and width of the pituitary
gland were 0.9 cm (SD, 0.2 cm) and 1.0 cm (SD, 0.1 cm), respectively. Comparing CT
measurements with anatomical measurements of the pituitary gland, the 95% limits of
agreement were -0.42 to 0.26 for width and -0.08 to 0.29 for height.
12
Discussion
The present study was performed to locate and measure anatomic features of the head
of clinically normal goats of the Saanen breed by use of multi-slice CT.
The studies were performed with a 40-row CT unit with a slice collimation of 0.6 cm and the
images were then reconstructed into 0.75 mm slices. As already reported, large volume
coverage and improved resolution can be achieved with multi-row CT scanners (Esteve-
Ratsch, Kneissl et al. 2001). As proven in this study, excellent reconstructed images can be
generated from thin collimated slices obtained in the transverse plane. CT is an excellent
modality to evaluate structures with a high natural contrast such as the nasal cavity and
paranasal sinus system (Losonsky 1997; Morrow, Park et al. 2000; Smallwood, Wood et al.
2002; De Rycke, Saunders et al. 2003). The anatomic complexity of the facial bones and nasal
turbinates (endoturbinates I and II, maxilloturbinate) can be overcome by use of cross-
sectional diagnostic techniques including CT and Magnetic Resonance Imaging (MRI) (De
Rycke, Saunders et al. 2003). Excellent images of the bone and soft tissue components of the
paranasal sinuses and nasal cavity were obtained in the present study. The openings of the
paranasal sinuses into the nasal cavity could be identified in all goats.
Numerous structures of the brain identified on anatomic sections were also identified
on the CT images. The distinctions among internal brain structures were frequently difficult
because of the minor density differences on CT images; therefore landmarks such as
radiolucent CSF and bony structures were used for orientation. The use of contrast medium
enhanced the visualization of certain intra-cranial structures, such as the pituitary gland,
choroid plexus, cavernous sinus, falx cerebri and arterial cerebral circle. This was particularly
important for the identification of the pituitary gland. Other structures that exhibited post-
contrast enhancement were the salivary glands and the lymph nodes. The post contrast
enhancemet clearly helped to delineate these structures from the surrounding subcutaneous
tissues and muscles. Although MRI is known to be superior to CT for the evaluation of soft
13
tissue structures, (LeCouteur, 1999) CT represents a valuable modality for the assessment of
soft tissues such as the brain if MRI is not available.
The quantification of the enhancement of the pituitary gland in the post-contrast
examinations has a questionable value considering that many parameters such as injection
rate, contrast dose, injection time and body weight can influence this measurement (Awai,
Hiraishi et al. 2004).
CT measurements of the width of the pituitary gland agreed well with the anatomical
measurements; however, with CT, pituitary height was always measured higher than on the
anatomical specimen. We speculate that the impossibility to always slice the pituitary gland at
the same level and at its maximum size may have been a source of error in this measurement.
Another interesting finding was the pituitary height/brain area ratio of 0.45 mm in the goat,
which is higher than the reported mean value for the dog (Voorhout, Stolp et al. 1988). A
relatively large pituitary gland compared to other domestic species has been reported in the
sheep (Venzke, 1975). Based on our findings, this relative large pituitary gland size may also
be present in goats.
Similar to other species, the adenohypophysis and neurohypophysis are separately
vascularized in goats (Dyce 2002). Due to the presence of the rete mirabile, there is no single
artery corresponding to the caudal hypophyseal artery in man or in the dog. Instead, one
major and multiple small arteries originating from the rete replace them (Daniel and Prichard
1958). Through these vessels, the neurohypophysis has a direct arterial blood supply. The
adenohypophysis is supplied indirectly, receiving its blood from veins (Dyce 2002). The
anterior hypophyseal arteries originate from the internal carotid artery shortly after the
posterior communicating arteries have been given off forming a ring around the rostral part of
the pituitary stalk. From this ring, numerous braches run along the stalk to supply a first
capillary bed within it. Hypophyseal portal vessels drain the blood from this capillary
network; then, they run ventrally and caudally along the stalk and carry the blood to a second
14
capillary bed in the adenohypophysis. These portal vessels are the sole source from which
almost the whole of the anterior lobe receives its blood supply. The capillary network of the
adenohypophysis subsequently drains into the cavernous sinus (Daniel and Prichard 1958). In
both dynamic studies, two focal enhancing areas with different time to peak enhancement
were observed in the pituitary gland. The first area of enhancement most likely represented
the neurohypophysis due to its location in the caudodorsal aspect of the gland and its early
enhancement. The second focal area of enhancement occurred 10 seconds after the peak
enhancement of the neurohypophysis and was located in the rostrodorsal part of the pituitary
gland. Considering the time of enhancement and its location, this second focal area of
enhancement most likely represented portal veins extending through the stalk into the
adenohypophysis. In people undergoing dynamic CT, enhancement of the internal carotid
artery was observed followed by enhancement of the central part of the secondary capillary
bed of the adenohypohysis, which has been called the pituitary tuft (Bonneville, Cattin et al.
1983). Similar findings characterized by a strong and early enhancement of the central part of
the pituitary gland was observed in dogs (Love, Fisher et al. 2000; van der Vlugt-Meijer, Meij
et al. 2004; Van der Vlugt-Meijer, Meij et al. 2007). Due to anatomical differences between
human and canine pituitary glands, this focal area of enhancement was interpreted as the
neurohypophysis and was called the pituitary flush (van der Vlugt-Meijer, Meij et al. 2004).
In the study reported here, the enhancement of both, the neurohypophysis and
adenohypophysis could be identified independently.
An interesting finding in this study is the homogeneous size of the lateral ventricles
and the similar ratio of the lateral ventricles area to brain area between animals. This contrasts
with the values reported in dogs where statistically significant differences in ventricle size
were identified between different breeds of dogs (Esteve-Ratsch, Kneissl et al. 2001). In two
goats, the lateral ventricles could not be identified on CT; no intracranial abnormalities other
than that were found either with CT or on the anatomic specimen. Small ventricles may
15
represent a normal variation, however, pathologic processes like bleeding, inflammation or
neoplasia cannot be ruled out. Unfortunately, pathological information was not available.
Regarding the measurement of the extension of the paranasal sinuses, in order to have
a clinical application, palpable structures such as the supraorbital foramen, the cranial contour
of the orbit and the maxillary teeth were used. Our results regarding the caudal and cranial
extensions of the frontal sinus are similar to those reported in the literature (Sisson 1975). The
communications of the medial and lateral compartments of the frontal sinus with the nasal
cavity (olfactory part of the middle nasal meatus) as well as the communications of the medial
compartment of the maxillary sinus with the nasal cavity were very small but could be
identified with CT in all animals.
In conclusion, a thorough knowledge of the anatomic features of the head in clinically
normal goats is a prerequisite for accurate interpretation of CT changes with pathologic
conditions. Therefore, the present CT atlas and the measurements obtained in this study can
be as a reference for the evaluation of the head in goats.
16
References
Allen, J.R., Barbee, D.D., Boulton, C.R., Major, M.D., Crisman, M.V., Murnane, R.D.
(1987). Brain abscess in a horse: diagnosis by computed tomography and successful surgical
treatment. Equine Veterinary Journal 19: 552-555.
Auriemma, E., Voorhout, G., Barthez, P.Y. (2007). Determination of optimal window width
and level for measurement of the canine pituitary gland height on computed tomographic
images using a phantom. Veterinary Radiololy and Ultrasound 48(2): 113-117.
Awai, K., Hiraishi, K., Hori, S. (2004). Effect of contrast material injection duration and rate
on aortic peak time and peak enhancement at dynamic CT involving injection protocol with
dose tailored to patient weight. Radiology 230(1): 142-150.
Baisden, J., Voo, L.M., Cusick, J.F., Pintar, F.A., Yoganandan, N. (1999). Evaluation of
cervical laminectomy and laminoplasty. A longitudinal study in the goat model. Spine 24,
1283-1288; discussion 1288-1289.
Barrington, G.M., Tucker, R.L. (1996). Use of computed tomography to diagnose sinusitis in
a goat. Veterinary Radiology and Ultrasound 37, 118-120.
Bergman, R., Jones, J., Lanz, O., Inzana, K., Shell, L., Moon, M., Wright, R.E. (2000). Post-
operative computed tomography in two dogs with cerebral meningioma. Veterinary
Radiology and Ultrasound 41, 425-432.
Bonneville, J.F., Cattin, F., Moussa-Bacha, K., Portha, C. (1983). Dynamic computed
tomography of the pituitary gland: the "tuft sign". Radiology 149(1): 145-148.
Daniel, P.M., Prichard, M.M. (1958). The effects of pituitary stalk section in the goat.
American Journal of Pathology 34(3): 433-439.
De Rycke, L.M., Saunders, J.H., Gielen, I.M., van Bree, H.J., Simoens, P.J. (2003). Magnetic
resonance imaging, computed tomography, and cross-sectional views of the anatomy of
normal nasal cavities and paranasal sinuses in mesaticephalic dogs. American Journal of
Veterinary Research 64, 1093-1098.
17
Dyce, K.M., Sack, W.O., Wensing, C.J.G. (2002). The Endocrine Glands. In: Veterinary
Anatomy, Saunders, USA.
Ducote, J.M., Johnson, K.E., Dewey, C.W., Walker, M.A., Coates, J.R., Berridge, B.R.
(1999). Computed tomography of necrotizing meningoencephalitis in 3 Yorkshire Terriers.
Veterinary Radiology and Ultrasound 40, 617-621.
Esteve-Ratsch, B., Kneissl, S., Gabler, C. (2001). Comparative evaluation of the ventricles in
the Yorkshire Terrier and the German Shepherd dog using low-field MRI. Veterinary
Radiology and Ultrasound 42, 410-413.
Fike, J.R., LeCouteur, R.A., Cann, C.E., Pflugfelder, C.M. (1981). Computerized tomography
of brain tumors of the rostral and middle fossas in the dog. American Journal of Veterinary
Research 42, 275-281.
Fike, J.R., Portha, C., Turowski, K. (1986). Differentiation of neoplastic from non-neoplastic
lesions in dog brain using quantitative CT. Veterinary Radiology and Ultrasound 27, 121-128.
Frazho, J.K., Tano, C.A., Ferrell, E.A. (2008). Diagnosis and treatment of dynamic closed-
mouth jaw locking in a dog. Journal of the American Veterinary Medical Association 233,
748-751.
Fulton K.L., Clarke, M.S., Farris, H.E. (1994). Farm animals in biomedical research Part 2.
The goat as a model for biomedical research and teaching. ILAR News, Institute of
Laboratory Animals Resources 36, 21-29.
Gerros, T.C., Mattoon, J.S., Snyder, S.P. (1998). Use of computed tomography in the
diagnosis of a cerebral abscess in a goat. Veterinary Radiology and Ultrasound 39, 322-324.
Gonzalo-Orden, J.M., Diez, A., Altonaga, J.R., Gonzalo, J.M., Orden, M.A. (1999).
Computed tomographic findings in ovine coenurosis. Veterinary Radiology and Ultrasound
40, 441-444.
LeCouteur, R.A, Filke, J.R., Cann, C.E. (1981). Computed tomography of brain tumors in the
caudal fossa of the dog. Veterinary Radiology and Ultrasound 22, 244-251.
18
Leung, K.S., Siu, W.S., Cheung, N.M., Lui, P.Y., Chow, D.H., James, A., Qin, L. (2001).
Goats as an osteopenic animal model. Journal of Bone and Mineral Research 16, 2348-2355.
Liu, G., Zhao, L., Zhang, W., Cui, L., Liu, W., Cao, Y. (2008). Repair of goat tibial defects
with bone marrow stromal cells and beta-tricalcium phosphate. Journal of Materials Science:
Materials in Medicine 19, 2367-2376.
Losonsky, J.M., Abbot, L.C., Kuriashkin, I.V. (1997). Computed tomography of the normal
feline nasal cavity and paranasal sinuses. Veterinary Radiology and Ultrasound 38, 251-258.
Love, N.E., Fisher, P., Hudson, L. (2000). The computed tomographic enhancement pattern of
the normal canine pituitary gland. Veterinary Radiology and Ultrasound 41(6): 507-510.
Marshall, C.L., Weinstock, D., Kramer, R.W., Bagley, R.S. (1995). Glioma in a goat. Journal
of the America Veterinary Medical Association 206, 1572-1574.
Morrow, K.L., Park, R.D., Spurgeon, T.L., Stashak, T.S., Arceneaux, B. (2000). Computed
tomographic imaging of the equine head. Veterinary Radiology and Ultrasound 41, 491-497.
Nykamp, S., Scrivani, P., DeLahunta, A., Yu-Speight, A., Riis, R. (2001). Chronic subdural
hematomas and hydrocephalus in a dog. Veterinary Radiology and Ultrasound 42, 511-514.
Plummer, S., Wheeler, S., Thrall D. (1992). Computed tomography of primary inflammatory
brain disorders in dogs and cats. Veterinary Radiology and Ultrasound 33, 307-332.
Sisson, S. (1975). Ruminant Osteology. In: Getty, R. (Ed), Sisson and Grossman’s The
Anatomy of the Domestic Animals, Fifth edition. W.B. Saunders Company, USA.
Smallwood, J.E., Wood, B.C., Taylor, W.E., Tate, L.P., Jr. (2002). Anatomic reference for
computed tomography of the head of the foal. Veterinary Radiology and Ultrasound 43, 99-
117.
ten Hallers, E.J., Marres, H.A., Rakhorst, G., Jansen, J.A., Sommers, M.G., Van der Houwen,
E.B., Schutte, H.K., Van Kooten, T.G., Van Loon, J.P., Verkerke, G.J. (2007). The Saanen
goat as an animal model for post-laryngectomy research: practical implications. Laboratory
Animals 41, 270-284.

19
ten Hallers, E.J., Rakhorst, G., Marres, H.A., Jansen, J.A., van Kooten, T.G., Schutte, H.K.,
van Loon, J.P., van der Houwen, E.B., Verkerke, G.J. (2004). Animal models for tracheal
research. Biomaterials 25, 1533-1543.
Tidwell, A, Mahony, O., Moore, R. (1994). Computed tomography of an acute hemorrhagic
cerebral infarct in a dog. Veterinary Radiology and Ultrasound 35, 290-296.
Tietje, S., Becker, M., Bockenhoff, G. (1996). Computed tomographic evaluation of head
diseases in the horse: 15 cases. Equine Veterinary Journal 28, 98-105.
van der Vlugt-Meijer, R.H., Meij, B.P., Voorhout, G. (2004). Dynamic computed
tomographic evaluation of the pituitary gland in healthy dogs. American Journal of Veterinary
Research 65(11): 1518-1524.
van der Vlugt-Meijer, R.H., Meij, B.P., Voorhout, G. (2007). Dynamic helical computed
tomography of the pituitary gland in healthy dogs. Veterinary Radiology and Ultrasound
48(2): 118-124.
Venzke, W.G. (1975). Ruminant Endocrinology. In: Getty, R. (Ed), Sisson and Grossman’s
The Anatomy of the Domestic Animals, Fifth edition. W.B. Saunders Company, USA.
Vink-Nooteboom, M., Junker, K., van den Ingh, T.S., Dik, K.J. (1998). Computed
tomography of cholesterinic granulomas in the choroid plexus of horses. Veterinary
Radiology and Ultrasound 39, 512-516.
Voorhout, G., Stolp, R., Lubberink, A.A., van Waes, P.F. (1988). Computed tomography in
the diagnosis of canine hyperadrenocorticism not suppressible by dexamethasone. Journal of
the American Veterinary Medical Association 192(5): 641-646.
Wolf, M., Pedroia, V., Higgins, R.J. (1995). Intracranial ring enhancing lesions in a dog: a
correlative CT scanning and neuropathologic study. Veterinary Radiology and Ultrasound 36,
16-20.
20
Woods, P, Walker, M., Weir, V. (1993). Computed tomography of Rambouillet sheep
affected with neuronal ceroid lipofuscinosis. Veterinary Radiology and Ultrasound 34, 259-
262.
21
Figures
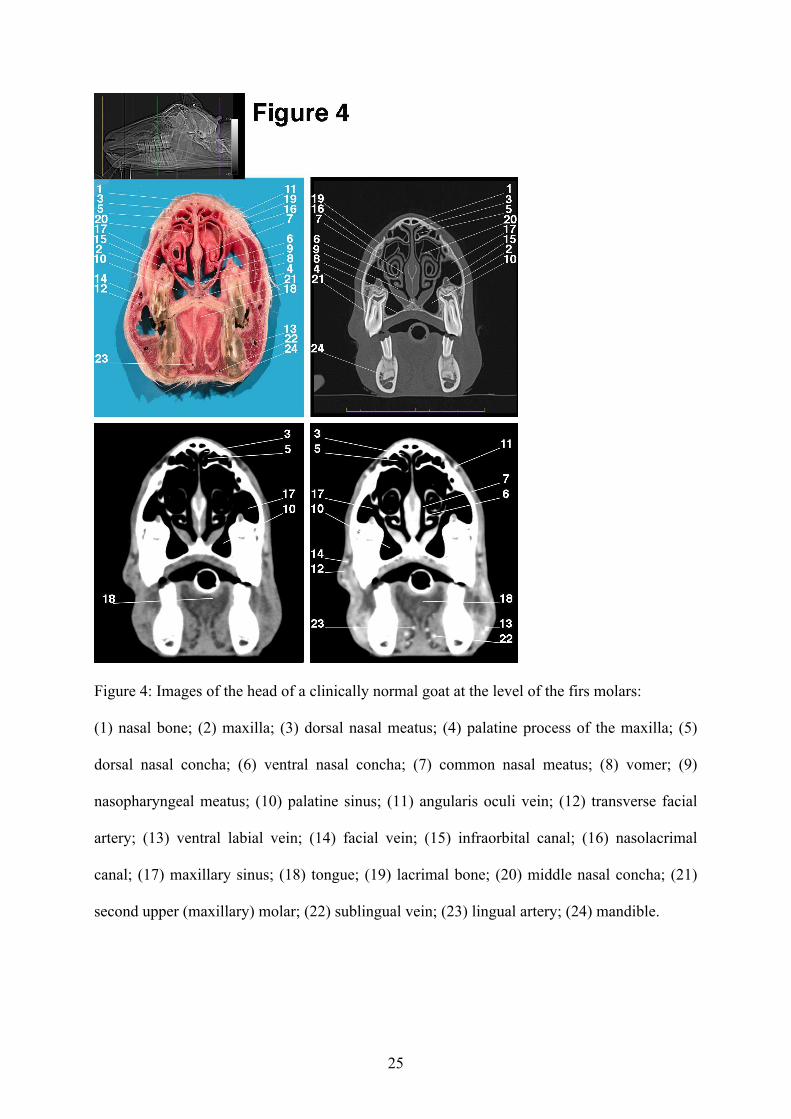
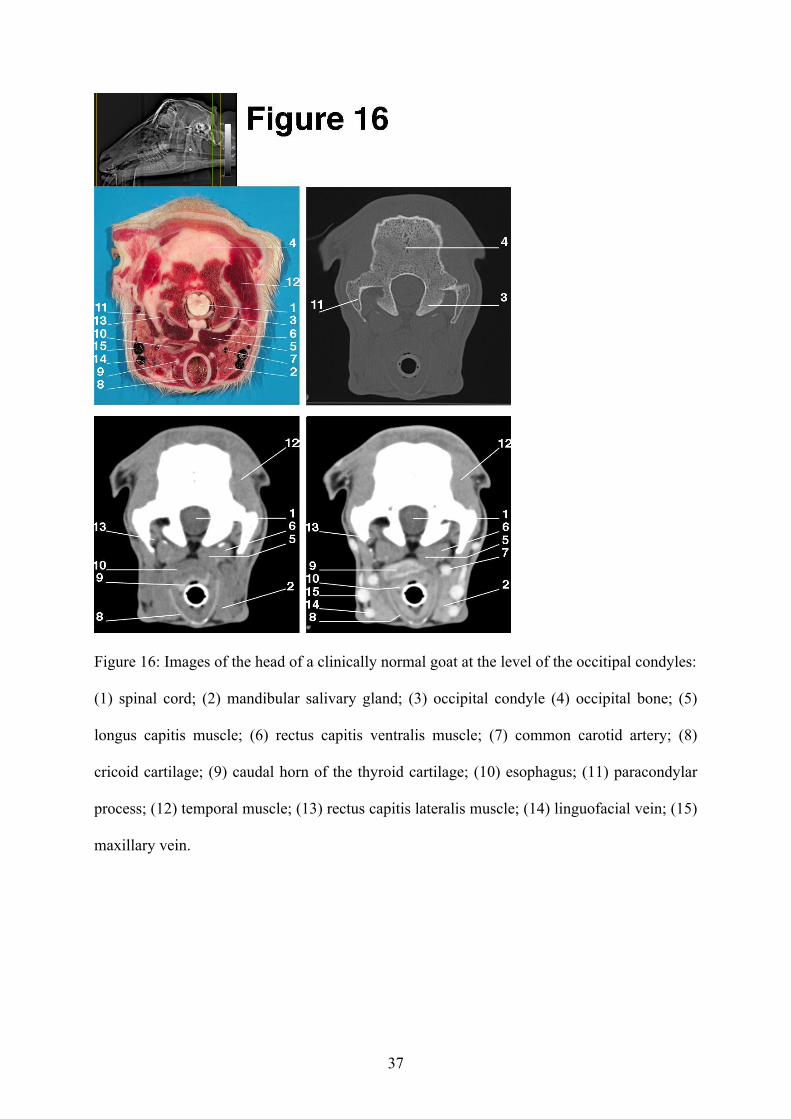
Figures 1-16: Images of the head of a clinically normal goat. On the top left CT image
(topogram), the green vertical line illustrates the level of the transverse CT image. The mid
left photograph represents the transverse anatomic section with the corresponding transverse
pre-contrast CT image in a bone window (mid right), and pre-contrast (bottom left) and post-
contrast (bottom right) CT images in a soft tissue window. Left is to the left and right is to the
right in the images.
22
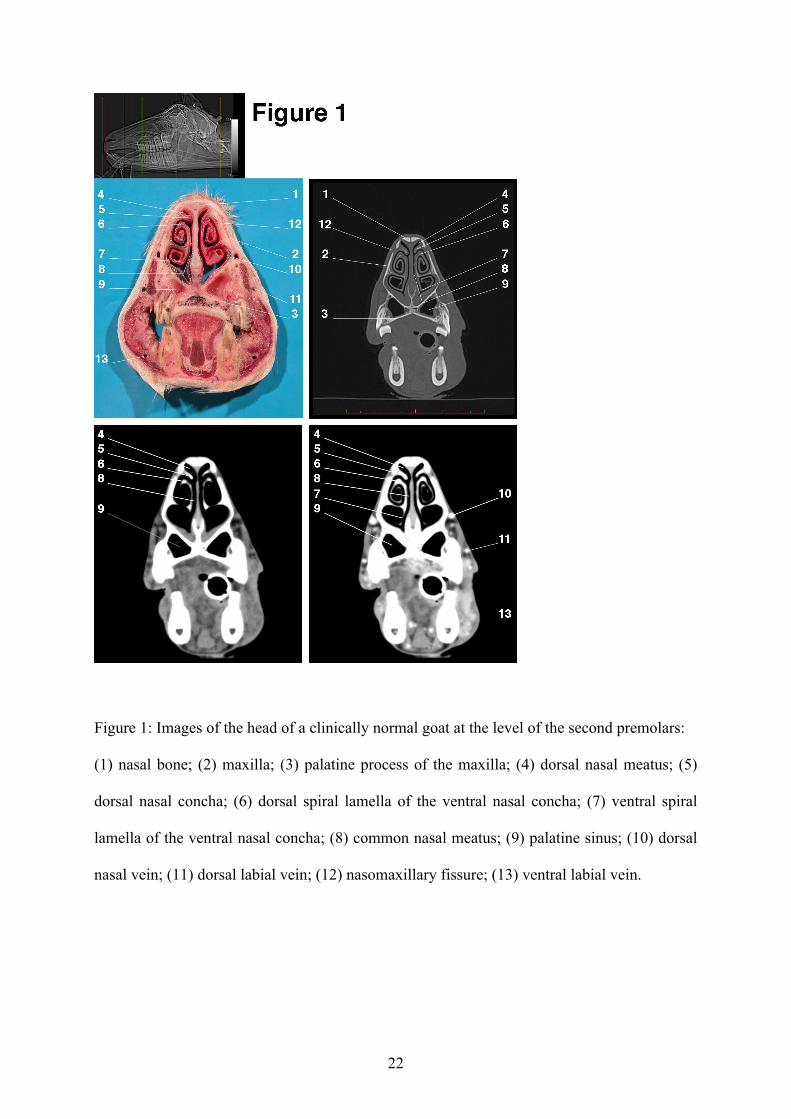
Figure 1: Images of the head of a clinically normal goat at the level of the second premolars:
(1) nasal bone; (2) maxilla; (3) palatine process of the maxilla; (4) dorsal nasal meatus; (5)
dorsal nasal concha; (6) dorsal spiral lamella of the ventral nasal concha; (7) ventral spiral
lamella of the ventral nasal concha; (8) common nasal meatus; (9) palatine sinus; (10) dorsal
nasal vein; (11) dorsal labial vein; (12) nasomaxillary fissure; (13) ventral labial vein.
23
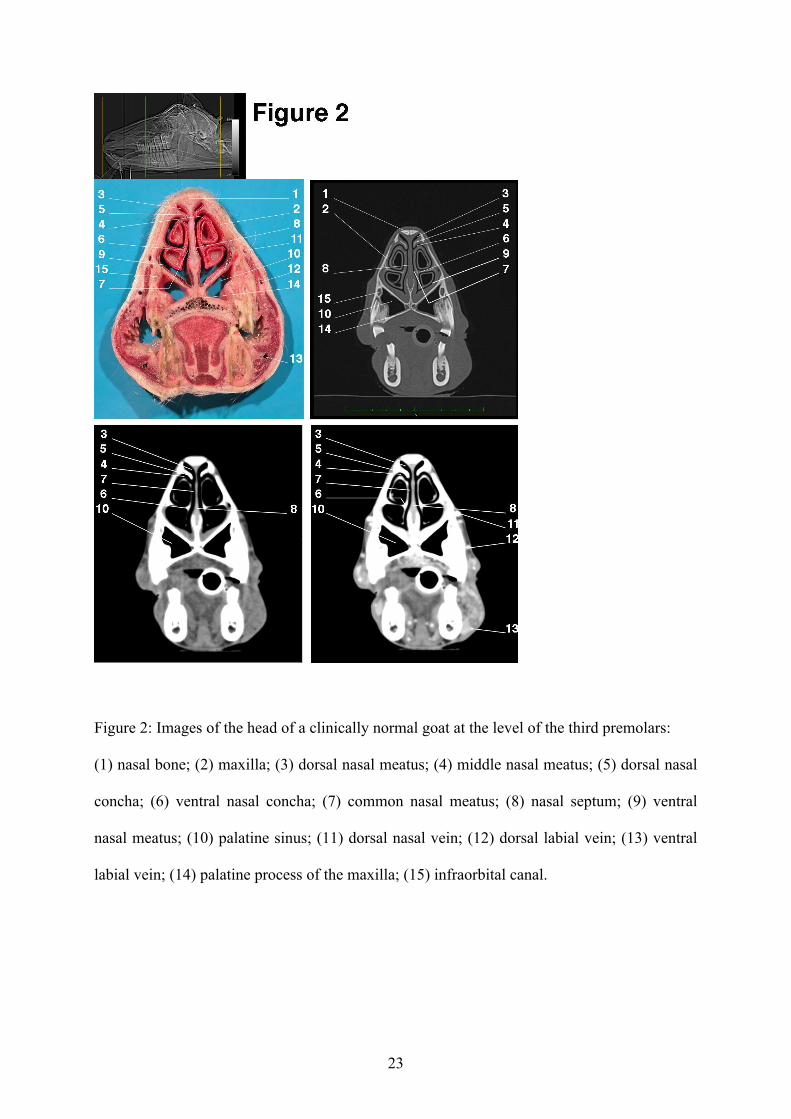
Figure 2: Images of the head of a clinically normal goat at the level of the third premolars:
(1) nasal bone; (2) maxilla; (3) dorsal nasal meatus; (4) middle nasal meatus; (5) dorsal nasal
concha; (6) ventral nasal concha; (7) common nasal meatus; (8) nasal septum; (9) ventral
nasal meatus; (10) palatine sinus; (11) dorsal nasal vein; (12) dorsal labial vein; (13) ventral
labial vein; (14) palatine process of the maxilla; (15) infraorbital canal.
24
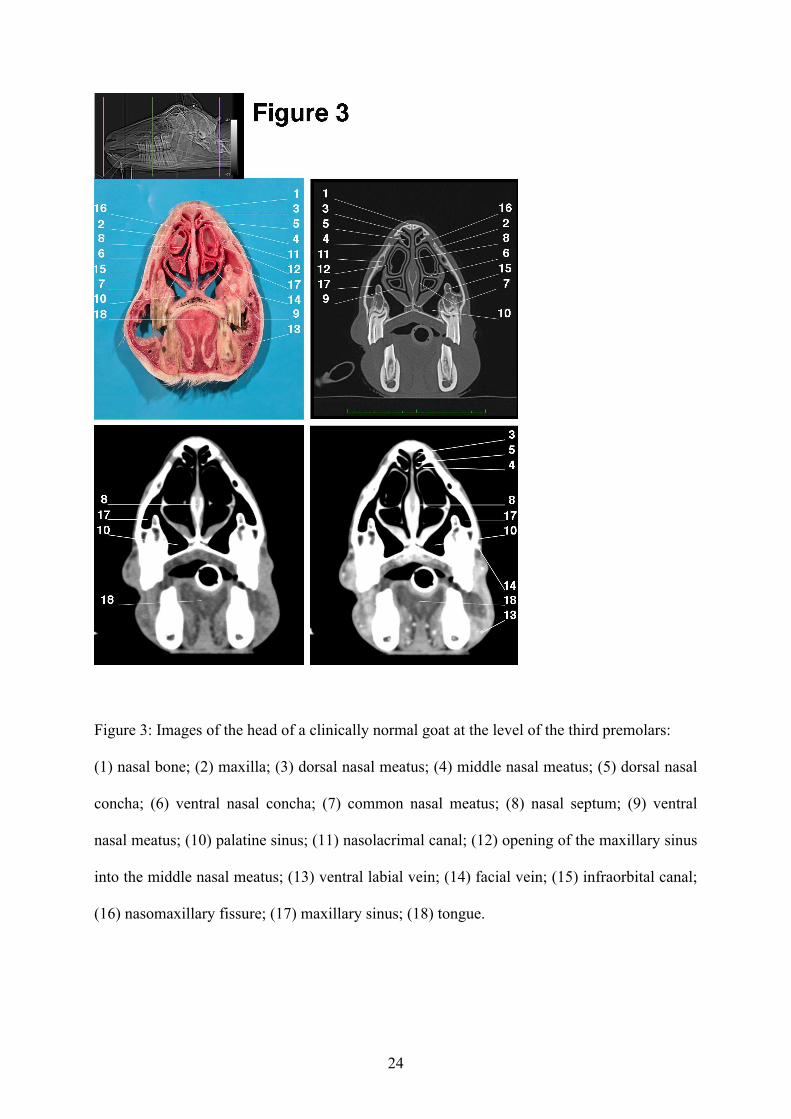
Figure 3: Images of the head of a clinically normal goat at the level of the third premolars:
(1) nasal bone; (2) maxilla; (3) dorsal nasal meatus; (4) middle nasal meatus; (5) dorsal nasal
concha; (6) ventral nasal concha; (7) common nasal meatus; (8) nasal septum; (9) ventral
nasal meatus; (10) palatine sinus; (11) nasolacrimal canal; (12) opening of the maxillary sinus
into the middle nasal meatus; (13) ventral labial vein; (14) facial vein; (15) infraorbital canal;
(16) nasomaxillary fissure; (17) maxillary sinus; (18) tongue.
25
Figure 4: Images of the head of a clinically normal goat at the level of the firs molars:
(1) nasal bone; (2) maxilla; (3) dorsal nasal meatus; (4) palatine process of the maxilla; (5)
dorsal nasal concha; (6) ventral nasal concha; (7) common nasal meatus; (8) vomer; (9)
nasopharyngeal meatus; (10) palatine sinus; (11) angularis oculi vein; (12) transverse facial
artery; (13) ventral labial vein; (14) facial vein; (15) infraorbital canal; (16) nasolacrimal
canal; (17) maxillary sinus; (18) tongue; (19) lacrimal bone; (20) middle nasal concha; (21)
second upper (maxillary) molar; (22) sublingual vein; (23) lingual artery; (24) mandible.
26
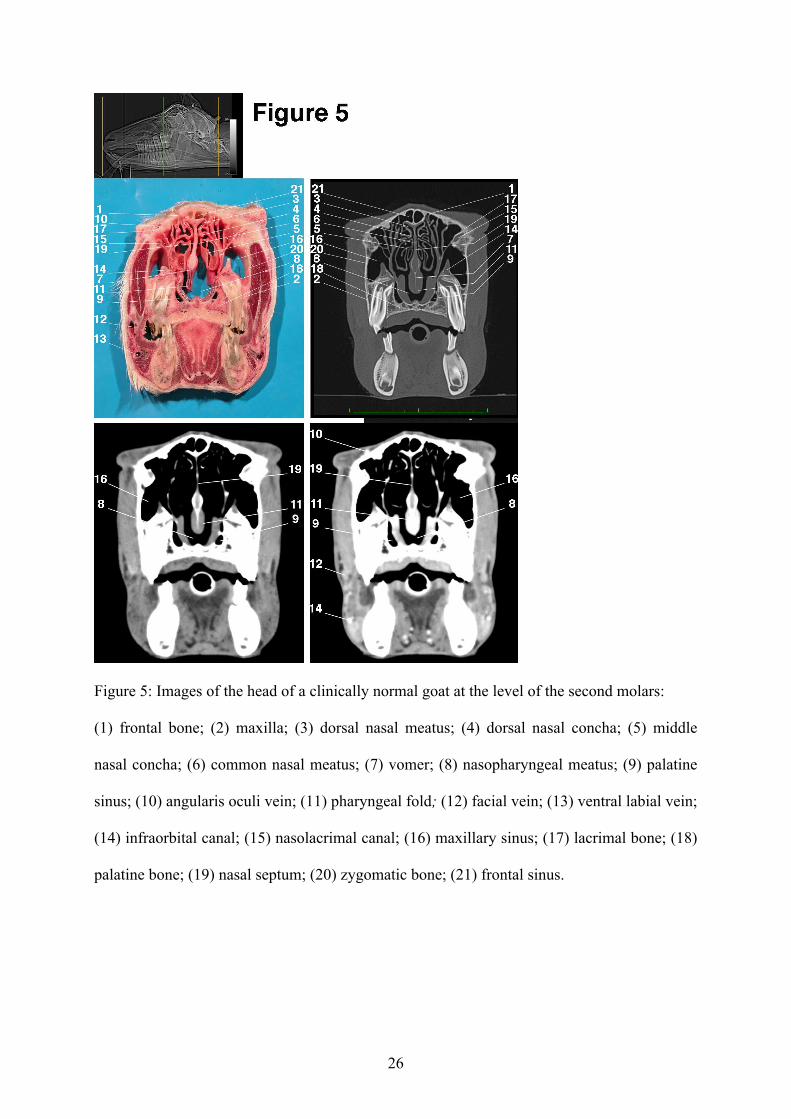
Figure 5: Images of the head of a clinically normal goat at the level of the second molars:
(1) frontal bone; (2) maxilla; (3) dorsal nasal meatus; (4) dorsal nasal concha; (5) middle
nasal concha; (6) common nasal meatus; (7) vomer; (8) nasopharyngeal meatus; (9) palatine
sinus; (10) angularis oculi vein; (11) pharyngeal fold; (12) facial vein; (13) ventral labial vein;
(14) infraorbital canal; (15) nasolacrimal canal; (16) maxillary sinus; (17) lacrimal bone; (18)
palatine bone; (19) nasal septum; (20) zygomatic bone; (21) frontal sinus.
27
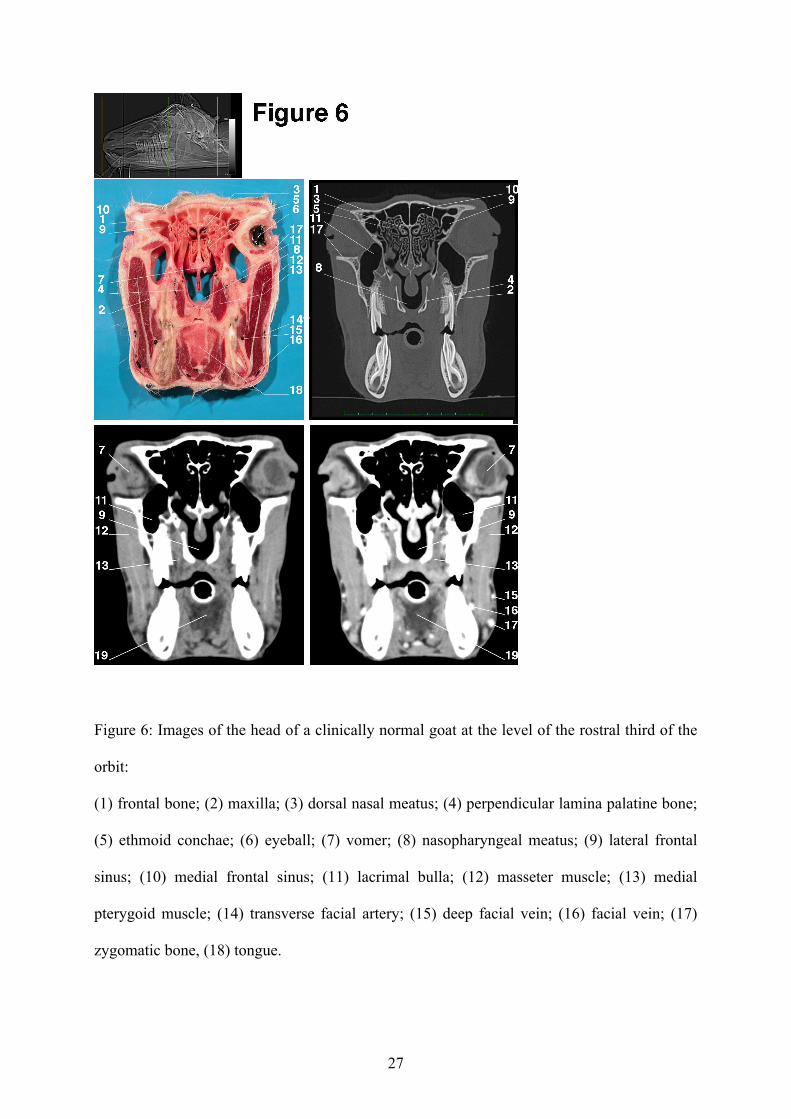
Figure 6: Images of the head of a clinically normal goat at the level of the rostral third of the
orbit:
(1) frontal bone; (2) maxilla; (3) dorsal nasal meatus; (4) perpendicular lamina palatine bone;
(5) ethmoid conchae; (6) eyeball; (7) vomer; (8) nasopharyngeal meatus; (9) lateral frontal
sinus; (10) medial frontal sinus; (11) lacrimal bulla; (12) masseter muscle; (13) medial
pterygoid muscle; (14) transverse facial artery; (15) deep facial vein; (16) facial vein; (17)
zygomatic bone, (18) tongue.
28
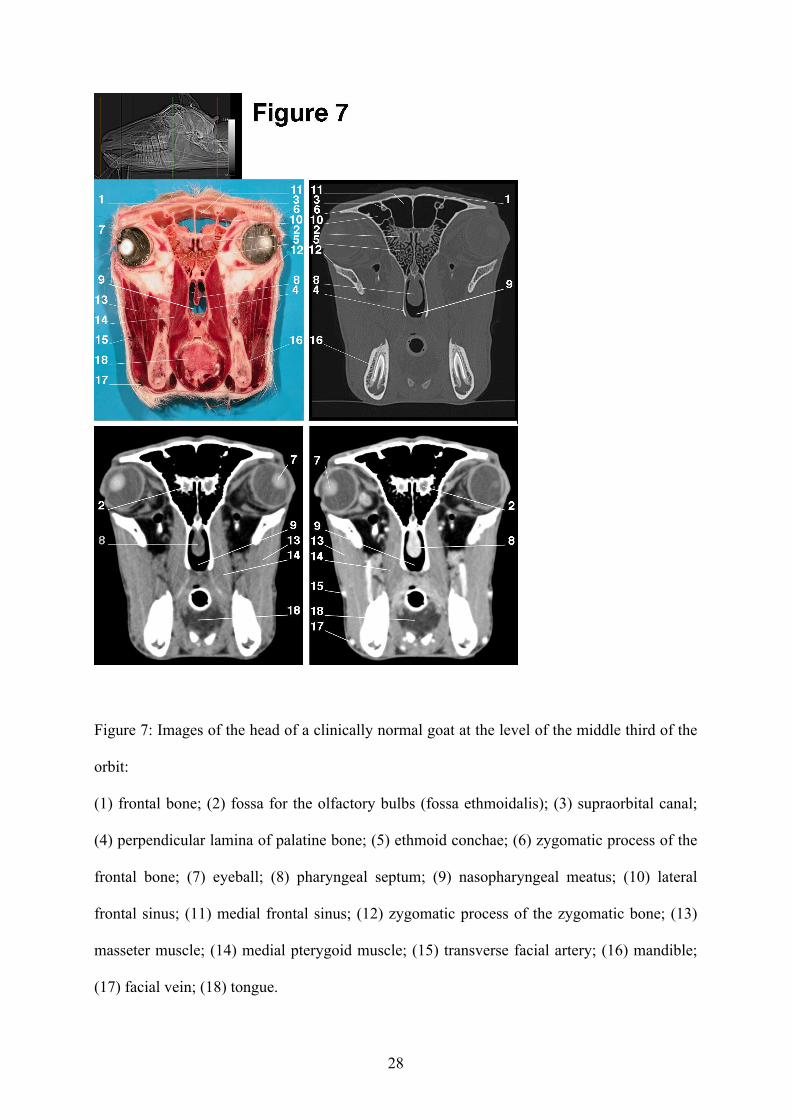
Figure 7: Images of the head of a clinically normal goat at the level of the middle third of the
orbit:
(1) frontal bone; (2) fossa for the olfactory bulbs (fossa ethmoidalis); (3) supraorbital canal;
(4) perpendicular lamina of palatine bone; (5) ethmoid conchae; (6) zygomatic process of the
frontal bone; (7) eyeball; (8) pharyngeal septum; (9) nasopharyngeal meatus; (10) lateral
frontal sinus; (11) medial frontal sinus; (12) zygomatic process of the zygomatic bone; (13)
masseter muscle; (14) medial pterygoid muscle; (15) transverse facial artery; (16) mandible;
(17) facial vein; (18) tongue.
29
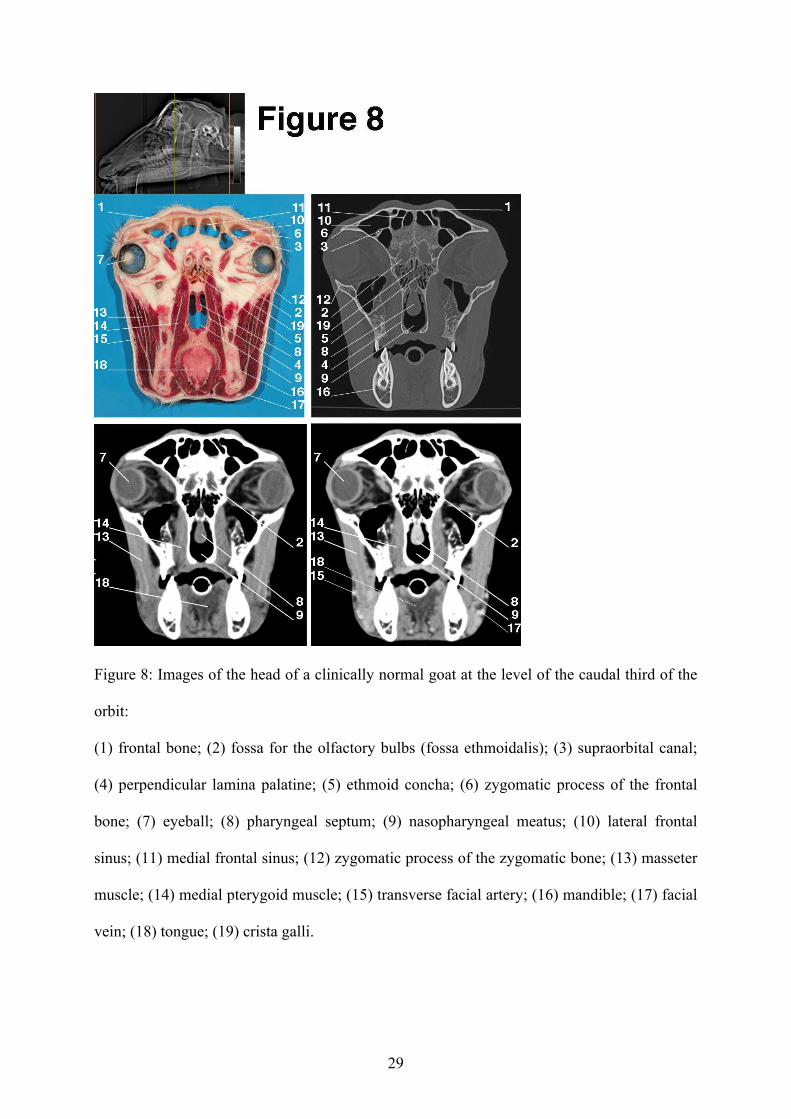
Figure 8: Images of the head of a clinically normal goat at the level of the caudal third of the
orbit:
(1) frontal bone; (2) fossa for the olfactory bulbs (fossa ethmoidalis); (3) supraorbital canal;
(4) perpendicular lamina palatine; (5) ethmoid concha; (6) zygomatic process of the frontal
bone; (7) eyeball; (8) pharyngeal septum; (9) nasopharyngeal meatus; (10) lateral frontal
sinus; (11) medial frontal sinus; (12) zygomatic process of the zygomatic bone; (13) masseter
muscle; (14) medial pterygoid muscle; (15) transverse facial artery; (16) mandible; (17) facial
vein; (18) tongue; (19) crista galli.
30
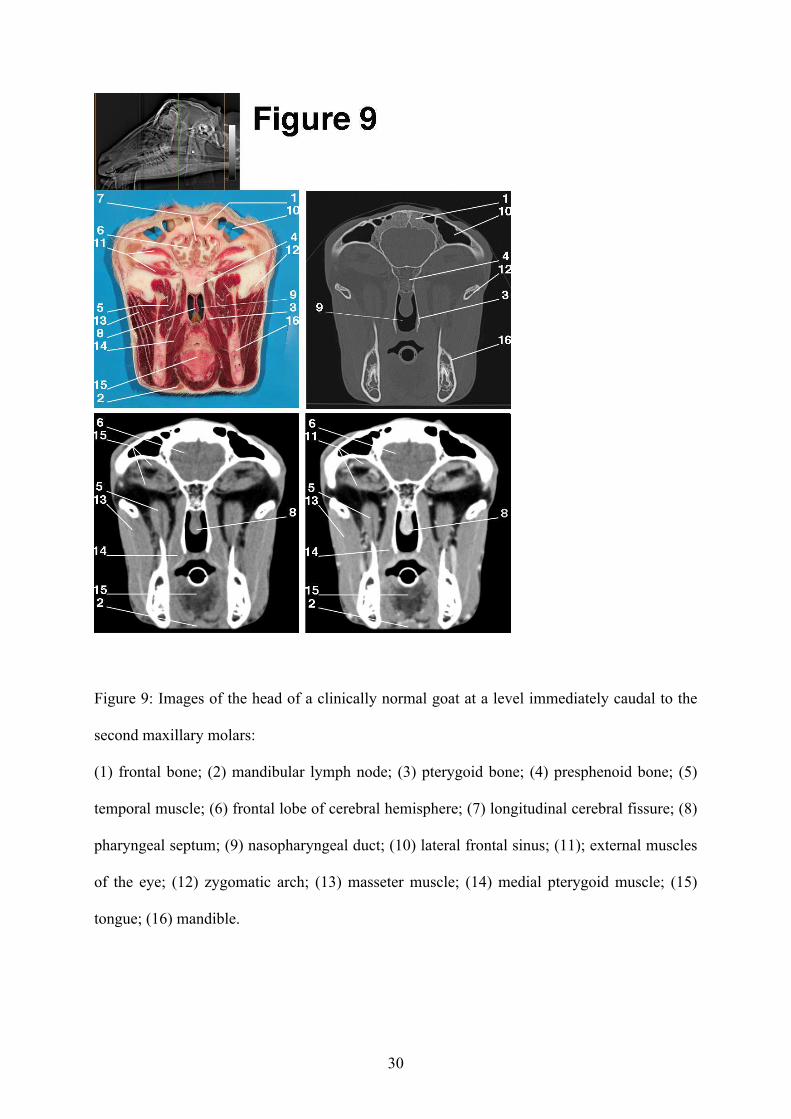
Figure 9: Images of the head of a clinically normal goat at a level immediately caudal to the
second maxillary molars:
(1) frontal bone; (2) mandibular lymph node; (3) pterygoid bone; (4) presphenoid bone; (5)
temporal muscle; (6) frontal lobe of cerebral hemisphere; (7) longitudinal cerebral fissure; (8)
pharyngeal septum; (9) nasopharyngeal duct; (10) lateral frontal sinus; (11); external muscles
of the eye; (12) zygomatic arch; (13) masseter muscle; (14) medial pterygoid muscle; (15)
tongue; (16) mandible.
31
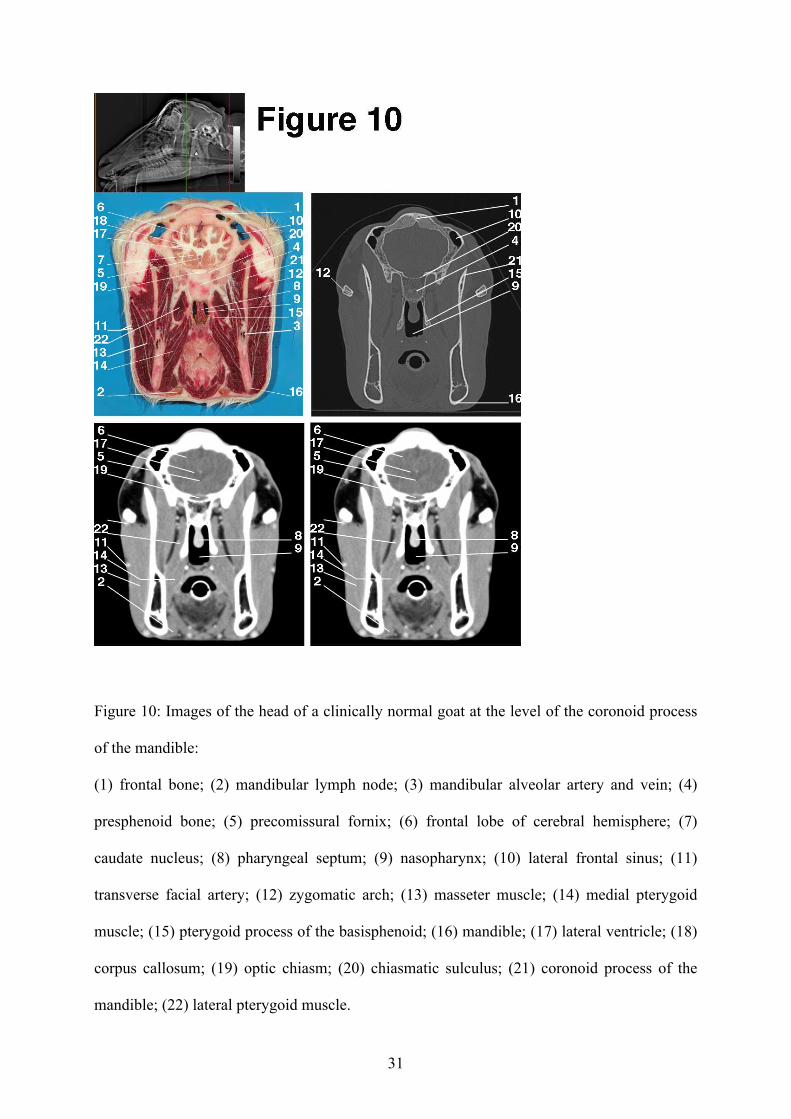
Figure 10: Images of the head of a clinically normal goat at the level of the coronoid process
of the mandible:
(1) frontal bone; (2) mandibular lymph node; (3) mandibular alveolar artery and vein; (4)
presphenoid bone; (5) precomissural fornix; (6) frontal lobe of cerebral hemisphere; (7)
caudate nucleus; (8) pharyngeal septum; (9) nasopharynx; (10) lateral frontal sinus; (11)
transverse facial artery; (12) zygomatic arch; (13) masseter muscle; (14) medial pterygoid
muscle; (15) pterygoid process of the basisphenoid; (16) mandible; (17) lateral ventricle; (18)
corpus callosum; (19) optic chiasm; (20) chiasmatic sulculus; (21) coronoid process of the
mandible; (22) lateral pterygoid muscle.
32
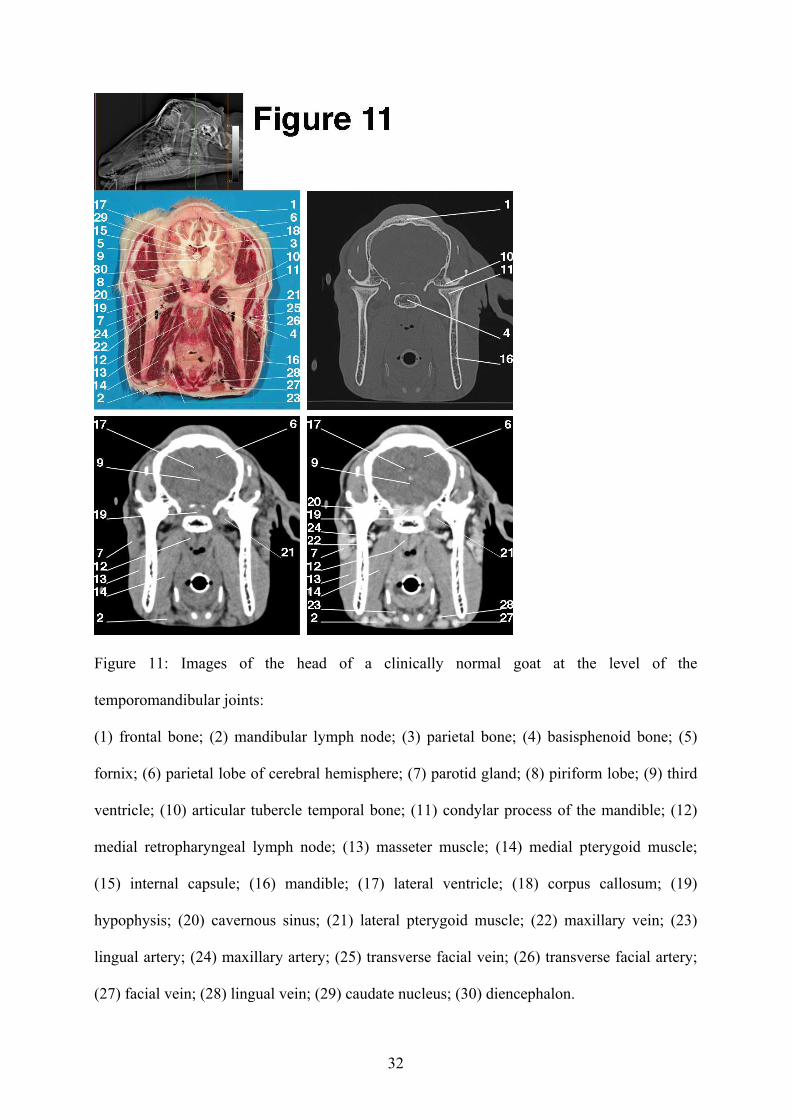
Figure 11: Images of the head of a clinically normal goat at the level of the
temporomandibular joints:
(1) frontal bone; (2) mandibular lymph node; (3) parietal bone; (4) basisphenoid bone; (5)
fornix; (6) parietal lobe of cerebral hemisphere; (7) parotid gland; (8) piriform lobe; (9) third
ventricle; (10) articular tubercle temporal bone; (11) condylar process of the mandible; (12)
medial retropharyngeal lymph node; (13) masseter muscle; (14) medial pterygoid muscle;
(15) internal capsule; (16) mandible; (17) lateral ventricle; (18) corpus callosum; (19)
hypophysis; (20) cavernous sinus; (21) lateral pterygoid muscle; (22) maxillary vein; (23)
lingual artery; (24) maxillary artery; (25) transverse facial vein; (26) transverse facial artery;
(27) facial vein; (28) lingual vein; (29) caudate nucleus; (30) diencephalon.
33
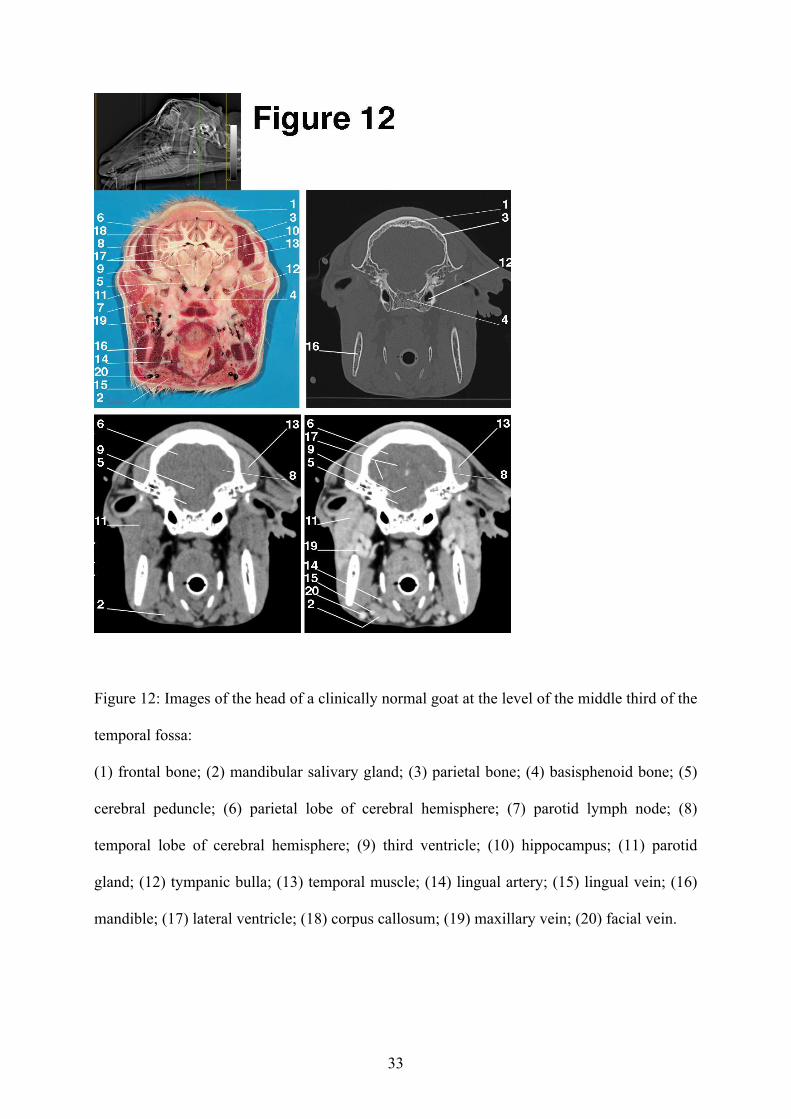
Figure 12: Images of the head of a clinically normal goat at the level of the middle third of the
temporal fossa:
(1) frontal bone; (2) mandibular salivary gland; (3) parietal bone; (4) basisphenoid bone; (5)
cerebral peduncle; (6) parietal lobe of cerebral hemisphere; (7) parotid lymph node; (8)
temporal lobe of cerebral hemisphere; (9) third ventricle; (10) hippocampus; (11) parotid
gland; (12) tympanic bulla; (13) temporal muscle; (14) lingual artery; (15) lingual vein; (16)
mandible; (17) lateral ventricle; (18) corpus callosum; (19) maxillary vein; (20) facial vein.
34
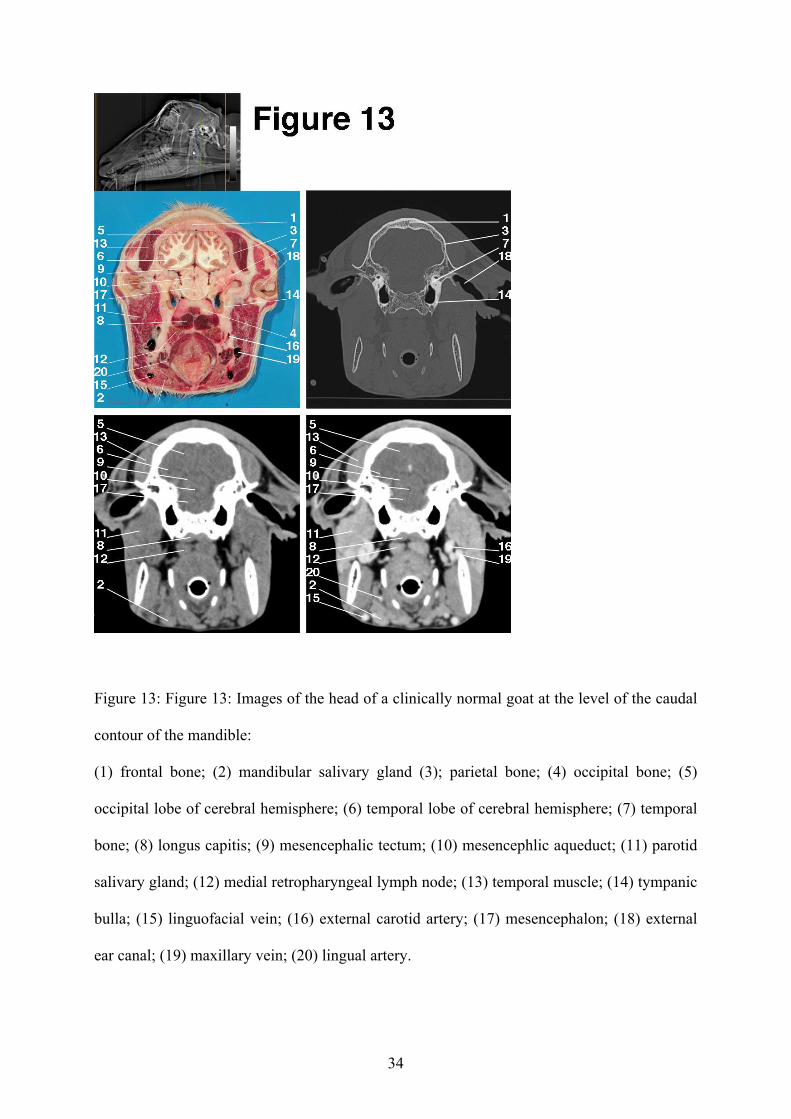
Figure 13: Figure 13: Images of the head of a clinically normal goat at the level of the caudal
contour of the mandible:
(1) frontal bone; (2) mandibular salivary gland (3); parietal bone; (4) occipital bone; (5)
occipital lobe of cerebral hemisphere; (6) temporal lobe of cerebral hemisphere; (7) temporal
bone; (8) longus capitis; (9) mesencephalic tectum; (10) mesencephlic aqueduct; (11) parotid
salivary gland; (12) medial retropharyngeal lymph node; (13) temporal muscle; (14) tympanic
bulla; (15) linguofacial vein; (16) external carotid artery; (17) mesencephalon; (18) external
ear canal; (19) maxillary vein; (20) lingual artery.
35
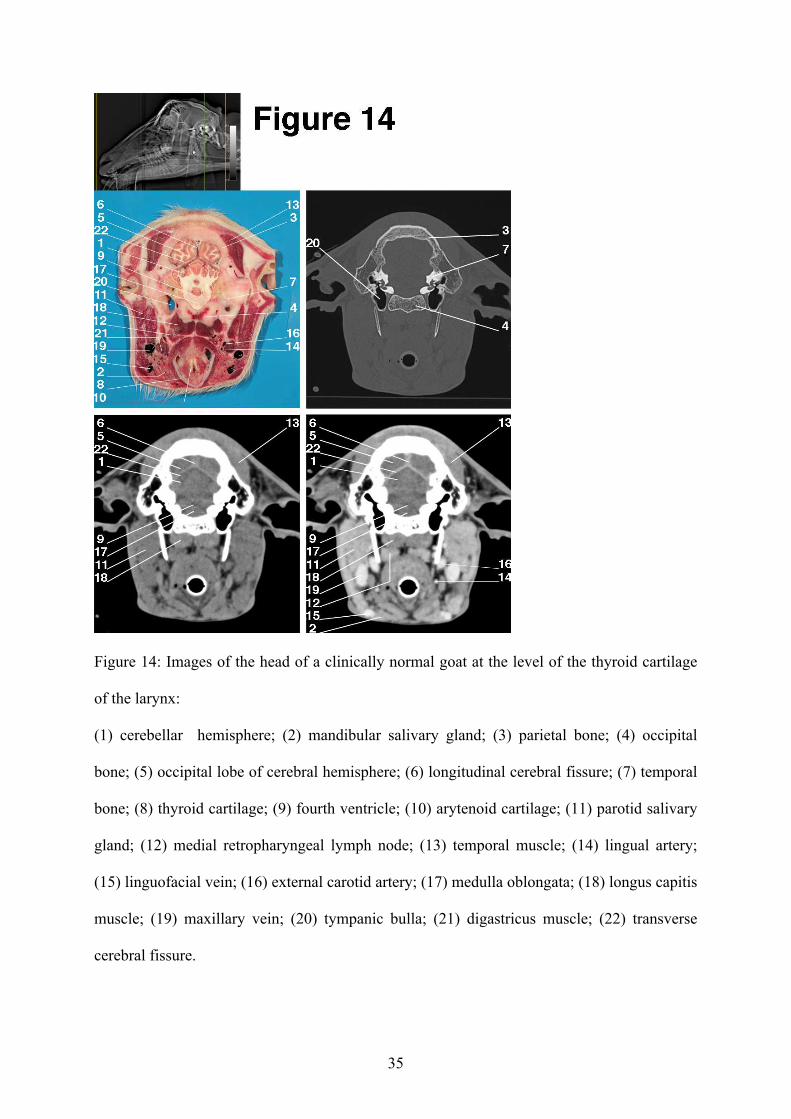
Figure 14: Images of the head of a clinically normal goat at the level of the thyroid cartilage
of the larynx:
(1) cerebellar hemisphere; (2) mandibular salivary gland; (3) parietal bone; (4) occipital
bone; (5) occipital lobe of cerebral hemisphere; (6) longitudinal cerebral fissure; (7) temporal
bone; (8) thyroid cartilage; (9) fourth ventricle; (10) arytenoid cartilage; (11) parotid salivary
gland; (12) medial retropharyngeal lymph node; (13) temporal muscle; (14) lingual artery;
(15) linguofacial vein; (16) external carotid artery; (17) medulla oblongata; (18) longus capitis
muscle; (19) maxillary vein; (20) tympanic bulla; (21) digastricus muscle; (22) transverse
cerebral fissure.
36
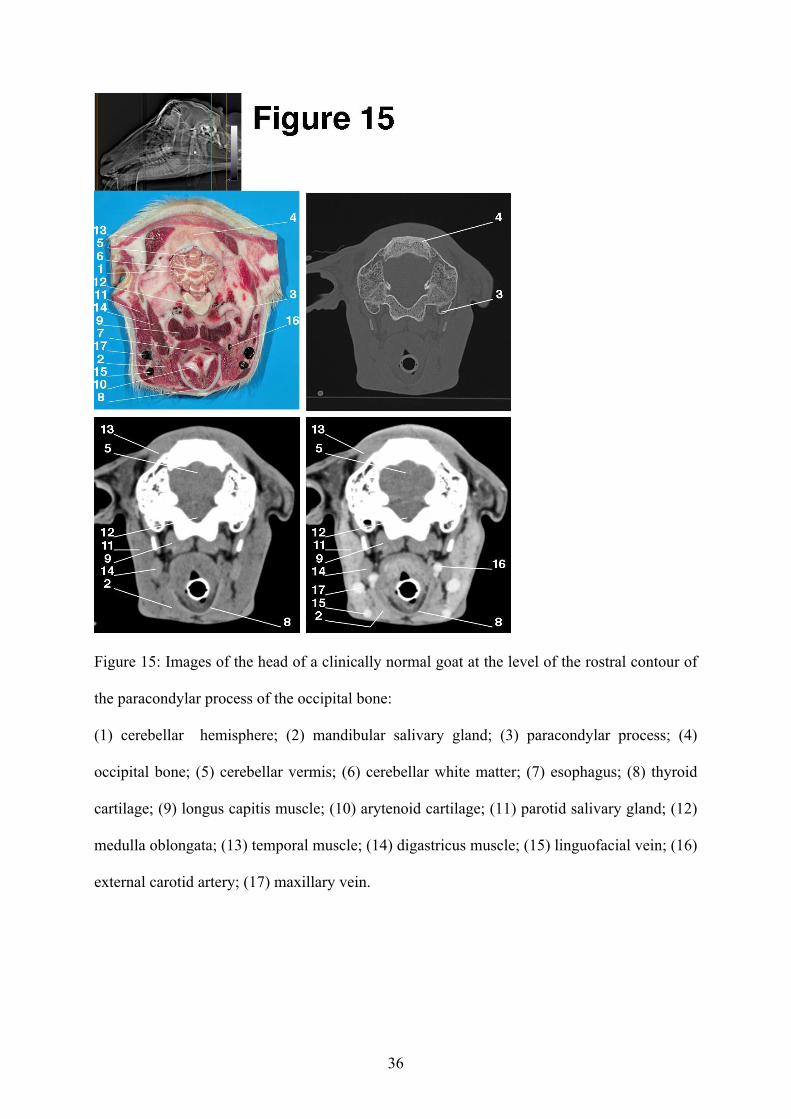
Figure 15: Images of the head of a clinically normal goat at the level of the rostral contour of
the paracondylar process of the occipital bone:
(1) cerebellar hemisphere; (2) mandibular salivary gland; (3) paracondylar process; (4)
occipital bone; (5) cerebellar vermis; (6) cerebellar white matter; (7) esophagus; (8) thyroid
cartilage; (9) longus capitis muscle; (10) arytenoid cartilage; (11) parotid salivary gland; (12)
medulla oblongata; (13) temporal muscle; (14) digastricus muscle; (15) linguofacial vein; (16)
external carotid artery; (17) maxillary vein.
37
Figure 16: Images of the head of a clinically normal goat at the level of the occitipal condyles:
(1) spinal cord; (2) mandibular salivary gland; (3) occipital condyle (4) occipital bone; (5)
longus capitis muscle; (6) rectus capitis ventralis muscle; (7) common carotid artery; (8)
cricoid cartilage; (9) caudal horn of the thyroid cartilage; (10) esophagus; (11) paracondylar
process; (12) temporal muscle; (13) rectus capitis lateralis muscle; (14) linguofacial vein; (15)
maxillary vein.
38
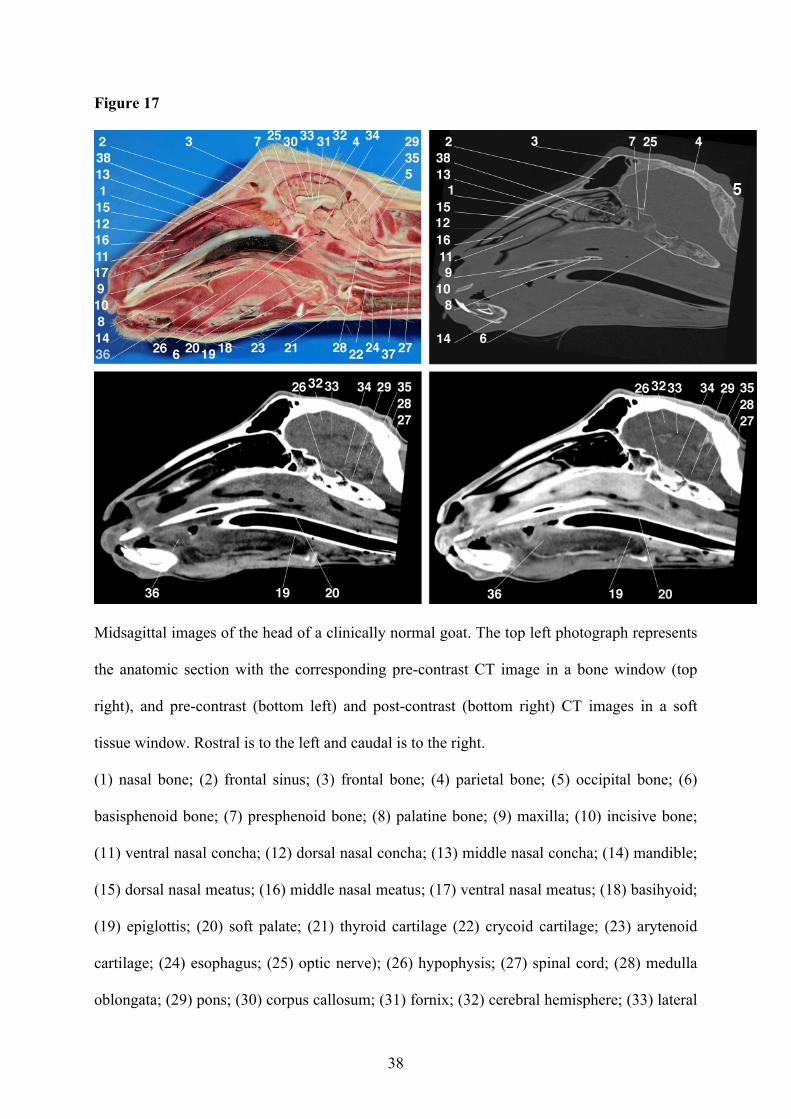
Figure 17
Midsagittal images of the head of a clinically normal goat. The top left photograph represents
the anatomic section with the corresponding pre-contrast CT image in a bone window (top
right), and pre-contrast (bottom left) and post-contrast (bottom right) CT images in a soft
tissue window. Rostral is to the left and caudal is to the right.
(1) nasal bone; (2) frontal sinus; (3) frontal bone; (4) parietal bone; (5) occipital bone; (6)
basisphenoid bone; (7) presphenoid bone; (8) palatine bone; (9) maxilla; (10) incisive bone;
(11) ventral nasal concha; (12) dorsal nasal concha; (13) middle nasal concha; (14) mandible;
(15) dorsal nasal meatus; (16) middle nasal meatus; (17) ventral nasal meatus; (18) basihyoid;
(19) epiglottis; (20) soft palate; (21) thyroid cartilage (22) crycoid cartilage; (23) arytenoid
cartilage; (24) esophagus; (25) optic nerve); (26) hypophysis; (27) spinal cord; (28) medulla
oblongata; (29) pons; (30) corpus callosum; (31) fornix; (32) cerebral hemisphere; (33) lateral

39
ventricle (septum pellucidum); (34) mesencephalon; (35) cerebellum; (36) tongue; (37)
trachea; (38) ethmoid conchae.
40
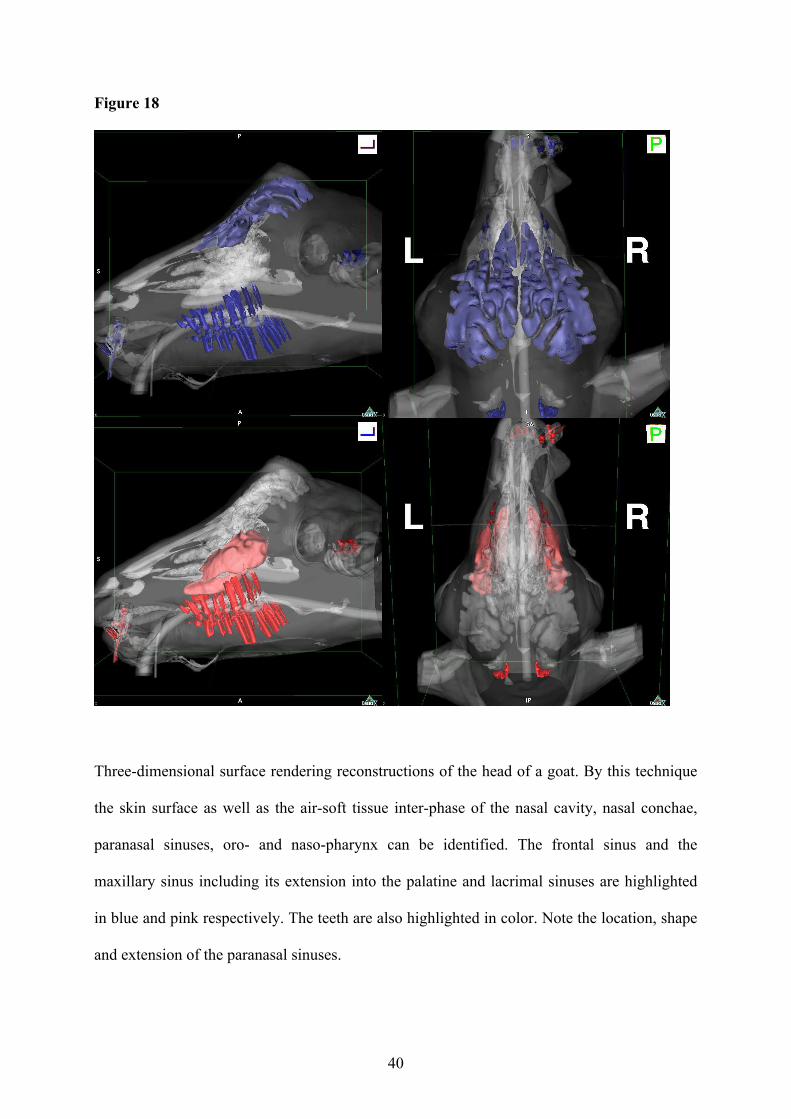
Figure 18
Three-dimensional surface rendering reconstructions of the head of a goat. By this technique
the skin surface as well as the air-soft tissue inter-phase of the nasal cavity, nasal conchae,
paranasal sinuses, oro- and naso-pharynx can be identified. The frontal sinus and the
maxillary sinus including its extension into the palatine and lacrimal sinuses are highlighted
in blue and pink respectively. The teeth are also highlighted in color. Note the location, shape
and extension of the paranasal sinuses.
41
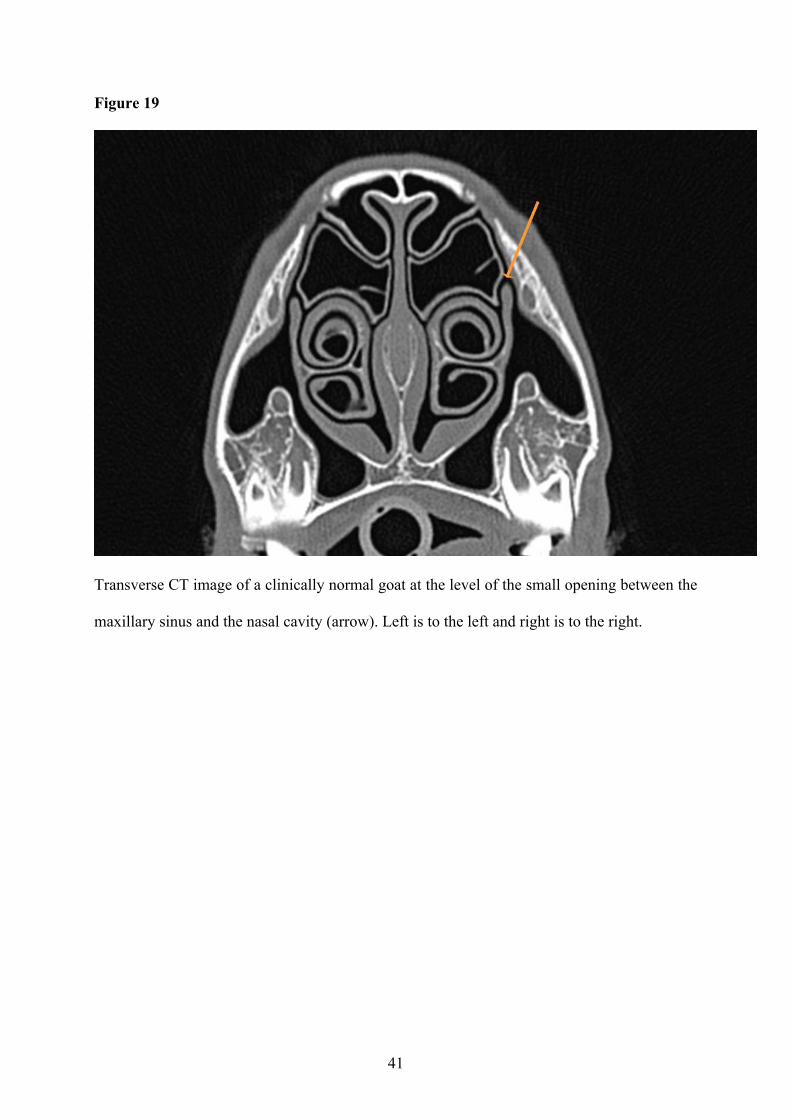
Figure 19
Transverse CT image of a clinically normal goat at the level of the small opening between the
maxillary sinus and the nasal cavity (arrow). Left is to the left and right is to the right.
42
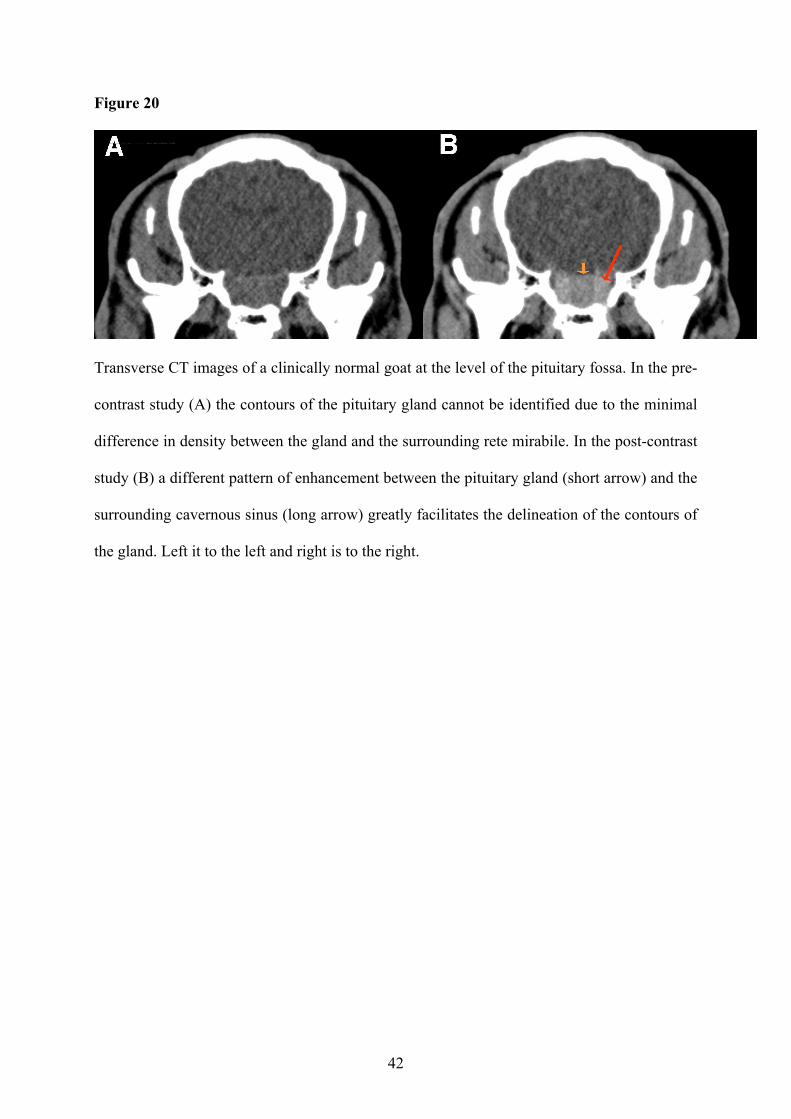
Figure 20
Transverse CT images of a clinically normal goat at the level of the pituitary fossa. In the pre-
contrast study (A) the contours of the pituitary gland cannot be identified due to the minimal
difference in density between the gland and the surrounding rete mirabile. In the post-contrast
study (B) a different pattern of enhancement between the pituitary gland (short arrow) and the
surrounding cavernous sinus (long arrow) greatly facilitates the delineation of the contours of
the gland. Left it to the left and right is to the right.
43
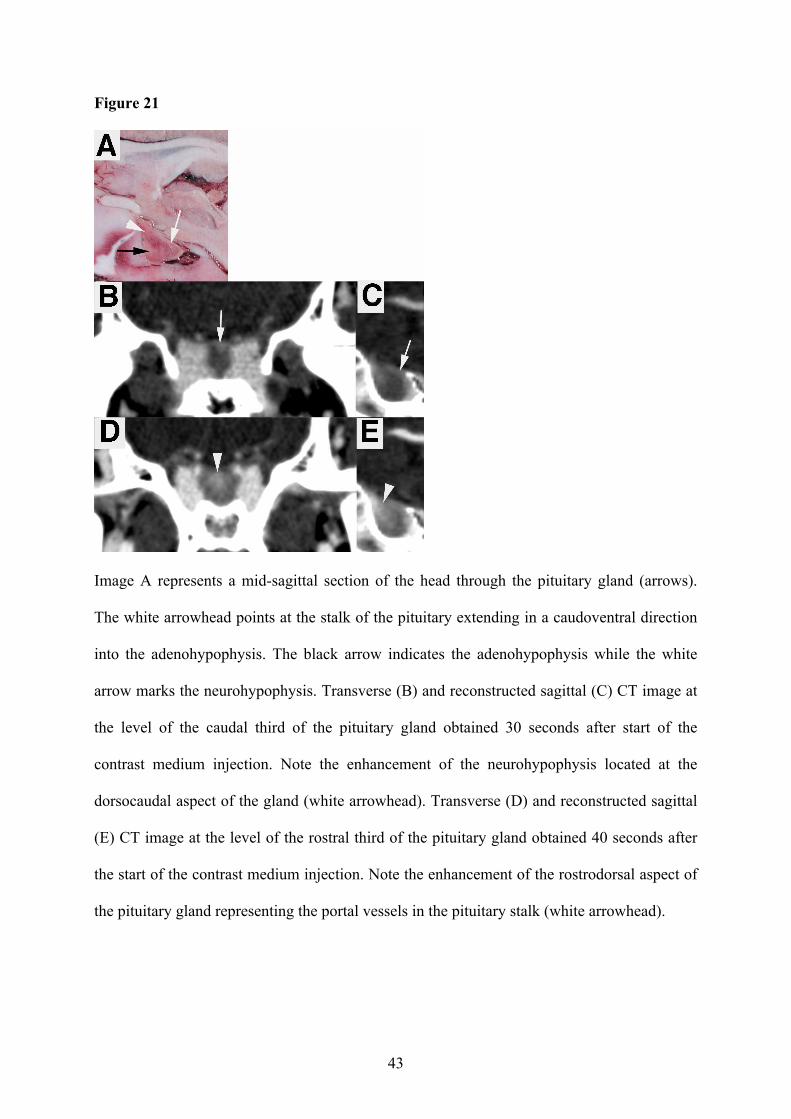
Figure 21
Image A represents a mid-sagittal section of the head through the pituitary gland (arrows).
The white arrowhead points at the stalk of the pituitary extending in a caudoventral direction
into the adenohypophysis. The black arrow indicates the adenohypophysis while the white
arrow marks the neurohypophysis. Transverse (B) and reconstructed sagittal (C) CT image at
the level of the caudal third of the pituitary gland obtained 30 seconds after start of the
contrast medium injection. Note the enhancement of the neurohypophysis located at the
dorsocaudal aspect of the gland (white arrowhead). Transverse (D) and reconstructed sagittal
(E) CT image at the level of the rostral third of the pituitary gland obtained 40 seconds after
the start of the contrast medium injection. Note the enhancement of the rostrodorsal aspect of
the pituitary gland representing the portal vessels in the pituitary stalk (white arrowhead).

44
Acknowledgements
I am most grateful for getting the chance to do a doctoral thesis under the supervision of Prof.
Dr. U. Braun and PD Dr. S. Ohlerth.
Many thanks go to Prof. Dr. H. Augsburger and U. Müller for the support with the anatomic
sections, the photographic work and the image labelling.
Such a work would have not been possible without the strong support of co-workers.
Therefore, I owe a thousand thanks to Dr. M. Becker-Birck, Dr. M. Irmer, Dr. K. Steininger,
Dr. D. Jaquat, Dr. A. Tschuor, Dr. R. Jud and the radiology technicians.
I also thank Prof. Dr. H. Lutz for the blood examinations and Prof. Dr. P. Deplazes for the
parasitological examinations.
Many thanks go to my family and to everybody not mentioned in particular, for adding to the
success of this work, for their mental support and for their friendship.
45
Curriculum vitae
Name Makara, Mariano Andrés
Date of birth June 27, 1975
Place of birth Buenos Aires, Argentina
Nationality Argentina
1988 – 1992 Primary and High school (Quilmes High School), Buenos Aires,
Argentina (a bilingual English school)
Degree: „Bachiller Bilingüe con Orientatión en Ciencias y Letras“
Additional qualifications: „International General Certificate of
Secondary Education (Cambridge University)
1993 – 1999 Universidad Nacional de La Plata (National University of La
Plata) Buenos Aires, Argentina
Degree: Medico Veterinario
1999 – 2002 Assistant Professor, Physiology Department, National University
of La Plata, Buenos Aires, Argentina
1999 – 2004 Assistant Position in small animals and diagnostic imaging,
private practice of Dr. Olga Den Toom, Olivos, Argentina
2005 – 2007 Internship in diagnostic imaging (Mentor Prof. Dr. J. Morgan),
Ross University, Dominica, West Indies, USA
2007 – 2010 Doctoral Thesis, Section of Diagnostic Imaging and Department
of Farm Animals, Vetsuisse Faculty, University of Zurich,
Switzerland
2007 – dato Resident ECVDI, Vetsuisse Faculty, University of Zurich,
Switzerland