Embed Size (px)
Citation preview
IBM Systems Group
© 2009 IBM Corporation
Dan Braden [email protected]
AIX Advanced Technical Support
http://w3.ibm.com/support/americas/pseries
Disk IO Tuning in AIX 6.1 and 5.3
June 1, 2009
2009 IBM Corporation
Agenda
The importance of IO tuning
The AIX IO stack
Data layout
Tools to characterize IO
Testing IO thruput
Tuning IO buffers
VMM tuning
Mount options
Asynchronous IO tuning
Queue depth tuning

2009 IBM Corporation
Moore's law
Processors double in price performance every 18 months
Disk growth
Disk densities are doubling every 12 months
Customers are doubling storage capacities every 12-18 months
Actuator and rotational speed increasing relatively slowly
Network bandwidth - doubling every 6 months
Why is disk IO tuning important?
Approximate CPU cycle time 0.0000000005 seconds
Approximate memory access time 0.000000270 seconds
Approximate disk access time 0.010000000 seconds
Memory access takes 540 CPU cycles
Disk access takes 20 million CPU cycles, or 37,037 memory accesses
System bottlenecks are being pushed to the disk
Disk subsystems are using cache to improve IO service times
Customers now spend more on storage than on servers
2009 IBM Corporation
Disk metrics
MB/s
IOPS
With a reasonable service time
Application metrics
Response time
Run time
System metrics
CPU, memory and IO
Size for your peak workloads
Size based on maximum sustainable thruputs
Bandwidth and thruput sometimes mean the same thing, sometimes
not
For tuning - it's good to have a short running job that's representative of
your workload
Performance metrics
2009 IBM Corporation
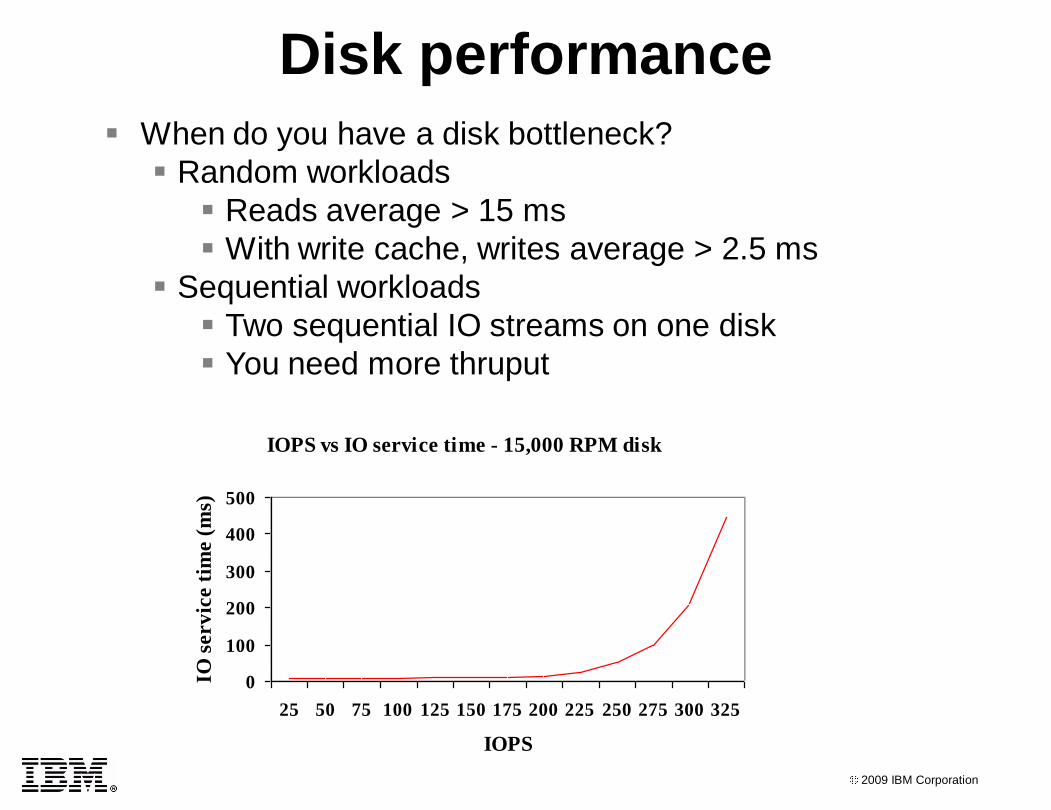
Disk performance
When do you have a disk bottleneck?
Random workloads
Reads average > 15 ms
With write cache, writes average > 2.5 ms
Sequential workloads
Two sequential IO streams on one disk
You need more thruput
IOPS vs IO service time - 15,000 RPM disk
0
100
200
300
400
500
25 50 75 100 125 150 175 200 225 250 275 300 325
IOPS
IO s
erv
ice t
ime (
ms)

2009 IBM Corporation
Application memory area caches data to
avoid IO
NFS caches file attributes
NFS has a cached filesystem for NFS clients
The AIX IO stack
JFS and JFS2 cache use extra system RAM
JFS uses persistent pages for cache
JFS2 uses client pages for cache
Queues exist for both adapters and disks
Adapter device drivers use DMA for IO
Disk subsystems have read and write cache
Disks have memory to store commands/data
IOs can be coalesced (good) or split up (bad) as they go thru the IO stack
IOs adjacent in a file/LV/disk can be coalesced
IOs greater than the maximum IO size supported will be split up
Write cache Read cache or memory area used for IO
Disk
Disk subsystem (optional)
Adapter Device Drivers
Disk Device Drivers
LVM (LVM device drivers)
Raw
disk
s
Raw
LV
s
Application
Logical file system
JFS JFS2 NFS Other
VMM
Multi-path IO driver (optional)
2009 IBM Corporation
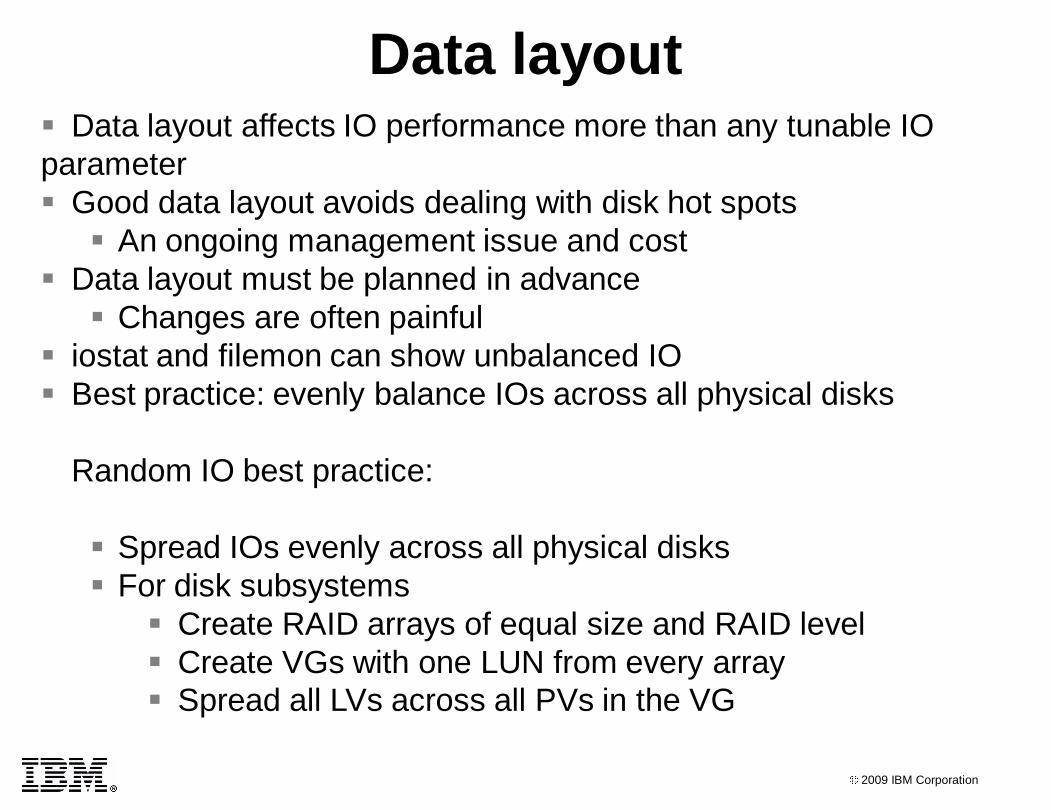
Data layout Data layout affects IO performance more than any tunable IO
parameter
Good data layout avoids dealing with disk hot spots
An ongoing management issue and cost
Data layout must be planned in advance
Changes are often painful
iostat and filemon can show unbalanced IO
Best practice: evenly balance IOs across all physical disks
Random IO best practice:
Spread IOs evenly across all physical disks
For disk subsystems
Create RAID arrays of equal size and RAID level
Create VGs with one LUN from every array
Spread all LVs across all PVs in the VG
2009 IBM Corporation
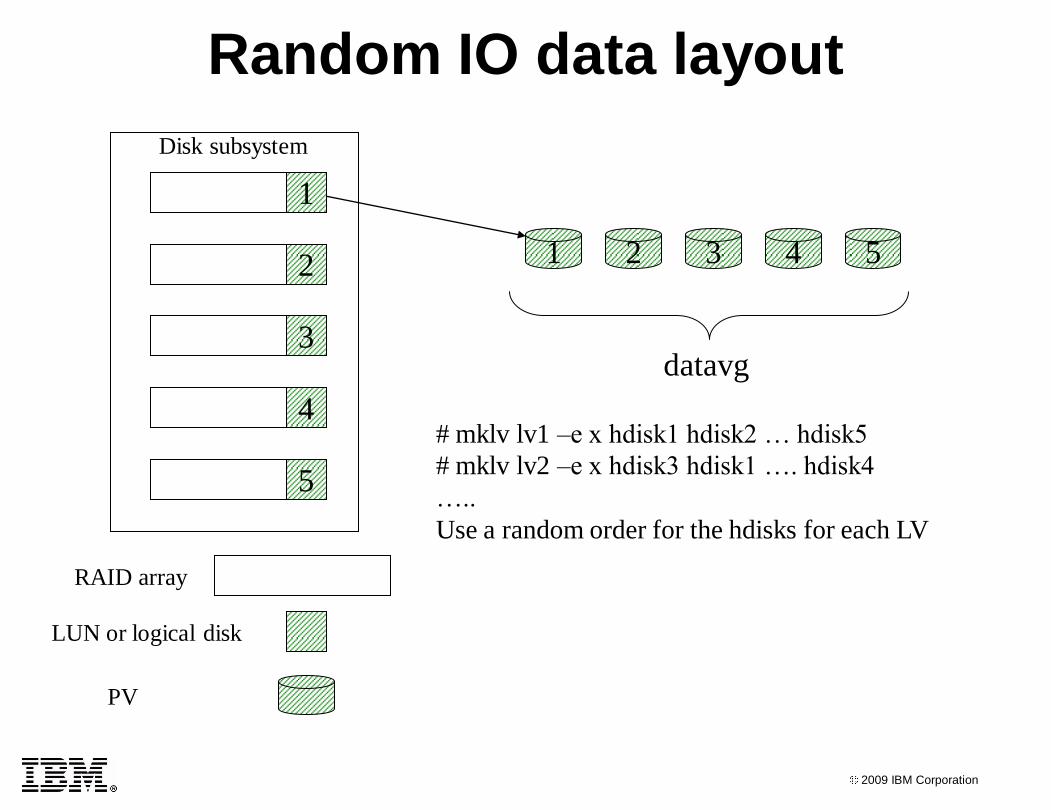
Random IO data layout
RAID array
LUN or logical disk
1
2
3
4
5
1
PV
2 3 4 5
datavg
# mklv lv1 –e x hdisk1 hdisk2 … hdisk5
# mklv lv2 –e x hdisk3 hdisk1 …. hdisk4
…..
Use a random order for the hdisks for each LV
Disk subsystem
2009 IBM Corporation
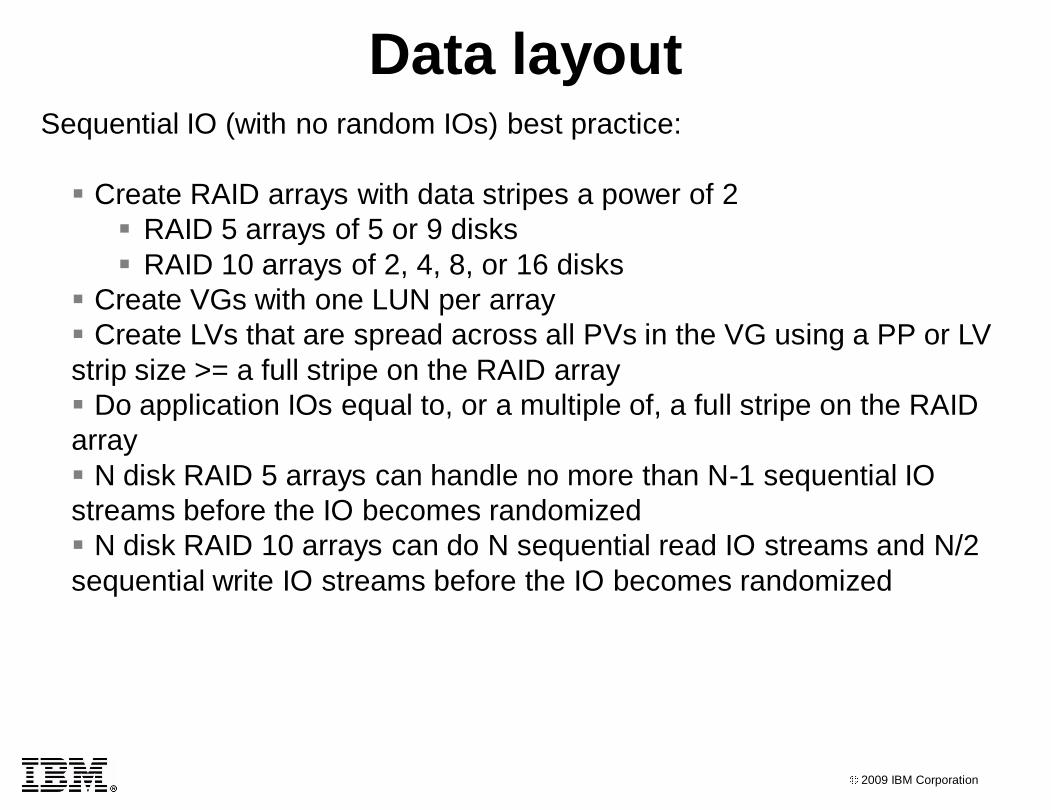
Data layoutSequential IO (with no random IOs) best practice:
Create RAID arrays with data stripes a power of 2
RAID 5 arrays of 5 or 9 disks
RAID 10 arrays of 2, 4, 8, or 16 disks
Create VGs with one LUN per array
Create LVs that are spread across all PVs in the VG using a PP or LV
strip size >= a full stripe on the RAID array
Do application IOs equal to, or a multiple of, a full stripe on the RAID
array
N disk RAID 5 arrays can handle no more than N-1 sequential IO
streams before the IO becomes randomized
N disk RAID 10 arrays can do N sequential read IO streams and N/2
sequential write IO streams before the IO becomes randomized
2009 IBM Corporation
Data layoutRandom and sequential mix best practice:
Use the random IO best practices
If the sequential rate isn’t high treat it as random
Determine sequential IO rates to a LV with lvmstat (covered later)
2009 IBM Corporation
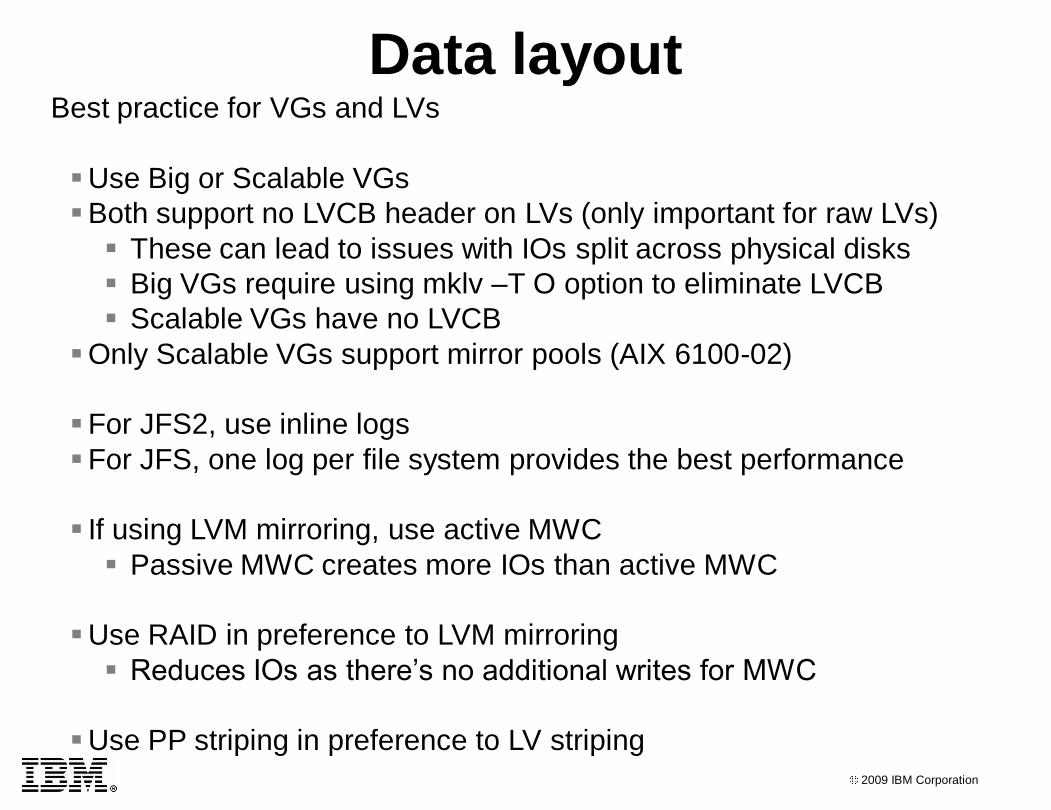
Data layoutBest practice for VGs and LVs
Use Big or Scalable VGs
Both support no LVCB header on LVs (only important for raw LVs)
These can lead to issues with IOs split across physical disks
Big VGs require using mklv –T O option to eliminate LVCB
Scalable VGs have no LVCB
Only Scalable VGs support mirror pools (AIX 6100-02)
For JFS2, use inline logs
For JFS, one log per file system provides the best performance
If using LVM mirroring, use active MWC
Passive MWC creates more IOs than active MWC
Use RAID in preference to LVM mirroring
Reduces IOs as there’s no additional writes for MWC
Use PP striping in preference to LV striping
2009 IBM Corporation
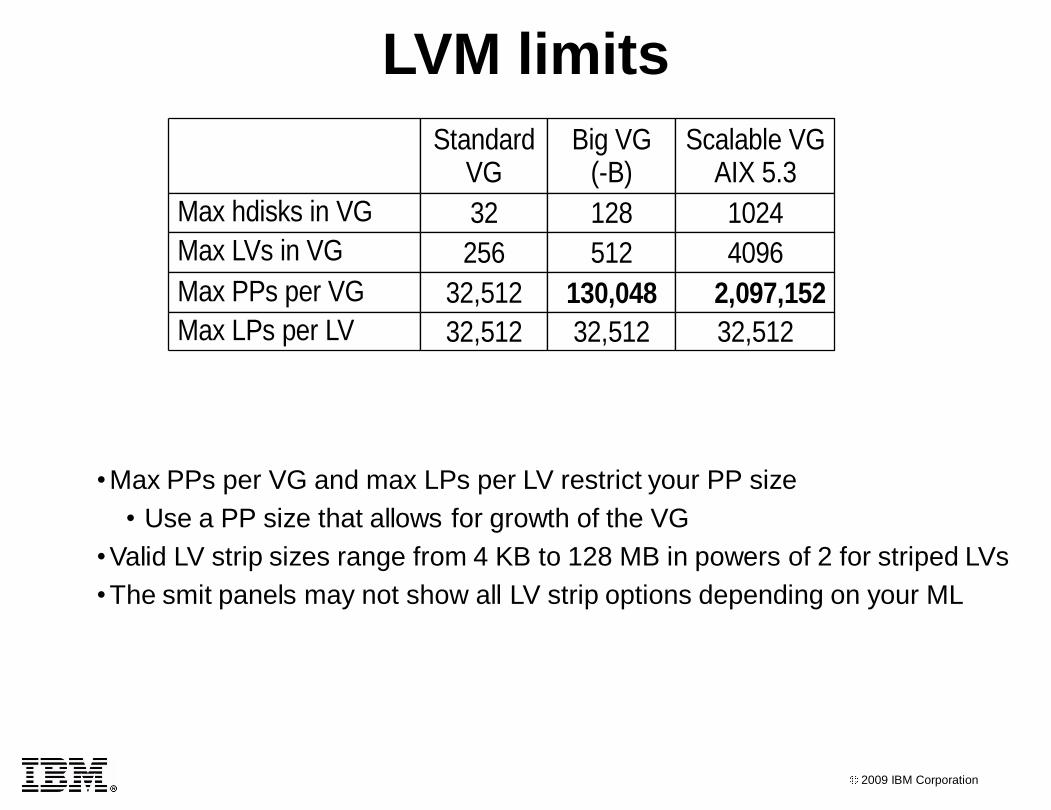
LVM limits
Standard VG
Big VG (-B)
Scalable VGAIX 5.3
Max hdisks in VG 32 128 1024
Max LVs in VG 256 512 4096
Max PPs per VG 32,512 130,048 2,097,152
Max LPs per LV 32,512 32,512 32,512
•Max PPs per VG and max LPs per LV restrict your PP size
• Use a PP size that allows for growth of the VG
•Valid LV strip sizes range from 4 KB to 128 MB in powers of 2 for striped LVs
•The smit panels may not show all LV strip options depending on your ML

2009 IBM Corporation
Application IO characteristics Random IO
Typically small (4-32 KB)
Measure and size with IOPS
Usually disk actuator limited
Sequential IO
Typically large (32KB and up)
Measure and size with MB/s
Usually limited on the interconnect to the disk actuators
To determine application IO characteristics
Use filemon
# filemon –o /tmp/filemon.out –O lv,pv –T 500000; sleep 90; trcstop
or at AIX 6.1# filemon –o /tmp/filemon.out –O lv,pv,detailed –T 500000; sleep 90; trcstop
Check for trace buffer wraparounds which may invalidate the data, run
filemon with a larger –T value or shorter sleep
Use lvmstat to get LV IO statistics
Use iostat to get PV IO statistics
2009 IBM Corporation
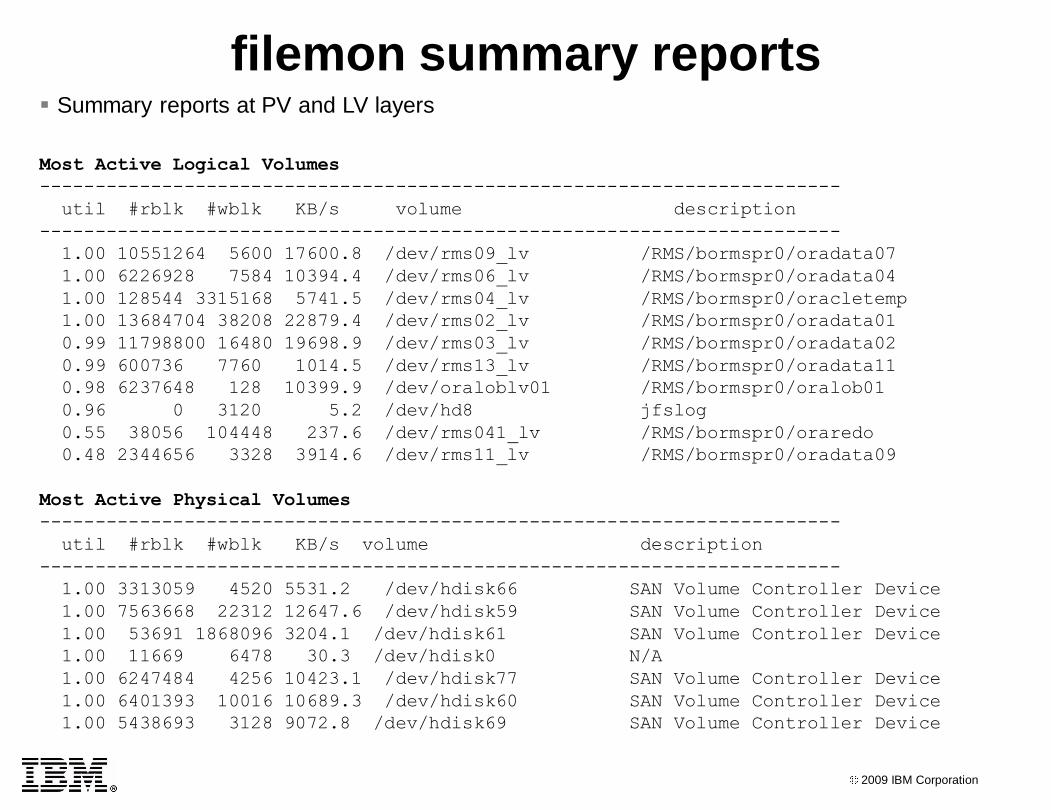
Summary reports at PV and LV layers
Most Active Logical Volumes
------------------------------------------------------------------------
util #rblk #wblk KB/s volume description
------------------------------------------------------------------------
1.00 10551264 5600 17600.8 /dev/rms09_lv /RMS/bormspr0/oradata07
1.00 6226928 7584 10394.4 /dev/rms06_lv /RMS/bormspr0/oradata04
1.00 128544 3315168 5741.5 /dev/rms04_lv /RMS/bormspr0/oracletemp
1.00 13684704 38208 22879.4 /dev/rms02_lv /RMS/bormspr0/oradata01
0.99 11798800 16480 19698.9 /dev/rms03_lv /RMS/bormspr0/oradata02
0.99 600736 7760 1014.5 /dev/rms13_lv /RMS/bormspr0/oradata11
0.98 6237648 128 10399.9 /dev/oraloblv01 /RMS/bormspr0/oralob01
0.96 0 3120 5.2 /dev/hd8 jfslog
0.55 38056 104448 237.6 /dev/rms041_lv /RMS/bormspr0/oraredo
0.48 2344656 3328 3914.6 /dev/rms11_lv /RMS/bormspr0/oradata09
Most Active Physical Volumes
------------------------------------------------------------------------
util #rblk #wblk KB/s volume description
------------------------------------------------------------------------
1.00 3313059 4520 5531.2 /dev/hdisk66 SAN Volume Controller Device
1.00 7563668 22312 12647.6 /dev/hdisk59 SAN Volume Controller Device
1.00 53691 1868096 3204.1 /dev/hdisk61 SAN Volume Controller Device
1.00 11669 6478 30.3 /dev/hdisk0 N/A
1.00 6247484 4256 10423.1 /dev/hdisk77 SAN Volume Controller Device
1.00 6401393 10016 10689.3 /dev/hdisk60 SAN Volume Controller Device
1.00 5438693 3128 9072.8 /dev/hdisk69 SAN Volume Controller Device
filemon summary reports
2009 IBM Corporation
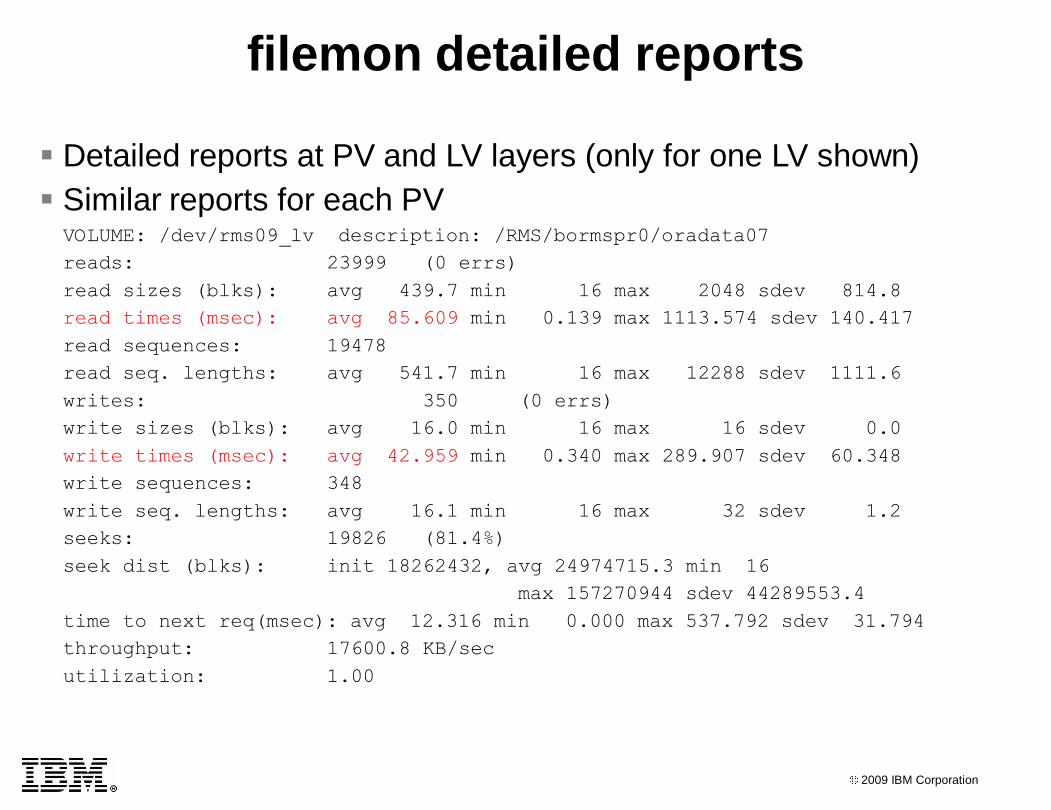
Detailed reports at PV and LV layers (only for one LV shown)
Similar reports for each PVVOLUME: /dev/rms09_lv description: /RMS/bormspr0/oradata07
reads: 23999 (0 errs)
read sizes (blks): avg 439.7 min 16 max 2048 sdev 814.8
read times (msec): avg 85.609 min 0.139 max 1113.574 sdev 140.417
read sequences: 19478
read seq. lengths: avg 541.7 min 16 max 12288 sdev 1111.6
writes: 350 (0 errs)
write sizes (blks): avg 16.0 min 16 max 16 sdev 0.0
write times (msec): avg 42.959 min 0.340 max 289.907 sdev 60.348
write sequences: 348
write seq. lengths: avg 16.1 min 16 max 32 sdev 1.2
seeks: 19826 (81.4%)
seek dist (blks): init 18262432, avg 24974715.3 min 16
max 157270944 sdev 44289553.4
time to next req(msec): avg 12.316 min 0.000 max 537.792 sdev 31.794
throughput: 17600.8 KB/sec
utilization: 1.00
filemon detailed reports
2009 IBM Corporation
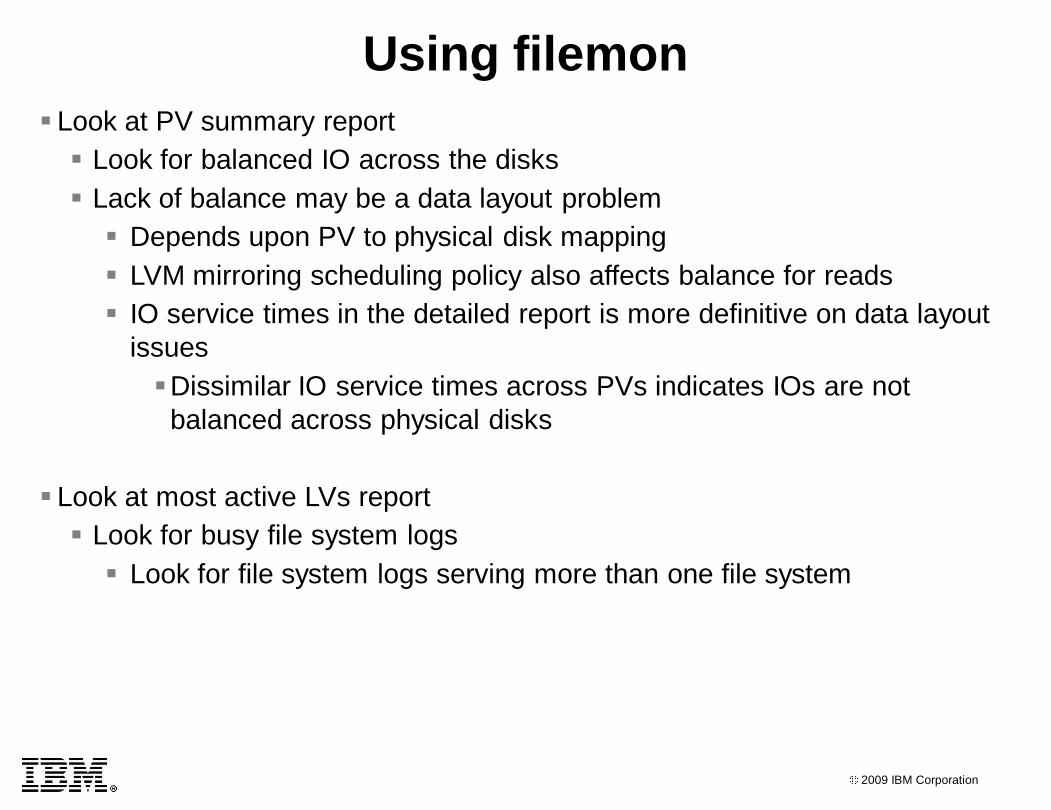
Look at PV summary report
Look for balanced IO across the disks
Lack of balance may be a data layout problem
Depends upon PV to physical disk mapping
LVM mirroring scheduling policy also affects balance for reads
IO service times in the detailed report is more definitive on data layout
issues
Dissimilar IO service times across PVs indicates IOs are not
balanced across physical disks
Look at most active LVs report
Look for busy file system logs
Look for file system logs serving more than one file system
Using filemon
2009 IBM Corporation
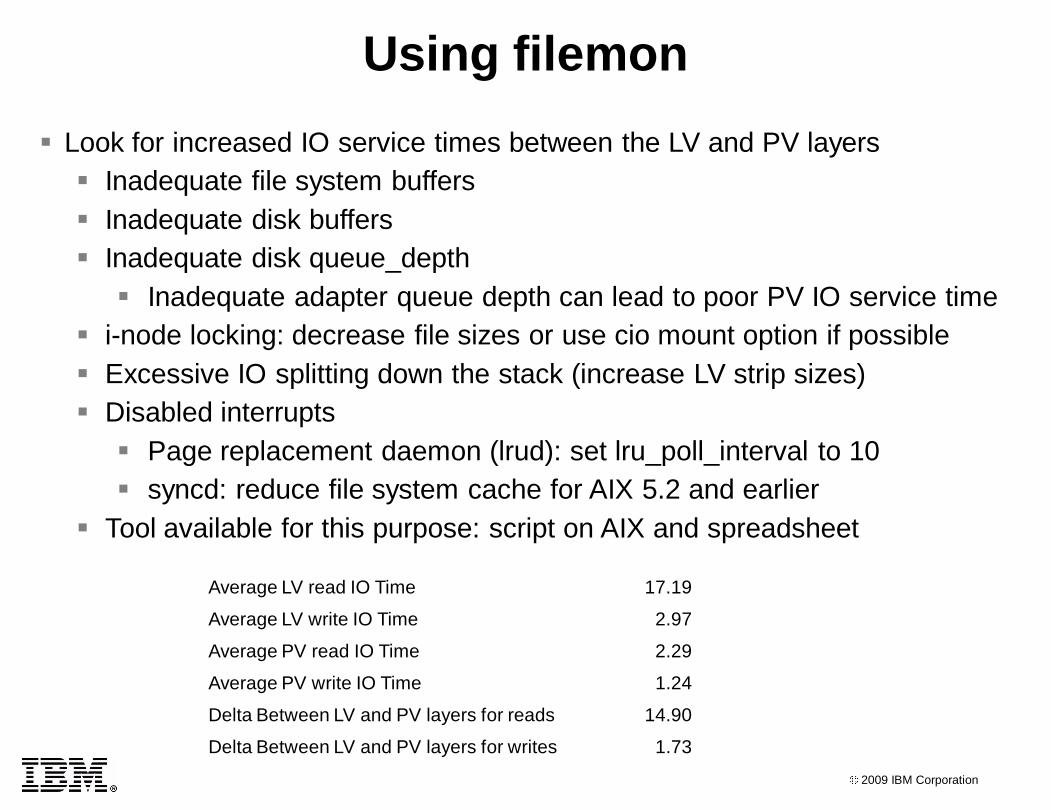
Look for increased IO service times between the LV and PV layers
Inadequate file system buffers
Inadequate disk buffers
Inadequate disk queue_depth
Inadequate adapter queue depth can lead to poor PV IO service time
i-node locking: decrease file sizes or use cio mount option if possible
Excessive IO splitting down the stack (increase LV strip sizes)
Disabled interrupts
Page replacement daemon (lrud): set lru_poll_interval to 10
syncd: reduce file system cache for AIX 5.2 and earlier
Tool available for this purpose: script on AIX and spreadsheet
Using filemon
Average LV read IO Time 17.19
Average LV write IO Time 2.97
Average PV read IO Time 2.29
Average PV write IO Time 1.24
Delta Between LV and PV layers for reads 14.90
Delta Between LV and PV layers for writes 1.73
2009 IBM Corporation
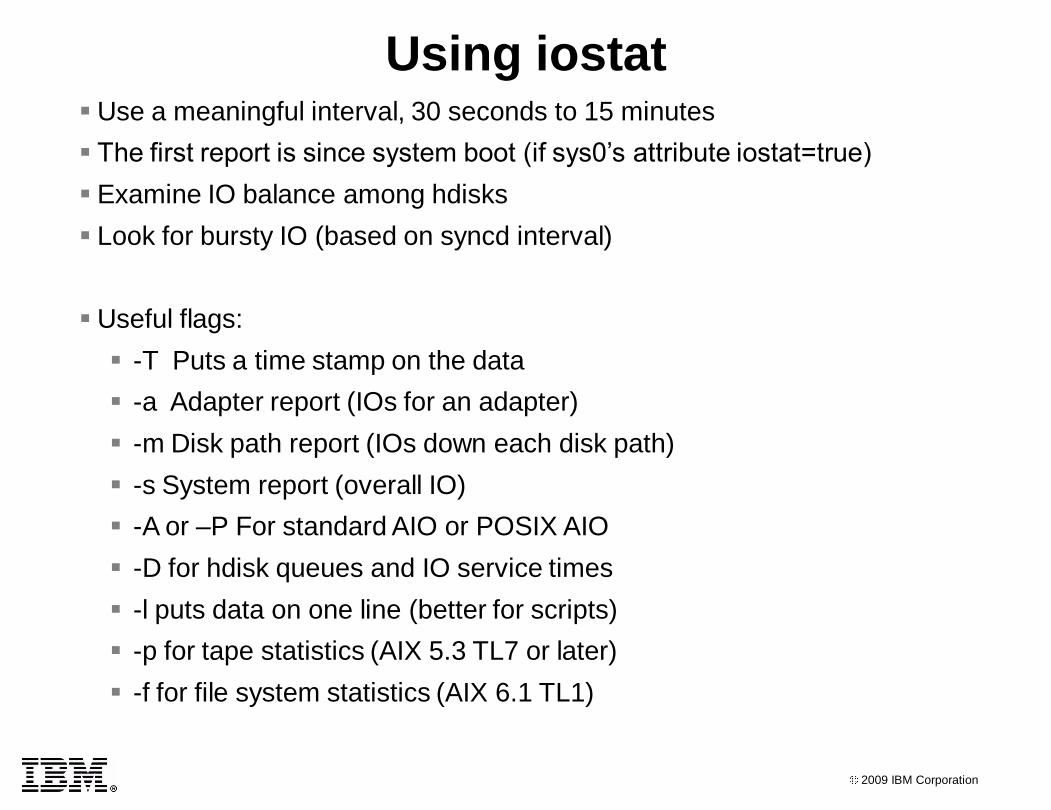
Using iostat Use a meaningful interval, 30 seconds to 15 minutes
The first report is since system boot (if sys0’s attribute iostat=true)
Examine IO balance among hdisks
Look for bursty IO (based on syncd interval)
Useful flags:
-T Puts a time stamp on the data
-a Adapter report (IOs for an adapter)
-m Disk path report (IOs down each disk path)
-s System report (overall IO)
-A or –P For standard AIO or POSIX AIO
-D for hdisk queues and IO service times
-l puts data on one line (better for scripts)
-p for tape statistics (AIX 5.3 TL7 or later)
-f for file system statistics (AIX 6.1 TL1)
2009 IBM Corporation
Using iostat
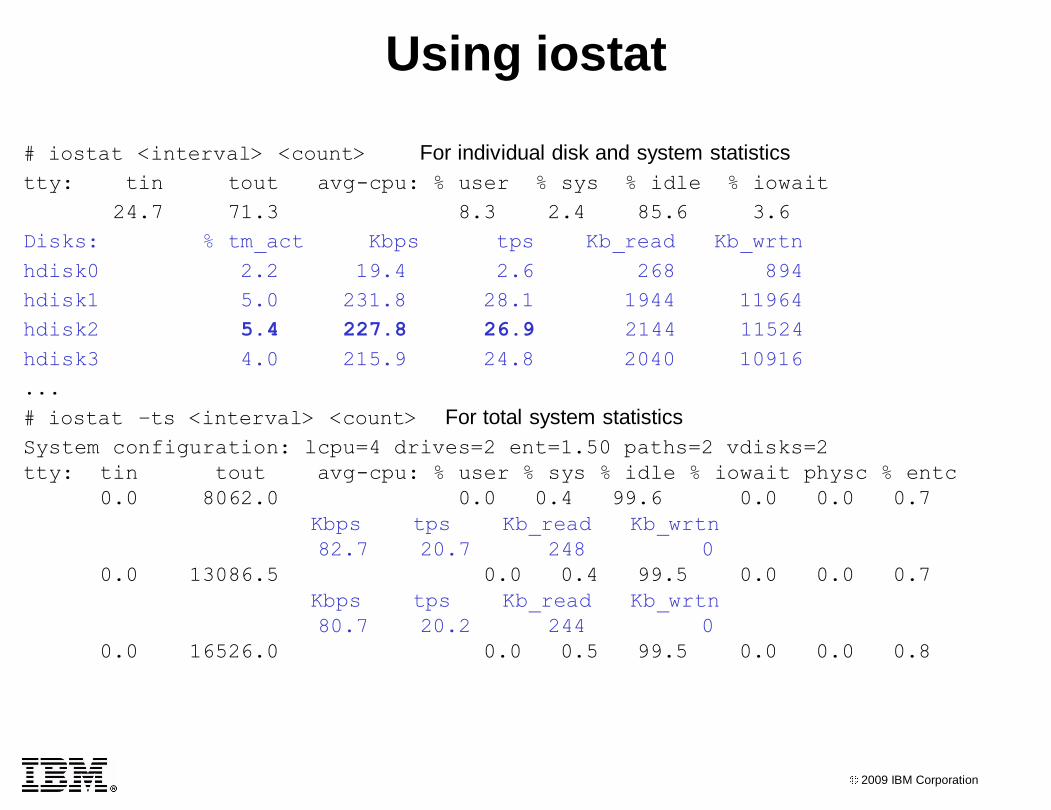
# iostat <interval> <count> For individual disk and system statistics
tty: tin tout avg-cpu: % user % sys % idle % iowait
24.7 71.3 8.3 2.4 85.6 3.6
Disks: % tm_act Kbps tps Kb_read Kb_wrtn
hdisk0 2.2 19.4 2.6 268 894
hdisk1 5.0 231.8 28.1 1944 11964
hdisk2 5.4 227.8 26.9 2144 11524
hdisk3 4.0 215.9 24.8 2040 10916
...
# iostat –ts <interval> <count> For total system statistics
System configuration: lcpu=4 drives=2 ent=1.50 paths=2 vdisks=2
tty: tin tout avg-cpu: % user % sys % idle % iowait physc % entc
0.0 8062.0 0.0 0.4 99.6 0.0 0.0 0.7
Kbps tps Kb_read Kb_wrtn
82.7 20.7 248 0
0.0 13086.5 0.0 0.4 99.5 0.0 0.0 0.7
Kbps tps Kb_read Kb_wrtn
80.7 20.2 244 0
0.0 16526.0 0.0 0.5 99.5 0.0 0.0 0.8
2009 IBM Corporation
Percent of time the CPU is idle and waiting on an IO so it can do some
more work
High %iowait does not necessarily indicate a disk bottleneck
Your application could be IO intensive, e.g. a backup
You can make %iowait go to 0 by adding CPU intensive jobs
Low %iowait does not necessarily mean you don't have a disk bottleneck
The CPUs can be busy while IOs are taking unreasonably long times
Conclusion: %iowait is a misleading indicator of disk performance
What is %iowait?
2009 IBM Corporation
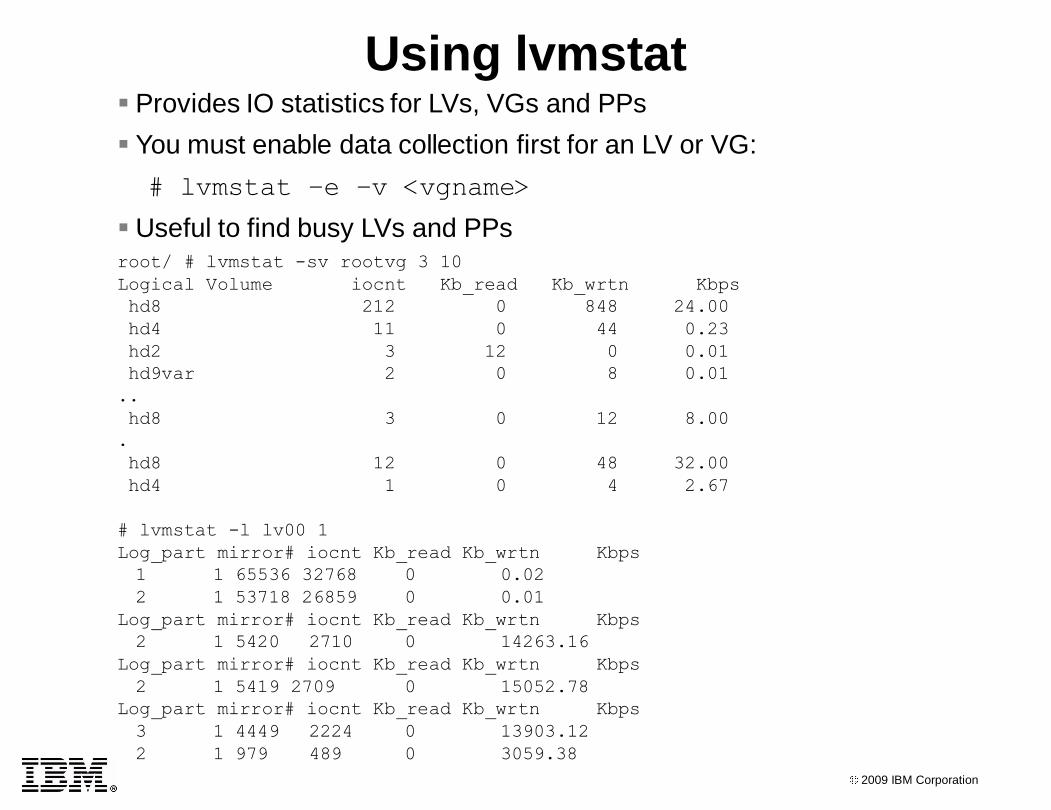
Using lvmstat Provides IO statistics for LVs, VGs and PPs
You must enable data collection first for an LV or VG:
# lvmstat –e –v <vgname>
Useful to find busy LVs and PPs root/ # lvmstat -sv rootvg 3 10
Logical Volume iocnt Kb_read Kb_wrtn Kbps
hd8 212 0 848 24.00
hd4 11 0 44 0.23
hd2 3 12 0 0.01
hd9var 2 0 8 0.01
..
hd8 3 0 12 8.00
.
hd8 12 0 48 32.00
hd4 1 0 4 2.67
# lvmstat -l lv00 1
Log_part mirror# iocnt Kb_read Kb_wrtn Kbps
1 1 65536 32768 0 0.02
2 1 53718 26859 0 0.01
Log_part mirror# iocnt Kb_read Kb_wrtn Kbps
2 1 5420 2710 0 14263.16
Log_part mirror# iocnt Kb_read Kb_wrtn Kbps
2 1 5419 2709 0 15052.78
Log_part mirror# iocnt Kb_read Kb_wrtn Kbps
3 1 4449 2224 0 13903.12
2 1 979 489 0 3059.38
2009 IBM Corporation
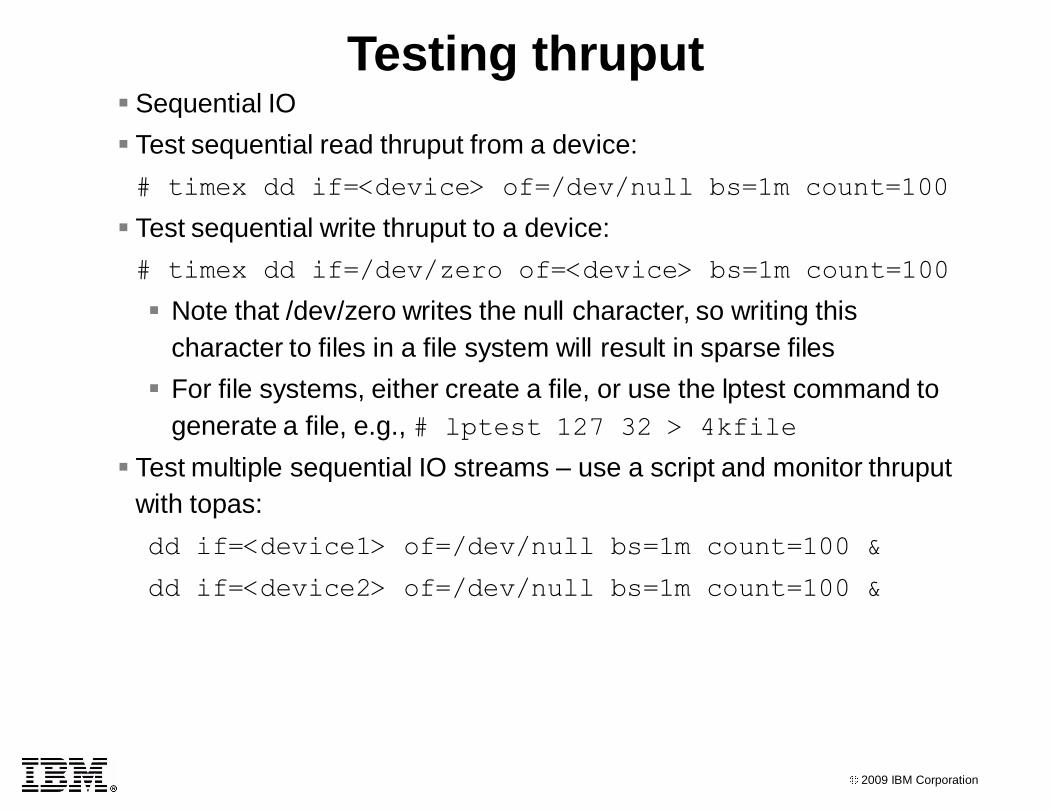
Testing thruput Sequential IO
Test sequential read thruput from a device:
# timex dd if=<device> of=/dev/null bs=1m count=100
Test sequential write thruput to a device:
# timex dd if=/dev/zero of=<device> bs=1m count=100
Note that /dev/zero writes the null character, so writing this
character to files in a file system will result in sparse files
For file systems, either create a file, or use the lptest command to
generate a file, e.g., # lptest 127 32 > 4kfile
Test multiple sequential IO streams – use a script and monitor thruput
with topas:
dd if=<device1> of=/dev/null bs=1m count=100 &
dd if=<device2> of=/dev/null bs=1m count=100 &
2009 IBM Corporation
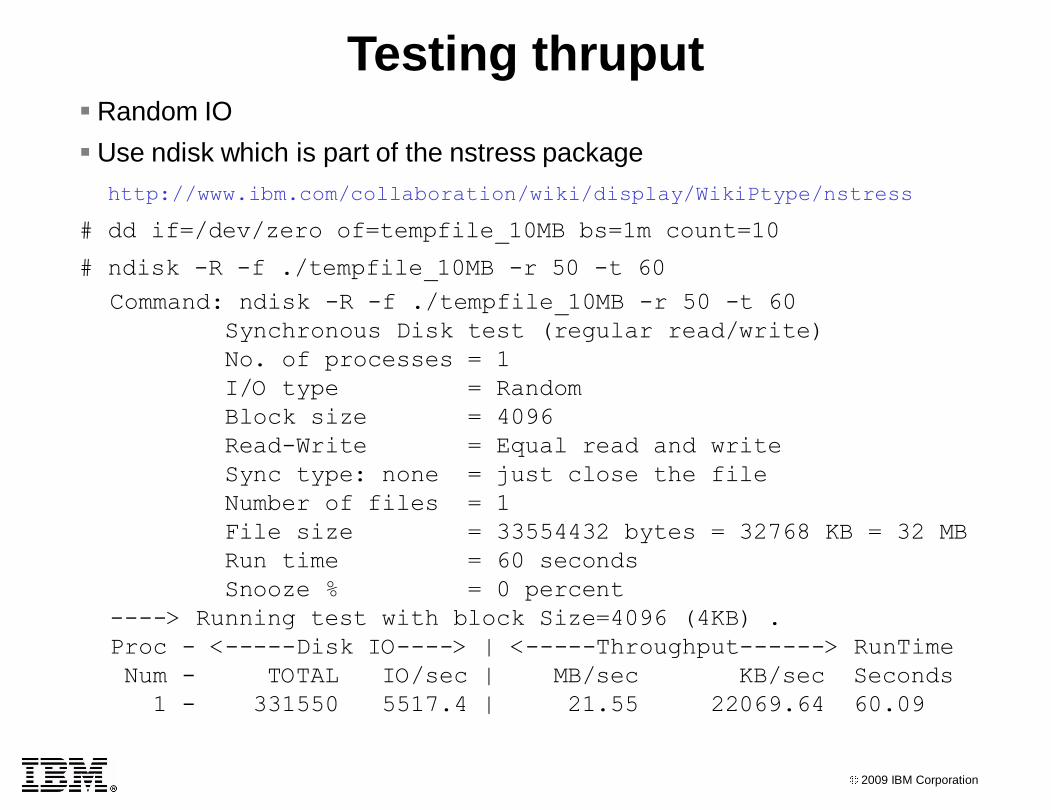
Testing thruput Random IO
Use ndisk which is part of the nstress package
http://www.ibm.com/collaboration/wiki/display/WikiPtype/nstress
# dd if=/dev/zero of=tempfile_10MB bs=1m count=10
# ndisk -R -f ./tempfile_10MB -r 50 -t 60
Command: ndisk -R -f ./tempfile_10MB -r 50 -t 60
Synchronous Disk test (regular read/write)
No. of processes = 1
I/O type = Random
Block size = 4096
Read-Write = Equal read and write
Sync type: none = just close the file
Number of files = 1
File size = 33554432 bytes = 32768 KB = 32 MB
Run time = 60 seconds
Snooze % = 0 percent
----> Running test with block Size=4096 (4KB) .
Proc - <-----Disk IO----> | <-----Throughput------> RunTime
Num - TOTAL IO/sec | MB/sec KB/sec Seconds
1 - 331550 5517.4 | 21.55 22069.64 60.09
2009 IBM Corporation
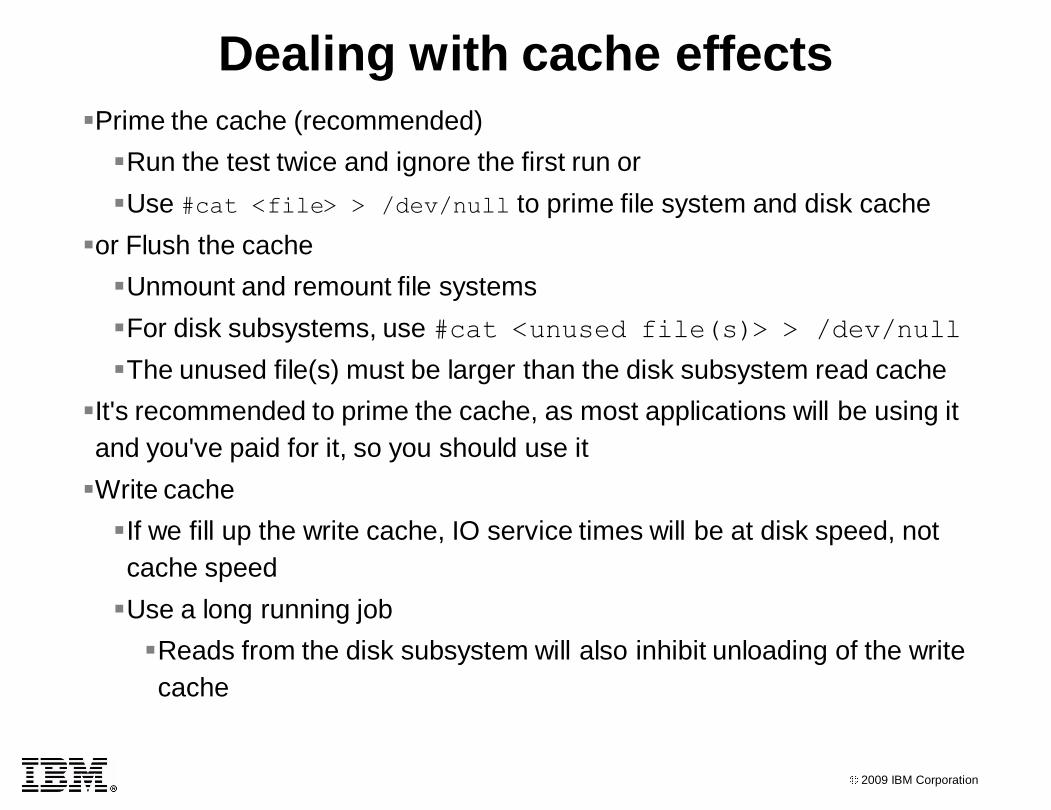
Dealing with cache effects
Prime the cache (recommended)
Run the test twice and ignore the first run or
Use #cat <file> > /dev/null to prime file system and disk cache
or Flush the cache
Unmount and remount file systems
For disk subsystems, use #cat <unused file(s)> > /dev/null
The unused file(s) must be larger than the disk subsystem read cache
It's recommended to prime the cache, as most applications will be using it
and you've paid for it, so you should use it
Write cache
If we fill up the write cache, IO service times will be at disk speed, not
cache speed
Use a long running job
Reads from the disk subsystem will also inhibit unloading of the write
cache
2009 IBM Corporation
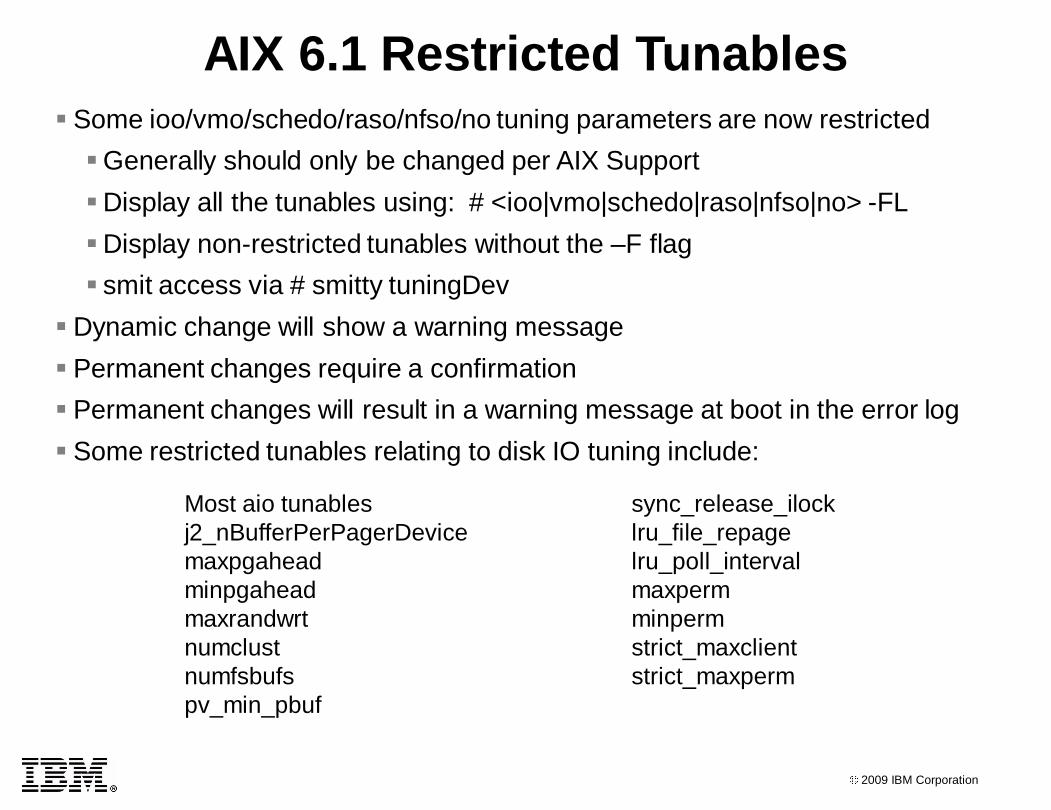
AIX 6.1 Restricted Tunables
Some ioo/vmo/schedo/raso/nfso/no tuning parameters are now restricted
Generally should only be changed per AIX Support
Display all the tunables using: # <ioo|vmo|schedo|raso|nfso|no> -FL
Display non-restricted tunables without the –F flag
smit access via # smitty tuningDev
Dynamic change will show a warning message
Permanent changes require a confirmation
Permanent changes will result in a warning message at boot in the error log
Some restricted tunables relating to disk IO tuning include:
Most aio tunables
j2_nBufferPerPagerDevice
maxpgahead
minpgahead
maxrandwrt
numclust
numfsbufs
pv_min_pbuf
sync_release_ilock
lru_file_repage
lru_poll_interval
maxperm
minperm
strict_maxclient
strict_maxperm
2009 IBM Corporation
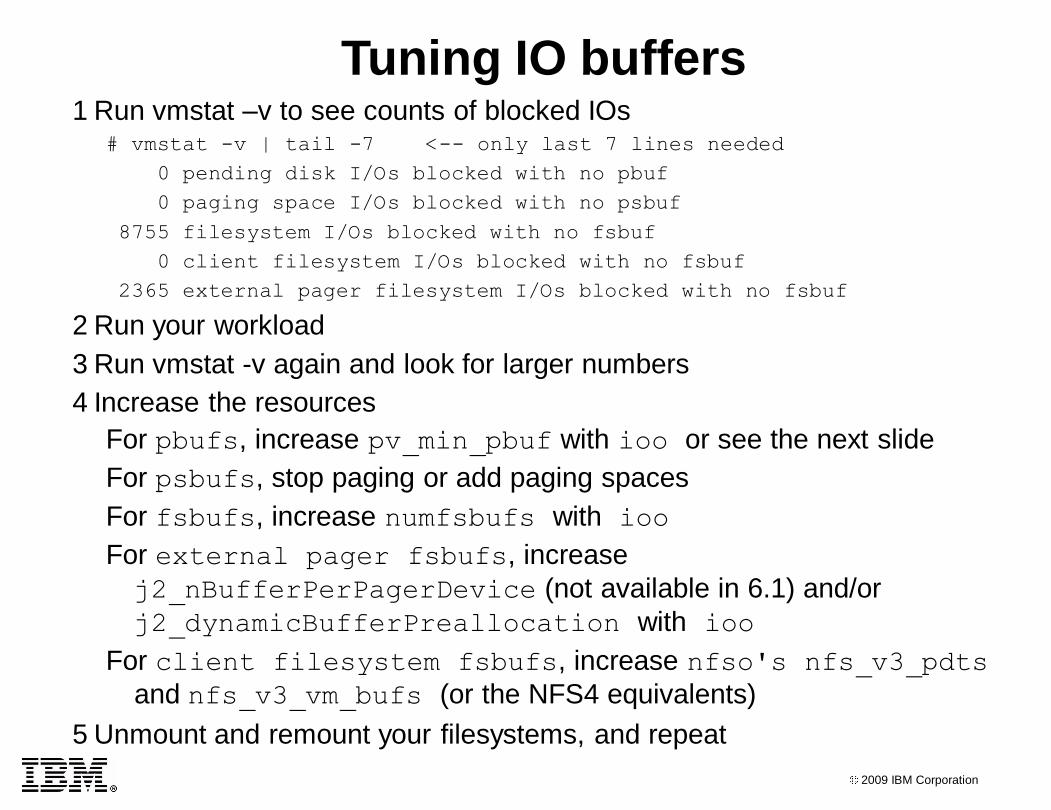
1 Run vmstat –v to see counts of blocked IOs# vmstat -v | tail -7 <-- only last 7 lines needed
0 pending disk I/Os blocked with no pbuf
0 paging space I/Os blocked with no psbuf
8755 filesystem I/Os blocked with no fsbuf
0 client filesystem I/Os blocked with no fsbuf
2365 external pager filesystem I/Os blocked with no fsbuf
2 Run your workload
3 Run vmstat -v again and look for larger numbers
4 Increase the resources
For pbufs, increase pv_min_pbuf with ioo or see the next slide
For psbufs, stop paging or add paging spaces
For fsbufs, increase numfsbufs with ioo
For external pager fsbufs, increase
j2_nBufferPerPagerDevice (not available in 6.1) and/or
j2_dynamicBufferPreallocation with ioo
For client filesystem fsbufs, increase nfso's nfs_v3_pdts
and nfs_v3_vm_bufs (or the NFS4 equivalents)
5 Unmount and remount your filesystems, and repeat
Tuning IO buffers
2009 IBM Corporation
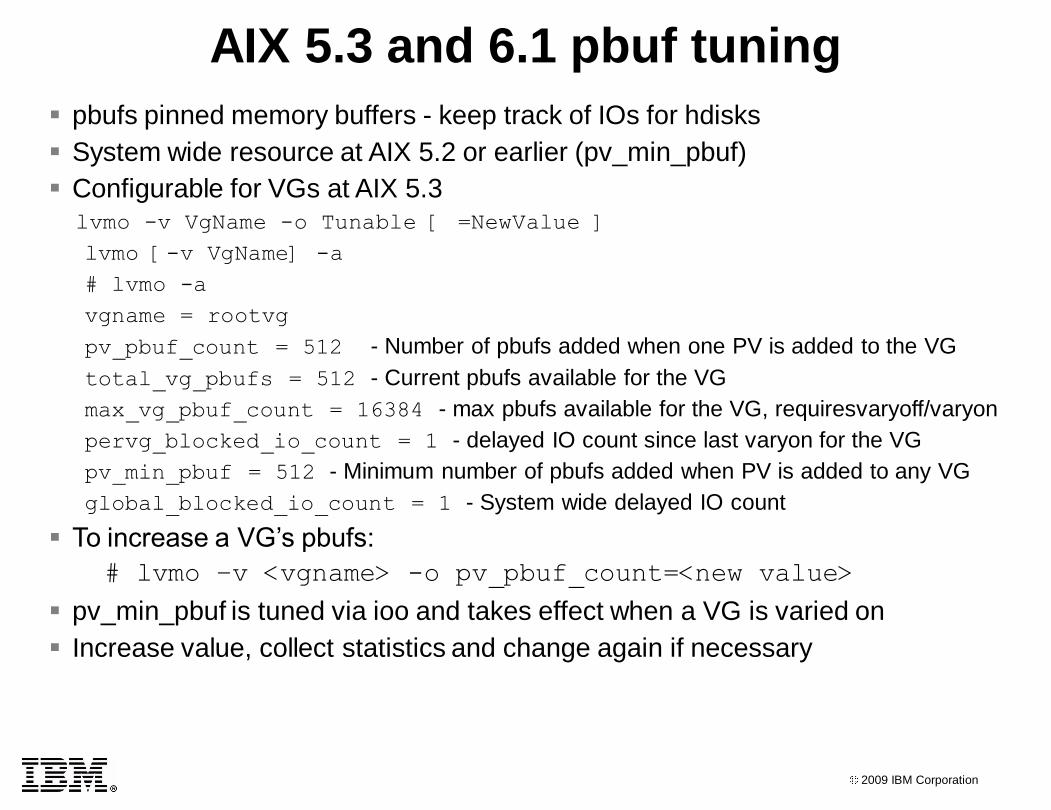
AIX 5.3 and 6.1 pbuf tuning
pbufs pinned memory buffers - keep track of IOs for hdisks
System wide resource at AIX 5.2 or earlier (pv_min_pbuf)
Configurable for VGs at AIX 5.3lvmo -v VgName -o Tunable [ =NewValue ]
lvmo [-v VgName] -a
# lvmo -a
vgname = rootvg
pv_pbuf_count = 512 - Number of pbufs added when one PV is added to the VG
total_vg_pbufs = 512 - Current pbufs available for the VG
max_vg_pbuf_count = 16384 - max pbufs available for the VG, requiresvaryoff/varyon
pervg_blocked_io_count = 1 - delayed IO count since last varyon for the VG
pv_min_pbuf = 512 - Minimum number of pbufs added when PV is added to any VG
global_blocked_io_count = 1 - System wide delayed IO count
To increase a VG’s pbufs:
# lvmo –v <vgname> -o pv_pbuf_count=<new value>
pv_min_pbuf is tuned via ioo and takes effect when a VG is varied on
Increase value, collect statistics and change again if necessary

2009 IBM Corporation
File system buffers at this layer
The AIX IO stack
Disk
Disk subsystem (optional)
Adapter Device Drivers
Disk Device Drivers
LVM (LVM device drivers)
Raw
disk
s
Raw
LV
s
Application
Logical file system
JFS JFS2 NFS Other
VMM
Write cache Read cache or memory area used for IO
Disk buffers, pbufs, at this layer
Multi-path IO driver (optional)
2009 IBM Corporation
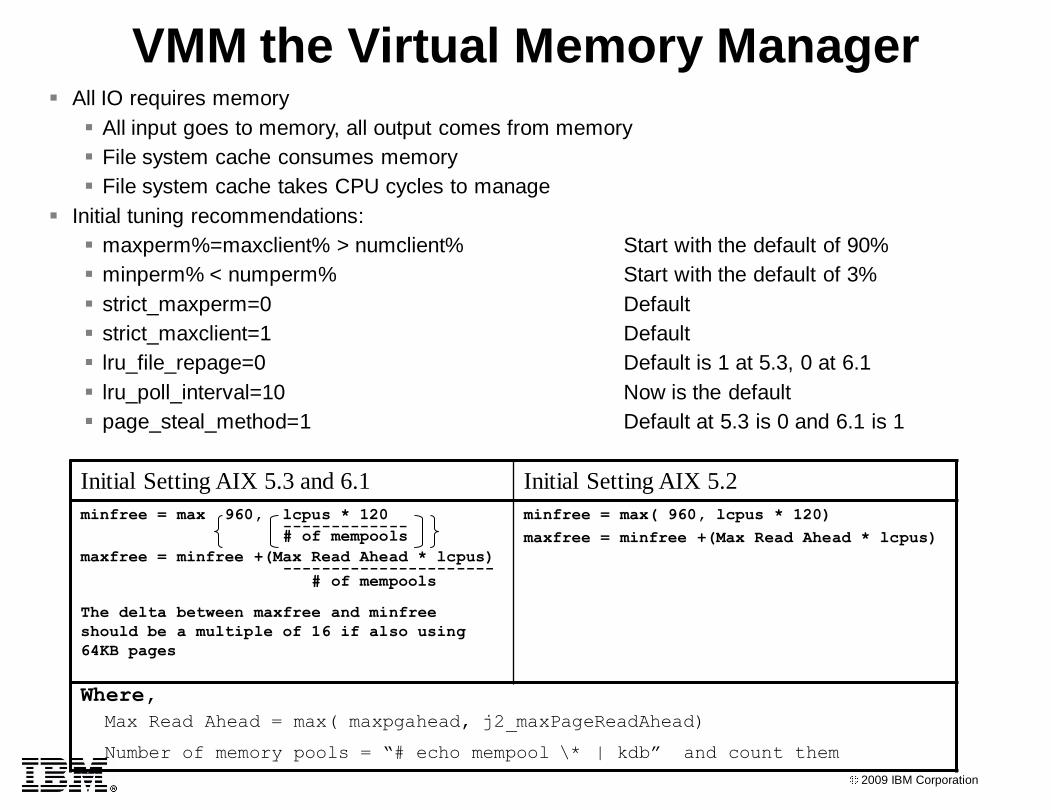
VMM the Virtual Memory Manager All IO requires memory
All input goes to memory, all output comes from memory
File system cache consumes memory
File system cache takes CPU cycles to manage
Initial tuning recommendations:
maxperm%=maxclient% > numclient% Start with the default of 90%
minperm% < numperm% Start with the default of 3%
strict_maxperm=0 Default
strict_maxclient=1 Default
lru_file_repage=0 Default is 1 at 5.3, 0 at 6.1
lru_poll_interval=10 Now is the default
page_steal_method=1 Default at 5.3 is 0 and 6.1 is 1
Initial Setting AIX 5.3 and 6.1 Initial Setting AIX 5.2
minfree = max 960, lcpus * 120 -------------# of mempools
maxfree = minfree +(Max Read Ahead * lcpus) ----------------------
# of mempools
The delta between maxfree and minfree
should be a multiple of 16 if also using
64KB pages
minfree = max( 960, lcpus * 120)
maxfree = minfree +(Max Read Ahead * lcpus)
Where,
Max Read Ahead = max( maxpgahead, j2_maxPageReadAhead)
Number of memory pools = “# echo mempool \* | kdb” and count them
2009 IBM Corporation
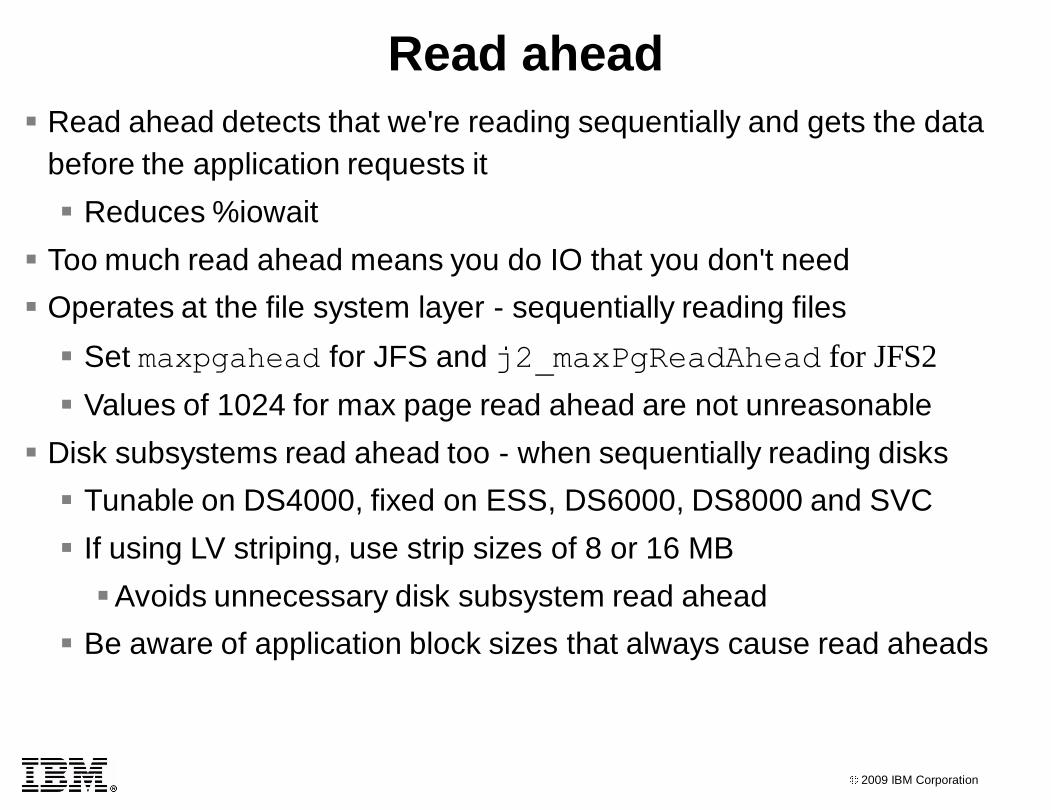
Read ahead detects that we're reading sequentially and gets the data
before the application requests it
Reduces %iowait
Too much read ahead means you do IO that you don't need
Operates at the file system layer - sequentially reading files
Set maxpgahead for JFS and j2_maxPgReadAhead for JFS2
Values of 1024 for max page read ahead are not unreasonable
Disk subsystems read ahead too - when sequentially reading disks
Tunable on DS4000, fixed on ESS, DS6000, DS8000 and SVC
If using LV striping, use strip sizes of 8 or 16 MB
Avoids unnecessary disk subsystem read ahead
Be aware of application block sizes that always cause read aheads
Read ahead
2009 IBM Corporation
Write behind tuning for sequential writes to a file
Tune numclust for JFS
Tune j2_nPagesPerWriteBehindCluster for JFS2
These represent 16 KB clusters
Larger values allow IO to be coalesced
When the specified number of sequential 16 KB clusters are updated, start
the IO to disk rather than wait for syncd
Write behind tuning for random writes to a file
Tune maxrandwrt for JFS
Tune j2_maxRandomWrite and j2_nRandomCluster for JFS2
Max number of random writes allowed to accumulate to a file before
additional IOs are flushed, default is 0 or off
j2_nRandomCluster specifies the number of clusters apart two
consecutive writes must be in order to be considered random
If you have bursty IO, consider using write behind to smooth out the IO rate
Write behind
2009 IBM Corporation
More on write behind and syncd syncd - system wide file system cache flushing
Historical Unix feature to improve performance
Applies to asynchronous IOs (not necessarily aio)
inode is locked when each file is synced
There is a tradeoff:
Longer intervals allow more IO to be coalesced
Longer intervals can:
Create bursty IO
Bursty IO can slow down other IO
Increased IOPS reduces IO service times
AIX 5.3 keeps a list of dirty pages in cache (new feature)
There can be too much filesystem cache
Somewhere around 24 GB for pre-AIX 5.3
sync_release_ilock=1 releases inode lock during syncs, but not
recommended when creating/deleting many files in a short time
2009 IBM Corporation
No time for atime• Ingo Molnar (Linux kernel developer) said:
– "It's also perhaps the most stupid Unix design idea of all times. Unix is really nice and well done, but think about this a bit: 'For every file that is read from the disk, lets do a ... write to the disk! And, for every file that is already cached and which we read from the cache ... do a write to the disk!'"
• If you have a lot of file activity, you have to update a lot of timestamps– File timestamps
• File creation (ctime)
• File last modified time (mtime)
• File last access time (atime)
– New mount option noatime disables last access time updates for JFS2
– File systems with heavy inode access activity due to file opens can have significantperformance improvements
• First customer benchmark efix reported 35% improvement with DIO noatime mount (20K+ files)
• Most customers should expect much less for production environments
• APARs– IZ11282 AIX 5.3
– IZ13085 AIX 6.1
# mount –a rw,noatime /myfilesystem
2009 IBM Corporation
Mount options Release behind: rbr, rbw and rbrw
Says to throw the data out of file system cache
rbr is release behind on read
rbw is release behind on write
rbrw is both
Applies to sequential IO only
DIO: Direct IO
Bypasses file system cache
No file system read ahead
No lrud or syncd overhead
No double buffering of data
Half the kernel calls to do the IO
Half the memory transfers to get the data to the application
Requires the application be written to use DIO
CIO: Concurrent IO
The same as DIO but with no i-node locking

2009 IBM Corporation
i-node locking: when 2 or more threads access
the same file, and one is a write, the write will
block all read threads at this level
The AIX IO stack
Write cache Read cache or memory area used for IO
Disk
Disk subsystem (optional)
Adapter Device Drivers
Disk Device Drivers
LVM (LVM device drivers)
Raw
disk
s
Raw
LV
s
Application
Logical file system
JFS JFS2 NFS Other
VMM
Multi-path IO driver
2009 IBM Corporation
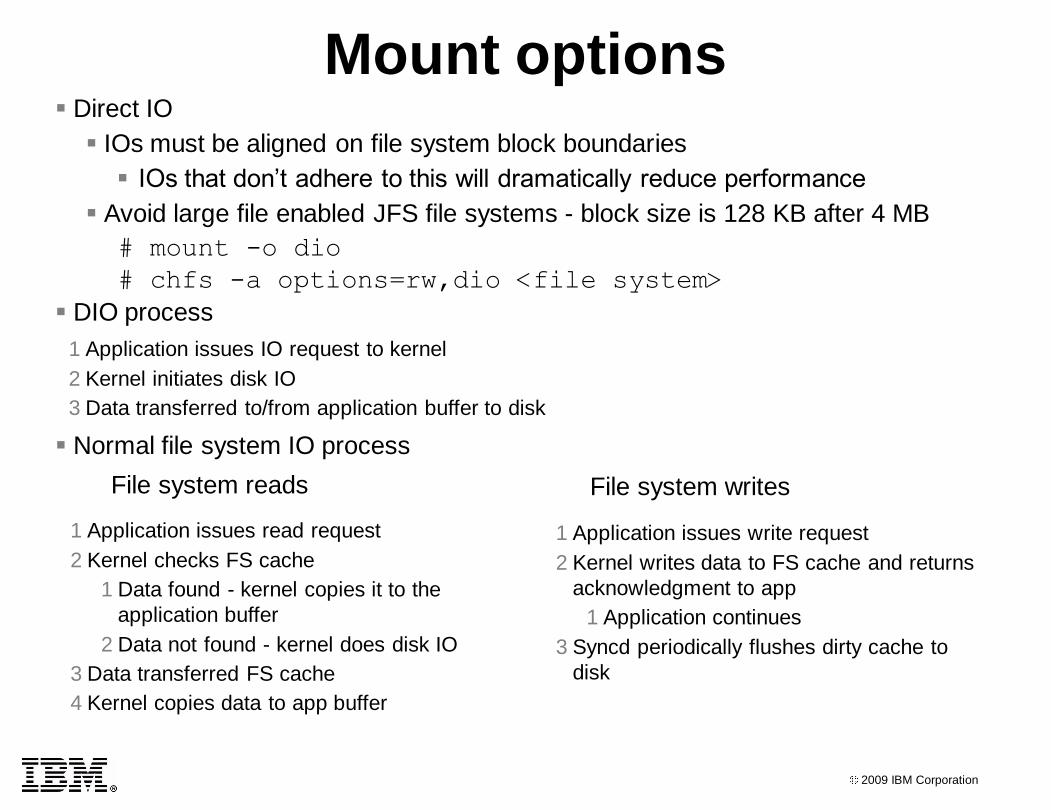
Mount options Direct IO
IOs must be aligned on file system block boundaries
IOs that don’t adhere to this will dramatically reduce performance
Avoid large file enabled JFS file systems - block size is 128 KB after 4 MB
# mount -o dio
# chfs -a options=rw,dio <file system>
DIO process
1 Application issues IO request to kernel
2 Kernel initiates disk IO
3 Data transferred to/from application buffer to disk
1 Application issues read request
2 Kernel checks FS cache
1 Data found - kernel copies it to the
application buffer
2 Data not found - kernel does disk IO
3 Data transferred FS cache
4 Kernel copies data to app buffer
1 Application issues write request
2 Kernel writes data to FS cache and returns
acknowledgment to app
1 Application continues
3 Syncd periodically flushes dirty cache to
disk
Normal file system IO process
File system reads File system writes

2009 IBM Corporation
Mount options Concurrent IO for JFS2 only at AIX 5.2 ML1 or later
# mount -o cio
# chfs -a options=rw,cio <file system>
Assumes that the application ensures data integrity for multiple simultaneous
IOs to a file
Changes to meta-data are still serialized
I-node locking: When two threads (one of which is a write) to do IO to the same
file are at the file system layer of the IO stack, reads will be blocked while a write
proceeds
Provides raw LV performance with file system benefits
Requires an application designed to use CIO
For file system maintenance (e.g. restore a backup) one usually mounts without
cio during the maintenance

2009 IBM Corporation
Disabling file system journaling
You may lose data in the event of a system crash!
Improves performance for meta-data changes to file systems
When you frequently add, delete or change the size of files
JFS
# mount –o nointegrity <file system>
JFS2
# mount -o log=NULL <file system>
2009 IBM Corporation
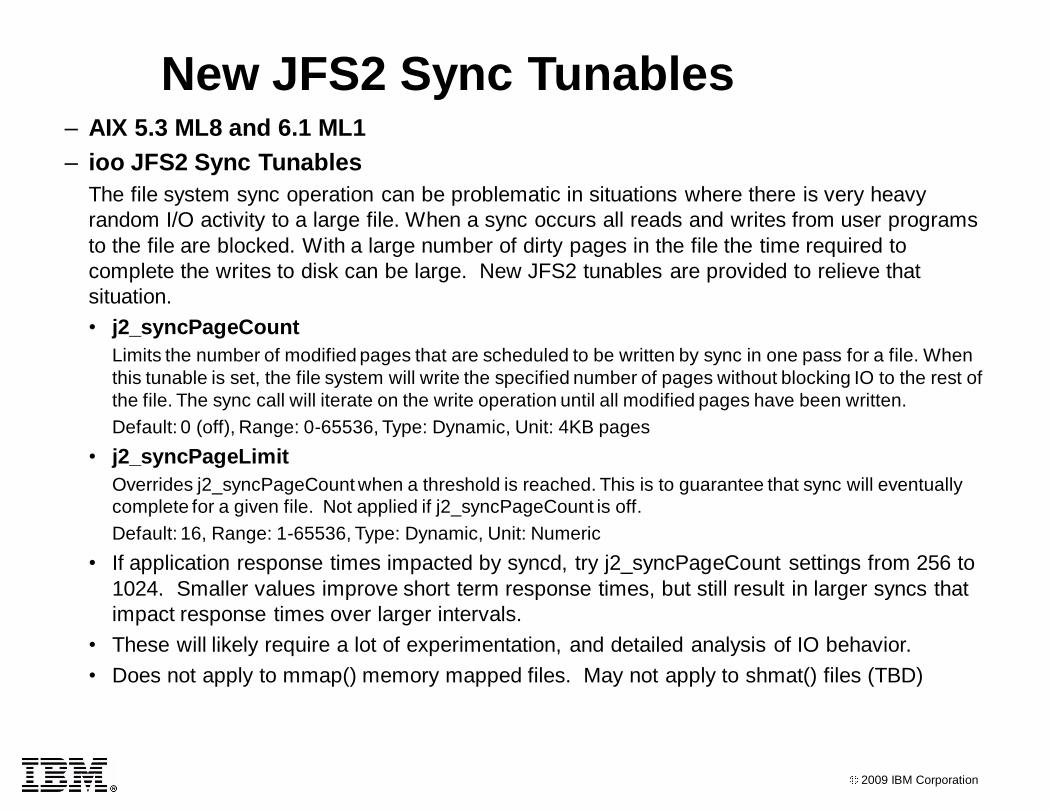
New JFS2 Sync Tunables– AIX 5.3 ML8 and 6.1 ML1
– ioo JFS2 Sync Tunables
The file system sync operation can be problematic in situations where there is very heavy
random I/O activity to a large file. When a sync occurs all reads and writes from user programs
to the file are blocked. With a large number of dirty pages in the file the time required to
complete the writes to disk can be large. New JFS2 tunables are provided to relieve that
situation.
• j2_syncPageCount
Limits the number of modified pages that are scheduled to be written by sync in one pass for a file. When
this tunable is set, the file system will write the specified number of pages without blocking IO to the rest of
the file. The sync call will iterate on the write operation until all modified pages have been written.
Default: 0 (off), Range: 0-65536, Type: Dynamic, Unit: 4KB pages
• j2_syncPageLimit
Overrides j2_syncPageCount when a threshold is reached. This is to guarantee that sync will eventually
complete for a given file. Not applied if j2_syncPageCount is off.
Default: 16, Range: 1-65536, Type: Dynamic, Unit: Numeric
• If application response times impacted by syncd, try j2_syncPageCount settings from 256 to
1024. Smaller values improve short term response times, but still result in larger syncs that
impact response times over larger intervals.
• These will likely require a lot of experimentation, and detailed analysis of IO behavior.
• Does not apply to mmap() memory mapped files. May not apply to shmat() files (TBD)
2009 IBM Corporation
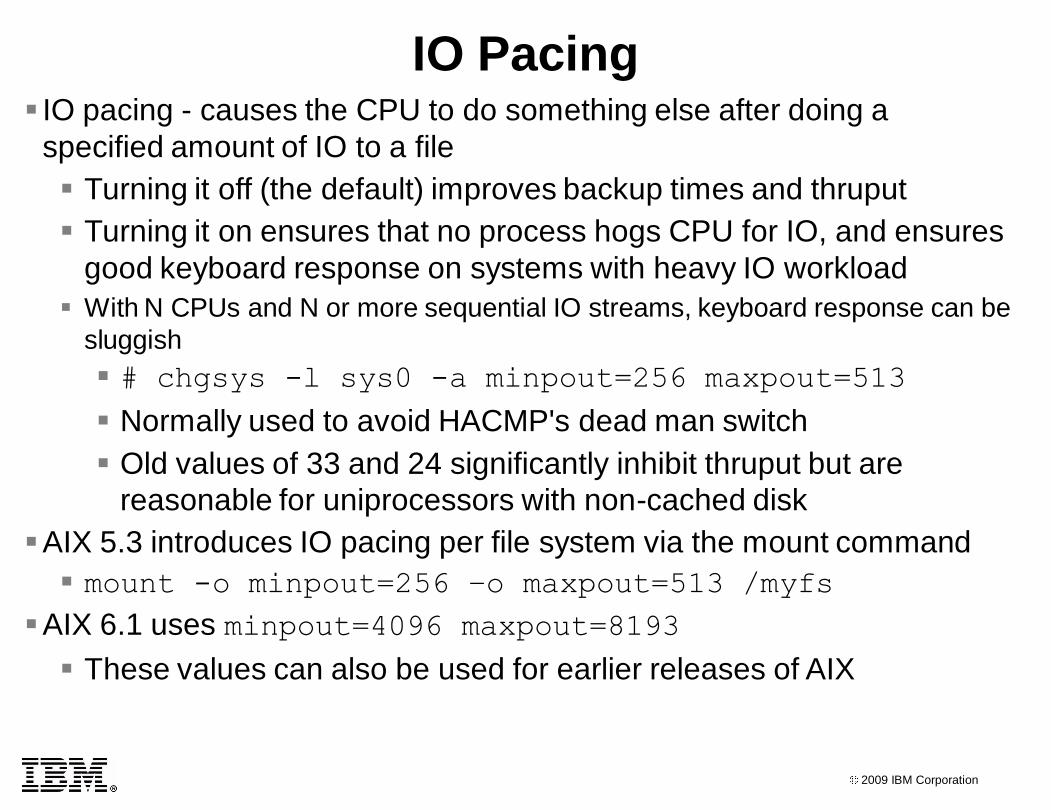
IO pacing - causes the CPU to do something else after doing a
specified amount of IO to a file
Turning it off (the default) improves backup times and thruput
Turning it on ensures that no process hogs CPU for IO, and ensures
good keyboard response on systems with heavy IO workload
With N CPUs and N or more sequential IO streams, keyboard response can be
sluggish
# chgsys -l sys0 -a minpout=256 maxpout=513
Normally used to avoid HACMP's dead man switch
Old values of 33 and 24 significantly inhibit thruput but are
reasonable for uniprocessors with non-cached disk
AIX 5.3 introduces IO pacing per file system via the mount command
mount -o minpout=256 –o maxpout=513 /myfs
AIX 6.1 uses minpout=4096 maxpout=8193
These values can also be used for earlier releases of AIX
IO Pacing
2009 IBM Corporation
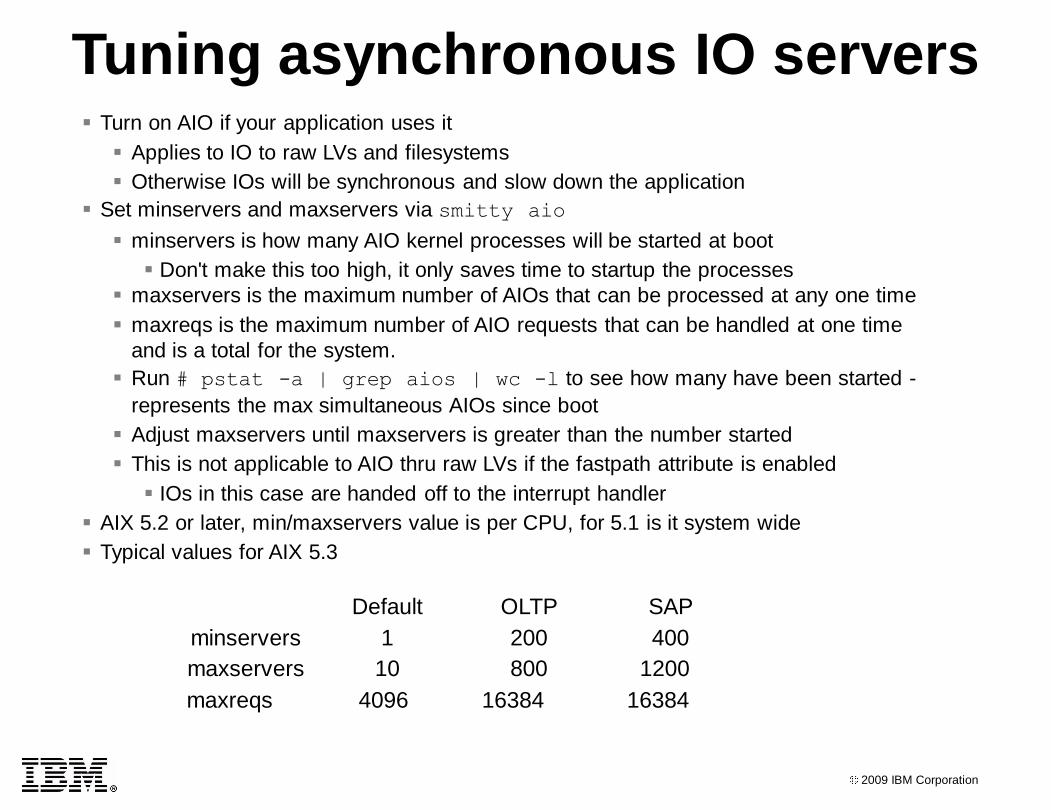
Tuning asynchronous IO servers Turn on AIO if your application uses it
Applies to IO to raw LVs and filesystems
Otherwise IOs will be synchronous and slow down the application
Set minservers and maxservers via smitty aio
minservers is how many AIO kernel processes will be started at boot
Don't make this too high, it only saves time to startup the processes
maxservers is the maximum number of AIOs that can be processed at any one time
maxreqs is the maximum number of AIO requests that can be handled at one time
and is a total for the system.
Run # pstat -a | grep aios | wc -l to see how many have been started -
represents the max simultaneous AIOs since boot
Adjust maxservers until maxservers is greater than the number started
This is not applicable to AIO thru raw LVs if the fastpath attribute is enabled
IOs in this case are handed off to the interrupt handler
AIX 5.2 or later, min/maxservers value is per CPU, for 5.1 is it system wide
Typical values for AIX 5.3
Default OLTP SAP
minservers 1 200 400
maxservers 10 800 1200
maxreqs 4096 16384 16384
2009 IBM Corporation
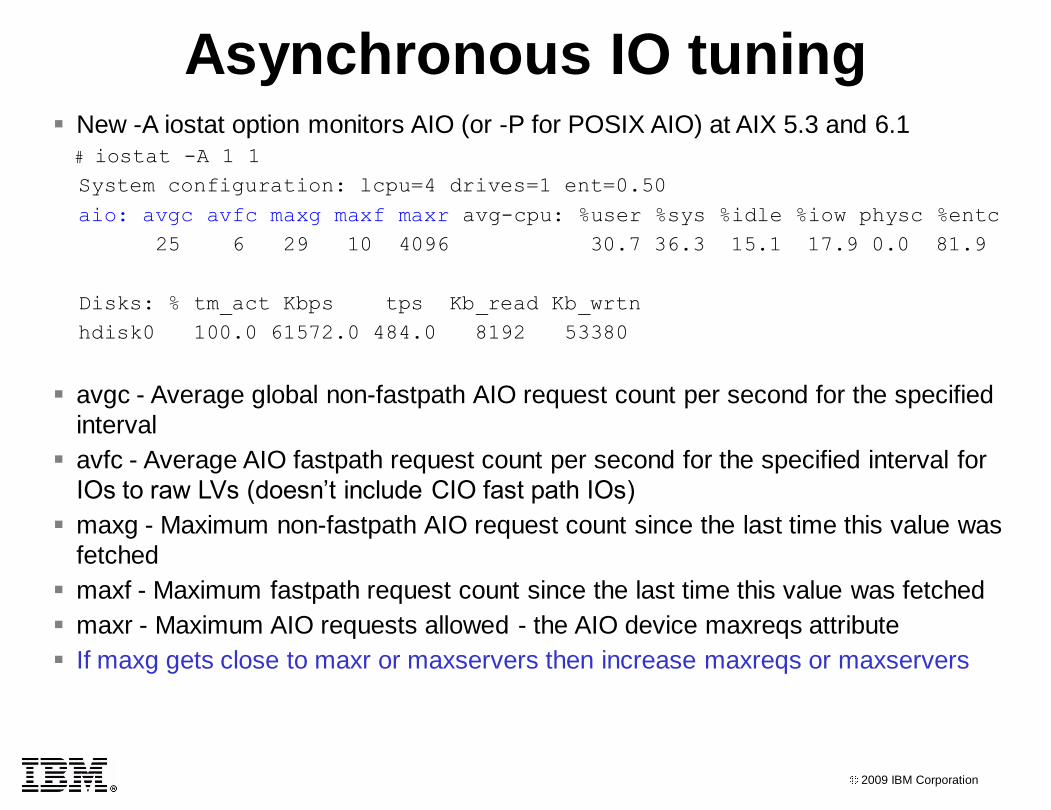
Asynchronous IO tuning New -A iostat option monitors AIO (or -P for POSIX AIO) at AIX 5.3 and 6.1
# iostat -A 1 1
System configuration: lcpu=4 drives=1 ent=0.50
aio: avgc avfc maxg maxf maxr avg-cpu: %user %sys %idle %iow physc %entc
25 6 29 10 4096 30.7 36.3 15.1 17.9 0.0 81.9
Disks: % tm_act Kbps tps Kb_read Kb_wrtn
hdisk0 100.0 61572.0 484.0 8192 53380
avgc - Average global non-fastpath AIO request count per second for the specified
interval
avfc - Average AIO fastpath request count per second for the specified interval for
IOs to raw LVs (doesn’t include CIO fast path IOs)
maxg - Maximum non-fastpath AIO request count since the last time this value was
fetched
maxf - Maximum fastpath request count since the last time this value was fetched
maxr - Maximum AIO requests allowed - the AIO device maxreqs attribute
If maxg gets close to maxr or maxservers then increase maxreqs or maxservers
2009 IBM Corporation
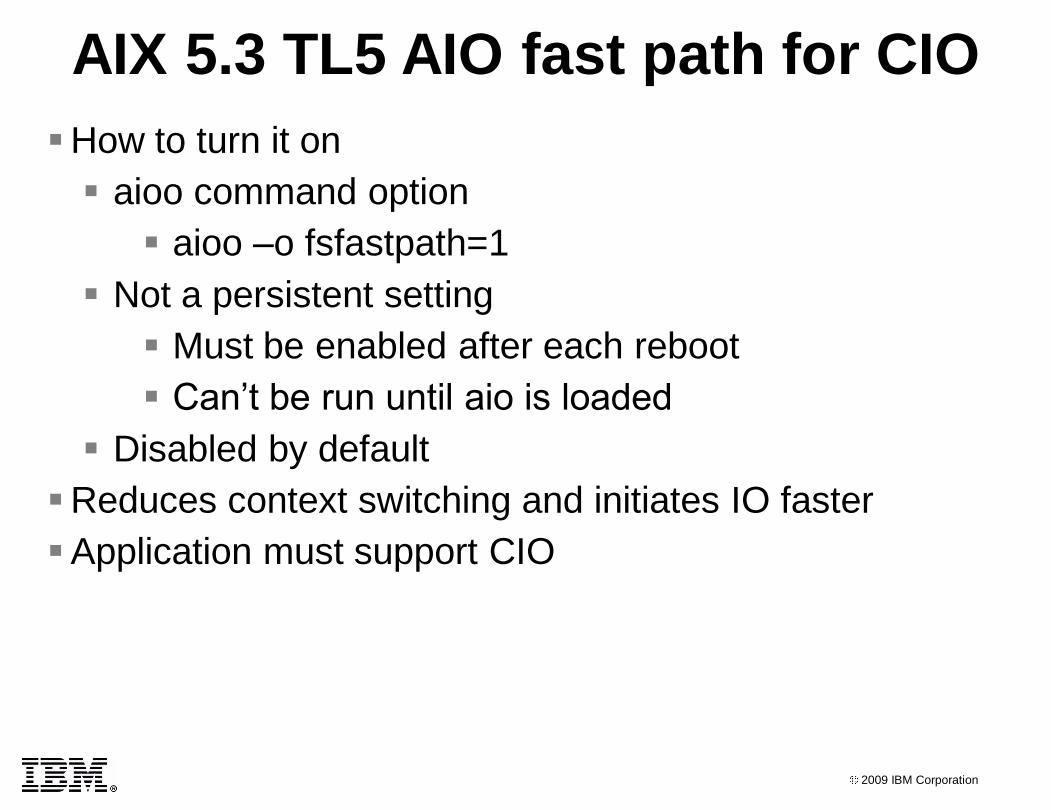
AIX 5.3 TL5 AIO fast path for CIO
How to turn it on
aioo command option
aioo –o fsfastpath=1
Not a persistent setting
Must be enabled after each reboot
Can’t be run until aio is loaded
Disabled by default
Reduces context switching and initiates IO faster
Application must support CIO
2009 IBM Corporation
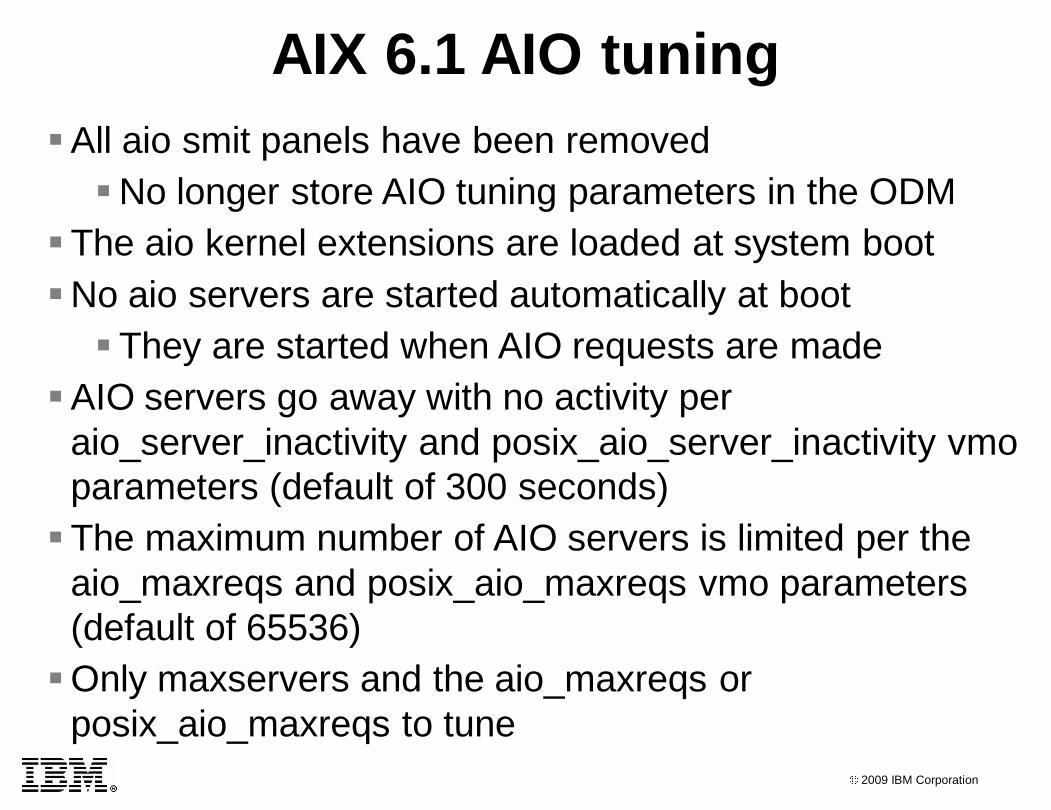
AIX 6.1 AIO tuning
All aio smit panels have been removed
No longer store AIO tuning parameters in the ODM
The aio kernel extensions are loaded at system boot
No aio servers are started automatically at boot
They are started when AIO requests are made
AIO servers go away with no activity per
aio_server_inactivity and posix_aio_server_inactivity vmo
parameters (default of 300 seconds)
The maximum number of AIO servers is limited per the
aio_maxreqs and posix_aio_maxreqs vmo parameters
(default of 65536)
Only maxservers and the aio_maxreqs or
posix_aio_maxreqs to tune
2009 IBM Corporation
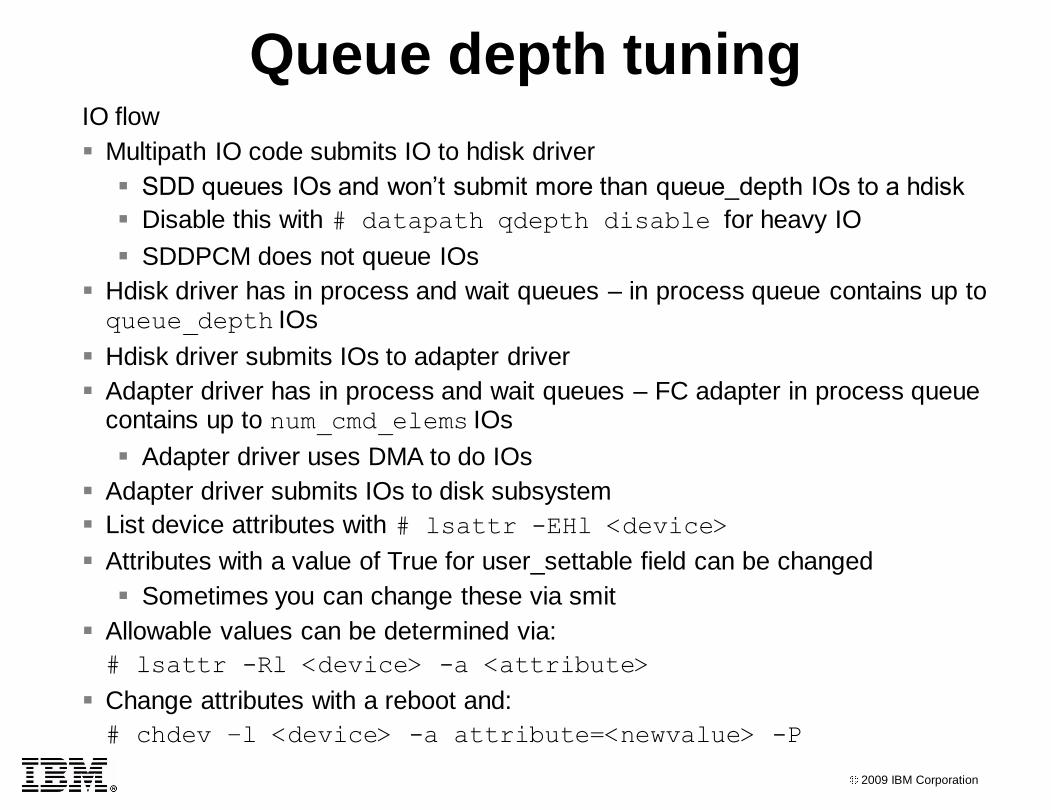
Queue depth tuningIO flow
Multipath IO code submits IO to hdisk driver
SDD queues IOs and won’t submit more than queue_depth IOs to a hdisk
Disable this with # datapath qdepth disable for heavy IO
SDDPCM does not queue IOs
Hdisk driver has in process and wait queues – in process queue contains up to queue_depth IOs
Hdisk driver submits IOs to adapter driver
Adapter driver has in process and wait queues – FC adapter in process queue contains up to num_cmd_elems IOs
Adapter driver uses DMA to do IOs
Adapter driver submits IOs to disk subsystem
List device attributes with # lsattr -EHl <device>
Attributes with a value of True for user_settable field can be changed
Sometimes you can change these via smit
Allowable values can be determined via:
# lsattr -Rl <device> -a <attribute>
Change attributes with a reboot and:
# chdev –l <device> -a attribute=<newvalue> -P

2009 IBM Corporation
Queue depth tuning Don’t increase queue depths beyond what the disk can handle!
IOs will be lost and will have to be retried, which reduced performance
FC adapters
max_xfer_size attribute controls a DMA memory area for data IO
At the default of 0x100000, the DMA area is 16 MB
At other allowable values (e.g. 0x200000) the DMA area is 128 MB
We often need to change this for heavy IO
lg_term_dma attribute controls a DMA memory area for control IO
The default is usually adequate
How to determine if queues are being filled
With SDD: # datapath query devstats and
# datapath query adaptstats
With SDDPCM: # pcmpath query devstats
# pcmpath query adaptstats
With iostat: # iostat –D for data since system boot and
# iostat –D <interval> <count> for interval data
With sar: # sar –d <interval> <count>
2009 IBM Corporation
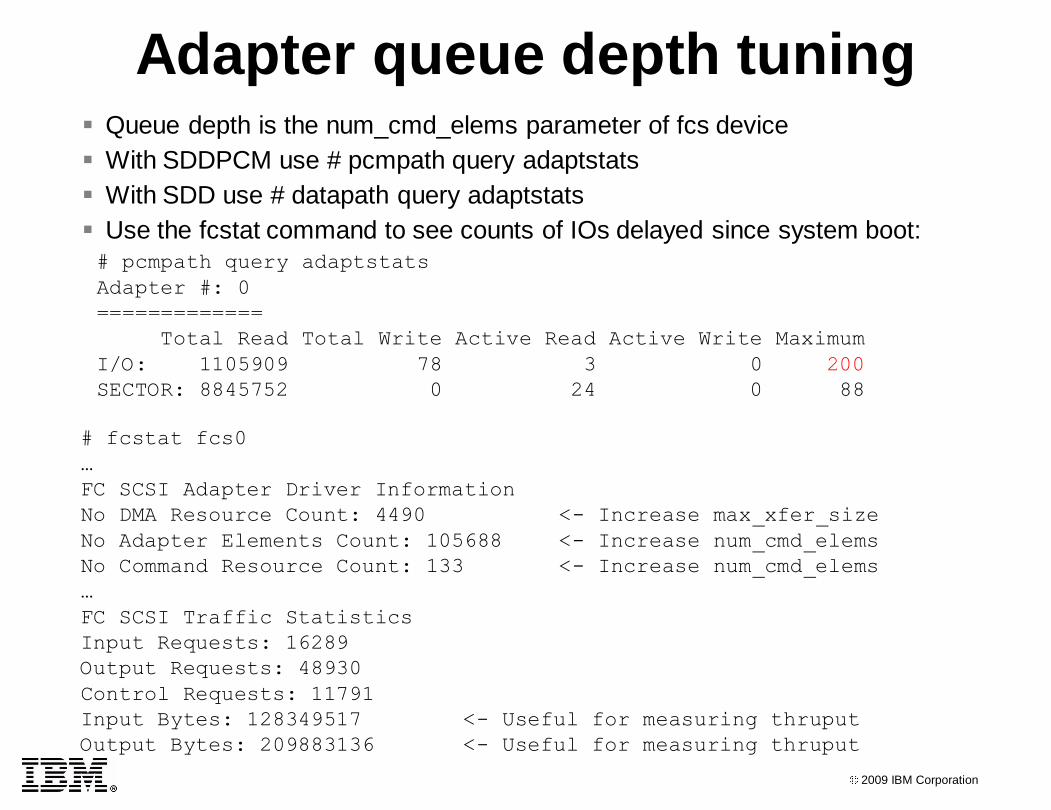
Adapter queue depth tuning Queue depth is the num_cmd_elems parameter of fcs device
With SDDPCM use # pcmpath query adaptstats
With SDD use # datapath query adaptstats
Use the fcstat command to see counts of IOs delayed since system boot:
# fcstat fcs0
…
FC SCSI Adapter Driver Information
No DMA Resource Count: 4490 <- Increase max_xfer_size
No Adapter Elements Count: 105688 <- Increase num_cmd_elems
No Command Resource Count: 133 <- Increase num_cmd_elems
…
FC SCSI Traffic Statistics
Input Requests: 16289
Output Requests: 48930
Control Requests: 11791
Input Bytes: 128349517 <- Useful for measuring thruput
Output Bytes: 209883136 <- Useful for measuring thruput
# pcmpath query adaptstats
Adapter #: 0
=============
Total Read Total Write Active Read Active Write Maximum
I/O: 1105909 78 3 0 200
SECTOR: 8845752 0 24 0 88
2009 IBM Corporation
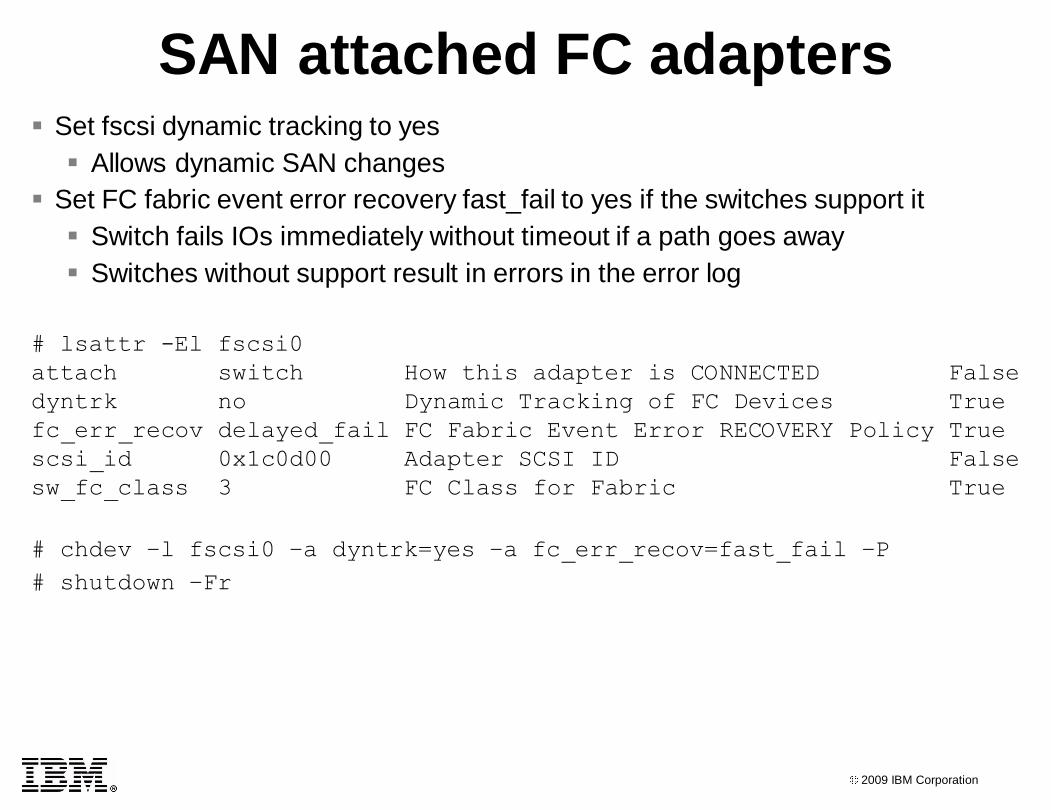
SAN attached FC adapters Set fscsi dynamic tracking to yes
Allows dynamic SAN changes
Set FC fabric event error recovery fast_fail to yes if the switches support it
Switch fails IOs immediately without timeout if a path goes away
Switches without support result in errors in the error log
# lsattr -El fscsi0
attach switch How this adapter is CONNECTED False
dyntrk no Dynamic Tracking of FC Devices True
fc_err_recov delayed_fail FC Fabric Event Error RECOVERY Policy True
scsi_id 0x1c0d00 Adapter SCSI ID False
sw_fc_class 3 FC Class for Fabric True
# chdev –l fscsi0 –a dyntrk=yes –a fc_err_recov=fast_fail –P
# shutdown –Fr
2009 IBM Corporation
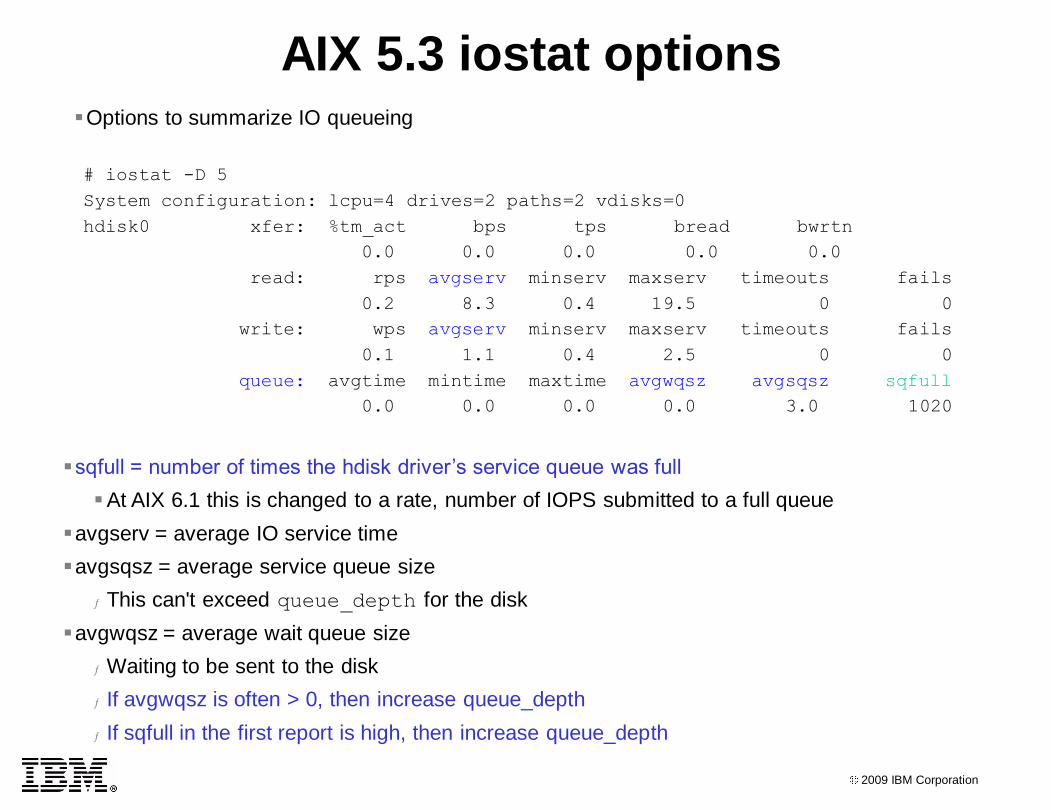
# iostat -D 5
System configuration: lcpu=4 drives=2 paths=2 vdisks=0
hdisk0 xfer: %tm_act bps tps bread bwrtn
0.0 0.0 0.0 0.0 0.0
read: rps avgserv minserv maxserv timeouts fails
0.2 8.3 0.4 19.5 0 0
write: wps avgserv minserv maxserv timeouts fails
0.1 1.1 0.4 2.5 0 0
queue: avgtime mintime maxtime avgwqsz avgsqsz sqfull
0.0 0.0 0.0 0.0 3.0 1020
AIX 5.3 iostat optionsOptions to summarize IO queueing
sqfull = number of times the hdisk driver’s service queue was full
At AIX 6.1 this is changed to a rate, number of IOPS submitted to a full queue
avgserv = average IO service time
avgsqsz = average service queue size
ƒ This can't exceed queue_depth for the disk
avgwqsz = average wait queue size
ƒ Waiting to be sent to the disk
ƒ If avgwqsz is often > 0, then increase queue_depth
ƒ If sqfull in the first report is high, then increase queue_depth

2009 IBM Corporation
# sar -d 1 2
AIX sq1test1 3 5 00CDDEDC4C00 06/22/04
System configuration: lcpu=2 drives=1 ent=0.30
10:01:37 device %busy avque r+w/s Kbs/s avwait avserv
10:01:38 hdisk0 100 36.1 363 46153 51.1 8.3
10:01:39 hdisk0 99 38.1 350 44105 58.0 8.5
Average hdisk0 99 37.1 356 45129 54.6 8.4
AIX 5.3 new sar output
sar -d formerly reported zeros for avwait and avserv
avque definition changes in AIX 5.3
avque - average IOs in the wait queue
Waiting to get sent to the disk (the disk's queue is full)
Values > 0 indicate increasing queue_depth may help performance
Used to mean number of IOs in the disk queue
avgwait - time (ms) waiting in wait queue
avgserv - IO service time (ms) when sent to the disk
2009 IBM Corporation
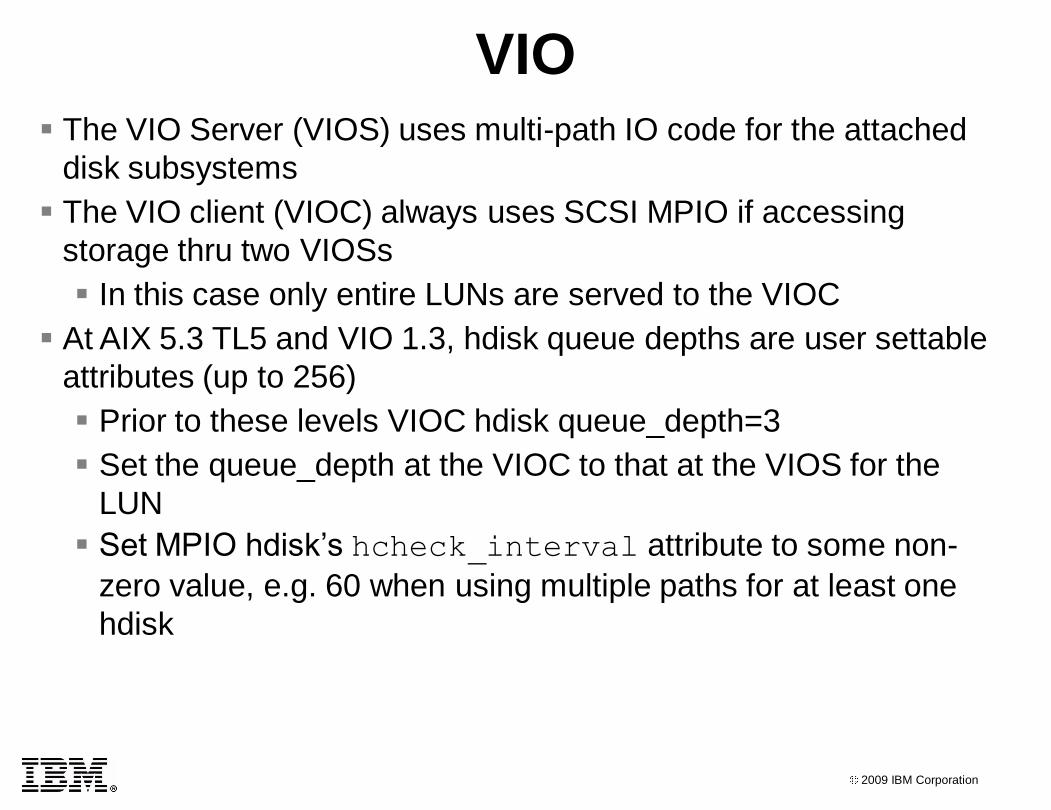
VIO The VIO Server (VIOS) uses multi-path IO code for the attached
disk subsystems
The VIO client (VIOC) always uses SCSI MPIO if accessing
storage thru two VIOSs
In this case only entire LUNs are served to the VIOC
At AIX 5.3 TL5 and VIO 1.3, hdisk queue depths are user settable
attributes (up to 256)
Prior to these levels VIOC hdisk queue_depth=3
Set the queue_depth at the VIOC to that at the VIOS for the
LUN
Set MPIO hdisk’s hcheck_interval attribute to some non-
zero value, e.g. 60 when using multiple paths for at least one
hdisk