Embed Size (px)
Citation preview

Quality of Life Research, 7, pp. 135–142
© 1998 Rapid Science Ltd Quality of Life Research . Vol 7 . 1998 135
Disease-specific quality of life: is it oneconstruct?
A. G. E. M. de Boer,* R. J. Spruijt, M. A. G. Sprangers and J. C. J. M. de Haes
Department of Medical Psychology, Academic Medical Center, University ofAmsterdam, Amsterdam, The Netherlands (A. G. E. M. de Boer, M. A. G. Sprangers,J. C. J. M de Haes); Division of Psychosocial Research and Epidemiology, The Netherlands Cancer Institute, Amsterdam, The Netherlands (R. J. Spruijt)
The objective of this study was to examine thestructure of disease-specific quality of life (QoL).Models of QoL with either one overall construct ormore constructs were tested and the relationships(factor loadings) between the constructs and dimen-sions were established, using structural equationmodelling. The models were tested over time toassess the stability of the structure. To generalize theresults further, disease-specific questionnaires oftwo very different chronic diseases have beencompared: inflammatory bowel disease (IBD) andParkinson’s disease (PD). Questionnaires were mailed in 1994 and a repeatedmeasurement was conducted in 1995. Data wereobtained from 222 IBD patients and 235 PD patients.The results show that for both diseases, disease-specific QoL can be considered as one construct.The stability over time of the structure of the QoLmodels was satisfactory. In PD the factor loadingsbetween the dimensions and QoL were within a smallrange and remained the same over time, while in IBD,the factor loadings had a larger range and fluctuatedmore. These results imply that one meaningful sumscore can be obtained from these questionnaires.Qual Life Res 7: 135–142 © 1998 Rapid Science Ltd
Key words: Quality of life; inflammatory bowel disease;Parkinson’s disease; structural equation modelling.
Introduction
Quality of life (QoL) has become a widely acceptedconcept in health care research. It is used as anoutcome measure in population studies, in descriptivestudies of patient groups and in clinical trials. Whilethere is no clear and broadly approved definition of
QoL,1 it has been accepted that it is a multidimen-sional concept. The multiple dimensions may not onlyinclude the physical, psychological and socialfunctioning specified by the World HealthOrganization2 but also material consequences,cognition, spiritual well-being and structuralfunctioning.3–9 Little is known, however, about thestructure of QoL. There is controversy about thenumber of constructs or higher-order factors underly-ing the dimensions. Some consider the physical, emo-tional and social dimensions part of one overall QoLconstruct,3–10 while others found two separateconstructs underlying the dimensions which arelabelled physical health (including physicalfunctioning and symptoms) and mental health(including emotional and social functioning).11–15 Stillothers2 presume three dimensions underlying QoL(physical, emotional and social). Empirical results,however,12–15 were obtained from generic QoLquestionnaires (the SF-19 and Quality of LifeQuestionnaire) and it is not clear if these results can begeneralized to disease-specific questionnaires.
Whether QoL can be considered as one overallconstruct or separate constructs is relevant to the waysum scores can be aggregated from QoL question-naires. In some studies researchers are interested inthe separate scores of all the subscales of a question-naire, e.g. the effect of psychological counselling onphysical, emotional and/or social well-being. Otherstudies, however, require one aggregated QoL sumscore, as in cost-utility studies or in some clinicaltrials. If only one construct is underlying the QoLdimensions, one sum score will capture QoLadequately. If, however, QoL should consist of moredistinguishable constructs, the appropriate number ofsum scores should be calculated.
Several researchers have investigated the impor-tance or relative weights of specific items in relation tothe dimensions, for instance by means of factor
*To whom correspondence should be addressed atDepartment of Medical Psychology, Academic MedicalCenter, University of Amsterdam, PO Box 22700, 1100 DEAmsterdam, The Netherlands.Tel: 31 20 566 4661; Fax: 3120 566 9104; Email: [email protected]

analysis.16–18 Others used judgement analysis tomeasure the patient’s most important areas of QoL.19,20
However, the extent to which the dimensionsthemselves assess QoL is yet unknown. If physical,emotional and social functioning are as equallyimportant to QoL, this should be reflected in the rela-tions between the dimensions and the construct(s).Whatever structure is found, it should be relativelystable over time and not vary as the disease progressesor fluctuates. Longitudinal testing of a QoL model has,to our knowledge, never been performed. Finally, ifdisease-specific QoL is a general concept, the structureshould be similar across diseases.
The objective of this study is to examine thestructure of disease-specific QoL, that is the number ofconstructs underlying QoL and the relations betweenthe construct(s) and the dimensions. First, QoL modelswith either one or more underlying constructs will betested. Second, the models will be tested over time toassess the stability of the structure. These longitudinalmodels will yield either one or more constructs andthe relationships between physical, emotional andsocial dimensions and the underlying construct(s) willbe established. Third, the models of two disease-specific questionnaires for inflammatory boweldisease (IBD) and Parkinson’s disease (PD) will becompared to generalize the results.
Methods
Patient recruitment
Patients with IBD and patients with PD participated inthis study. IBD is a chronic inflammatory disease ofthe gut which mainly affects young people. The mainsymptoms are diarrhoea, abdominal pain and weightloss. Acute exacerbations of varying severity usuallyoccur intermittently. PD is a slowly progressive neuro-logical disease with a mean age of onset of 55 years.The main symptoms are tremor, akinesia and posturalabnormalities.
In 1994 we sent self-report questionnaires to consecutive IBD patients who attended the IBD out-patients’ clinic of the Academic Medical Center ofAmsterdam and to members of the Dutch Parkinson’sDisease Society. In 1995 we conducted a repeatedmeasurement.
Measurements
Disease-specific QoL was measured by two instru-ments. The IBD Questionnaire (IBDQ) consists of 32
items which form four subscales: IBD-relatedsymptoms and functioning (IBD symptoms, e.g.cramps in the abdomen and loose bowel movements,ten items), systemic symptoms (e.g. fatigue andweight problems, five items), emotional functioning(e.g. feeling embarrassed, 12 items) and social func-tioning (e.g. unable to attend school or work, and needto cancel social activities, five items).21–22
The PD Quality of Life Questionnaire (PDQL)consists of 37 items. The PDQL consists of foursubscales: Parkinsons related symptoms andfunctioning (e.g. stiffness and shaking, 14 items),systemic symptoms (e.g. fatigue and obstipation,seven items), emotional functioning (e.g. difficultyaccepting illness and feeling embarrassed, nine items)and social functioning (e.g. less holidays and need tocancel social activities, seven items).23 In bothquestionnaires the scores are given on five-pointLikert scales. They have well-established levels ofreliability and validity.21–23 Standard demographicquestions were used to assess gender, age and diseaseduration.
Statistical analysis: structural equationmodelling
The models for QoL were tested using structuralequation modelling (SEM). The greatest advantage ofSEM is its ability to test the tenability of a hypothe-sized model while taking measurement error intoaccount.24
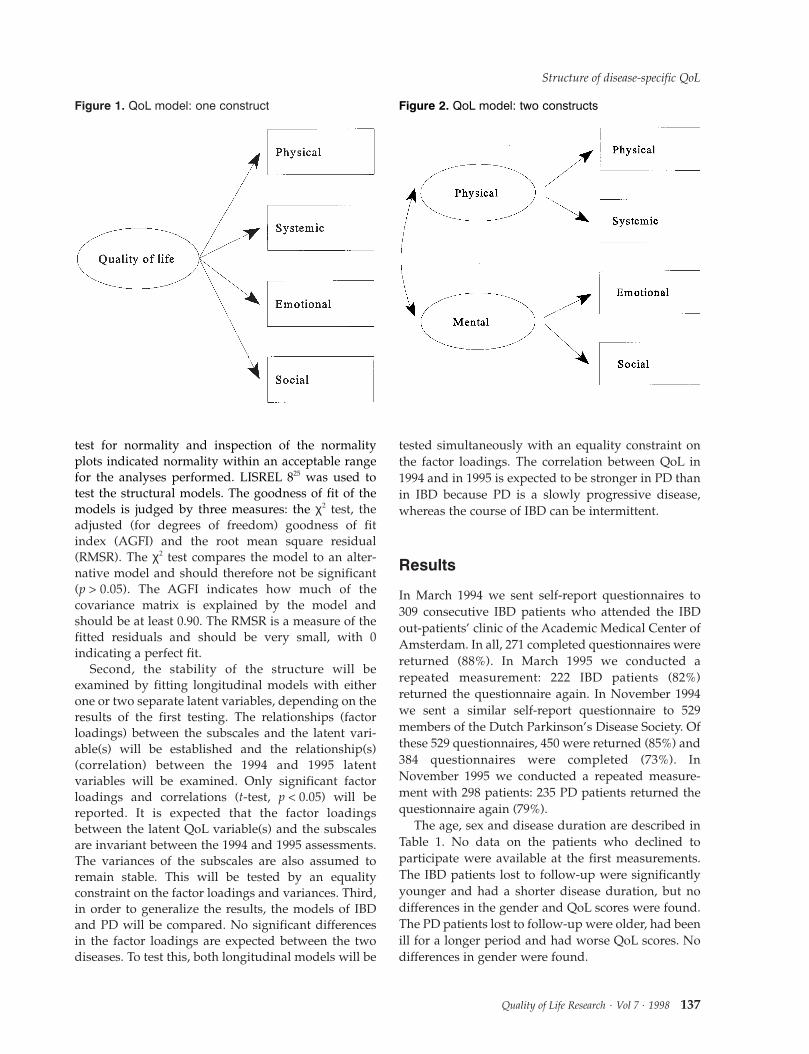
First, two theoretical models will be tested. Figure 1shows the theoretical model in which one overall QoLconstruct is underlying the four dimensions. Figure 2depicts the theoretical model where two constructs,i.e. physical and mental health, underlie the fourdimensions. For statistical reasons it was not possibleto test a model with three constructs (physical, mentaland social), since there would be no degrees offreedom left.
The latent variables, i.e. the representation of con-structs, are represented by circles. The observedsubscales that operationalize the respective dimen-sions are represented by boxes. The influence of alatent variable on a subscale is indicated by an arrowand by the path coefficient which is simply a factorloading. For each disease a covariance matrix of twotimes four variables (disease-specific symptoms andphysical functioning, systemic symptoms, emotionalfunctioning and social functioning, assessed in 1994and 1995) constituted the input data for this study. Thevariables were checked for violations of normalityassumptions. The results of the Kolmogorov–Smirnov
A. G. E. M. de Boer et al.
136 Quality of Life Research . Vol 7 . 1998
test for normality and inspection of the normalityplots indicated normality within an acceptable rangefor the analyses performed. LISREL 825 was used totest the structural models. The goodness of fit of themodels is judged by three measures: the χ2 test, theadjusted (for degrees of freedom) goodness of fitindex (AGFI) and the root mean square residual(RMSR). The χ2 test compares the model to an alter-native model and should therefore not be significant(p > 0.05). The AGFI indicates how much of thecovariance matrix is explained by the model andshould be at least 0.90. The RMSR is a measure of thefitted residuals and should be very small, with 0indicating a perfect fit.
Second, the stability of the structure will beexamined by fitting longitudinal models with eitherone or two separate latent variables, depending on theresults of the first testing. The relationships (factorloadings) between the subscales and the latent vari-able(s) will be established and the relationship(s)(correlation) between the 1994 and 1995 latentvariables will be examined. Only significant factorloadings and correlations (t-test, p < 0.05) will bereported. It is expected that the factor loadingsbetween the latent QoL variable(s) and the subscalesare invariant between the 1994 and 1995 assessments.The variances of the subscales are also assumed toremain stable. This will be tested by an equalityconstraint on the factor loadings and variances. Third,in order to generalize the results, the models of IBDand PD will be compared. No significant differencesin the factor loadings are expected between the twodiseases. To test this, both longitudinal models will be
tested simultaneously with an equality constraint onthe factor loadings. The correlation between QoL in1994 and in 1995 is expected to be stronger in PD thanin IBD because PD is a slowly progressive disease,whereas the course of IBD can be intermittent.
Results
In March 1994 we sent self-report questionnaires to309 consecutive IBD patients who attended the IBDout-patients’ clinic of the Academic Medical Center ofAmsterdam. In all, 271 completed questionnaires werereturned (88%). In March 1995 we conducted arepeated measurement: 222 IBD patients (82%)returned the questionnaire again. In November 1994we sent a similar self-report questionnaire to 529members of the Dutch Parkinson’s Disease Society. Ofthese 529 questionnaires, 450 were returned (85%) and384 questionnaires were completed (73%). InNovember 1995 we conducted a repeated measure-ment with 298 patients: 235 PD patients returned thequestionnaire again (79%).
The age, sex and disease duration are described inTable 1. No data on the patients who declined toparticipate were available at the first measurements.The IBD patients lost to follow-up were significantlyyounger and had a shorter disease duration, but nodifferences in the gender and QoL scores were found.The PD patients lost to follow-up were older, had beenill for a longer period and had worse QoL scores. Nodifferences in gender were found.
Structure of disease-specific QoL
Quality of Life Research . Vol 7 . 1998 137
Figure 1. QoL model: one construct Figure 2. QoL model: two constructs

QoL model: one latent variable or twoseparate latent variables
To establish whether one or two latent variablesunderlie QoL, two structural models (Figures 1 and 2)were tested. Both models were tested on the datacollected in 1994 and 1995. The fit statistics for the fourmodels for IBD are reported in Table 2.
The results show that the model with one latentvariable fits the data best for IBD: a low χ2, smallRMSR and high AGFI were found. The two latentvariables model appears to show a good fit, but therewere serious fitting problems. The estimated corre-lation between the physical and mental latentvariables was higher than 1 (1.03), thus exceeding theupper limit of a correlation coefficient. Moreover, theone latent variable model is more parsimonious.
The goodness of fit statistics for PD are reported inTable 3. The best fitted model for PD was the one withtwo latent variables: physical and mental health. Themodel fitted better in 1995 than in 1994: the χ2 is notsignificant and the AGFI and RMSR are better.
However, the correlation between the physical andmental latent variables was very high: r = 0.90 in 1994and r = 0.87 in 1995. This implies that although this
model describes the data slightly better, the two latentvariables are strongly related. For reasons ofparsimony, we therefore decided to the test a thirdmodel with one latent variable. In this model thevariances between the physical and systemicsubscales (which had the highest subscale correlation,r = 0.69) were correlated. This model was found to beequivalent to the two latent variables model with thesame good fit statistics.
Longitudinal models
To test the stability of the model over time, one longi-tudinal model of QoL with one latent variable for eachyear was fitted on the 1994 and 1995 data for eachdisease group. Figure 3 depicts the longitudinal QoLmodel for IBD.
The figure reveals significant factor loadingsbetween the measured subscales of the IBDQ (IBD symptoms, systemic symptoms, emotionalfunctioning and social functioning) and the latentvariable QoL. The factor loadings range from 0.56 to0.95. The factor loadings and variances of the
A. G. E. M. de Boer et al.
138 Quality of Life Research . Vol 7 . 1998
Table 1. Patient characteristics of the two patient groups
IBD PD
1994 1995 1994 1995(n = 271) (n = 222) (n = 384) (n = 235)
Age (years) 39.6 (SD 13.8) 41.9 (SD 13.4) 67.1 (SD 10.8) 66.6 (SD 10.3)Gender:
Female 166 (61.3%) 140 (63%) 181 (47%) 107 (46%)Male 105 (38.7%) 82 (37%) 202 (53%) 128 (54%)
Disease duration (years) 10.6 (SD 8.4) 12.3 (SD 8.7) 7.9 (SD 6.3) 8.8 (SD 6.6)
Table 2. Fit statistics for the models for IBD
Latent variables Year n χ2 df p AGFI RMSR
1 1994 271 4.26 2 0.12 0.96 0.0152 1994 271 2.67 1 0.10 0.95 0.0121 1995 222 2.64 2 0.27 0.97 0.0142 1995 222 2.29 1 0.13 0.95 0.013Longitudinal 1994 + 1995 222 14.91 16 0.53 0.96 0.029
n, number of patients; df, degrees of freedom; p, p value; AGFI, adjusted goodness of fit index; RMSR, root meansquare residual.

subscales were expected to be invariant over time. Itwas indeed found that IBD symptoms and socialfunctioning did have the same factor loadings andvariances in both 1994 and 1995. However, the factorloadings for both systemic symptoms and emotionalfunctioning were lower in 1994: the model showed asignificantly worse fit when these parameters wereconstrained to be equal. QoL had the strongest factorloading on the emotional functioning subscale in both1994 (r = 0.95) and 1995 (r = 0.84). The goodness of fitstatistics are also shown in table 2. The goodness of fittests indicate a good fit, with χ2 (16) = 14.91 (p = 0.53)AGFI = 0.96, and RMSR = 0.029. It should be notedthat a good fit was achieved after correlating thevariances of the systemic symptoms and emotionalfunctioning subscales. This indicates that bothsubscales have more in common than just the latentvariable QoL.
Next, a longitudinal model with one latent variablewas tested on the data of the PD questionnaire. Thevariances of the PD symptoms and systemic subscaleswere correlated again. In addition, the variances of thesystemic and emotional subscales were also corre-lated, as was the case with the longitudinal model forIBD. Figure 4 shows the factor loadings between thesubscales of the PDQL (Parkinson’s symptoms,systemic symptoms, emotional functioning and socialfunctioning) and the underlying latent variable QoL.
The factor loadings range from 0.67 to 0.73. All ofthe factor loadings and subscale variances were equalin 1994 and 1995: the model showed a non-significantworse fit when these parameters were constrained tobe equal. As is shown in Table 3, the longitudinalmodel has a good fit: χ2 (20) = 29.19 (p = 0.084),AGFI = 0.95 and RMSR = 0.034.
Structure of disease-specific QoL
Quality of Life Research . Vol 7 . 1998 139
Figure 3. Longitudinal QoL model for IBD.
Table 3. Fit statistics for the models for PD
Latent variables Year n χ2 df p AGFI RMSR
1 1994 384 0.17 2 0.000019 0.87 0.0292 1994 384 7.40 1 0.006500 0.91 0.0141 1995 235 16.56 2 0.000250 0.85 0.0312 1995 235 2.98 1 0.084000 0.94 0.0121, correlated 1994 384 7.40 1 0.006500 0.91 0.0141, correlated 1995 235 2.98 1 0.084000 0.94 0.012Longitudinal 1994 + 1995 235 29.19 20 0.084000 0.95 0.034
n, number of patients; df, degrees of freedom; p, p value; AGFI, adjusted goodness of fit index; RMSR, root meansquare residual.

Comparison of the longitudinal IBD and PDmodels
The longitudinal IBD and PD models were compared,in order to generalize the results further. To testwhether the factor loadings of the subscales of thetwo models are the same, both longitudinal modelswere tested simultaneously with an equalityconstraint on the factor loadings. This total model didnot fit the data: χ2 (41) = 79.88 (p = 0.00026),AGFI = 0.89 and RMSR = 0.10. When the equalityconstraints of the factor loadings was lifted and thefactor loadings were estimated for each disease group,the total model did fit the data: χ2 (36) = 43.05(p = 0.20), AGFI = 0.98 and RMSR = 0.033.
The factor loadings in the IBD model have a widerange from 0.56 (systemic symptoms in 1995) to 0.95(emotional functioning in 1994). In PD they rangefrom 0.67 (emotional functioning) to 0.73 (Parkinson’ssymptoms). Only the factor loadings for disease-specific symptoms are the same in both groups (0.73in both 1994 and 1995). However, the factor loadings
for systemic symptoms and emotional and socialfunctioning were higher for IBD in 1994 and, exceptfor systemic symptoms, also in 1995. The longitudinalIBD model (Figure 3) shows that QoL was relativelystable over time (r = 0.64), but, as expected, the PDmodel (Figure 4) shows a stronger correlation betweenthe QoL in 1994 and 1995 (r = 0.91).
Discussion
The objective of this study was to examine thestructure of disease-specific QoL to determine howmany constructs underlie QoL and to assess therelations between the construct(s) and the dimensions.We fitted QoL models with either one overall or twoseparate underlying latent variables. The results showthat the model with one overall QoL latent variablefitted the IBD QoL questionnaire best. For the PDquestionnaire the model with two latent variables atfirst seemed to fit the data best. However, the latentvariables were highly correlated and it could beshown that a single latent variable model in which thevariances of the physical and systemic subscales werecorrelated was equivalent to and more parsimoniousthan the two latent variables model.
These results imply that disease-specific QoL can be considered as one construct. This conclusion isdifferent from prior research into the structure of QoL,based on data from generic questionnaires. Theseearlier studies clearly showed two constructs whichwere not highly correlated (0.4512 and range0.16–0.4815). Items in disease-specific questionnaires,such as the IBDQ and PDQL, measure QoL morespecifically in that specific disease. All of the items(physical, psychological and social) refer to onedisease and are intended to be interpreted in thecontext of that one disease only. It is therefore likely
A. G. E. M. de Boer et al.
140 Quality of Life Research . Vol 7 . 1998
Figure 4. Longitudinal QoL model for PD.

that items in those disease-specific questionnairesrepresent one construct. Items in generic instruments,on the other hand, measure QoL more generally andare not formulated in terms of one disease.Consequently, different constructs are more likely tobe distinguished in models based on these genericquestionnaires.
The stability of the structure was examined byfitting longitudinal models. Relationships between thephysical, emotional and social subscales and theunderlying latent variable were established and thestability of these relationships over time wasexamined. A longitudinal model with one latentvariable did fit the data in both diseases. In PD thefactor loadings between the subscales and QoL werewithin a small range and remained the same overtime. In IBD, the factor loadings of emotionalfunctioning and systemic symptoms were higher in1994 than in 1995. One might speculate that thesedifferences are a result of the fluctuating course ofIBD. It was expected that IBD symptoms wouldchange most and, consequently, the factor loading ofthis subscale might have changed, but this was not thecase.
In both longitudinal models, the variances betweenthe systemic and emotional subscales were also corre-lated. This means that the systemic and emotionalsubscales have something in common, which is notshared with the other scales. The systemic scalecontains items about fatigue, sleep, energy and feelinggenerally unwell. The emotional scale contains itemsabout depression, embarrassment and accepting thedisease. It is generally accepted that fatigue, energyloss and general feelings of unwellness are symptomsthat may concur with feelings of depression. Thus, thesystemic and emotional dimension may, to someextent, both draw upon the same information.
The longitudinal models of two diseases werecompared. While we found stable models for two verydifferent diseases, IBD and PD, we also came upondifferences between the models. No significant differ-ences in the factor loadings were expected betweenthe two diseases, but the results showed that the factorloadings were not equal. In IBD, the range of factorloadings was much larger (0.56–0.95) than in PD(0.67–0.73). In addition, the factor loadings in PDwere more stable than in IBD. Moreover, the factorloadings or relative contribution of QoL to thesubscales were different in the diseases. The subscalesIBD and PD symptoms and systemic symptoms havesimilar factor loadings, but emotional and socialfunctioning have a higher factor loading in IBD thanin PD. Both diseases have severe negative emotionaland social consequences. IBD patients often experi-
ence feelings of depression and frustration. Theextremely frequent visits to the washroom keep manypatients from social activities. In PD, the most severeemotional consequences are depression, insecurityand fear for the progress of PD. Visible shaking andsudden involuntary movements also keep manypatients from social activities. It could be, however,that emotional and social functioning are moreimportant to the overall QoL in the IBD patients thanin the PD patients, because the IBD patients weremuch younger (40 years) than the PD patients (67years).
The relation between the QoL scores of 1994 and1995 were, as expected, less stable in IBD than in PD(0.64 versus 0.91), which could be explained by thefluctuating nature of IBD. Despite these relativelysmall differences, the results are highly comparable.Given the fact that these diseases are so different incourse, symptoms and treatments, it may well be thatthese results could be generalized to other diseases. Itshould be noted, however, that the two questionnairescontain the same four subscales. Although thesesubscales are the ones used most frequently, in bothdisease-specific and generic QoL instruments, it couldbe that questionnaires with different subscales, suchas material consequences, cognition or spiritual well-being, have a different structure.
These findings have one major practical impli-cation. The objective of some research projects, such ascost-utility studies, is to establish which treatment orstrategy is the best in terms of QoL. For those researchpurposes, one meaningful sum score can be calculatedfor each questionnaire by aggregating across theitems. This one sum score reflects the physical,emotional and social well-being, that is the QoL of aperson. Clearly, this aggregation implies that specificinformation about physical or psychosocial well-beingis lost. Research projects which focus on the effects ofa specific physical and/or psychosocial dimension,require the use and computation of subscale scores.
In summary, a model with one overall QoL latentvariable adequately fitted the data of the two disease-specific questionnaires. The results show that therelations between the dimensions and the QoL latentvariable basically remained the same over time andthat the models are stable. The relative contributionsof the subscales to the QoL latent variable were,however, different in the two diseases.
Acknowledgements
We would like to thank Dr J. Bartelsman for his help inthe inclusion of the IBD patients, Dr J. D. Speelman for
Structure of disease-specific QoL
Quality of Life Research . Vol 7 . 1998 141

his help in the inclusion of the PD patients and Dr P.Oosterveld for his help with the analyses.
References
1. Schipper H, Clinch J, Olweny CLM. Quality of lifestudies: definitions and conceptual issues. In: Spilker B,ed. Quality of Life and Pharmacoeconomics in Clinical Trials.Philadelphia: Lippincott-Raven Press, 1996: 11–23.
2. World Health Organization. World Health Organizationconstitution. In: Basic Documents. Geneva: World HealthOrganization, 1948.
3. Hörnquist JO. The concept of quality of life. Scand J SocMed 1982; 10: 57–61.
4. de Haes JCJM, van Knippenberg FCE. The quality of lifeof cancer patients: a review of the literature. Soc Sci Med1985; 20: 809–817.
5. Rosser R. Quality of life: consensus, controversy andconcern. In: Walker SR, Rosser RM, eds. Quality of Life:Assessment and Application. Lancaster: MTP Press Ltd,1988: 297–304.
6. Bergner M. Quality of life, health status and clinicalresearch. Med Care 1989; 27: s148–s156.
7. Bowling A. Measuring Health: A Review of Quality of LifeMeasurement Scales. Milton Keynes: Open UniversityPress, 1991.
8. Fitzpatrick R, Fletcher A, Gore S, Jones D, Cox D. Qualityof life measures in health care. Applications and issues inassessment. BMJ 1992; 305: 1074–1077.
9. Wilson IB, Cleary PD. Linking clinical variables withhealth-related quality of life: a conceptual model ofpatient outcomes. JAMA 1995; 273: 59–65.
10. Andrews FM, Withey SB. Social Indicators of Well-being:Americans’ Perceptions of Life Quality. New York: PlenumPress, 1976.
11. Ware JE. The assessment of health status. In: Aiken LH,Mechanic D, eds. Applications of Social Science to ClinicalMedicine and Health Policy, 9th edn. New Brunswick:Rutgers University Press, 1986.
12. Hays RD, Stewart AL. The structure of self-report healthin chronic disease patients. Psychol Assess: J Consult ClinPsychol 1990; 2: 22–30.
13. Stewart AL, Ware JE. Measuring Functioning and Well-being. The Medical Outcomes Study Approach. Durham:Duke University Press, 1992.
14. Romney DM, Jenkins CD, Bynner JM. A structuralanalysis of health-related quality of life dimensions.Human Relat 1992; 47: 165–176.
15. Romney DM, Evans DR. Toward a general model ofhealth-related quality of life. Qual Life Res 1996; 5:235–241.
16. Cella DF, Tulsky DS, Gray G et al. The functionalassessment of cancer therapy scale: development andvalidation of the general measure. J Clin Oncol 1993; 11:570–579.
17. Lim LL, Valenti LA, Knapp JC et al. A self-administeredquality-of-life questionnaire after acute myocardialinfarction. J Clin Epidemiol 1993; 46: 1249–1256.
18. Streiner DL, Norman GR. Health Measurements Scales: APractical Guide to their Development and Use. Oxford:Oxford University Press, 1989.
19. O’Boyle CA, McGee H, Hickey A, O’Malley, Joyce CRB.Individual quality of life in patients undergoing hipreplacement. Lancet 1992; 339: 1088–1091.
20. Bowling A. What things are important in people’s lives?A survey of the public’s judgements to inform scales ofhealth related quality of life. Soc Sci Med 1995; 41:1447–1462.
21. Guyatt GH, Mitchell A, Irvine EJ et al. A new measure ofhealth status for clinical trials in inflammatory boweldisease. Gastroenterology 1989; 96: 804–810.
22. De Boer AGEM, Wijker W, Bartelsman JFW, de HaesHCJM. Inflammatory Bowel Disease Questionnaire:cross-cultural adaptation and further validation. Eur JGastroenterol Hepatol 1995; 7: 1043–1050.
23. De Boer AGEM, Wijker W, Speelman JD, de Haes JCJM.Quality of life in patients with Parkinson’s disease: thedevelopment of a questionnaire. J Neurol Neurosurg Psychiat 1996; 61: 70–74.
24. Hoyle RH. Introduction to the special section: structuralequation modelling in clinical research. J Consult ClinPsychol 1994; 62: 427–428.
25. Jöreskog KG, Sörbom D. LISREL 7: A Guide to the Programand Applications, 2nd edn. Chicago: SPSS Inc, 1989.
(Received 2 December 1996; accepted 30 September 1997)
A. G. E. M. de Boer et al.
142 Quality of Life Research . Vol 7 . 1998