Embed Size (px)
Citation preview
This article was downloaded by: [University of Tasmania]On: 29 November 2014, At: 13:39Publisher: Taylor & FrancisInforma Ltd Registered in England and Wales Registered Number: 1072954 Registeredoffice: Mortimer House, 37-41 Mortimer Street, London W1T 3JH, UK
Geophysical & Astrophysical FluidDynamicsPublication details, including instructions for authors andsubscription information:http://www.tandfonline.com/loi/ggaf20
Direct numerical simulations ofturbulent convection: II. variable gravityand differential rotationW. Cabot a & J. B. Pollack ba Center for Turbulence Research, Stanford University , Stanford,California, 94305, USAb NASA/Ames Research Center , Moffett Field, California, 94035,USAPublished online: 19 Aug 2006.
To cite this article: W. Cabot & J. B. Pollack (1992) Direct numerical simulations of turbulentconvection: II. variable gravity and differential rotation, Geophysical & Astrophysical Fluid Dynamics,64:1-4, 97-133, DOI: 10.1080/03091929208228086
To link to this article: http://dx.doi.org/10.1080/03091929208228086
PLEASE SCROLL DOWN FOR ARTICLE
Taylor & Francis makes every effort to ensure the accuracy of all the information (the“Content”) contained in the publications on our platform. However, Taylor & Francis,our agents, and our licensors make no representations or warranties whatsoever as tothe accuracy, completeness, or suitability for any purpose of the Content. Any opinionsand views expressed in this publication are the opinions and views of the authors,and are not the views of or endorsed by Taylor & Francis. The accuracy of the Contentshould not be relied upon and should be independently verified with primary sourcesof information. Taylor and Francis shall not be liable for any losses, actions, claims,proceedings, demands, costs, expenses, damages, and other liabilities whatsoever orhowsoever caused arising directly or indirectly in connection with, in relation to or arisingout of the use of the Content.
This article may be used for research, teaching, and private study purposes. Anysubstantial or systematic reproduction, redistribution, reselling, loan, sub-licensing,systematic supply, or distribution in any form to anyone is expressly forbidden. Terms &Conditions of access and use can be found at http://www.tandfonline.com/page/terms-and-conditions
Gruphys. Asrrophjs. Fluid Dynamics. Vol. 64, pp. 97- 133 Reprints available directly from the publisher Photocopying permitied by license only
( 1992 Gordon and Breach Science Publishers S A Printed in the United Kingdom
DIRECT NUMERICAL SIMULATIONS OF TURBULENT CONVECTION: 11. VARIABLE GRAVITY AND DIFFERENTIAL ROTATION
W. CABOT
Center for Turbulence Research, Stanford University, Stanford, California 94305 USA
J. B. POLLACK
NASAIAmes Research Center, Moffett Field, California 94035 USA
(Received 6 March 1991; in final form 3 September 1991)
Direct numerical simulations of incompressible channel flow have been performed that explore the effects of centrifugally stable differential rotation on thermal convection (with gravity and rotation axes aligned). In order to provide greater correspondence to the interior regions of astrophysical accretion disks, especially to the convective solar nebula, we consider a gravity that varies linearly with distance from midplane and Keplerian rotation. We are restricted, however, to unrealistically low Reynolds numbers. Our findings are: (1) Statistical thermal convective properties depend almost exclusively on Peclet number and epicyclic frequency, regardless of the anisotropy induced by the shear. ( 2 ) At low Reynolds numbers, Reynolds stresses show the remarkable behavior of changing sign with increasing rotation rate, going from positive to negative shear production rates. Higher-Reynolds-number simulations tend to retain positive shear production rates to more rapid rotation. (3) At very rapid rotation, independent of Reynolds number, the flow becomes quasi-two-dimensional by losing streamwise variation in one or more of its fluctuating variables (especially the vertical velocity). At this point the simulation results become unreliable. These results suggest that convection in accretion disks is characterized by very long azimuthal wavelengths, and that, in some circumstances, Reynolds stresses can feed turbulence kinetic energy to the mean flow in contradiction to the conventional eddy-viscosity ansatz.
KEY WORDS: Convection, turbulence, differential rotation, numerical integration, solar nebula
1 . INTRODUCTION
Turbulent Reynolds stresses are thought to be one means by which angular momentum and matter is transported in accretion disks. It has been proposed that thermal convection, especially in the solar nebula and other extrasolar protoplanetary nebulae now being observed, can provide a mechanism for generating turbulence, which, when coupled with the release of gravitational energy, can result in a quasi-steady transfer of angular momentum and mass. Lin and Papaloizou (1980), Ruden and Lin (1986), and Cabot et al. (1987a) have modelled convectively driven turbulent Reynolds stresses based on simple ad hoc diffusive relations between the Reynolds stress and rotational shear and on convective properties derived from mixing length models. Our objective here is to conduct numerical experiments of fully resolved turbulence under conditions similar to those found in thin, convective accretion disks in order to provide an experimental database with which to test the validity of such
91
G.A.F.D. D
Dow
nloa
ded
by [
Uni
vers
ity o
f T
asm
ania
] at
13:
39 2
9 N
ovem
ber
2014
98 W. CABOT A N D J. B. POLLACK
ad hoc models under more rigorous constraints than presently provided by astronomical observations.
As a first pass at investigating the physics of turbulent convection in the solar nebula and other astrophysical accretion disks, Cabot et al. (1990) (“Paper I” hereafter) considered the effects of linearly varying gravity and uniform rotation (with its axis parallel to gravity) on thermal convection driven by a uniform internal heat source. Direct numerical simulations were performed in the Boussinesq approximation in a semi-infinite channel with impermeable top and bottom walls. We extend that work here by introducing a differential rotation (with the rotational shear lying in a plane perpendicular to gravity), which allows us to investigate Reynolds stress production generated by thermal convection. For the most part, we will consider Keplerian rotation, which is approximately valid for most regions in a thin accretion disk; this rotational state is centrifugally stable, so that in the absence of buoyancy forces no turbulent motions are generated.
In Section 2 we survey the numerical methods for the direct simulations, which are essentially the same as in Paper I except for the special treatment of the rotational shear. The results of several run sequences are presented in Section 3. These results are discussed in Section 4 in terms of turbulence physics and with regard to implications for the solar nebula’s protoplanetary disk, and suggestions for future work are given.
2. NUMERICAL METHODS
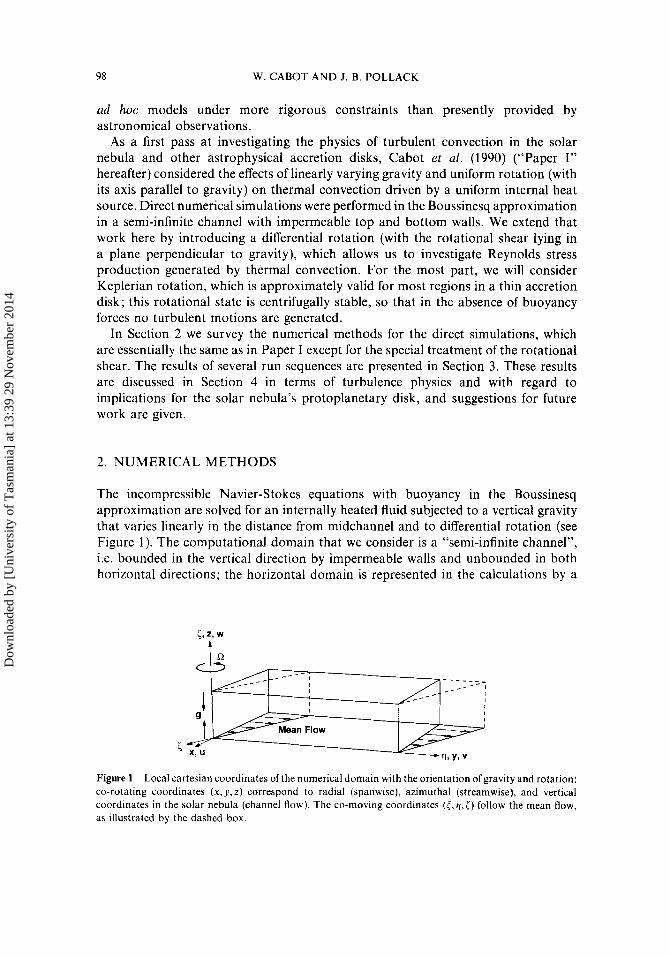
The incompressible Navier-Stokes equations with buoyancy in the Boussinesq approximation are solved for an internally heated fluid subjected to a vertical gravity that varies linearly in the distance from midchannel and to differential rotation (see Figure 1). The computational domain that we consider is a “semi-infinite channel”, i.e. bounded in the vertical direction by impermeable walls and unbounded in both horizontal directions; the horizontal domain is represented in the calculations by a
Figure 1 Local Cartesian coordinates of the numerical domain with the orientation ofgravity and rotation: co-rotating coordinates (x, y, z) correspond to radial (spanwise), azimuthal (streamwise), and vertical coordinates in the solar nebula (channel flow). The co-moving coordinates (<, q , i) follow the mean flow, as illustrated by the dashed box.
Dow
nloa
ded
by [
Uni
vers
ity o
f T
asm
ania
] at
13:
39 2
9 N
ovem
ber
2014
TURBULENT CONVECTION 99
finite region that periodically repeats itself ad injniturn. No-stress (free-slip) boundary conditions and fixed potential temperature are imposed at the impermeable walls, where the normal velocity component vanishes. A version of the channel code described in Paper I, originally developed by Kim et a!. (1987), is used here with special modifications required by the rotational shear, as described below.
In Paper I the unbounded horizontal directions were homogeneous in the frame of uniform (or no) rotation, and spectral methods were employed in a finite horizontal domain with periodic boundary conditions. Differential rotation with shear in the horizontal plane generally destroys this homogeneity. However, Rogallo (198 1) showed that the homogeneity of the governing equations could be recovered for a uniform shear rate in the co-moving frame. We therefore approximate the differential rotation by a linear variation of the mean rotational (streamwise) velocity in the spanwise direction, corresponding to an imposed uniform shear rate in the co-rotating frame. Our co-rotating coordinates x i = ( x , y , z ) are arranged such that z is the vertical (gravity and rotation axis) coordinate, y is the streamwise coordinate (along the direction of rotational flow), and x is the spanwise coordinate (along the direction of the gradient of the rotational flow); the corresponding velocity components are ui = (u, u , w). The co-moving coordinates are t i= ( t , q , [) (cf. Figure 1).
Following Rogallo (1981), the Navier-Stokes equations are transformed from the coordinates ( x i ) co-rotating at a rate SZ about the vertical axis to co-moving coordinates (ti) using ti = B i j x j , where B i j = d i j - (i?U,/dx,)t with the mean shear rate d U i / d x j = (dV/i?x)di2Sj1. However, in order to simplify the transformation, the velocity is still described by its co-rotating components. The governing equations are made dimensionless with a length scale 6 equal to the channel half-depth, a potential temperature scale Bo = qd2/2x, and a velocity scale uo = (PmaxB06)1iZ, where q is the thermometric heating rate, x is the coefficient of thermal diffusivity, and P,,, is the maximal vertical buoyancy coefficient equal to the magnitude of the gravity at the wal!s multiplied by the thermal expansion coefficient. The dimensionless Navier- Stokes and potential temperature equations in the co-moving coordinates become
where summation over repeated indices is observed. P is the reduced pressure (including centrifugal terms), = 5 for the linearly varying gravity, S = (6/u0)(BV/Bx) is the dimensionless shear rate, and o = 2SZ6/u0 is the dimensionless rotational vorticity, equal to the inverse of the scale Rossby number Ro in Paper I. The other dimensionless scale parameters are the Reynolds number Re = uo6/v (where v is the coefficient of dynamical viscosity) and the Peclet number Pe = uo6/x. Alternatively, one can parametrize in terms of a Rayleigh number Ra=2RePe, a Prandtl number Pr = Pe/Re, and a Taylor number Ta = Re2/Ro2. In addition, we specify the ratio of shear rate to rotational vorticity s=S/w. We often find it useful in this paper to
Dow
nloa
ded
by [
Uni
vers
ity o
f T
asm
ania
] at
13:
39 2
9 N
ovem
ber
2014
100 W. CABOT AND J. B. POLLACK
express the rotation rate in terms of the dimensionless epicyclic frequency
ti = [w (o + S)]”2 = o( 1 + s)l’2, (4)
defined for centrifugally stable rotation (S > - 0); K measures the restorative action of the Coriolis force. For uniform rotation s=O and K=W, while for Keplerian rotation s = - 314 and ti = 012.
Equations (1-3) are homogeneous in 5 and q becaue Bij is a function solely of time. Spectral decomposition can now be applied to the homogeneous directions with the wavevector correspondence k , = k , - Stk, , k , = k,. The numerical code uses a Chebyshev decomposition in the inhomogeneous vertical ( c ) direction on a collocated grid such that fast Fourier transforms can be applied in all three directions.
After several shear times (ISI-’) the co-moving mesh becomes very distorted. To follow the flow for an indefinite amount of time (in order to establish statistical equilibrium), we have implemented Rogallo’s (198 1) remeshing transformation. When the mesh is distorted by a set amount, the flow is interpolated back to a pre-distorted configuration making use of periodic conditions. In particular, the streamwise wavenumber n, is distorted as ny-SStn,/aqE, where n, are integers and a is the streamwise-to-spanwise aspect ratio of the horizontal computational domain. For S < 0, remeshing occurs when the mesh distortion - St/a,< reaches 0.5, and the flow is mapped to a mesh distortion of -0.5. The remeshing procedure is performed in horizontal wavespace with de-aliasing methods; some high-wavenumber energy and dissipation are discarded in the procedure.
Use of periodic boundary conditions is valid when the flow is uncorrelated at horizontal separations of half of the box size. This large-scale resolution is tested in the simulations by monitoring the autocorrelation functions of the fluctuating variables; we try to adjust horizontal domain sizes so that autocorrelation functions have decayed to sufficiently small values at half-box-size separations. In certain rapid rotation/shear regimes, we are unable to satisfy this resolution requirement; this problem is discussed in more detail in Section 3 . One-dimensional spectra of fluctuating intensities are monitored to assess the small-scale resolution of the simulation. Low to moderate Reynolds number simulations typically display a drop of 3 to 4 orders of magnitude in energy from low to high wavenumbers; some of the high Reynolds number, rapid shear simulations are less well resolved, with drops of 2 orders of magnitude or less in their energy spectra. For Reynolds numbers of 559, 1000, and 1789, the typical grid sizes N , x N , x N , are 64 x 64 x 33,96 x 96 x 49, and 128 x 128 x 65, respectively. The collocated vertical mesh results in a denser distribution of points near the walls and with these grid sizes is sufficient to resolve the viscous wall region.
The time-advancement uses the Adams-Bashford method for convective terms and Crank-Nicholson method for diffusion terms. (For more details, see Paper I and references therein.) The time-step is chosen to satisfy the more stringent of a convective or shear Courant-Friedrichs-Lewy (CFL) condition, such that the timestep is less than the lesser of lujl/Ai and a,S/N,ISI, where luil are maximal velocity components, Ai are grid spacings and N , is the number of streamwise grid points. The latter
‘19
Dow
nloa
ded
by [
Uni
vers
ity o
f T
asm
ania
] at
13:
39 2
9 N
ovem
ber
2014
TURBULENT CONVECTION 101
“shear” CFL condition is imposed so that the distortion of the mesh due to the shear does not proceed quicker than can be followed by the timestep. In practice the timestep is typically not limited by the shear CFL condition even at the most rapid shear rates because it becomes necessary to increase the streamwise-to-spanwise aspect ratio a,,( in this regime as well.
Simulations are initiated from fully developed turbulent fields with similar parameters in order to achieve a statistical steady state with the least amount of computational time. A simulation is deemed to have reached a statistical steady state when the mean potential temperature and the envelope of fluctuating intensities becomes nearly stationary. At this point statistical sampling in time and in the homogeneous horizontal directions is commenced in order to construct an approximation to an ensemble average via the ergodic hypothesis. In order to acquire undistorted flow statistics in the presence of shear, we sample the flow when the mesh becomes orthogonal once per aVt/ISI. This limits us for economical reasons to consider shear rates that are moderate to rapid with respect to the convective lapse rate (IS1 > a few tenths), because at small IS/ the timestep is limited by the convective CFL condition, while the statistical sampling occurs over very long intervals. From this statistical sampling, we derive mean fields (denoted by overbars), fluctuating fields (denoted by primes), root-mean-square statistics (denoted by an rms subscript), and volume averages (denoted by angle brackets). Since the mean velocity components are all identically or statistically zero, the distinction between total velocity field and fluctuating velocity field statistics will generally be ignored.
Simple test cases were performed for centrifugally stable (S > -0) and unstable (S < -0) differential rotation with no gravity, for which linear solutions can be easily found. Single-eigenmode initial conditions were evolved in the linear regime and found to agree very well with the linear analysis. These tests also clearly demonstrated the correct effect of remeshing on a single wavenumber mode: For modes with streamwise wavenumber n, #O, the spanwise wavenumber nt of the sole energy- containing mode was incremented (or decremented) by lnsl after each remeshing, such that the energy effectively “cascades” to high InE] at large times due to the shear.
3. RESULTS
a> Efects of DifSerent Keplerian Rotation Rates and Reynolds Numbers
A sequence of simulations (“K 1”) was performed in which Keplerian rotation (s= -0.75) was varied at the same Reynolds and Peclet numbers (Re=559 and Pe= 112) as the sequence in Paper I for uniform rotation and no-stress walls (“Ul”). We estimate in the Appendix that Pe should be about 10’ and the scaled epicyclic frequency ic should be about unity or greater for standard solar nebula models (cf. Ruden and Lin, 1986). In order to ascertain the effects of lower levels of viscosity, sequences of simulations (“K2” and “K3”) were also performed at Re= 1000 and 1789 for the same Pe (corresponding to lower P r and higher Ra) . For point of reference, the rotational stability limits from axisymmetric ( k , = 0) linear analysis (the same as in Paper I, Appendix A, except with K - ’ replacing Ro in the definition of
Dow
nloa
ded
by [
Uni
vers
ity o
f T
asm
ania
] at
13:
39 2
9 N
ovem
ber
2014

102 W. CABOT AND J. B. POLLACK
Table 1 Linear Marginal Stability Limits for k , = O and P e = 112
Stationary 559 4.1 1 (5)
1000 1.02 ( 6 ) 1789 2.50 ( 6 )
Oscillatory 559 3.52 ( 6 )
1000 2.51 (7) 1789 I .83 (8)
1.15 1.01 0.88
3.36 5.01 7.56
9.6 11.1 12.9
6.6b 7.9 9.2
0.194 0.177 0.159
Notes: oscillation frequency of perturbation; corrects erroneous value in Paper I .
Ta) are given in Table 1 for these values of P e and Re. Here Ta, and K , are the critical Taylor number and corresponding epicyclic frequency above which no exponentially growing mode (with or without oscillations) occurs. Nonaxisymmetric modes are always found to grow slower than axisymmetric ones in the long-time limit (Knobloch, 1985). The set-up parameters for the numerical simulations are listed in Table 2 .
The flow energetics can be examined with the Reynolds stress equations, which govern the statistical averages of the second-order products of fluctuating quantities u,EIJ and B'u,. Because of flow symmetry, UW, GW, 8'u, and @u are statistically zero; iZ and 6 are statistically finite due to the shear and buoyancy, respectively. The nontrivial second-order statistics, represented here by averages over time and horizontal directions, are governed by the following Reynolds stress equations at orthogonal meshes (i.e., when B l j = a,, and i', =xJ:
-
~ ~ ~~
f (u2) , . , + l [ u 2 w - R e - ' ( u ~ ) , ~ ] , , =ouv+Pu. , - Re-'u,,uy, ( 5 )
- (uu), , + [Uvw- Re- ' (uu). , ] , , =o[7- ( 1 + s ) u 2 ] -P(u + v, ,)-2Re- ' i i , u , , , (8)
where the mean potential temperature 0 = B is governed by
Dow
nloa
ded
by [
Uni
vers
ity o
f T
asm
ania
] at
13:
39 2
9 N
ovem
ber
2014
TURBULENT CONVECTION I03
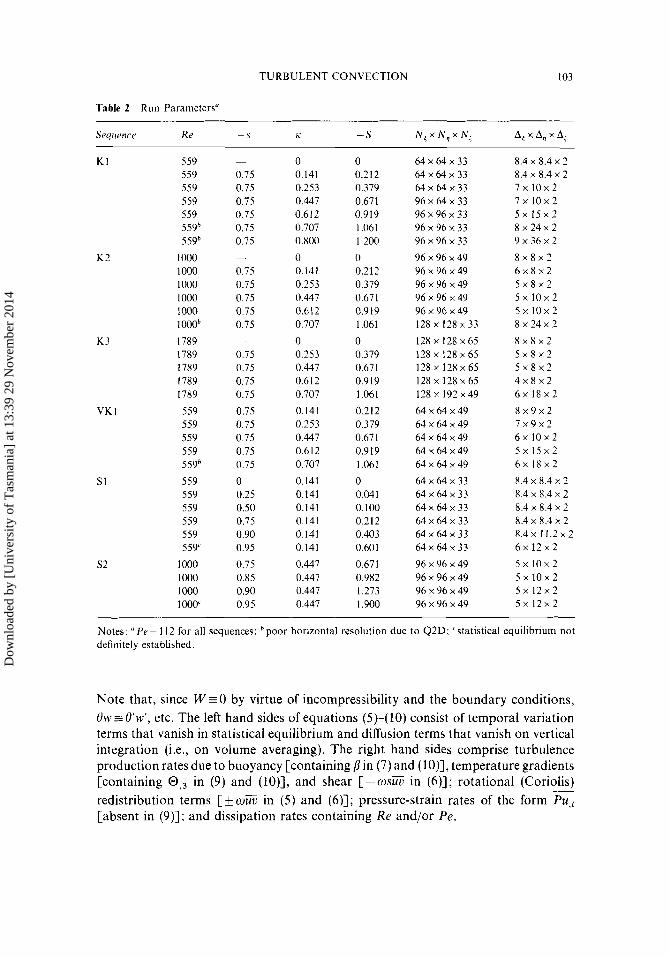
Table 2 Run Parameters'
Sequence Re --s K - S N g x N , x N , At x A4, x A:
K2
K3
VK 1
SI
s2
KI 559 559 559 559 559 559h 559b
1000 lo00 1000 1000 1000 1 OOOb
I789 1789 1789 1789 I789
559 559 559 559 559b
559 559 559 559 559 559'
I000 1000 1000 1000'
-
0.75 0.75 0.75 0.75 0.75 0.75 ~.
0.75 0.75 0.75 0.75 0.75 -
0.75 0.75 0.75 0.75
0.75 0.75 0.75 0.75 0.75
0 0.25 0.50 0.75 0.90 0.95
0.75 0.85 0.90 0.95
0 0.141 0.253 0.447 0.6 I 2 0.707 0.800
0 0.141 0.253 0.447 0.612 0.707
0 0.253 0.447 0.612 0.707
0.141 0.253 0.447 0.612 0.707
0.141 0.141 0.141 0.141 0.141 0.141
0.447 0.447 0.447 0.447
0 0.212 0.379 0.671 0.919 1.061 1.200
0 0.2 12 0.379 0.671 0.919 1.061
0 0.379 0.671 0.9 19 1.06 I 0.212 0.379 0.671 0.919 1.061
0 0.041 0.100 0.212 0.403 0.601
0.671 0.982 1.273 1.900
64 x 64 x 33 64 x 64 x 33 64 x 64 x 33 96 x 64 x 33 96 x 96 x 33 96 x 96 x 33 96 x 96 x 33
96 x 96 x 49 96 x 96 x 49 96 x 96 x 49 96 x 96 x 49 96 x 96 x 4 9 1 2 8 x 1 2 8 ~ 3 3
128 x I28 x 65 1 2 8 x 1 2 8 ~ 6 5 I28 x I28 x 65 1 2 8 x 1 2 8 ~ 6 5 128 x 192 x 49
64 x 64 x 49 64 x 64 x 49 64 x 64 x 4 9 64 x 64 x 49 64 x 64 x 49
64 x 64 x 33 6 4 x 64 x 33 6 4 x 64 x 33 6 4 x 64 x 33 64 x 64 x 33 64 x 64 x 33
96 x 96 x 49 96 x 96 x 49 96 x 96 x49 96 x 96 x 49
8.4 x 8.4 x 2 8.4 x 8.4 x 2 7 x l O x 2 7 x 1 0 ~ 2 5 x 1 5 ~ 2 8 x 2 4 ~ 2 9 x 3 6 ~ 2
8 x 8 ~ 2 6 x 8 ~ 2 5 x 8 ~ 2 5 x l O x 2 5 x l O x 2 8 x 2 4 ~ 2
8 x 8 ~ 2 5 x 8 ~ 2 5 x 8 ~ 2 4 x 8 ~ 2 6 x 1 8 ~ 2
8 x 9 ~ 2 7 ~ 9 x 2 6 x 1 0 x 2 5 X 1 5 X 2 6 x 1 8 ~ 2
8.4 x 8.4 x 2 8.4 x 8.4 x 2 8.4 x 8.4 x 2 8.4 x 8.4 x 2 8 . 4 ~ 1 1 . 2 ~ 2 6 x 1 2 ~ 2
5 x 1 0 ~ 2 5 x 1 0 ~ 2 5 X 1 2 X 2 5 x 1 2 ~ 2
Notes: * P e = 112 for all sequences: "poor horizontal resolution due to Q2D: 'statistical equilibrium not definitely established.
Note that, since W =O by virtue of incompressibility and the boundary conditions, Ow = O'w', etc. The left hand sides of equations (5)-( 10) consist of temporal variation terms that vanish in statistical equilibrium and diffusion terms that vanish on vertical integration (i.e., on volume averaging). The right hand sides comprise turbulence production rates due to buoyancy [containing fi in (7) and (lo)], temperature gradients [containing in (9) and (lo)], and shear [-wsuV in (6)]; rotational (Coriolis) redistribution terms [ oUV in (5) and (6)]; pressure-strain rates of the form & [absent in (9)]; and dissipation rates containing Re and/or Pe.
__ ~
Dow
nloa
ded
by [
Uni
vers
ity o
f T
asm
ania
] at
13:
39 2
9 N
ovem
ber
2014
104 W. CABOT AND J. B. POLLACK
MEAN TEMPERATURE PROFILE .5 r
TURBULENCE INTENSITIES
/
/ _ _ - - - _ * - -
' y ' .- /' '\
ui
. , . . . . . , _ _ - - E .I - ... L _ _ _ - -
.... ...- .... ... ....' ,
.... ,. ... 3 ... .
1 !
I I I I I I I I i 0 .2 .4 .6 .0 1 .o
z
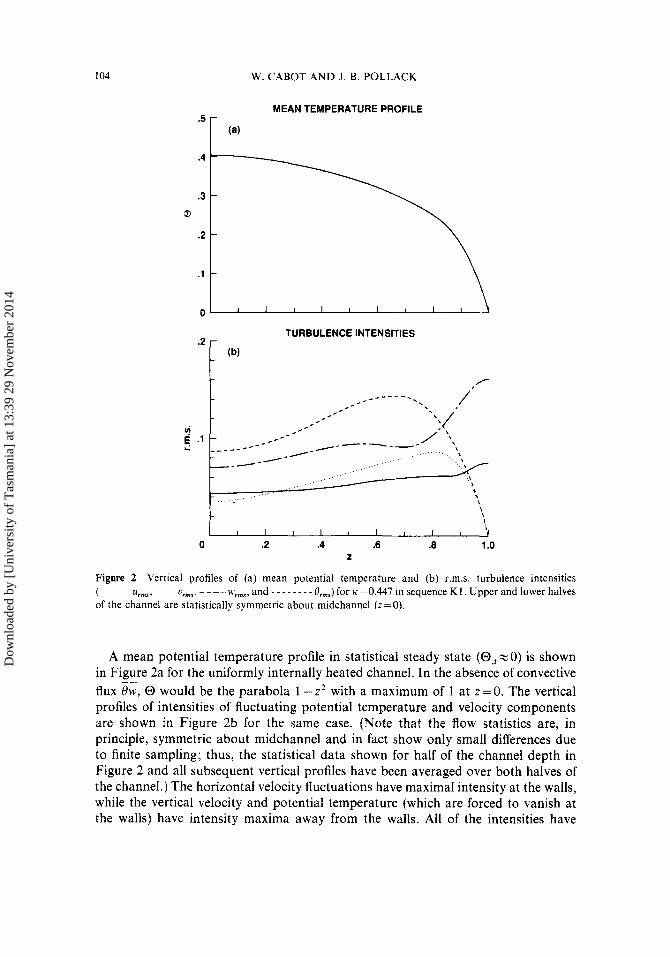
Figure 2 Vertical profiles of (a) mean potential temperature and (b) r.m.s. turbulence intensities (--- U,, , , -~ ,ns , ---- w,,,, and - - - - - - - - Q,,,) for K =0.447 in sequence K1. Upper and lower halves of the channel are statistically symmetric about midchannel (z =O).
A mean potential temperature profile in statistical steady state (O,,xO) is shown in Figure 2a for the uniformly internally heated channel. In the absence of convective flux %, 0 would be the parabola 1 - z2 with a maximum of 1 at z =O. The vertical profiles of intensities of fluctuating potential temperature and velocity components are shown in Figure 2b for the same case. (Note that the flow statistics are, in principle, symmetric about midchannel and in fact show only small differences due to finite sampling; thus, the statistical data shown for half of the channel depth in Figure 2 and all subsequent vertical profiles have been averaged over both halves of the channel.) The horizontal velocity fluctuations have maximal intensity at the walls, while the vertical velocity and potential temperature (which are forced to vanish at the walls) have intensity maxima away from the walls. All of the intensities have
Dow
nloa
ded
by [
Uni
vers
ity o
f T
asm
ania
] at
13:
39 2
9 N
ovem
ber
2014
TURBULENT CONVECTION I05
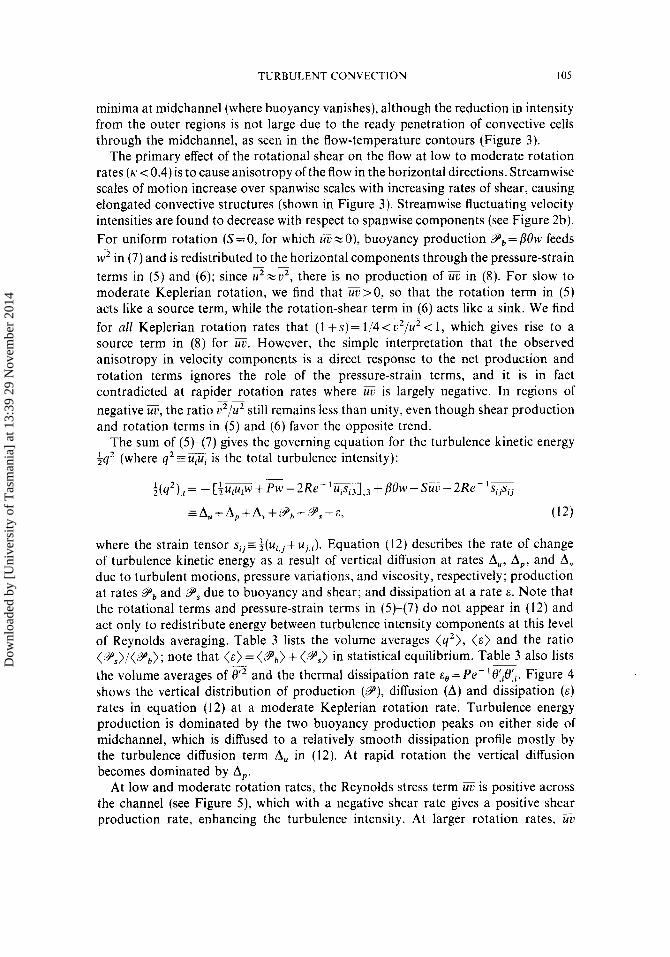
minima at midchannel (where buoyancy vanishes), although the reduction in intensity from the outer regions is not large due to the ready penetration of convective cells through the midchannel, as seen in the flow-temperature contours (Figure 3).
The primary effect of the rotational shear on the flow at low to moderate rotation rates ( K < 0.4) is to cause anisotropy of the flow in the horizontal directions. Streamwise scales of motion increase over spanwise scales with increasing rates of shear, causing elongated convective structures (shown in Figure 3). Streamwise fluctuating velocity intensities are found to decrease with respect to spanwise components (see Figure 2b). For uniform rotation ( S = 0, for which UV z 0), buoyancy production Pb = pew feeds w2 in (7) and is redistributed to the horizontal components through the pressure-strain terms in (5) and (6); since u2 z u 2 , there is no production of UV in (8). For slow to moderate Keplerian rotation, we find that E>O, so that the rotation term in ( 5 ) acts like a source term, while the rotation-shear term in (6) acts like a sink. We find for all Keplerian rotation rates that (1 +s)= 1/4<u2/u2 < 1, which gives rise to a source term in (8) for E. However, the simple interpretation that the observed anisotropy in velocity components is a direct response to the net production and rotation terms ignores the role of the pressure-strain terms, and it is in fact contradicted at rapider rotation rates where E is largely negative. In regions of negative UV, the ratio u2/u2 still remains less than unity, even though shear production and rotation terms in (5) and (6) favor the opposite trend.
The sum of (5)-(7) gives the governing equation for the turbulence kinetic energy +q2 (where q2 = ii& is the total turbulence intensity):
-
_ _
_ _
__ ~
~~ -
+(q2), , = - [f- + PW - 2Re- 1i&],3 +pew - siiu - 2Re- lsijsij
A,, + Ap+ Av + gpb + Yps -&, (12)
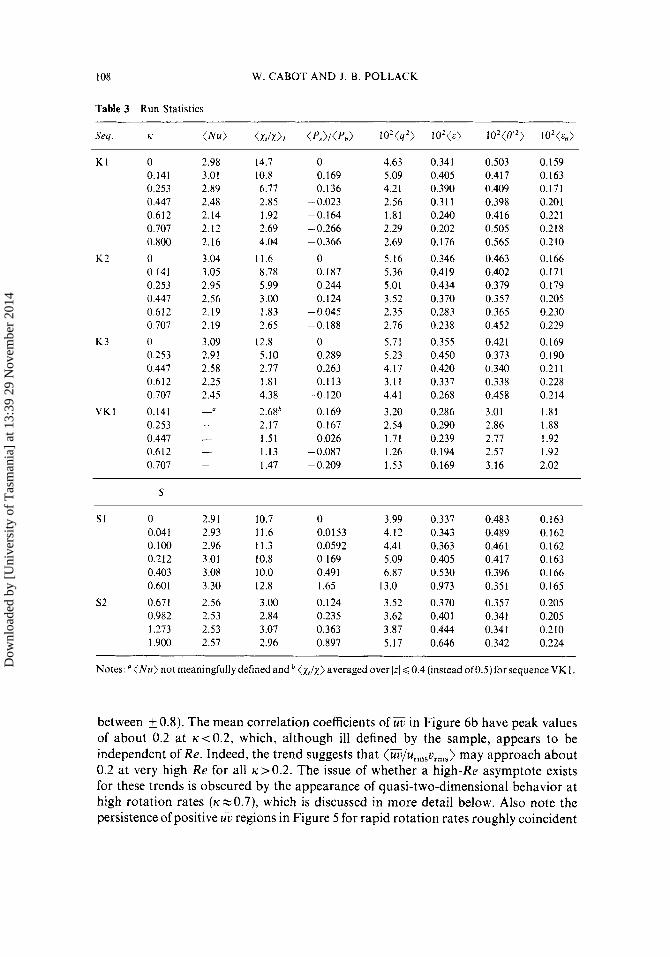
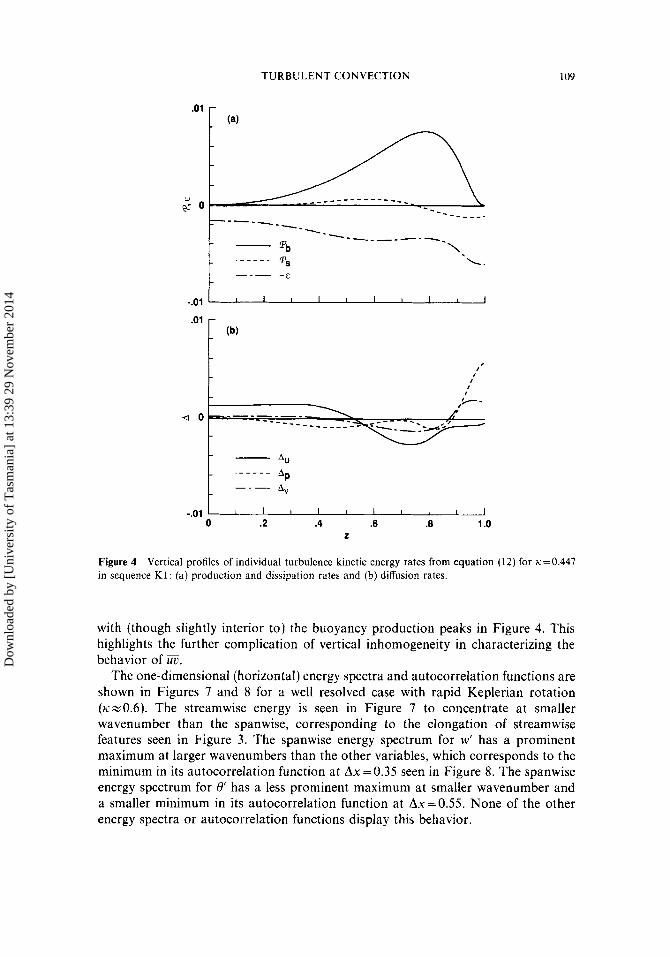
where the strain tensor Equation (12) describes the rate of change of turbulence kinetic energy as a result of vertical diffusion at rates A,,, Ap, and A, due to turbulent motions, pressure variations, and viscosity, respectively; production at rates PPb and Ps due to buoyancy and shear; and dissipation at a rate E . Note that the rotational terms and pressure-strain terms in (5)-(7) do not appear in (12) and act only to redistribute energy between turbulence intensity components at this level of Reynolds averaging. Table 3 lists the volume averages ( q 2 ) , (6) and the ratio (9s)/(S,); note that ( E ) = (Pb) + (9J in statistical equilibrium. Table 3 also lists the volume averages of and the thermal dissipation rate E e = P e - ' m . Figure 4 shows the vertical distribution of production (9), diffusion (A) and dissipation ( E )
rates in equation (12) at a moderate Keplerian rotation rate. Turbulence energy production is dominated by the two buoyancy production peaks on either side of midchannel, which is diffused to a relatively smooth dissipation profile mostly by the turbulence diffusion term A,, in (12). At rapid rotation the vertical diffusion becomes dominated by Ap.
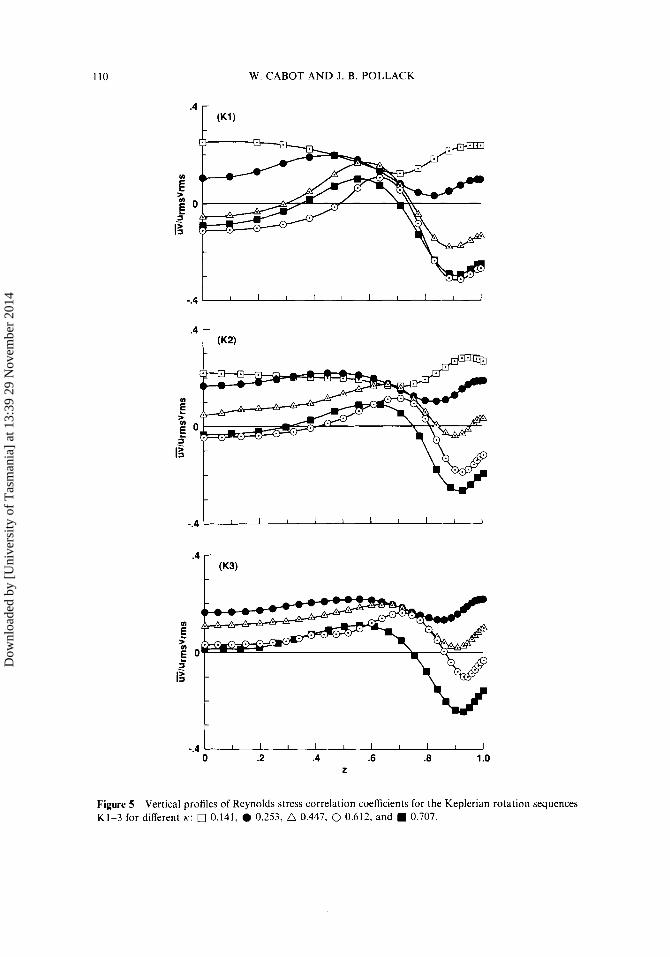
At low and moderate rotation rates, the Reynolds stress term UV is positive across the channel (see Figure 5), which with a negative shear rate gives a positive shear production rate, enhancing the turbulence intensity. At larger rotation rates, UV
Dow
nloa
ded
by [
Uni
vers
ity o
f T
asm
ania
] at
13:
39 2
9 N
ovem
ber
2014
106 W. CABOT AND J. B. POLLACK
l l l i l l l ~ l ~ ~ l ~ ~ ~ ~ ~ ~ ~ ~ ~ ~ ~ ~ ~ ~ ~ ~ ~ ~ ~ ~ ~ ~ ~ ~ ~ ~ ~ ~ ~ ~ ~ ~ ~
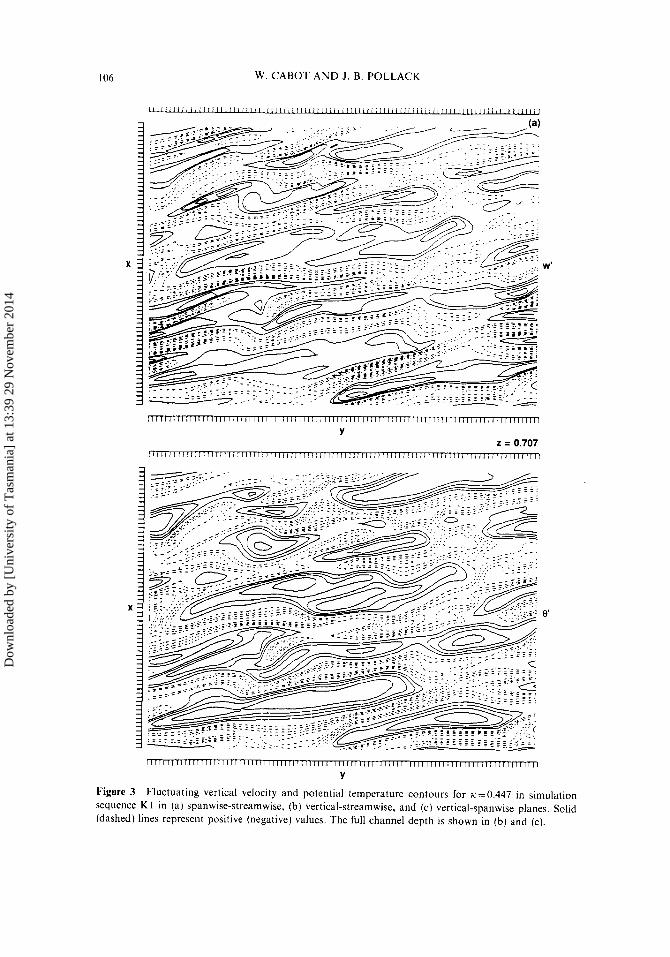
Y Figure 3 Fluctuating vertical velocity and potential temperature contours for K = 0.447 in simulation sequence K1 in (a) spanwise-streamwise, (b) vertical-streamwise, and (c) vertical-spanwise planes. Solid (dashed) lines represent positive (negative) values. The full channel depth is shown in (b) and (c).
Dow
nloa
ded
by [
Uni
vers
ity o
f T
asm
ania
] at
13:
39 2
9 N
ovem
ber
2014
TURBULENT CONVECTION 107
r n n I I I I I I I I I I I I mmnTm I I I I I I I I I I I I I I I 1 1 I I I I I I I I l l
Y
Figure 3 (cont.).
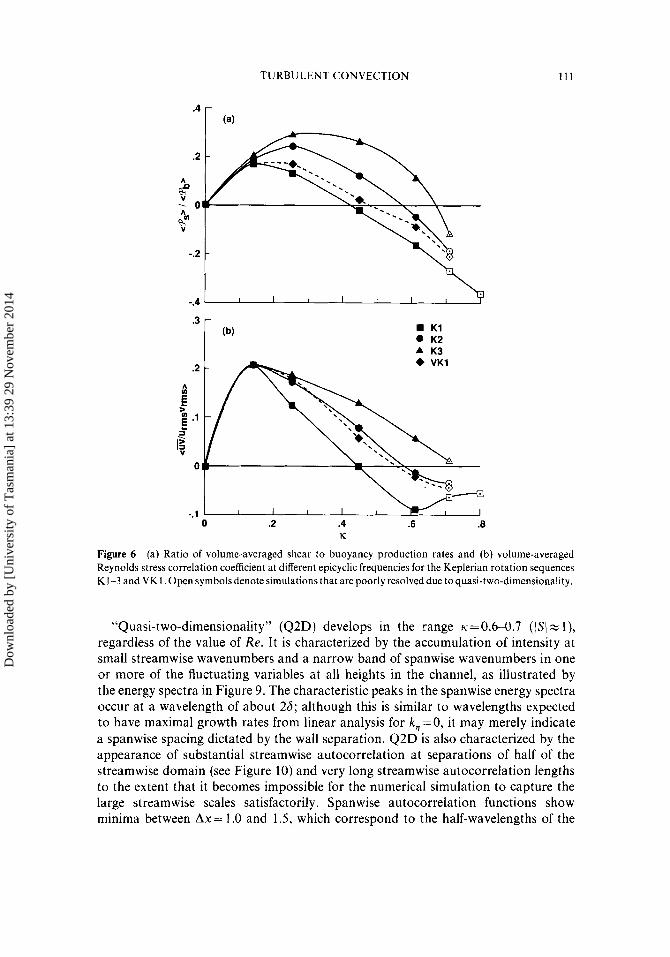
becomes negative near the walls and near midchannel to the extent that (Ps) becomes negative, diminishing the turbulence intensity compared with uniformly rotating cases at the same K . This trend occurs at larger ti the larger the value of Re (see Figures 5 and 6a). Both the peak value of (Ps)/(Pb) and the value of ti at which it occurs increase with increasing Re; this appears (cf. Figure 6b) to be a result of a slower decline of UV with increasing ti and IS/. The correlation coefficients of UV in Figure 5 are always relatively weak (between k0.3) compared, e.g., with those for 8w (typically
Dow
nloa
ded
by [
Uni
vers
ity o
f T
asm
ania
] at
13:
39 2
9 N
ovem
ber
2014
108 W. CABOT AND J. B. POLLACK
KI
K2
K3
VK 1
0 0.141 0.253 0.447 0.612 0.707 0.800 0 0.141 0.253 0.447 0.612 0.707 0 0.253 0.447 0.6 12 0.707 0.141 0.253 0.447 0.612 0.707
2.98 3.01 2.89 2.48 2.14 2.12 2.16 3.04 3.05 2.95 2.56 2.19 2.19 3.09 2.91 2.58 2.25 2.45 -
_ _ - -
-
14.7 10.8 6.77 2.85 1.92 2.69 4.04
11.6 8.78 5.99 3 .oo 1.83 2.65
12.8 5.10 2.77 1.81 4.38 2.68* 2.17 1.51 1.13 I .47
0 0.169 0.136
-0.164
-0.366
-0.023
-0.266
0 0.187 0.244 0. I24
- 0.045 -0.188
0 0.289 0.263 0.113
-0.120 0.169 0.167 0.026
-0.087 -0.209
4.63 5.09 4.21 2.56 1.81 2.29 2.69 5.16 5.36 5.01 3.52 2.35 2.76 5.71 5.23 4.17 3.11 4.41 3.20 2.54 1.71 1.26 1.53
0.341 0.405 0.390 0.311 0.240 0.202 0.176 0.346 0.4 I9 0.434 0.370 0.283 0.238 0.355 0.450 0.420 0.337 0.268 0.286 0.290 0.239 0.194 0.169
0.503 0.417 0.409 0.398 0.416 0.505 0.565 0.463 0.402 0.379 0.357 0.365 0.452 0.421 0.373 0.340 0.338 0.458 3.01 2.86 2.77 2.57 3.16
0.159 0.163 0.171 0.201 0.221 0.218 0.210 0.166 0.171 0.179 0.205 0.230 0.229 0.169 0.190 0.21 I 0.228 0.214 1.81 1.88 1.92 1.92 2.02
- S
SI 0 2.91 10.7 0 3.99 0.337 0.483 0.163 0.041 2.93 11.6 0.0153 4.12 0.343 0.489 0.162 0.100 2.96 11.3 0.0592 4.41 0.363 0.461 0.162 0.212 3.01 10.8 0.169 5.09 0.405 0.417 0.163 0.403 3.08 10.0 0.49 1 6.87 0.530 0.396 0.166 0.601 3.30 12.8 I .65 13.0 0.973 0.351 0.165
s 2 0.671 2.56 3.00 0.124 3.52 0.370 0.357 0.205 0.982 2.53 2.84 0.235 3.62 0.401 0.341 0.205 1.273 2.53 3.07 0.363 3.87 0.444 0.341 0.210 1.900 2.57 2.96 0.897 5.17 0.646 0.342 0.224
Notes:" ( N u ) not meaningfully defined and (zr/x) averaged over /zI G0.4 (instead of0.5)forsequence VK 1.
between f 0.8). The mean correlation coefficients of UV in Figure 6b have peak values of about 0.2 at ~ ~ 0 . 2 , which, although ill defined by the sample, appears to be independent of Re. Indeed, the trend suggests that (iE/ur,,,prmS) may approach about 0.2 at very high Re for all ~ > 0 . 2 . The issue of whether a high-Re asymptote exists for these trends is obscured by the appearance of quasi-two-dimensional behavior at high rotation rates (~=0.7), which is discussed in more detail below. Also note the persistence of positive UV regions in Figure 5 for rapid rotation rates roughly coincident
Dow
nloa
ded
by [
Uni
vers
ity o
f T
asm
ania
] at
13:
39 2
9 N
ovem
ber
2014
TURBULENT CONVECTION 109
I I I I I 1 I I I I
, I ,
I I
All
AP AV
-.01 I I I I I I I 1 I I 0 .2 .4 .6 .a 1 .o
2
Figure 4 in sequence K1: (a) production and dissipation rates and (b) diffusion rates.
Vertical profiles of individual turbulence kinetic energy rates from equation (12) for ~=0.447
with (though slightly interior to) the buoyancy production peaks in Figure 4. This highlights the further complication of vertical inhomogeneity in characterizing the behavior of UV.
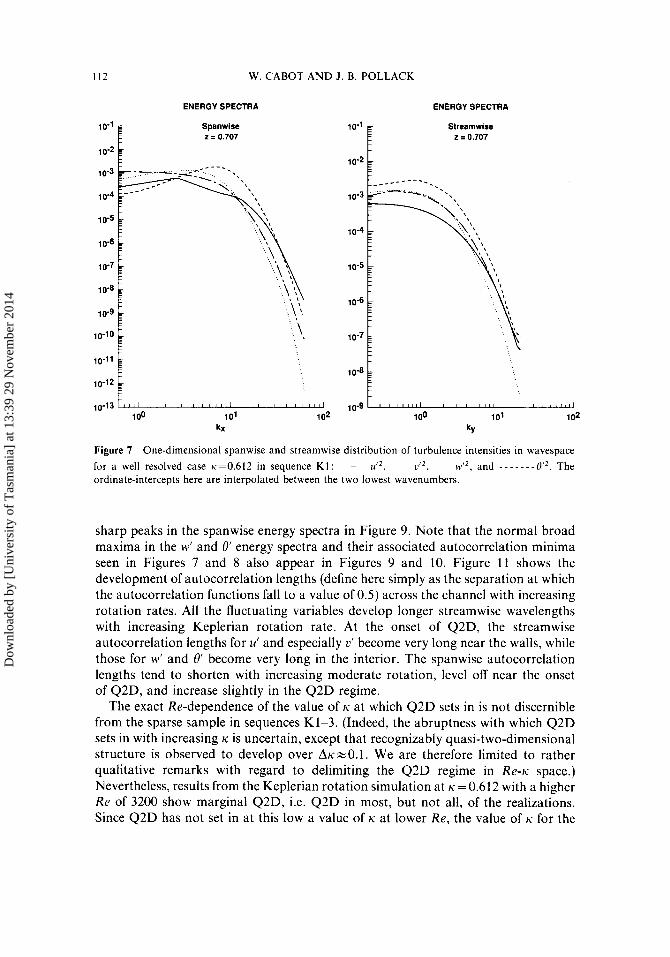
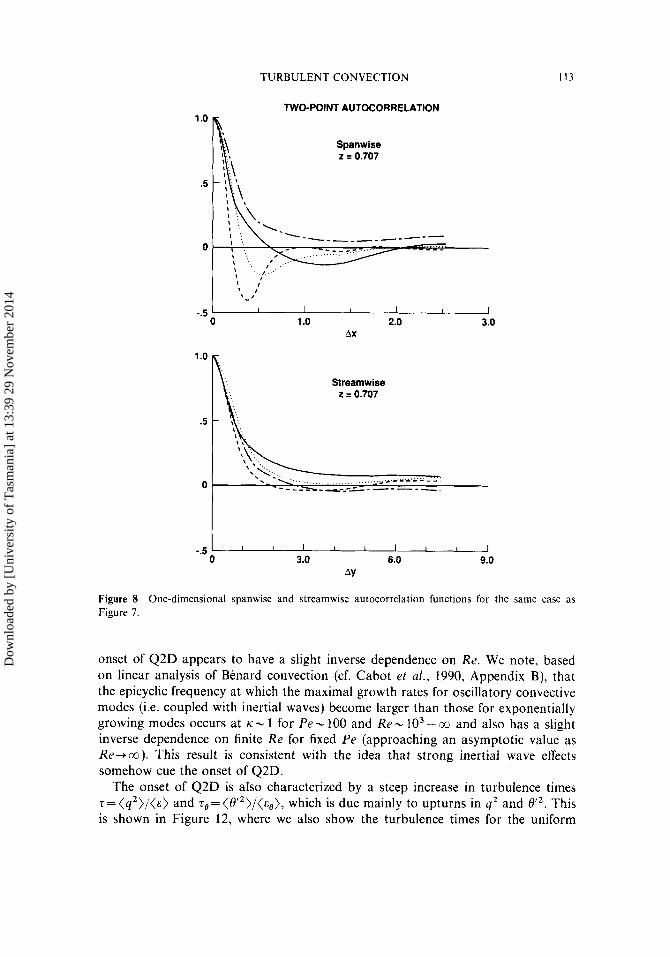
The one-dimensional (horizontal) energy spectra and autocorrelation functions are shown in Figures 7 and 8 for a well resolved case with rapid Keplerian rotation ( ~ ~ 0 . 6 ) . The streamwise energy is seen in Figure 7 to concentrate at smaller wavenumber than the spanwise, corresponding to the elongation of streamwise features seen in Figure 3. The spanwise energy spectrum for w' has a prominent maximum at larger wavenumbers than the other variables, which corresponds to the minimum in its autocorrelation function at Ax=O.35 seen in Figure 8. The spanwise energy spectrum for 8' has a less prominent maximum at smaller wavenumber and a smaller minimum in its autocorrelation function at Ax=O.55. None of the other energy spectra or autocorrelation functions display this behavior.
Dow
nloa
ded
by [
Uni
vers
ity o
f T
asm
ania
] at
13:
39 2
9 N
ovem
ber
2014
110 W. CABOT AND J. B. POLLACK
-.4 I I I I I I I I I I
'4 c (K2)
-.4 0 .2 .4 .6 .0 1 .o
z
Figure 5 K1-3 for different ti: 0 0.141, 0 0.253, A 0.447, 0 0.612, and
Vertical profiles of Reynolds stress correlation coefficients for the Keplerian rotation sequences 0.707.
Dow
nloa
ded
by [
Uni
vers
ity o
f T
asm
ania
] at
13:
39 2
9 N
ovem
ber
2014
TURBULENT CONVECTION
.3 r K1
0 K2 A K3
0 .2 .4 .6 .8 K
Figure 6 (a) Ratio of volume-averaged shear to buoyancy production rates and (b) volume-averaged Reynolds stress correlation coefficient at different epicyclic frequencies for the Keplerian rotation sequences K 1-3 and VKl . Open symbolsdenote simulations that are poorly resolved due to quasi-two-dimensionality .
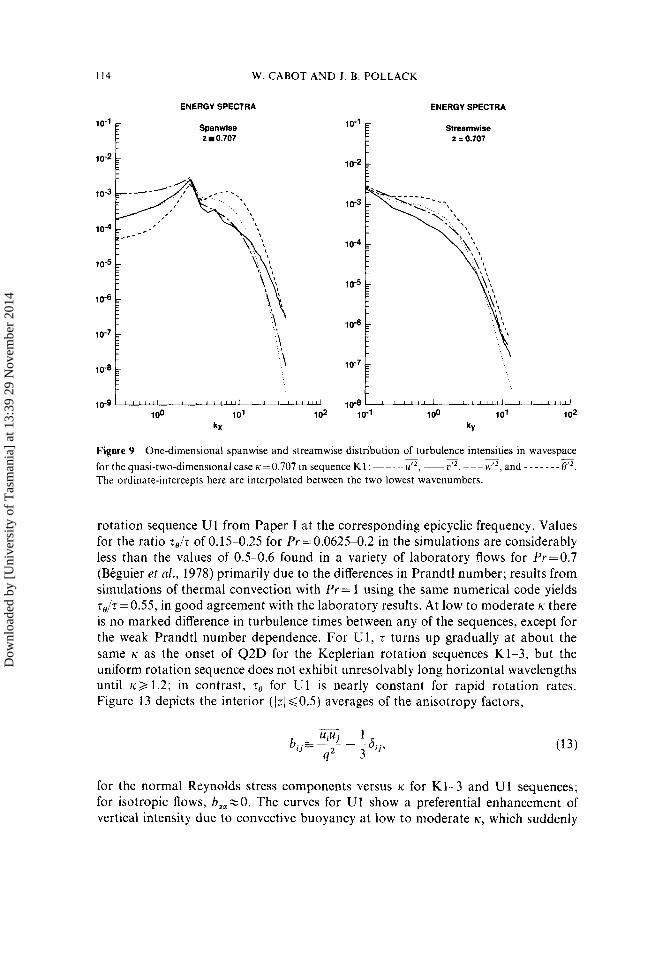
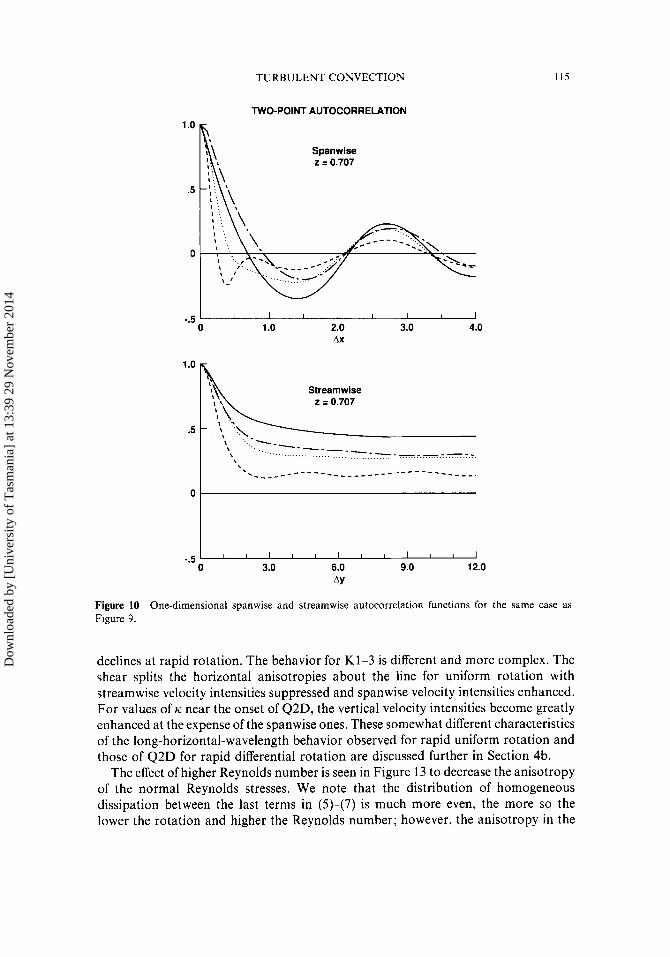
“Quasi-two-dimensionality’’ ( 4 2 0 ) develops in the range ~=0.6-0.7 (IS1 z l), regardless of the value of Re. It is characterized by the accumulation of intensity at small streamwise wavenumbers and a narrow band of spanwise wavenumbers in one or more of the fluctuating variables at all heights in the channel, as illustrated by the energy spectra in Figure 9. The characteristic peaks in the spanwise energy spectra occur at a wavelength of about 26; although this is similar to wavelengths expected to have maximal growth rates from linear analysis for k , = O , it may merely indicate a spanwise spacing dictated by the wall separation. Q2D is also characterized by the appearance of substantial streamwise autocorrelation at separations of half of the streamwise domain (see Figure 10) and very long streamwise autocorrelation lengths to the extent that it becomes impossible for the numerical simulation to capture the large streamwise scales satisfactorily. Spanwise autocorrelation functions show minima between Ax= 1 .O and 1.5, which correspond to the half-wavelengths of the
Dow
nloa
ded
by [
Uni
vers
ity o
f T
asm
ania
] at
13:
39 2
9 N
ovem
ber
2014
112 W. CABOT AND J. B. POLLACK
ENERGYSPECTRA ENERGYSPECTRA
Spanwioe Z = 0.707
tb I I I I I 1 00 101 102
kx
Streamwise L = 0.707
Figure 7 One-dimensional spanwise and streamwise distribution of turbulence intensities in wavespace for a well resolved case ~ = 0 . 6 1 2 in sequence K I : - - - u ” , -d2, ~~~ w”, and - - - - - - - 0‘’. The ordinate-intercepts here are interpolated between the two lowest wavenumbers.
- ~ ~ ~~~
sharp peaks in the spanwise energy spectra in Figure 9. Note that the normal broad maxima in the w’ and 0‘ energy spectra and their associated autocorrelation minima seen in Figures 7 and 8 also appear in Figures 9 and 10. Figure 11 shows the development of autocorrelation lengths (define here simply as the separation at which the autocorrelation functions fall to a value of 0.5) across the channel with increasing rotation rates. All the fluctuating variables develop longer streamwise wavelengths with increasing Keplerian rotation rate. At the onset of Q2D, the streamwise autocorrelation lengths for u’ and especially u’ become very long near the walls, while those for w‘ and 13’ become very long in the interior. The spanwise autocorrelation lengths tend to shorten with increasing moderate rotation, level off near the onset of Q2D, and increase slightly in the Q2D regime.
The exact Re-dependence of the value of K at which Q2D sets in is not discernible from the sparse sample in sequences K1-3. (Indeed, the abruptness with which Q2D sets in with increasing ti is uncertain, except that recognizably quasi-two-dimensional structure is observed to develop over AtizO.1. We are therefore limited to rather qualitative remarks with regard to delimiting the Q2D regime in Re-ti space.) Nevertheless, results from the Keplerian rotation simulation at K = 0.61 2 with a higher Re of 3200 show marginal Q2D, i.e. Q2D in most, but not all, of the realizations. Since Q2D has not set in at this low a value of K at lower Re, the value of ti for the
Dow
nloa
ded
by [
Uni
vers
ity o
f T
asm
ania
] at
13:
39 2
9 N
ovem
ber
2014
TURBULENT CONVECTION 113
1 .o
.5
0
TWO-POINT AUTOCORRELATION
Spanwise Z = 0.707
-.5 ' I I I I I I 0 1 .o 2.0 3.0
AX
I \I. Streamwise
-.5 0 3.0 6.0 9.0
AY
Figure 8 One-dimensional spanwise and streamwise autocorrelation functions for the same case as Figure 7.
onset of Q2D appears to have a slight inverse dependence on Re. We note, based on linear analysis of Benard convection (cf. Cabot et al., 1990, Appendix B), that the epicyclic frequency at which the maximal growth rates for oscillatory convective modes (i.e. coupled with inertial waves) become larger than those for exponentially growing modes occurs at K - 1 for P e - 100 and R e - lo3 - 03 and also has a slight inverse dependence on finite Re for fixed Pe (approaching an asymptotic value as R e - a ) . This result is consistent with the idea that strong inertial wave effects somehow cue the onset of Q2D.
The onset of Q2D is also characterized by a steep increase in turbulence times . r = ( q 2 ) / ( & ) and t e=( t l '2 ) / (~ , ) , which is due mainly to upturns in q2 and el2. This is shown in Figure 12, where we also show the turbulence times for the uniform
Dow
nloa
ded
by [
Uni
vers
ity o
f T
asm
ania
] at
13:
39 2
9 N
ovem
ber
2014
114 W. CABOT A N D J. B. POLLACK
ENERGY SPECTRA ENERGY SPECTRA
Streamwise Z = 0.707
10.2
Spanwise Z 0.707
10.2
10-4
10-5
10.6
10-7
1 0-8
10.9
Figure 9 One-dimensional spanwise and streamwise distribution of turbulence intensities in wavespace for thequasi-two-dimensionalcasek-=0.707in sequence Kl:-----~’~,---u‘~,---w’~,and - - - - - - - t Y 2 . The ordinate-intercepts here are interpolated between the two lowest wavenumbers.
~ ~ - -
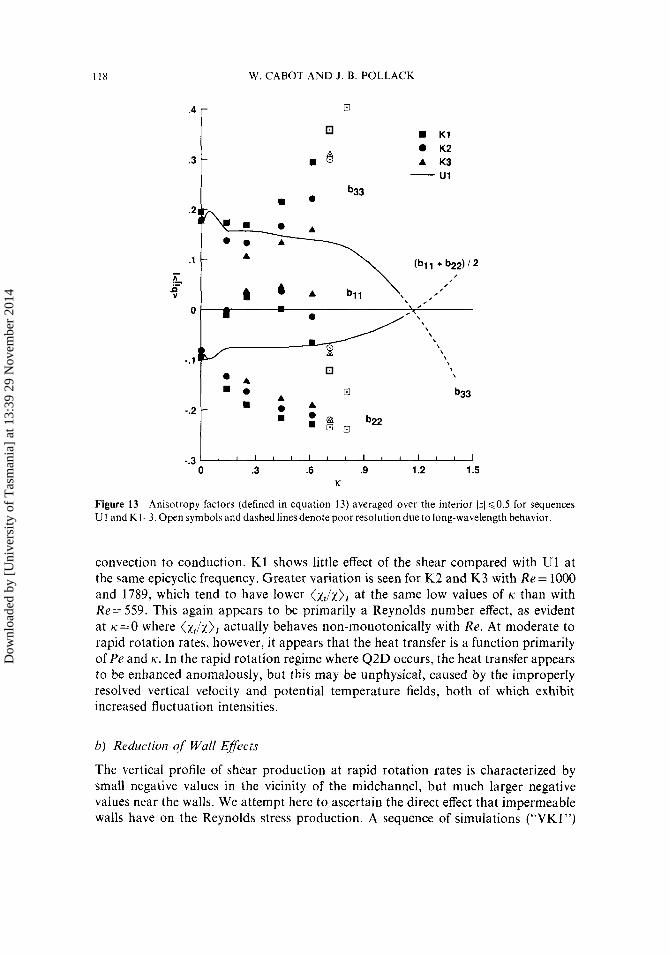
rotation sequence U1 from Paper I at the corresponding epicyclic frequency. Values for the ratio T ~ / T of 0.15-0.25 for Pr=0.0625-0.2 in the simulations are considerably less than the values of 0.5-0.6 found in a variety of laboratory flows for Pr=0.7 (Beguier et al., 1978) primarily due to the differences in Prandtl number; results from simulations of thermal convection with Pr = 1 using the same numerical code yields so/z =0.55, in good agreement with the laboratory results. At low to moderate K there is no marked difference in turbulence times between any of the sequences, except for the weak Prandtl number dependence. For U1, T turns up gradually at about the same ti as the onset of Q2D for the Keplerian rotation sequences K1-3, but the uniform rotation sequence does not exhibit unresolvably long horizontal wavelengths until ti2 1.2; in contrast, T @ for U1 is nearly constant for rapid rotation rates. Figure 13 depicts the interior ( lzl60.5) averages of the anisotropy factors,
U.U. 1 b..= 2 - -6.. ”- q2 3 ‘ I ’
for the normal Reynolds stress components versus K for K1-3 and U1 sequences; for isotropic flows, b,,%0. The curves for U1 show a preferential enhancement of vertical intensity due to convective buoyancy at low to moderate K, which suddenly
Dow
nloa
ded
by [
Uni
vers
ity o
f T
asm
ania
] at
13:
39 2
9 N
ovem
ber
2014
TURBULENT CONVECTION
0 .
-.5
115
\ ... ---- .... .... -------_ - - - -_ \ ..........................
\ ............................................
\ \ - _ _ _ - - - - - - - - - - - - - - - _ _ . _ - - - - - _ - - _ _ - -
1 1 1 1 1 1 1 1 1 1 1 1
TWO-POINT AUTOCORRELATION 1 .o
.5
0
Spanwise z = 0.707 Spanwise z = 0.707
I I . \ - .
-.5 L I I I I 1 I I I 0 1 .o 2.0 3.0 4.0
AX
Figure 10 One-dimensional spanwise and streamwise autocorrelation functions for the same case as Figure 9.
declines at rapid rotation. The behavior for K1-3 is different and more complex. The shear splits the horizontal anisotropies about the line for uniform rotation with streamwise velocity intensities suppressed and spanwise velocity intensities enhanced. For values of K near the onset of Q2D, the vertical velocity intensities become greatly enhanced at the expense of the spanwise ones. These somewhat different characteristics of the long-horizontal-wavelength behavior observed for rapid uniform rotation and those of Q2D for rapid differential rotation are discussed further in Section 4b.
The effect of higher Reynolds number is seen in Figure 13 to decrease the anisotropy of the normal Reynolds stresses. We note that the distribution of homogeneous dissipation between the last terms in (5)-(7) is much more even, the more so the lower the rotation and higher the Reynolds number; however, the anisotropy in the
Dow
nloa
ded
by [
Uni
vers
ity o
f T
asm
ania
] at
13:
39 2
9 N
ovem
ber
2014
116 W. CABOT A N D J. B. POLLACK
AUTOCORRELATION LENGTHS
,; 1.0
L \
E 1.0 4
2.0 2.0
j l . 0 3 1 . 0
0 .2 4 .6 .a 1.0 0 2 .4 .6 .a 1 .o z 2
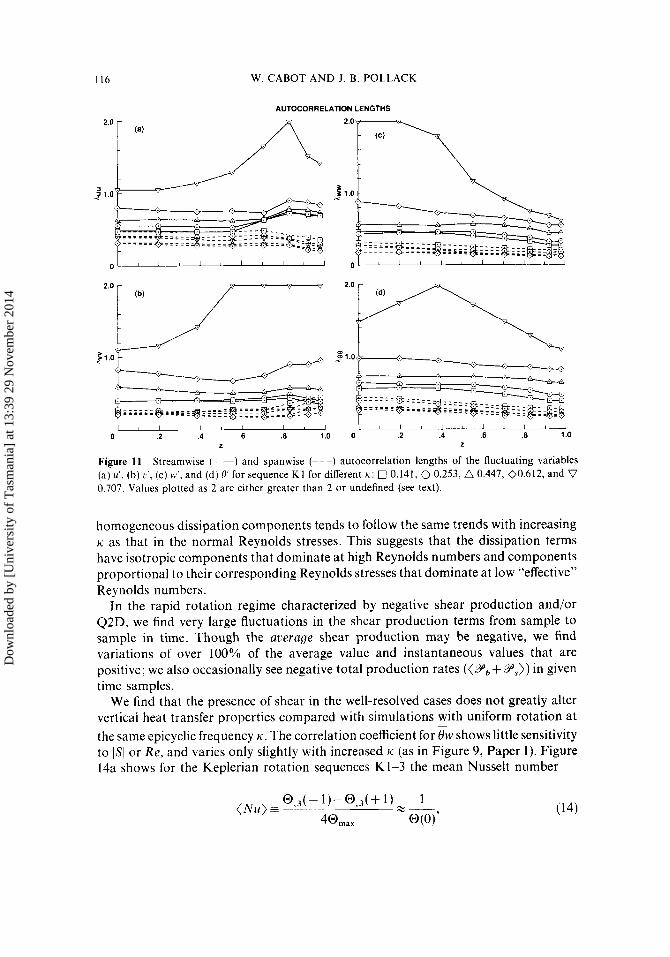
Figure 11 Streamwise (--) and spanwise (---) autocorrelation lengths of the fluctuating variables (a) u'. (b) t : ' , (c) w', and (d) 0' for sequence K1 for different K : 0 0.141, 0 0.253, A 0.447, 00.612, and V 0.707. Values plotted as 2 are either greater than 2 or undefined (see text).
homogeneous dissipation components tends to follow the same trends with increasing ti as that in the normal Reynolds stresses. This suggests that the dissipation terms have isotropic components that dominate at high Reynolds numbers and components proportional to their corresponding Reynolds stresses that dominate at low "effective" Reynolds numbers.
In the rapid rotation regime characterized by negative shear production and/or Q2D, we find very large fluctuations in the shear production terms from sample to sample in time. Though the average shear production may be negative, we find variations of over 100% of the average value and instantaneous values that are positive; we also occasionally see negative total production rates ((Yb + Y s ) ) in given time samples.
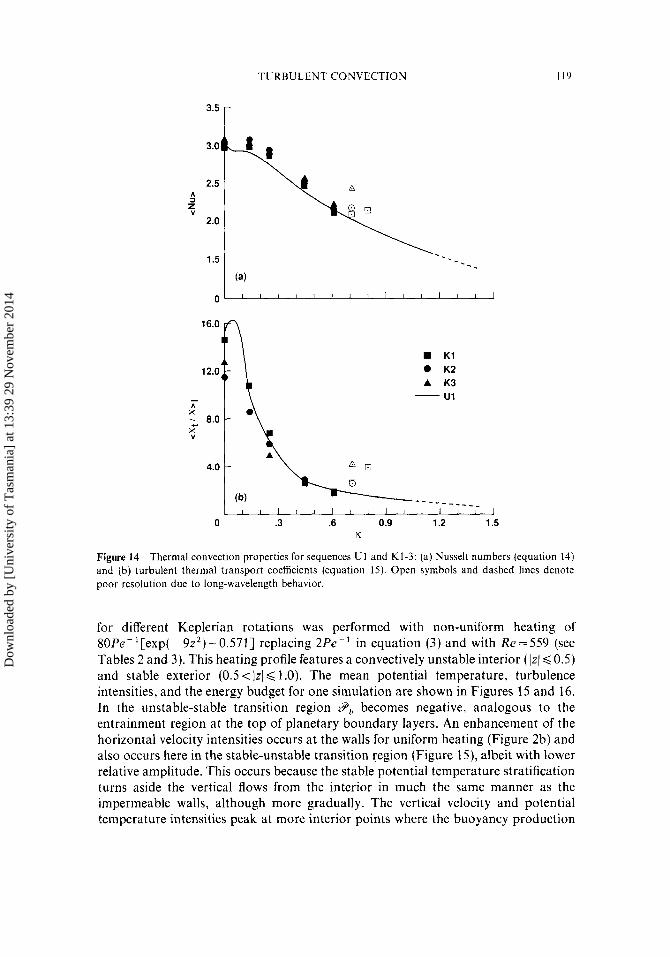
We find that the presence of shear in the well-resolved cases does not greatly alter vertical heat transfer properties compared with simulations with uniform rotation at the same epicyclic frequency ti. The correlation coefficient for 8w shows little sensitivity to IS1 or Re, and varies only slightly with increased ti (as in Figure 9, Paper I). Figure 14a shows for the Keplerian rotation sequences K1-3 the mean Nusselt number
@ , 3 ( - l ) - @ , 3 ( + l ) - 1 ( N u ) - - ----,
4@,,, @(O)
Dow
nloa
ded
by [
Uni
vers
ity o
f T
asm
ania
] at
13:
39 2
9 N
ovem
ber
2014

TURBULENT CONVECTION 117
20.0
10.0
5.0
A , , ,
0 1
'.O I 0 K2 A K3
u1 -
0 .3 .6 0.9 1.2 1.5 K
Figure 12 Global turbulence times (a) 7 = ( q 2 ) / ( & ) and (b) T ~ = ( 0 2 ) / ( & , ) for uniform rotation sequence U1 and the Keplerian rotation sequences KI-3. Open symbols and dashed lines denote poor resolution due to long-wavelength behavior.
which measures the effect of convective turbulence on the mean temperature profile (but which is primarily determined by turbulent heat transfer near the walls). It is compared here with uniform rotation simulations from Paper I (Ul). K1 shows a slight increase in ( N u ) over U1 at low to moderate ti, but a slight decrease at ~ = 0 . 6 , which can be largely ascribed to enhancement/diminishment of the turbulence intensity by positive/negative shear production. Slightly larger values of ( N u ) for K2 and K3 appear to be due mostly to their larger Reynolds numbers (as seen at ti = 0). Figure 14b shows for the same sequences the convective heat transfer coefficient
averaged over the interior flow (/zI 60.5) , ( x , / x ) ~ , which measures the efficiency of
Dow
nloa
ded
by [
Uni
vers
ity o
f T
asm
ania
] at
13:
39 2
9 N
ovem
ber
2014
W. CABOT AND J. B. POLLACK
B
.3 ‘‘1 W K1 K2
. 8 A K3 u1 -
.2
A .1 - - E., n-
\ \
- 9 1:: . B b33
I - b22 ’- I . : @
-.3“ ’ I ’ ’ I ’ ’ I I ’ I ’ ’ ‘ 0 .3 .6 .9 1.2 1.5
K
Figure 13 U 1 and K 1-3. Open symbols and dashed lines denote poor resolution due to long-wavelength behavior.
Anisotropy factors (defined in equation 13) averaged over the interior lz1<0.5 for sequences
convection to conduction. K1 shows little effect of the shear compared with U1 at the same epicyclic frequency. Greater variation is seen for K2 and K3 with Re = 1000 and 1789, which tend to have lower ( x , / x ) ~ at the same low values of K than with Re=559. This again appears to be primarily a Reynolds number effect, as evident at K = O where ( x , / x ) , actually behaves non-monotonically with Re. At moderate to rapid rotation rates, however, it appears that the heat transfer is a function primarily of Pe and K . In the rapid rotation regime where Q2D occurs, the heat transfer appears to be enhanced anomalously, but this may be unphysical, caused by the improperly resolved vertical velocity and potential temperature fields, both of which exhibit increased fluctuation intensities.
h) Reduction of Wall Eflpcis
The vertical profile of shear production at rapid rotation rates is characterized by small negative values in the vicinity of the midchannel, but much larger negative values near the walls. We attempt here to ascertain the direct effect that impermeable walls have on the Reynolds stress production. A sequence of simulations (“VK1”)
Dow
nloa
ded
by [
Uni
vers
ity o
f T
asm
ania
] at
13:
39 2
9 N
ovem
ber
2014
TURBULENT CONVECTION
12.0
K1 0 K2 A K3 - u1
4.0
0 .3 .6 0.9 1.2 1.5 K
Figure 14 Thermal convection properties for sequences U1 and K1-3: (a) Nusselt numbers (equation 14) and (b) turbulent thermal transport coefficients (equation 15). Open symbols and dashed lines denote poor resolution due to long-wavelength behavior.
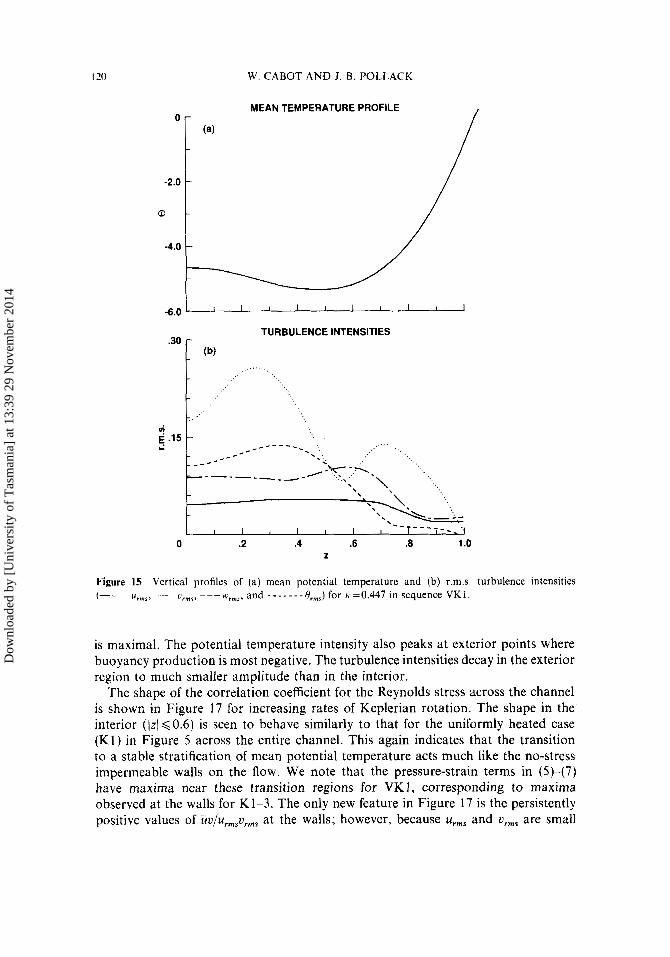
for different Keplerian rotations was performed with non-uniform heating of 80Pe-'[exp(-9z2)-0.571] replacing 2Pe-' in equation (3) and with Re=559 (see Tables 2 and 3). This heating profile features a convectively unstable interior ( IzI 6 0.5) and stable exterior (0.5 < /zl d 1.0). The mean potential temperature, turbulence intensities, and the energy budget for one simulation are shown in Figures 15 and 16. In the unstable-stable transition region Y b becomes negative, analogous to the entrainment region at the top of planetary boundary layers. An enhancement of the horizontal velocity intensities occurs at the walls for uniform heating (Figure 2b) and also occurs here in the stable-unstable transition region (Figure 15), albeit with lower relative amplitude. This occurs because the stable potential temperature stratification turns aside the vertical flows from the interior in much the same manner as the impermeable walls, although more gradually. The vertical velocity and potential temperature intensities peak at more interior points where the buoyancy production
Dow
nloa
ded
by [
Uni
vers
ity o
f T
asm
ania
] at
13:
39 2
9 N
ovem
ber
2014
120 W. CABOT AND J. B. POLLACK
-6.0 > TURBULENCE INTENSITIES
'30 [ (b) t
E : i - .15
I L I I I I I I I I
0 .2 .4 .6 .0 1 .u
Figure 15 Vertical profiles of (a) mean potential temperature and (b) r.m s turbulence intensities ( - - -u , , , ,~ , --irm7,---wrm5,and -------Orms)for h=O447in sequence VKl
is maximal. The potential temperature intensity also peaks at exterior points where buoyancy production is most negative. The turbulence intensities decay in the exterior region to much smaller amplitude than in the interior.
The shape of the correlation coefficient for the Reynolds stress across the channel is shown in Figure 17 for increasing rates of Keplerian rotation. The shape in the interior (Iz/ 6 0 . 6 ) is seen to behave similarly to that for the uniformly heated case ( K l ) in Figure 5 across the entire channel. This again indicates that the transition to a stable stratification of mean potential temperature acts much like the no-stress impermeable walls on the flow. We note that the pressure-strain terms in (5)-(7) have maxima near these transition regions for VK 1, corresponding to maxima observed at the walls for K1-3. The only new feature in Figure 17 is the persistently positive values of uU/u,,,u,,, at the walls; however, because u,,, and or,, are small
Dow
nloa
ded
by [
Uni
vers
ity o
f T
asm
ania
] at
13:
39 2
9 N
ovem
ber
2014
TURBULENT CONVECTION 121
.01
W
@ T o
‘b
‘S
- E I (an - - -
-.01 ’ I I I I I I , I I I
-.01 0 .2 .4 .6 .8 1 .o
2
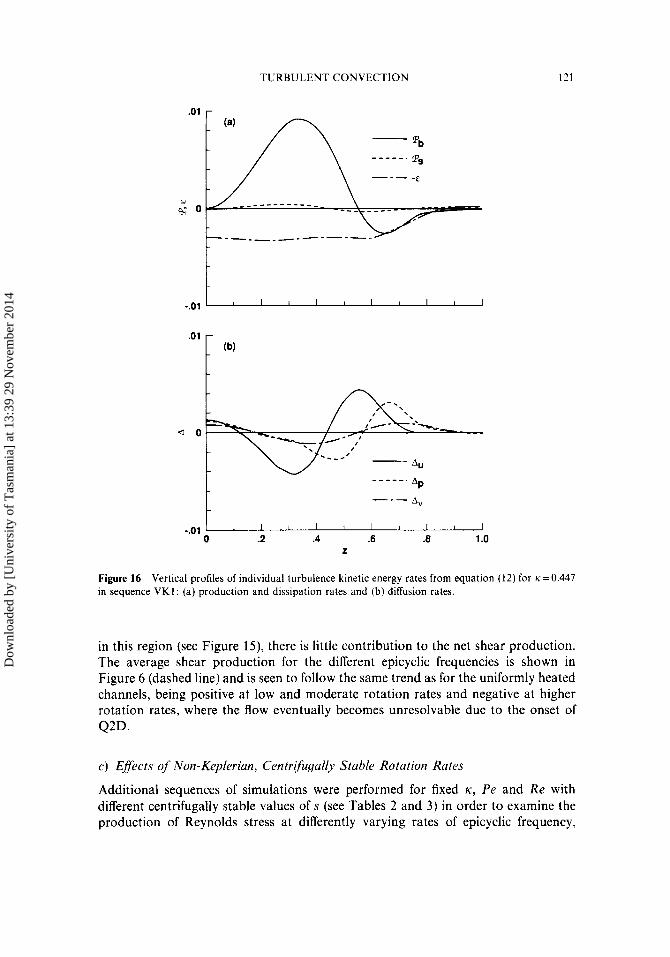
Figure 16 Vertical profiles of individual turbulence kinetic energy rates from equation (12) for ~ = 0 . 4 4 7 in sequence V K l : (a) production and dissipation rates and (b) diffusion rates.
in this region (see Figure 15), there is little contribution to the net shear production. The average shear production for the different epicyclic frequencies is shown in Figure 6 (dashed line) and is seen to follow the same trend as for the uniformly heated channels, being positive at low and moderate rotation rates and negative at higher rotation rates, where the flow eventually becomes unresolvable due to the onset of Q2D.
c ) Effects of Non-Keplerian, Centrifugally Stable Rotation Rates
Additional sequences of simulations were performed for fixed K , Pe and Re with different centrifugally stable values of s (see Tables 2 and 3) in order to examine the production of Reynolds stress at differently varying rates of epicyclic frequency,
Dow
nloa
ded
by [
Uni
vers
ity o
f T
asm
ania
] at
13:
39 2
9 N
ovem
ber
2014
I22 W. CABOT AND J. B. POLLACK
-.4 1 1 I I 1 I I I I I I 0 .2 .4 .6 .8 1 .o
z Figure 17 ti: 0 0.141, 0 0.253, A 0.447, 0 0.612, and
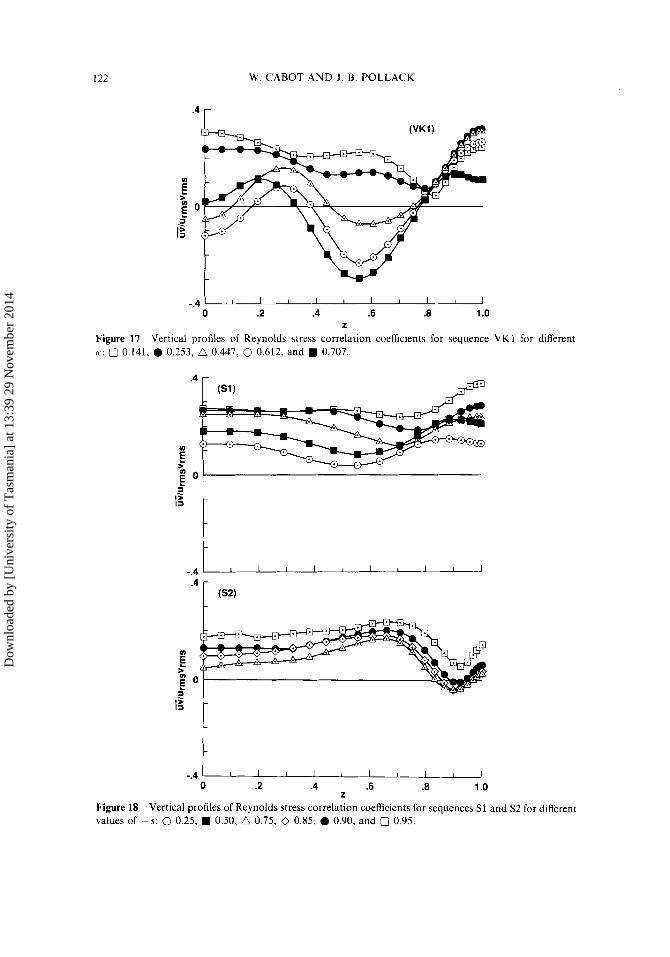
Vertical profiles or Reynolds stress correlation coefficients for sequence VKI for different 0.707.
t t
-.4 I I I I 1 I I I I 1 I 0 .2 .4 .6 .8 1 .o
z Figure 18 values of -s: 0 0.25,
Vertical profiles of Reynolds stress correlation coefficients for sequences S1 and S2 for different 0.50, A 0.75, 0 0.85, 0 0.90, and 0 0.95.
Dow
nloa
ded
by [
Uni
vers
ity o
f T
asm
ania
] at
13:
39 2
9 N
ovem
ber
2014
TURBULENT CONVECTION 123
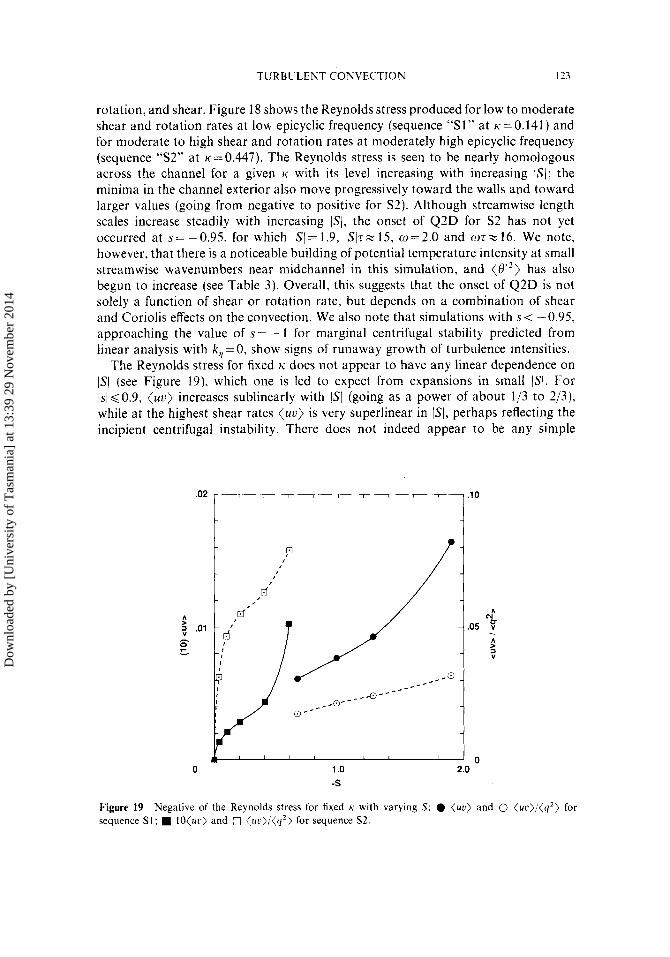
rotation, and shear. Figure 18 shows the Reynolds stress produced for low to moderate shear and rotation rates at low epicyclic frequency (sequence “Sl” at ~ = 0 . 1 4 1 ) and for moderate to high shear and rotation rates at moderately high epicyclic frequency (sequence “S2” at ti = 0.447). The Reynolds stress is seen to be nearly homologous across the channel for a given ti with its level increasing with increasing IS\; the minima in the channel exterior also move progressively toward the walls and toward larger values (going from negative to positive for S2). Although streamwise length scales increase steadily with increasing IS(, the onset of Q2D for S2 has not yet occurred at s= -0.95, for which IS/ = 1.9, ISIT= 15, w = 2.0 and w r z 16. We note, however, that there is a noticeable building of potential temperature intensity at small streamwise wavenumbers near midchannel in this simulation, and (6”) has also begun to increase (see Table 3). Overall, this suggests that the onset of Q2D is not solely a function of shear or rotation rate, but depends on a combination of shear and Coriolis effects on the convection. We also note that simulations with s< -0.95, approaching the value of s = - 1 for marginal centrifugal stability predicted from linear analysis with k , = 0, show signs of runaway growth of turbulence intensities.
The Reynolds stress for fixed ti does not appear to have any linear dependence on IS( (see Figure 19), which one is led to expect from expansions in small IS(. For Isld0.9, (uv) increases sublinearly with IS[ (going as a power of about 1/3 to 2 / 3 ) , while at the highest shear rates (uv) is very superlinear in (SI, perhaps reflecting the incipient centrifugal instability. There does not indeed appear to be any simple
0 1 .o -S
.10
A N
.05 ? .
0 2.0
Figure 19 sequence S1; t O ( u i ) and 0 ( u c t ) / ( q 2 ) For sequence S2.
Negative of the Reynolds stress for fixed K with varying S : 0 (ul;) and 0 ( u c ) / ( q 2 > for
Dow
nloa
ded
by [
Uni
vers
ity o
f T
asm
ania
] at
13:
39 2
9 N
ovem
ber
2014
124 W. CABOT AND J . B. POLLACK
power-law fit for (uv) in JSI and w. We note finally that the mean buoyancy production is not greatly affected by the shear: when 9',>0, leading to an enhancement of 2, 8" tends to decline by a comparable amount, such that 8w remains largely unchanged.
4. DISCUSSION
a) Quasi-two-dimensional Behavior
For Keplerian rotation and fixed Pe = 112, quasi-two-dimensionality (Q2D) develops between K =0.6 and 0.7 for all Re considered, corresponding to tit - 6-8 (5 = ( q 2 ) / ( & ) and K equals the rotation rate here). This Q2D is characterized by a predominance in turbulence intensity of the zero streamwise wavenumber mode for some of the fluctuating variables at some heights in the channel. Negative shear production rates are asymptotically related to Q2D, which is seen from the volume average of equation (6):
(16) 1 i ( v 2 ) , , = - (w+S)(uu) + ( P v , z ) - R e - ' ( ~ , ~ v , ~ ) .
In steady state (v')., = 0 and for exact two-dimensionality o , ~ =0, hence ( P U , ~ ) =O; in this case - (o + S ) ( u v ) must balance the positive-definite ( R e - ' ~ , ~ v . ~ ) . Thus, for a positive angular momentum gradient (o + S > 0), one requires (uv) < 0, which for S<O gives (PS) = - S ( u v ) < O . However, one sees from Figure 6a that the onset of average negative shear production per se is not tied closely to the onset of Q2D for increasing K . For low-Re sequences (K1 and VKl) 9\,<0 occurs well before Q2D, while for the highest-Re sequence (K3) Q2D appears to set in well before 9,<0. In the latter case, the pressure-strain rate is not negligible near the onset of Q2D; most of the two-dimensionality is in fact found in the vertical velocity fluctuations. Also, unlike the onset of Q2D, the onset of the negative shear production is highly Re-dependent. A proper model will need to describe both phenomena separately.
Simulations with fixed K , P e and Re presented in Section 3b suggest that it is neither the shear rate nor the rotation rate per se that controls the onset of Q2D; it appears to be more sensitive to the epicyclic frequency. For instance, values of (o, IS1 )t - 15 were simulated-but with K T - &without the onset of Q2D. Coriolis effects, measured by K , are known to have a profound effect on thermal convection and on turbulence in general. A body of empirical evidence (cf. Hopfinger and Linden, 1990, and references therein) indicates that relaminarization, perhaps related to Taylor-Proudman reorganization of the flow, occurs in the regime of rapid (uniform) rotation ( K T ~ 10). Theoretical and numerical work (e.g., Cambon and Jacquin, 1989; Bardina, et al., 1985) also suggest that rapid rotation inhibits the transfer of energy from large scales to small dissipative scales due to a disruption of wavevector interactions. These results are at least qualitatively consistent with the simulation results at rapid rotation. The general development of long horizontal wavelengths in rapid, uniformly and differentially rotating flows may be a result of the
Dow
nloa
ded
by [
Uni
vers
ity o
f T
asm
ania
] at
13:
39 2
9 N
ovem
ber
2014
TURBULENT CONVECTION 125
relaminarization process, although the detailed structures differ markedly between uniform and differential rotation (see below). The development of large turbulence times (see Figure 12) at rapid rotation may be the result of the inhibited transfer of turbulence energy to dissipative scales. For uniform rotation, these effects set in at KT - 14 (where K = o here), twice the value for the Keplerian rotation sequences (but at a comparable rotation rate).
Another notable difference between uniform and differential rotation sequences is that the sharp increase in turbulence times at the onset of Q2D for differential rotation is due mostly to an enhancement of the vertical velocity fluctuations at the expense of spanwise velocity fluctuations, rather than the enhancement of horizontal velocity fluctuations exhibited by rapid uniform rotation (see Figures 12 and 13). On this point, it is perhaps relevant that linear analysis of inviscid, homogeneous, buoyant flow (Knobloch, 1985) shows the long-time behavior of spanwise velocity amplitudes declining by a factor at-’ compared with the other velocity components as a result of the shearing action. Since a relaminarization process may be at work here, the reduction in the spanwise component may be a consequence of this linear effect. Integration of the linearized equations with uniform buoyancy shows initially UV > 0, a decay of the streamwise velocity amplitude u,,~ and a growth of the spanwise component u,,,; after ISlt- few, the v perturbation switches sign and UV becomes negative. In the long-time limit, viscous or conductive dissipation (the latter being dominant in the solar nebula) preferentially destroys k, Z 0 perturbations (Knobloch, 1984), tending to a two-dimensional flow with k , = O . This “enhancement” of the dissipation by the shear may play a role in the onset of relaminarization effects at lower epicyclic frequencies in differential as opposed to uniformly rotating flow. While linear analysis is consistent with some of the behavior observed in the numerical simulations with differential rotation, it does not predict the outcome of the statistical steady state with which we are ultimately concerned.
b) Negative Shear Production
The epicyclic frequency K at which transition to net negative shear production occurs is strongly dependent on and increases with Re in the range accessible to the direct numerical simulations. There is perhaps a hint of asymptotic behavior for values of K at which (9 , )=0 in Figure 6a toward a value of about unity. However, this is less than compelling on the basis of three points and with the complication of Q2D, discussed in sections 3a and 4a, which prevents reliable numerical resolution in the relevant regime. Although one could appeal to higher-Re simulations (e.g., employing subgrid-scale modelling) to assess the asymptotic behavior (if any), the ubiquitous appearance of Q2D may lead to dubious results.
There is presently no rigorous theoretical model that predicts the observed Reynolds stress behavior for fully developed turbulence with centrifugally stable differential rotation. A change of sign in the Reynolds stress with rapid differential rotation, similar to our simulation results, has been obtained in a simplified analysis by Kichatinov (1986), in which he allows slow uniform rotation to modify an isotropic,
Dow
nloa
ded
by [
Uni
vers
ity o
f T
asm
ania
] at
13:
39 2
9 N
ovem
ber
2014
126 W. CABOT AND J. B. POLLACK
homogeneous turbulence field, which is in turn subjected to a weak rotational shear. Nonlinear terms are crudely approximated by linear terms multiplied by a turbulence timescale t’ (presumably proportional to q2/&). Kichatinov finds positive shear production for wt’ < 2 and negative shear production for wz’ > 2; this is suggestive of the simulation results in Figure 6a, in which (9,) becomes negative at o(q2)/(&) = wt = 7 and 10 for Re = 559 and 1000. However, the inherent anisotropy of convection is not treated, and, because of the approximations employed, the analysis is really only valid for JSI KO<<?’- ’. In our simulations 1st - o> t- and we expect that anisotropies due to buoyancy, rotation, and shear in fully developed convection will all be important; we also have strong vertical inhomogeneity to complicate matters. An earlier analysis by Rudiger (1977) proposes that negative eddy viscosity can arise when two-dimensional turbulence structures dominate the flow, and the negative eddy viscosity found by Kichatinov is presumably a consequence of the Taylor-Proudman-like reorganization of the flow at rapid rotation, which tends to suppress vertical variations. There is, however, a competing trend to two-dimensionality from the suppression of streamwise variations at rapid shear rates that has not been accounted for in these analyses.
A detailed analysis of the trend to negative shear production will need to take account of the vertical inhomogeneity of the flow, which appears to produce some distinct features. The most negative shear production rates coincide with regions of large pressure-strain, viz., near impermeable walls or the transition region from convectively unstable to stable flow. Yet positive shear production rates persist in regions roughly coinciding with the positive buoyancy production peaks. Lesser negative shear production rates develop near midchannel (perhaps due to the vertical variation of the buoyancy), which actually causes the core of the flow to have almost zero net shear production rate.
c) Implications for the Solar Nebula In the Appendix we show that solar nebula models (e.g., Ruden and Lin, 1986; Cabot et al., 1987b) are expected to fall in the regime of rapid rotation in which the previously discussed effects can occur. The scaled epicyclic frequency K should be about unity or greater, which is marginally larger in fact than the maximal values of ti=0.6-0.7 that we can compute without the onset of quasi-two-dimensionality. Since the value of ti at which Q2D sets in was found to have a slight inverse dependence on Re, this feature is unlikely to go away at the very high values of Re that characterize solar nebula convection. The Peclet number Pe should be about t l- l , where a is a dimensionless factor proportional to the Reynolds stress and net internal heating; the value of P e z lo2 used in our simulations is thus in line with the value of a=: found in Ruden and Lin’s (1986) solar nebula models. Furthermore, we estimate that solar nebula disks that assume self-sustaining thermal convection would have ratios of turbulent timescales to rotation and shear times (0, ISl)t- ( q 2 ) / ( u v ) , which is 3 10 for all simulations presented here (cf. Figure 19) and comparable to the most rapidly rotating/sheared cases (cf. Figure 12). We therefore expect Coriolis forces and shear to have profound effects on the turbulence statistics in a convective solar nebula.
Dow
nloa
ded
by [
Uni
vers
ity o
f T
asm
ania
] at
13:
39 2
9 N
ovem
ber
2014
TURBULENT CONVECTION 127
The occurrence of regimes at rapid differential rotation that feature negative shear production and/or quasi-two-dimensionality can have important consequences for convective solar nebula models, as well as posing an intrinsically interesting problem from a fluid dynamics perspective. The appearance of Q2D suggests that convection may generate long azimuthal structures of global proportion, rather than purely localized turbulence. Further, if convection in the solar nebula produces negative shear production rates, then the turbulence kinetic energy is converted to mean flow kinetic energy at the expense of the thermal energy, as observed in some zonal flows in planetary atmospheres. Such “negative (eddy) viscosity” phenomena were discussed at length by Starr (1968). In order for turbulence to be sustained in a quasistatic manner, another source of energy needs to be available (which we have supplied artificially in the simulations); otherwise we can expect the outbreak of convection in the solar nebula-in the absence of any other mechanisms for generating turbulence-to be a transient phenomenon. There is also the possibility that angular momentum and mass would be transported in a direction opposite to normal convention, i.e., in a sense opposite to that of molecular viscosity in which the angular momentum flux (the Reynolds stress) is down-gradient with respect to the angular velocity. In the negative shear production regime, the net angular momentum flux is, at least in sign, down-gradient with respect to specific angular momentum; this result may thus be relevant to Gough and Lynden-Bell’s (1 968) “vorticity expulsion” and Bretherton and Turner’s (1968) “angular momentum mixing” mechanisms. In the solar nebula, instead of material drifting inward due to “viscous” drag, material might be spun outward. The transport of angular momentum depends, however, on the gradient of the Reynolds stress, so that a negative shear production need not translate into a contrary angular momentum flux. More realistic solar nebula conditions that take account of radial variations need to be simulated in order to adequately address this issue. It is not actually clear that negative shear production is a feature of realistic solar nebula disks, since the trend, as one moves to higher, more realistic Reynolds numbers, is for positive net shear production at rapid rotation (see Figure 6). Nevertheless, the change of sign in the Reynolds stress near solid or convectively stable boundaries (cf. Figures 5 and 17), which occurs at all Reynolds numbers at rapid rotation in this study, suggests that the radial mass and angular momentum transport in convective disks may have a complicated vertical structure.
While the value of Pe chosen for this study is consistent with Ruden arid Lin’s (1986) value of a, the validity of this value (and even its sign) for disk accretion driven solely by convection has yet to be established. Ruden and Lin’s value of a is obtained from Lin and Papaloizou’s (1980) model in which the Reynolds stress term U V F Z U , ~ , where u, is a convective speed determined from standard mixing length theory and can be taken to correspond to w,,, in these simulations. In Paper I it was found that mixing length theory without rotational stabilization (as it was applied by Lin and Papaloizou) may substantially overestimate the value of u,‘ , since rapid uniform rotation (ic2 1) was found to reduce wlzms by about an order of magnitude. However, in the quasi-two-dimensional regime for rapid Keplerian rotation, wlzrnS becomes larger again with increasing rotation rate in proportion to q2 (see Table 3). We also note that the simulations presented here suggest an upper limit on .V/wIzrns of about 0.1,
Dow
nloa
ded
by [
Uni
vers
ity o
f T
asm
ania
] at
13:
39 2
9 N
ovem
ber
2014
128 W. CABOT A N D J. B. POLLACK
based on maxima of about 0.2 found for mean values of iiii/urmsurms (see Figure 6b) and mean values of urmsu,ms/w~ms of 0.4-0.6. This suggests that Lin and Papaloizou’s model overestimates the ratio of Reynolds stress to convective kinetic energy by an order of magnitude. Both of the factors described here suggest that the value of c1
produced solely by thermal convection is substantially less than that predicted by Ruden and Lin. It also suggests that larger values of P e are appropriate for convective disks and should be considered in future numerical simulations. More definitive answers on the proper level of a in convective disks from numerical simulations require a determination of asymptotic properties of the turbulence at higher rotation rates and much higher Reynolds numbers, and also require including important compressibility effects like large density stratification and a self-consistently generated viscous heat source.
d) Future Work
Our ultimate goal is to have the capability to predict the character of differentially rotating convective flow in order to model the transfer of angular momentum in physical systems, such as protoplanetary accretion disks. We would like to develop a practical model for the dependence of the Reynolds stress on differential rotation and Reynolds number and to determine in particular the parameters that govern the occurrence of negative shear production and long-streamwise-wavelength (quasi-two- dimensional) regimes. This is of the utmost importance in astrophysical accretion disks in which the rotation/shear rates are dominant and in which these effects are likely to be manifest. It is not yet clear to what extent higher-order models developed for homogeneous flows depending on spectral decomposition, such as two-point closure models (cf. Cambon and Jacquin, 1989), can be used to analyse differentially rotating convection, which is complicated by time-varying wavenumbers in the co-moving frame or inhomogeneity in the inertial frame due to the shear, as well as the vertical inhomogeneity and anisotropy associated with the thermal convection. We intend to apply Reynolds-stress (one-point closure) models that include buoyancy and shear terms (e.g., Zeman, 1981; Mellor and Yamada, 1982) to this problem; this will allow us to take better account of the vertical inhomogeneity in the buoyancy, although it will not yield direct information on the flow’s spectral behavior.
The added complication of vertical inhomogeneity in the present simulations, due largely to the linearly varying gravity in the interior, could be mitigated with a more fundamental numerical study of the interior flow of differentially rotating Benard convection. The tendency of the rapidly differentially rotating flow to develop long streamwise length scales hampers our ability to determine via simulation the asymptotic character of the shear production at large Re. This tendency makes numerical simulations of localized accretion disk structure unreliable, since the unresolved low streamwise (azimuthal) wavenumbers contain a significant fraction of the turbulence kinetic energy. It is still possible that simulations with a combination of higher Pe and Re could provide useful asymptotic information at rotation rates below the onset of this quasi-two-dimensionality; these simulations would probably necessitate the use of large-eddy simulations with subgrid-scale modelling. The
Dow
nloa
ded
by [
Uni
vers
ity o
f T
asm
ania
] at
13:
39 2
9 N
ovem
ber
2014
TURBULENT CONVECTION 129
development of very long streamwise (azimuthal) wavelengths for sufficiently rapid differential rotation suggests that a proper numerical resolution of the convective solar nebula problem may require taking account of curvature effects and can perhaps be approached only by means of curved channel simulations with substantial or full ( 2 ~ ) azimuthal coverage.
Overall vertical heat transfer in the well resolved numerical simulations presented herein does not appear to be affected substantially by the degree of shearing in the differential rotation, which may allow it to be modelled more simply than the Reynolds stresses. The vertical heat transfer does depend on the differential rotation, however, through a strong dependence on the restorative Coriolis forces, measured by the epicyclic frequency, which tends to inhibit convective motions.
In order to predict tangible properties of convective accretion disks, as in the solar nebula, simulations similar to the ones presented here but with compressible effects need to be performed (and are currently under way) to assess in particular the effects of large density stratification. A compressible simulation in which turbulence kinetic energy and thermal energy are comparable is also needed to determine the ability of the disk to achieve a self-sustaining state, although the appearance of negative net shear production under realistic conditions would obviate this possibility without the existence of an alternative energy source for the turbulence.
Acknowledgements The authors are indebted to J. Kim, P. Moin and R. S. Rogallo for their technical assistance with the numerical simulation codes and for many helpful discussions. We are also grateful to P. Cassen for his insightful comments and to V. M. Canuto for his seminal ideas concerning this project. We also thank the two referees for their many useful suggestions. The numerical simulations were performed on a NASA/Ames Research Center Cray Y-MP/832. Support was provided in part by the NASA Geology and Geophysics Program under grant RTOP 151-01-60-05; by the Center for Turbulence Research, a joint program of Stanford University and NASA/Ames Research Center; and under the auspices of a special NASA astrophysics program, which supports a joint Center for Star Formation Studies at NASA/Ames Research Center, U.C. Berkeley, and U.C. Santa Cruz.
References Bardina, J., Ferziger, J . H. and Rogallo, R. S., “Effect of rotation on isotropic turbulence: computation
and modelling,” J . Fiuid Mech. 154, 321-336 (1985). Beguier, C., Dekeyser, I. and Launder, B. E., “Ratio of scalar and velocity dissipation time scales in
shear flow turbulence,” Phys. F1uid.y 21, 307-310 (1978). Bretherton, F. P. and Turner, J. S., “On the mixing of angular momentum in a stirred rotating fluid,”
J . Fluid Mech. 32, 449464 (1968). Cabot, W., Canuto, V. M., Hubickyj, 0. and Pollack, J . B., “The role of turbulent convection in the
primitive solar nebula. I. Theory,” Icarus 69, 387422 (1987a). Cabot, W., Canuto, V. M., Hubickyj, 0. and Pollack, J. B., “The role of turbulent convection in the
primitive solar nebula. 11. Results,” Icarus 69, 423457 (1987b). Cabot, W., Hubickyj, O., Pollack, J. B., Cassen, P. and Canuto, V. M., “Direct numerical simulations
of turbulent convection: I. Variable gravity and uniform rotation,” Geophys. Astrophys. Fluid Dynarn. 53, 1 4 2 (1990) (“Paper I”).
Cambon, C. and Jacquin, L., “Spectral approach to non-isotropic turbulence subjected to rotation,” J . Fluid Mech. 202, 295-317 (1989).
G.A.F.D.-E
Dow
nloa
ded
by [
Uni
vers
ity o
f T
asm
ania
] at
13:
39 2
9 N
ovem
ber
2014
130 W. CABOT AND J . B. POLLACK
Chan, K . L. and Sofia, S., “Turbulent compressible convection in a deep atmosphere. IV. Results of
Gough, D. 0. and Lynden-Bell, D., “Vorticity expulsion by turbulence: astrophysical implications of an
Hopfinger, E. J. and Linden, P. F., “The effect of background rotation on fluid motions: a report on
Kichatinov, L. L., “Turbulent transport of angular momentum and differential rotation,” Geophys.
Kim, J., Moin, P. and Moser, R., “Turbulence statistics in fully developed channel flow at low Reynolds
Knobloch, E., “On the stability of stratified plane Couette flow,” Geophys. Astrophys. Fluid Dynam. 29,
Knobloch, E., “The stability of non-separable barotropic and baroclinic shear flows,” Astrophys. Space
Lin, D. N. C. and Papaloizou, J., “On the structure and evolution of the primordial solar nebula,” Mon.
Mellor, G . L. and Yarnada, T., “Development of a turbulence closure model for geophysical fluid problems,”
Pringle, J . E., “Accretion discs in astrophysics,” Ann. Rev. Asrron. Asrrophys. 19, 137-162 (1981). Rogallo, R. S., “Numerical experiments in homogeneous turbulence,” NASA Tech. Mem. 81315 (1981). Ruden, S. P. and Lin, D. N. C., “The global evolution of the primordial solar nebula,” Astrophys. J . 308,
Riidiger, G., “Two-dimensional stochastic motions and the problem of differential rotation,” Solar Phys.
Starr, V. P., Physics of Negative Viscosity Phenomena, McGraw-Hill, New York (1968). Zeman, O., “Progress in the modeling of planetary boundary layers,” Annu. Rev. Fluid Mech. 13, 253-272
three-dimensional computations,” Astrophys. J . 336, 1022-1040 (1989).
Alka-Seltzer experiment,” J . Fluid Mech. 32, 437447 (1968).
Euromech 245,” J . Fluid Mech. 211, 417435 (1990).
Astrophys. Fluid Dynam. 35, 93-1 10 (1986).
number,” J . Fluid Mech. 177, 133-166 (1987).
105-116 (1984).
Sci. 116, 149-163 (1985).
Not. R . astr. SOC. 191, 3 7 4 8 (1980).
Rev. Geophys. Space Phys. 20, 851-875 (1982).
883-901 (1986).
51, 257-269 (1977).
(1981).
APPENDIX: SOLAR NEBULA PARAMETERS
We estimate here the relative strength of thermal convection and the rapidity of the rotation and shear rates in solar nebula models in terms of the dimensionless ratios used in the text. We also estimate the turbulence times expected in the solar nebula in a state of self-sustaining thermal convection. In this crude analysis, we have generalized the scaling arguments to include rudimentary density stratification effects. Unless otherwise noted, quantities are fully dimensional and represent mean or characteristic values.
Basic timescales in thin, quasistatic accretion disks are determined by vertical hydrostatic and thermal equilibrium and by approximate centrifugal balance (cf. Pringle, 1981; Ruden and Lin, 1986). Centrifugal balance gives the magnitude of vertical gravity
g % GMz/r3 x R2z - R2h,
where G is the gravitational constant, M is the mass of the central body, z is the height above midplane, r is the distance from the central body, h is the characteristic semi-thickness of the disk, and R is the nearly Keplerian rotation rate with a
Dow
nloa
ded
by [
Uni
vers
ity o
f T
asm
ania
] at
13:
39 2
9 N
ovem
ber
2014
TURBULENT CONVECTION
corresponding shear rate S given by
Vertical hydrostatic equilibrium gives
1 ap cf aZ h’ 9 = - - ---
where p is the pressure, p is the density, and c,- (pip)"' is the sound speed. The convective velocity scale uo is defined as the approximate (maximal) speed
that would be induced by buoyancy forces over a height h in the base state in the absence of any damping effects. In order to include density stratification effects, we take explicit account of superadiabatic and radiative/conductive temperature gradients. The potential energy available from buoyancy is roughly
- p g h ” y - (y)J -pyh’[f,V3z-]. a lnp
where (dT/az),, is the adiabatic temperature gradient, V is the logarithmic derivative of temperature with respect to pressure, and L < 1 is the ratio of superadiabatic to radiative temperature gradients. Equating this with a scale kinetic energy pui and using (A.3) to eliminate the pressure gradient gives
In the Boussinesq approximationf,- 1 , while in solar nebula modelsf,z0.2ZO.5 and VzO.4-0.8 (Ruden and Lin, 1986; Cabot et al., 1987b). Thus, from equation (4) in the text, the scaled epicyclic frequency,
is expected to be about 1-3.
heating rate Q: In vertical thermal equilibrium, the gradient of the heat flux F balances the specific
aF - = Q, aZ
or
F = F , + F,- Qh,
Dow
nloa
ded
by [
Uni
vers
ity o
f T
asm
ania
] at
13:
39 2
9 N
ovem
ber
2014
132 W. CABOT AND J. B. POLLACK
where Fr and F, are the radiative and convective fluxes. For optically thick disks,
T aT F , = - C P P X - az - c,px -, h ('4.9)
where c, is the coefficient of specific heat at constant pressure (and c,T-c:) and x is the radiative diffusivity coefficient. Generalizing equation (15) in the text,
defining the turbulent conductivity zr. In accretion disk models Q is parametrized by a dimensionless efficiency factor CI such that
Q E apc,hS2 - Upc,hR2 - apcSR. (A.11)
With (A.9)-(A.1 l) , (A.8) becomes
or, in terms of K [equation (A.6)] and the Pecltt number, Pe = u,h/X,
For the rapid rotation ( I C ~ 1) indicated by (A.6), convection is inefficient and X, /X is probably less than or about unity (cf. Figure 14b); we therefore expect Pe-(c tx) - ' NU-'. The solar nebula models of Ruden and Lin (1986) feature u - ~ O - ~ , while Cabot et a!. (1987b) found a- 10-2-10-4.
In order to estimate turbulence timescales in a self-sustaining convective disk, we need to determine the characteristic viscous dissipation rate E . (Note that energy rates here include a factor of density p . ) From the static, compressible equations for turbulence kinetic energy (cf. Cabot et al., 1987a),
~
where Ys= -puVS is the shear production, the term Pb= -u.Vp contains the buoyancy production, and A represents diffusion terms with zero volume average (analogous to A,,+Av in equation (12) in the text). The static equation for specific internal energy e is
a ___- d F aF - [ ( p e + p ) w I = - + ~ - 9 ~ = - 2 +8, + A , az a Z aZ (A.15)
eliminating E with (A.14); w is the vertical velocity component. Let the enthalpy flux
Dow
nloa
ded
by [
Uni
vers
ity o
f T
asm
ania
] at
13:
39 2
9 N
ovem
ber
2014
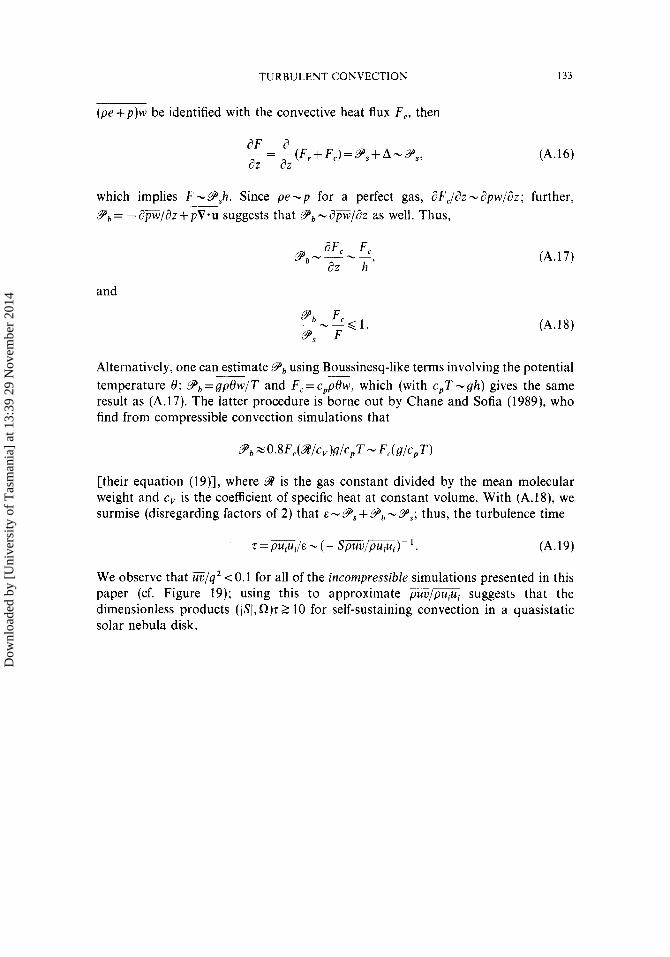
TURBULENT CONVECTION 133
(pe+p)w be identified with the convective heat flux F,, then
aF a aZ aZ ~ = - (F, + F,)=9, + A -gS, (A.16)
which implies F -9 ,h . Since pe-p for a perfect gas, aF,/az-dpiG/az; further, 8, = - apW/az + pV-u suggests that 8, - apw/dz as well. Thus,
-~
and
(A. 17)
(A. 18)
Alternatively, one can estimate 9 b using Boussinesq-like terms involving the potential temperature 8: 9,, = &/T and F, = cp&, which (with c p T -gh) gives the same result as (A.17). The latter procedure is borne out by Chane and Sofia (1989), who find from compressible convection simulations that
[their equation (19)], where 9 is the gas constant divided by the mean molecular weight and c y is the coefficient of specific heat at constant volume. With (A.18), we surmise (disregarding factors of 2) that & - 9, + 9 b - 8,; thus, the turbulence time
T = W/& - ( - spuv/pu,u,)- 1. (A.19)
We observe that E/q2 <0.1 for all of the incompressible simulations presented in this paper (cf. Figure 19); using this to approximate @ E m suggests that the dimensionless products (ISI, Q)T 3 10 for self-sustaining convection in a quasistatic solar nebula disk.
Dow
nloa
ded
by [
Uni
vers
ity o
f T
asm
ania
] at
13:
39 2
9 N
ovem
ber
2014