Embed Size (px)
Citation preview
1
Direct Comparison between the Angular Distributions
of the Erythemal and Eye-Damaging UV Irradiances: A
Pilot Study
P. Schouten a,b #
, A.V. Parisi b.
a School of Engineering, Griffith University, Gold Coast, Australia 4222.
b Centre for Rural and Remote Area Health, Faculty of Sciences, University of
Southern Queensland, Toowoomba, Australia 4350.
Keywords: Solar UV, Ultraviolet, Angular, Erythemal, Spectroradiometer.
*To whom correspondence should be addressed at: [email protected]
2
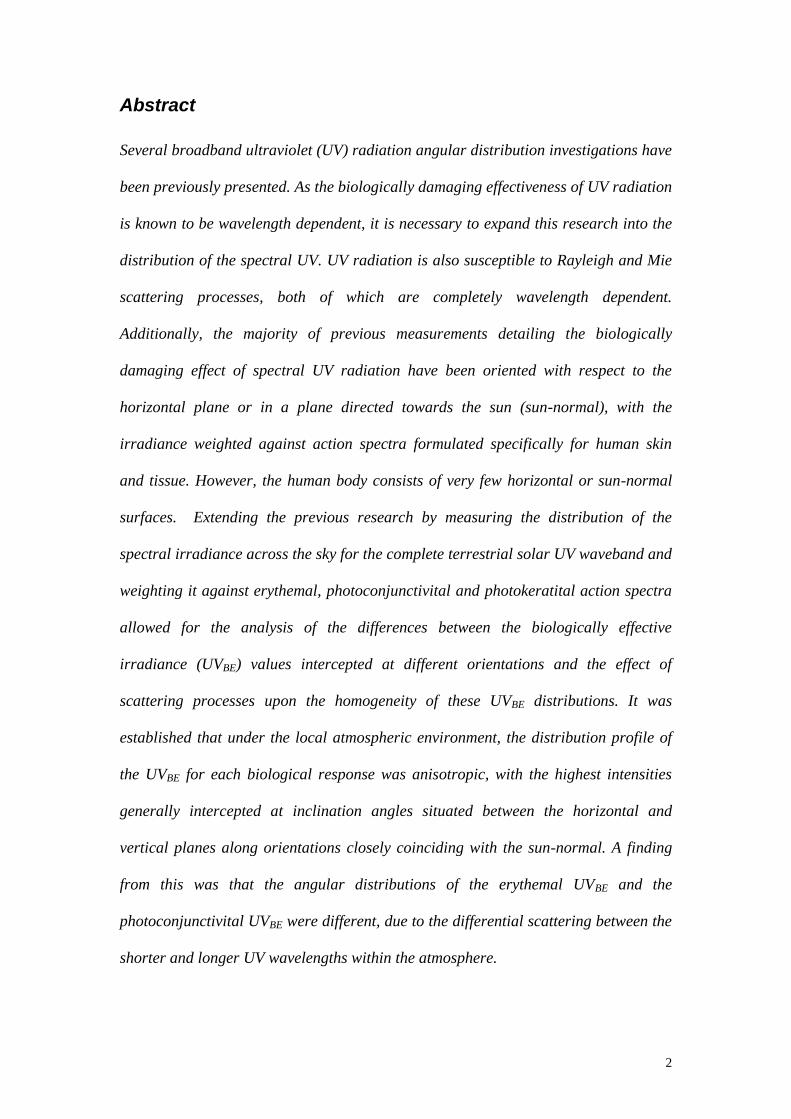
Abstract
Several broadband ultraviolet (UV) radiation angular distribution investigations have
been previously presented. As the biologically damaging effectiveness of UV radiation
is known to be wavelength dependent, it is necessary to expand this research into the
distribution of the spectral UV. UV radiation is also susceptible to Rayleigh and Mie
scattering processes, both of which are completely wavelength dependent.
Additionally, the majority of previous measurements detailing the biologically
damaging effect of spectral UV radiation have been oriented with respect to the
horizontal plane or in a plane directed towards the sun (sun-normal), with the
irradiance weighted against action spectra formulated specifically for human skin
and tissue. However, the human body consists of very few horizontal or sun-normal
surfaces. Extending the previous research by measuring the distribution of the
spectral irradiance across the sky for the complete terrestrial solar UV waveband and
weighting it against erythemal, photoconjunctivital and photokeratital action spectra
allowed for the analysis of the differences between the biologically effective
irradiance (UVBE) values intercepted at different orientations and the effect of
scattering processes upon the homogeneity of these UVBE distributions. It was
established that under the local atmospheric environment, the distribution profile of
the UVBE for each biological response was anisotropic, with the highest intensities
generally intercepted at inclination angles situated between the horizontal and
vertical planes along orientations closely coinciding with the sun-normal. A finding
from this was that the angular distributions of the erythemal UVBE and the
photoconjunctivital UVBE were different, due to the differential scattering between the
shorter and longer UV wavelengths within the atmosphere.

3
Introduction
Over the past thirty years, a number of investigations have been conducted focusing
on the angular measurement and distribution of direct and diffuse solar UV radiation
within varying atmospheric conditions. Employing a similar methodology as used in
previous studies [1, 2, 3] Ireland and Sacher [4] conducted the most complete
broadband solar UV angular distribution investigations made to date. The authors
utilised a tripod-mounted narrow view radiometer to measure the angular distribution
of the diffuse UV, visible and near infrared wavebands for different solar zenith
angles (SZA) under near cloudless skies at a site in Lauder, New Zealand over a
three-day period in early 1995. All radiometers used during the research had their
input optic connected to a tube that limited their field of view to 5 half-angle.
During their analysis, Ireland and Sacher discovered that the angular distributions of
the diffuse UV, visible and near infrared wavebands all exhibited anisotropic regimes,
disagreeing with previous work [5, 6] that had postulated that isotropic distributions
should be applied to certain solar wavebands.
The damaging effect of UV radiation on biological processes and tissue is related to
photonic energy and is consequently dependent on wavelength. In order to accurately
calculate the biologically damaging effect of UV radiation, the measured spectral UV
irradiance must be weighted against a mathematical function known as an action
spectrum [7]. An action spectrum quantifies the relative damaging effect or relative
effectiveness of electromagnetic radiation to produce a particular biological response
over a certain wavelength range [8]. In general, action spectra are determined by
laboratory investigations performed on human, animal and plant test subjects. The
biologically effective UV irradiance (UVBE) for a specific biological process with an
4
action spectrum, A(), is determined by applying this simple integral over the
required UV wavelength range
UV
BE dASUV )()(
where S() is spectral irradiance in units of W m-2
nm-1
[9]. In practice, the integral is
substituted by a summation for spectral irradiances with a fixed wavelength range.
After collecting the results of almost sixty years of study by various researchers, the
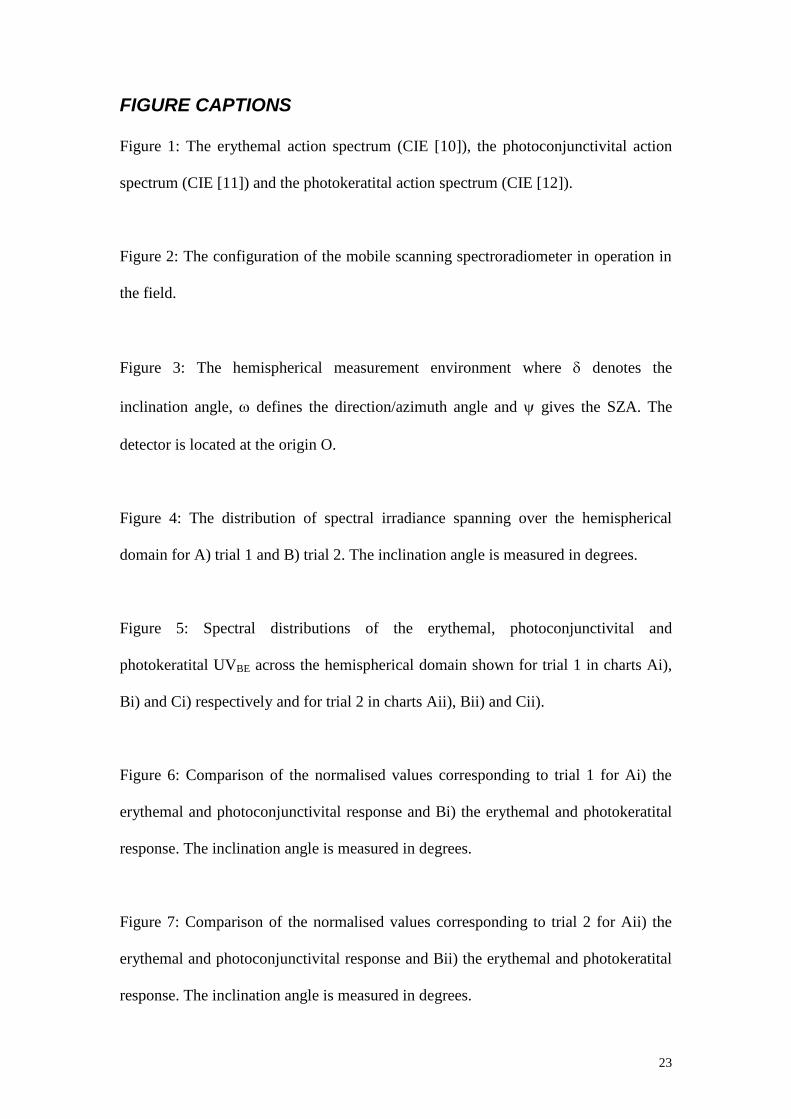
CIE [10] produced a definitive action spectrum (Figure 1) quantifying the erythemal
(sunburning) effect of UV radiation on human skin. This spectrum shows that
wavelengths below 298 nm are the most efficient at producing an erythemal response.
From 298 to 328 nm the effectiveness decreases by close to three orders of
magnitude. Wavelengths increasing from 328 nm display a steady reduction in
erythemal effectiveness by approximately four orders of magnitude compared to the
effectiveness at 298 nm.
Excessive exposure of the eye to UV radiation causes the onset of photoconjunctivitis,
an inflammation of the conjunctiva, the soft tissue covering the eyelid and some of the
eyeball. The CIE [11] developed a model quantifying the spectral responsivity of
photoconjunctivitis (Figure 1) using previous work compiled over a forty-year period.
From 220 nm the photoconjunctivital effectiveness has a gradual reduction before
sharply increasing at 235 nm until reaching the maximal response occurring at 260
nm. After the maxima, the photoconjunctivital response rapidly decreases to zero
response at 310 nm, and hence no response is seen in the UVA waveband.
5
Photokeratitis is a swelling of the cornea that occurs after excessive exposure to UV
radiation generally from artificial sources such as welding arcs, mercury lamps, laser
beams and reflected UV from sand and snow. After analysing the data assimilated by
numerous research groups on various live test subjects including rabbits, primates and
humans, the CIE [12] delivered a recommended action spectrum for photokeratitis
(Figure 1). The maximum response for photokeratitis is located at 288 nm, with no
response in the UVA. In general, the responsivity decreases more rapidly away from
the maxima at longer wavelengths in comparison to the shorter wavelengths.
Following on from the broadband analysis performed by McKenzie, Paulin and
Kotkamp [13] limited spectral work was undertaken by Parisi and Kimlin [9]
who
measured the horizontal and sun-normal biologically damaging spectral UV
irradiances at a Southern Hemisphere site. All measurements were made using a
mobile spectroradiometer over two clear-sky days in late winter and early spring. The
results showed that a surface oriented in a sun-normal direction could receive up to
27% higher erythemal UV exposure in comparison to a horizontal plane. Also, for the
sun-normal orientation a reduction in diffuse UV irradiance was observed when
compared to the horizontal orientation. This equated to a decrease in the damaging
UV exposure produced by the diffuse component in the sun-normal orientation.
Parisi, Kimlin and Turnbull [14] extended this research by investigating the effect of
tree shade on the solar UV irradiance incident on horizontal and sun-normal surfaces.
A spectroradiometer was employed to measure irradiances for horizontal and sun-
normal orientations under trees with medium and thin canopies with measurements
taken at the centre, edge and trunk of each tree. Further studies of how diffuse
6
radiation can potentially influence human eye damage in both full sun and tree shade
conditions [15] and a year long analysis of the angular distribution of biologically
damaging solar UV radiation under public shade structures at sports fields and public
venues [16] have also been detailed. Continuing on from these studies, the most
recent examination into the angular distribution of solar UV radiation was performed
by Koepke and Mech [17] who analysed the influence of SZA, albedo and cloud
coverage upon erythemal irradiance incident on tilted surfaces. From this work it was
found that the largest clear sky erythemal irradiance values on an inclined surface are
most likely to be measured during high SZA conditions and are enhanced by
surrounding high ground albedo.
The vast majority of measurements detailing biologically damaging UV radiation are
oriented with respect to some horizontal surface. The spectral irradiance is weighted
against action spectra formulated specifically for human skin and tissue, but the
surface of the human physique consists of very few horizontal surfaces. So the
angular distribution of UV radiation must be accurately quantified in order for future
research to create a truly practical model detailing the effect of UV on the entire
surface of the human body.
The only known study into the angular distribution of the solar spectral UV and
erythemal UV across a large part of the terrestrial UV waveband has been performed
in Japan by Kawanishi [18] who developed a rudimentary distribution of the spectral
ultraviolet radiation for sections of the sky. In this study, the distribution was
weighted against only the erythemal action spectrum and no other action spectra were
considered.
7
To the authors’ knowledge, apart from the preliminary work detailed in [18], only
broadband angular UV radiation distribution investigations have been made to this
point in time. Consequently, spectral angular distributions are required, as the
biologically damaging effectiveness of UV is completely wavelength dependent.
Additionally, UV radiation is also susceptible to Rayleigh and Mie scattering
processes, both of which are wavelength dependent. Some spectral analysis has been
compiled for specific directions and inclinations, but it has yet to encompass the entire
hemispherical domain, which is necessary, as the diffuse UV irradiance is incident
from all angles and directions. Consequently, this paper addresses this definite need
for a study that accurately quantifies the angular distribution of the spectral solar UV
spectrum at different SZA by reporting on a direct comparison between the angular
distribution of the erythemal and eye-damaging UV irradiances.
Materials and Methods
Equipment Setup and Usage Summary
The angular distribution of the solar UV spectrum was investigated for multiple
combinations of seven inclinations and eight directions using a wide view sampling
approach to map the distribution of the solar UV spectrum around a hemispherical
domain encompassing the sky. Every field-based spectral UV measurement trial was
undertaken at the University of Southern Queensland’s Toowoomba campus (27 o 36’
S, 151 o
55’ E) utilising transportable spectroradiometric instrumentation fitted with a
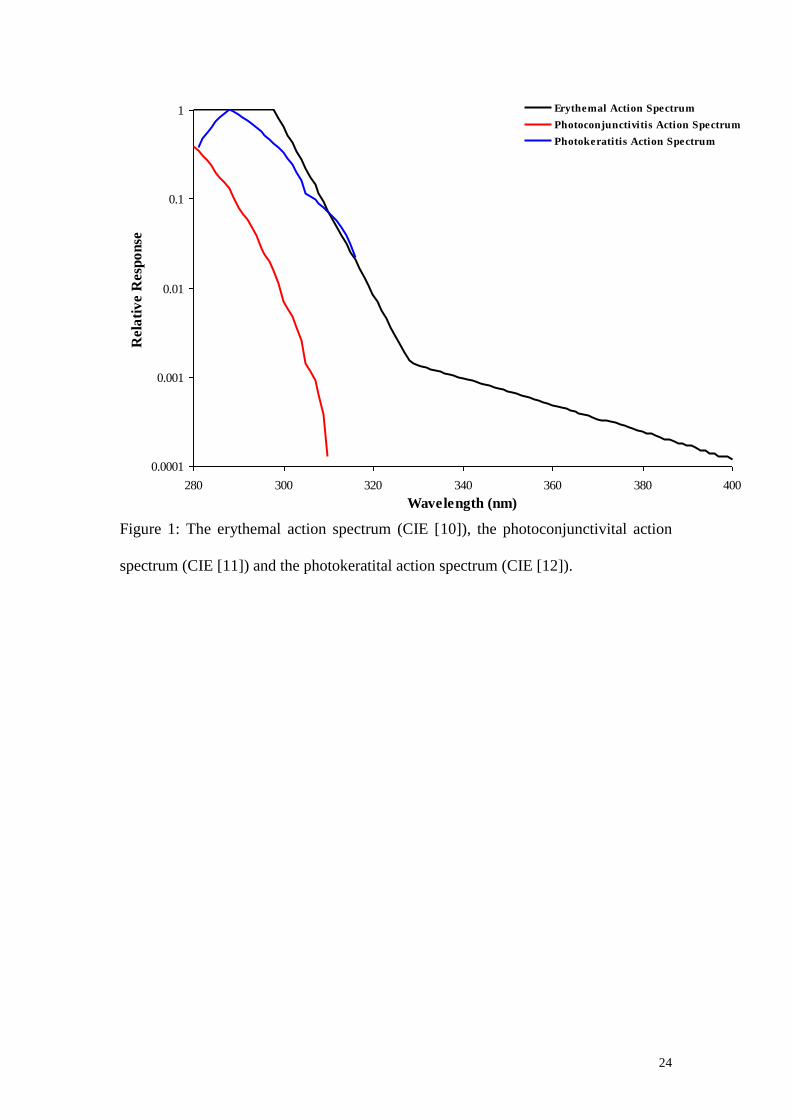
specialised angular sweep apparatus. A picture of the spectroradiometer along with
the angular sweep apparatus is depicted in Figure 2. The spectral UV measurements
were taken under both clear sky and partially cloudy conditions in an open outdoor
environment free from any natural or artificial obstructions. For the remainder of this

8
manuscript the trial carried out under partially cloudy sky conditions will be referred
to as trial 1 and the trial performed under clear sky conditions will be referred to as
trial 2. Biologically effective angular irradiance distributions were also determined
from the spectral UV data.
The transportable scanning spectroradiometer employed a diffuser input optic (type
D6, Bentham Instruments, Reading, UK) capable of collecting spectral data ranging
from 280 to 400 nm with wavelength dispersal provided by a double holographic
grating monochromator (model DH10, Jobin Yvon, France) with 1200 lines/mm
gratings. Detection of the irradiances was performed by a photomultiplier tube (model
R212, Hamamatsu Co., Japan) maintained at a temperature of 15.0 0.5 o
C by a
Peltier cell controller. A custom built angular sweep apparatus was attached to the
diffuser, which allowed for measurements to be made along any axis and at any angle
from horizontal to vertical. The cosine error of the diffuser has been measured to be
no greater than 1 % as specified by the manufacturer [19].
Before every scanning session, the spectroradiometer was wavelength calibrated
against mercury UV spectral lines and absolute irradiance calibrated against a 250 W
secondary standard quartz tungsten halogen lamp (SSL) operating at a current of
9.500 0.005 A d.c. with calibration traceable to a primary standard located at the
CSIRO National Standards Laboratory, Lindfield. The SSL current was via a
regulated power supply (Model PD36 20AD, Kenwood) that was monitored by a
calibrated multimeter (MX 56 Metrix). According to the CSIRO [20] this primary
3.0% at 240 nm that decreases linearly
with increasing wavelength to 2.0% at 350 nm and decreases further with increasing
9
wavelength to 1.1% at 550 nm. In addition to this, it is known that an error of
approximately 3.0% is inherited in the calibration transfer between the primary to
secondary standard. Also, the variations in the spectral irradiance measured by the
spectroradiometer are known to be in the order of 5% [21].
For the absolute irradiance calibration sessions with the spectroradiometer, the SSL
was mounted in a custom-built housing above the diffuser. This housing was
specifically designed so that the interference of stray light was kept to an absolute
minimum and also to keep the SSL at an adequate temperature via an external cooling
device. The responsivity of the spectroradiometer was determined by scanning the
standard lamp at the required lamp current and voltage settings and lamp to aperture
distance to sustain utmost repeatability. Following the irradiance calibration, a dark
count (DK) scan was performed where the DK is defined as the measurement of
randomised electronic noise within the spectroradiometer. The DK scan was made by
performing a ‘clean’ scan by ensuring that absolutely no radiation was incident on the
diffuser. Three DK scan cycles were taken for each measurement campaign.
Measurement Campaign Specification
The angular distribution of the solar UV spectrum over various inclination and
direction combinations was recorded using the mobile scanning spectroradiometer for
both near clear sky (trial 1) and partially cloudy (trial 2) conditions. The
measurements were taken out in an open outdoors environment (a football field) free
from any type of natural or artificial obstruction. The surface of this field was
predominantly grass with an estimated albedo of 1.9% 0.15%. This albedo
measurement was made using an IL1400 broadband meter (‘A’ Series, International

10
Light, Newburyport, MA) calibrated directly to the spectroradiometer used in the
measurement trials.
For each of the two cloud coverage conditions, measurements were taken on separate
days across an approximate one hour time period as quickly as possible generally
commencing in the mid morning ending in the early afternoon during the winter
months of 2005. Over this time the SZA ranged over 60 o to 48
o on the days of the
measurements. The determination of the SZA was made using data available from the
US Naval Observatory Sun Azimuth and Altitude Table Internet site located at
http://aa.usno.navy.mil/data/docs/AltAz.html.
Clear sky measurements were taken on occasions when no visible cloud was present
in the surrounding skies. Distant low level cloud seen low on the outer horizon during
some measurements was disregarded. The percentage of cloud coverage present
during the measurement trials reached a maximum of 34% and a minimum of 1%.
These cloud coverage amounts were determined from processed sky data accumulated
by a total sky imager system (TSI-440, Yankee Environmental Systems, MA, USA)
currently maintained at the University of Southern Queensland’s Toowoomba campus
approximately 200 metres away from the measurement site. The TSI-440 has been
found to have an uncertainty of approximately 10% at least 95% of the time during
its operation [22].
As the measurements were carried out in 2005, over the entirety of the solar
measurement phase local ozone levels and aerosol index data over Toowoomba was
collected from the Goddard Space Flight Centre Total Ozone Spectrophotometer
11
(GSFC-TOMS) information page found at
http://toms.gsfc.nasa.gov/eptoms/ep_ovplist_a.html. These readings were taken from
a daily pass by the TOMS satellite at 11:15 am local time at a surveillance resolution
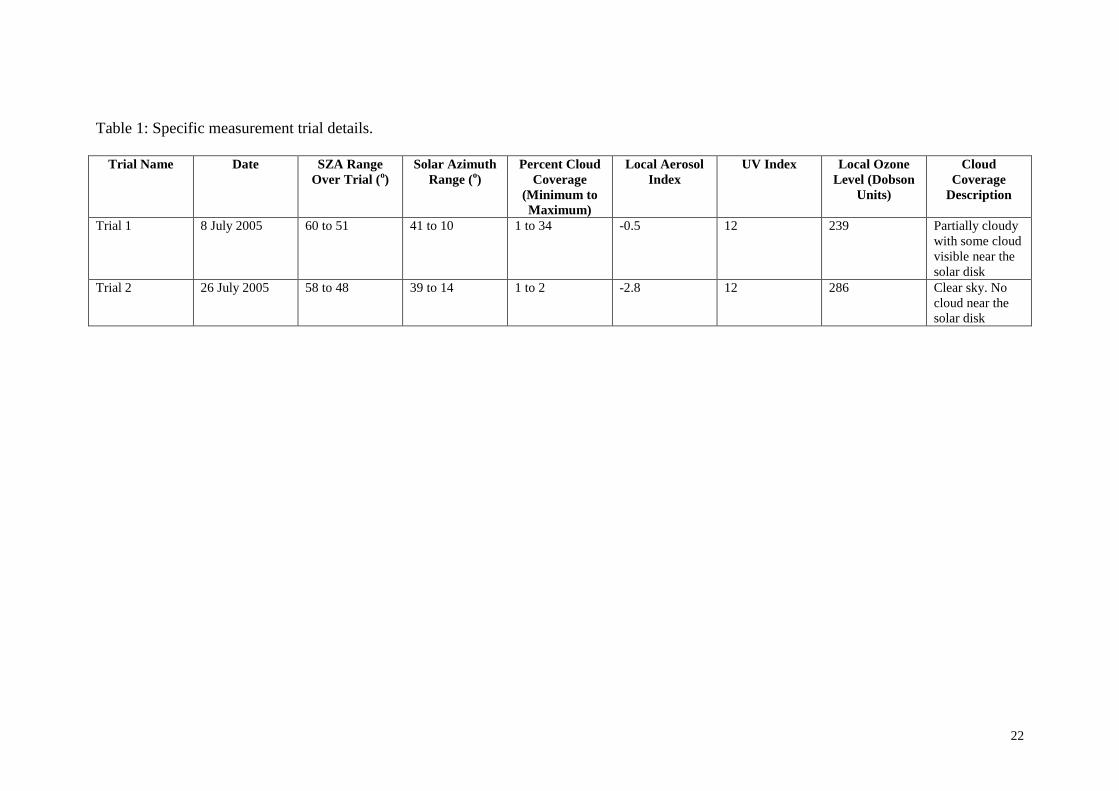
of 50 km x 50 km at nadir and 100 km x 100 km average [23]. Specific values for trial
1 and trial 2 can be seen in Table 1. At this time the TOMS instrumentation had a
latitude dependent calibration error for the ozone values of between –2 to 4%. The
aerosol index (AI) values as provided in Table 1 are calculated from the ratio between
measured backscattered UV radiation from the Earth’s atmosphere at 360 nm by the
TOMS satellite and the modelled backscattered UV radiation predicted for a pure
Rayleigh atmosphere at 360 nm [24]. The AI is negative for aerosols with poor
absorption and is positive for aerosols with good absorption.
Before each scan, the spectroradiometer was levelled to ensure that the diffuser was
aligned on a horizontal plane. Spectral data was scanned in 1 nm increments over a
wavelength range extending from 280 to 400 nm, although for most scans a useable
irradiance signal above the noise was not obtained until at least 295 nm. Each scan
took approximately 45 s to complete. For both trial 1 and trial 2 scans were halted
when rapid changes in cloud coverage occurred and were resumed once all cloud had
moved over and away from the solar disk.
The solar UV spectrum was measured for seven different inclination angles () in
steps of 15 o over a range spanning from 0
o through to 90
o with respect to the
horizontal plane for eight different direction angles () working in 45 o increments
from geographical north, namely north, north-east, east, south-east, south, south-west,
west and north-west. This collective of measurements generated a hemispherical
12
measurement domain, which is depicted in Figure 3. The 90 o scans were made in
conjunction with each azimuth and inclination combination series in order to compare
the angular measurements against a closely timed measurement aligned in parallel to
the Earth’s surface plane. A compass was used to align the angular sweep apparatus
to the particular direction under analysis. Due to parallax error occurring during the
use of the compass, it is estimated that an inaccuracy of 2 o became inherent with
each directional orientation. Less than 50 s was required for each change in direction
and less then 15 s was needed for each change in inclination angle as the angular
sweep apparatus had the required angles marked on its axial pivot. After the solar
measurement phase was completed, Microsoft Excel (versions 97 and 2002) was used
to produce the graphical representations of the collected data.
Results
Table 1 details the various environmental factors associated with the two trials
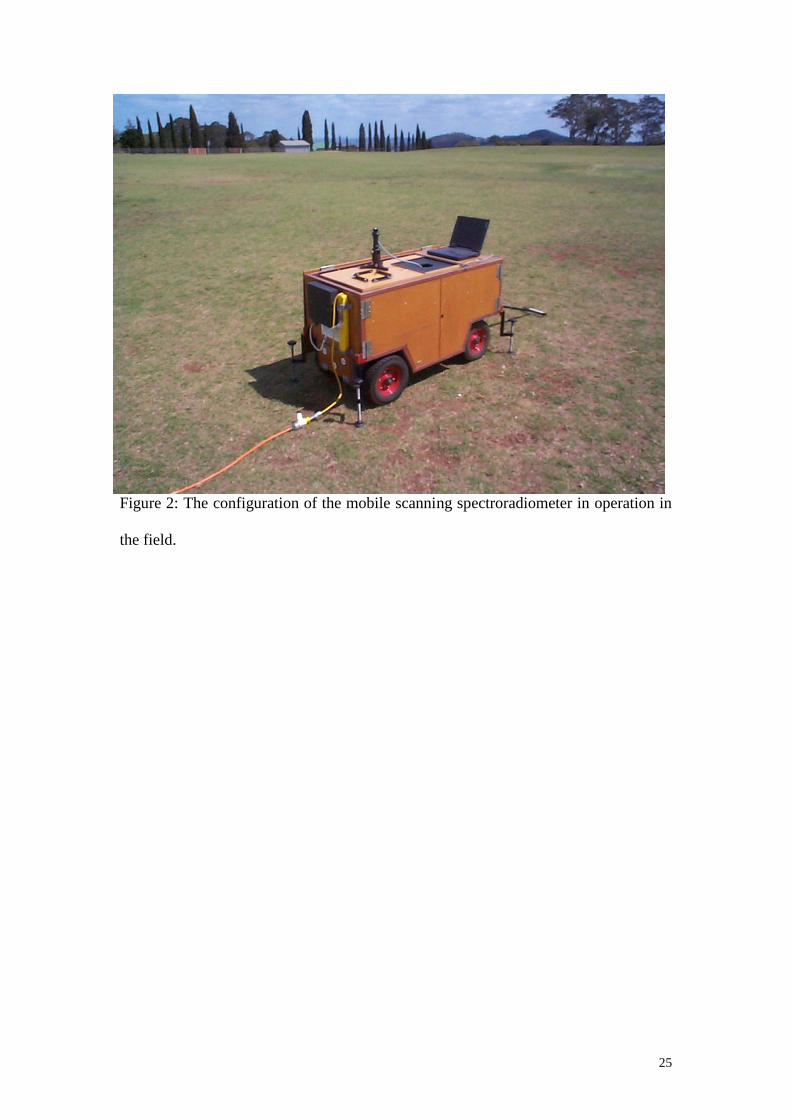
reported in this manuscript. Figure 4 displays the spectral UV irradiance angular
distribution for trial 1 in the upper graph and trial 2 in the lower graph. The spectral
irradiance data displayed in Figure 4 is not given relative to a single measurement and
has not been normalised or averaged. Each UV spectrum is a singular unweighted
irradiance scan measured by the spectroradiometer at a particular instant for an exact
point within the hemispherical domain measured at a given time throughout the
approximate 1 hour measurement campaign time span. In each graph the x-axis
represents the wavelength in nanometres and the z-axis gives the spectral irradiance in
units of Watts per square metre per nanometre. The y-axis illustrates the seven
different inclination angles in steps of 15 o over a 90
o range with respect to the
horizontal plane for the eight direction angles moving in 45 o increments from
13
geographical south to geographical south-east. As an example, between the interval 0
N and 0 NE, the spectral data is presented for the inclination and direction
combinations of 0 o N, 15
o N, 30
o N, 45
o N, 60
o N, 75
o N and 90
o N. This format
remains similar for all the other azimuths. For all of the inclination and direction
angle combinations the spectral irradiance increased with increasing wavelength from
the cut-off wavelength of 295 nm. The troughs seen at the same wavelengths
throughout the spectral irradiances are caused by the absorption of UV radiation by
various molecular constituents within the Sun’s atmosphere and the Earth’s
atmosphere.
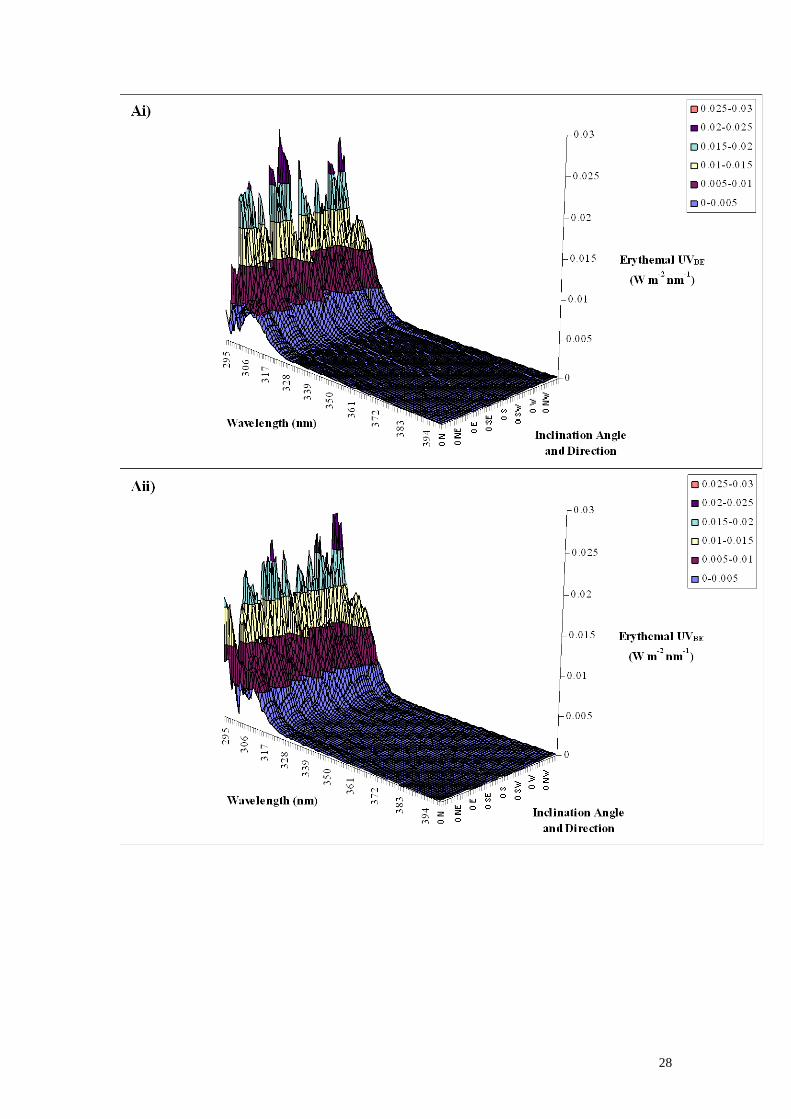
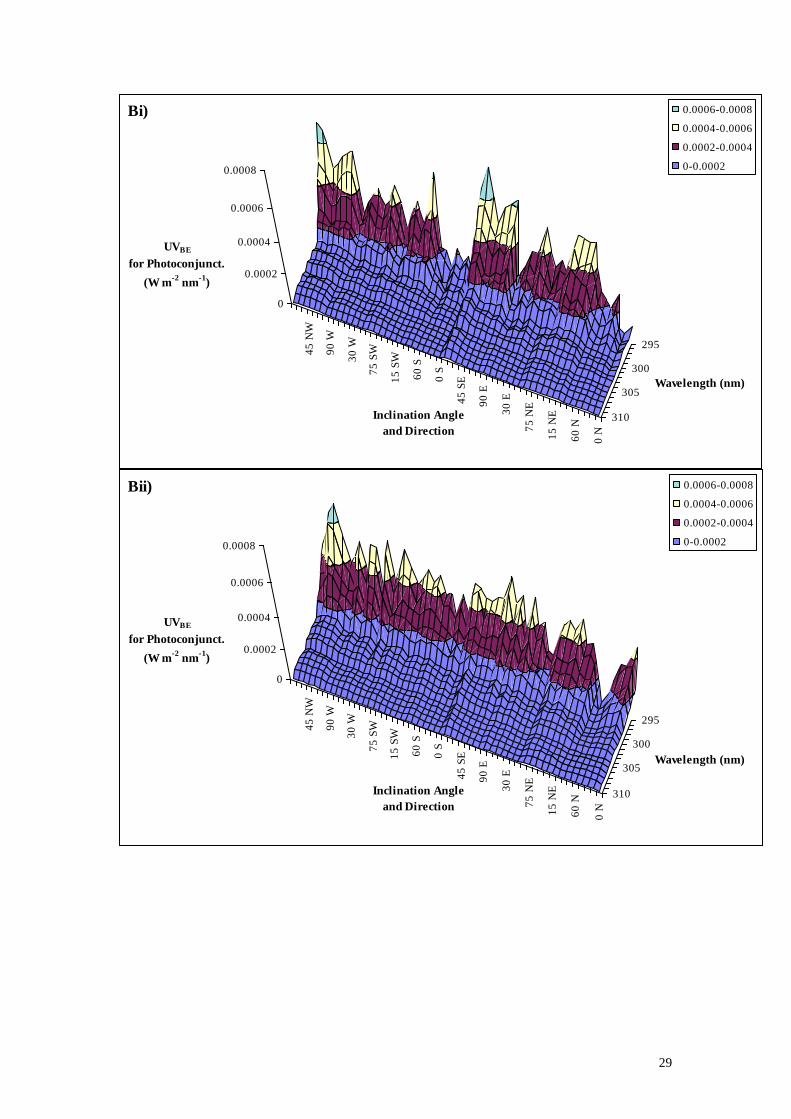
The spectral UVBE distributions corresponding to trial 1 and trial 2 for the erythemal,
photoconjunctivital and photokeratital responses are illustrated in the form of a three-
dimensional contour map in Figure 5. In these contour maps the three axes represent
the same quantities as detailed before for Figure 4. These contour maps show that in
general under both clear and cloudy conditions for SZAs between 48 o and 60
o, the
highest UVBE levels were received at inclination angles between 15 o and 75
o either
near or along the north or north-west directions. In addition, the contour maps display
the disparity of UVBE levels across the different inclination angle and direction
combinations that reveal the anisotropic distribution of the UVBE for each of the
various biological responses.
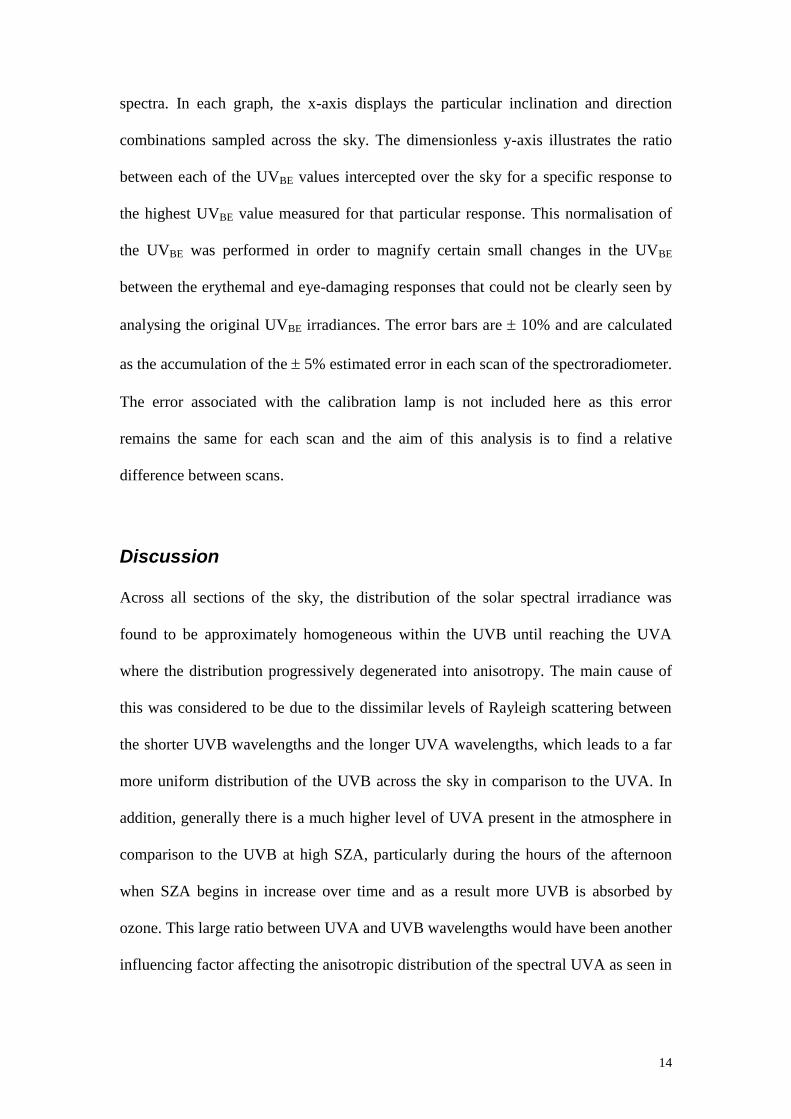
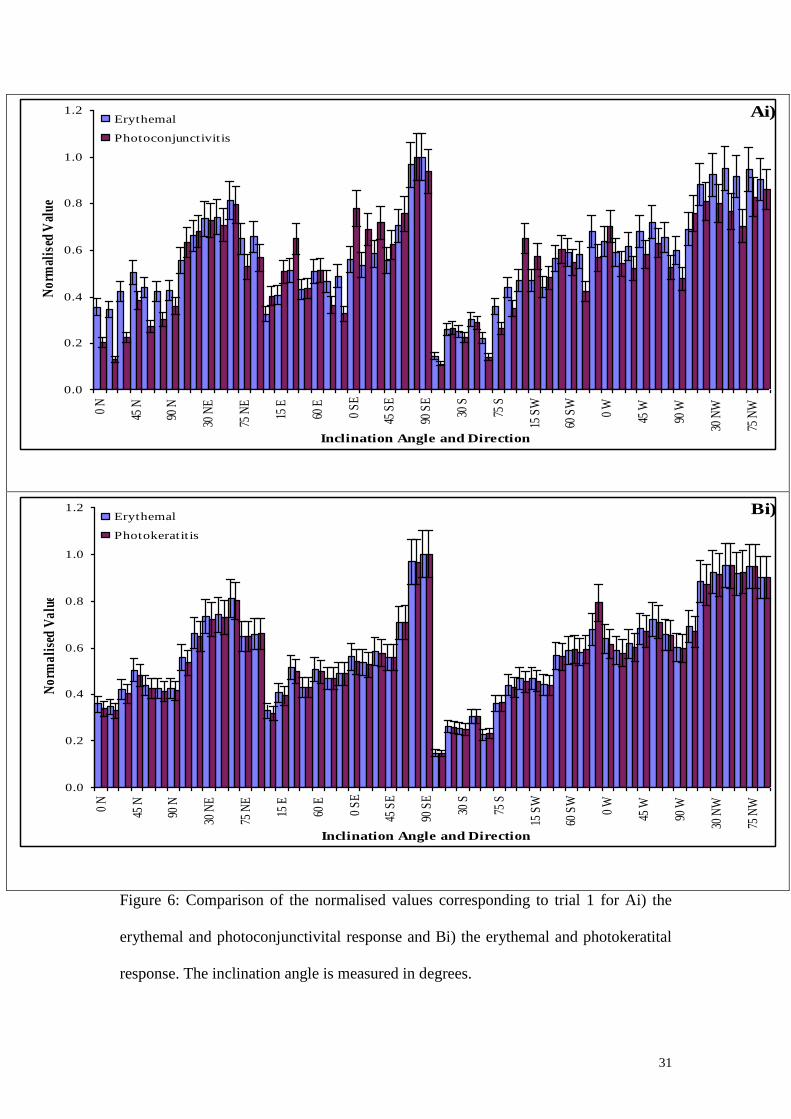
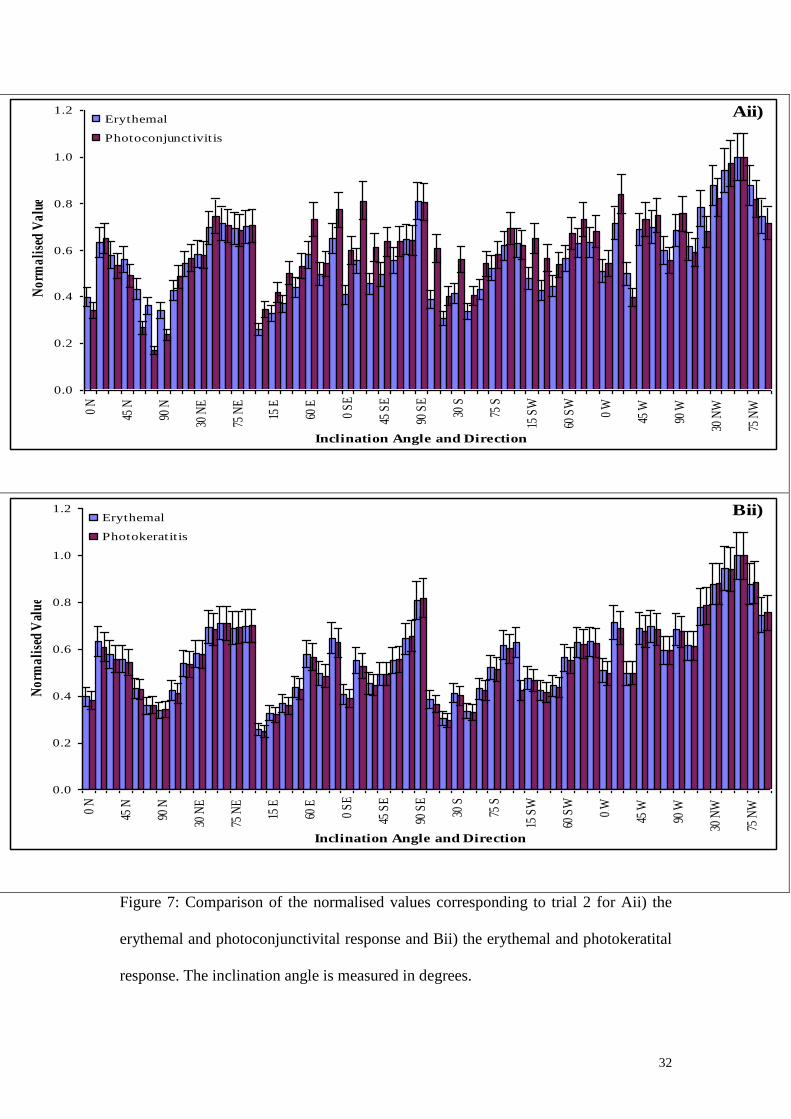
For trial 1 and trial 2, Figure 6 and Figure 7 respectively compare the distribution of
the erythemal UVBE to the distributions of the UVBE for photoconjunctivitis and
photokeratitis across the hemispherical domain. These UVBE measurements were
selected due to the differences in the responsive wavelengths of the respective action
14
spectra. In each graph, the x-axis displays the particular inclination and direction
combinations sampled across the sky. The dimensionless y-axis illustrates the ratio
between each of the UVBE values intercepted over the sky for a specific response to
the highest UVBE value measured for that particular response. This normalisation of
the UVBE was performed in order to magnify certain small changes in the UVBE
between the erythemal and eye-damaging responses that could not be clearly seen by
analysing the original UVBE irradiances. The error bars are 10% and are calculated
as the accumulation of the 5% estimated error in each scan of the spectroradiometer.
The error associated with the calibration lamp is not included here as this error
remains the same for each scan and the aim of this analysis is to find a relative
difference between scans.
Discussion
Across all sections of the sky, the distribution of the solar spectral irradiance was
found to be approximately homogeneous within the UVB until reaching the UVA
where the distribution progressively degenerated into anisotropy. The main cause of
this was considered to be due to the dissimilar levels of Rayleigh scattering between
the shorter UVB wavelengths and the longer UVA wavelengths, which leads to a far
more uniform distribution of the UVB across the sky in comparison to the UVA. In
addition, generally there is a much higher level of UVA present in the atmosphere in
comparison to the UVB at high SZA, particularly during the hours of the afternoon
when SZA begins in increase over time and as a result more UVB is absorbed by
ozone. This large ratio between UVA and UVB wavelengths would have been another
influencing factor affecting the anisotropic distribution of the spectral UVA as seen in
15
both trial 1 and trial 2 which both extended from late morning to the early afternoon
spanning across an SZA range of approximately 10 o.
The anisotropic distribution of the spectral irradiance seen in these trials can not only
be associated to Rayleigh scattering. Scattering caused by natural and industrial
aerosols and cloud cover also has an influence upon incoming solar UVB and UVA
photons. Additionally, the position of the sun within the east-west plane of the sky
contributes in part to the anisotropic profile of the spectral solar UV. Each trial was
undertaken during either the mid to late morning or the early afternoon. During these
times of the day, at the measurement location, the sun transverses across the north to
the north-west as it makes its way out towards the west in the late afternoon, so the
measurements made in these directions were intercepting the solar UV irradiance at
either a near or exact sun-normal orientation, which accounts for the significantly
higher spectral irradiances generally seen across the directions moving from the west
to the north in comparison to the directions spanning around from the north-east to the
south-west. These directions running from the north-east to the south-west had no
clear direct view of the sun and consequently were receiving only the localised diffuse
UV irradiance.
Trial 1 taken during slightly cloudy conditions exhibited moderately higher spectral
irradiances in comparison to those intercepted during trial 2 taken under completely
cloud free conditions during the same month for a similar SZA range. As some high
cirrus cloud was seen moving close to the solar disk during trial 1 it could be a
possibility that some solar UV enhancement came into effect during the
measurements. For example, in trial 1, the spectral intensity seen at the 45 o
NW
16
inclination angle and direction reached a maxima of approximately 1.4 W m-2
nm-1
at
400 nm, while for trial 2 the spectral intensity of the corresponding inclination angle
and direction reached a maxima of approximately 1.7 W m-2
nm-1
at 400 nm, an
increase of roughly 21%, which is within the limits of 25 23% for UVA
enhancement as defined by [25] and above the total uncertainty inherent within the
spectroradiometer. Additionally, a lower level of ozone was also present during the
trial 1 measurements (239 DU) in comparison to the trial 2 measurements (286 DU)
which could have had a measureable influence on the higher irradiance intensities
detected in trial 1.
For trial 1 and trial 2, as seen in Figure 6, only very slight differences were seen
between the erythemal and photokeratital UVBE distributions across the hemispherical
domain. It is unclear whether these differences are genuine or are the result of the
innate irradiance variation within the spectroradiometer as they all fall within the 10%
level of uncertainty. However, large variations extending across the majority of the
inclination and direction combinations often exceeding the 10% uncertainty threshold
were seen to exist between the erythemal and photoconjunctivital UVBE distributions.
It should be noted that the maximum irradiance did occur at the 90o SE position for
trial 1 and the corresponding trial 2 measurement in this position was also relatively
high. As detailed in the Materials and Methods section, the 90o angle as defined
within the hemispherical domain is effectively a measurement parallel to the Earth’s
surface plane and is not effectively pointing in the SE direction. So at the time that
this measurement was made in both trial 1 and trial 2 the Sun would have been either
very close to or at its highest point in the sky in order for the highest irradiance value
to be measured.
17
As previously mentioned, longer wavelengths, such as those near or within the UVA,
are less sensitive to Rayleigh scattering than the shorter UVB wavelengths, resulting
in the scattering of the longer wavelengths being less uniform across the sky, while
the scattering of the shorter wavelengths remaining approximately isotropic in
comparison. This explains the differences between the erythemal and
photoconjunctivital UVBE distributions and the similarities between the erythemal and
photokeratital UVBE distributions. The photoconjunctivital action spectrum is only
effective within the UVB until a cut-off at 310 nm. However, the photokeratital action
spectrum extends out closer to the UVA until a cut-off at 316 nm, while the erythemal
action spectrum remains effective through the UVB and across the entirety of the
UVA. So the distribution of UVBE for the erythemal and photokeratital responses is
influenced to a lesser degree by scattering in comparison to the UVBE for the
photoconjunctivial response.
Under trees, purpose-built shade structures and hats, the diffuse solar UV component
constitutes the largest proportion of total human UV exposure and hence provides the
greatest biological threat in these environments. The results taken from this research
will provide an improved characterisation of the spectral angular distribution of the
diffuse solar UV component, which should assist in the better design of future UV
minimisation strategies. Further research will be required to quantify the effect of
cloud cover, aerosols, ozone and SZA less than 48 o upon the distribution of the
spectral UV. This data could be used to synthesise a model that would determine the
variations throughout the year of UVBE exposure under particular shade settings.

18
Acknowledgments:
The authors acknowledge the technical staff of the USQ physics discipline and the
Sciences workshop for their assistance in this project.
19
References
[1] J.E. Burt, F.M. Luther. Effect of receiver orientation on erythema dose.
Photochem. Photobiol. 29 (1979) 85-91.
[2] A. Dahlback, J. Moan. Annual exposures to carcinogenic radiation from the sun at
different latitudes and amplification factors related to ozone depletion. The use of
different geometrical representations of the skin surface receiving the ultraviolet
radiation. Photochem. Photobiol. 52 (1990) 1025-1028.
[3] A.V. Parisi, C.F. Wong. A dosimetric technique for the measurement of ultraviolet
radiation exposure to plants, Photochem. Photobiol. 60 (1994) 471-474.
[4] W. Ireland, R. Sacher. The angular distribution of solar ultraviolet, visible and
near-infrared radiation from cloudless skies. Photochem. Photobiol. 63 (1996) 483-
486.
[5] J.E. Frederick. Yearly review. Ultraviolet sunlight reaching the Earth’s surface: A
review of recent research. Photochem. Photobiol. 57 (1993) 175-178.
[6] R.G. Grainger, R.E. Basher, R.L. McKenzie. UV-B Robertson-Berger meter
characterisation and field calibration. Applied Optics, 32 (1993) 343-349.
[7] M.M. Caldwell, L.B. Camp, C.W. Warner, S.D. Flint. Action spectra and their key
role in assessing biological consequences of solar UV radiation, Stratospheric Ozone
Reduction, Solar Ultraviolet Radiation and Plant Life, R.C. Worrest, M.M. Caldwell
(eds.) (1986) Springer, Heidelberg.
[8] J.C.F. Wong, A.V. Parisi. 1996, Measurement of UVA exposure to solar radiation.
Photochem. Photobiol. 63(6) (1996) 807-810.
[9] A.V. Parisi, M.G. Kimlin. Horizontal and sun-normal biologically effective
ultraviolet irradiances. Photochem. Photobiol. 53(1-3) (1999) 70-74.
20
[10] CIE (International Commission on Illumination). A reference action spectrum for
ultraviolet induced erythema in human skin. CIE-Journal. 5(1) (1987) 17-22.
[11] CIE (International Commission on Illumination). Photoconjunctivitis. CIE-
Journal. 5(1) (1986) 24-28.
[12] CIE (International Commission on Illumination). Photokeratitis. CIE- Journal.
5(1) (1986) 19-23.
[13] R.L. McKenzie, K.J. Paulin, M. Kotkamp. Erythemal UV irradiances at Lauder,
New Zealand: Relationship between horizontal and normal incidence. Photochem.
Photobiol. 66 (1997) 683-689.
[14] A.V. Parisi, M.G. Kimlin, D. Turnbull. Spectral shade ratios on horizontal and
sun normal surfaces for single trees and relatively cloud free sky. J. Photochem.
Photobiol. B:Biol. 65 (2001) 151-156.
[15] A.V. Parisi, A. Green, M.G. Kimlin. Diffuse Solar UV Radiation and
Implications for preventing Human Eye Damage. Photochem. Photobiol. 73(2) (2001)
135-139.
[16] D.J. Turnbull, A.V. Parisi. Annual variation of the angular distribution of UV
beneath public shade structures. J. Photochem. Photobiol. B:Biol, 76(1-3) (2004) 41-
47.
[17] P. Koepke, M. Mech. UV irradiance on arbitrarily oriented surfaces: variation
with atmospheric and ground properties. Theor. Appl. Climatol. 81 (2005) 25-32.
[18] Kawanishi, T. in Proceedings of SPIE Vol. 5886 Ultraviolet Ground- and Space-
based Measurements, Models and Effects V, eds. G. Bernhard, J.R. Slusser, J.R.
Herman, W. Gao (SPIE, Belligham, WA, 2005).
[19] Bentham Instruments n.d., Cosine Response Diffusers, United Kingdom, viewed
8 October 2010, < http://www.bentham.co.uk/pdf/Cosine%20Diffusers.pdf>
21
[20] CSIRO (Commonwealth Scientific and Industrial Research Organisation) 1997,
National Measurement Laboratory Measurement Report On One Tungsten Halogen
Lamp No. M28623, CSIRO, Lindfield, Australia.
[21] C.F. Wong, S. Toomey, R.A. Fleming, B.W. Thomas. UV-B radiometry and
dosimetry for solar measurements. Health Phys. 68 (1995) 175-184.
[22] J.M. Sabburg, C.N. Long. Improved sky imaging for studies of enhanced UV
irradiance. Atmos. Chem. Phys. 4 (2004) 2543-2552.
[23] A.V. Parisi, J. Sabburg, M.G. Kimlin, Scattered and Filtered Solar UV
Measurements, Kluwer Academic Publishers, 2004.
[24] NASA 2006, Aerosol Data, United States, viewed 8 October 2010, <
http://jwocky.gsfc.nasa.gov/aerosols/AI_definition/ai_ep_definition.pdf>
[25] J.M. Sabburg, A.V. Parisi, M.G. Kimlin. Enhanced spectral UV irradiance: A 1
year preliminary study. Atmos. Res. 66 (2003) 261-272.
22
Table 1: Specific measurement trial details.
Trial Name Date SZA Range
Over Trial (o)
Solar Azimuth
Range (o)
Percent Cloud
Coverage
(Minimum to
Maximum)
Local Aerosol
Index
UV Index Local Ozone
Level (Dobson
Units)
Cloud
Coverage
Description
Trial 1 8 July 2005 60 to 51 41 to 10 1 to 34 -0.5 12 239 Partially cloudy
with some cloud
visible near the
solar disk
Trial 2 26 July 2005 58 to 48 39 to 14 1 to 2 -2.8 12 286 Clear sky. No
cloud near the
solar disk
23
FIGURE CAPTIONS
Figure 1: The erythemal action spectrum (CIE [10]), the photoconjunctivital action
spectrum (CIE [11]) and the photokeratital action spectrum (CIE [12]).
Figure 2: The configuration of the mobile scanning spectroradiometer in operation in
the field.
Figure 3: The hemispherical measurement environment where denotes the
inclination angle, defines the direction/azimuth angle and gives the SZA. The
detector is located at the origin O.
Figure 4: The distribution of spectral irradiance spanning over the hemispherical
domain for A) trial 1 and B) trial 2. The inclination angle is measured in degrees.
Figure 5: Spectral distributions of the erythemal, photoconjunctivital and
photokeratital UVBE across the hemispherical domain shown for trial 1 in charts Ai),
Bi) and Ci) respectively and for trial 2 in charts Aii), Bii) and Cii).
Figure 6: Comparison of the normalised values corresponding to trial 1 for Ai) the
erythemal and photoconjunctivital response and Bi) the erythemal and photokeratital
response. The inclination angle is measured in degrees.
Figure 7: Comparison of the normalised values corresponding to trial 2 for Aii) the
erythemal and photoconjunctivital response and Bii) the erythemal and photokeratital
response. The inclination angle is measured in degrees.
24
0.0001
0.001
0.01
0.1
1
280 300 320 340 360 380 400
Wavelength (nm)
Rela
tiv
e R
esp
on
se
Erythemal Action Spectrum
Photoconjunctivitis Action Spectrum
Photokeratitis Action Spectrum
Figure 1: The erythemal action spectrum (CIE [10]), the photoconjunctivital action
spectrum (CIE [11]) and the photokeratital action spectrum (CIE [12]).
25
Figure 2: The configuration of the mobile scanning spectroradiometer in operation in
the field.

26
Figure 3: The hemispherical measurement environment where denotes the
inclination angle, defines the direction/azimuth angle and gives the SZA. The
detector is located at the origin O.
27
29
5
30
2
30
9
31
6
32
3
33
0
33
7
34
4
35
1
35
8
36
5
37
2
37
9
38
6
39
3
40
0
0 S
0 SW
0 W
0 NW
0 N
0 NE
0 E
0 SE
0.0
0.5
1.0
1.5
2.0
Spectral Irradiance
(W m-2
nm-1
)
Wavelength (nm)
Inclination Angle and
Direction
A) 1.5-2.0
1.0-1.5
0.5-1.0
0.0-0.5
29
5
30
2
30
9
31
6
32
3
33
0
33
7
34
4
35
1
35
8
36
5
37
2
37
9
38
6
39
3
40
0
0 S
0 SW
0 W
0 NW
0 N
0 NE
0 E
0 SE
0.0
0.5
1.0
1.5
2.0
Spectral Irradiance
(W m-2
nm-1
)
Wavelength (nm)
Inclination Angle and
Direction
B) 1.5-2.0
1.0-1.5
0.5-1.0
0.0-0.5
Figure 4: The distribution of spectral irradiance spanning over the hemispherical
domain for A) trial 1 and B) trial 2. The inclination angle is measured in degrees.
28
29
0 N60
N
15
NE
75
NE
30
E90
E
45
SE0
S60
S
15
SW
75
SW
30
W90
W
45
NW
295
300
305
310
0
0.0002
0.0004
0.0006
0.0008
0.0006-0.0008
0.0004-0.0006
0.0002-0.0004
0-0.0002
Bi)
Inclination Angle
and Direction
Wavelength (nm)
UVBE
for Photoconjunct.
(W m-2
nm-1
)
0 N60
N
15
NE
75
NE
30
E90
E
45
SE0
S60
S
15
SW
75
SW
30
W90
W
45
NW
295
300
305
310
0
0.0002
0.0004
0.0006
0.0008
0.0006-0.0008
0.0004-0.0006
0.0002-0.0004
0-0.0002
Bii)
Inclination Angle
and Direction
Wavelength (nm)
UVBE
for Photoconjunct.
(W m-2
nm-1
)

30
0 N
60
N
15
NE
75
NE
30
E
90
E
45
SE
0 S
60
S
15
SW
75
SW
30
W
90
W
45
NW
295
299
303
307
311
315
0
0.005
0.01
0.015
0.02
0.015-0.02
0.01-0.015
0.005-0.01
0-0.005
Ci)
Inclination Angle
and Direction
Wavelength (nm)
UVBE
for Photokeratitis
(W m-2
nm-1
)
0 N
60
N
15
NE
75
NE
30
E
90
E
45
SE
0 S
60
S
15
SW
75
SW
30
W
90
W
45
NW
295
299
303
307
311
315
0
0.005
0.01
0.015
0.02
0.015-0.02
0.01-0.015
0.005-0.01
0-0.005
Cii)
Inclination Angle
and Direction
Wavelength (nm)
UVBE
for Photokeratitis
(W m-2
nm-1
)
Figure 5: Spectral distributions of the erythemal, photoconjunctivital and
photokeratital UVBE across the hemispherical domain shown for trial 1 in charts Ai),
Bi) and Ci) respectively and for trial 2 in charts Aii), Bii) and Cii).
31
0.0
0.2
0.4
0.6
0.8
1.0
1.20
N
45 N
90 N
30 N
E
75 N
E
15 E
60 E
0 S
E
45 S
E
90 S
E
30 S
75 S
15 S
W
60 S
W
0 W
45 W
90 W
30 N
W
75 N
W
Inclination Angle and Direction
No
rmal
ised
Val
ue
Erythemal
Photoconjunctivitis
Ai)
0.0
0.2
0.4
0.6
0.8
1.0
1.2
0 N
45 N
90 N
30 N
E
75 N
E
15 E
60 E
0 S
E
45 S
E
90 S
E
30 S
75 S
15 S
W
60 S
W
0 W
45 W
90 W
30 N
W
75 N
W
Inclination Angle and Direction
No
rma
lise
d V
alu
e
Erythemal
Photokeratit is
Bi)
Figure 6: Comparison of the normalised values corresponding to trial 1 for Ai) the
erythemal and photoconjunctivital response and Bi) the erythemal and photokeratital
response. The inclination angle is measured in degrees.
32
0.0
0.2
0.4
0.6
0.8
1.0
1.2
0 N
45 N
90 N
30 N
E
75 N
E
15 E
60 E
0 S
E
45 S
E
90 S
E
30 S
75 S
15 S
W
60 S
W
0 W
45 W
90 W
30 N
W
75 N
W
Inclination Angle and Direction
No
rma
lise
d V
alu
e
Erythemal
Photoconjunctivitis
Aii)
0.0
0.2
0.4
0.6
0.8
1.0
1.2
0 N
45 N
90 N
30 N
E
75 N
E
15 E
60 E
0 S
E
45 S
E
90 S
E
30 S
75 S
15 S
W
60 S
W
0 W
45 W
90 W
30 N
W
75 N
W
Inclination Angle and Direction
No
rma
lise
d V
alu
e
Erythemal
Photokeratitis
Bii)
Figure 7: Comparison of the normalised values corresponding to trial 2 for Aii) the
erythemal and photoconjunctivital response and Bii) the erythemal and photokeratital
response. The inclination angle is measured in degrees.