Embed Size (px)
Citation preview

THE CARBON FOOTPRINT OF AUSTRALIAN TOURISM
ii
Technical Reports The technical report series present data and its analysis, meta-studies and conceptual studies, and are considered to be of value to industry, government and researchers. Unlike the Sustainable Tourism Cooperative Research Centre’s Monograph series, these reports have not been subjected to an external peer review process. As such, the scientific accuracy and merit of the research reported here is the responsibility of the authors, who should be contacted for clarification of any content. Author contact details are at the back of this report.
National Library of Australia Cataloguing-in-Publication entry The carbon footprint of Australian tourism / Peter Forsyth ... [et al]. ISBNs: 9781921521188 (pdf) 9781921521171 (pbk). Notes: Includes index. Bibliography. Tourism—Environmental aspects—Australia. Greenhouse gases—Economic aspects—Australia. Greenhouse gas mitigation—Australia—Economic aspects. Other Authors/Contributors: Forsyth, Peter. Cooperative Research Centre for Sustainable Tourism. Dewey Number: 338.479194
Acknowledgements The Sustainable Tourism Cooperative Research Centre, established and supported under the Australian Government’s Cooperative Research Centre’s Program, funded this research. The Australian Government Department of Resources, Energy and Tourism also contributed funding towards this project.
This document reports the results from a research project undertaken by STCRC, in conjunction with the Australian Government Department of Resources, Energy and Tourism.
Qantas Airways Limited is a major supporter of the STCRC’s Centre for Economics and Policy (CEP),
through its sponsorship of the Qantas Chair in Travel and Tourism Economics at the University of New South Wales.
Copyright © CRC for Sustainable Tourism Pty Ltd 2008 All rights reserved. Apart from fair dealing for the purposes of study, research, criticism or review as permitted under the Copyright Act, no part of this book may be reproduced by any process without written permission from the publisher. Any enquiries should be directed to: General Manager Communications and Industry Extension or Publishing Manager, via [email protected].
First published in Australia in 2008 by CRC for Sustainable Tourism Pty Ltd Printed in Australia (Gold Coast, Queensland)
Disclaimer While all reasonable efforts have been made to gather the most current and appropriate information, Sustainable Tourism Cooperative Research Centre (STCRC) does not give any warranty as to the correctness, completeness or suitability of the information, and shall in no event be liable for any loss or damage that might be suffered as a result of reliance on this information. Please direct all enquiries to STCRC via [email protected].
THE CARBON FOOTPRINT OF AUSTRALIAN TOURISM
iii
Authors The research for this report was carried out by STCRC’s Centre for Economics and Policy (CEP). The following CEP staff contributed to the study:
• Peter Forsyth Professor of Economics and Deputy Director, Tourism Research Unit, Monash University
• Serajul Hoque Research Fellow, STCRC CEP, Monash University
• Larry Dwyer Qantas Professor of Travel and Tourism Economics, University of New South Wales
• Ray Spurr Director of CEP, Senior STCRC Research Fellow, University of New South Wales
• Thiep Van Ho Senior Economic Modeller, STCRC CEP, Monash University
• Daniel Pambudi Research Fellow, STCRC CEP, Monash University

THE CARBON FOOTPRINT OF AUSTRALIAN TOURISM
iv
CONTENTS TECHNICAL REPORTS ____________________________________________________________________ II NATIONAL LIBRARY OF AUSTRALIA CATALOGUING-IN-PUBLICATION ENTRY _________________________ II ACKNOWLEDGEMENTS ___________________________________________________________________ II COPYRIGHT © CRC FOR SUSTAINABLE TOURISM PTY LTD 2008 ___________________________________ II DISCLAIMER ___________________________________________________________________________ II AUTHORS _____________________________________________________________________________ III LIST OF FIGURES ________________________________________________________________________ V LIST OF TABLES ________________________________________________________________________ V
EXECUTIVE SUMMARY________________________________________________________________ VI CARBON FOOTPRINT OF AUSTRALIAN TOURISM ________________________________________________ VI
Comparison with ‘Non-Tourism’ Industries – Direct Emissions__________________________________x Total Emissions from International Aviation________________________________________________ xi
INTRODUCTION________________________________________________________________________ 1 APPROACH AND METHOD ______________________________________________________________ 3
DIRECT GHG EMISSIONS ESTIMATES ________________________________________________________ 3 INDIRECT GHG EMISSIONS ESTIMATES ______________________________________________________ 4
CARBON FOOTPRINT OF AUSTRALIAN TOURISM: RESULTS______________________________ 6 PRODUCTION BASED CARBON FOOTPRINT ____________________________________________________ 7
Direct GHG Emissions from Tourism Industries (Row 1)______________________________________ 9 Emissions from Motor Vehicles (Row 2) ___________________________________________________ 9 Emissions from International Aviation (Row 3) _____________________________________________ 9 Indirect Emissions from Tourism Inputs (Row 5) ___________________________________________ 10 Emissions from Imports (Row 6) ________________________________________________________ 10 Emissions from Transport of Imports (Row 7) _____________________________________________ 10
EXPENDITURE BASED CARBON FOOTPRINT __________________________________________________ 11 NOTES: TABLE 2 _______________________________________________________________________ 12
Direct GHG Emissions (Rows 1 and 2)___________________________________________________ 12 Emissions from International Aviation (Rows 3 and 4)_______________________________________ 12 Indirect Emissions from Tourism Inputs and Imports (Rows 6 and 7) ___________________________ 12 Emissions from Directly Purchased Imports (Row 8) ________________________________________ 12 Emissions from Transport of Imports (Row 9) _____________________________________________ 12 Indirect Emissions from Non-Australian Based Aviation (Row 10) _____________________________ 12
COMPARISONS WITH ‘NON-TOURISM’ INDUSTRIES – DIRECT GHG EMISSIONS _______________________ 13 TOTAL GHG EMISSIONS FROM INTERNATIONAL AVIATION ______________________________________ 13
FURTHER DIRECTIONS________________________________________________________________ 16 SUMMARY ____________________________________________________________________________ 17
APPENDIX A: GHG EMISSIONS TABLES A1 – A8 _________________________________________ 19 APPENDIX B: DEFINITIONS OF SELECTED TERMS USED IN THIS REPORT __________________ 33 REFERENCES________________________________________________________________________ 35 GERMAN AEROSPACE INSTITUTE (DLR) (2008). HTTP://WWW.DLR.DE/RM-NEU/EN/DESKTOPDEFAULT.ASPX_ 35 INTERNATIONAL CIVIL AVIATION ORGANIZATION (2008). HTTP://WWW2.ICAO.INT/PUBLIC/CFMAPPS/CARBONOFFSET/CARBON_CALCULATOR.CFM# _______________ 35 LIST OF ABBREVIATIONS_____________________________________________________________ 36
THE CARBON FOOTPRINT OF AUSTRALIAN TOURISM
v
List of Figures Figure 1 Production Based Approach Major Components of Total GHG Emissions_____________________ vii Figure 2 Expenditure Based Approach Major Components of Total GHG Emissions _____________________ ix Figure 3 Share of Direct GHG Emissions by Tourism Industry 2003–04 _______________________________x Figure 4 Total CHG Emissions from International Aviation ________________________________________ xi Figure 5 Shares of Tourism GHG Emissions – Production Based, 2003–04 ____________________________ 8 Figure 6 Shares of Direct GHG Emissions by Tourism Industry, 2003–04 _____________________________ 8 Figure 7 Share of Indirect GHG Emissions from Tourism Purchases, 2003–04 _________________________ 9 Figure 8 Shares of Tourism GHG emissions – Expenditure based, 2003–04___________________________ 12 Figure 9 Shares of Direct and Indirect GHG Emissions from International (Australian and Non-Australian Based) Airlines, 2003–04 __________________________________________________________________ 14
List of Tables Table A1 Direct GHG Emissions by Tourism Industry (in Mt), 2003–04______________________________ 19 Table A2 Indirect GHG Emissions from Tourism Purchases (in Mt), 2003–04 _________________________ 20 Table A3 Indirect GHG Emissions from Tourism Purchases Excluding Outbound International Aviation (in Mt), 2003–04 _______________________________________________________________________________ 22 Table A4 Expenditure Based Emissions from International Aviation (Australian and Foreign) ____________ 24 Table A5 Tourism (production only) Compared to ‘Non-Tourism’ Economic Sector ____________________ 25 Table A6 Direct GHG Emissions, by Economic (ANZSIC) Sector, Australia, 2003–04, Mt________________ 27 Table A7 Tourism (production, private motor vehicle use and Australian based international aviation) Compared to ‘Non-Tourism’ Economic Sector__________________________________________________ 29 Table A8 Tourism (production, private motor vehicle use and Australian and non-Australian based inbound international aviation) Compared to ‘Non-Tourism’ Economic Sector _______________________________ 31
THE CARBON FOOTPRINT OF AUSTRALIAN TOURISM
vi
EXECUTIVE SUMMARY The focus of this report is on the ‘Carbon Footprint’ of the Australian tourism industry. Increasingly the shorthand term ‘Carbon Footprint’ is used to refer to the amount of greenhouse gas (GHG) emissions (CO2 equivalent) associated with the production and consumption of goods and services at the level of an individual firm, industry or entire economy. Producing goods and services for tourism results in GHG emissions in both the home economy, Australia and abroad.
The measures presented here are comprehensive and include all the GHG emissions produced by Australian tourism globally. They include:
• GHG emissions which arise directly from tourism production—for example, from the fuel used by tour
buses;
• indirect GHG emissions, for example, from electricity used by resorts; and
• GHG emissions from imports which are provided to tourists or the industry and from the transport of those imports—these emissions do not come from Australian production.
The objective is to present measures of global GHG emissions from tourism. These various components are presented separately, however.
This paper reports outputs from two approaches to estimating the direct and indirect carbon ‘costs’ of the
Australian tourism industry for the year 2003–04. These Carbon Footprint estimates (in Mt, millions of tonnes), include the home (Kyoto) emissions and in addition, emissions from international aviation and overseas production, to gain an indication of the global emissions from Australian tourism.
Carbon Footprint of Australian Tourism The production based estimates are for the Carbon Footprint arising from production of the Australian tourism industry, as defined and measured by the Australian Tourism Satellite Account (ATSA).
The production based estimates include: • GHG emissions directly produced by tourism industries;
• inbound and outbound aviation services of Australian airlines; and
• GHG emissions from imports used in producing goods and services for sale to the Australian tourism industry.
The production based estimates exclude: • inbound or outbound services of non-Australian based airlines; and
• GHG emissions from imports directly purchased by tourists.
The expenditure based estimates are for the Carbon Footprint which arises from the expenditures by non-Australian based and domestic tourists on tourism in Australia.
The expenditure based estimates include: • air travel by visitors provided by Australian and non-Australian based airlines.
The expenditure based estimates exclude:

THE CARBON FOOTPRINT OF AUSTRALIAN TOURISM
vii
• expenditure on outbound trips by departing Australian residents except for the part of this expenditure which relates to activities within Australia (e.g. for travel costs and hotels within Australia preceding or following an international flight); and
• expenditure on outbound air fares.
Using the production approach we estimate: • Total direct GHG emissions 26.3 Mt
• Total indirect GHG emissions 28.1 Mt
Total global (direct plus indirect) GHG emissions are estimated to be 54.4 Mt. Shares of direct and indirect GHG emissions in total GHG emissions were 48.3 per cent and 51.7 per cent respectively.
When our current ‘Kyoto’ emissions are considered the Australian figures are 21.6 Mt direct and 18.8 Mt
indirect for a total of 40.4 Mt. Assessing and attributing the particular case of international aviation emissions is complex, largely because the ‘rules’ for attribution for global aviation emissions to individual economies are yet to be determined. To the present these remain outside of national Kyoto targets, but given Australia’s distance from markets it is important that the magnitude of this component (and future risk) be examined. Some alternative approaches to measuring the extent of the components of this issue are reported in this report.
Shares of GHG emissions by Australian Kyoto, foreign sourced and international aviation – Australian
airlines in total GHG emissions were 74.3 per cent, 17.1 per cent and 8.6 per cent, respectively, as illustrated in Figure 1 below.
The major components are displayed below. These results are shown in detail in Table 1 in the main report.
Figure 1 Production Based Approach Major Components of Total GHG Emissions
Using the expenditure approach we estimate: • Total direct GHG emissions 29.5 Mt
• Total indirect GHG emissions 32.0 Mt
Total (direct plus indirect) GHG emissions are estimated to be 61.5 Mt. The major components are displayed below. The Australian Kyoto emissions are calculated as 39.9 Mt with an additional 21.6 Mt emissions produced by the global activity generated by tourists to and within Australia. As noted above, the international aviation components of these emissions are largely unattributed at the present but remain as a significant risk to the Australian tourism sector. Emissions from goods and services imported into Australia are the responsibility of

THE CARBON FOOTPRINT OF AUSTRALIAN TOURISM
viii
other countries, but would affect Australian tourism if their prices were to change due to implementation of climate change mitigation policies in supplier countries. These results are shown in detail in Table 2 in the main report.

THE CARBON FOOTPRINT OF AUSTRALIAN TOURISM
ix
Figure 2 Expenditure Based Approach Major Components of Total GHG Emissions
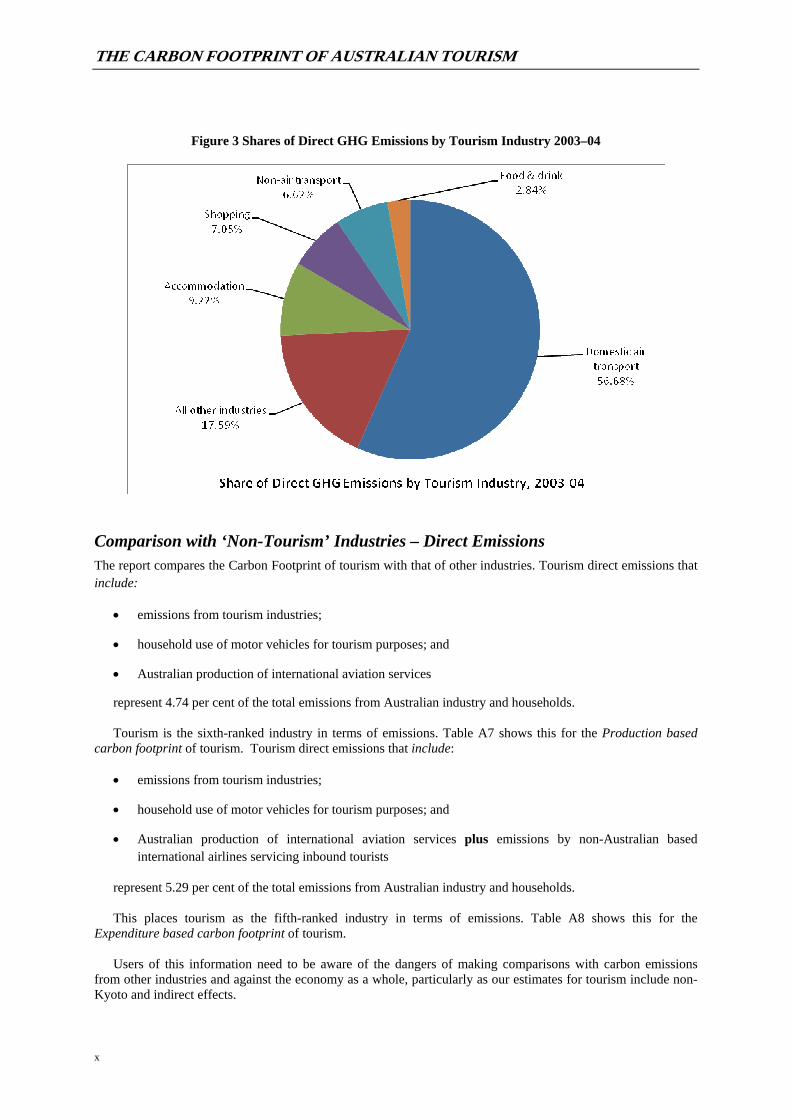
Production based total direct GHG emissions by the Australian tourism industry in 2003–04 was 10.5 Mt (see Table 1). These are estimates of GHG emissions directly produced by tourism industries, based on the model database (Adams, 2006). The tourism industry is as defined in the Australian Tourism Satellite Account (ATSA). This is an aggregation of the tourism components of other industries. They include domestic but not international aviation, and they do not include emissions from use of private motor vehicles for tourism. The detailed industry breakdown is given in Table A1.
Domestic air transport was the largest component of tourism industry GHG emissions at 56.68 per cent,
followed by accommodation services (9.22%), shopping (7.05%), non-air transport (6.62%), and food and drink (2.84), as illustrated in Figure 3 opposite.
These estimates of the Carbon Footprint of the Australian tourism industry are, to our knowledge, the most
accurate to date given the available data. The notes to the tables explain the differences between the production and expenditure based approaches and outline the difficulties and methods of calculating international aviation and foreign sourced GHG emissions. While these are not currently part of Australia’s Kyoto emissions they are nonetheless significant in the debate on global climate change and are subject to increasingly intense international scrutiny.
THE CARBON FOOTPRINT OF AUSTRALIAN TOURISM
x
Figure 3 Shares of Direct GHG Emissions by Tourism Industry 2003–04
Comparison with ‘Non-Tourism’ Industries – Direct Emissions The report compares the Carbon Footprint of tourism with that of other industries. Tourism direct emissions that include:
• emissions from tourism industries;
• household use of motor vehicles for tourism purposes; and
• Australian production of international aviation services
represent 4.74 per cent of the total emissions from Australian industry and households. Tourism is the sixth-ranked industry in terms of emissions. Table A7 shows this for the Production based
carbon footprint of tourism. Tourism direct emissions that include: • emissions from tourism industries;
• household use of motor vehicles for tourism purposes; and
• Australian production of international aviation services plus emissions by non-Australian based international airlines servicing inbound tourists
represent 5.29 per cent of the total emissions from Australian industry and households. This places tourism as the fifth-ranked industry in terms of emissions. Table A8 shows this for the
Expenditure based carbon footprint of tourism. Users of this information need to be aware of the dangers of making comparisons with carbon emissions
from other industries and against the economy as a whole, particularly as our estimates for tourism include non-Kyoto and indirect effects.

THE CARBON FOOTPRINT OF AUSTRALIAN TOURISM
xi
Total Emissions from International Aviation The report estimates GHG emissions from inbound international passenger aviation, excluding freight.
Total direct and indirect GHG Emissions are 9.9 Mt. This comprises Australian airlines GHG emissions of 2.7 Mt and non-Australian based airlines GHG emissions of 7.2 Mt. Total GHG emissions from international aviation (both Australian and non-Australian based) in 2003–04 was 9.9 Mt. Shares of direct GHG emissions by non-Australian based and Australian based airlines were 58.6 per cent, 21.2 per cent respectively while indirect GHG emissions by non-Australian based airlines, and Australian based airlines were 14.1 per cent and 6.1 per cent, respectively.
Figure 4 Total CHG Emissions from International Aviation
Australian Airlines Direct
Emissions21.2%
Australian Airlines Indirect
Emissions6.1%
Foreign Airlines Direct Emissions
58.6%
Foreign Airlines Indirect
Emissions14.1%
Total GHG Emissions from International Aviation, 9.9 Mt
2.1 Mt
0.6 Mt
1.4 Mt
5.8 Mt
Some of the emissions from Australian tourism are produced in Australia, and are GHG emissions which are included under Kyoto accounting rules. In addition there are GHG emissions from Australian firms producing in Australia which are not included under Kyoto rules—the main example of this is GHG emissions from Australian airlines’ international services. There also are GHG emissions which are produced overseas, for example, in the production of goods which Australia imports to supply tourists or the tourism industry. Australia has responsibility for its ‘Kyoto’ emissions and has committed to reduce them. It has no specific commitments to reduce GHG emissions from international aviation1, and GHG emissions from the production of goods which Australia imports to supply to tourists or the tourism industry—these are the responsibility of the countries which produce them. Whatever are the commitments of Australia at the present time, policies to mitigate and to adapt to climate change need to be based on as much detailed information as is available regarding the emissions of GHG associated with economic activity. The estimates contained in this report are intended to provide such information.
1 It also makes no judgment on the ‘radiative forcing effect’ that some argue may arise from the emissions of GHGs at higher altitudes by aircraft—the science surrounding this effect is still uncertain.

THE CARBON FOOTPRINT OF AUSTRALIAN TOURISM
1
Chapter 1
INTRODUCTION
This report is the latest in a series of reports published by the Sustainable Tourism Cooperative Research Centre (STCRC) addressing the issue of climate change and tourism. Climate change, which has substantial capacity to affect Australia’s destination competitiveness, is the result of a build up of greenhouse gases (GHGs), chiefly carbon dioxide (CO2) in the atmosphere. Policies to mitigate and to adapt to climate change need to be based on as much detailed information as is available regarding the emissions of GHG associated with economic activity. Increasingly, the shorthand term ‘Carbon Footprint’ is used to refer to the amount of GHG emissions associated with the production and consumption of goods and services at the level of an individual firm, industry or entire economy. The focus of this report is on the ‘carbon footprint’ of the Australian tourism industry.
In this Report we present a comprehensive measure of the Carbon Footprint of tourism, or, in other words,
the CO2 equivalent emissions associated with Australian tourism. The measures are for 2003–04, the latest year for which the data needed for a fully comprehensive measure were available. The footprint would have grown somewhat since.
The development of a Carbon Footprint for tourism is not straightforward, as there are several different
interpretations given to what the Carbon Footprint is, and what it should encompass (for some discussion, see Patterson and McDonald, 2004; Becken and Patterson, 2006; Dick Sisman and Associates, 2007; Kelly and Williams, 2007; and Lundie, Dwyer and Forsyth, 2007). Here we have sought to be as all-inclusive as possible. Several measures of the Carbon Footprint for other countries are less inclusive, and simply focus on some key sectors. Details are given for the various components of the Footprint.
Another issue concerns the definition of tourism. In this Report, tourism consists of the economic activities
included in the Australian Tourism Satellite Account (TSA). The TSA is widely used in Australia, and this Carbon Footprint is consistent with it. However, even within the TSA there are several measures of ‘tourism’. One measure is the production by the Australian tourism industry—this includes services provided by Australian international airlines to inbound visitors and outbound Australian tourists. The TSA also measures tourism expenditure in Australia and this also includes expenditure on imports provided to tourists. Here we report on both a production based measure of the Footprint, and an expenditure based measure.
The measures presented here are comprehensive and include all the GHG emissions produced by Australian
tourism globally. They include: • GHG emissions which arise directly from tourism production—for example from the fuel used by tour
buses;
• indirect GHG emissions, for example, from electricity used by resorts; and
• GHG emissions from imports which are provided to tourists or the industry and from the transport of those imports—these emissions do not come from Australian production.
The objective is to present measures of global GHG emissions from tourism. These various components are presented separately however.
Some activities in tourism pose particular difficulties. One of these concerns the use of motor vehicle fuel.
The production of this fuel creates emissions, but in addition, the consumption or use of the fuel also generates emissions. The GHG emissions created by tourists’ use of motor vehicles is included as part of the Carbon Footprint.
International aviation also produces emissions. In the TSA, output of Australian airlines producing
international services is included. Thus, in the production based measures, GHG emissions from this source, both direct and indirect, are counted. In the expenditure based measures, international aviation is handled differently—the GHG emissions associated with carrying inbound visitors, travelling on Australian and non-

THE CARBON FOOTPRINT OF AUSTRALIAN TOURISM
2
Australian based airlines, are included, but the GHG emissions from airlines carrying outbound Australian residents are excluded.
The objective has been to be as comprehensive as possible and to present the GHG emissions arising globally
as a result of Australian tourism, though the various components can be identified. Different GHG emissions can be treated differently. Some of the emissions from Australian tourism are produced in Australia, and are GHG emissions which are included under Kyoto accounting rules. In addition there are GHG emissions from Australian firms producing in Australia which are not included under Kyoto rules—the main example of this is GHG emissions from Australian airlines’ international services. Finally there are GHG emissions which are produced overseas, for example, in the production of goods which Australia imports to supply tourists or the tourism industry. Australia has responsibility for its ‘Kyoto’ emissions and has committed to reduce them. It has no specific commitments to reduce GHG emissions from international aviation, and GHG emissions from the production of goods which Australia produces are the responsibility of the countries which produce them.
Using the production based measure of the Carbon Footprint, the total global emissions associated with
Australian tourism was 54.5 Mt in 2003–04, and of this, 40.4 Mt were Kyoto emissions. Using the expenditure based measure, the global footprint was greater, at 61.5 Mt, though the Kyoto emissions were slightly lower than those for the production based estimate, at 39.9 Mt. The expenditure based measures have higher global GHG emissions because they include more air transport, along with GHG emissions associated with imports provided directly to tourists.
In using these estimates, it is important to be aware of what they seek to measure and what they do not. A
Carbon Footprint is essentially an accounting measure, to determine how GHG emissions intensive an industry is. It is not an impact model. Thus, it would not be correct to conclude that if the tourism industry were to expand by 10 per cent, global GHG emissions on a production base would increase by 5.44 Mt (10% of 54.4 Mt). Changes in the size of the tourism industry will induce changes in other industries, and these would need to be taken into account. Furthermore, it is not possible to use these estimates to obtain anything other than a rough measure of the impact that the introduction of an emissions trading scheme, as proposed by the Australian government, will have on tourism. This policy will have effects across the whole economy, and it is necessary to take these into account in a full modelling exercise to determine the impact of the scheme on Australian tourism.

THE CARBON FOOTPRINT OF AUSTRALIAN TOURISM
3
Chapter 2
APPROACH AND METHOD The estimates measure GHGs directly produced by the industries which make up the tourism industry – for example, the induced GHG emissions of the tourism component of industries in Australia such as domestic aviation, accommodation, cafes and restaurants and food outlets etc.
The tourism industry is as defined in the Australian Tourism Satellite Account (ATSA)2. This is an aggregation of the tourism components of other industries. Given the limitations of the databases used, the estimates provided in this report have been produced using the MMRF (Monash Multi-Regional Forecasting) –Green industry classifications3. This is similar, though not identical, to the classifications used in ATSA. Thus, when aggregated the estimates in this report correspond exactly with the ATSA definitions and measurements, although at the individual component industry level small differences may occur (see ‘Tourism Industry’ in Appendix B including Footnote 10).
GHGs from production of international airline services by Australian-based airlines have been included,
reflecting the fact that such production is included in ATSA. The Carbon Footprint has been estimated for 2003–04, the latest year for which detailed industry GHG
emissions data are available in a form suitable for this type of estimate. The primary data sources for these estimates are the ATSA, the MMRF-Green database4, the Bureau of Transport and Regional Economics database5, and Department of Climate Change (DCC)6 estimates of industry and household GHG emissions. Carbon dioxide equivalent (CO2-e), as measured by the DCC is used in these estimates.
Direct GHG Emissions Estimates The estimate provided here for the Carbon Footprint of the tourism industry is directly comparable to the GHGs or Carbon Footprint of other industries as represented in the DCC statistics on industry GHG emissions with two notable exceptions. These are the handling of international aviation GHG emissions outside Australia, and inclusion of private motor vehicle use (see below) both of which pose particular problems for estimation of the tourism industry’s Carbon Footprint.
International aviation production by Australian airlines (e.g. Qantas carrying passengers from Sydney to Singapore or Singapore to London) is included as part of tourism production in ATSA. Hence, for consistency, GHGs resulting from this production need to be included in the estimates.
There are, however, no available estimates of GHGs from Australian airline international aviation services.
The DCC excludes international aviation in its estimates, although it does include domestic aviation. It also includes estimates of GHGs from aviation fuel sold in Australia to international airlines (including Qantas, Singapore Airlines and Emirates). This is different from the GHGs resulting from international operations by Australian airlines and different from GHGs generated by international tourism to and from Australia.
The use of fuel in motor vehicles in Australia adds to GHGs produced in Australia. In the DCC data,
however, these GHGs are included in the GHG emissions of the household sector and not of the industrial sector. Thus while tourism use of household motor vehicles is another source of GHGs, it is not strictly part of the ‘tourism industry’ when defined in production based terms. Because of the significance of this component of tourism generated GHGs (from both domestic and international visitor activity), they have been identified and included in this report. Tourism expenditure data from the ATSA were used to estimate tourism purchases and use of fuel, and these in turn were used to estimate GHGs.
2 Australian Bureau of Statistics (2007) 3 Adams (2006) 4 Ibid 5 Bureau of Transport and Regional Economics (2007) 6 Department of Climate Change (DCC), 2007a (formerly the Australian Greenhouse Office)

THE CARBON FOOTPRINT OF AUSTRALIAN TOURISM
4
For the production based measures, an estimate of the GHG emissions resulting from Australian airlines’
international services was obtained by multiplying the Qantas international passenger services by an estimate of the emissions per passenger kilometre from the German Aerospace Institute (DLR) (personal communication). These estimates allow only for the passenger component of flights and exclude air freight. In 2003–04 by far most Australian based international services were provided by the Qantas Group.
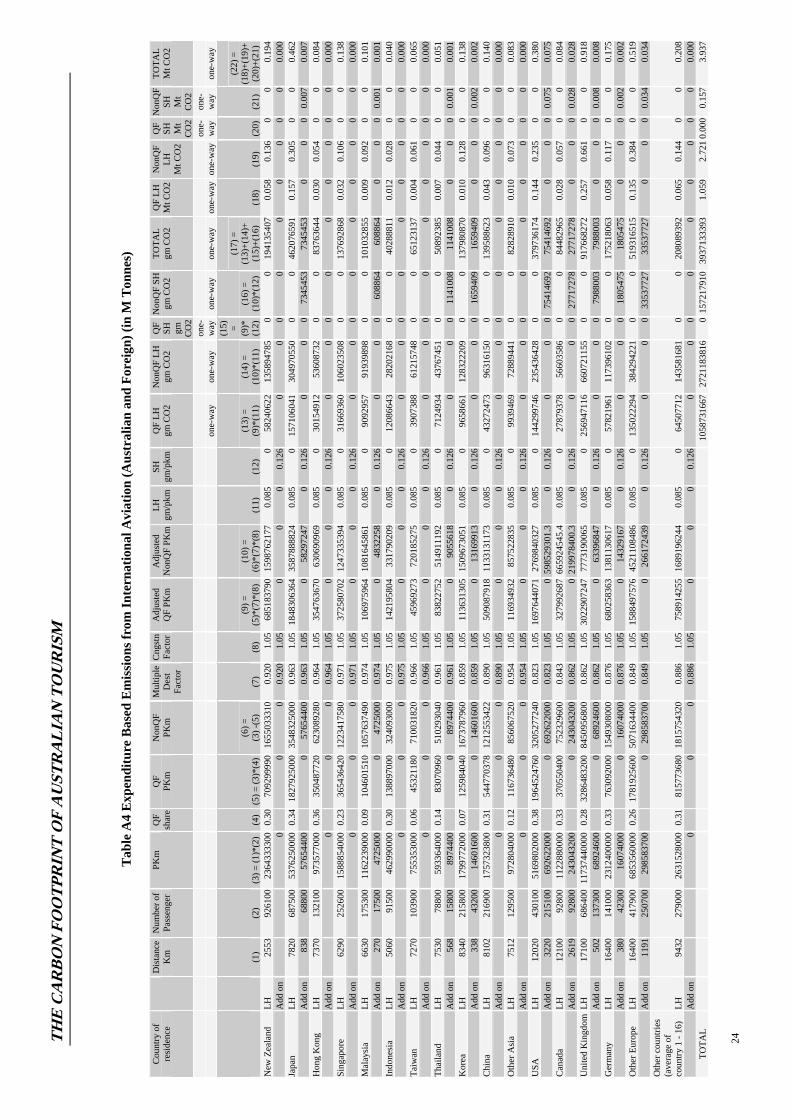
Estimates for international aviation using the expenditure measure include inbound passenger aviation only.
Workings for the estimates are shown in Table A4. They are based on passenger kilometres from major inbound tourism markets as identified from Tourism Research Australia’s International Visitor Survey (IVS), Qantas market shares, adjustments for non-direct flying (5%) and scaled down to allow for multiple destination visits (e.g. where a UK visitor makes a stopover in Hong Kong—see paragraph below). The non-Australian based aviation component includes an allowance for short haul connecting flights in origin regions. GHG emissions were estimated at 0.126 g per passenger km for short haul flights (Scheelhaase and Grimme, 2007) and 0.085g per passenger km for long haul flights (from German Aerospace Institute, DLR).
The multiple destinations adjustment factor was calculated as follows. Data on the proportions of visitors
who visited another country en route to and from Australia were taken from the 2003–04 IVS for each of the recorded main origin markets. Estimates were made of the length of stay of visitors from each origin market. The proportions of the days spent on trips from each destination in Australia were estimated. Thus, for example, the proportion of the days spent in Australia on a trip from New Zealand was estimated at 0.96, and from the US (on which multiple destinations are common), was 0.81. Direct aviation GHG emissions from the whole trip were allocated according to the proportion of days spent in Australia. For details see Table A4. In total, this adjustment reduces the estimated GHG emissions from international aviation from 8.9 to 7.9 Mt (Table 3).
It should be noted that there is a considerable range of estimates of the carbon emissions from aviation. The
estimates here are in the lower to middle of this range. The aircraft used on Australian international routes are large and relatively new, and thus their emissions per passenger km are relatively low. Australian routes are less congested than Northern hemisphere routes, and flights are more direct. As noted above, an allowance has been made for multiple trips, which are important for long haul destinations such as Australia.
There is also considerable global debate about the attribution of carbon ‘debits’ among multiple destinations
on the same trip, and indeed to source or destination countries themselves. While these debates will take some time to resolve it is believed important that Australia be aware of its total range of potential liabilities.
Indirect GHG Emissions Estimates Indirect GHG emissions are estimated at 19.2 Mt. This includes 0.4 Mt from indirect use of aviation and since this has already been counted in the direct estimates, it is deducted from the 19.2 Mt, giving a total of 18.8 Mt. These estimates were derived from calculations of the outputs of each industry associated with supplying inputs to tourism. These calculations were based on the purchases by the air transport industry, as recorded in the database and input output structure of the Australian economy embodied in the Monash University Centre of Policy Studies (CoPS) MMRF model (Adams, 2006). Details for each industry are provided in Table A2.
The ATSA indicates that the tourism industry purchases $36.3 billion of inputs (output less gross value added), and Table A3 indicates that gross indirect output was $48.7 billion, of which it is estimated that $25.4 billion represents indirect gross value added (GVA) produced in Australia (using figures which are consistent with the ATSA).
The difference between $36.3 billion and $25.4 billion is imports of 10.9 billion—this represents the total
import content of Australian tourism production and sales. GHGs from imports are emissions produced in other countries as a result of producing goods and services for
export to Australia. The pattern of imports was estimated using the Australian Input-Output structure in the MMRF model, and it was assumed that GHG emissions from each product would bear the same ratio to output as it does in Australia (i.e. it is assumed that equally emissions intensive technologies are used in Australia and abroad). The direct GHG emissions are estimated to be 3.2 Mt, this estimate excludes indirect emissions. To get the total, it was assumed that the total GHG emissions from imports would bear the same proportion to value as
THE CARBON FOOTPRINT OF AUSTRALIAN TOURISM
5
for the indirect GHG emissions from tourism. After scaling up the estimate to allow for indirect emissions, an estimate of 8.1 Mt of GHG emissions is obtained.
The estimate of emissions from shipping imports to Australia was based on an estimate of the total GHG
emissions from shipping goods to and from Australia, and the tourism import share (4.8%) of total imports and exports in value terms.
Aviation produces GHG emissions indirectly through its purchases of goods and services. These are
automatically included in GHG emissions indirectly produced by Australian airlines. The estimate for non-Australian based airlines is based on the same ratio of value of inputs purchased to GHG emissions as for Australian airlines. It is assumed (based on industry consultations) that non-Australian based airlines purchase 90 per cent of their inputs used for inbound passenger from foreign sources, and 10 per cent from Australian sources which are already accounted for in the estimates for the Australian tourism industry.
THE CARBON FOOTPRINT OF AUSTRALIAN TOURISM
6
Chapter 3
CARBON FOOTPRINT OF AUSTRALIAN TOURISM: RESULTS Carbon Footprint estimates (GHG emissions) are produced here on both a production base and on an expenditure base.
The production based estimates are for the Carbon Footprint arising from production of the Australian tourism industry, as defined and measured by the Australian Tourism Satellite Account (ATSA). They include inbound and outbound aviation services of Australian airlines, but not inbound or outbound services of non-Australian based airlines. They do not include GHG emissions from imports directly purchased by tourists, but do include GHG emissions from imports used in producing goods and services for sale to the Australian tourism industry.
The expenditure based estimates are for the Carbon Footprint which arises from the expenditures by foreign
and domestic tourists on tourism in Australia as reported in the ATSA. These exclude expenditure on outbound trips by departing Australian residents except for the part of this expenditure which relates to activities within Australia (e.g. for travel costs and hotels within Australia preliminary to or following an international flight). They exclude expenditure on outbound air fares. But they include air travel by visitors provided by Australian and non-Australian based airlines.
The main differences between the two estimates are: • the production based estimates include international inbound and outbound air travel supplied by
Australian airlines, while the expenditure estimates only include inbound services of Australian airlines;
• the production based estimates exclude inbound air travel supplied by non-Australian based airlines, while the expenditure based estimates include this; and
• the production based estimates exclude imports directly purchased by tourists while the expenditure based estimates include this.
These differences in calculation give rise to consequential differences in some of the component measures of Australian tourism’s Carbon Footprint. The results are displayed in Figures 5 and 6.
The tables below provide the results of a production based calculation (Table 1) and an expenditure based
calculation (Table 2). The Tables include five columns. • The first column includes GHG emissions from Australian based production and consumption—these
count as Australian emissions for Kyoto measurement purposes.
• The second column includes GHG emissions from Australian supplied international aviation. These are Australian sourced emissions, though they currently are not counted for Kyoto measurement purposes.
• The third column includes GHG emissions from foreign producers, either of aviation services, or imports used directly or indirectly by Australian tourism.
• A fourth column provides the total GHG emissions for each row which are expressed as percentages in the final column.
Table data record the estimates of CO2 equivalent emissions in million tonnes (Mt).

THE CARBON FOOTPRINT OF AUSTRALIAN TOURISM
7
Production Based Carbon Footprint Table 1 Production Based Carbon Footprint (GHG in Mt), 2003–04
Kyoto Non-Kyoto Source
Australian Kyoto Emissions
International Aviation
Australian Airlines
Emissions
Foreign Sourced
Emissions
Total GHG
(Kyoto+non-Kyoto)
Emissions
% Share of Total Direct & Indirect GHG
Emissions
1. Direct Emissions from Tourism Industries
10.5 10.5 19.30
2. Emissions from Tourism-related Private Motor Vehicle Use
11.1 11.1 20.40
3. Emissions from International Aviation
4.7 4.7 8.64
4. Total Direct GHG Emissions
21.6 4.7 26.3 48.35
5. Indirect Emissions from Tourism Inputs
18.8 18.8 34.56
6. Emissions from Imports
8.1 8.1 14.89
7. Emissions from Transport of Imports
1.2 1.2 2.21
8. Total Indirect GHG Emissions
18.8 9.3 28.1 51.65
9. Total Direct and Indirect GHG Emissions
40.4 4.7 9.3 54.4 100.00
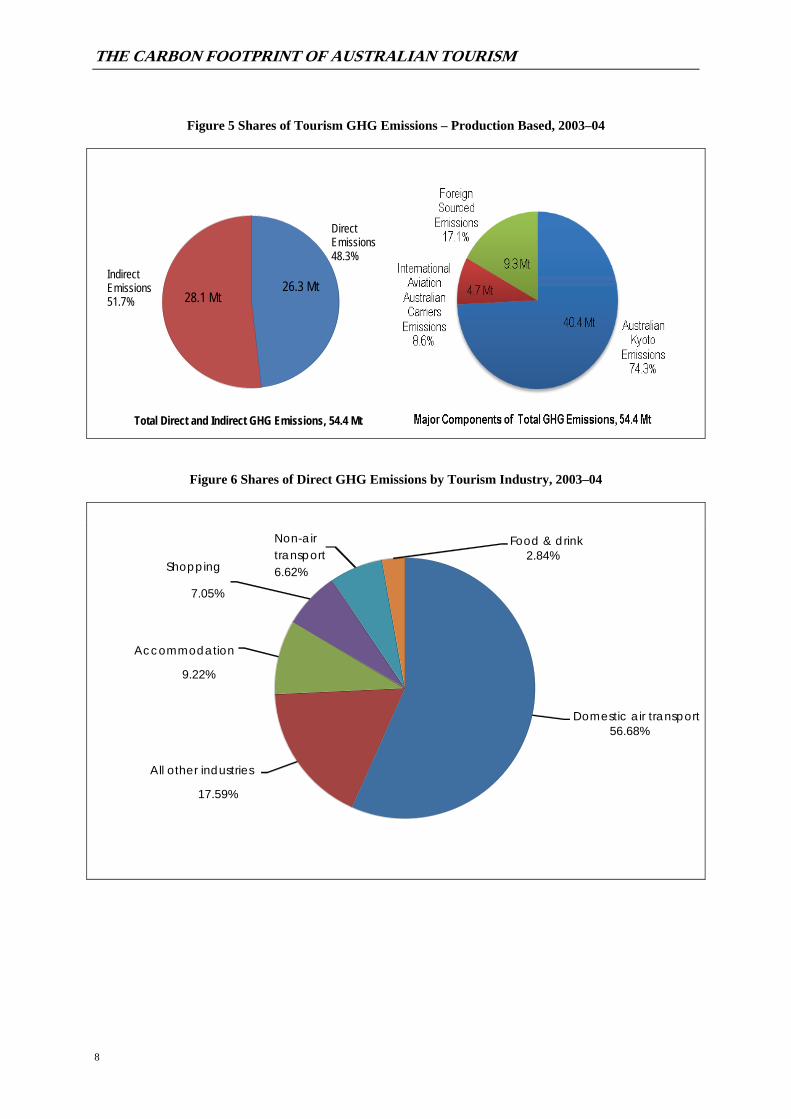
Production based total direct and indirect GHG emissions by Australian tourism in 2003–04 was 54.4 Mt. Shares of direct and indirect GHG emissions in total GHG emissions were 48.3 and 51.7 per cent, respectively. GHG emissions by Australian Kyoto (40.4 Mt), foreign sourced (9.3 Mt) and international aviation – Australian airlines (4.7 Mt) in total GHG emissions were 74.3, 17.1, and 8.6 per cent respectively, as illustrated in Figure 5.
THE CARBON FOOTPRINT OF AUSTRALIAN TOURISM
8
Figure 5 Shares of Tourism GHG Emissions – Production Based, 2003–04
Figure 6 Shares of Direct GHG Emissions by Tourism Industry, 2003–04
Direct Emissions 48.3%
Indirect Emissions 51.7% 28.1 Mt
26.3 Mt
Total Direct and Indirect GHG Emissions, 54.4 Mt
Domestic air transport 56.68%
All other industries
17.59%
Accommodation
9.22%
Shopping
7.05%
Non-air transport 6.62%
Food & drink2.84%

THE CARBON FOOTPRINT OF AUSTRALIAN TOURISM
9
Production based total direct GHG emissions by Australian tourism industry in 2003–04 was 10.5 Mt. Domestic air transport was the largest component of tourism industry GHG emissions at 56.68 per cent, followed by accommodation services (9.22%), shopping (7.05%), non-air transport (6.62%), and food and drink (2.84%), as illustrated in Figure 2. Food and drink refers to animal food (meat and dairy), other food and drink; non-air transport refers to road transport, rail transport, water transport and other transport; and shopping refers to textile, clothing and footwear (TCF), wood products, paper products, chemical products, and non-metal and mineral products as reported in Table A1.
Notes: Table 1
Direct GHG Emissions from Tourism Industries (Row 1) These are estimates of GHG emissions directly produced by tourism industries, based on the model database (Adams, 2006). They include domestic but not international aviation. The detailed industry breakdown is given in Table A1.
Emissions from Motor Vehicles (Row 2) From the ATSA we can estimate vehicle fuel purchases, from which GHG emissions can be derived, while Department of Climate Change (DCC) data has been used to identify household use of motor vehicles for tourism related travel. The estimate of GHG emissions from use of motor vehicles for tourism is based on the average of estimates derived using estimates of the total GHG emissions associated with motor vehicle travel and the proportion of this travel represented by tourism. These differ by less than 10 per cent.
Emissions from International Aviation (Row 3) Qantas provided 55,395 million passenger kilometres (pkm) of international services in 2003–04 (Qantas Annual Report 2003–04). The largest share of GHG emissions (assume 80%) would have been produced by Boeing 747s, which produce an average of 0.09 kg/pkm and a smaller share (assume 20%) by Airbus A330s (or equivalents) at 0.065 kg/pkm. These estimates are from the German Aerospace Institute (DLR). This gives an average of 0.085 kg/pkm. In 2003–04 nearly all international services by Australian airlines were operated by Qantas and its subsidiaries. This gives an estimate of 4.709 Mt of GHG emissions in 2003–04. This estimate does not include freight, as this activity is not counted as tourism.
Figure 7 Shares of Indirect GHG Emissions from Tourism Purchases, 2003–04
THE CARBON FOOTPRINT OF AUSTRALIAN TOURISM
10
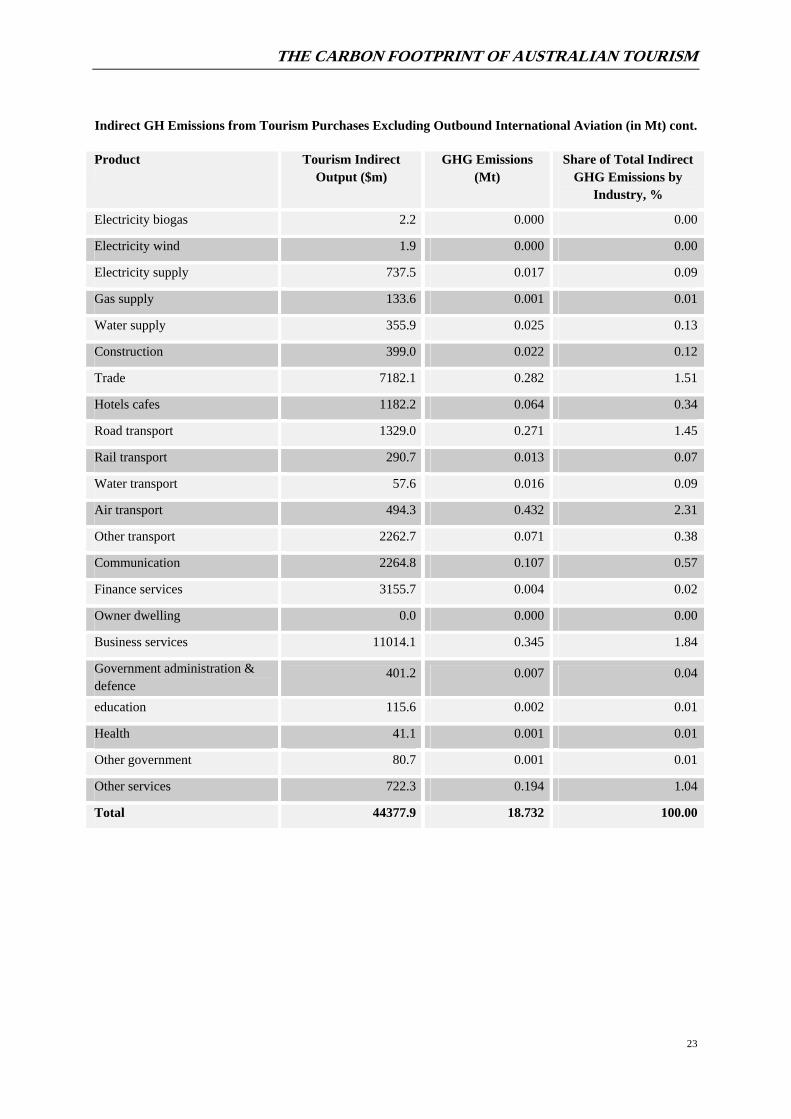
Indirect Emissions from Tourism Inputs (Row 5) Indirect GHG emissions from tourism purchases excluding outbound international aviation in 2003–04 was 18.8 Mt. Details for each industry are provided in Appendix Tables A2 and A3. Electricity coal was the largest component of indirect GHG emissions at 37.44 per cent, followed by agriculture, forestry and fishery 30.64 per cent, gas (4.06%), chemical products (3.66%), petrol refinery (3.49%), electricity gas (2.82%), iron steel (2.48%), air transport (2.31%), business services (1.84%), trade (1.51%) and road transport (1.45%), as illustrated in Figure 7.
Emissions from Imports (Row 6) As described in text.
Emissions from Transport of Imports (Row 7) As described in text.
THE CARBON FOOTPRINT OF AUSTRALIAN TOURISM
11
Expenditure Based Carbon Footprint Table 2 Expenditure Based Carbon Footprint (GHG in Mt), 2003–04
Kyoto Non-Kyoto Source
Australian Kyoto
Emissions
International Aviation Australian Airlines Emissions
Foreign Sourced
Emissions
Total GHG (Kyoto +
non-Kyoto) Emissions
% Share of Total Direct and Indirect
GHG Emissions
1. Direct Emissions from Tourism Industries
10.5 10.5 17.07
2. Emissions from Tourism-related Private Motor Vehicle Use
11.1 11.1 18.05
3. Emissions from International Aviation – Australian
2.1 2.1 3.41
4. Emissions from International Aviation – non-Australian Based
5.8 5.8 9.43
5. Total Direct GHG Emissions
21.6 2.1 5.8 29.5 47.97
6. Indirect Emissions from Tourism Inputs (excluding outbound aviation)
18.3 18.3 29.76
7. Emissions from Imports 7.7 7.7 12.52
8. Emissions from Imports Directly Purchased
3.2 3.2 5.20
9. Emissions from Transport of Imports
1.6 1.6 2.60
10. Emissions from International Aviation – Non-Australian Based
1.2 1.2 1.95
11. Total Indirect GHG Emissions
18.3 13.7 32.0 52.03
12. Total Direct and Indirect GHG Emissions
39.9 2.1 19.5 61.5 100.00

THE CARBON FOOTPRINT OF AUSTRALIAN TOURISM
12
Figure 8 Shares of Tourism GHG emissions – Expenditure based, 2003–04
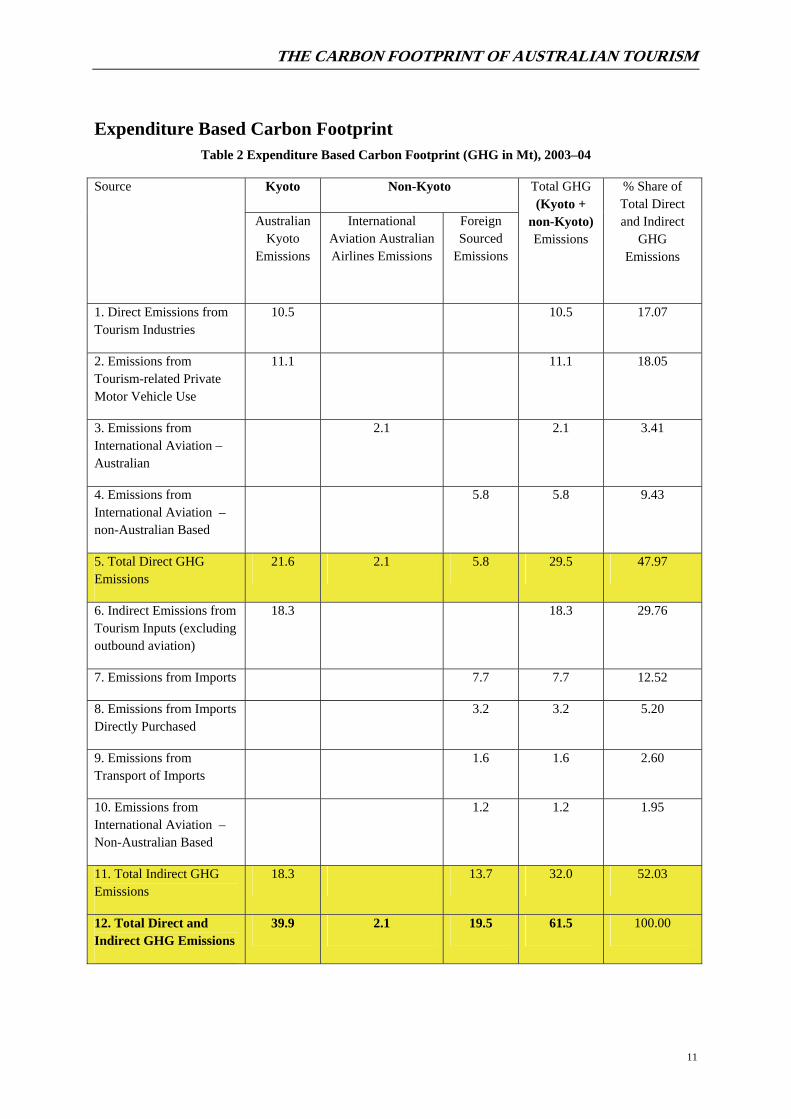
Expenditure based total direct and indirect GHG emissions by Australian tourism in 2003–04 was 61.5 Mt. Shares of direct and indirect GHG emissions in total GHG emissions were 48.0 and 52.0 per cent, respectively. GHG emissions by Australian Kyoto (39.9 Mt), foreign sourced (19.5 Mt) and international aviation – Australian airlines (2.1 Mt) in total GHG emissions were 64.9 per cent, 31.7 per cent and 3.4 per cent, respectively, as illustrated in Figure 4.
Notes: Table 2
Direct GHG Emissions (Rows 1 and 2) These are the same as those in Table 1 for tourism industries and motor vehicles.
Emissions from International Aviation (Rows 3 and 4) As described in text.
Indirect Emissions from Tourism Inputs and Imports (Rows 6 and 7) These are slightly different from those in Table 1 because outbound international aviation services by Australian airlines are excluded. The industry breakdown of the indirect emissions estimates is given in Table A3.
Emissions from Directly Purchased Imports (Row 8) These are estimated on the same basis as emissions from imports used indirectly.
Emissions from Transport of Imports (Row 9) GHG emissions relating to transport of imports is estimated to be 3.2 Mt. This is higher than in Table 1 (1.2 Mt) because it includes an estimate for imports directly purchased by tourists (Row 9).
Indirect Emissions from Non-Australian Based Aviation (Row 10) As described in text.
Direct Emissions 48.0%
Indirect Emissions 52.0%
32.0 Mt 29.5 Mt
Total Direct and Indirect GHG Emissions, 61.5 Mt
THE CARBON FOOTPRINT OF AUSTRALIAN TOURISM
13
Comparisons with ‘Non-Tourism’ Industries – Direct GHG Emissions Given the different measures of what constitutes tourism there is no one ideal measure to compare tourism's emissions with those of other industries. Tourism is unlike other industries in that it produces both Kyoto and non-Kyoto emissions.
Tables A5 to A8 in the Appendix provide indications of tourism’s direct contribution to GHG emissions, relative to those of non-tourism industries. Indirect emissions for other industries are not currently available. Since tourism is a part of other industries, there is double counting, and percentages do not sum to 100 per cent.
Table A5 shows that direct tourism industry emissions, excluding emissions from use of motor vehicles and
from international aviation, represent 2.11 per cent of the total emissions from Australian industry and tourism is the ninth ranked ‘industry’ identified in terms of emissions.
From Table A6 it can be seen that tourism direct emissions including emissions from tourism industries and
household use of motor vehicles for tourism purposes represent 3.93 per cent of the total emissions from Australian industry and households, and tourism is the seventh ranked industry in terms of emissions.
Table A7 shows that tourism direct emissions including emissions from tourism industries, household use of
motor vehicles for tourism purposes, and Australian production of international aviation services represent 4.74 per cent of the total emissions from Australian industry and households, plus international aviation, and tourism is the sixth ranked industry in terms of emissions. This table corresponds to the Production based carbon footprint of tourism.
In Table A8, tourism direct emissions including emissions from tourism industries, use of motor vehicles and
the production of both Australian and non-Australian based international aviation services for inbound tourists represent 5.29 per cent of the total emissions from Australian industry and households, and international aviation, and tourism is the fifth ranked industry in terms of emissions. This Table corresponds to the Expenditure based carbon footprint of tourism.
The measures which are most relevant for comparison purposes are Tables A6 and A7. However, Table A6
understates the full production and emissions from tourism as it is formally defined in the TSA by excluding some production which is included in the TSA (production associated with international air services by Australian airlines. Table A7 on the other hand, includes the same production as the TSA, but some of this produces non-Kyoto emissions (production associated with producing international aviation services).
Thus, if the objective is to compare the proportion of tourism’s total contribution to output, as defined by the
Australian TSA, with the proportion of its contribution to emissions, then Table A7 provides the most relevant measure. However, if the intention is to count only Kyoto emissions, then Table A6 is the more relevant table. The two alternative sets of data cannot be compared with one another, however, because of the different definitions of the industry which have been used in each case.
Total GHG Emissions from International Aviation The question of assessing GHG emissions from international aviation is the most difficult component of this exercise, and the one that will inevitably strike most debate on the international stage. It is possible to view the model both with, and without, international aviation emissions. Notwithstanding the temptation to do the former, aviation emissions are at present too complex to be incorporated into the Kyoto framework. Given Australia’s distance from markets it is important that the magnitude of this component (and future risk) be examined as mitigation policies to be enacted to meet the challenges of climate change may well have serious consequences for long haul travel.
GHG emissions from international aviation are summarised in Table 3. These are based on the expenditure estimates which allow for multiple destination trips.
THE CARBON FOOTPRINT OF AUSTRALIAN TOURISM
14
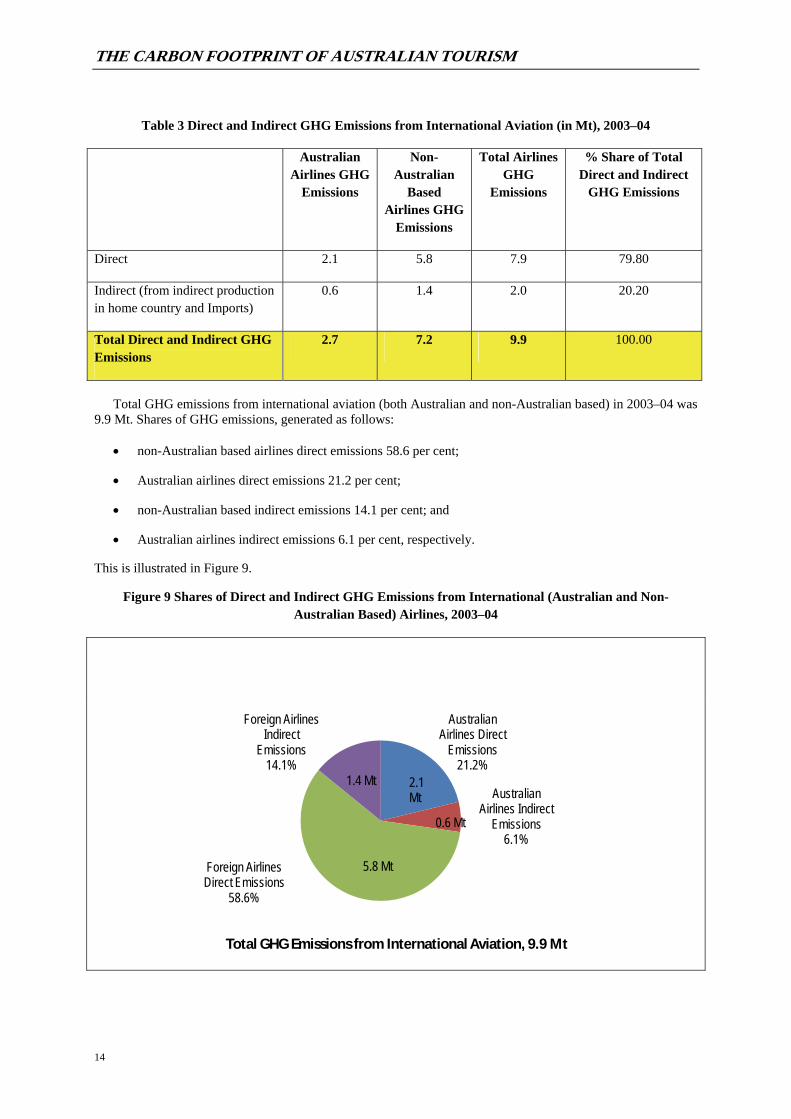
Table 3 Direct and Indirect GHG Emissions from International Aviation (in Mt), 2003–04
Australian Airlines GHG
Emissions
Non-Australian
Based Airlines GHG
Emissions
Total Airlines GHG
Emissions
% Share of Total Direct and Indirect
GHG Emissions
Direct 2.1 5.8 7.9 79.80
Indirect (from indirect production in home country and Imports)
0.6 1.4 2.0 20.20
Total Direct and Indirect GHG Emissions
2.7 7.2 9.9 100.00
Total GHG emissions from international aviation (both Australian and non-Australian based) in 2003–04 was
9.9 Mt. Shares of GHG emissions, generated as follows: • non-Australian based airlines direct emissions 58.6 per cent;
• Australian airlines direct emissions 21.2 per cent;
• non-Australian based indirect emissions 14.1 per cent; and
• Australian airlines indirect emissions 6.1 per cent, respectively.
This is illustrated in Figure 9.
Figure 9 Shares of Direct and Indirect GHG Emissions from International (Australian and Non-Australian Based) Airlines, 2003–04
Australian Airlines Direct
Emissions 21.2%
Australian Airlines Indirect
Emissions6.1%
Foreign Airlines Direct Emissions
58.6%
Foreign AirlinesIndirect
Emissions14.1%
Total GHG Emissions from International Aviation, 9.9 Mt
2.1 Mt
0.6 Mt
1.4 Mt
5.8 Mt

THE CARBON FOOTPRINT OF AUSTRALIAN TOURISM
15
Table 3 shows that direct GHG emissions from international aviation are significantly larger than the indirect GHG emissions, though the latter are moderately significant. The shares of Australian and non-Australian based airlines in GHG emissions reflect their shares of traffic. The percentage of total emissions from international aviation, at around 20 per cent, is as expected, given Australia’s distance from its markets and the fact that aviation is a relatively GHG emission intensive industry.
Table A4 shows the Expenditure based GHG emissions associated with inbound one way and return travel.
Of the countries included in this table, travel to Australia from the UK, with 0.926 Mt CO2 for a one way trip, generates the highest emissions. This is followed by other Europe (0.519 Mt) and Japan (0.469 Mt). The least GHG emissions are associated with Malaysia (0.102 Mt), Indonesia (0.040 Mt) and Thailand (0.052 Mt). As discussed in Note 2 under Table 2, the estimates of GHG emissions from international aviation do not depend upon distance only, but allow for market volume and transit destinations en route to Australia.
THE CARBON FOOTPRINT OF AUSTRALIAN TOURISM
16
Chapter 4
FURTHER DIRECTIONS It would be feasible to expand on, and further develop, this Carbon Footprint in several directions. Some of these are:
• Development of State Carbon Footprints based on the State TSAs which have been developed by the STCRC Centre for Economics and Policy for 2003–04, and which are currently being updated for 2006–07.
• The Carbon Footprint is estimated for 2003–04, the latest year for which the full data set necessary was available. It would be feasible to update this work, though with some loss of accuracy. Updating would be able to take into account changes in the outputs of the tourism industry by relying on recent ATSAs. Recent information on emissions intensities of industries, and improvements in efficiency would be more difficult to obtain, though projections can be made, enabling a more up to date Carbon Footprint to be estimated.
• The present Carbon Footprint presents detail on the industry composition of emissions in the Appendices, but further analysis of the data contained in these would be feasible.
• A logical further development of this work is a study of how the proposed emissions trading scheme (ETS) for Australia will impact on the tourism industry. This would take into account impacts on tourism costs, prices and international competitiveness, impacts on individual industries, and impacts on tourism flows and industry output and employment. This would require a full computable general equilibrium modelling exercise, of the sort that the STCRC Centre for Economics and Policy has done for other tourism issues. While it would be possible to obtain a first pass at an estimate of how the ETS will directly impact on tourism costs by using this Carbon Footprint and suggested carbon prices, the ETS will have impacts on a wide range of industries and prices and these, in turn would impact on tourism. In addition, different variants of the ETS will have different impacts on tourism—for example, if major emissions intensive export industries are shielded from the ETS, as is proposed, this will impact more severely than if these industries are not given such treatment. Thus an accurate assessment of how tourism will be affected by the ETS requires a full modelling study.
THE CARBON FOOTPRINT OF AUSTRALIAN TOURISM
17
Chapter 5
SUMMARY Deriving a Carbon Footprint for the tourism sector is a particularly complex task which parallels the challenges of developing robust tourism satellite accounts over the past two decades.
This paper reports outputs from two approaches to estimating the direct and indirect carbon ‘costs’ of the Australian tourism industry. These are basically the same, though they reflect slightly different definitions of what constitutes the ‘tourism industry’.
Using the production approach we estimate: • Total direct GHG emissions 26.3 Mt
• Total indirect GHG emissions 28.1 Mt
• Total (direct plus indirect) GHG emissions 54.4 Mt
Using the expenditure approach we estimate: • Total direct GHG emissions 29.5 Mt
• Total indirect GHG emissions 32.0 Mt
• Total (direct plus indirect) GHG emissions 61.5 Mt
The above estimates of the Carbon Footprint of the Australian tourism industry are, to our knowledge, the most accurate to date given the available data.
Among the various activities that support tourism the data highlight the significant role that transport/tourist
distribution plays in the Australian tourism sector. While aviation emissions are currently in the global spotlight, for Australia the use of private motor vehicles for regional travel contribute close to half of all industry emissions. A carbon constrained future economy could significantly challenge the current distribution patterns seen within Australian tourism.
Assessing and attributing the case of international aviation emissions is more complex, largely because the
‘rules’ for attribution for global aviation emissions to individual economies are yet to be determined. To the present these remain outside of national Kyoto targets, but given Australia’s distance from markets it is important that the magnitude of this component (and future risk) be examined. Total direct and indirect GHG Emissions are 9.9 Mt. This comprises Australian airlines GHG emissions of 2.7 Mt and non-Australian based airlines GHG emissions of 7.2 Mt. Some alternative approaches to measuring the extent of the components of this issue were reported herein.
For international aviation emissions, 4.7 Mt are estimated when Australian based airlines (international
outbound and inbound) are included, but this figure is reduced to 2.1 Mt under the assumptions of the expenditure model which include the international services of Australian airlines’ to inbound tourists but not to outbound tourists. In the expenditure estimates, foreign supplied inbound aviation services are included. Under such considerations non-Australian based airlines bringing visitors to Australia also bring into focus 5.8 Mt of GHG emissions.
The report also compares the Carbon Footprint of Australian tourism with that of other industries. Tourism direct emissions including emissions from tourism industries, household use of private motor
vehicles for tourism purposes, and Australian production of international aviation services represent 4.74 per cent of the total emissions from Australian industry and households, plus international aviation, and tourism is the sixth ranked industry in terms of emissions. Table A7 shows this for the Production based carbon footprint of tourism.

THE CARBON FOOTPRINT OF AUSTRALIAN TOURISM
18
Tourism direct emissions including emissions from tourism industries, use of private motor vehicles for
tourism purposes and the production of both Australian and non-Australian based international aviation services for inbound tourists represent 5.29 per cent of the total emissions from Australian industry and households, and international aviation, and tourism is the fifth ranked industry in terms of emissions. Table A8 shows this for the Expenditure based carbon footprint of tourism.
The dangers of making comparisons with carbon emissions from other industries and against the economy as
a whole are acknowledged, particularly as our estimates for tourism include non-Kyoto and indirect effects.

THE CARBON FOOTPRINT OF AUSTRALIAN TOURISM
19
APPENDIX A: GHG EMISSIONS TABLES A1 – A8 Table A1 Direct GHG Emissions by Tourism Industry (in Mt), 2003–04
Industry Total Direct GHG
Emissions (Mt)7
Tourism Share of Output
Tourism’s Direct GHG Emissions
(Mt)
Share of Total Direct GHG Emissions by Industry, %
Animal food 0.547 0.066 0.036 0.34
Other food 2.368 0.077 0.181 1.72
Drink 0.430 0.189 0.081 0.77
Textile, clothing, footwear (TCF) 0.473 0.117 0.055 0.52
Wood products 0.369 0.007 0.002 0.02
Paper products 1.278 0.050 0.064 0.61
Petrol refinery 4.996 0.113 0.567 5.40
Chemical products 22.318 0.025 0.558 5.32
Non-metal and mineral products 2.509 0.024 0.061 0.58
Other equipment 0.378 0.023 0.009 0.09
Trade 6.723 0.041 0.278 2.65
Accommodation services 2.160 0.448 0.967 9.22
Road transport 5.279 0.104 0.549 5.23
Rail transport 0.448 0.091 0.041 0.39
Water transport 0.776 0.055 0.043 0.41
Domestic air transport 7.080 0.840 5.947 56.68
Other transport 0.834 0.074 0.062 0.59
Communication services 1.770 0.071 0.126 1.20
Ownership of dwellings 0.134 0.028 0.004 0.04
Business services 4.655 0.006 0.027 0.26
Government administration & defence 0.980 0.001 0.001 0.01
Education 0.594 0.060 0.036 0.34
Health 0.651 0.091 0.059 0.56
Other government 0.210 0.037 0.008 0.08
Other services 12.663 0.058 0.731 6.97 Total 80.623 0.130 10.493 100.00
7 Source: MMRF-Green database (Adams, 2006).
THE CARBON FOOTPRINT OF AUSTRALIAN TOURISM
20
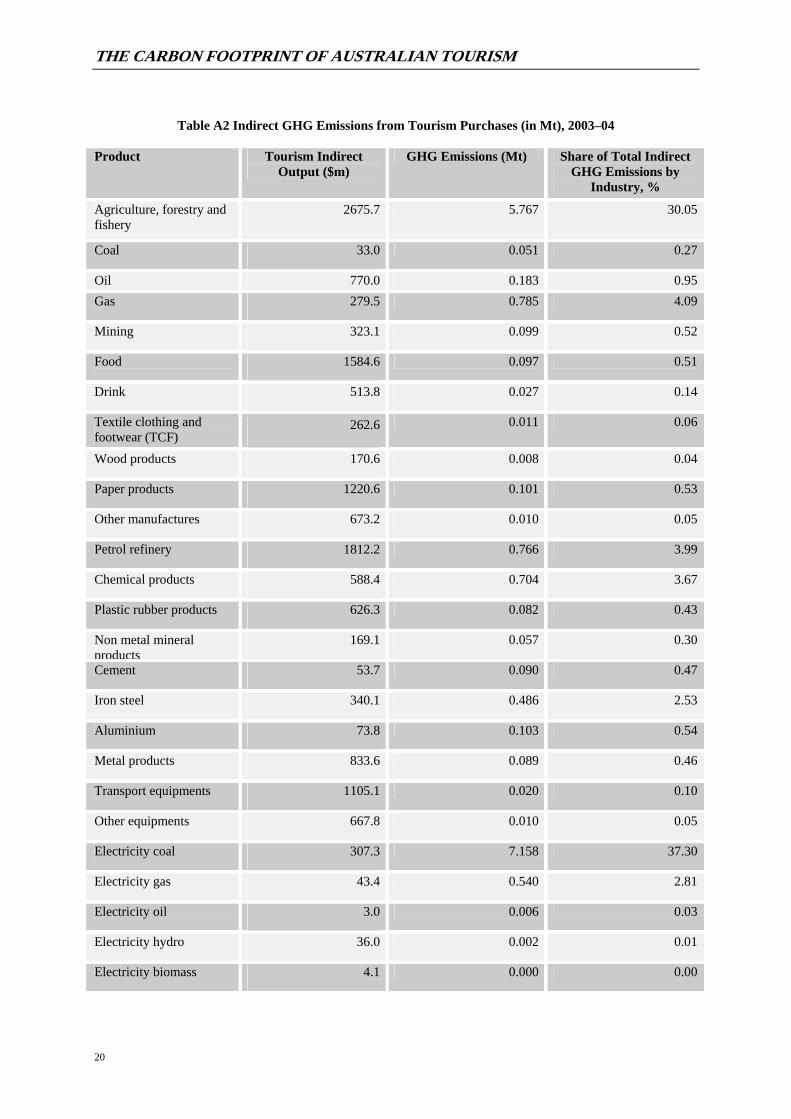
Table A2 Indirect GHG Emissions from Tourism Purchases (in Mt), 2003–04
Product Tourism Indirect Output ($m)
GHG Emissions (Mt) Share of Total Indirect GHG Emissions by
Industry, %
Agriculture, forestry and fishery
2675.7 5.767 30.05
Coal 33.0 0.051 0.27
Oil 770.0 0.183 0.95 Gas 279.5 0.785 4.09
Mining 323.1 0.099 0.52
Food 1584.6 0.097 0.51
Drink 513.8 0.027 0.14
Textile clothing and footwear (TCF)
262.6 0.011 0.06
Wood products 170.6 0.008 0.04
Paper products 1220.6 0.101 0.53
Other manufactures 673.2 0.010 0.05
Petrol refinery 1812.2 0.766 3.99
Chemical products 588.4 0.704 3.67
Plastic rubber products 626.3 0.082 0.43
Non metal mineral products
169.1 0.057 0.30
Cement 53.7 0.090 0.47
Iron steel 340.1 0.486 2.53
Aluminium 73.8 0.103 0.54
Metal products 833.6 0.089 0.46
Transport equipments 1105.1 0.020 0.10
Other equipments 667.8 0.010 0.05
Electricity coal 307.3 7.158 37.30
Electricity gas 43.4 0.540 2.81
Electricity oil 3.0 0.006 0.03
Electricity hydro 36.0 0.002 0.01
Electricity biomass 4.1 0.000 0.00

THE CARBON FOOTPRINT OF AUSTRALIAN TOURISM
21
Indirect GHG Emissions from Tourism Purchases (in Mt) cont.
Product Tourism Indirect Output ($m)
GHG Emissions (Mt) Share of Total Indirect GHG Emissions by Industry, %
Electricity biogas 2.3 0.000 0.00
Electricity wind 2.0 0.000 0.00
Electricity supply 752.8 0.018 0.09
Gas supply 135.6 0.001 0.01
Water supply 364.7 0.026 0.14
Construction 405.9 0.022 0.11
Trade 7413.0 0.291 1.52
Hotels cafes 1228.3 0.067 0.35
Road transport 1369.9 0.279 1.45
Rail transport 301.6 0.014 0.07
Water transport 61.3 0.018 0.09
Air transport 504.5 0.441 2.30
Other transport 2539.9 0.080 0.42
Communication 2332.8 0.111 0.58
Finance services 3261.9 0.004 0.02
Owner dwelling 0.0 0.000 0.00
Business services 11475.6 0.360 1.88
Government administration & defence
412.2 0.007 0.04
Education 121.3 0.002 0.01
Health 42.0 0.001 0.01
Other government 82.8 0.001 0.01
Other services 740.3 0.199 1.04
Total 48721.1 19.192 100.00

THE CARBON FOOTPRINT OF AUSTRALIAN TOURISM
22
Table A3 Indirect GHG Emissions from Tourism Purchases Excluding Outbound International Aviation (in Mt), 2003–04
Product Tourism Indirect Output ($m)
GHG Emissions (Mt) Share of Total Indirect GHG Emissions by Industry, %
Agriculture, forestry and fishery 2662.8 5.740 30.64
Coal 32.2 0.050 0.27
Oil 705.1 0.168 0.90
Gas 270.3 0.760 4.06
Mining 312.9 0.096 0.51
Food 1580.4 0.097 0.52
Drink 511.8 0.027 0.14
Textile clothing and footwear (TCF)
260.2 0.011 0.06
Wood products 167.1 0.008 0.04
Paper products 1196.1 0.099 0.53
Other manufactures 660.1 0.010 0.05
Petrol refinery 1546.3 0.654 3.49
Chemical products 573.5 0.686 3.66
Plastic rubber products 608.7 0.079 0.42
Non metal mineral products 165.7 0.056 0.30
Cement 52.6 0.088 0.47
Iron steel 325.3 0.464 2.48
Aluminium 71.7 0.100 0.53
Metal products 814.3 0.087 0.46
Transport equipments 970.6 0.017 0.09
Other equipments 656.2 0.010 0.05
Electricity coal 301.0 7.013 37.44
Electricity gas 42.5 0.529 2.82
Electricity oil 2.9 0.006 0.03
Electricity hydro 35.3 0.002 0.01
Electricity biomass 4.0 0.000 0.00
THE CARBON FOOTPRINT OF AUSTRALIAN TOURISM
23
Indirect GH Emissions from Tourism Purchases Excluding Outbound International Aviation (in Mt) cont.
Product Tourism Indirect Output ($m)
GHG Emissions (Mt)
Share of Total Indirect GHG Emissions by
Industry, %
Electricity biogas 2.2 0.000 0.00
Electricity wind 1.9 0.000 0.00
Electricity supply 737.5 0.017 0.09
Gas supply 133.6 0.001 0.01
Water supply 355.9 0.025 0.13
Construction 399.0 0.022 0.12
Trade 7182.1 0.282 1.51
Hotels cafes 1182.2 0.064 0.34
Road transport 1329.0 0.271 1.45
Rail transport 290.7 0.013 0.07
Water transport 57.6 0.016 0.09
Air transport 494.3 0.432 2.31
Other transport 2262.7 0.071 0.38
Communication 2264.8 0.107 0.57
Finance services 3155.7 0.004 0.02
Owner dwelling 0.0 0.000 0.00
Business services 11014.1 0.345 1.84
Government administration & defence
401.2 0.007 0.04
education 115.6 0.002 0.01
Health 41.1 0.001 0.01
Other government 80.7 0.001 0.01
Other services 722.3 0.194 1.04
Total 44377.9 18.732 100.00
THE
CA
RBO
N F
OO
TPR
INT
OF
AU
STR
ALI
AN
TO
UR
ISM
24
Tab
le A
4 E
xpen
ditu
re B
ased
Em
issi
ons f
rom
Inte
rnat
iona
l Avi
atio
n (A
ustr
alia
n an
d Fo
reig
n) (i
n M
Ton
nes)
Cou
ntry
of
resi
denc
e
Dis
tanc
eK
m
Num
ber o
fPa
ssen
ger
PKm
Q
F sh
are
QF
PKm
N
onQ
F PK
m
Mul
tiple
D
est
Fact
or
Cng
stn
Fact
orA
djus
ted
QF
PKm
A
djus
ted
Non
QF
PKm
LH
gm/p
km
SH
gm/p
kmQ
F LH
gm
CO
2 N
onQ
F LH
gm
CO
2 Q
F SH
gm
C
O2
Non
QF
SHgm
CO
2 TO
TAL
gm C
O2
QF
LH
Mt C
O2
Non
QF
LH
Mt C
O2
QF
SH
Mt
CO
2
Non
QF
SH
Mt
CO
2
TOTA
L M
t CO
2
one-
way
on
e-w
ay
one-
way
one-
way
on
e-w
ay
one-
way
one-
way
one-
way
on
e-w
ay
one-
way
(1)
(2)
(3) =
(1)*
(2)
(4)
(5) =
(3)*
(4)
(6) =
(3
) -(5
) (7
) (8
) (9
) =
(5)*
(7)*
(8)
(10)
=
(6)*
(7)*
(8)
(11)
(1
2)
(13)
=
(9)*
(11)
(1
4) =
(1
0)*(
11)
(15)
= (9)*
(12)
(16)
=
(10)
*(12
)
(17)
=
(13)
+(14
)+
(15)
+(16
) (1
8)
(19)
(2
0)
(21)
(22)
=
(18)
+(19
)+
(20)
+(21
) N
ew Z
eala
nd
LH
2553
9261
0023
6433
3300
0.
30
7092
9999
016
5503
3310
0.92
01.
0568
5183
790
1598
7621
770.
085
058
2406
2213
5894
785
00
1941
3540
70.
058
0.13
60
0 0.
194
A
dd o
n
0
0
00.
920
1.05
00
0 0.
126
00
00
00
00
0 0.
000
Japa
n LH
78
2068
7500
5376
2500
00
0.34
18
2792
5000
3548
3250
000.
963
1.05
1848
3063
6435
8788
8824
0.08
5 0
1571
0604
130
4970
550
00
4620
7659
10.
157
0.30
50
0 0.
462
A
dd o
n 83
868
800
5765
4400
0
5765
4400
0.96
31.
050
5829
7247
0 0.
126
00
073
4545
373
4545
30
00
0.00
7 0.
007
Hon
g K
ong
LH
7370
1321
0097
3577
000
0.36
35
0487
720
6230
8928
00.
964
1.05
3547
6367
063
0690
969
0.08
5 0
3015
4912
5360
8732
00
8376
3644
0.03
00.
054
0 0
0.08
4
Add
on
0
00
0.96
41.
050
00
0.12
60
00
00
00
0 0
0.00
0 Si
ngap
ore
LH
6290
2526
0015
8885
4000
0.
23
3654
3642
012
2341
7580
0.97
11.
0537
2580
702
1247
3353
940.
085
031
6693
6010
6023
508
00
1376
9286
80.
032
0.10
60
0 0.
138
A
dd o
n
0
0
00.
971
1.05
00
0 0.
126
00
00
00
00
0 0.
000
Mal
aysi
a LH
66
3017
5300
1162
2390
00
0.09
10
4601
510
1057
6374
900.
974
1.05
1069
7596
410
8164
5861
0.08
5 0
9092
957
9193
9898
00
1010
3285
50.
009
0.09
20
0 0.
101
A
dd o
n 27
017
500
4725
000
0
4725
000
0.97
41.
050
4832
258
0 0.
126
00
060
8864
6088
640
00
0.00
1 0.
001
Indo
nesi
a LH
50
6091
500
4629
9000
0 0.
30
1388
9700
032
4093
000
0.97
51.
0514
2195
804
3317
9020
90.
085
012
0866
4328
2021
680
040
2888
110.
012
0.02
80
0 0.
040
A
dd o
n
0
0
00.
975
1.05
00
0 0.
126
00
00
00
00
0 0.
000
Taiw
an
LH
7270
1039
0075
5353
000
0.06
45
3211
8071
0031
820
0.96
61.
0545
9692
7372
0185
275
0.08
5 0
3907
388
6121
5748
00
6512
3137
0.00
40.
061
0 0
0.06
5
Add
on
0
00
0.96
61.
050
00
0.12
60
00
00
00
0 0
0.00
0 Th
aila
nd
LH
7530
7880
059
3364
000
0.14
83
0709
6051
0293
040
0.96
11.
0583
8227
5251
4911
192
0.08
5 0
7124
934
4376
7451
00
5089
2385
0.00
70.
044
0 0
0.05
1
Add
on
568
1580
089
7440
0
089
7440
00.
961
1.05
090
5561
80
0.12
60
00
1141
008
1141
008
00
0 0.
001
0.00
1 K
orea
LH
83
4021
5800
1799
7720
00
0.07
12
5984
040
1673
7879
600.
859
1.05
1136
3130
515
0967
3051
0.08
5 0
9658
661
1283
2220
90
013
7980
870
0.01
00.
128
0 0
0.13
8
Add
on
338
4320
014
6016
00
014
6016
000.
859
1.05
013
1699
130
0.12
60
00
1659
409
1659
409
00
0 0.
002
0.00
2 C
hina
LH
81
0221
6900
1757
3238
00
0.31
54
4770
378
1212
5534
220.
890
1.05
5090
8791
811
3313
1173
0.08
5 0
4327
2473
9631
6150
00
1395
8862
30.
043
0.09
60
0 0.
140
A
dd o
n
0
0
00.
890
1.05
00
0 0.
126
00
00
00
00
0 0.
000
Oth
er A
sia
LH
7512
1295
0097
2804
000
0.12
11
6736
480
8560
6752
00.
954
1.05
1169
3493
285
7522
835
0.08
5 0
9939
469
7288
9441
00
8282
8910
0.01
00.
073
0 0
0.08
3
Add
on
0
00
0.95
41.
050
00
0.12
60
00
00
00
0 0
0.00
0 U
SA
LH
1202
043
0100
5169
8020
00
0.38
19
6452
4760
3205
2772
400.
823
1.05
1697
6440
7127
6984
0327
0.08
5 0
1442
9974
623
5436
428
00
3797
3617
40.
144
0.23
50
0 0.
380
A
dd o
n 32
2021
5100
6926
2200
0
069
2622
000
0.82
31.
050
5985
2930
1.3
0 0.
126
00
075
4146
9275
4146
920
00
0.07
5 0.
075
Can
ada
LH
1210
092
800
1122
8800
00
0.33
37
0550
400
7523
2960
00.
843
1.05
3279
9268
766
5924
545.
40.
085
027
8793
7856
6035
860
084
4829
650.
028
0.05
70
0 0.
084
A
dd o
n 26
1992
800
2430
4320
0
024
3043
200
0.86
21.
050
2199
7840
0.3
0 0.
126
00
027
7172
7827
7172
780
00
0.02
8 0.
028
Uni
ted
Kin
gdom
LH
17
100
6864
0011
7374
4000
0 0.
28
3286
4832
0084
5095
6800
0.86
21.
0530
2290
7247
7773
1900
650.
085
025
6947
116
6607
2115
50
091
7668
272
0.25
70.
661
0 0
0.91
8
Add
on
502
1373
0068
9246
00
068
9246
000.
862
1.05
063
3968
470
0.12
60
00
7988
003
7988
003
00
0 0.
008
0.00
8 G
erm
any
LH
1640
014
1000
2312
4000
00
0.33
76
3092
000
1549
3080
000.
876
1.05
6802
5836
313
8113
0617
0.08
5 0
5782
1961
1173
9610
20
017
5218
063
0.05
80.
117
0 0
0.17
5
Add
on
380
4230
016
0740
00
016
0740
000.
876
1.05
014
3291
670
0.12
60
00
1805
475
1805
475
00
0 0.
002
0.00
2 O
ther
Eur
ope
LH
1640
041
7900
6853
5600
00
0.26
17
8192
5600
5071
6344
000.
849
1.05
1588
4975
7645
2110
8486
0.08
5 0
1350
2229
438
4294
221
00
5193
1651
50.
135
0.38
40
0 0.
519
A
dd o
n 11
9125
0700
2985
8370
0
029
8583
700
0.84
91.
050
2661
7243
90
0.12
60
00
3353
7727
3353
7727
00
0 0.
034
0.03
4 O
ther
cou
ntrie
s (a
vera
ge o
f co
untry
1 -
16)
LH
9432
2790
0026
3152
8000
0.
31
8157
7368
018
1575
4320
0.88
61.
0575
8914
255
1689
1962
440.
085
064
5077
1214
3581
681
00
2080
8939
20.
065
0.14
40
0 0.
208
A
dd o
n
0
0
00.
886
1.05
00
0 0.
126
00
00
00
00
0 0.
000
TOTA
L
1058
7316
6727
2118
3816
015
7217
910
3937
1333
931.
059
2.72
10.
000
0.15
7 3.
937

THE CARBON FOOTPRINT OF AUSTRALIAN TOURISM
25
Table A5 Tourism (production only) Compared to ‘Non-Tourism’ Economic Sector Direct GHG Emissions, by Economic (ANZSIC) Sector, Australia, 2003–04, Mt
Economic Sector GHG Emissions, Mt (a)
Share of Total GHG Emissions by Industry %
Electricity and gas supply 194.00 39.11
Agriculture, forestry, fishing 130.06 26.22
Metal products 33.88 6.83
Road transport 26.92 5.43
Mining 23.06 4.65
Petroleum, coal and chemical 18.82 3.79
Accommodation, cultural and personal 15.96 3.22
Oil and gas extraction 15.03 3.03
Tourism (b) 10.49 2.11
Non-metallic mineral products 10.35 2.09
Mining non-energy 5.86 1.18
Air transport 4.79 0.97
Food, beverages, tobacco 3.50 0.71
Water transport 2.22 0.45
Wood, paper and printing 2.15 0.43
Railway transport 1.69 0.34
Government administration and defence 1.57 0.32
Water, sewerage and drainage 1.33 0.27
Other transport, services and storage 1.23 0.25
Education, health and community services 1.15 0.23
Wholesale and retail trade 0.86 0.17
Machinery and equipment 0.48 0.10
Communication 0.46 0.09

THE CARBON FOOTPRINT OF AUSTRALIAN TOURISM
26
Economic Sector GHG Emissions, Mt (a)
Share of Total GHG Emissions by Industry %
Textile, clothing, footwear and leather 0.45 0.09
Finance, insurance, property and business 0.20 0.04
Other manufacturing 0.02 0.004
TOTAL 496.04 (c) 100.00 (d)
Note: ‘Tourism’ is not an ANZSIC economic sector and, to avoid double counting, is consequently not counted in the total.
(a) Source: Department of Climate Change (2007a), Australian Greenhouse Emissions Information System, accessed on 4 December 2007.
(b) STCRC CEP estimate which contains emissions from tourism production including domestic aviation (Table 1, Row 1).
(c) Total includes GHG emissions from all economic (ANZSIC) sectors except Residential (transport and non-transport) sector.
(d) Percentages subject to rounding.
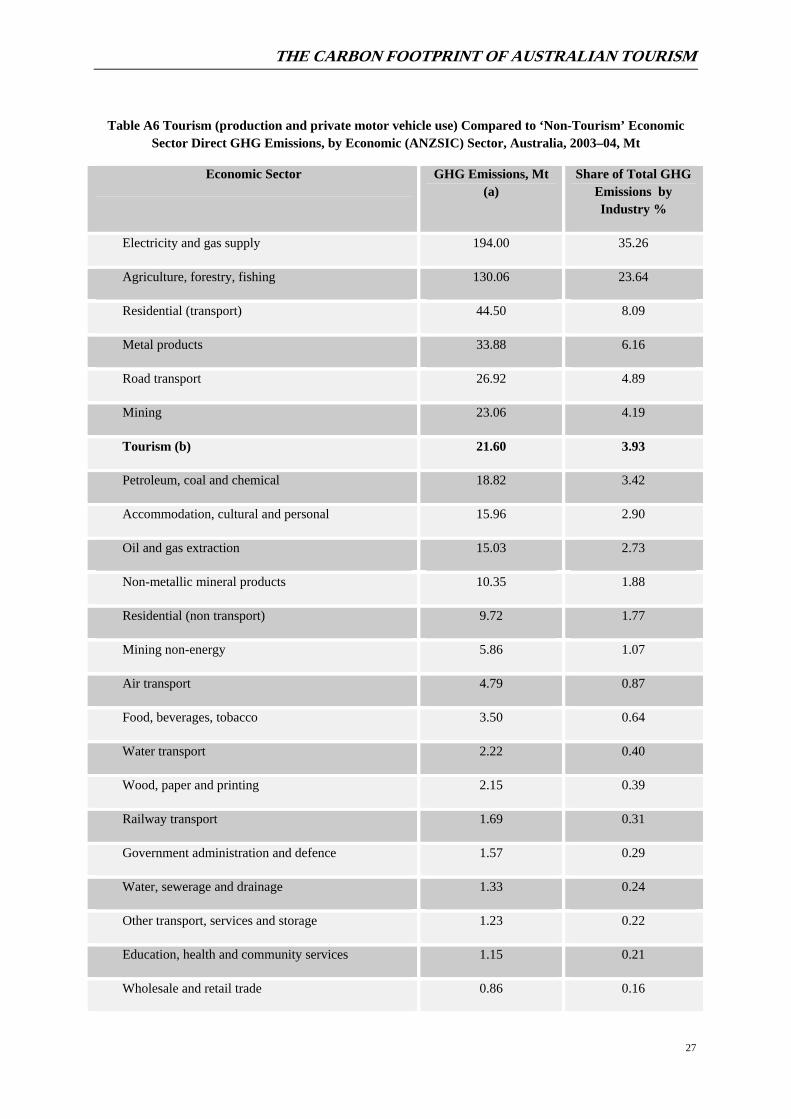
THE CARBON FOOTPRINT OF AUSTRALIAN TOURISM
27
Table A6 Tourism (production and private motor vehicle use) Compared to ‘Non-Tourism’ Economic Sector Direct GHG Emissions, by Economic (ANZSIC) Sector, Australia, 2003–04, Mt
Economic Sector GHG Emissions, Mt (a)
Share of Total GHG Emissions by Industry %
Electricity and gas supply 194.00 35.26
Agriculture, forestry, fishing 130.06 23.64
Residential (transport) 44.50 8.09
Metal products 33.88 6.16
Road transport 26.92 4.89
Mining 23.06 4.19
Tourism (b) 21.60 3.93
Petroleum, coal and chemical 18.82 3.42
Accommodation, cultural and personal 15.96 2.90
Oil and gas extraction 15.03 2.73
Non-metallic mineral products 10.35 1.88
Residential (non transport) 9.72 1.77
Mining non-energy 5.86 1.07
Air transport 4.79 0.87
Food, beverages, tobacco 3.50 0.64
Water transport 2.22 0.40
Wood, paper and printing 2.15 0.39
Railway transport 1.69 0.31
Government administration and defence 1.57 0.29
Water, sewerage and drainage 1.33 0.24
Other transport, services and storage 1.23 0.22
Education, health and community services 1.15 0.21
Wholesale and retail trade 0.86 0.16

THE CARBON FOOTPRINT OF AUSTRALIAN TOURISM
28
Economic Sector GHG Emissions, Mt (a)
Share of Total GHG Emissions by Industry %
Machinery and equipment 0.48 0.09
Communication 0.46 0.08
Textile, clothing, footwear and leather 0.45 0.08
Finance, insurance, property and business 0.20 0.04
Other manufacturing 0.02 0.004
TOTAL 550.25 (c) 100.00 (d)
Note: ‘Tourism’ is not an ANZSIC economic sector and, to avoid double counting, is consequently not counted in the total.
(a) Source: Department of Climate Change (2007a), Australian Greenhouse Emissions Information System, (accessed on 4 December 2007).
(b) STCRC CEP estimate which represents emissions from tourism production including domestic aviation and private motor vehicle use (Table 1, Row 4 and Column 1).
(c) Total represents GHG emissions from all economic (ANZSIC) sectors.
(d) Percentages subject to rounding.
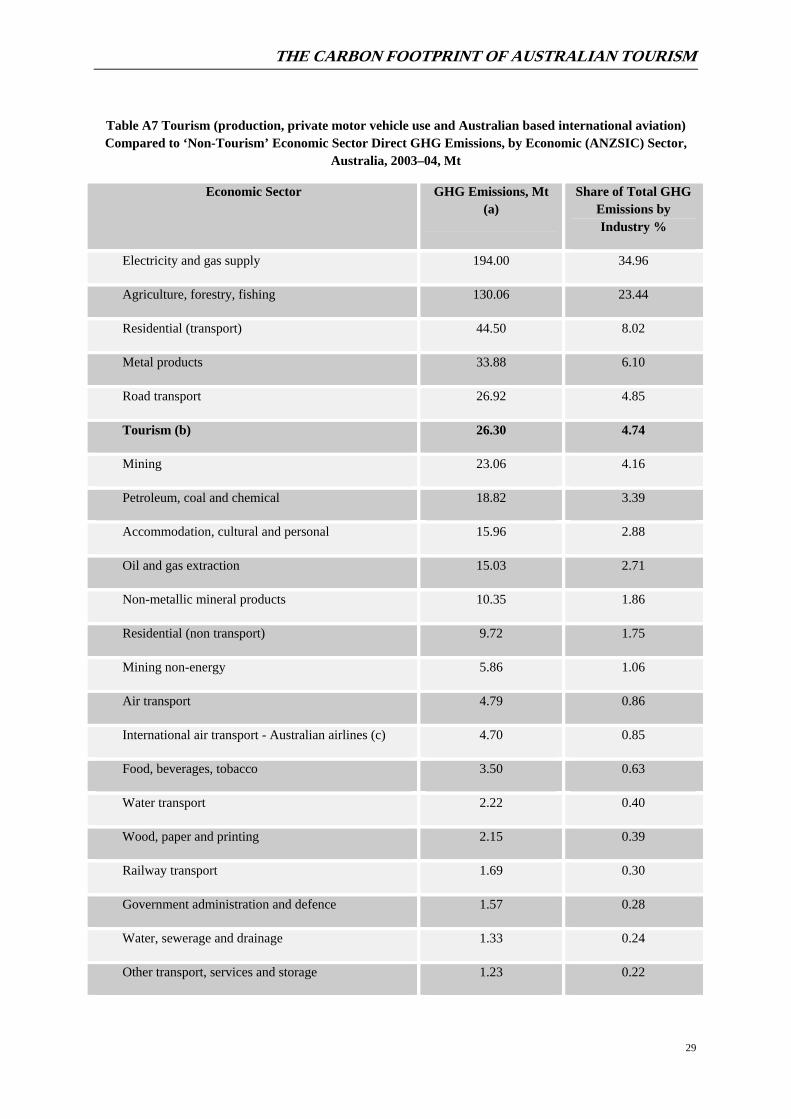
THE CARBON FOOTPRINT OF AUSTRALIAN TOURISM
29
Table A7 Tourism (production, private motor vehicle use and Australian based international aviation) Compared to ‘Non-Tourism’ Economic Sector Direct GHG Emissions, by Economic (ANZSIC) Sector,
Australia, 2003–04, Mt
Economic Sector GHG Emissions, Mt (a)
Share of Total GHG Emissions by Industry %
Electricity and gas supply 194.00 34.96
Agriculture, forestry, fishing 130.06 23.44
Residential (transport) 44.50 8.02
Metal products 33.88 6.10
Road transport 26.92 4.85
Tourism (b) 26.30 4.74
Mining 23.06 4.16
Petroleum, coal and chemical 18.82 3.39
Accommodation, cultural and personal 15.96 2.88
Oil and gas extraction 15.03 2.71
Non-metallic mineral products 10.35 1.86
Residential (non transport) 9.72 1.75
Mining non-energy 5.86 1.06
Air transport 4.79 0.86
International air transport - Australian airlines (c) 4.70 0.85
Food, beverages, tobacco 3.50 0.63
Water transport 2.22 0.40
Wood, paper and printing 2.15 0.39
Railway transport 1.69 0.30
Government administration and defence 1.57 0.28
Water, sewerage and drainage 1.33 0.24
Other transport, services and storage 1.23 0.22

THE CARBON FOOTPRINT OF AUSTRALIAN TOURISM
30
Economic Sector GHG Emissions, Mt (a)
Share of Total GHG Emissions by Industry %
Education, health and community services 1.15 0.21
Wholesale and retail trade 0.86 0.15
Machinery and equipment 0.48 0.09
Communication 0.46 0.08
Textile, clothing, footwear and leather 0.45 0.08
Finance, insurance, property and business 0.20 0.04
Other manufacturing 0.02 0.004
TOTAL 554.95 (d) 100.00 (e)
Note: ‘Tourism’ is not an ANZSIC economic sector and, to avoid double counting, is consequently not counted in the total.
(a) Source: Department of Climate Change (2007a), Australian Greenhouse Emissions Information System, accessed on 4 December 2007.
(b) STCRC CEP estimate which consists of emissions from tourism production including domestic aviation, Australian based international aviation and private motor vehicle use (Table 1, Row 4).
(c) Source: Table 1, Row 3.
(d) Total includes GHG emissions from all economic (ANZSIC) sectors plus emissions from international air transport by Australian airlines.
(e) Percentages subject to rounding.

THE CARBON FOOTPRINT OF AUSTRALIAN TOURISM
31
Table A8
Tourism (production, private motor vehicle use and Australian and non-Australian based inbound international aviation) Compared to ‘Non-Tourism’ Economic Sector
Direct GHG Emissions, by Economic (ANZSIC) Sector, Australia, 2003–04, Mt
Economic Sector GHG Emissions, Mt (a) Share of Total GHG Emissions by Industry %
Electricity and gas supply 194.00 34.76
Agriculture, forestry, fishing 130.06 23.30
Residential (transport) 44.50 7.97
Metal products 33.88 6.07
Tourism (b) 29.50 5.29
Road transport 26.92 4.82
Mining 23.06 4.13
Petroleum, coal and chemical 18.82 3.37
Accommodation, cultural and personal 15.96 2.86
Oil and gas extraction 15.03 2.69
Non-metallic mineral products 10.35 1.85
Residential (non transport) 9.72 1.74
International air transport – Australian & non-Australian based airlines (c)
7.90 1.42
Mining non-energy 5.86 1.05
Air transport 4.79 0.86
Food, beverages, tobacco 3.50 0.63
Water transport 2.22 0.40
Wood, paper and printing 2.15 0.39
Railway transport 1.69 0.30
Government administration and defence 1.57 0.28

THE CARBON FOOTPRINT OF AUSTRALIAN TOURISM
32
Economic Sector GHG Emissions, Mt (a) Share of Total GHG Emissions by Industry %
Water, sewerage and drainage 1.33 0.24
Other transport, services and storage 1.23 0.22
Education, health and community services 1.15 0.21
Wholesale and retail trade 0.86 0.15
Machinery and equipment 0.48 0.09
Communication 0.46 0.08
Textile, clothing, footwear and leather 0.45 0.08
Finance, insurance, property and business 0.20 0.04
Other manufacturing 0.02 0.004
TOTAL 558.15 (d) 100.00 (e)
Note: ‘Tourism’ is not an ANZSIC economic sector and, to avoid double counting, is consequently not counted in the total.
(a) Source: Department of Climate Change (2007a), Australian Greenhouse Emissions Information System, accessed on 4 December 2007.
(b) STCRC CEP estimate which consists of emissions from tourism production including domestic aviation, Australian based international aviation and private motor vehicle use (Table 2, Row 5).
(c) Source: Table 2, Rows 3 and 4).
(d) Total includes GHG emissions from all economic (ANZSIC) sectors plus emissions from international air transport by Australian and non-Australian based airlines. (e) Percentages subject to rounding.

THE CARBON FOOTPRINT OF AUSTRALIAN TOURISM
33
APPENDIX B: DEFINITIONS OF SELECTED TERMS USED IN THIS REPORT8
Australian International Airlines
Australian International Airlines for the year 2003–04 consist of Qantas, Australian Airlines, Pacific Blue and Jetstar.
Emissions
Emissions refer to greenhouse gas emissions.
Greenhouse Gas (GHG)
The most common greenhouse gases are carbon dioxide, methane, nitrous oxide and the synthetic greenhouse gases [the hydro fluorocarbons (HFCs), sulphur hexafluoride and the per fluorocarbons (PFCs)]. Emissions from these gases are aggregated into carbon dioxide equivalents (CO2-e) using a factor called global warming potentials (GWPs). GWP represents the relative warming effect of a unit of mass of greenhouse gas compared with the same amount of mass of CO2 over a specific period.
Mt
‘Mt’ is millions of metric tonnes of emissions. Technically a tonne of emissions is 1 tonne of carbon dioxide equivalent, which measures all the greenhouse gases.
Tourism Industry9
Tourism industry is as defined in the Australian Tourism Satellite Account (ATSA). ATSA classifies the tourism industry as comprising the following ‘tourism characteristic’ and ‘tourism connected’ industries. Tourism characteristic industries
• Travel agency and tour operator services
• Taxi transport
• Air and water transport
• Motor vehicle hiring
• Accommodation
• Cafés, restaurants and food outlets
8 These definitions are based on the Explanatory Notes to ABS TSA, Australian National Account, 5249.0, 2005–06 (ABS, 2007), National Greenhouse Gas Inventory 2005 (DCC, 2007b) and Australian Methodology for the Estimation of Greenhouse gas Emissions and Sinks 2005: Energy (Transport) (DCC, 2006), with adjustment where necessary to reflect the focus of this report. 9 Industry definitions in the MMRF-Green database (Adams, 2006) used for this study do not coincide precisely with those used in the ATSA. It was thus necessary to develop a concordance with MMRF-Green industries. As a result, while the overall tourism industry total is the same the component figures by industry are not necessarily identical.
THE CARBON FOOTPRINT OF AUSTRALIAN TOURISM
34
Tourism connected industries
• Clubs, pubs, taverns and bars
• Other road transport
• Rail transport
• Food manufacturing
• Beverage manufacturing
• Transport equipment manufacturing
• Other manufacturing
• Retail trade
• Casinos and other gambling services
• Libraries, museums and arts
• Other entertainment services
• Education
• Ownership of dwellings
* * These definitions are based on the Explanatory Notes to ABS TSA, Australian National Account, 5249.0, 2005–06 (ABS, 2007), National Greenhouse Gas Inventory 2005 (AGO 2007) and Australian Methodology for the Estimation of Greenhouse gas Emissions and Sinks 2005: Energy (Transport) (AGO 2006).
Adjustment has been made where necessary to reflect the focus of this report.
THE CARBON FOOTPRINT OF AUSTRALIAN TOURISM
35
REFERENCES Adams, P.D. (2006). MMRF-Green Database 2003–04, Centre of Policy Studies, Faculty of Business and Economics, Monash University, Melbourne.
Australian Bureau of Statistics (2007). Australian National Accounts: Tourism Satellite Account 2005–06, (Cat. No. 5249.0), Released on 11 May 2007, Canberra, www.abs.gov.au
Becken, S. and M. Patterson (2006). ‘Measuring National Carbon Dioxide Emissions from Tourism as a Key Step Towards Achieving Sustainable Tourism’, Journal of Sustainable Tourism, Vol. 14, No. 4, pp. 323–338.
Bureau of Transport and Regional Economics (2007). Airline by country of port data (passengers, freight and mail) 1999-current, Canberra, available at www.btre.gov.au/ info.aspx?ResourceId=218&NodeId=103 accessed on 14 November 2007.
Department of Climate Change (2007a). Australian Greenhouse Emissions Information System, accessed on 4 December 2007.
Department of Climate Change (2007b). National Greenhouse Gas Inventory 2005, Canberra, available at www.greenhouse.gov.au/inventory/2005/pubs/inventory2005.pdf accessed on 14 November 2007.
Department of Climate Change (2006). Australian Methodology for the Estimation of Greenhouse gas Emissions and Sinks 2005: Energy (Transport), Canberra, available on the Internet at the following address: http://www.greenhouse.gov.au/inventory
Dick Sisman & Associates (2007). Tourism Destinations Carbon Footprints, Cambridge, UK, March 2007.
German Aerospace Institute (DLR) (2008). http://www.dlr.de/rm-neu/en/desktopdefault.aspx
International Civil Aviation Organization (2008). http://www2.icao.int/public/cfmapps/carbonoffset/carbon_calculator.cfm#
Kelly, J. and P. W. Williams (2007). ‘Modelling Tourism Destination Energy Consumption and Greenhouse Gas Emissions: Whistler, British Columbia, Canada’, Journal of Sustainable Tourism, Vol. 15, No. 1, pp. 67–90.
Lundie, S., L. Dwyer and P. Forsyth (2007). ‘Environmental-Economic Measures of Tourism Yield’, Journal of Sustainable Tourism, Vol. 15, No. 5, pp. 503–519.
Patterson, M. and G. McDonald (2004). How Clean and Green is New Zealand Tourism? Lifecycle and Future Environmental Impacts, Landcare Research Science Series No. 24, Lincoln, Canterbury, New Zealand.
Qantas (2003–04). Qantas Annual Report 2003–04, Qantas Airways Limited. Scheelhaase, J. and W. Grimme (2007). ‘Emissions Trading for International Aviation – an Estimation of the Economic Impact on Selected European Airlines’, Journal of Air Transport Management, April.

THE CARBON FOOTPRINT OF AUSTRALIAN TOURISM
36
LIST OF ABBREVIATIONS ABS Australian Bureau of Statistics
ANZSIC Australia and New Zealand Industrial Classification
ATSA Australian Tourism Satellite Account
AusF Australian Flight
CGE Computable General Equilibrium
CO2-e Carbon dioxide equivalent
CEP STCRC’s Centre for Economics and Policy
DCC (/AGO) Department of Climate Change (/formerly the Australian Greenhouse Office)
GHG Greenhouse Gas
GVA Gross Value Added
ICAO International Civil Aviation Organization
IVS International Visitor Survey
kg/pkm Kilogram per passenger kilometre
LH Long Haul
Mt Million tonnes
MMRF Monash Multi-Regional Forecasting model
NonAusF Non-Australian Based Flight
SH Short Haul
STCRC Sustainable Tourism Cooperative Research Centre
TCF Textile, clothing and footwear
TSA Tourism Satellite Account
8.4%
12.7%
10.8%
14.2%
8.4%
12.7%
10.8%
14.2%
Leading the world in sustainable tourism research,commercialisation, extension and education.
CRC for Sustainable Tourism Pty Ltd ABN 53 077 407 286
Gold Coast Campus Griffith University QLD 4222 Australia
Telephone: +61 7 5552 8172 Facsimile: +61 7 5552 8171
Website: www.crctourism.com.au
Bookshop: www.crctourism.com.au/bookshop
Email: [email protected]
*11
125