Embed Size (px)
Citation preview
DIGITAL VIDEO AD EFFECTIVENESSYouTube, Facebook, Instagram, Twitter, Snapchat and More
NOVEMBER 2017
Paul Verna
Contributors: Annalise Clayton, Sean Creamer
Read this on eMarketer for iPad
DIGITAL VIDEO AD EFFECTIVENESS: YOUTUBE, FACEBOOK, INSTAGRAM, TWITTER, SNAPCHAT AND MORE ©2017 EMARKETER INC. ALL RIGHTS RESERVED 2
DIGITAL VIDEO AD EFFECTIVENESS: YOUTUBE, FACEBOOK, INSTAGRAM, TWITTER, SNAPCHAT AND MORE
This report looks at how ad industry executives measure the effectiveness of video ad campaigns. As new platforms
and devices change the landscape, and best practices must be tweaked, experts grapple with how to benchmark
campaigns for maximum effectiveness. The report combines recent data with executive insights.
■ YouTube and Facebook are the pillars of digital video advertising, with most practitioners using both rather than choosing one or the other. If anything, the question is how to combine each of those platforms with TV, not how to play them against each other.
■ Twitter is another key outlet, but for many ad buyers the platform has not delivered on its promise. Snapchat remains an experimental option for most.
■ As buyers increasingly delve into connected TV, they’re finding that the living room is a natural conduit for the types of ads that have worked for generations on linear TV. After all, connected TV viewers are still watching on TV screens, and the experience is similar to linear TV. But perhaps more importantly, the data-mining capabilities of set-top boxes and smart TVs present tantalizing possibilities.
WHAT’S IN THIS REPORT? This report polls ad industry experts on how they measure video ad effectiveness across a range of platforms—including YouTube, Facebook, Instagram, Snapchat and Twitter—as well as on linear and connected TV.
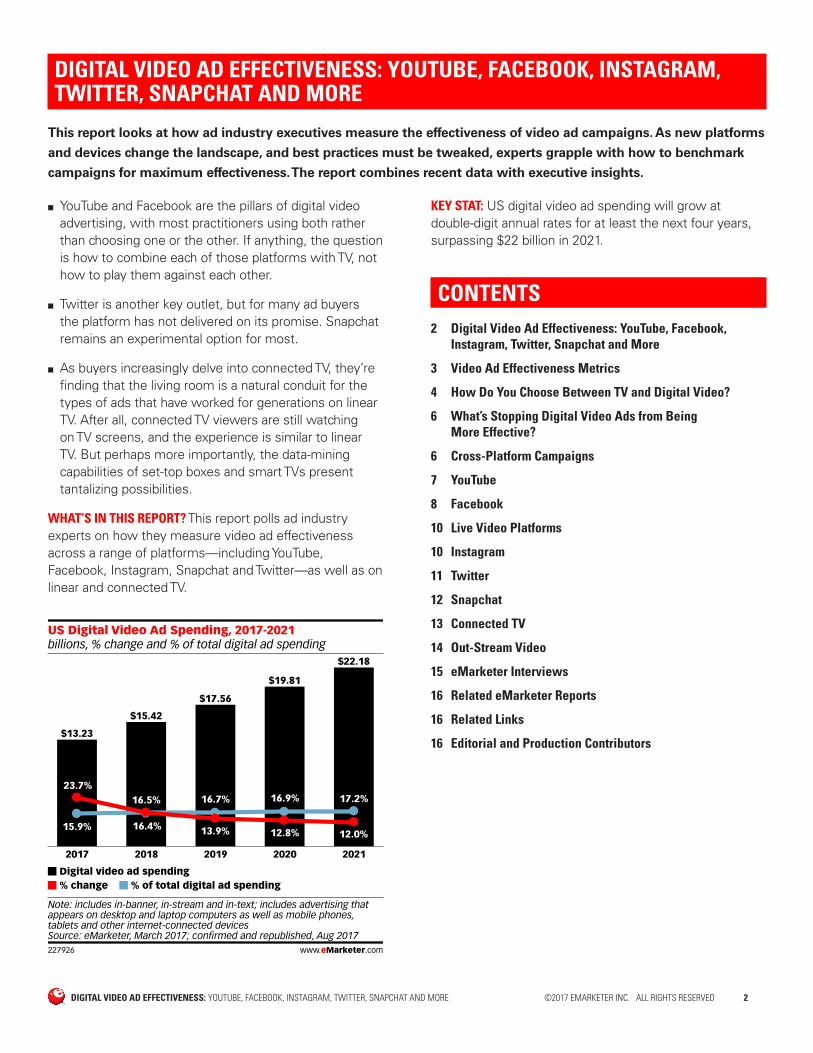
billions, % change and % of total digital ad spendingUS Digital Video Ad Spending, 2017-2021
2017
$13.23
23.7%
15.9%
2018
$15.42
16.5%
16.4%
2019
$17.56
13.9%
16.7%
2020
$19.81
12.8%
16.9%
2021
$22.18
12.0%
17.2%
Digital video ad spending% change % of total digital ad spending
Note: includes in-banner, in-stream and in-text; includes advertising that appears on desktop and laptop computers as well as mobile phones, tablets and other internet-connected devicesSource: eMarketer, March 2017; confirmed and republished, Aug 2017227926 www.eMarketer.com
KEY STAT: US digital video ad spending will grow at double-digit annual rates for at least the next four years, surpassing $22 billion in 2021.
CONTENTS2 Digital Video Ad Effectiveness: YouTube, Facebook,
Instagram, Twitter, Snapchat and More
3 Video Ad Effectiveness Metrics
4 How Do You Choose Between TV and Digital Video?
6 What’s Stopping Digital Video Ads from Being More Effective?
6 Cross-Platform Campaigns
7 YouTube
8 Facebook
10 Live Video Platforms
10 Instagram
11 Twitter
12 Snapchat
13 Connected TV
14 Out-Stream Video
15 eMarketer Interviews
16 Related eMarketer Reports
16 Related Links
16 Editorial and Production Contributors
DIGITAL VIDEO AD EFFECTIVENESS: YOUTUBE, FACEBOOK, INSTAGRAM, TWITTER, SNAPCHAT AND MORE ©2017 EMARKETER INC. ALL RIGHTS RESERVED 3
VIDEO AD EFFECTIVENESS METRICS
Recent studies from key players in the world of ad
tech tell quite different stories of how video ads
seem to be performing, based on completion rates,
viewability rates, clickthroughs and more.
Although the body of research on video ad metrics is still limited, the noisiness in the data is remarkable given how concrete some of these metrics are. Nevertheless, those who have followed the industry understand that many complicating factors are at play.
One such factor is that each company measures activity on its own platform, which is only a small sample of the broader universe. Lack of standards also has an effect. The digital video space seems to be a constant flux of formats, aspect ratios, ad lengths and determinants, such as whether ads autoplay or have to be initiated, and whether the sound should be on or off by default.
This lack of consensus, coupled with the fact that in many cases each publisher, platform and video ad measurement firm may approach video ad measurement in slightly different ways, with slightly different data sets, also make it near impossible to uncover any universal metric for success.
For example, Extreme Reach found that four key metrics it tracked during the year leading up to Q2 2017 all increased: completion rate, viewability rate, viewable completion rate and clickthrough rate. These were measured across the company’s worldwide network, with the bulk of the activity being in the US.
among impressions served by Extreme Reach
Digital Video Ad Benchmarks Worldwide: CTR,Completion and Viewability Rates, Q2 2016-Q2 2017
Completion rate
Viewability rate
Viewable completion rate
Clickthrough rate (CTR)
Q2 2016
61.0%
51.0%
50.0%
0.30%
Q3 2016
67.0%
55.0%
60.0%
0.37%
Q4 2016
65.0%
63.0%
75.0%
0.34%
Q1 2017
73.0%
69.0%
73.0%
0.45%
Q2 2017
73.0%
61.0%
71.0%
0.45%
Note: represents activity on the Extreme Reach platform, broader industrymetrics may varySource: Extreme Reach, July 1, 2017230996 www.eMarketer.com
By contrast, the metrics on Moat’s platform varied significantly. Although the scope was also worldwide, impressions were served mostly in the UK and US. Furthermore, Moat segmented its data by device type—
desktop and mobile—and did not average out the two. With so many differences in scope and methodology, the two studies are not at all directly comparable.
That said, Moat found that completion rates decreased during the same period that they increased for Extreme Reach, and this was true on both desktop and mobile. Also, Moat’s 2-second in-view rate, which according to the definitions provided by each company correlates with Extreme Reach’s viewability rate, increased slightly on desktop but decreased considerably more on mobile.
among impressions served by Moat analytics
Desktop vs. Mobile Video Ad Benchmarks Worldwide:Completion and Viewability Rates, Q2 2016-Q2 2017
Desktop
2-second in-view rate
Completion rate
Audible & visible oncomplete rate
Completion quality rate
Mobile
2-second in-view rate
Completion rate
Audible & visible oncomplete rate
Completion quality rate
Q22016
58.8%
68.4%
20.4%
37.4%
52.0%
51.6%
7.5%
26.5%
Q32016
57.2%
67.5%
22.5%
36.5%
39.4%
38.1%
17.6%
30.8%
Q42016
56.0%
62.2%
26.1%
38.5%
42.0%
38.6%
16.0%
28.8%
Q12017
58.5%
62.7%
29.6%
42.4%
43.3%
37.4%
15.6%
28.0%
Q22017
60.8%
61.4%
29.5%
42.5%
43.4%
39.4%
14.8%
25.6%
Note: represents activity on the Moat Analytics platform, broader industrymetrics may varySource: Moat, Aug 2017231093 www.eMarketer.com
In addition, Moat tracked metrics that other companies did not, such as the rate at which video ads were audible and visible upon completion. “Completion quality” refers to the audible/visible rate divided by overall completion.
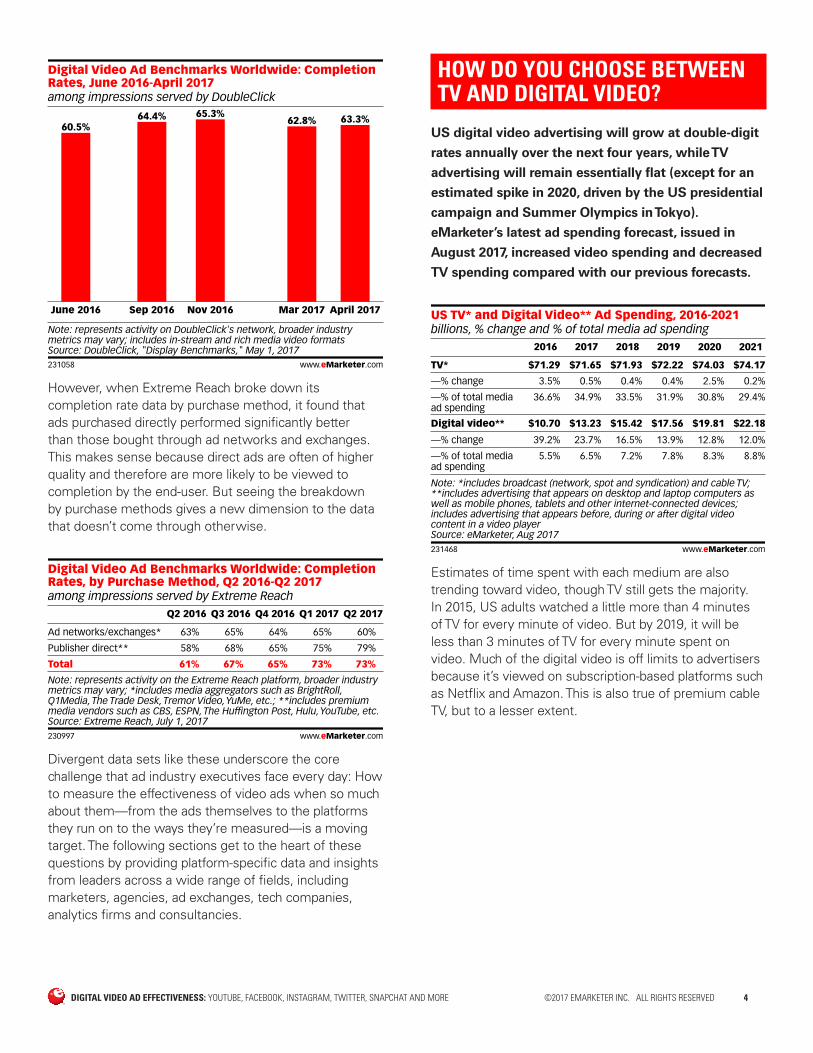
Drilling further down into completion rates, a May 2017 DoubleClick study roughly agreed with Extreme Reach’s. Worldwide digital video ad completion rates on its network hit 63.3% in April 2017, up from 60.5% in June 2016.
DIGITAL VIDEO AD EFFECTIVENESS: YOUTUBE, FACEBOOK, INSTAGRAM, TWITTER, SNAPCHAT AND MORE ©2017 EMARKETER INC. ALL RIGHTS RESERVED 4
among impressions served by DoubleClick
Digital Video Ad Benchmarks Worldwide: CompletionRates, June 2016-April 2017
June 2016
60.5%
Sep 2016
64.4%
Nov 2016
65.3%
Mar 2017
62.8%
April 2017
63.3%
Note: represents activity on DoubleClick's network, broader industrymetrics may vary; includes in-stream and rich media video formatsSource: DoubleClick, "Display Benchmarks," May 1, 2017231058 www.eMarketer.com
However, when Extreme Reach broke down its completion rate data by purchase method, it found that ads purchased directly performed significantly better than those bought through ad networks and exchanges. This makes sense because direct ads are often of higher quality and therefore are more likely to be viewed to completion by the end-user. But seeing the breakdown by purchase methods gives a new dimension to the data that doesn’t come through otherwise.
among impressions served by Extreme Reach
Digital Video Ad Benchmarks Worldwide: CompletionRates, by Purchase Method, Q2 2016-Q2 2017
Ad networks/exchanges*
Publisher direct**
Total
Q2 2016
63%
58%
61%
Q3 2016
65%
68%
67%
Q4 2016
64%
65%
65%
Q1 2017
65%
75%
73%
Q2 2017
60%
79%
73%
Note: represents activity on the Extreme Reach platform, broader industrymetrics may vary; *includes media aggregators such as BrightRoll,Q1Media, The Trade Desk, Tremor Video, YuMe, etc.; **includes premiummedia vendors such as CBS, ESPN, The Huffington Post, Hulu, YouTube, etc.Source: Extreme Reach, July 1, 2017230997 www.eMarketer.com
Divergent data sets like these underscore the core challenge that ad industry executives face every day: How to measure the effectiveness of video ads when so much about them—from the ads themselves to the platforms they run on to the ways they’re measured—is a moving target. The following sections get to the heart of these questions by providing platform-specific data and insights from leaders across a wide range of fields, including marketers, agencies, ad exchanges, tech companies, analytics firms and consultancies.
HOW DO YOU CHOOSE BETWEEN TV AND DIGITAL VIDEO?
US digital video advertising will grow at double-digit
rates annually over the next four years, while TV
advertising will remain essentially flat (except for an
estimated spike in 2020, driven by the US presidential
campaign and Summer Olympics in Tokyo).
eMarketer’s latest ad spending forecast, issued in
August 2017, increased video spending and decreased
TV spending compared with our previous forecasts.
billions, % change and % of total media ad spendingUS TV* and Digital Video** Ad Spending, 2016-2021
TV*
—% change
—% of total mediaad spending
Digital video**
—% change
—% of total mediaad spending
2016
$71.29
3.5%
36.6%
$10.70
39.2%
5.5%
2017
$71.65
0.5%
34.9%
$13.23
23.7%
6.5%
2018
$71.93
0.4%
33.5%
$15.42
16.5%
7.2%
2019
$72.22
0.4%
31.9%
$17.56
13.9%
7.8%
2020
$74.03
2.5%
30.8%
$19.81
12.8%
8.3%
2021
$74.17
0.2%
29.4%
$22.18
12.0%
8.8%
Note: *includes broadcast (network, spot and syndication) and cable TV;**includes advertising that appears on desktop and laptop computers aswell as mobile phones, tablets and other internet-connected devices;includes advertising that appears before, during or after digital videocontent in a video playerSource: eMarketer, Aug 2017231468 www.eMarketer.com
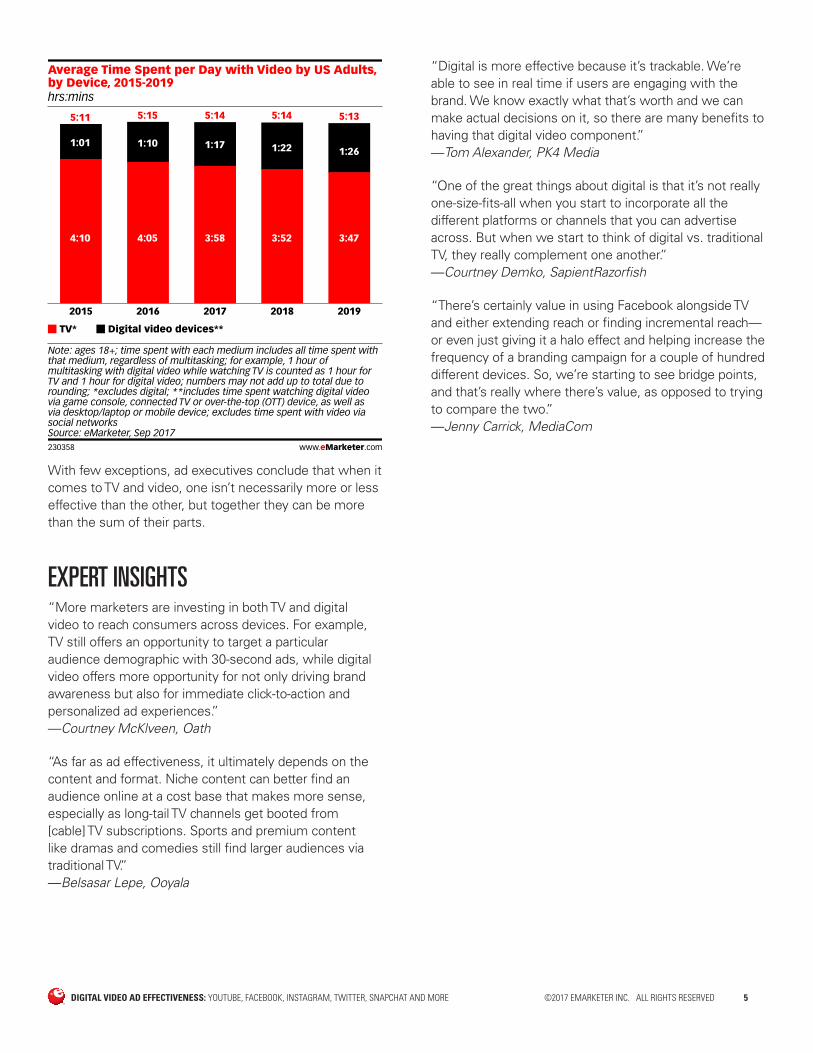
Estimates of time spent with each medium are also trending toward video, though TV still gets the majority. In 2015, US adults watched a little more than 4 minutes of TV for every minute of video. But by 2019, it will be less than 3 minutes of TV for every minute spent on video. Much of the digital video is off limits to advertisers because it’s viewed on subscription-based platforms such as Netflix and Amazon. This is also true of premium cable TV, but to a lesser extent.
DIGITAL VIDEO AD EFFECTIVENESS: YOUTUBE, FACEBOOK, INSTAGRAM, TWITTER, SNAPCHAT AND MORE ©2017 EMARKETER INC. ALL RIGHTS RESERVED 5
hrs:mins
Average Time Spent per Day with Video by US Adults,by Device, 2015-2019
2015
4:10
1:01
2016
4:05
1:10
2017
3:58
1:17
2018
3:52
1:22
2019
3:47
1:26
5:11 5:15 5:14 5:14 5:13
TV* Digital video devices**
Note: ages 18+; time spent with each medium includes all time spent withthat medium, regardless of multitasking; for example, 1 hour ofmultitasking with digital video while watching TV is counted as 1 hour forTV and 1 hour for digital video; numbers may not add up to total due torounding; *excludes digital; **includes time spent watching digital videovia game console, connected TV or over-the-top (OTT) device, as well asvia desktop/laptop or mobile device; excludes time spent with video viasocial networksSource: eMarketer, Sep 2017230358 www.eMarketer.com
With few exceptions, ad executives conclude that when it comes to TV and video, one isn’t necessarily more or less effective than the other, but together they can be more than the sum of their parts.
EXPERT INSIGHTS “More marketers are investing in both TV and digital video to reach consumers across devices. For example, TV still offers an opportunity to target a particular audience demographic with 30-second ads, while digital video offers more opportunity for not only driving brand awareness but also for immediate click-to-action and personalized ad experiences.” —Courtney McKlveen, Oath
“As far as ad effectiveness, it ultimately depends on the content and format. Niche content can better find an audience online at a cost base that makes more sense, especially as long-tail TV channels get booted from [cable] TV subscriptions. Sports and premium content like dramas and comedies still find larger audiences via traditional TV.” —Belsasar Lepe, Ooyala
“Digital is more effective because it’s trackable. We’re able to see in real time if users are engaging with the brand. We know exactly what that’s worth and we can make actual decisions on it, so there are many benefits to having that digital video component.” —Tom Alexander, PK4 Media
“One of the great things about digital is that it’s not really one-size-fits-all when you start to incorporate all the different platforms or channels that you can advertise across. But when we start to think of digital vs. traditional TV, they really complement one another.” —Courtney Demko, SapientRazorfish
“There’s certainly value in using Facebook alongside TV and either extending reach or finding incremental reach—or even just giving it a halo effect and helping increase the frequency of a branding campaign for a couple of hundred different devices. So, we’re starting to see bridge points, and that’s really where there’s value, as opposed to trying to compare the two.” —Jenny Carrick, MediaCom
DIGITAL VIDEO AD EFFECTIVENESS: YOUTUBE, FACEBOOK, INSTAGRAM, TWITTER, SNAPCHAT AND MORE ©2017 EMARKETER INC. ALL RIGHTS RESERVED 6
WHAT’S STOPPING DIGITAL VIDEO ADS FROM BEING MORE EFFECTIVE?
Despite digital video advertising’s bright growth,
industry executives continue to point to a host
of challenges and obstacles. These include brand
safety and metrics, most prominently on YouTube
and Facebook. But even beyond those high-profile
incidents, other barriers remain.
EXPERT INSIGHTS “The obstacles have traditionally been around targeting and measurement. ... We’re making such progress in being able to effectively target audiences across platforms and measure the results of the effectiveness of those integrations in ways that advertisers have been expecting of digital platforms.” —Aaron Frank, Branded Entertainment Network
“Being able to actively follow a user and understand what they’re doing and really get the best video ad is something that we’ve seen companies really address from the display side, and I think mobile video especially is lagging behind where the display market is. That’s changing, and [next year] I think we’re going to continue to see a lot of improvement over 2017.” —Justin Festa, LittleThings
“Many advertisers cite a lack of premium video inventory as a barrier to entry. As the industry defines effective standards for viewability and additional measurement, advertisers are navigating this ecosystem and production costs when investing in high-quality digital video advertising.” —Courtney McKlveen, Oath
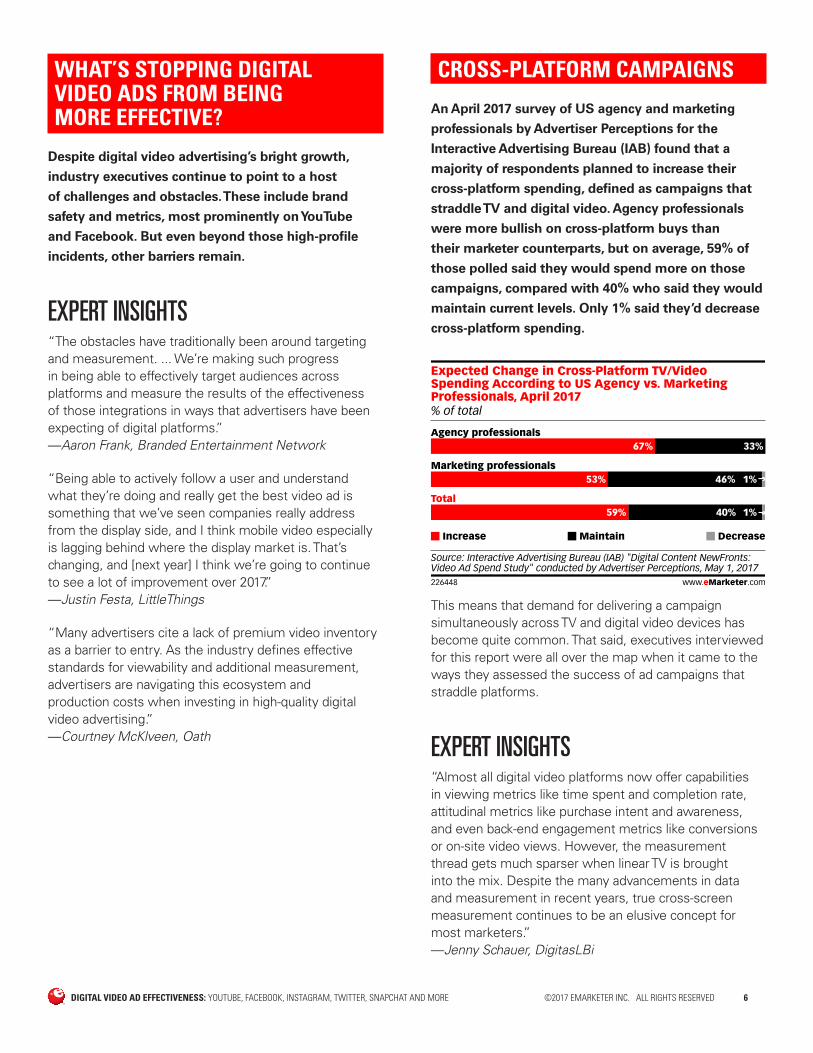
CROSS-PLATFORM CAMPAIGNS
An April 2017 survey of US agency and marketing
professionals by Advertiser Perceptions for the
Interactive Advertising Bureau (IAB) found that a
majority of respondents planned to increase their
cross-platform spending, defined as campaigns that
straddle TV and digital video. Agency professionals
were more bullish on cross-platform buys than
their marketer counterparts, but on average, 59% of
those polled said they would spend more on those
campaigns, compared with 40% who said they would
maintain current levels. Only 1% said they’d decrease
cross-platform spending.
% of total
Expected Change in Cross-Platform TV/VideoSpending According to US Agency vs. MarketingProfessionals, April 2017
Agency professionals67% 33%
Increase Maintain Decrease
Source: Interactive Advertising Bureau (IAB) "Digital Content NewFronts:Video Ad Spend Study" conducted by Advertiser Perceptions, May 1, 2017226448 www.eMarketer.com
Marketing professionals53% 46% 1%
Total59% 40% 1%
This means that demand for delivering a campaign simultaneously across TV and digital video devices has become quite common. That said, executives interviewed for this report were all over the map when it came to the ways they assessed the success of ad campaigns that straddle platforms.
EXPERT INSIGHTS “Almost all digital video platforms now offer capabilities in viewing metrics like time spent and completion rate, attitudinal metrics like purchase intent and awareness, and even back-end engagement metrics like conversions or on-site video views. However, the measurement thread gets much sparser when linear TV is brought into the mix. Despite the many advancements in data and measurement in recent years, true cross-screen measurement continues to be an elusive concept for most marketers.” —Jenny Schauer, DigitasLBi
DIGITAL VIDEO AD EFFECTIVENESS: YOUTUBE, FACEBOOK, INSTAGRAM, TWITTER, SNAPCHAT AND MORE ©2017 EMARKETER INC. ALL RIGHTS RESERVED 7
“In the digital world, one thing folks look at as a measure of success is completion rate. Did they watch the ad to completion? A second is viewability. Did someone see the ad? Another one, especially as connected television becomes a more prevalent piece of the ecosystem, is GRP [gross ratings point]. Part of the reason GRP is important is that that’s a currency that television is used to, so that will become more and more of a factor as connected television becomes a bigger part of the overall media mix transacted programmatically.” —Tim Sims, The Trade Desk
“With video, it’s still largely an awareness tactic, in our view. Completed views are still the strongest KPI [key performance indicator]. And after completed views, we look at view rate to inform us on audience engagement within the content. Unfortunately, the measurement stick across all platforms is not equal.” —Leah Woolford, USDM Holdings
YOUTUBE
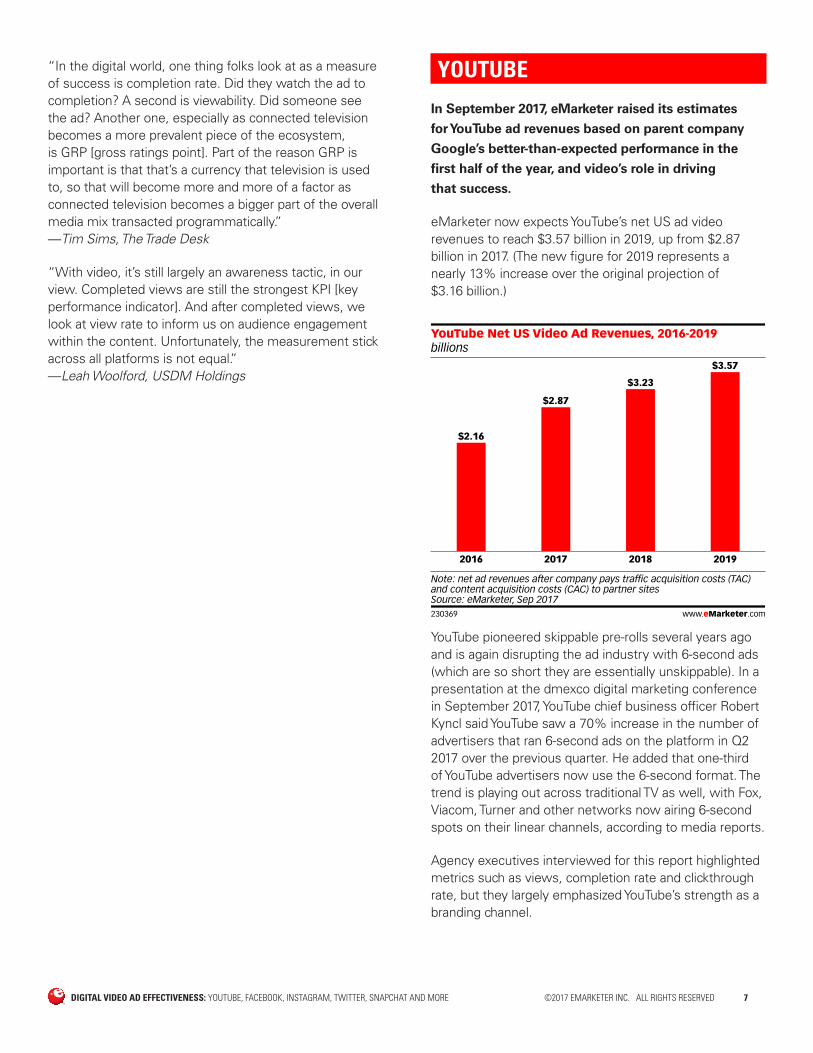
In September 2017, eMarketer raised its estimates
for YouTube ad revenues based on parent company
Google’s better-than-expected performance in the
first half of the year, and video’s role in driving
that success.
eMarketer now expects YouTube’s net US ad video revenues to reach $3.57 billion in 2019, up from $2.87 billion in 2017. (The new figure for 2019 represents a nearly 13% increase over the original projection of $3.16 billion.)
billionsYouTube Net US Video Ad Revenues, 2016-2019
2016
$2.16
2017
$2.87
2018
$3.23
2019
$3.57
Note: net ad revenues after company pays traffic acquisition costs (TAC)and content acquisition costs (CAC) to partner sitesSource: eMarketer, Sep 2017230369 www.eMarketer.com
YouTube pioneered skippable pre-rolls several years ago and is again disrupting the ad industry with 6-second ads (which are so short they are essentially unskippable). In a presentation at the dmexco digital marketing conference in September 2017, YouTube chief business officer Robert Kyncl said YouTube saw a 70% increase in the number of advertisers that ran 6-second ads on the platform in Q2 2017 over the previous quarter. He added that one-third of YouTube advertisers now use the 6-second format. The trend is playing out across traditional TV as well, with Fox, Viacom, Turner and other networks now airing 6-second spots on their linear channels, according to media reports.
Agency executives interviewed for this report highlighted metrics such as views, completion rate and clickthrough rate, but they largely emphasized YouTube’s strength as a branding channel.
DIGITAL VIDEO AD EFFECTIVENESS: YOUTUBE, FACEBOOK, INSTAGRAM, TWITTER, SNAPCHAT AND MORE ©2017 EMARKETER INC. ALL RIGHTS RESERVED 8
EXPERT INSIGHTS “We will look at metrics such as video views, clickthrough rates and time in session, but we are ultimately trying to shift the dial on the brand sell, so whether that be ad recall or favorability or intent to purchase, that’s what we’re trying to create.” —Jenny Carrick, MediaCom
“While we look at video views and clickthroughs, we’ll also look at measuring brand lift and ad recall, so oftentimes we’ll utilize Google Consumer Surveys for those. That’s been a great tool for us to measure the impact of some of the videos that we flight across YouTube.” —Courtney Demko, SapientRazorfish
“At the end of the day, YouTube is simply another avenue for marketers to intercept their consumers, and we feel it’s increasingly important to hold the platform to consistent standards as [we do with] other digital video sources.” —Jenny Schauer, DigitasLBi
If YouTube is one of the pillars of digital video
advertising, Facebook is the other. The social platform
is well along the path of transforming itself into a
video-first service, as CEO Mark Zuckerberg signaled
in the company’s Q2 2016 earnings release.
To date, Facebook’s video ad efforts have focused primarily on paid in-feed units, sometimes supplemented by organic marketing on brand pages. However, as the platform moves further into mid-length and long-form content, in-stream mid-roll clips will become increasingly important to its strategy.
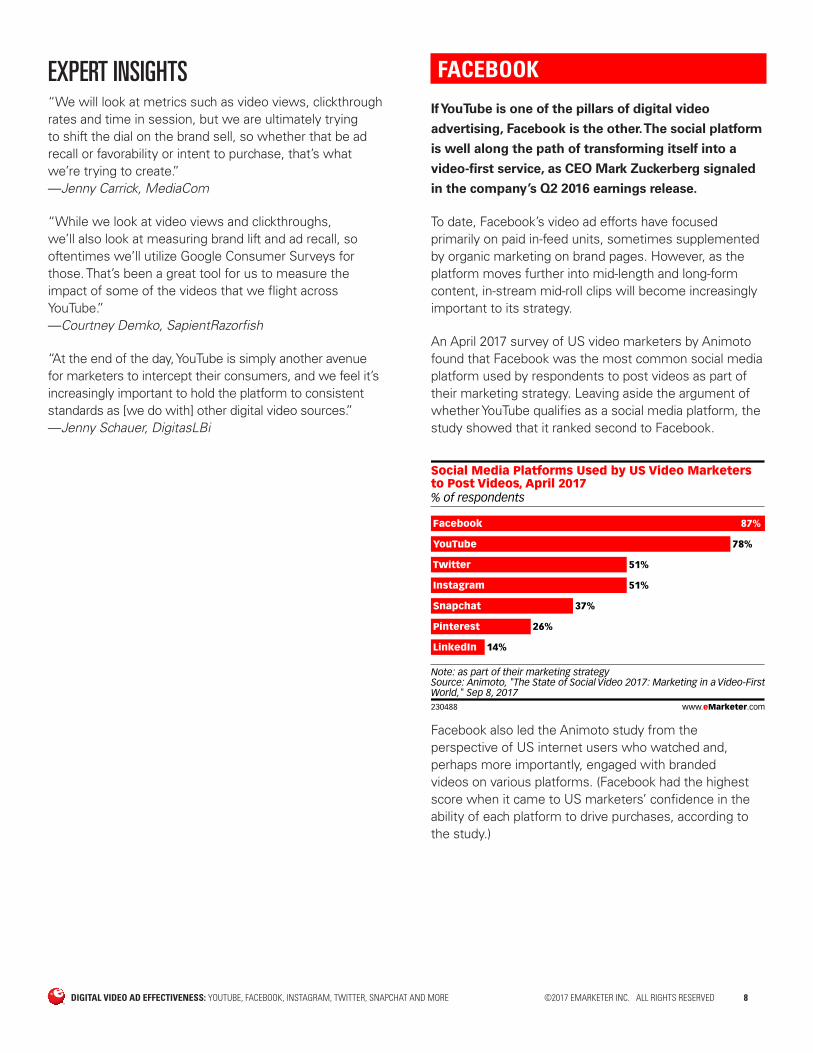
An April 2017 survey of US video marketers by Animoto found that Facebook was the most common social media platform used by respondents to post videos as part of their marketing strategy. Leaving aside the argument of whether YouTube qualifies as a social media platform, the study showed that it ranked second to Facebook.
% of respondents
Social Media Platforms Used by US Video Marketersto Post Videos, April 2017
Facebook 87%
YouTube 78%
Twitter 51%
Instagram 51%
Snapchat 37%
Pinterest 26%
LinkedIn 14%
Note: as part of their marketing strategySource: Animoto, "The State of Social Video 2017: Marketing in a Video-FirstWorld," Sep 8, 2017230488 www.eMarketer.com
Facebook also led the Animoto study from the perspective of US internet users who watched and, perhaps more importantly, engaged with branded videos on various platforms. (Facebook had the highest score when it came to US marketers’ confidence in the ability of each platform to drive purchases, according to the study.)
DIGITAL VIDEO AD EFFECTIVENESS: YOUTUBE, FACEBOOK, INSTAGRAM, TWITTER, SNAPCHAT AND MORE ©2017 EMARKETER INC. ALL RIGHTS RESERVED 9
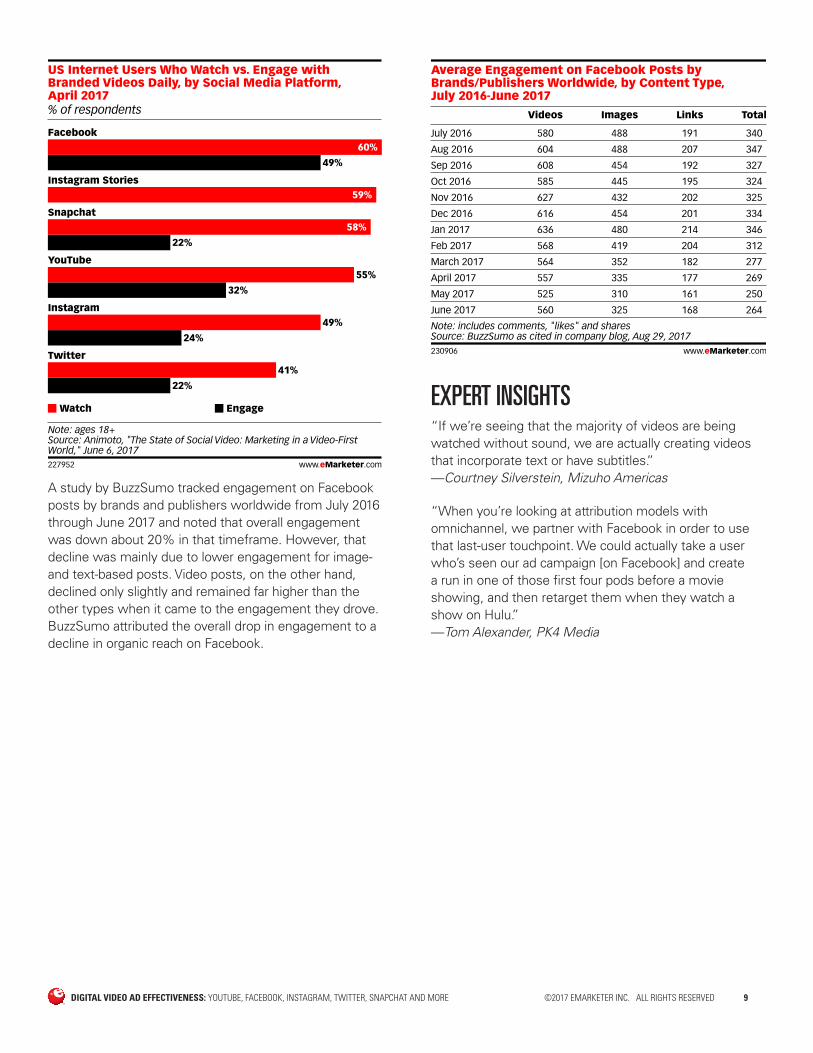
% of respondents
US Internet Users Who Watch vs. Engage withBranded Videos Daily, by Social Media Platform, April 2017
Facebook60%
49%
Instagram Stories59%
Snapchat58%
22%
YouTube55%
32%
Instagram49%
24%
Twitter41%
22%
Watch Engage
Note: ages 18+Source: Animoto, "The State of Social Video: Marketing in a Video-FirstWorld," June 6, 2017227952 www.eMarketer.com
A study by BuzzSumo tracked engagement on Facebook posts by brands and publishers worldwide from July 2016 through June 2017 and noted that overall engagement was down about 20% in that timeframe. However, that decline was mainly due to lower engagement for image- and text-based posts. Video posts, on the other hand, declined only slightly and remained far higher than the other types when it came to the engagement they drove. BuzzSumo attributed the overall drop in engagement to a decline in organic reach on Facebook.
Average Engagement on Facebook Posts byBrands/Publishers Worldwide, by Content Type, July 2016-June 2017
Videos Images Links Total
July 2016 580 488 191 340
Aug 2016 604 488 207 347
Sep 2016 608 454 192 327
Oct 2016 585 445 195 324
Nov 2016 627 432 202 325
Dec 2016 616 454 201 334
Jan 2017 636 480 214 346
Feb 2017 568 419 204 312
March 2017 564 352 182 277
April 2017 557 335 177 269
May 2017 525 310 161 250
June 2017 560 325 168 264
Note: includes comments, "likes" and sharesSource: BuzzSumo as cited in company blog, Aug 29, 2017230906 www.eMarketer.com
EXPERT INSIGHTS “If we’re seeing that the majority of videos are being watched without sound, we are actually creating videos that incorporate text or have subtitles.” —Courtney Silverstein, Mizuho Americas
“When you’re looking at attribution models with omnichannel, we partner with Facebook in order to use that last-user touchpoint. We could actually take a user who’s seen our ad campaign [on Facebook] and create a run in one of those first four pods before a movie showing, and then retarget them when they watch a show on Hulu.” —Tom Alexander, PK4 Media
DIGITAL VIDEO AD EFFECTIVENESS: YOUTUBE, FACEBOOK, INSTAGRAM, TWITTER, SNAPCHAT AND MORE ©2017 EMARKETER INC. ALL RIGHTS RESERVED 10
LIVE VIDEO PLATFORMS
Effectiveness metrics on live video platforms are a
work in progress given the newness of the format;
the uncertainty stems from the unpredictability
of advertising against live content and the lack of
standards when it comes to the various kinds of ads
and content.
Nevertheless, the number of views, number of concurrent views and engagement stats measuring how viewers are responding to the stream are among the metrics being tracked, some of them in real time.
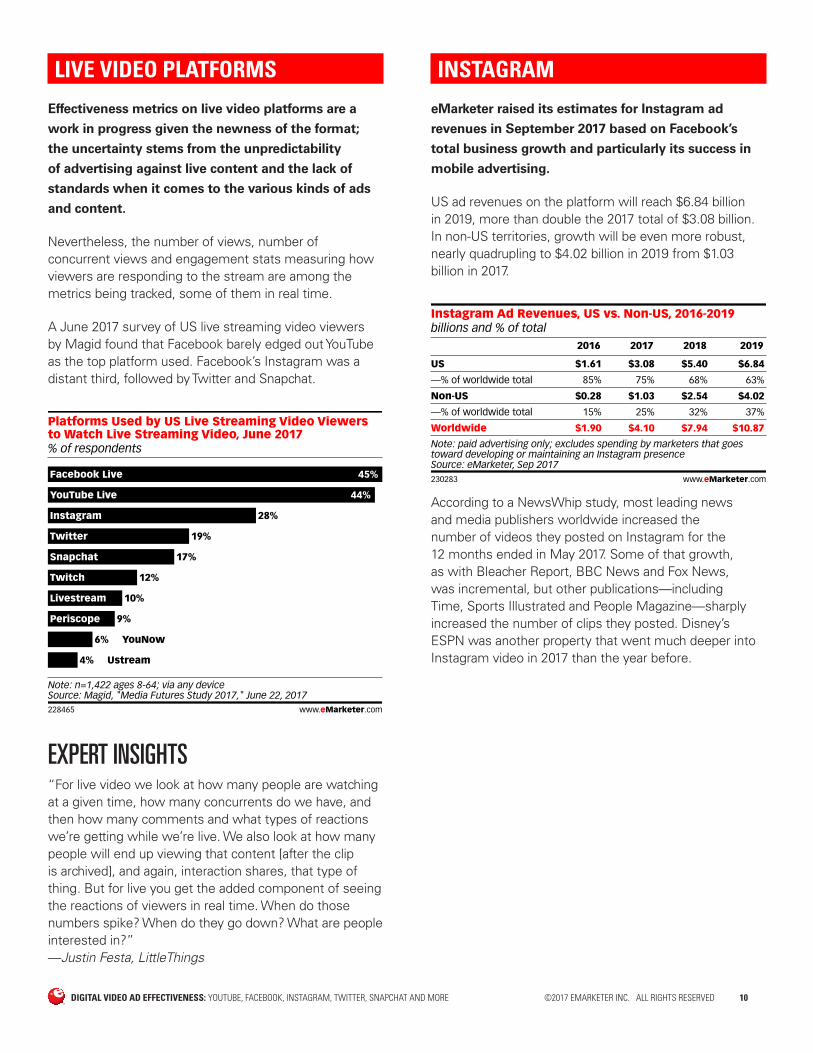
A June 2017 survey of US live streaming video viewers by Magid found that Facebook barely edged out YouTube as the top platform used. Facebook’s Instagram was a distant third, followed by Twitter and Snapchat.
% of respondents
Platforms Used by US Live Streaming Video Viewersto Watch Live Streaming Video, June 2017
Facebook Live 45%
YouTube Live 44%
Instagram 28%
Twitter 19%
Snapchat 17%
Twitch 12%
Livestream 10%
Periscope 9%
YouNow6%
Ustream4%
Note: n=1,422 ages 8-64; via any deviceSource: Magid, "Media Futures Study 2017," June 22, 2017228465 www.eMarketer.com
EXPERT INSIGHTS “For live video we look at how many people are watching at a given time, how many concurrents do we have, and then how many comments and what types of reactions we’re getting while we’re live. We also look at how many people will end up viewing that content [after the clip is archived], and again, interaction shares, that type of thing. But for live you get the added component of seeing the reactions of viewers in real time. When do those numbers spike? When do they go down? What are people interested in?” —Justin Festa, LittleThings
eMarketer raised its estimates for Instagram ad
revenues in September 2017 based on Facebook’s
total business growth and particularly its success in
mobile advertising.
US ad revenues on the platform will reach $6.84 billion in 2019, more than double the 2017 total of $3.08 billion. In non-US territories, growth will be even more robust, nearly quadrupling to $4.02 billion in 2019 from $1.03 billion in 2017.
billions and % of totalInstagram Ad Revenues, US vs. Non-US, 2016-2019
US
—% of worldwide total
Non-US
—% of worldwide total
Worldwide
2016
$1.61
85%
$0.28
15%
$1.90
2017
$3.08
75%
$1.03
25%
$4.10
2018
$5.40
68%
$2.54
32%
$7.94
2019
$6.84
63%
$4.02
37%
$10.87
Note: paid advertising only; excludes spending by marketers that goestoward developing or maintaining an Instagram presenceSource: eMarketer, Sep 2017230283 www.eMarketer.com
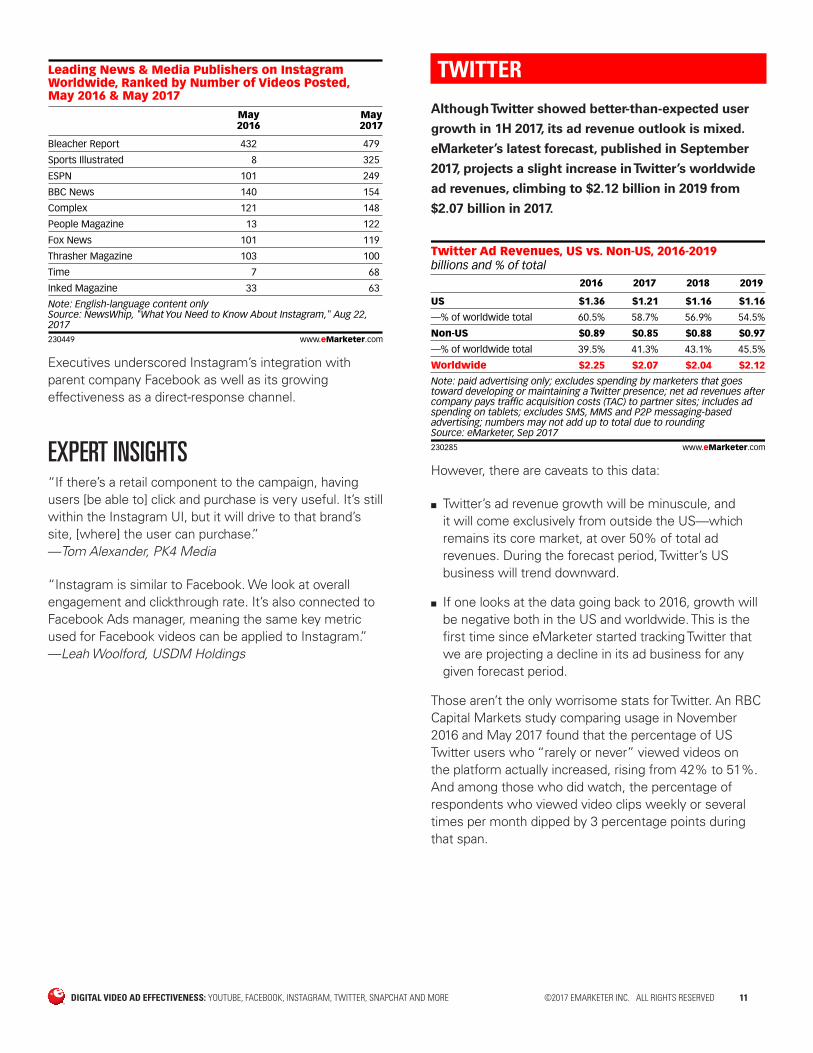
According to a NewsWhip study, most leading news and media publishers worldwide increased the number of videos they posted on Instagram for the 12 months ended in May 2017. Some of that growth, as with Bleacher Report, BBC News and Fox News, was incremental, but other publications—including Time, Sports Illustrated and People Magazine—sharply increased the number of clips they posted. Disney’s ESPN was another property that went much deeper into Instagram video in 2017 than the year before.
DIGITAL VIDEO AD EFFECTIVENESS: YOUTUBE, FACEBOOK, INSTAGRAM, TWITTER, SNAPCHAT AND MORE ©2017 EMARKETER INC. ALL RIGHTS RESERVED 11
Leading News & Media Publishers on InstagramWorldwide, Ranked by Number of Videos Posted, May 2016 & May 2017
May2016
May2017
Bleacher Report 432 479
Sports Illustrated 8 325
ESPN 101 249
BBC News 140 154
Complex 121 148
People Magazine 13 122
Fox News 101 119
Thrasher Magazine 103 100
Time 7 68
Inked Magazine 33 63
Note: English-language content onlySource: NewsWhip, "What You Need to Know About Instagram," Aug 22,2017230449 www.eMarketer.com
Executives underscored Instagram’s integration with parent company Facebook as well as its growing effectiveness as a direct-response channel.
EXPERT INSIGHTS “If there’s a retail component to the campaign, having users [be able to] click and purchase is very useful. It’s still within the Instagram UI, but it will drive to that brand’s site, [where] the user can purchase.” —Tom Alexander, PK4 Media
“Instagram is similar to Facebook. We look at overall engagement and clickthrough rate. It’s also connected to Facebook Ads manager, meaning the same key metric used for Facebook videos can be applied to Instagram.” —Leah Woolford, USDM Holdings
Although Twitter showed better-than-expected user
growth in 1H 2017, its ad revenue outlook is mixed.
eMarketer’s latest forecast, published in September
2017, projects a slight increase in Twitter’s worldwide
ad revenues, climbing to $2.12 billion in 2019 from
$2.07 billion in 2017.
billions and % of totalTwitter Ad Revenues, US vs. Non-US, 2016-2019
US
—% of worldwide total
Non-US
—% of worldwide total
Worldwide
2016
$1.36
60.5%
$0.89
39.5%
$2.25
2017
$1.21
58.7%
$0.85
41.3%
$2.07
2018
$1.16
56.9%
$0.88
43.1%
$2.04
2019
$1.16
54.5%
$0.97
45.5%
$2.12
Note: paid advertising only; excludes spending by marketers that goestoward developing or maintaining a Twitter presence; net ad revenues aftercompany pays traffic acquisition costs (TAC) to partner sites; includes adspending on tablets; excludes SMS, MMS and P2P messaging-basedadvertising; numbers may not add up to total due to roundingSource: eMarketer, Sep 2017230285 www.eMarketer.com
However, there are caveats to this data:
■ Twitter’s ad revenue growth will be minuscule, and it will come exclusively from outside the US—which remains its core market, at over 50% of total ad revenues. During the forecast period, Twitter’s US business will trend downward.
■ If one looks at the data going back to 2016, growth will be negative both in the US and worldwide. This is the first time since eMarketer started tracking Twitter that we are projecting a decline in its ad business for any given forecast period.
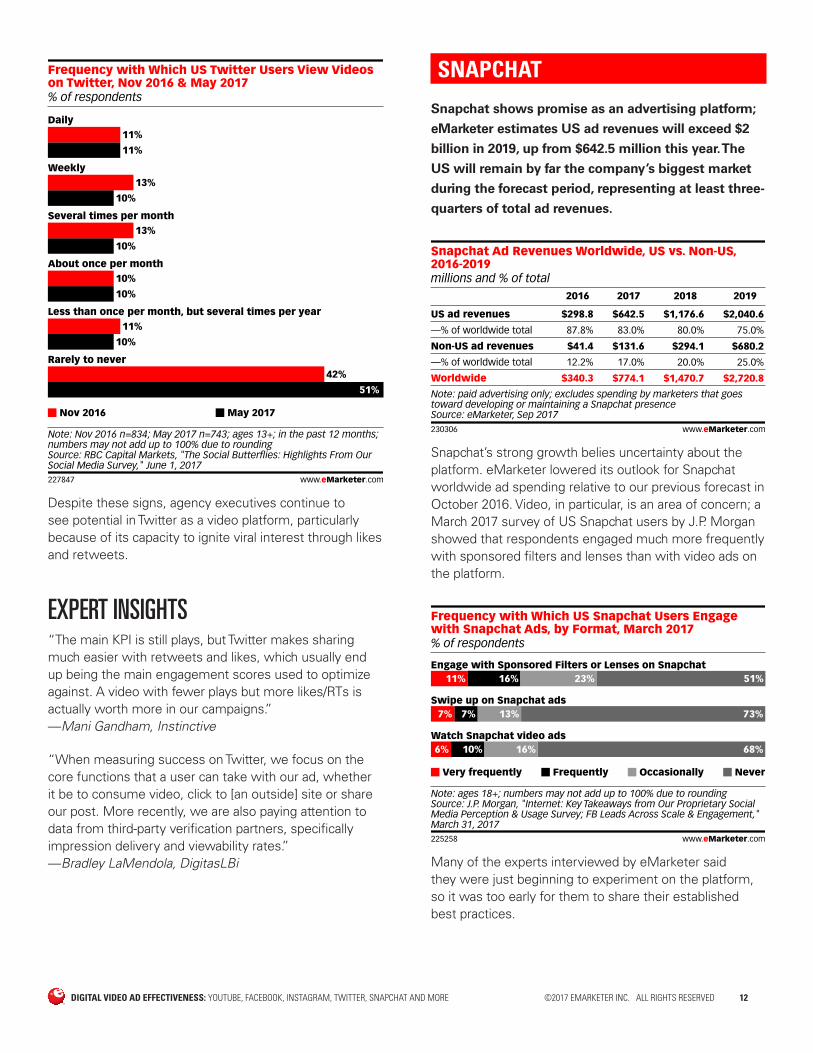
Those aren’t the only worrisome stats for Twitter. An RBC Capital Markets study comparing usage in November 2016 and May 2017 found that the percentage of US Twitter users who “rarely or never” viewed videos on the platform actually increased, rising from 42% to 51%. And among those who did watch, the percentage of respondents who viewed video clips weekly or several times per month dipped by 3 percentage points during that span.
DIGITAL VIDEO AD EFFECTIVENESS: YOUTUBE, FACEBOOK, INSTAGRAM, TWITTER, SNAPCHAT AND MORE ©2017 EMARKETER INC. ALL RIGHTS RESERVED 12
% of respondents
Frequency with Which US Twitter Users View Videoson Twitter, Nov 2016 & May 2017
Daily11%
11%
Weekly13%
10%
Several times per month13%
10%
About once per month10%
10%
Less than once per month, but several times per year11%
10%
Rarely to never42%
51%
Nov 2016 May 2017
Note: Nov 2016 n=834; May 2017 n=743; ages 13+; in the past 12 months;numbers may not add up to 100% due to roundingSource: RBC Capital Markets, "The Social Butterflies: Highlights From OurSocial Media Survey," June 1, 2017227847 www.eMarketer.com
Despite these signs, agency executives continue to see potential in Twitter as a video platform, particularly because of its capacity to ignite viral interest through likes and retweets.
EXPERT INSIGHTS “The main KPI is still plays, but Twitter makes sharing much easier with retweets and likes, which usually end up being the main engagement scores used to optimize against. A video with fewer plays but more likes/RTs is actually worth more in our campaigns.” —Mani Gandham, Instinctive
“When measuring success on Twitter, we focus on the core functions that a user can take with our ad, whether it be to consume video, click to [an outside] site or share our post. More recently, we are also paying attention to data from third-party verification partners, specifically impression delivery and viewability rates.” —Bradley LaMendola, DigitasLBi
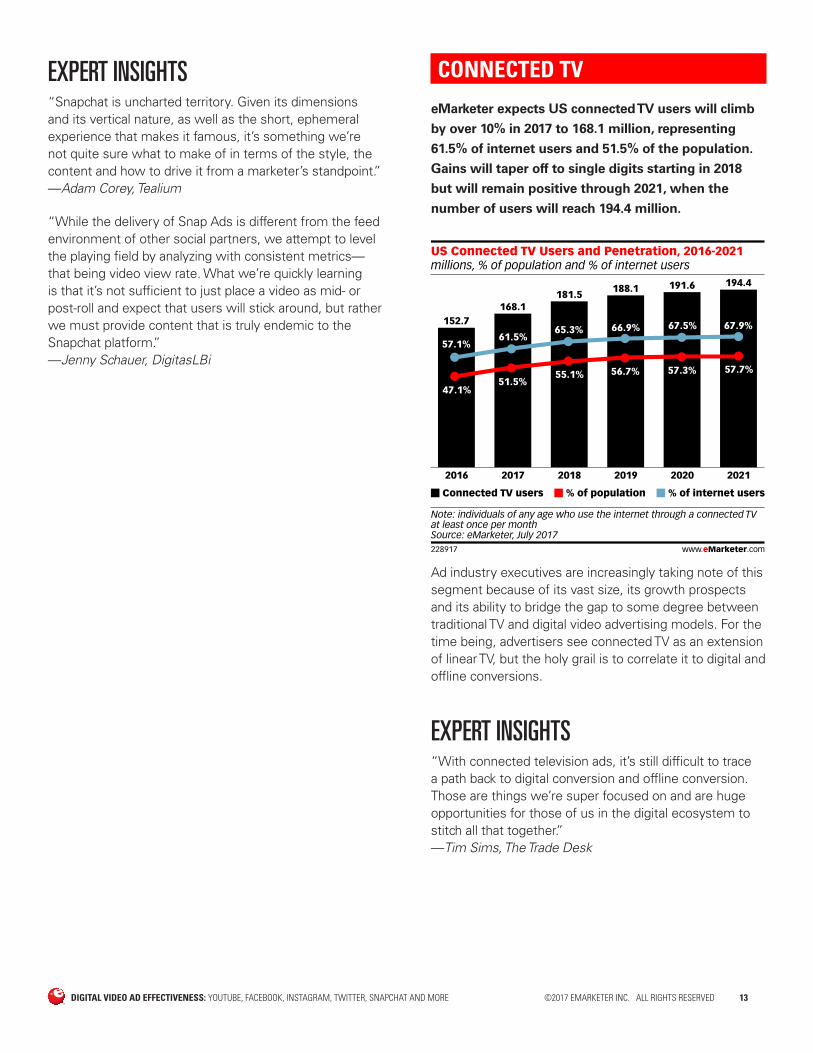
SNAPCHAT
Snapchat shows promise as an advertising platform;
eMarketer estimates US ad revenues will exceed $2
billion in 2019, up from $642.5 million this year. The
US will remain by far the company’s biggest market
during the forecast period, representing at least three-
quarters of total ad revenues.
millions and % of total
Snapchat Ad Revenues Worldwide, US vs. Non-US,2016-2019
US ad revenues
—% of worldwide total
Non-US ad revenues
—% of worldwide total
Worldwide
2016
$298.8
87.8%
$41.4
12.2%
$340.3
2017
$642.5
83.0%
$131.6
17.0%
$774.1
2018
$1,176.6
80.0%
$294.1
20.0%
$1,470.7
2019
$2,040.6
75.0%
$680.2
25.0%
$2,720.8
Note: paid advertising only; excludes spending by marketers that goestoward developing or maintaining a Snapchat presenceSource: eMarketer, Sep 2017230306 www.eMarketer.com
Snapchat’s strong growth belies uncertainty about the platform. eMarketer lowered its outlook for Snapchat worldwide ad spending relative to our previous forecast in October 2016. Video, in particular, is an area of concern; a March 2017 survey of US Snapchat users by J.P. Morgan showed that respondents engaged much more frequently with sponsored filters and lenses than with video ads on the platform.
% of respondents
Frequency with Which US Snapchat Users Engagewith Snapchat Ads, by Format, March 2017
Engage with Sponsored Filters or Lenses on Snapchat11% 16% 23% 51%
Swipe up on Snapchat ads7% 7% 13% 73%
Watch Snapchat video ads6% 10% 16% 68%
Very frequently Frequently Occasionally Never
Note: ages 18+; numbers may not add up to 100% due to roundingSource: J.P. Morgan, "Internet: Key Takeaways from Our Proprietary SocialMedia Perception & Usage Survey; FB Leads Across Scale & Engagement,"March 31, 2017225258 www.eMarketer.com
Many of the experts interviewed by eMarketer said they were just beginning to experiment on the platform, so it was too early for them to share their established best practices.
DIGITAL VIDEO AD EFFECTIVENESS: YOUTUBE, FACEBOOK, INSTAGRAM, TWITTER, SNAPCHAT AND MORE ©2017 EMARKETER INC. ALL RIGHTS RESERVED 13
EXPERT INSIGHTS “Snapchat is uncharted territory. Given its dimensions and its vertical nature, as well as the short, ephemeral experience that makes it famous, it’s something we’re not quite sure what to make of in terms of the style, the content and how to drive it from a marketer’s standpoint.” —Adam Corey, Tealium
“While the delivery of Snap Ads is different from the feed environment of other social partners, we attempt to level the playing field by analyzing with consistent metrics—that being video view rate. What we’re quickly learning is that it’s not sufficient to just place a video as mid- or post-roll and expect that users will stick around, but rather we must provide content that is truly endemic to the Snapchat platform.” —Jenny Schauer, DigitasLBi
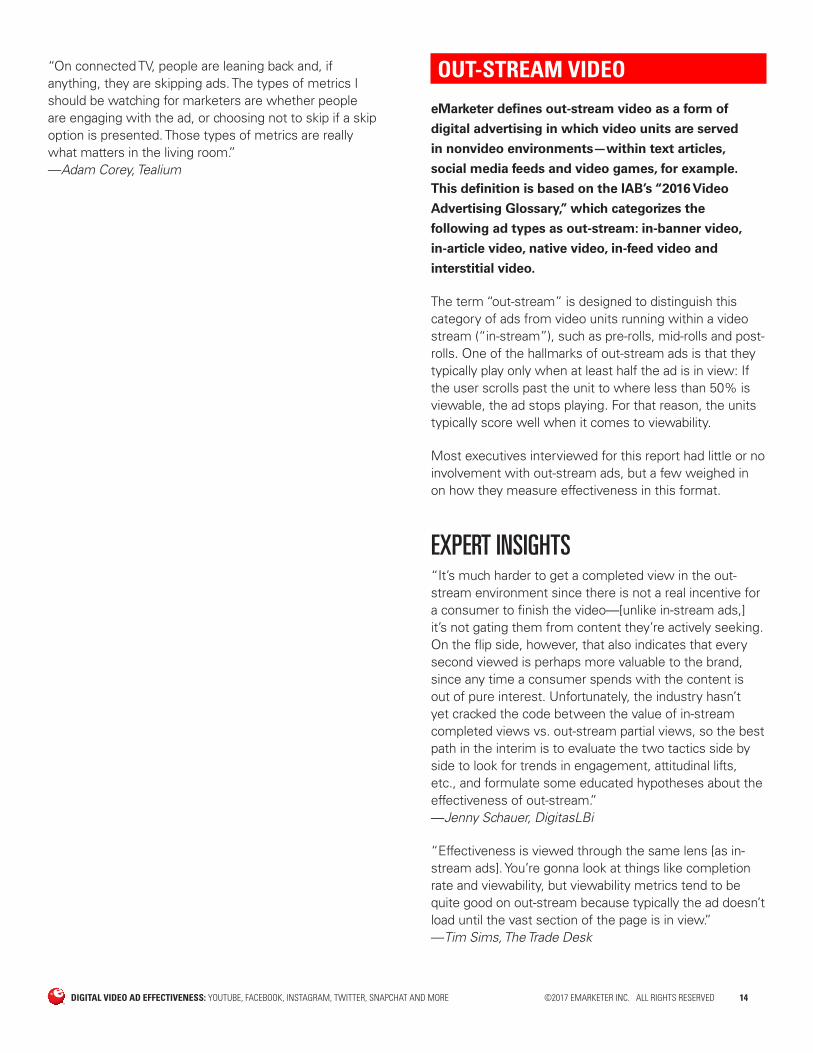
CONNECTED TV
eMarketer expects US connected TV users will climb
by over 10% in 2017 to 168.1 million, representing
61.5% of internet users and 51.5% of the population.
Gains will taper off to single digits starting in 2018
but will remain positive through 2021, when the
number of users will reach 194.4 million.
millions, % of population and % of internet usersUS Connected TV Users and Penetration, 2016-2021
2016
152.7
47.1%
57.1%
2017
168.1
51.5%
61.5%
2018
181.5
55.1%
65.3%
2019
188.1
56.7%
66.9%
2020
191.6
57.3%
67.5%
2021
194.4
57.7%
67.9%
Connected TV users % of population % of internet users
Note: individuals of any age who use the internet through a connected TVat least once per monthSource: eMarketer, July 2017228917 www.eMarketer.com
Ad industry executives are increasingly taking note of this segment because of its vast size, its growth prospects and its ability to bridge the gap to some degree between traditional TV and digital video advertising models. For the time being, advertisers see connected TV as an extension of linear TV, but the holy grail is to correlate it to digital and offline conversions.
EXPERT INSIGHTS “With connected television ads, it’s still difficult to trace a path back to digital conversion and offline conversion. Those are things we’re super focused on and are huge opportunities for those of us in the digital ecosystem to stitch all that together.” —Tim Sims, The Trade Desk
DIGITAL VIDEO AD EFFECTIVENESS: YOUTUBE, FACEBOOK, INSTAGRAM, TWITTER, SNAPCHAT AND MORE ©2017 EMARKETER INC. ALL RIGHTS RESERVED 14
“On connected TV, people are leaning back and, if anything, they are skipping ads. The types of metrics I should be watching for marketers are whether people are engaging with the ad, or choosing not to skip if a skip option is presented. Those types of metrics are really what matters in the living room.” —Adam Corey, Tealium
OUT-STREAM VIDEO
eMarketer defines out-stream video as a form of
digital advertising in which video units are served
in nonvideo environments—within text articles,
social media feeds and video games, for example.
This definition is based on the IAB’s “2016 Video
Advertising Glossary,” which categorizes the
following ad types as out-stream: in-banner video,
in-article video, native video, in-feed video and
interstitial video.
The term “out-stream” is designed to distinguish this category of ads from video units running within a video stream (“in-stream”), such as pre-rolls, mid-rolls and post-rolls. One of the hallmarks of out-stream ads is that they typically play only when at least half the ad is in view: If the user scrolls past the unit to where less than 50% is viewable, the ad stops playing. For that reason, the units typically score well when it comes to viewability.
Most executives interviewed for this report had little or no involvement with out-stream ads, but a few weighed in on how they measure effectiveness in this format.
EXPERT INSIGHTS “It’s much harder to get a completed view in the out-stream environment since there is not a real incentive for a consumer to finish the video—[unlike in-stream ads,] it’s not gating them from content they’re actively seeking. On the flip side, however, that also indicates that every second viewed is perhaps more valuable to the brand, since any time a consumer spends with the content is out of pure interest. Unfortunately, the industry hasn’t yet cracked the code between the value of in-stream completed views vs. out-stream partial views, so the best path in the interim is to evaluate the two tactics side by side to look for trends in engagement, attitudinal lifts, etc., and formulate some educated hypotheses about the effectiveness of out-stream.” —Jenny Schauer, DigitasLBi
“Effectiveness is viewed through the same lens [as in-stream ads]. You’re gonna look at things like completion rate and viewability, but viewability metrics tend to be quite good on out-stream because typically the ad doesn’t load until the vast section of the page is in view.” —Tim Sims, The Trade Desk

DIGITAL VIDEO AD EFFECTIVENESS: YOUTUBE, FACEBOOK, INSTAGRAM, TWITTER, SNAPCHAT AND MORE ©2017 EMARKETER INC. ALL RIGHTS RESERVED 15
EMARKETER INTERVIEWS
Why Different Video Ad Channels Require Different Success Metrics
Tom Alexander Founder and CEO
PK4 Media Interview conducted on July 26, 2017
Jenny Carrick Head of Paid Social
MediaCom Interview conducted on September 15, 2017
Adam Corey Vice President, Marketing
Tealium Interview conducted on September 14, 2017
Courtney Demko Media Director
SapientRazorfish Interview conducted on September 14, 2017
Vince Errico Chief Digital Officer
Trusted Media Brands Interview conducted on August 29, 2017
Justin Festa Chief Digital Officer
LittleThings Interview conducted on July 25, 2017
Aaron Frank Vice President, Strategy and Insights
Branded Entertainment Network Interview conducted on August 4, 2017
Mani Gandham Co-Founder and CEO
Instinctive Interview conducted on September 1, 2017
Jordan Hoffner CEO
Salon Media Group Interview conducted on September 18, 2017
Bradley LaMendola Vice President, Director, Paid Social
DigitasLBi Interview conducted on September 19, 2017
Belsasar Lepe Founder and Senior Vice President, Products and Solutions
Ooyala Interview conducted on August 9, 2017
Courtney McKlveen Head of US Field Sales
Oath Interview conducted on August 16, 2017
Michael Milligan Senior Director, Product and Solution Marketing
Limelight Networks Interview conducted on August 23, 2017
Jenny Schauer Vice President and Director, Media
DigitasLBi Interview conducted on August 4, 2017
Courtney Silverstein Vice President, Content Strategy and Social Media
Mizuho Americas Interview conducted on August 4, 2017
Tim Sims Senior Vice President, Inventory Partnerships
The Trade Desk Interview conducted on August 9, 2017
Rebecca Steinberg Herson Vice President, Marketing
Anodot Interview conducted on July 27, 2017
Leah Woolford Founder and CEO
USDM Holdings Interview conducted on August 10, 2017

DIGITAL VIDEO AD EFFECTIVENESS: YOUTUBE, FACEBOOK, INSTAGRAM, TWITTER, SNAPCHAT AND MORE ©2017 EMARKETER INC. ALL RIGHTS RESERVED 16
RELATED EMARKETER REPORTS
Q3 2017 Digital Video Trends: Monetization, Audience, Platforms and Content
US TV and Digital Video StatPack 2017: Ad Spending Data and Audience Trends for Broadcast, Pay and OTT TV
RELATED LINKS
Advertiser Perceptions
Animoto
BuzzSumo
DoubleClick
Extreme Reach
Interactive Advertising Bureau (IAB)
J.P. Morgan
Magid
Moat
NewsWhip
RBC Capital Markets
EDITORIAL AND PRODUCTION CONTRIBUTORS
Michael Balletti Copy EditorKatie Hamblin Chart Editorial ManagerDana Hill Director of ProductionEden Kelley Senior Chart EditorStephanie Meyer Senior Production ArtistHeather Price Managing Editor, ReportsJohn Rambow Executive Editor, ReportsErica Walker Copy Editor
Coverage of a Digital WorldeMarketer data and insights address how consumers spend time and money, and what marketers are doing to reach them in today’s digital world. Get a deeper look at eMarketer coverage, including our reports, benchmarks and forecasts, and charts.
Confidence in the NumbersOur unique approach of analyzing data from multiple research sources provides our customers with the most definitive answers available about the marketplace. Learn why.
Customer StoriesThe world’s top companies across every industry look to eMarketer first for information on digital marketing, media and commerce. Read more about how our clients use eMarketer to make smarter decisions.
Your account team is here to help:Email [email protected] to submit a request for research support, or contact [email protected] or 866-345-3864 to discuss any details related to your account.
The leading research firm for marketing in a digital world.