Embed Size (px)
Citation preview
Digital Literacy European Commission Working Paper and
Recommendations from Digital Literacy High-Level Expert Group
This Report presents the outcome of the Digital Literacy Review that the Commission has undertaken as part of the commitments made in the Riga Declaration in 2006 and in the eInclusion Communication in 2007 (COM(2007) 694 final). Acknowledgements The Report was prepared by DG Information Society and Media with the support of DG Education and Culture and Eurostat. It is based on the study "Public policies and stakeholders initiatives in support of Digital Literacy" commissioned by DG Information Society and Media in 2006 and undertaken by the Danish Technological Institute and on the Digital literacy module of the "Community Survey on ICT usage in Households and by Individuals" published by Eurostat in 2007. The Report was also supported by the Digital Literacy High-Level Expert Group, which was set up in preparation of the Commission Communication on eInclusion and of the 2008 eInclusion initiative to provide expertise and guidance to the Commission. The Group was invited to comment on the findings of the Review and to propose Recommendations for digital literacy policies. The Group is comprised of experts in digital literacy coming from industry, civil society and academia. The members are:
1. Ms. Elena Bonfiglioli, Director Corporate Responsibility, Microsoft EMEA 2. Mr. Alan Bennett, Senior Manager, K12, Apple Europe 3. Dr. Jim Devine, Director, IADT Institute of Art, Design & Technology, Ireland 4. Dr. David Buckingham, Professor of Education, Institute of Education, University
of London 5. Mr. Kevin Carey, Director, NGO Humanity 6. Dr. J.M. Perez Tornero, Director del Gabinete de Comunicación y Educación,
Universidad Autónoma de Barcelona 7. Dr. Roberto Carneiro, Professor, Universidade Católica Portuguesa 8. Dr. Allan Martin, Professor Emeritus, University of Glasgow 9. Dr. Tapio Varis, Professor of Vocational Education, University of Tampere and
UNESCO Chair in global e-learning with applications to multiple domains 10. Mr. Nikos Ioannou, EU Affairs Manager, ECDL Foundation 11. Dr. Carmen Stadelhofer, Academic Director and Director, Zentrum für
Allgemeine Wissenschaftliche Weiterbildung, University of Ulm 12. Ms. Dana Diminescu, Director of the IT/Migrations Scientific Program, Maison
des Sciences de l'Homme, Paris 13. Ms. Anne-Sophie Parent, Director General, AGE (European Older People’s
platform)
Contents Digital Literacy Report: a review for the i2010 eInclusion Initiative EUROPEAN COMMISSION STAFF WORKING DOCUMENT Digital Literacy: High-Level Expert Group Recommendations
1
Digital Literacy Report: a review for the i2010 eInclusion initiative COMMISSION STAFF WORKING DOCUMENT
2
TABLE OF CONTENTS
1. Introduction........................................................................................................................................ 4
2. Retrospective on Digital Literacy Initiatives.............................................................................. 5
2.1. Stage 1: digital literacy to improve access .................................................................................. 6
2.2 Stage 2: promoting basic ICT user skills ..................................................................................... 8
2.3. Stage 3: Improving quality of use and participation in the Information Society............. 13
2.4. Digital Literacy in Europe: Conclusions ....................................................................................... 15
3. Good Practices: Successful Implementation of Initiatives ................................................... 16
3.1. Motivation.......................................................................................................................................... 16
3.2. Affordability and Sustainability .................................................................................................. 17
3.3. Content and Delivery Mode............................................................................................................ 18
3.4. Accessibility and Usability ............................................................................................................ 19
4. Conclusions.........................................................................................................................................20
3
Summary
Digital Literacy is increasingly becoming an essential life skill and the inability to access or use ICT has effectively become a barrier to social integration and personal development. In response, EU Member States meeting at Riga in 2006 agreed on a series of eInclusion targets, including reducing by half the gap between digital literacy levels of disadvantaged groups and the average for the EU by 2010.
This Report presents the outcome of the Digital Literacy Review undertaken by the Commission as part of the commitments made in the Riga Declaration and in the eInclusion Communication. In the framework of this Review, 470 digital literacy initiatives across the EU were analysed together with the results of the digital literacy module of the Community Survey on ICT usage in Households and by Individuals. The main conclusions are:
(1) Member States have invested in large digital literacy programmes over the last ten years as part of their Lisbon priorities for information society and as a result regular Internet use has grown rapidly, particularly among young persons for whom skill levels and usage rates exceed that of the USA.
(2) Digital literacy remains a major challenge and more efforts need to be dedicated to supporting disadvantaged groups, in particular those over 55.
(3) There is evidence that secondary digital divides may be emerging in relation to quality of use and more needs to be done to increase the levels of confidence and trust in online transactions and the use of ICT for lifelong learning for all.
The Review also identified good practices to bring disadvantaged groups online and the key features are summarised, grouped according to: motivation, affordability and sustainability, content and delivery and accessibility and usability.
4
Digital LiteracyWhat is it? Digital literacy is the skills required to achieve digital competence, the confident and critical use of ICT for work, leisure, learning and communication. Digital Competence was included as one of the eight essential skills, in the Recommendation on Key Competences for Lifelong learning. How is it measured? Digital literacy is underpinned by basic technical use of computers and the Internet. To measure this, the Community Survey on ICT usage in Households and by Individuals asked if respondents had carried out six basic computer and six basic internet activities. Those who had done 5 or 6 are classed as high skilled, 3-4=medium; 1-2=low; those who had not carried out any of the activities, are considered as having no skills.
1. Introduction
In the Renewed Social Agenda for Europe1, the Commission highlighted how technological change, globalisation and an ageing population are transforming Europe’s societies and the role that ICTs can play to create more social and economic opportunities for citizens and improve their access to quality services. Digital literacy for all is essential to enable all Europeans to access these opportunities. The objective of this paper is to report on the Review of policies in Europe2 to promote digital literacy. Digital Literacy is one of the most important but also challenging areas to achieve an information society for all. Despite its inclusive effects, the information society has also created new divides. The knowledge society is becoming ubiquitous with more everyday activities, goods and services available electronically and, increasingly, only available online. Digital Literacy is increasingly becoming an essential life competence and the inability to access or use ICT has effectively become a barrier to social integration and personal development. Those without sufficient ICT skills are disadvantaged in the labour market and have less access to information to empower themselves as consumers, or as citizens saving time and money in offline activities and using online public services. In response to its growing importance, EU Member States agreed, in the Riga Ministerial
1 http://ec.europa.eu/social/main.jsp?catId=547&langId=en 2 The analysis covers the EU plus Norway and Iceland.
Declaration3, to a series of eInclusion targets, including reducing by half the gap between digital literacy levels of disadvantaged groups and the average for the EU by 2010. To give an overall benchmark, the i2010 Annual Report in 2007 found that 40% of the EU population have no Internet skills but higher percentages are to be seen in older age groups, people outside the labour force and those with a low level of
education. Since 2000, the European Union has stepped up its activities to improve eLearning and to develop skills. The eEurope Action Plan put eLearning and eSkills high on the political agenda and led to the eLearning Programme, which directly promoted Digital Literacy. This has continued under the renewed Lisbon Agenda, which
highlights Digital Literacy as a key area for policy intervention. The working definition of Digital literacy adopted in this paper (see box) is the skills required to achieve digital competence. It is underpinned by basic skills in ICT and the use of computers to retrieve, assess, store, produce, present and exchange information, and to communicate and participate in collaborative networks via the Internet. Digital competence is one of the eight essential competences that every European should have to prosper in a knowledge-based society and economy, as defined in the
3 http://ec.europa.eu/information_society/events/ict_riga_2006/do
c/declaration_riga.pdf
5
recent Recommendation on Key Competences for lifelong learning4. 2008 is the year of the eInclusion initiative and the Commission has conducted a Digital Literacy Review as part of its commitments made in the Riga Ministerial Declaration and the eInclusion Communication. This report presents the outcome of the Review. The main inputs to this Review were:
• a special module of digital literacy levels carried out as part of the Community Survey on ICT usage in Households and by Individuals5;
• an inventory of digital literacy policies in the Member States with an in-depth review of 30 cases identified as best practices6.
The Review was also supported by academic and industry experts through the Digital
4 Recommendation of the European Parliament and of the Council of
18 December 2006 on key competences for lifelong learning
(2006/962/EC). The eight key competences are: Communication in
the mother tongue; Communication in foreign languages; Mathematical
competence and basic competences in science and technology; Digital
competence; Learning to learn; Social and civic competences; Sense of
initiative and entrepreneurship; Cultural awareness and expression.
5 Community Survey on ICT usage in Households and by Individuals,
EUROSTAT, 2007. In 2007 the Community Survey included a module
on digital literacy levels. They were measured on the basis of
computer and internet activities declared by the households and
individuals interviewed. Computer activities are: a) Copying or moving
a file or folder; b) Using copy and paste tools to duplicate or move
information within a document; c) Using basic arithmetic formulas in a
spreadsheet; d) Compressing (or zipping) files; e) Connecting and
installing new devices, e.g. a printer or a modem; f) Writing a
computer program using a specialised programming language. Internet activities are: a) Using a search engine to find information;
b) Sending e-mails with attached files (documents, pictures, etc.); c)
Posting messages to chatrooms, newsgroups or an online discussion
forum; d) Using the Internet to make telephone calls; e) Using peer-
to-peer file sharing for exchanging movies, music, etc.; f) Creating a
web page. 6 Public policies and stakeholders initiatives in support of Digital
Literacy, European Commission, 2008.
Literacy High-Level Expert Group7 and by the Member States within the i2010 High-Level Group8. It also received the support of the Media Literacy Expert Group. Section 2 of this paper summarises how digital literacy has evolved over the last decade. Section 3 focuses on the approaches which have been shown to successfully address the needs of disadvantaged groups. 2. RETROSPECTIVE ON DIGITAL
LITERACY INITIATIVES
Digital literacy policies have evolved as the information society has developed in Europe, essentially in three stages. Firstly, the priority was given to access and connectivity; secondly, policies began to promote skills for basic computer and Internet use and lastly, more sophisticated and sustainable digital skills were drawn in. So far, most effort has been devoted to the first and second stages whereas the third stage, which promotes more advanced Internet use (including critical thinking, trust, confidence and multiplatform use) is only now starting in most countries. The overall assessment is positive with clear progress made in Internet regular use and computer and Internet skills but a lot remains to be done to extend these benefits to all sections of the population. A feature common to all countries is the lower level of digital literacy among the elderly, less educated, people outside the labour force, manual workers and those living in regions that are economically lagging behind. The largest gap is for those aged over 55. Compared with the USA, Europeans in this age group are far behind (by over 20%) and could benefit greatly over the next few years from digital literacy initiatives. There is also emerging evidence of a second digital divide in terms of quality of use: some users lack the skills to take advantage of the more advanced services available on the Internet and are unable to carry out online
7 http://ec.europa.eu/information_society/activities/einclusion/docs
/diglitgrpmandate.pdf 8 http://ec.europa.eu/information_society/activities/einclusion/parti
cipate/index_en.htm
6
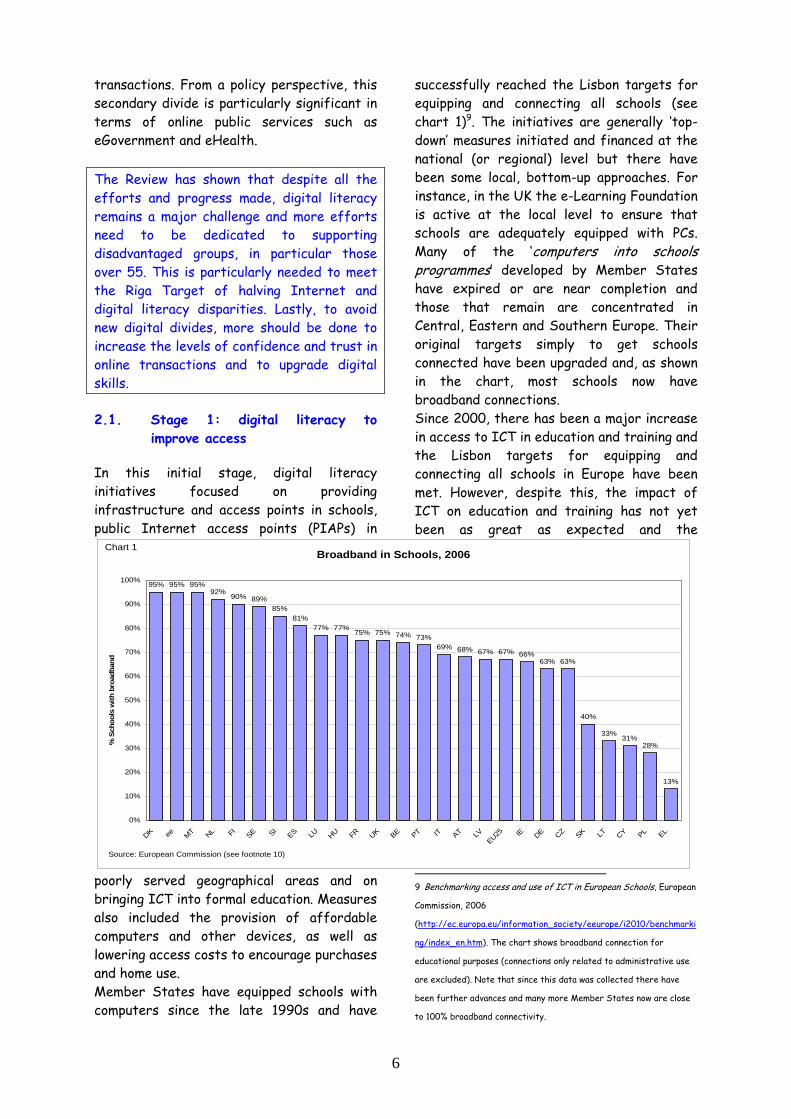
Broadband in Schools, 2006
95% 95% 95%92%
90% 89%85%
81%77% 77%
75% 75% 74% 73%69% 68% 67% 67% 66%
63% 63%
40%
33%31%
28%
13%
0%
10%
20%
30%
40%
50%
60%
70%
80%
90%
100%
DK ee MT NL FI SE SIES LU HU FR UK BE PT IT AT LV
EU25 IE DE CZ SK LT CY PL EL
% S
choo
ls w
ith b
road
band
Source: European Commission (see footnote 10)
Chart 1
transactions. From a policy perspective, this secondary divide is particularly significant in terms of online public services such as eGovernment and eHealth. The Review has shown that despite all the efforts and progress made, digital literacy remains a major challenge and more efforts need to be dedicated to supporting disadvantaged groups, in particular those over 55. This is particularly needed to meet the Riga Target of halving Internet and digital literacy disparities. Lastly, to avoid new digital divides, more should be done to increase the levels of confidence and trust in online transactions and to upgrade digital skills.
2.1. Stage 1: digital literacy to improve access
In this initial stage, digital literacy initiatives focused on providing infrastructure and access points in schools, public Internet access points (PIAPs) in
poorly served geographical areas and on bringing ICT into formal education. Measures also included the provision of affordable computers and other devices, as well as lowering access costs to encourage purchases and home use. Member States have equipped schools with computers since the late 1990s and have
successfully reached the Lisbon targets for equipping and connecting all schools (see chart 1)9. The initiatives are generally ‘top-down’ measures initiated and financed at the national (or regional) level but there have been some local, bottom-up approaches. For instance, in the UK the e-Learning Foundation is active at the local level to ensure that schools are adequately equipped with PCs. Many of the ‘computers into schools programmes’ developed by Member States have expired or are near completion and those that remain are concentrated in Central, Eastern and Southern Europe. Their original targets simply to get schools connected have been upgraded and, as shown in the chart, most schools now have broadband connections. Since 2000, there has been a major increase in access to ICT in education and training and the Lisbon targets for equipping and connecting all schools in Europe have been met. However, despite this, the impact of ICT on education and training has not yet been as great as expected and the
9 Benchmarking access and use of ICT in European Schools, European
Commission, 2006 (http://ec.europa.eu/information_society/eeurope/i2010/benchmarki
ng/index_en.htm). The chart shows broadband connection for
educational purposes (connections only related to administrative use
are excluded). Note that since this data was collected there have
been further advances and many more Member States now are close
to 100% broadband connectivity.
7
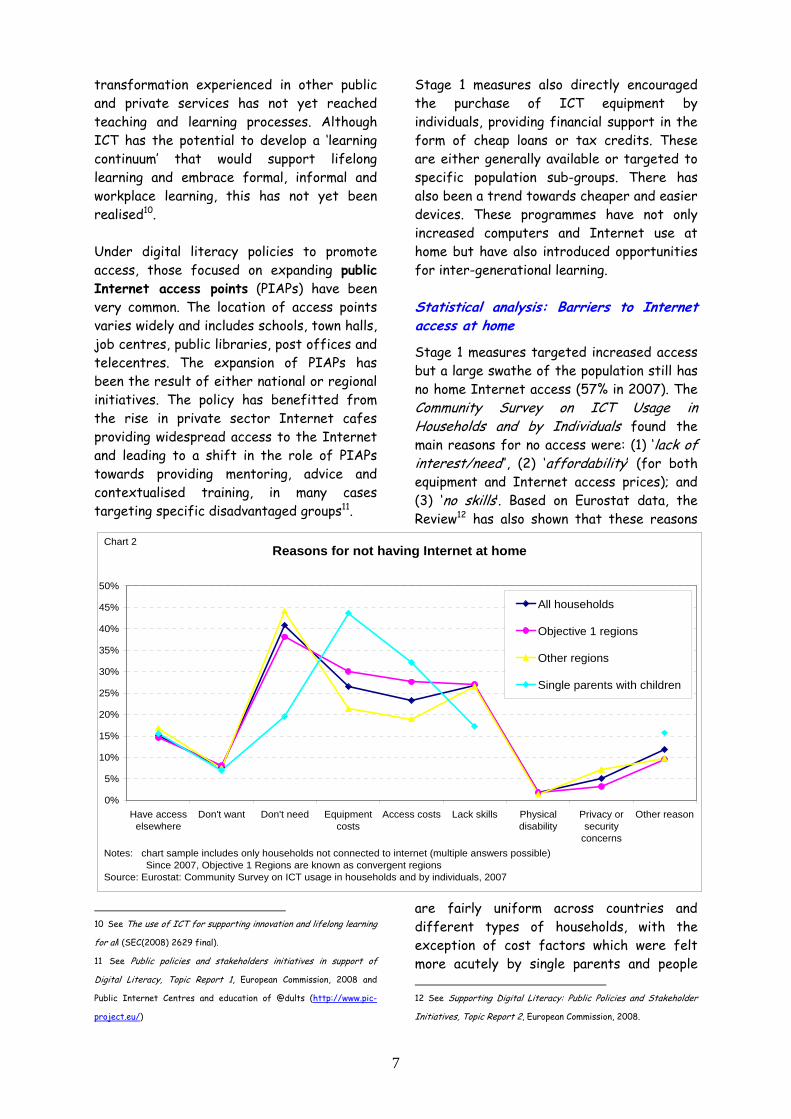
Reasons for not having Internet at home
0%
5%
10%
15%
20%
25%
30%
35%
40%
45%
50%
Have accesselsewhere
Don't want Don't need Equipmentcosts
Access costs Lack skills Physicaldisability
Privacy orsecurity
concerns
Other reason
All households
Objective 1 regions
Other regions
Single parents with children
Chart 2
Notes: chart sample includes only households not connected to internet (multiple answers possible) Since 2007, Objective 1 Regions are known as convergent regionsSource: Eurostat: Community Survey on ICT usage in households and by individuals, 2007
transformation experienced in other public and private services has not yet reached teaching and learning processes. Although ICT has the potential to develop a ‘learning continuum’ that would support lifelong learning and embrace formal, informal and workplace learning, this has not yet been realised10. Under digital literacy policies to promote access, those focused on expanding public Internet access points (PIAPs) have been very common. The location of access points varies widely and includes schools, town halls, job centres, public libraries, post offices and telecentres. The expansion of PIAPs has been the result of either national or regional initiatives. The policy has benefitted from the rise in private sector Internet cafes providing widespread access to the Internet and leading to a shift in the role of PIAPs towards providing mentoring, advice and contextualised training, in many cases targeting specific disadvantaged groups11.
10 See The use of ICT for supporting innovation and lifelong learning
for all (SEC(2008) 2629 final). 11 See Public policies and stakeholders initiatives in support of
Digital Literacy, Topic Report 1, European Commission, 2008 and
Public Internet Centres and education of @dults (http://www.pic-
project.eu/)
Stage 1 measures also directly encouraged the purchase of ICT equipment by individuals, providing financial support in the form of cheap loans or tax credits. These are either generally available or targeted to specific population sub-groups. There has also been a trend towards cheaper and easier devices. These programmes have not only increased computers and Internet use at home but have also introduced opportunities for inter-generational learning. Statistical analysis: Barriers to Internet access at home
Stage 1 measures targeted increased access but a large swathe of the population still has no home Internet access (57% in 2007). The Community Survey on ICT Usage in Households and by Individuals found the main reasons for no access were: (1) ‘lack of interest/need’’, (2) ‘affordability’ (for both equipment and Internet access prices); and (3) ‘no skills’. Based on Eurostat data, the Review12 has also shown that these reasons
are fairly uniform across countries and different types of households, with the exception of cost factors which were felt more acutely by single parents and people 12 See Supporting Digital Literacy: Public Policies and Stakeholder
Initiatives, Topic Report 2, European Commission, 2008.
8
Internet growth 2005-2007
0
10
20
30
40
50
60
70
80
90
100
RO BG EL IT CY PT PL
CZ
ES LT HU SI
EU
27 IE SK LV FR EE AT
BE
DE
UK LU FI SE
DK NL
NO IS
% re
glua
r use
rs
2005 2007
Chart 3
Source. Eurostat: Community Survey on ICT usage in households and by individuals, 2005 and 2007
living in regions lagging behind. There are also some variations: in Hungary, Estonia, Portugal, Romania and Bulgaria, ‘equipment and access costs’ are equal or higher than ‘lack of interest/need’ as a barrier. There is also a wide variation among Member States in the proportion of the population citing such barriers. The finding that 41% of households respond they don’t need the Internet will partly reflect choice and partly unfamiliarity with its benefits and the services available. In response, many countries are launching awareness campaigns to ensure citizens can make an informed choice. In relation to affordability, the price of equipment was felt to be slightly more of a problem than access prices (27% compared to 23%, respectively). A gradual reduction in access and equipment costs, due in part to competitive markets promoted by the regulatory framework, will reduce this barrier. The importance of digital literacy policies is confirmed by the high proportion citing lack of skills as one of the main barriers to having Internet at home.
The Eurostat surveys on ICT use illustrate how rapidly Internet usage has increased throughout Europe. Chart 3 shows growth by Member State between 2005 and 2007 for
people 16-74 years old. For example, Ireland saw a 20% increase and even those at the top of the scale have continued to increase the number of users (e.g. Finland where 75% of the population are now users and the numbers rose between 2005 and 2007 by 13%). In these countries, growth was achieved by extending Internet use to groups such as the unemployed with formerly lower rates of use, which is an illustration of the success of digital literacy programmes. Increased usage by disadvantaged groups is illustrated in more detail in chart 5.
2.2. Stage 2: promoting basic ICT user skills
Digital literacy initiatives in stage 2 focused on teaching computer and Internet usage skills with basic introductions to operating systems and office applications and to some Internet activities (mainly email and web search). Initially such measures were offered to the general public, but increasingly, as Internet use increased in the countries, they were tailored to specific
disadvantaged groups. More recently, the Review identified some more innovative initiatives going beyond basic Internet skills and extending to social web tools and
9
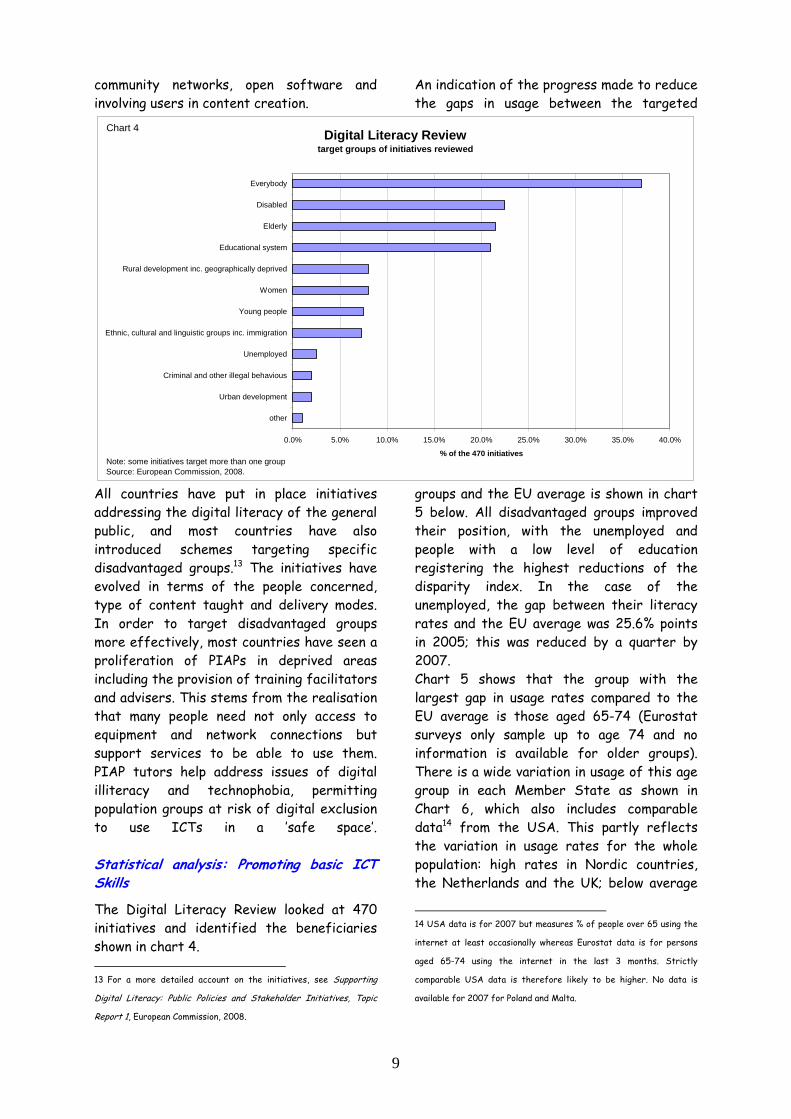
Digital Literacy Reviewtarget groups of initiatives reviewed
0.0% 5.0% 10.0% 15.0% 20.0% 25.0% 30.0% 35.0% 40.0%
other
Urban development
Criminal and other illegal behavious
Unemployed
Ethnic, cultural and linguistic groups inc. immigration
Young people
Women
Rural development inc. geographically deprived
Educational system
Elderly
Disabled
Everybody
% of the 470 initiativesNote: some initiatives target more than one groupSource: European Commission, 2008.
Chart 4
community networks, open software and involving users in content creation.
All countries have put in place initiatives addressing the digital literacy of the general public, and most countries have also introduced schemes targeting specific disadvantaged groups.13 The initiatives have evolved in terms of the people concerned, type of content taught and delivery modes. In order to target disadvantaged groups more effectively, most countries have seen a proliferation of PIAPs in deprived areas including the provision of training facilitators and advisers. This stems from the realisation that many people need not only access to equipment and network connections but support services to be able to use them. PIAP tutors help address issues of digital illiteracy and technophobia, permitting population groups at risk of digital exclusion to use ICTs in a ’safe space’. Statistical analysis: Promoting basic ICT Skills
The Digital Literacy Review looked at 470 initiatives and identified the beneficiaries shown in chart 4. 13 For a more detailed account on the initiatives, see Supporting
Digital Literacy: Public Policies and Stakeholder Initiatives, Topic
Report 1, European Commission, 2008.
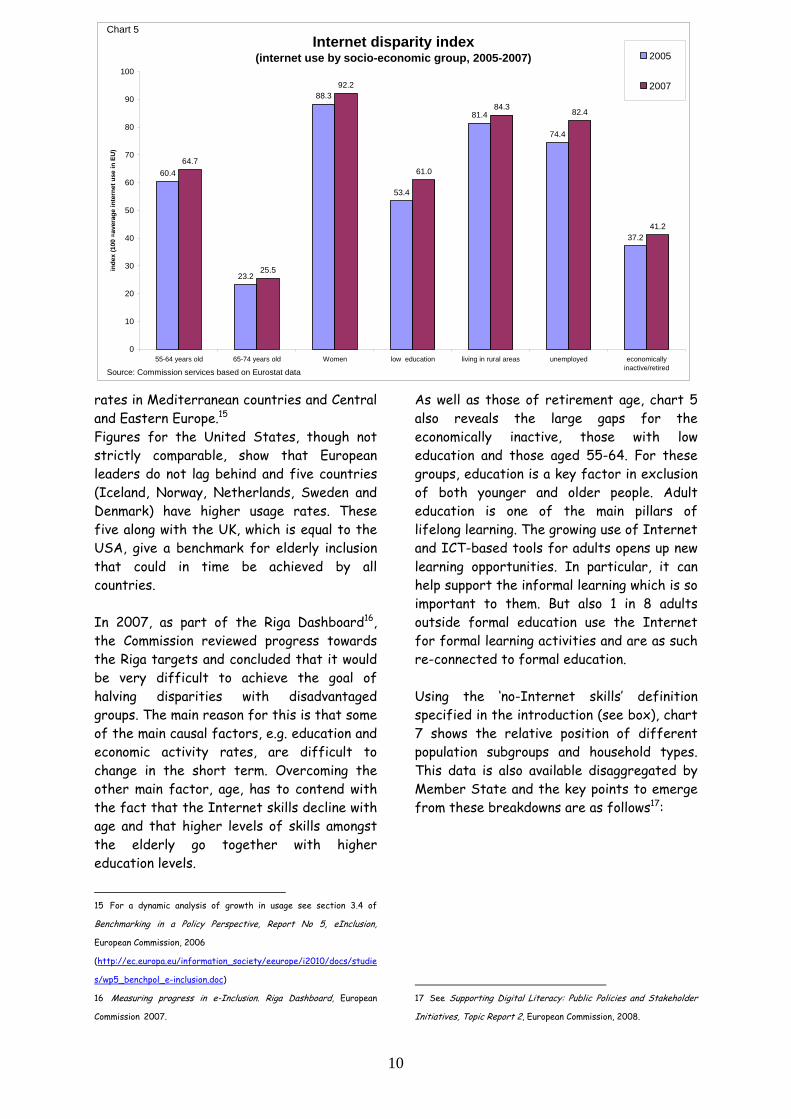
An indication of the progress made to reduce the gaps in usage between the targeted
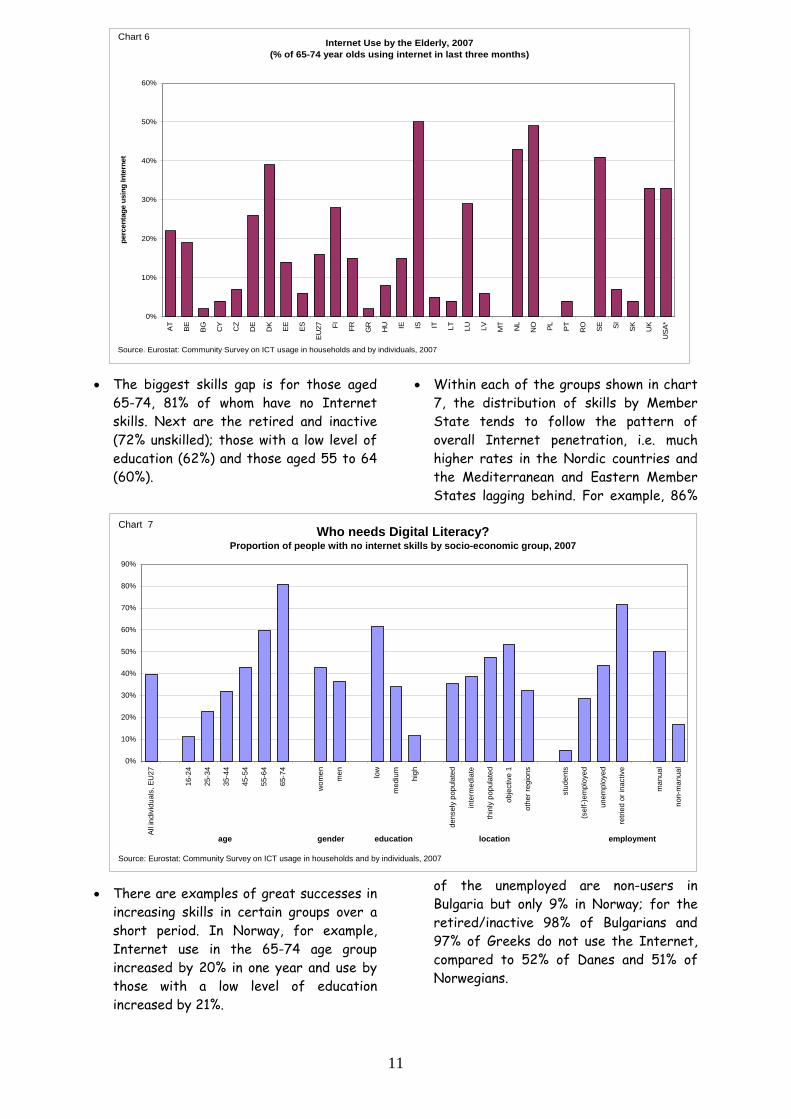
groups and the EU average is shown in chart 5 below. All disadvantaged groups improved their position, with the unemployed and people with a low level of education registering the highest reductions of the disparity index. In the case of the unemployed, the gap between their literacy rates and the EU average was 25.6% points in 2005; this was reduced by a quarter by 2007. Chart 5 shows that the group with the largest gap in usage rates compared to the EU average is those aged 65-74 (Eurostat surveys only sample up to age 74 and no information is available for older groups). There is a wide variation in usage of this age group in each Member State as shown in Chart 6, which also includes comparable data14 from the USA. This partly reflects the variation in usage rates for the whole population: high rates in Nordic countries, the Netherlands and the UK; below average
14 USA data is for 2007 but measures % of people over 65 using the
internet at least occasionally whereas Eurostat data is for persons
aged 65-74 using the internet in the last 3 months. Strictly
comparable USA data is therefore likely to be higher. No data is
available for 2007 for Poland and Malta.
10
Internet disparity index(internet use by socio-economic group, 2005-2007)
60.4
23.2
88.3
53.4
81.4
74.4
37.2
64.7
25.5
61.0
84.3 82.4
41.2
92.2
0
10
20
30
40
50
60
70
80
90
100
55-64 years old 65-74 years old Women low education living in rural areas unemployed economicallyinactive/retired
inde
x (1
00 =
aver
age
inte
rnet
use
in E
U)
2005
2007
Chart 5
Source: Commission services based on Eurostat data
rates in Mediterranean countries and Central and Eastern Europe.15 Figures for the United States, though not strictly comparable, show that European leaders do not lag behind and five countries (Iceland, Norway, Netherlands, Sweden and Denmark) have higher usage rates. These five along with the UK, which is equal to the USA, give a benchmark for elderly inclusion that could in time be achieved by all countries. In 2007, as part of the Riga Dashboard16, the Commission reviewed progress towards the Riga targets and concluded that it would be very difficult to achieve the goal of halving disparities with disadvantaged groups. The main reason for this is that some of the main causal factors, e.g. education and economic activity rates, are difficult to change in the short term. Overcoming the other main factor, age, has to contend with the fact that the Internet skills decline with age and that higher levels of skills amongst the elderly go together with higher education levels.
15 For a dynamic analysis of growth in usage see section 3.4 of
Benchmarking in a Policy Perspective, Report No 5, eInclusion,
European Commission, 2006
(http://ec.europa.eu/information_society/eeurope/i2010/docs/studie
s/wp5_benchpol_e-inclusion.doc) 16 Measuring progress in e-Inclusion. Riga Dashboard, European
Commission 2007.
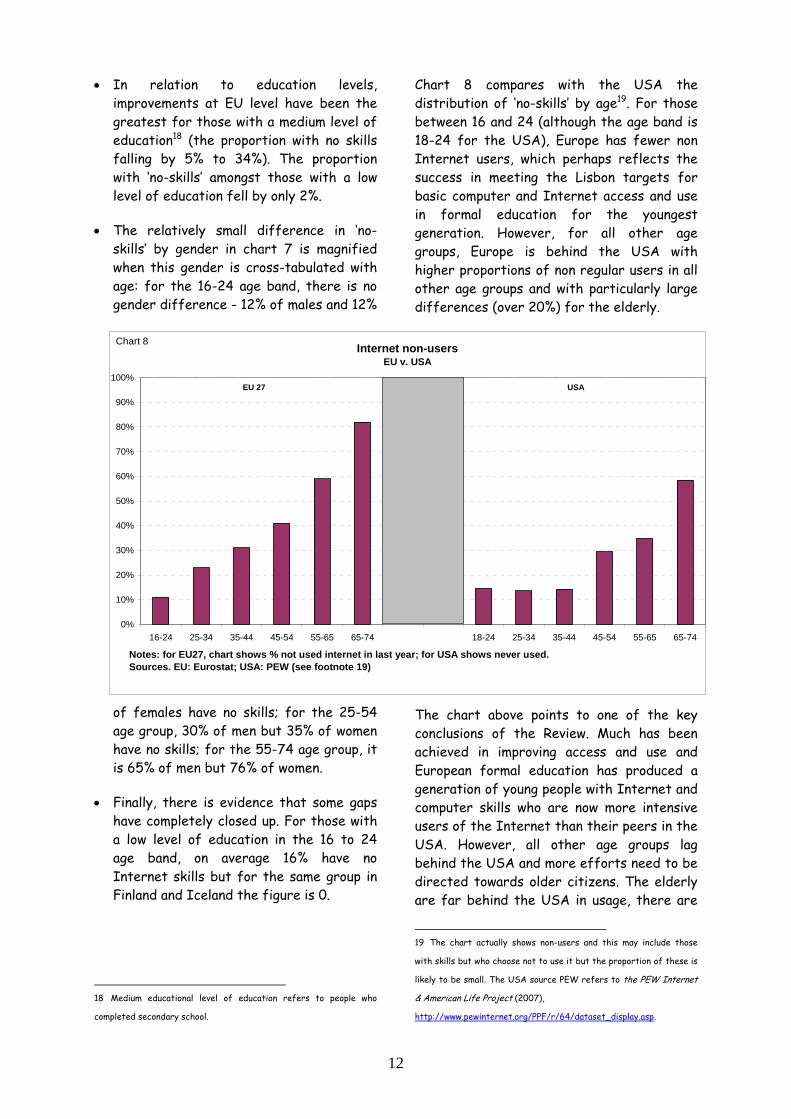
As well as those of retirement age, chart 5 also reveals the large gaps for the economically inactive, those with low education and those aged 55-64. For these groups, education is a key factor in exclusion of both younger and older people. Adult education is one of the main pillars of lifelong learning. The growing use of Internet and ICT-based tools for adults opens up new learning opportunities. In particular, it can help support the informal learning which is so important to them. But also 1 in 8 adults outside formal education use the Internet for formal learning activities and are as such re-connected to formal education. Using the ‘no-Internet skills’ definition specified in the introduction (see box), chart 7 shows the relative position of different population subgroups and household types. This data is also available disaggregated by Member State and the key points to emerge from these breakdowns are as follows17:
17 See Supporting Digital Literacy: Public Policies and Stakeholder
Initiatives, Topic Report 2, European Commission, 2008.
11
Internet Use by the Elderly, 2007(% of 65-74 year olds using internet in last three months)
0%
10%
20%
30%
40%
50%
60%
AT
BE
BG CY
CZ
DE
DK
EE
ES
EU27 FI FR GR
HU IE IS IT LT LU LV MT
NL
NO PL
PT
RO SE SI
SK
UK
US
A*
perc
enta
ge u
sing
Inte
rnet
Chart 6
Source. Eurostat: Community Survey on ICT usage in households and by individuals, 2007
Who needs Digital Literacy?Proportion of people with no internet skills by socio-economic group, 2007
0%
10%
20%
30%
40%
50%
60%
70%
80%
90%
All
indi
vidu
als,
EU
27
16-2
4
25-3
4
35-4
4
45-5
4
55-6
4
65-7
4
wom
en
men low
med
ium
high
dens
ely
popu
late
d
inte
rmed
iate
thin
ly p
opul
ated
obje
ctiv
e 1
othe
r reg
ions
stud
ents
(sel
f-)em
ploy
ed
unem
ploy
ed
retri
ed o
r ina
ctiv
e
man
ual
non-
man
ual
Chart 7
Source: Eurostat: Community Survey on ICT usage in households and by individuals, 2007
age gender education location employment
• The biggest skills gap is for those aged 65-74, 81% of whom have no Internet skills. Next are the retired and inactive (72% unskilled); those with a low level of education (62%) and those aged 55 to 64 (60%).
• There are examples of great successes in increasing skills in certain groups over a short period. In Norway, for example, Internet use in the 65-74 age group increased by 20% in one year and use by those with a low level of education increased by 21%.
• Within each of the groups shown in chart 7, the distribution of skills by Member State tends to follow the pattern of overall Internet penetration, i.e. much higher rates in the Nordic countries and the Mediterranean and Eastern Member States lagging behind. For example, 86%
of the unemployed are non-users in Bulgaria but only 9% in Norway; for the retired/inactive 98% of Bulgarians and 97% of Greeks do not use the Internet, compared to 52% of Danes and 51% of Norwegians.
12
Internet non-usersEU v. USA
0%
10%
20%
30%
40%
50%
60%
70%
80%
90%
100%
16-24 25-34 35-44 45-54 55-65 65-74 18-24 25-34 35-44 45-54 55-65 65-74
Notes: for EU27, chart shows % not used internet in last year; for USA shows never used.Sources. EU: Eurostat; USA: PEW (see footnote 19)
EU 27 USA
Chart 8
• In relation to education levels, improvements at EU level have been the greatest for those with a medium level of education18 (the proportion with no skills falling by 5% to 34%). The proportion with ‘no-skills’ amongst those with a low level of education fell by only 2%.
• The relatively small difference in ‘no-skills’ by gender in chart 7 is magnified when this gender is cross-tabulated with age: for the 16-24 age band, there is no gender difference - 12% of males and 12%
of females have no skills; for the 25-54 age group, 30% of men but 35% of women have no skills; for the 55-74 age group, it is 65% of men but 76% of women.
• Finally, there is evidence that some gaps have completely closed up. For those with a low level of education in the 16 to 24 age band, on average 16% have no Internet skills but for the same group in Finland and Iceland the figure is 0.
18 Medium educational level of education refers to people who
completed secondary school.
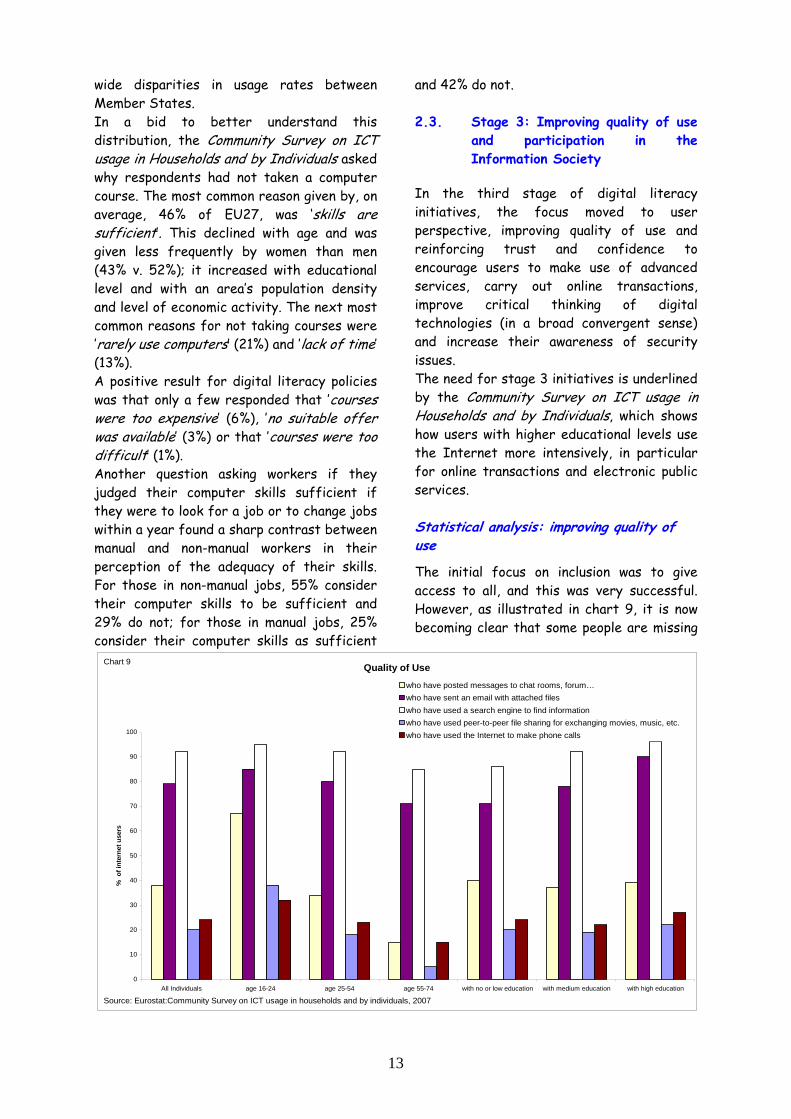
Chart 8 compares with the USA the distribution of ‘no-skills’ by age19. For those between 16 and 24 (although the age band is 18-24 for the USA), Europe has fewer non Internet users, which perhaps reflects the success in meeting the Lisbon targets for basic computer and Internet access and use in formal education for the youngest generation. However, for all other age groups, Europe is behind the USA with higher proportions of non regular users in all other age groups and with particularly large differences (over 20%) for the elderly.
The chart above points to one of the key conclusions of the Review. Much has been achieved in improving access and use and European formal education has produced a generation of young people with Internet and computer skills who are now more intensive users of the Internet than their peers in the USA. However, all other age groups lag behind the USA and more efforts need to be directed towards older citizens. The elderly are far behind the USA in usage, there are
19 The chart actually shows non-users and this may include those
with skills but who choose not to use it but the proportion of these is
likely to be small. The USA source PEW refers to the PEW Internet
& American Life Project (2007),
http://www.pewinternet.org/PPF/r/64/dataset_display.asp.
13
Quality of Use
0
10
20
30
40
50
60
70
80
90
100
All Individuals age 16-24 age 25-54 age 55-74 with no or low education with medium education with high education
% o
f int
erne
t use
rs
who have posted messages to chat rooms, forum…who have sent an email with attached fileswho have used a search engine to find informationwho have used peer-to-peer file sharing for exchanging movies, music, etc.who have used the Internet to make phone calls
Source: Eurostat:Community Survey on ICT usage in households and by individuals, 2007
Chart 9
wide disparities in usage rates between Member States. In a bid to better understand this distribution, the Community Survey on ICT usage in Households and by Individuals asked why respondents had not taken a computer course. The most common reason given by, on average, 46% of EU27, was ‘skills are sufficient’. This declined with age and was given less frequently by women than men (43% v. 52%); it increased with educational level and with an area’s population density and level of economic activity. The next most common reasons for not taking courses were ’rarely use computers’ (21%) and ’lack of time’ (13%). A positive result for digital literacy policies was that only a few responded that ’courses were too expensive’ (6%), ’no suitable offer was available’ (3%) or that ’courses were too difficult’ (1%). Another question asking workers if they judged their computer skills sufficient if they were to look for a job or to change jobs within a year found a sharp contrast between manual and non-manual workers in their perception of the adequacy of their skills. For those in non-manual jobs, 55% consider their computer skills to be sufficient and 29% do not; for those in manual jobs, 25% consider their computer skills as sufficient
and 42% do not. 2.3. Stage 3: Improving quality of use
and participation in the Information Society
In the third stage of digital literacy initiatives, the focus moved to user perspective, improving quality of use and reinforcing trust and confidence to encourage users to make use of advanced services, carry out online transactions, improve critical thinking of digital technologies (in a broad convergent sense) and increase their awareness of security issues. The need for stage 3 initiatives is underlined by the Community Survey on ICT usage in Households and by Individuals, which shows how users with higher educational levels use the Internet more intensively, in particular for online transactions and electronic public services. Statistical analysis: improving quality of use
The initial focus on inclusion was to give access to all, and this was very successful. However, as illustrated in chart 9, it is now becoming clear that some people are missing
14
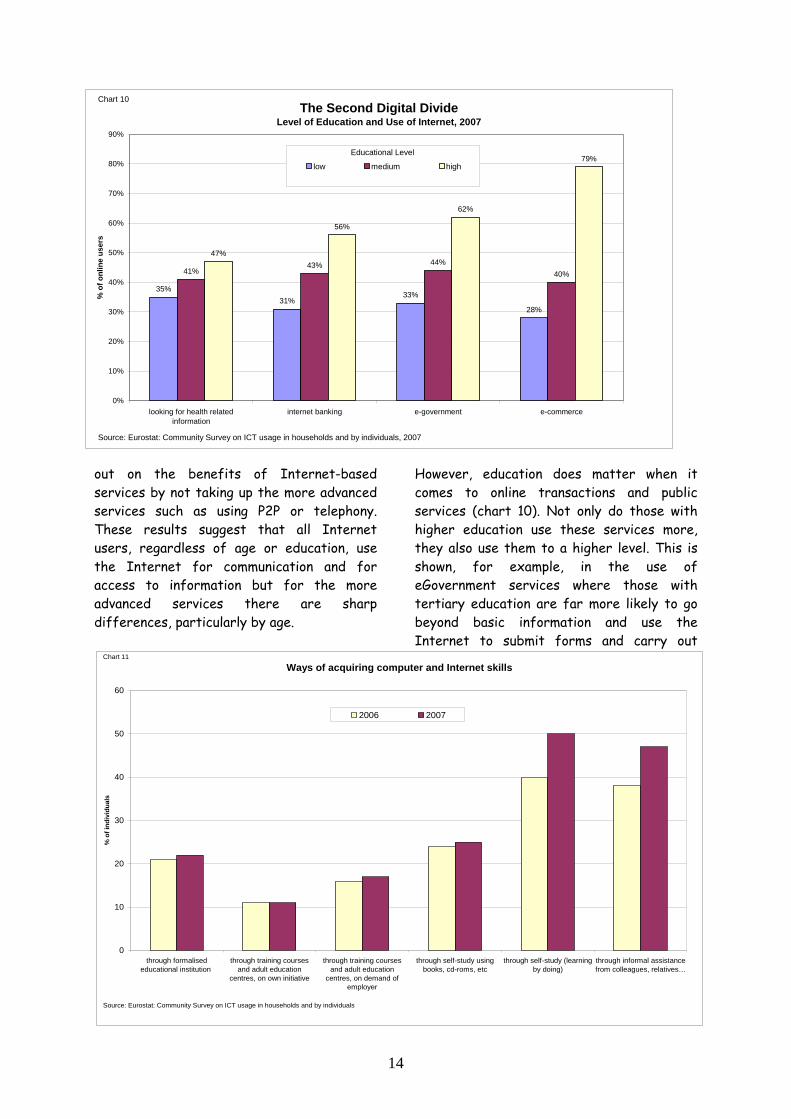
The Second Digital DivideLevel of Education and Use of Internet, 2007
35%31%
33%
28%
41%43% 44%
40%
47%
56%
62%
79%
0%
10%
20%
30%
40%
50%
60%
70%
80%
90%
looking for health relatedinformation
internet banking e-government e-commerce
% o
f onl
ine
user
s
low medium high
Educational Level
Chart 10
Source: Eurostat: Community Survey on ICT usage in households and by individuals, 2007
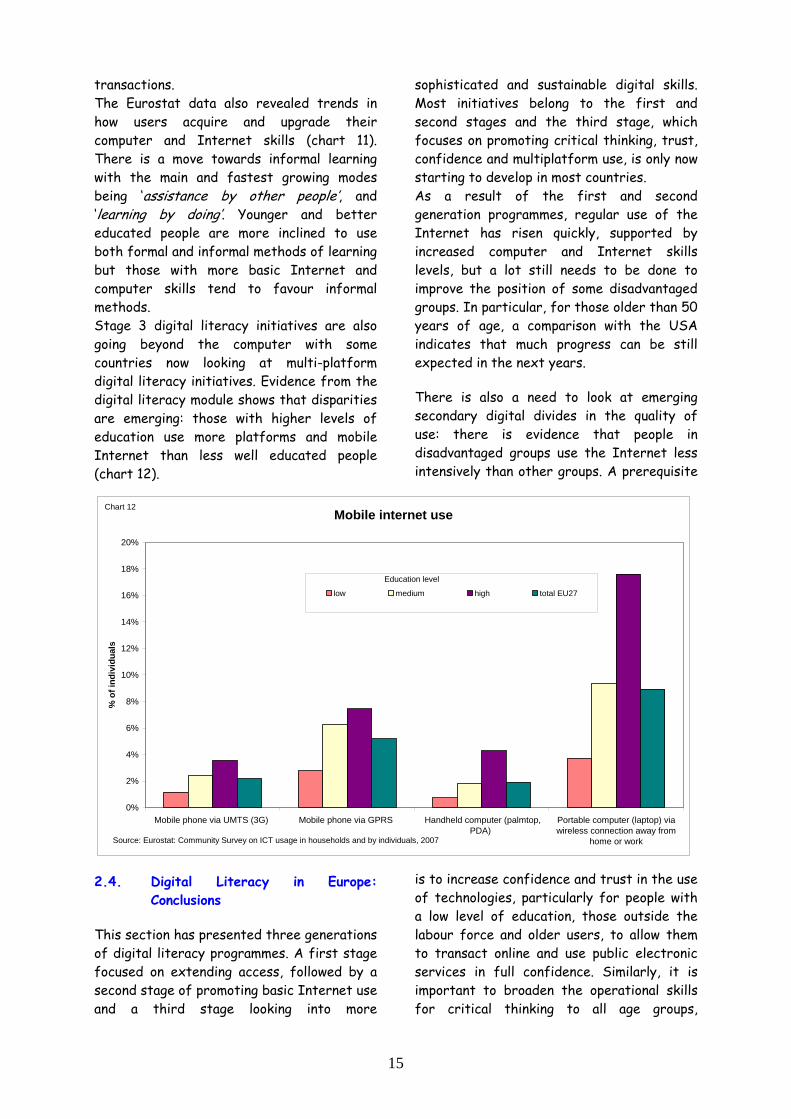
Ways of acquiring computer and Internet skills
0
10
20
30
40
50
60
through formalisededucational institution
through training coursesand adult education
centres, on own initiative
through training coursesand adult education
centres, on demand ofemployer
through self-study usingbooks, cd-roms, etc
through self-study (learningby doing)
through informal assistancefrom colleagues, relatives…
% o
f ind
ivid
uals
2006 2007
Chart 11
Source: Eurostat: Community Survey on ICT usage in households and by individuals
out on the benefits of Internet-based services by not taking up the more advanced services such as using P2P or telephony. These results suggest that all Internet users, regardless of age or education, use the Internet for communication and for access to information but for the more advanced services there are sharp differences, particularly by age.
However, education does matter when it comes to online transactions and public services (chart 10). Not only do those with higher education use these services more, they also use them to a higher level. This is shown, for example, in the use of eGovernment services where those with tertiary education are far more likely to go beyond basic information and use the Internet to submit forms and carry out
15
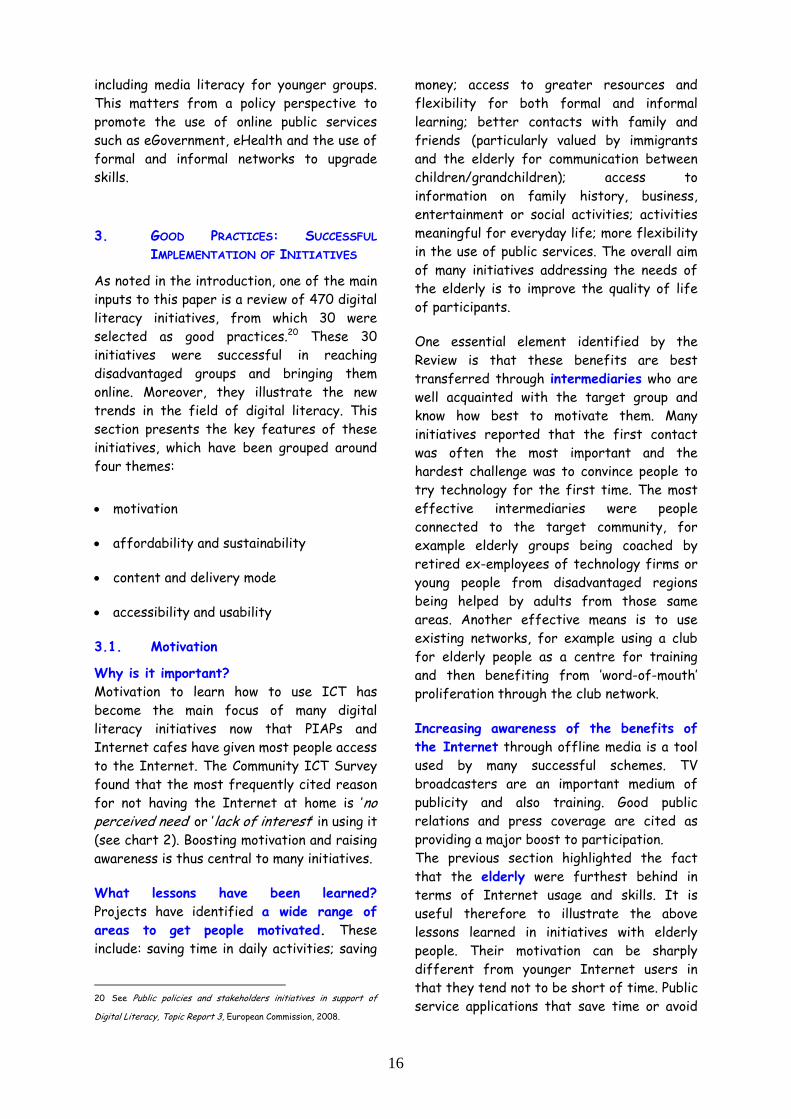
Mobile internet use
0%
2%
4%
6%
8%
10%
12%
14%
16%
18%
20%
Mobile phone via UMTS (3G) Mobile phone via GPRS Handheld computer (palmtop,PDA)
Portable computer (laptop) viawireless connection away from
home or work
% o
f ind
ivid
uals
low medium high total EU27
Education level
Source: Eurostat: Community Survey on ICT usage in households and by individuals, 2007
Chart 12
transactions. The Eurostat data also revealed trends in how users acquire and upgrade their computer and Internet skills (chart 11). There is a move towards informal learning with the main and fastest growing modes being ‘assistance by other people’, and ‘learning by doing’. Younger and better educated people are more inclined to use both formal and informal methods of learning but those with more basic Internet and computer skills tend to favour informal methods. Stage 3 digital literacy initiatives are also going beyond the computer with some countries now looking at multi-platform digital literacy initiatives. Evidence from the digital literacy module shows that disparities are emerging: those with higher levels of education use more platforms and mobile Internet than less well educated people (chart 12).
2.4. Digital Literacy in Europe: Conclusions
This section has presented three generations of digital literacy programmes. A first stage focused on extending access, followed by a second stage of promoting basic Internet use and a third stage looking into more
sophisticated and sustainable digital skills. Most initiatives belong to the first and second stages and the third stage, which focuses on promoting critical thinking, trust, confidence and multiplatform use, is only now starting to develop in most countries. As a result of the first and second generation programmes, regular use of the Internet has risen quickly, supported by increased computer and Internet skills levels, but a lot still needs to be done to improve the position of some disadvantaged groups. In particular, for those older than 50 years of age, a comparison with the USA indicates that much progress can be still expected in the next years.
There is also a need to look at emerging secondary digital divides in the quality of use: there is evidence that people in disadvantaged groups use the Internet less intensively than other groups. A prerequisite
is to increase confidence and trust in the use of technologies, particularly for people with a low level of education, those outside the labour force and older users, to allow them to transact online and use public electronic services in full confidence. Similarly, it is important to broaden the operational skills for critical thinking to all age groups,
16
including media literacy for younger groups. This matters from a policy perspective to promote the use of online public services such as eGovernment, eHealth and the use of formal and informal networks to upgrade skills.
3. GOOD PRACTICES: SUCCESSFUL
IMPLEMENTATION OF INITIATIVES
As noted in the introduction, one of the main inputs to this paper is a review of 470 digital literacy initiatives, from which 30 were selected as good practices.20 These 30 initiatives were successful in reaching disadvantaged groups and bringing them online. Moreover, they illustrate the new trends in the field of digital literacy. This section presents the key features of these initiatives, which have been grouped around four themes:
• motivation
• affordability and sustainability
• content and delivery mode
• accessibility and usability
3.1. Motivation
Why is it important? Motivation to learn how to use ICT has become the main focus of many digital literacy initiatives now that PIAPs and Internet cafes have given most people access to the Internet. The Community ICT Survey found that the most frequently cited reason for not having the Internet at home is ’no perceived need’ or ’lack of interest’ in using it (see chart 2). Boosting motivation and raising awareness is thus central to many initiatives.
What lessons have been learned? Projects have identified a wide range of areas to get people motivated. These include: saving time in daily activities; saving
20 See Public policies and stakeholders initiatives in support of
Digital Literacy, Topic Report 3, European Commission, 2008.
money; access to greater resources and flexibility for both formal and informal learning; better contacts with family and friends (particularly valued by immigrants and the elderly for communication between children/grandchildren); access to information on family history, business, entertainment or social activities; activities meaningful for everyday life; more flexibility in the use of public services. The overall aim of many initiatives addressing the needs of the elderly is to improve the quality of life of participants.
One essential element identified by the Review is that these benefits are best transferred through intermediaries who are well acquainted with the target group and know how best to motivate them. Many initiatives reported that the first contact was often the most important and the hardest challenge was to convince people to try technology for the first time. The most effective intermediaries were people connected to the target community, for example elderly groups being coached by retired ex-employees of technology firms or young people from disadvantaged regions being helped by adults from those same areas. Another effective means is to use existing networks, for example using a club for elderly people as a centre for training and then benefiting from ’word-of-mouth’ proliferation through the club network.
Increasing awareness of the benefits of the Internet through offline media is a tool used by many successful schemes. TV broadcasters are an important medium of publicity and also training. Good public relations and press coverage are cited as providing a major boost to participation. The previous section highlighted the fact that the elderly were furthest behind in terms of Internet usage and skills. It is useful therefore to illustrate the above lessons learned in initiatives with elderly people. Their motivation can be sharply different from younger Internet users in that they tend not to be short of time. Public service applications that save time or avoid
17
travel to the town hall or doctor’s surgery are not motivators. Motivation is more likely to come from contacts with extended families, with social groups and relevant health information. Family contacts (particularly children and grandchildren) have been found to be good intermediaries. The elderly often have broad experience to draw on, and this too has been used to establish groups led by retirees from the local community with technology skills. Informal learning has proved to be important in helping older people get over an initial fear of seemingly complex equipment and techniques.
3.2. Affordability and Sustainability
Why is it important? After ‘no need/interest’, the next most important reason given for not having the Internet at home were costs of equipment and access (see chart 3). These reasons were even more important for households of single parents and those in objective 1/convergence regions. The Internet is still perceived as being expensive and it is commonplace for participants to overestimate hardware and software costs. Obviously, the issue of costs is particularly important for groups on lower incomes. Several projects have promoted and motivated stakeholders by making them aware of the social and economic benefits.
What lessons have been learned? The Review identified the following elements which contributed to overcoming negative perceptions of costs:
The use of free software: open source software has been found to be beneficial in reducing entry costs and running initiatives and in developing more personalised content and localised community networks and some countries (like the Netherlands and Norway) are intensifying their use of it. In particular, there has been a proliferation of open source initiatives in PIAPs.
Launch of free online resources: a number of such initiatives have been launched by public administrations and private companies.
For example, the UK Online centres have developed a suite of very short online modules called "Myguide", which provide practical examples using a simple language.
Low cost computers: schemes have included: acquiring refurbished/new computer equipment from sponsors and providing equipment tailored to the needs of disabled participants, like in the Latvian "Open Door" project; provision of computers on loan terms for short periods to allow people to practice at home, like in the Flemish initiative "Aangename Kennismaking met de computer".
Estimate the costs and user need for certification before implementing the initiative: certification may not be useful for many learners and initiatives would benefit from a cost-benefit approach.
Sustainability: many initiatives only run for the duration of the programme periods and rely on funding. In order to make initiatives sustainable, it is best to combine many stakeholders (e.g. public authorities, industry players, associations and NGOs). A broad partnership is important not only to ensure financial support, but also reach the target groups of the initiatives. However, according to the Review, the involvement of stakeholders has varied widely between different programmes and those involving industry have proved to be more sustainable.
Interestingly, some initiatives have proved less resource intensive than others, such as those introducing a new organisational model based on intergenerational learning. For example, the European initiative "Grand parents and Grandchildren" funded by the Grundtvig programme involves national partners that organise networks of grand children who recruit and train their own grandparents.
Intermediaries: many initiatives make use of intermediaries and find their contribution is comparable to that one of paid staff, if they are given the right technical training beforehand.
18
Launching economic incentives for online users: the Review found that many initiatives provided tax incentives for online training and lower charges for online users (already offered by e-banking, e-tickets, etc.).
Consumer information on affordability choices according to user needs: like in Norway, for instance, through a website benchmarking prices and showing tests for beginners’ products, so that new users can obtain comprehensive and independent assistance when comparing different products on the market.
3.3. Content and Delivery Mode
Why is it important? Content has grown in importance as digital literacy initiatives have evolved. Course content has changed from an initial focus on operational skills using Windows and Office applications towards a greater inclusion of Internet activities, starting with email and searches and moving to more sophisticated activities such as social software or transaction services. Content has become critical and there has been a growth of more contextualised learner-oriented approaches which originated in Finland but are now found all across Europe.
What lessons have been learned?
Adapt content to personal interests: link content to everyday, local life or to the use of public services. Examples relate to online radio, local newspaper, genealogy and local history for seniors, home decorating and child care for women, job opportunities for the unemployed, news and entertainment from home for migrants, communication for everybody. This can be done by creating local interest web pages, using Web 2.0 tools to involve users in content creation or providing less academic and more informal material. Good practice can be found in “Digital Communities” in Ireland and initiatives such as the “SWICN Computer Clubhouse for youngsters” (also in Ireland) and the Spanish “See You in the Virtual Square for migrants”.
Include training in online activities to improve trust and confidence in the online environment: many countries have already launched charts and initiatives on digital rights and on increasing confidence. This can be also integrated into digital literacy curricula like the Danish “Netsikker NU Campaign” (Netsecure NOW) which provided promotional material but also courses in using the “digital signature”. Similarly Nordea (a financial services group based in the Nordic and Baltic region) has assisted its clients with training in eCommerce to increase trust in carrying out online transactions.
Help non-users to overcome their fears: programmes address fear of the technology and lack of self-confidence in the ability to understand and handle the technology. Many initiatives focus on this aspect, such as the Finnish “Mukanetti”, initiative for elderly people and the British initiative “IT for the Terrified”.
Rely on instructors or intermediaries who are close to the disadvantaged groups: this has proved to be particularly useful to encourage the enrolment of immigrants, ethnic and cultural minorities and the elderly as illustrated by initiatives like “Senioren: Medien – Migration — Integration – Participation” in Germany and “Click on Granny!” in Hungary. Often the best trainers either have similar challenges or have in-depth knowledge of the limitations of the disadvantaged group: in the Latvian “Open Door” project, disabled trainers train disabled participants.
Use new pedagogies and informal learning: a general finding is that most participants (especially the elderly) prefer not only practical, but personal face-to-face instruction. Learning by doing is also an approach used in a lot of initiatives targeting content creation, such as the Spanish scheme “See you in the virtual square”. Evaluating people skills, assessing their interests, grouping people with equal skill levels and interests is widely implemented in the Irish “New Knowledge” centres. Informal learning
19
is also important for updating and upgrading skills: users can have access to online tutors, online support and also learning by doing online content.
Helping people progress from informal to more formal programmes: several digital literacy initiatives not only help develop basic digital literacy skills, they also help target groups with low education levels begin formal education. For instance, the “Digital Communities” (Ireland) has involved academia and other formal learning actors.
However very few of the initiatives focused on improving critical thinking on the information provided in the Internet and the digital media productions as illustrated by the following quote from UK online centres: “We need a much broader approach to literacy in the digital age, one that helps users of social network sites take good care of their personal information and avoid scams or snares, one that encourages e-mail users to use available tools for encrypting messages or adding digital signatures. As computers and the Internet become more and more important in our daily lives it is vital that we know how they work and understand the risks we take when we surf websites, chat to colleagues or send e-mails off into the uncharted wastes of the network. Extending current thinking about media literacy to cover the wider area of digital literacy would be one way forward, and there is already a lot of work being done to refine and clarify what it would mean to be a well-rounded citizen of a networked society”.
3.4. Accessibility and Usability
Why is it important? Accessibility is essential to disabled and elderly people and a precondition for their participation on equal terms in society including in the Information Society. Accessibility measures not only help persons with disabilities but benefit the whole population. Accessibility is about removing and preventing barriers that hinder the use of products and services by persons with
disabilities. Given the correlation between disability and ageing, accessibility contributes to overcome the functional limitations that increase with age.
Usability is about increasing the ease of use of products and services. It is relevant to everybody and is a critical parameter for participation in the information society. Usability and accessibility are strongly interrelated and should be considered together. What lessons have been learned? The initiatives identified in the Review contained elements to improve usability features including:
Highlighting the economic potential for vendors to address and mainstream accessibility features.
Increasing access e.g. mobility actions making use of buses, laptops, kiosks, other platforms.
Improving usability of public services and promoting inclusive eGovernment, under which specific measures are developed to deliver public services to and connect vulnerable groups at risk of exclusion, has been recognised as a priority from Member States and has been reflected in various initiatives on digital literacy.
Developing guidelines for design professionals and getting the industry to reflect on the users' requirements.
Developing specific interfaces to deliver training in a very easy, friendly way e.g. “Myguide.uk”, a free package already used by 50000 users, the new ’users package’ in Norway which includes a broadband connection, standard ’desktop’ installation, and set-up with a ’beginner’s portal’.
New devices such as OLPCs (One Laptop Per Child) have looked at greater affordability and usability. In other platforms, new generations in mobile devices include easy-to-use functionalities.
20
4. CONCLUSIONS
The Digital Literacy Review has shown that countries have invested heavily in providing access and promoting basic Internet use. These measures have increased the density of public computer networks and infrastructures and contributed to the overall increase in regular use of the Internet. It also identified good practices to bring disadvantaged groups online. Successful digital literacy programmes are those which have been effective at:
• motivating non-users or users with fewer skills,
• making the technology cheaper, more user-friendly and accessible,
• adjusting to user’s preferences for informal learning, peer learning, learning by doing and online activities which reflect everyday activities or personal interests.
But more of these policies are needed to reach the 40% who do not use the Internet. Moreover, policies must adjust to new needs and emerging digital divides in the quality of use. These points were highlighted by the Digital Literacy High-Level Expert Group, which was established as part of the i2010 eInclusion 2008 initiative and which put forward a set of recommendations for digital literacy policies.