Embed Size (px)
Citation preview
Digital Image File Formats -- TIFF, JPEG & JPEG2000 May 2006
Version 17 © Tim Vitale 2006 use by permission only 1 Introduction to Digital File Formats 2 2 Brief History of Imaging Technology 3 3 Digital is Excellent Imaging Technology 5
Noise 7 RMS Granularity 8 Film Noise 9 Digital Noise 9 Dynamic Range 10 Does 8-bit Capture Extend Out to 2.4 Dmax? 11 Color Depth 11 Color Fidelity 12 Image Resolution 14 Relative Resolution of Film and Digital Media (list) 15 Resolution of Modern Film 16 Resolution of Selected Modern and Historic Films (list) 16 Predicting Resolution of Historic Film 17 4 The Lens – Limits Resolution in All Imaging Systems 19 System Resolving Power Equation 20
Lens Issues Effecting Resolution 20 Film Issues Effecting Resolution 21 Early Lenses 21
Evaluation a System: Camera, Lens and Film 22 Using an Excellent Lens 24 Canon 25 Nikkor 26 Zeiss 26 Leica 27 Theoretical Lens Resolution 28 BetterLight Repro 180/5.6 (projected) 29 5 Image File Formats 30 TIFF vs JPEG vs JPEG2000 30 TIFF File Format 30 TIFF Lossless Compression Option 31 BigTIFF Format 31 JPEG File Format 31 JPEG Rate of Compression: Example 32 JPEG2000 File Format 33 6 Storage of Digital Image Files 35 Storage Recommendation 35 IT Department 35 Internal and External Hard Drives 37 Longevity of Hard Drives 37 RAID Array Systems 38 CD and DVD Optical Storage 38 Hard Drives Always Live 39 Additional Digital Storage Information 39

<[email protected]> 510-594-8277 Tim Vitale © 2006 use by permission only
2
1 - Introduction Digital imaging is capable of recording spatial and color information well beyond the limits of film. Film-based imaging has thus been superceded by newer technology. Digital offers imaging with no intervening technologies such as film dyes, dye couplers, processing or film base, all with no physical deterioration. There is a detailed discussion of this topic in Section 3 “Digital is…” pages 5-19. Film materials deteriorate over time due to dark (chemical) and light fading of color dyes and degradation of the film base, via the vinegar syndrome or nitrate deterioration. Although these processes can be slowed by cold storage and basic preservation methodologies, they can never be halted, and unfortunately, cold storage affects "access" and use of originals. Remastering analog images into the digital domain preserves the image because it can be captured without loss and there is no physical deterioration within the digital domain. Digitized film or prints that are color-shifted by deterioration can be corrected using tools in Photoshop. Digital images need a file format that holds the digital image data securely and permanently --TIFF. See Section 5, “…File Formats” on pages 30-35 for details. Storage of image information is crucial for its long-term preservation. Although digital images can be stored indefinitely without deterioration, they can be lost. A digital file can be permanently “lost” if it is stored without regard for basic computer technology or on inappropriate storage media. The recommended storage medium is the hard drive (HD), which is viable for 5-10 years; see Section 6 “Storage” pages 35-39 for details. Although a HD can fail, it is usually backed up on another HD, or the files are stored in an internally redundant RAID array (mode 3 or 5). Optical media (CDR, DVD-R) fail without warning (3-25 yrs) and their (disk) readers won’t be available in 15-20 yrs. Image capture using automated imaging functions can easily compromise digital images permanently. Although the automated functions make digital imaging easier for the inexperienced, they remove control from the operator and can alter the fundamental image data captured by the CCD/CMOS and analog-to-digital converter (ADC) before the file is even written. Even with a neutral gray target in the frame, the full tonal range information can be compromised before the file is saved. It is always best to store image information in the TIFF format (file wrapper) using its uncompressed version. Compression of an image file diminishes the potential of the numerical image data by throwing sections away to save space or improve download speed. If the original image data is not as important as the space it occupies or the speed of download and network movement, compression could be used, but preferably not as a default operation. Image data alteration occurs even during the use of lossless-type compression, despite the unchanged appearance of the image on screen or in print. Lossy compression is more effective at reducing file size and increasing download speed. The new JPEG2000 lossy-type compression is superior to JPEG compression, but JPEG2000 implementation remains problematic. JPEG and JPEG2000 encode the original RGB image data, altering the original numerical digital data permanently. Digital workflow has put all imaging processes into the hands of one operator. The film workflow, in contrast, utilizes at least three skilled crafts to bring a color image from the photo-studio, to processing and then printing. The differences between digital and film-based workflows are revolutionizing how images are captured, used, stored and viewed. The following discussion will point to the development of imaging technologies, providing the reader with the background needed to create and preserve digital images.
<[email protected]> 510-594-8277 Tim Vitale © 2006 use by permission only
3
2 - Brief History of Imaging Technology Digital imaging is the next step is the continual improvement of imaging with light. A newer light-capturing imaging media will follow some day. The use of light, to directly render an image began with the 1550s Camera Obscura (with lens) and was adapted to analog photography by Niépce in 1816. Later, in 1826, Niépce made the first photograph using photosensitive bitumen on a pewter lithography plate. Film became the dominant image carrier beginning in 1889. The original cellulose nitrate film base was transitioned, in the late 1940s, to cellulose acetate film base. While cellulose acetate will not catch fire when in bulk on movie reels, it degrades faster than its nitrate precursor. Acetate base is still in common use today on 80-90% of all films. Some historic nitrate-based film is in better condition today, than some acetate-based film. Both film bases will degrade unless in cold storage. Film photography rose to a very high technological state before it was eclipsed by digital. Film and lenses were strategic WWII material and became critical in cold war espionage. Lenses reached a penultimate state just before WWII and topped out in the 1970s. Computer-aided design improves basic prime and zoom lens designs. Film remained the cutting edge of technology through the 1980s, but it is now a historical technology practiced by film aficionados or those slow to adopt newer technologies. The progression of light-based imaging begins with stone pseudo-lenses, and then…
KEY: Lens history; Pre-Photography; B&W Photography; Color photography & Digital Photography • Polished stones were used to magnify and condense light circa 3000 BC, or earlier • Glass was invented in Bronze Age, and then perfected by the Egyptians 3000- 2500 BC • Greek and Chinese scholars describe basic principals of optics and camera, circa 300-400 BC • Aristotle writes of a darkened room [Camera Obscura, Latin: dark room] with a small hole in one
wall focusing an inverted image on the far wall 330-300 BC • Reading Stone, a glass sphere use to read by magnified letters, around 1000 AD • Ibn el-Haitam Arabic Physicist described the first Lenses and Camera Obscura around 1000 AD • First Camera Obscura with a lens: when Girolamo Cardano (1501-1576) suggested replacing the
hole with a biconvex lens to improve the image in 1550s • Giovanni Battista della Porta (1538-1615) published what is believed to be the first account of the
possibilities of Camera Obscura as an aid to drawing in 1558 • Galileo made his astrophysical studies using a early telescope in 1610 • Newton discovers that white light is composed of colors of light (spectrum) between 1664-66 • Johann Heinrich Schulze mixes chalk, nitric acid, and silver, notices darkening on side of flask
exposed to sunlight, first photo-sensitive compound, silver nitrate, 1727 • Thomas Wedgwood, Sun Pictures, leather w/silver nitrate, deteriorated w/more than candle, 1800 • Lithography on stone & metal plate, France 1813 • Nicéphore Niépce combines the Camera Obscura with photosensitive paper, 1816 • First permanent image: light-sensitive bitumen of Judea on Pewter, Niépce in 1826 • Joseph Jackson Lister reduced chromatic aberrations in lenses by introducing concept of
several lenses, each with a portion of the full magnification, formerly required of one lens in 1830 • Light-sensitive silver iodide on copper, developed with Mercury vapor, Daguerreotype in 1833 • Chevalier Achromatic lens, 2 elements cemented, still in today’s point-and-shoot cameras 1835 • First paper negatives in 1839 • William Fox Talbot, silver chloride paper, Calotype, two exp., produce positive print, 1840-41 • Petzval Achromatic Portrait Lens, first “specifically designed photographic lens” in 1941 • Niepce de St Victor and Louis-Désiré Blanquart-Evrard experiment w/ albumen plates 1847 • Frederick Scott Archer creates glass plate negatives (wet collodion, cellulose nitrate) 1851 • Salted Paper Prints 1841-60, followed by wide use of albumen prints 1860 • Color Daguerreotypes, first Hillotype (1851) and then Heilochrome (1853), short life in 1850s • Louis-Désiré Blanquart-Evrard produces first albumen print (printing-out) in 1850 • Ambrotypes and Tintypes (Ferrotypes) positives on glass and metal respectively 1855-57 • Crayon Portraits by itinerate photographer, printed-out capture w/crayon design layer 1860-1900 • Ernst Abbe joins Zeiss (Jena), develops Abbe sine condition, improving optics significantly 1873 • First Silver Photographic Prints developed, both printing-out and developed-out, in 1870 • Dry Gelatin Plates glass plate negatives, 1878 • William Wills discovered the Platinum Print in 1873, reached market in 1881 • Gelatin emulsion papers developed, gelatin and collodion (cellulose nitrate polymer) in 1885

<[email protected]> 510-594-8277 Tim Vitale © 2006 use by permission only
4
• Baryta layer introduced to prints, increases reflectiveness and expands tonal range, about 1885 • Otto Schott joins Abbe & Zeiss, produces glass equal to Abbe’s work, Apochromatic lens, 1886 • Silver bromide - gelatin emulsion Printed Out Paper (light) available 1885, glossy in 1890 • Kodak paper roll negative, sold in camera only, in 1888 • Silver gelatin emulsion on cellulose nitrate film first developed in 1889 • Silver bromide -gelatin emulsion Developing Out Paper (chemical bath) in 1895 • Carl Zeiss Foundation develops “Anastigmat Lens” with no astigmatism or field curvature, later
known as Protar camera lens in 1890-94 • Dr. Rudolph, Zeiss Jena, develops Planar lens w/ 2 symmetrical groups, most copied style 1896 • Gabriel Lippman developed first direct color process, Photochrome in 1891 • Silver-gelatin prints supplant Albumen prints, 1895 • Dr. Schott (Zeiss) develop rare earth glass (Jena glass) in 1901 • Dr. Rudolph develops Tessar high resolution & contrast lens with 4 elements in 3 groups 1902 • Thomas Manley invents Raydex (Ozobrome) proportional color pigments on carbon paper, 1905 • Dufay ruled color screen process on glass in 1905, later on film • Colored starch on glass developed by Lumiere brothers, Autochrome, France 1907 • Fredric Ives develops major dye imbibition advance, Trichromatic Plate Pack (3 neg, 1 exp) 1911 • Kodachrome 2-color process 1915 • F.J. Christenson develops first silver dye bleach process in 1918 • Leitz releases the Leica I, 35 mm camera w/ 5-element Elmax or Elmar (4-elmt, 3 grs) lens 1925 • Eastman Technicolor 2-color motion picture process 1927 • Finlay square dot 3-color screen on film 1929 • Zeiss Icon AG releases Contax I, 35 mm camera with Zeiss f1.5 lens (Dr. Bertele, 7-elmt) 1932 • Eastman Technicolor 3-color process 1933 • Carbro print process, proportion deposit of pigment layer on paper, from Ozobrome, 1930-40 • Technicolor movie film process, three B&W negatives were made using color filters, 1932 • First viable three layered color positive film color process (Kodachrome) in 1935 • Dufaycolor ruled screen process on film 1935 • Nikon releases Nikkor 50 mm lens, mounted on Hanza Canon (Canon rangefinder) in 1935 • Zeiss develops lens vacuum deposition coatings, reducing internal reflections and flare,
increasing contrast and resolution in 1935, not available until 1940, only Sweden & Switzerland • Agfacolor, also a tripack color reversal process, 1936 • Kodachrome have low dye stability from inception (1935) through 1937, improved in 1937 • Kodak Azochrome (1940) silver dye bleach print from Eastman Wash-Off, to Dye-Transfer 1945 • First multi-layer Color Negative films developed in 1941 • First color print from a color negative film, Kodacolor, (red tone emphasis) in 1942 • Kodachrome color reversal film is supplanted by Ektachrome, with blue tone emphasis in 1946 • Ektachrome E1, E2 & E3 had poor cyan and yellow dye stability, 1940s through 1976 • Nikkor lenses equal Zeiss and Leica multi-coated equivalents in the early 1950s • Carl Zeiss Dresden (East) release first SLR (prototyped before WWII in Jena) in 1949 • Carl Zeiss (west) release their SLR, Contaflex, 1953 • Carl Zeiss (west) releases Contarex (Cyclops), first SLR with integrated light meter, in 1958 • Nikon releases the Nikon F body with metering (more compact and affordable) in 1959 • Lens designs with more advanced coatings reach point of penultimate performance in the 1960s • First instant color process, instant dye diffusion Polaroid, Polacolor in 1963 • Silver dye bleach process refined, positives prints from transparencies, Ilford, Cibachrome, 1963 • First viable digital CCD imager by Boyle & Smith at Bell Labs in 1969 • Excellent lens designs become cheaper, resolution reaches point of diminishing returns in 1970’s • Ochi’s ground breaking 8x8 pixels CCD sensor in 1972 • Ray Kurzweil invents CCD-flatbed scanner for OCR (becomes Xerox Textbridge 1980) 1975 • Ektachrome E4 with good dye stability supercedes others in 1977 • Schneider begins using multi-coated (flare suppression) lenses, 1977, completes full line by 1978 • First viable color digital imager, Sony Mavica 0.79 MP in 1981 • First Megapixel Camera, Kodak 1.4 MP 1987 • Ektachrome E6 claims 240-year dark fading stability, 1990 • Mike Collette invents the digital scanback after seeing the Kodak 6K trilinear CCD array in 1991 • Kodak introduces PhotoCD in 1992 • Mike Collette licenses the 6000x7520 (45/135 MP) digital scanback to Dicomed in 1994 • Kodak 410 DSLR camera (1012x1524, 1.5 MP) first commercial DSLR in 1994 • Depth-based color sensitivity, digital sensor: Foveon chip 1998 • BetterLight (Collette) releases 6K (6000x8000) scanback in 1997; 8K HS (12000x16000) in 2004 • Canon 1Ds (2704x4064, 11 MP) first DSLR recognized as excellent to 35 mm film in 2003 • Kodak announces discontinuation of slide projectors by 2008, in 2004 • Kodak discontinues all Eastman Ektachrome Color Reversal motion picture film thru-out 2004 • Kodak discontinues producing B&W paper, June 2005

<[email protected]> 510-594-8277 Tim Vitale © 2006 use by permission only
5
3 - Digital is Excellent Imaging Technology The reasons digital media is superior to film:
• Linear response • Low Noise • Dynamic Range • Large Color Depth • Improved Color Fidelity • Equivalent or Greater Resolution • File Format (TIFF) that holds all the Above Data Permanently
Linear Response Film’s response to light is not linear. Note that in the Characteristic Curve’s below the basic curve is not straight and that the individual curves for the red, green and blue dyes are different. This is non-linear behavior. Note that the plots are log scale on the x-axis; density (y axis) is log-based value, but plotted on a standard scale.
Transparency Film B&W Negative Film Color negative Film 0.15 – 3.5 D Range 0.35 – 2.5 D Avg. Range 0.3 – 2.3 D Range A digital sensor’s response to light is linear. The response is later modified at some point by applying a Gamma “tone curve,” but response remains linear. In the plot on the left, below the linear responses of generic sensors are depicted. The plot on the right shows the application of a Gamma 2.2 tone curve to the raw Gamma 1.0 data.
<[email protected]> 510-594-8277 Tim Vitale © 2006 use by permission only
6
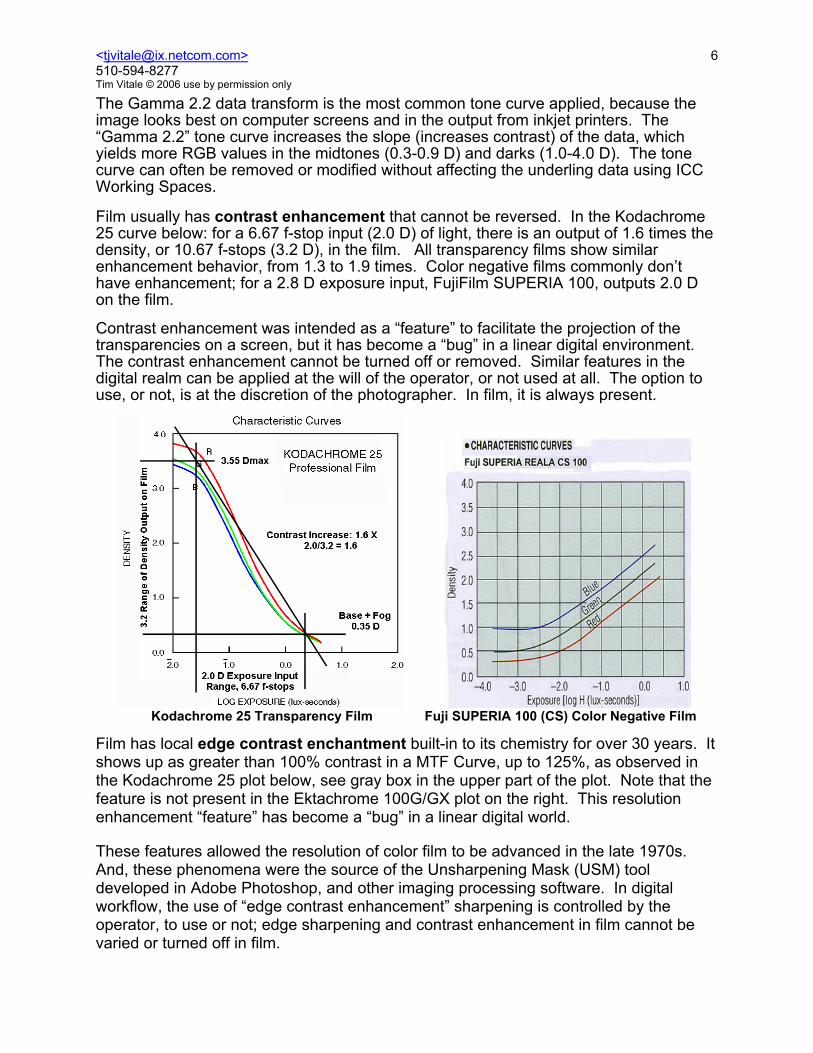
The Gamma 2.2 data transform is the most common tone curve applied, because the image looks best on computer screens and in the output from inkjet printers. The “Gamma 2.2” tone curve increases the slope (increases contrast) of the data, which yields more RGB values in the midtones (0.3-0.9 D) and darks (1.0-4.0 D). The tone curve can often be removed or modified without affecting the underling data using ICC Working Spaces. Film usually has contrast enhancement that cannot be reversed. In the Kodachrome 25 curve below: for a 6.67 f-stop input (2.0 D) of light, there is an output of 1.6 times the density, or 10.67 f-stops (3.2 D), in the film. All transparency films show similar enhancement behavior, from 1.3 to 1.9 times. Color negative films commonly don’t have enhancement; for a 2.8 D exposure input, FujiFilm SUPERIA 100, outputs 2.0 D on the film. Contrast enhancement was intended as a “feature” to facilitate the projection of the transparencies on a screen, but it has become a “bug” in a linear digital environment. The contrast enhancement cannot be turned off or removed. Similar features in the digital realm can be applied at the will of the operator, or not used at all. The option to use, or not, is at the discretion of the photographer. In film, it is always present.
Kodachrome 25 Transparency Film Fuji SUPERIA 100 (CS) Color Negative Film Film has local edge contrast enchantment built-in to its chemistry for over 30 years. It shows up as greater than 100% contrast in a MTF Curve, up to 125%, as observed in the Kodachrome 25 plot below, see gray box in the upper part of the plot. Note that the feature is not present in the Ektachrome 100G/GX plot on the right. This resolution enhancement “feature” has become a “bug” in a linear digital world. These features allowed the resolution of color film to be advanced in the late 1970s. And, these phenomena were the source of the Unsharpening Mask (USM) tool developed in Adobe Photoshop, and other imaging processing software. In digital workflow, the use of “edge contrast enhancement” sharpening is controlled by the operator, to use or not; edge sharpening and contrast enhancement in film cannot be varied or turned off in film.

<[email protected]> 510-594-8277 Tim Vitale © 2006 use by permission only
7
The second piece of information seen in the MTF Curve on the right, Ektachrome 100G/GX has a blue response with higher sharpness than the red and green dye clouds. Non-linear behavior has always been a fault of the analog film-based systems. Noise Noise in any imaging system is dependent on the speed of capture by the sensor -- ISO. The higher the ISO speed the higher the amplification of the sensor. Higher sensor amplification produces shorter exposure times, and thus, the higher signal-to-noise ratio (SNR). The SNR (noise) of film is commonly accepted to be 10:1 while the noise in an electronic imaging circuit is commonly accepted to be 100:1. Noise in film, is different from noise in a digital capture. Pixels have a finite size and are uniform across the element. Film is a continuous analog spectrum of “frequency domains” (particle sizes) with the basic elements only visible under high magnification, and never by unaided human eyes. Perceived film grain is a “pattern generation” phenomenon created from the random distribution of very small silver particles (0.2- 2.0 um) in B&W film and dye-cloud noise in color films. Noise in film varies from 5 to 50 RMS Granularity, based on manufacture data. All films show perceived grain, or regular variations in area of uniform density. The source of perceived grain in B&W and color are different, but look virtually identical. A specific square of color transparency film is the composite of three to nine layers of overlapping dye clouds. The dye clouds are made of individual 6-25 um (micron) dye clouds; assuming a silver clump size of 2-7 um in the Kodak micrographs below (Kodak H1, 1999). The silver clumps (dark centers) in the dye clouds are made of several silver particles agglomerated. The accumulation of all the individual dye clouds overlapping each other, in all layers, is averaged into dye clouds of about 25 um (Peter Krauss, 2003).

<[email protected]> 510-594-8277 Tim Vitale © 2006 use by permission only
8
The image on the left in a representation of regular silver grains found in B&W films, pre-T-grain (1982). The center is a thinly cut layer of cyan dye cloud around a silver grain; on the right are the dye clouds after full development including a competing dye coupler, which reduces dye cloud size. In actual film, dye clouds overlap within layers and there are up to 9 layers of the 3 colors of dye clouds that overlap. Each color layer-group has three film speeds: (1) a fine grain “slow” layer, (2) a moderate grain “normal” speed layer and (3) a course grain “fast” layer.
In color film, the unaided eye can resolve no individual grain or dye cloud. Magnification of the thinnest color regions, as in the Kodak micrographs above, pp 23-25 Kodak H-1 <http://www.kodak.com/US/en/motion/support/h1/h1_pdfs.shtml> can reveal isolated dye clouds at the edges. The accumulation of numerous dye clouds, through the depth of the emulsion, is “observed” as modulation in a seemingly uniform density. This modulation is “system noise,” which is seen as “grain” by the observer. These variations in noise, or grain, are measured by manufacturers using the RMS Granularity protocol. Perceived grain and RMS Granularity are not synonymous. Kodachrome 25 (PKM) transparency film has 11 RMS Granularity (Kodak data sheet). RMS Granularity is not Perceived Film Grain. Perceived Film Grain is a human-vision-based phenomenon, due to the human propensity to resolve patterns in random distributions. RMS Granularity is defined as the standard deviation of the mean, of a group of density measurements, using a 48-micron circle, on film exposed to 1.0 D. It is a measure of film noise. This clever industry protocol allows noise measurements of all film types including color dye clouds and large and small silver particles. Unfortunately, the measurement is only made at the one size domain: 48 um, or 21-lp/mm.
Measuring RMS Granularity using a 48-micron sample area. Root Mean Square is the Standard Deviation of the Mean of range of density measurements made on film at 1.0 D. Image from Kodak H-1 Publication 1999, p24.
<[email protected]> 510-594-8277 Tim Vitale © 2006 use by permission only
9
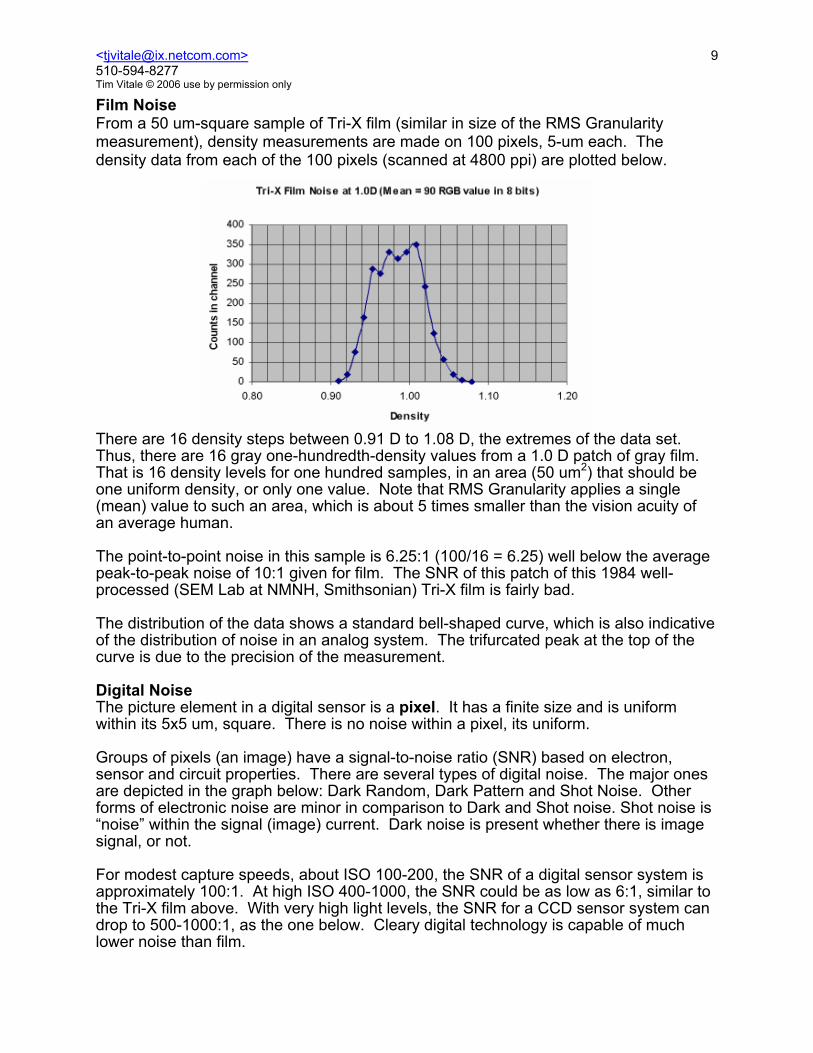
Film Noise From a 50 um-square sample of Tri-X film (similar in size of the RMS Granularity measurement), density measurements are made on 100 pixels, 5-um each. The density data from each of the 100 pixels (scanned at 4800 ppi) are plotted below.
There are 16 density steps between 0.91 D to 1.08 D, the extremes of the data set. Thus, there are 16 gray one-hundredth-density values from a 1.0 D patch of gray film. That is 16 density levels for one hundred samples, in an area (50 um2) that should be one uniform density, or only one value. Note that RMS Granularity applies a single (mean) value to such an area, which is about 5 times smaller than the vision acuity of an average human. The point-to-point noise in this sample is 6.25:1 (100/16 = 6.25) well below the average peak-to-peak noise of 10:1 given for film. The SNR of this patch of this 1984 well-processed (SEM Lab at NMNH, Smithsonian) Tri-X film is fairly bad. The distribution of the data shows a standard bell-shaped curve, which is also indicative of the distribution of noise in an analog system. The trifurcated peak at the top of the curve is due to the precision of the measurement. Digital Noise The picture element in a digital sensor is a pixel. It has a finite size and is uniform within its 5x5 um, square. There is no noise within a pixel, its uniform. Groups of pixels (an image) have a signal-to-noise ratio (SNR) based on electron, sensor and circuit properties. There are several types of digital noise. The major ones are depicted in the graph below: Dark Random, Dark Pattern and Shot Noise. Other forms of electronic noise are minor in comparison to Dark and Shot noise. Shot noise is “noise” within the signal (image) current. Dark noise is present whether there is image signal, or not. For modest capture speeds, about ISO 100-200, the SNR of a digital sensor system is approximately 100:1. At high ISO 400-1000, the SNR could be as low as 6:1, similar to the Tri-X film above. With very high light levels, the SNR for a CCD sensor system can drop to 500-1000:1, as the one below. Cleary digital technology is capable of much lower noise than film.

<[email protected]> 510-594-8277 Tim Vitale © 2006 use by permission only
10
Noise in an image can also be introduced by JPEG compression and sloppy image processing in both the camera software and imaging processing software. Thus, a good image can have “noise” introduced by the image format and processing. Using 8-bit capture for dense images produces induced-noise artifacts in the darks. The noise would not be present in a 14-bit or 16-bit raw capture of the same material; it is induced of the low bit level used in capture. Dynamic Range – Tonal Range The response of the CCD/CMOS sensor to light is dynamic range, or tonal range. The common units are Density, D. Density increases in a logarithmic manner compared to Reflectance, which is linear, on a non-log scale. An f-stop is familiar to many film and camera users. It is equal to 0.3 D units. One density unit (1.0 D) equals 3.1 f-stops. Kodachrome 25 film has about 7.6 f-stops tonal range, in response to light: 0 - 2.3D density range. Fuji Velvia, RVP100F, has a 12.3 f-stop response to light. Digital images are captured at Gamma 1.0. This is known as “raw” from the CCD and AD converter combination. If a Gamma 1.0 image is viewed, it will look flat due to the nature of the computer monitor. Thus, the image file is usually converted to Gamma 2.2 for viewing and processing based on what is seen on the monitor. Converting to Gamma 2.2 shifts the slope of the response curve (from Gamma 1.0 to 2.2) such that the image has higher contrast and there are more RGB steps available in the darks. The critical point is the number of steps available in the darks. This is important because it limits the ability of the specific "bit depth" to capture the actual or full tonal range of the negative, transparency or print. The image can only be captured in Gamma 1.0 raw. You may never see the Gamma 1.0 data because in most cases it is

<[email protected]> 510-594-8277 Tim Vitale © 2006 use by permission only
11
converted to Gamma 2.2 in the image capture software, such as scanners. Other Gamma's can be specified, but today’s monitors are set for best display at Gamma 2.2. The bit-depth capabilities of a "digital sensors and A-D converter system" have their own limitations. A sensor’s response is limited by the number of RGB values an image’s "electron count" can be divided into by the analog to digital converter at Gamma 1.0. Bit-Depth f-stop Range Density Range 8 bits 5 0 - 1.5 D (G 1.0) 12 bits 9 0 - 2.7 D (G 1.0) 14 bits 11 0 - 3.3 D (G 1.0) 16 bits 13 0 - 3.9 D (G 1.0) I define the limiting point of a particular “bit-depth” as the point where there are less than two RGB values for each “one-tenth-density” (0.1 D) increment, at Gamma 1.0. Does 8-bit Capture Extend Out to 2.4 Dmax? Some will argue that “8 bit-depth” extends out to 2.4 D, rather than 1.59 D noted above. The last RGB value (0) is assigned to 2.4 D; no more RGB value exists past 2.4 D. In 8-bit digital space the following is fact:
• Between 0 to 1.59 D, each “one-tenth-density increment” has multiple RGB values for each • Steps 1.6 D, 1.7 D, 1.8 D and 1.9 D have only one RGB value for each one-tenth-D step • Density data from 1.91- 2.09 D is lumped into RGB = 3, a 0.2 density step for 1 RGB value • Density data from 2.1 - 2.39 D is lumped into RGB = 2, a 0.3 density step for 1 RGB step • Density data from 2.4 - 3.7 D (Fuji Velvia) is lumped into RGB = 1, a full 1.6 D in one step
The reality may be that one cannot see these steps in the image "information" on the screen or in a print, but the image data in there never the less. The data in the file is much more powerful than what can be printed or seen on the monitor. If you go through the effort of making a good scan, why would you settle for just an 8/24-bit image? Can this be seen on a 2-5 year old CRT with a 35:1 contrast ratio (2.2 Dmax)? Probably not. Could this be seen on a modern (late 2004 or better) 300-500:1 contrast ratio LCD display (2.95 Dmax)? Possibly. Capture at 8-bits will misrepresent the actual numerical image data. The numerical image data behind each pixel is one of the significant features that separate digital from film.
Color Depth In a digital file, each pixel has a bit-depth based on the number of steps into which the image information is assigned. The magnitude of color information in equivalent picture element is thousands of times greater in digital realm, than in film of any type.
Bit-Depth Steps Color/B&W 8 bits 256 B&W 12 bits 4096 B&W 14 bits 16384 B&W 16 bits 65536 B&W 24 bits 16.7xM 8-bit color 36 bits 68.7xG 12-bit color 42 bits 4.4xT 14-bit color 48 bits 281xT 16-bit color
<[email protected]> 510-594-8277 Tim Vitale © 2006 use by permission only
12
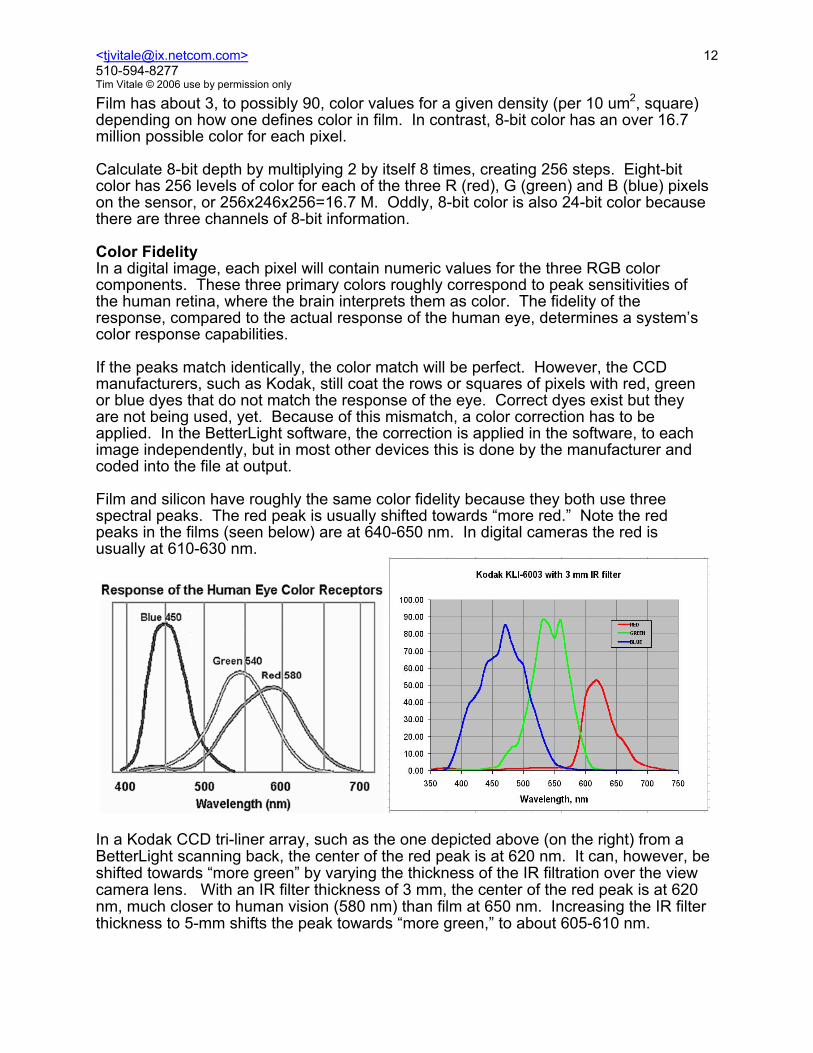
Film has about 3, to possibly 90, color values for a given density (per 10 um2, square) depending on how one defines color in film. In contrast, 8-bit color has an over 16.7 million possible color for each pixel. Calculate 8-bit depth by multiplying 2 by itself 8 times, creating 256 steps. Eight-bit color has 256 levels of color for each of the three R (red), G (green) and B (blue) pixels on the sensor, or 256x246x256=16.7 M. Oddly, 8-bit color is also 24-bit color because there are three channels of 8-bit information. Color Fidelity In a digital image, each pixel will contain numeric values for the three RGB color components. These three primary colors roughly correspond to peak sensitivities of the human retina, where the brain interprets them as color. The fidelity of the response, compared to the actual response of the human eye, determines a system’s color response capabilities. If the peaks match identically, the color match will be perfect. However, the CCD manufacturers, such as Kodak, still coat the rows or squares of pixels with red, green or blue dyes that do not match the response of the eye. Correct dyes exist but they are not being used, yet. Because of this mismatch, a color correction has to be applied. In the BetterLight software, the correction is applied in the software, to each image independently, but in most other devices this is done by the manufacturer and coded into the file at output. Film and silicon have roughly the same color fidelity because they both use three spectral peaks. The red peak is usually shifted towards “more red.” Note the red peaks in the films (seen below) are at 640-650 nm. In digital cameras the red is usually at 610-630 nm.
In a Kodak CCD tri-liner array, such as the one depicted above (on the right) from a BetterLight scanning back, the center of the red peak is at 620 nm. It can, however, be shifted towards “more green” by varying the thickness of the IR filtration over the view camera lens. With an IR filter thickness of 3 mm, the center of the red peak is at 620 nm, much closer to human vision (580 nm) than film at 650 nm. Increasing the IR filter thickness to 5-mm shifts the peak towards “more green,” to about 605-610 nm.

<[email protected]> 510-594-8277 Tim Vitale © 2006 use by permission only
13
Only the BetterLight, ViewFinder software, has the ability to adjust the sensitivity of the red peak, or any of the three peaks in the preview mode before the capture is made. Any combination of the three peak heights can be amplified or attenuated to more-closely match human vision. In the plot of the Kodak CCD with a 5 mm IR filter below, note that the red peak is shifted further to the green, 605 nm, but that the red peak height is decreased in the process.
Images from this configuration will have potentially truer reds and yellows, but will need red peak amplification and green peak attenuation to achieve that end. Note that the area under the red peak, in the both the 3 & 5 mm IR filtered versions of the Kodak trilinear array, is not the same as in the human eye response, on the previous page.
On the right is an example of the visible light spectrum overlaid with the response peaks of a generic CCD sensor. Ignoring the odd shape of the blue and green peaks, the shape of red peak on the right is created by red band pass filter (red line) and the IR filter (black line). The IR filter passes light between 350 and 720 nm, cutting infrared light. Silicon sensors are 5 times more sensitive to infrared light. The shape of both the (1) red band pass and (2) IR filters define the final red response of the CCD device. The red band pass filter (red line) allows all light to pass above 500 nm, through about 950 nm, the end of visible light and into the infrared. The blue band pass filter allows light between 350-500 nm. The green band pass allows light between 480-590 nm.

<[email protected]> 510-594-8277 Tim Vitale © 2006 use by permission only
14
Image Resolution Film has a native digital equivalent “resolution” up to 5080 ppi for the best color films and up to 8636 ppi for Kodak Technical Pan B&W, film. See the data tables on the next pages 16-17 and 22-24 for details. It is true that most digital sensors don’t exceed the resolution of the film-data-sheet-values for the best films, but most films do not approach their native resolution; see the system resolution data tables on page 23 & 24. Digital sensors have resolution up to 3600-4800 ppi, depending on equipment and size of image. DSLRs have a resolution of 2000-3500 ppi. BetterLight scanning backs have a resolution up to 3600 ppi for their 2.83” x 3.83” image size. Flatbed scanners have resolution ranging up to 4800 - 8000 ppi. Drum scanners have resolution from 1000 to 8000 ppi. Film-camera systems will fall short of ideal when a lens is used and the film processed. If the lens, image plane and film are not perfectly aligned, the highest possible resolution will not be achieved. No SLR lenses will meet or exceed the 170-lp/mm capabilities of Kodak Technical Pan B&W film (8636 ppi). The best 35 mm format lenses have a 120-140 lp/mm maximum resolution, at 30% contrast difference between white and black lines, starting with 100% contrast. Most 35 mm lenses can achieve 80-100 lp/mm at best. Few large format lenses exceed 60 lp/mm. Do not expect 4x5 transparencies to have resolution equal to 35 mm or medium format images, whose lenses have smaller “image circles” to manage. Using the Kodak VR 100 color negative film (5080 ppi native), through a lens of mythical resolution of 200 lp/mm, the resolution of the system is just two-thirds that of direct contact MTF curve value, 3390 ppi; see page 20 & 23-24. Using the best lenses known to me, 140 lp/mm, the VR 100, 5080 ppi, native resolution is degraded by 42%, to 2970 ppi, after the film is exposed and processed. While color negative films (Kodak VR 100) can have higher resolution than color positives (Fuji Velvia RVP100F, 80 lp/mm, 4064 ppi) the negative must go through a second lens when printed. Thus, the VR 100, 2970 ppi (at its best) resolution is only valid when the negative is scanned. Kodak and Fuji have equations for calculating the effects of lenses and processing in their handbooks; see EQ2 on page 20. Highend digital devices, such as the best DSLRs, exceed highend film in most cases. Many professional photographers agreed that the Canon 1Ds (2704x4064) was superior to film, Popular Photography, Feb. 2003. In 1999, the widely known Bay Area photographer, Stephen Johnson, showed that digital scanning backs (6000x8000) are superior to large format film (4x5) at the EMG/AIC meeting in St Louis in June 1999. Better 35 mm DSLR cameras can exceed most films. In the two columns on the far right of the data table on the next page, the actual resolution data from three specific Canon DSLRs are listed. In a film camera system with a 100 lp/mm lens, Fuji Velvia will have a resolution of 2235 ppi, a 45% loss from the native MTF curve data on pages 23-24. The canon EOS 1D Mk II (2336 ppi native resolution at 30% contrast) has an actual performance of 2540 ppi, at 50% contrast (a tougher standard). The list below compares film class averages and specific high-resolution films with digital cameras and scanners. The lens resolution data at the bottom helps define system limitations. Dedicated lenses in scanners can be superior to interchangeable lenses, because they are optimized to a specific system. Avoid extensive cleaning of scanner lens systems. Cleaning could disrupt critical alignment, and alignment is one of several critical lens quality issues.

<[email protected]> 510-594-8277 Tim Vitale © 2006 use by permission only
15
Relative Resolution of Film and Digital Imaging Media, with Typical Lens Resolution Data Direct Direct thru 80lp/mm thru 80lp/mm lens in ppi in lp/mm lens in ppi ppi from USAF
Film Type* -- Averages MTF @ 30 MTF @ 30% MTF @ 30% 1951 Chart Color Negative Film 3240 64* 2170 (43%)ß Color Transparency Film 2684 53* 1620 (40%)ß B&W (all eras) 4282 84* 2080 (49%)ß B&W 1940 data only 2900 57* 1700 (41%)ß
B&W 1970 data only 4525 89* 2144 (53%)ß B&W Modern only 6400 126* 2485 (61%)ß
Specific Modern Films Ektachrome 100 2285 45** 1465 (36%)ß Kodachrome 25 2700 53** 1620 (40%)ß Ektachrome 100GX 3050 60** 1740 (42%)ß
Fuji Velvia 50 3454 68** 1870 (46%)ß Fuji Velvia 100F RVP 4064 80** 2032 (50%)ß
Kodak VR 100 (color neg) 5080 100** 2260 (56%)ß Kodak T-Max 100 7112 140** 2585 (64%)ß Fuji Neopan 100*** 8130 160*** 2710 (67%)ß Kodak Technical Pan 8636 170** 2605 (65%)ß
DSLR (digital single lens reflex 35 mm) Canon EOS 1Ds MkII 3328 66+ Canon EOS 1Ds 2704 53+ 2032§ 2800Φ Canon EOS 1D Mk II 2336 46+ 2540§ 2800Φ Nikon D2x 2848 56+ Kodak DCS 3205 63+ Canon EOS 20D 2344 46+ 2185§Ψ 3150ΦΨ Nikon D70 2000 39+
Scanning Backs (4x5 view camera body) BetterLight 4000E-HS (3750x5000) 1323 26 BetterLight 6000E-HS (6000x8000) 2120 42 BetterLight 8K-HS (12000x16000) 2822 56 BetterLight 10K-HS (15000x20000) 3598 71
Flatbed Scanners Epson 10000XL, tabloid 2400 47 Aztek Plateau, tabloid 4000 79 Creo iQsmart2, tabloid 4300 87 Epson 4990, 8x10 4800 94 Creo iQsmart3, tabloid 5500 108 FlexTight 646, sheet film 6300 124 FlexTight 949, sheet film 8000 157
Drum Scanners Howtek 4500 4500 89
Fuji Celsis 6250 8000 157 Aztek Premier 8000 157 ICG 380 12000 236
Resolution Limitations imposed by Lens -- 30% contrast of black and white line pairs Old Large Format Lens 1016 20 Average Large Format (LF) Lens 2032 40 Good LF or Average SLR Lens 3036 60 Excellent LF or Very Good SLR 4048 80 Excellent SLR Lens 5060 100
Superior SLR Lens 6096 120 Theoretically Perfect Lens at f-16 3300 65Ω
Theoretically Perfect Lens at f-11 4318 85Θ Theoretically Perfect Lens at f-8 6096 120ω
Theoretically Perfect Lens at f-5.6 9144 180Σ Theoretically Perfect Lens at f-4.0 17800 350Π
* Pulled from data table on pp 16-17. ** Pulled from film manufactures data sheet found on the web or in official publications.
*** Resolution is based on the vastly inferior “1000:1” resolution target, it is probably inflated by 25-40%, over 30% MTF. ß Resolution figure is based on the System Resolving Power EQ2, seen on page 20 (data table p23); percent loss in parentheses.
+ No contrast information on digital pixels, such as the “30% of full scale” for film, pulled from MTF curves. § Actual resolution delivered http://www.wlcastleman.com/equip/reviews/film_ccd/index.htm using Koren process at 50% Contrast. Φ Measured using the 1951 USAF Resolution Test Pattern from Edmund Scientific found on the <wlcastleman> website above.
Ψ The 1000 ppi difference is actual data pulled from the <wlcastleman> website. Ω Theoretical resolution limit of a perfect lens at f-16 aperture, at 1% contrast a maximum of 100 lp/mm. Θ Theoretical resolution limit of a perfect lens at f-11 aperture, at 1% contrast a maximum of 150 lp/mm. ω Theoretical resolution limit of a perfect lens at f-8 aperture, at 1% contrast a maximum of 200 lp/mm. Σ Theoretical resolution limit of a perfect lens at f-5.6 aperture, at 1% contrast a maximum of 280 lp/mm. Π Theoretical resolution limit of a perfect lens at f-4.0 aperture, at 1% contrast a maximum of 400 lp/mm.

<[email protected]> 510-594-8277 Tim Vitale © 2006 use by permission only
16
Resolution of Modern Film: Film Data (1940-2004) This section on modern-era film resolution provides information on the resolution of specific films, and then film averages within specific class, such as
• B&W • Color transparency • Color negative
from historic eras, such as
• 1940 (historic) • 1940-1970 (old) • 1970-2004 (modern)
The resolution data listed below is based on direct contact printing of the film resolution target onto the film. Exposing film through a lens will decrease a film’s resolution from 40% to 50%, up to 80%. See the column on the near right for resolution through a good lens with good processing, and on the far right, for exposure through a typical large format lens.
• 40% - all film, good lens and good processing • 60% - large format films with equivalent lens and good processing
All film through 1970 should have their resolution reduced a minimum of 40% for exposure through a (modern) lens. Film exposed through older lenses or large format lenses should have the resolution reduced by 40%. Large format film from 1890-1940 should have their resolution lower by 60% to account for poor lens quality, film handling issues and questionable processing. Resolution reduction for 1890-1920 film/plates with all possible faults combined could be reduced as much as 80%. Resolution of Selected Modern and Historic Films -- with averages by Film Class and Era Optical Digital 40% loss 60% loss Film Resolution Equivalent from system from system lp/mm, MTF@30% ppi thru lens thru lens Color Negative Film Kodak Vericolor 5072 (neg-pos) 60 3050 Kodak VR 1000 (neg film) 45 2290 Kodak VR 400 (neg film) 50 2540 Kodak VR 100 (neg film) 100 5080 Average 64 3240 1944 1300 Color Transparency Film Kodachrome 25 (discontinued 2003) 53 2692 Kodachrome 64 50 2540 Kodachrome 200 50 2540 Ektachrome EDUPE 60 3050 Ektachrome 5071 (dup) 50 2540 Ektachrome 50 40 2030 Ektachrome 64 40 2030 Ektachrome 100 45 2290 Ektachrome 100GX 60 3050 Ektachrome 100plus EPP 45 2290 Ektachrome 160 35 1780 Fuji Velvia 50 RVP (2002) 68 3454 Fuji Velvia 100 RVP100F (2004) 80 4064 Fuji Provia 100F RPD 55 2800 Fuji Astra 100 RAP 45 2290 Fuji Astra 100F RAP100F 65 3300 Fujichrome EI 100 45 2290 Average (excluding Velvia 100F) 48 2440 1464 975 Average 53 2692 2013 1610
<[email protected]> 510-594-8277 Tim Vitale © 2006 use by permission only
17
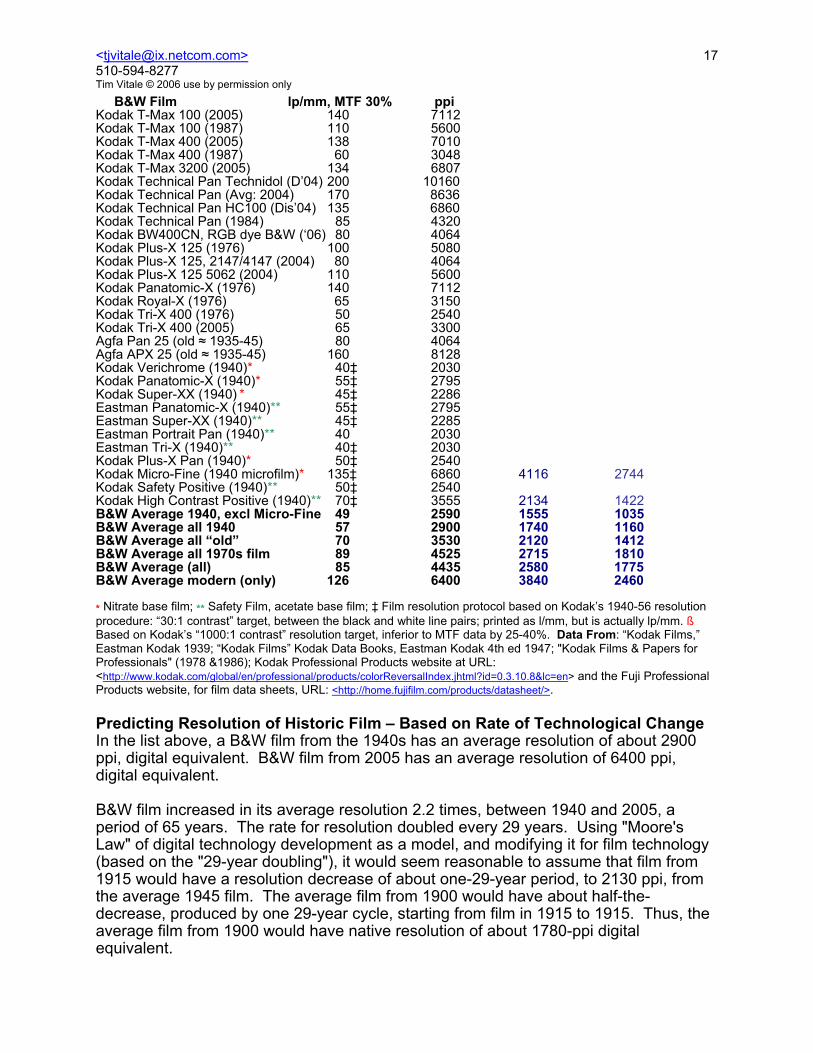
B&W Film lp/mm, MTF 30% ppi Kodak T-Max 100 (2005) 140 7112 Kodak T-Max 100 (1987) 110 5600 Kodak T-Max 400 (2005) 138 7010 Kodak T-Max 400 (1987) 60 3048 Kodak T-Max 3200 (2005) 134 6807 Kodak Technical Pan Technidol (D’04) 200 10160 Kodak Technical Pan (Avg: 2004) 170 8636 Kodak Technical Pan HC100 (Dis’04) 135 6860 Kodak Technical Pan (1984) 85 4320 Kodak BW400CN, RGB dye B&W (‘06) 80 4064 Kodak Plus-X 125 (1976) 100 5080 Kodak Plus-X 125, 2147/4147 (2004) 80 4064 Kodak Plus-X 125 5062 (2004) 110 5600 Kodak Panatomic-X (1976) 140 7112 Kodak Royal-X (1976) 65 3150 Kodak Tri-X 400 (1976) 50 2540 Kodak Tri-X 400 (2005) 65 3300 Agfa Pan 25 (old ≈ 1935-45) 80 4064 Agfa APX 25 (old ≈ 1935-45) 160 8128 Kodak Verichrome (1940)* 40‡ 2030 Kodak Panatomic-X (1940)* 55‡ 2795 Kodak Super-XX (1940) * 45‡ 2286 Eastman Panatomic-X (1940)** 55‡ 2795 Eastman Super-XX (1940)** 45‡ 2285 Eastman Portrait Pan (1940)** 40 2030 Eastman Tri-X (1940)** 40‡ 2030 Kodak Plus-X Pan (1940)* 50‡ 2540 Kodak Micro-Fine (1940 microfilm)* 135‡ 6860 4116 2744 Kodak Safety Positive (1940)** 50‡ 2540 Kodak High Contrast Positive (1940)** 70‡ 3555 2134 1422 B&W Average 1940, excl Micro-Fine 49 2590 1555 1035 B&W Average all 1940 57 2900 1740 1160 B&W Average all “old” 70 3530 2120 1412 B&W Average all 1970s film 89 4525 2715 1810 B&W Average (all) 85 4435 2580 1775 B&W Average modern (only) 126 6400 3840 2460 * Nitrate base film; ** Safety Film, acetate base film; ‡ Film resolution protocol based on Kodak’s 1940-56 resolution procedure: “30:1 contrast” target, between the black and white line pairs; printed as l/mm, but is actually lp/mm. ß Based on Kodak’s “1000:1 contrast” resolution target, inferior to MTF data by 25-40%. Data From: “Kodak Films,” Eastman Kodak 1939; “Kodak Films” Kodak Data Books, Eastman Kodak 4th ed 1947; "Kodak Films & Papers for Professionals" (1978 &1986); Kodak Professional Products website at URL: <http://www.kodak.com/global/en/professional/products/colorReversalIndex.jhtml?id=0.3.10.8&lc=en> and the Fuji Professional Products website, for film data sheets, URL: <http://home.fujifilm.com/products/datasheet/>. Predicting Resolution of Historic Film – Based on Rate of Technological Change In the list above, a B&W film from the 1940s has an average resolution of about 2900 ppi, digital equivalent. B&W film from 2005 has an average resolution of 6400 ppi, digital equivalent. B&W film increased in its average resolution 2.2 times, between 1940 and 2005, a period of 65 years. The rate for resolution doubled every 29 years. Using "Moore's Law" of digital technology development as a model, and modifying it for film technology (based on the "29-year doubling"), it would seem reasonable to assume that film from 1915 would have a resolution decrease of about one-29-year period, to 2130 ppi, from the average 1945 film. The average film from 1900 would have about half-the-decrease, produced by one 29-year cycle, starting from film in 1915 to 1915. Thus, the average film from 1900 would have native resolution of about 1780-ppi digital equivalent.

<[email protected]> 510-594-8277 Tim Vitale © 2006 use by permission only
18
Using known resolution averages from 2005, 1975 and 1940, the average resolution of film in 1900 has been predicted in the chart below. The plot uses averages for B&W film of specific ages in the “Resolution of Selected Modern and Historic Films” table above.
Unfortunately there is little MTF data for film earlier than about 1970s. Therefore resolution data for film between 1970/80 and 1940 is projected from 1000:1 high-contrast resolution targets. Prior to 1940 (even 1960-80 photo literature), only words were used to describe resolution, making evaluation almost pointless. In addition, film grain was confused with film resolution in popular photographic literature through, even, the 1990s. Film grain that is seen by humans is now known to be a “perceived property,” because silver particles (0.2 - 2.0 um) can't be seen by humans. The actual resolution on the film or glass plate must be diminished from “target” data by
• quality of lens used for the exposure • goodness of focus • trueness of lens and film axis • processing variables and faults of the era
The "Direct Resolution" data (second column in data table just above) is based on direct contact printing of the resolution target onto the film. Exposing film through a lens (normal photography) will decrease a film's resolution from 25% to 40%, up to 80%. See the five columns on the right of the data table above for resolution of
• 25% - modern 35-mm & 2¼” film through an excellent lens with good processing • 40% - modern large format film exposed through a typical large format lens • 50% - all film through an average (40 lp/mm) or poor lens (20 lp/mm or less) • 60% - large format film (including early roll film) from 1890-1930 • 80% - large format with all faults 1890-1920
<[email protected]> 510-594-8277 Tim Vitale © 2006 use by permission only
19
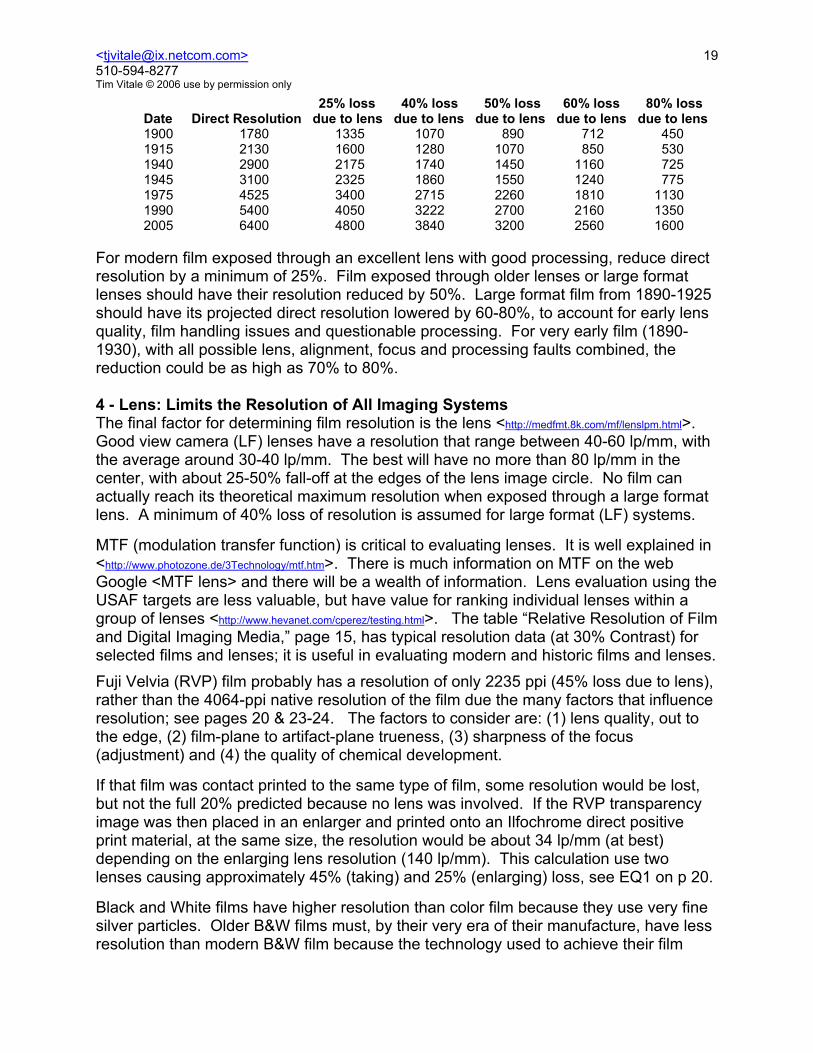
25% loss 40% loss 50% loss 60% loss 80% loss Date Direct Resolution due to lens due to lens due to lens due to lens due to lens 1900 1780 1335 1070 890 712 450 1915 2130 1600 1280 1070 850 530 1940 2900 2175 1740 1450 1160 725 1945 3100 2325 1860 1550 1240 775 1975 4525 3400 2715 2260 1810 1130 1990 5400 4050 3222 2700 2160 1350 2005 6400 4800 3840 3200 2560 1600 For modern film exposed through an excellent lens with good processing, reduce direct resolution by a minimum of 25%. Film exposed through older lenses or large format lenses should have their resolution reduced by 50%. Large format film from 1890-1925 should have its projected direct resolution lowered by 60-80%, to account for early lens quality, film handling issues and questionable processing. For very early film (1890-1930), with all possible lens, alignment, focus and processing faults combined, the reduction could be as high as 70% to 80%. 4 - Lens: Limits the Resolution of All Imaging Systems The final factor for determining film resolution is the lens <http://medfmt.8k.com/mf/lenslpm.html>. Good view camera (LF) lenses have a resolution that range between 40-60 lp/mm, with the average around 30-40 lp/mm. The best will have no more than 80 lp/mm in the center, with about 25-50% fall-off at the edges of the lens image circle. No film can actually reach its theoretical maximum resolution when exposed through a large format lens. A minimum of 40% loss of resolution is assumed for large format (LF) systems. MTF (modulation transfer function) is critical to evaluating lenses. It is well explained in <http://www.photozone.de/3Technology/mtf.htm>. There is much information on MTF on the web Google <MTF lens> and there will be a wealth of information. Lens evaluation using the USAF targets are less valuable, but have value for ranking individual lenses within a group of lenses <http://www.hevanet.com/cperez/testing.html>. The table “Relative Resolution of Film and Digital Imaging Media,” page 15, has typical resolution data (at 30% Contrast) for selected films and lenses; it is useful in evaluating modern and historic films and lenses. Fuji Velvia (RVP) film probably has a resolution of only 2235 ppi (45% loss due to lens), rather than the 4064-ppi native resolution of the film due the many factors that influence resolution; see pages 20 & 23-24. The factors to consider are: (1) lens quality, out to the edge, (2) film-plane to artifact-plane trueness, (3) sharpness of the focus (adjustment) and (4) the quality of chemical development. If that film was contact printed to the same type of film, some resolution would be lost, but not the full 20% predicted because no lens was involved. If the RVP transparency image was then placed in an enlarger and printed onto an Ilfochrome direct positive print material, at the same size, the resolution would be about 34 lp/mm (at best) depending on the enlarging lens resolution (140 lp/mm). This calculation use two lenses causing approximately 45% (taking) and 25% (enlarging) loss, see EQ1 on p 20. Black and White films have higher resolution than color film because they use very fine silver particles. Older B&W films must, by their very era of their manufacture, have less resolution than modern B&W film because the technology used to achieve their film
<[email protected]> 510-594-8277 Tim Vitale © 2006 use by permission only
20
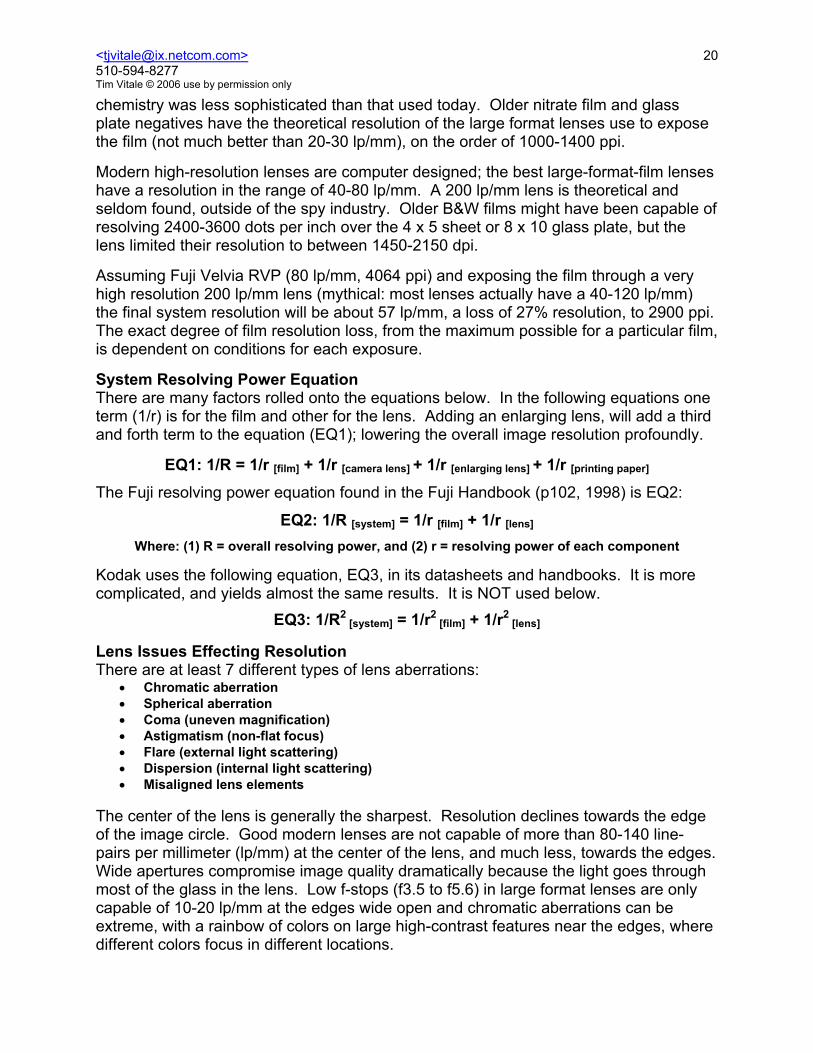
chemistry was less sophisticated than that used today. Older nitrate film and glass plate negatives have the theoretical resolution of the large format lenses use to expose the film (not much better than 20-30 lp/mm), on the order of 1000-1400 ppi. Modern high-resolution lenses are computer designed; the best large-format-film lenses have a resolution in the range of 40-80 lp/mm. A 200 lp/mm lens is theoretical and seldom found, outside of the spy industry. Older B&W films might have been capable of resolving 2400-3600 dots per inch over the 4 x 5 sheet or 8 x 10 glass plate, but the lens limited their resolution to between 1450-2150 dpi. Assuming Fuji Velvia RVP (80 lp/mm, 4064 ppi) and exposing the film through a very high resolution 200 lp/mm lens (mythical: most lenses actually have a 40-120 lp/mm) the final system resolution will be about 57 lp/mm, a loss of 27% resolution, to 2900 ppi. The exact degree of film resolution loss, from the maximum possible for a particular film, is dependent on conditions for each exposure. System Resolving Power Equation There are many factors rolled onto the equations below. In the following equations one term (1/r) is for the film and other for the lens. Adding an enlarging lens, will add a third and forth term to the equation (EQ1); lowering the overall image resolution profoundly.
EQ1: 1/R = 1/r [film] + 1/r [camera lens] + 1/r [enlarging lens] + 1/r [printing paper] The Fuji resolving power equation found in the Fuji Handbook (p102, 1998) is EQ2:
EQ2: 1/R [system] = 1/r [film] + 1/r [lens] Where: (1) R = overall resolving power, and (2) r = resolving power of each component
Kodak uses the following equation, EQ3, in its datasheets and handbooks. It is more complicated, and yields almost the same results. It is NOT used below.
EQ3: 1/R2 [system] = 1/r2
[film] + 1/r2 [lens]
Lens Issues Effecting Resolution There are at least 7 different types of lens aberrations:
• Chromatic aberration • Spherical aberration • Coma (uneven magnification) • Astigmatism (non-flat focus) • Flare (external light scattering) • Dispersion (internal light scattering) • Misaligned lens elements
The center of the lens is generally the sharpest. Resolution declines towards the edge of the image circle. Good modern lenses are not capable of more than 80-140 line-pairs per millimeter (lp/mm) at the center of the lens, and much less, towards the edges. Wide apertures compromise image quality dramatically because the light goes through most of the glass in the lens. Low f-stops (f3.5 to f5.6) in large format lenses are only capable of 10-20 lp/mm at the edges wide open and chromatic aberrations can be extreme, with a rainbow of colors on large high-contrast features near the edges, where different colors focus in different locations.

<[email protected]> 510-594-8277 Tim Vitale © 2006 use by permission only
21
Film Issues Effecting Resolution The problems with film have been described in detail, in online publications. Achieving crisp focus is the principal problem. However, keeping the film flat in any camera, perpendicular to the lens axis in LF cameras, along with, many hands mixing processing chemicals introduce significant problems. The issues forming an image on film include:
• Goodness of focus • Trueness of lens axis to film axis • Warp of the film in the film holder or film path • Aperture size (f-stop) • Shutter Speed • Vibration in all phases • Dirt and haze on lens (light scatter) • Film developing variables (exhaustion, impure water or impure chemicals) • Heat and humidity in storage, before and after exposure and processing • Time since exposure, and, possible x-rays exposure during airport screening
The exposure parameters of shutter speed and f-stop effect sharpness markedly. The f-stops above and below the optimal lens iris opening, f-8, degrade the image noticeably. Slow shutter speeds allow for hand-induced shake during exposure decreasing image sharpness. Fast shutter speeds require longer processing times which enlarges film silver particle size, decreasing film resolution. Mirror travel, and abrupt stops, in SLRs can have a large affect on camera movement (even while on a tripod) when using faster shutter speeds. There are many websites on lens quality: <http://www.hevanet.com/cperez/testing.html> (actual tests of large format lenses) <http://www.largeformatphotography.info/lenses-general.html> <http://www.largeformatphotography.info/lenses-primer/> <http://www.normankoren.com/Tutorials/MTF5.html> <http://home.online.no/~gjon/lenses.htm> and <http://www.photodo.com/nav/prodindex.html> (35-mm and MF lenses, unfortunately no LF lenses) Early Lenses Lenses from 1830-1890s will have much less resolution and have many more problems with spherical aberrations, chromatic aberrations and coma, including large amounts of flare, especially when used wide open. These lenses will have lower contrast and lower resolution with broad circles of confusion (point of focus for a point source). The field of focus is definitely not flat with astigmatism and coma issues. Until about 1835-40 lenses were one or two pieces of curved-surface glass with two to four air-glass interfaces and an iris behind. The “two lenses cemented into one group” design is called the Chevalier Achromatic. This design is still in use today, within most point-and-shoot cameras because it is cheap to produce and easy to assemble, even using plastic lens elements. It would be safe to assume that these lenses render only about 50% of the resolution possible for a modern lens (1950-70s) that are using rare earth glasses, multi-element designs and vacuum-deposition coatings. Between 1885-1900 Zeiss, Abbe and Schott developed Apochromatic lenses such as the Protar, Planar and the Tessar at Zeiss. Highend lens performance jumped dramatically, but the designs were not widely adopted until the 1920-30s when the special glass became more widely available.

<[email protected]> 510-594-8277 Tim Vitale © 2006 use by permission only
22
In approximately 1935 practical lens coating was developed by Zeiss, but was not widely available until the war, 1940-ish, but only in Sweden or Switzerland. Rare-earth glass at the end of the 19th century (high index of refraction with low dispersion of light internally) and lens coating (lowered internal light reflection from the lens surface, from 5% to about 0.4% reflection, at air interfaces) were significant advances in lens design. By the 1950s, most lenses had adopted the vacuum-deposition coating technology, but their cost was still high. In the 1960’s the Japanese helped lower the cost of quality cameras and lenses with their Nikkor and Canon optics on SLR bodies with integrated metering. Nikon used Zeiss (Jena, pre-war; then Carl Zeiss Dresden (east) and then Carl Zeiss, west) and Leitz camera body developments, which start in the pre-war era. By the 1980’s lens technology had reached its zenith. Zeiss had some of the earliest computers 55 years ago. Computer aided lens designs have been used to tweak earlier Zeiss and Leitz lens designs for prime lenses, and, allowed improved zoom-lens development. Few zoom lenses come close to prime lens quality. Most zoom lenses have only 50-80% the resolution of the best prime lenses, but they do have greater depth of fielded. The LeicaR Vario-Elmar 80-200/4 ($800) is one of the few “best-available” zoom lenses. Few Nikkor or Canon zooms even come close. The Nikkor AF-S 80-200/2.8 IF-ED; Nikkor AF 35-70/2.8D; Canon EF 70-200/2.8 L (and USM); Canon EF 80-2000/2.8 L; Canon EF 28-70/2.8L USM; and Canon EF 28-80/2.8-4 L all are within 90-98% of the LeicaR Vario-Elmar 80-200/4. Evaluation a System: Camera, Lens and Film Using the photographic system Resolving Power Equation from Fuji, EQ2, from "FujiFilm Professional Data Guide" AF3-141E, 2002, p 129, the following result could be expected: Film Resolution in ppi
Film Resolution 1/r [film] Direct Contact at 30% Contrast Kodak Ektachrome 160 35 lp/mm 0.0286 1778 Fuji Astia RAP 45 lp/mm 0.022 2286
Fuji Provia 100F RDP 55 lp/mm 0.0182 2794 Kodak Tri-X 400 (2004) 65 lp/mm 0.0154 3302 Kodak Ektachrome 100GX 60 lp/mm 0.0167 3050
Fuji Velvia RVP 80 lp/mm 0.0125 4064 Kodak Portra 160NC Color Neg 80 lp/mm 0.0125 4064
Kodak Plus-X 125 (2006) 80 lp/mm 0.0125 4064 Kodak VR100 Color Neg 100 lp/mm 0.0100 5080 Kodak Technical Pan (2004) 142 lp/mm 0.007 7214 Kodak Panatomic-X 170 lp/mm 0.0059 8636
Lens Resolution 1/r [lens] Lens Cost Old lens (1840-1930) & LF lens 20 lp/mm 0.05 $50-1500 Average lens 40 lp/mm 0.025 $150-500 Very Good LF lens 60 lp/mm 0.0167 $300-800* Excellent LF lens 80 lp/mm 0.0125 $1000-3000** Superior 35 mm format lens 100 lp/mm 0.01 $350-5000***
Outstanding 35 mm lens 120 lp/mm 0.0083 $350-1000§ Exceptional 35mm lens 140 lp/mm 0.0071 $350-1000Δ
Best Possible 35mm lens 200 lp/mm 0.005 you won’t find one Vapor-ware lens 600 lp/mm 0.00167 you’ll hear about it, but can’t find one
* Many 35 mm, medium format and large format lenses at f8; or better lenses at f11 or f16. ** Schneider 150 APO Symmar f5.6 at f8. *** Many second tier lenses at f8. § Nikkor & Canon 50mm & 85mm lenses at f8, on a tripod, superior processing, film only, no prints. Δ Leica or Zeiss 35 mm or medium format lenses.
<[email protected]> 510-594-8277 Tim Vitale © 2006 use by permission only
23
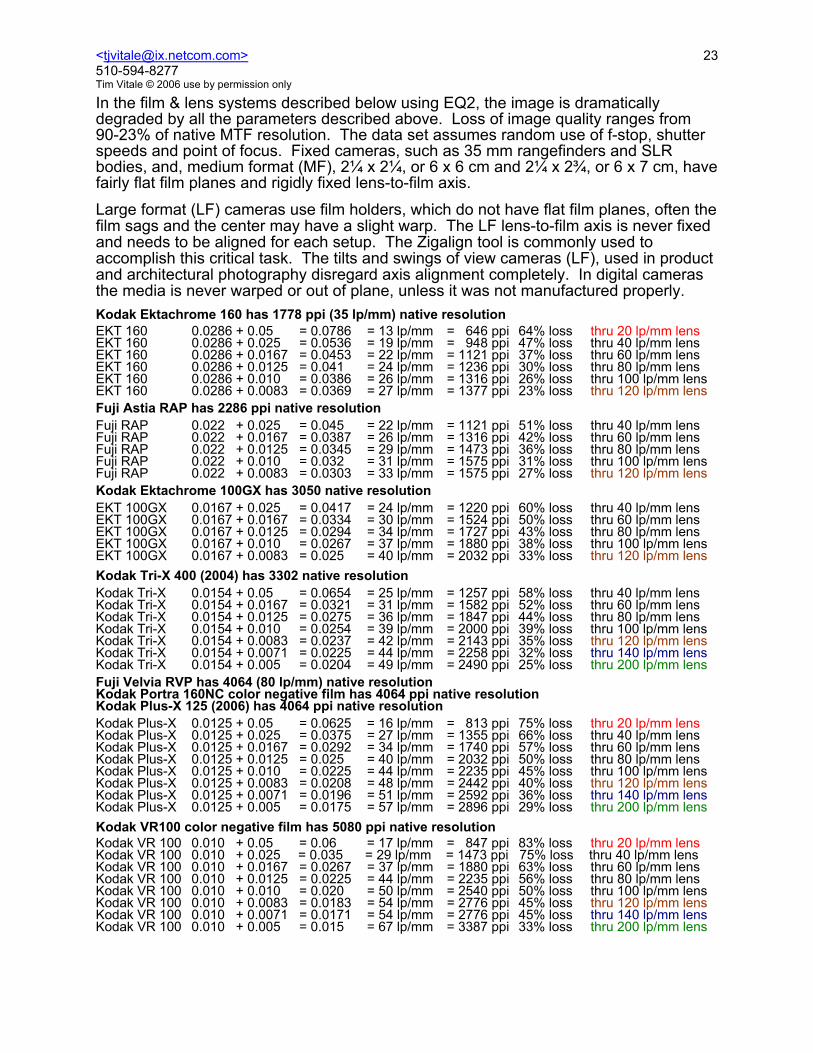
In the film & lens systems described below using EQ2, the image is dramatically degraded by all the parameters described above. Loss of image quality ranges from 90-23% of native MTF resolution. The data set assumes random use of f-stop, shutter speeds and point of focus. Fixed cameras, such as 35 mm rangefinders and SLR bodies, and, medium format (MF), 2¼ x 2¼, or 6 x 6 cm and 2¼ x 2¾, or 6 x 7 cm, have fairly flat film planes and rigidly fixed lens-to-film axis. Large format (LF) cameras use film holders, which do not have flat film planes, often the film sags and the center may have a slight warp. The LF lens-to-film axis is never fixed and needs to be aligned for each setup. The Zigalign tool is commonly used to accomplish this critical task. The tilts and swings of view cameras (LF), used in product and architectural photography disregard axis alignment completely. In digital cameras the media is never warped or out of plane, unless it was not manufactured properly. Kodak Ektachrome 160 has 1778 ppi (35 lp/mm) native resolution EKT 160 0.0286 + 0.05 = 0.0786 = 13 lp/mm = 646 ppi 64% loss thru 20 lp/mm lens EKT 160 0.0286 + 0.025 = 0.0536 = 19 lp/mm = 948 ppi 47% loss thru 40 lp/mm lens EKT 160 0.0286 + 0.0167 = 0.0453 = 22 lp/mm = 1121 ppi 37% loss thru 60 lp/mm lens EKT 160 0.0286 + 0.0125 = 0.041 = 24 lp/mm = 1236 ppi 30% loss thru 80 lp/mm lens EKT 160 0.0286 + 0.010 = 0.0386 = 26 lp/mm = 1316 ppi 26% loss thru 100 lp/mm lens EKT 160 0.0286 + 0.0083 = 0.0369 = 27 lp/mm = 1377 ppi 23% loss thru 120 lp/mm lens Fuji Astia RAP has 2286 ppi native resolution Fuji RAP 0.022 + 0.025 = 0.045 = 22 lp/mm = 1121 ppi 51% loss thru 40 lp/mm lens Fuji RAP 0.022 + 0.0167 = 0.0387 = 26 lp/mm = 1316 ppi 42% loss thru 60 lp/mm lens Fuji RAP 0.022 + 0.0125 = 0.0345 = 29 lp/mm = 1473 ppi 36% loss thru 80 lp/mm lens Fuji RAP 0.022 + 0.010 = 0.032 = 31 lp/mm = 1575 ppi 31% loss thru 100 lp/mm lens Fuji RAP 0.022 + 0.0083 = 0.0303 = 33 lp/mm = 1575 ppi 27% loss thru 120 lp/mm lens Kodak Ektachrome 100GX has 3050 native resolution EKT 100GX 0.0167 + 0.025 = 0.0417 = 24 lp/mm = 1220 ppi 60% loss thru 40 lp/mm lens EKT 100GX 0.0167 + 0.0167 = 0.0334 = 30 lp/mm = 1524 ppi 50% loss thru 60 lp/mm lens EKT 100GX 0.0167 + 0.0125 = 0.0294 = 34 lp/mm = 1727 ppi 43% loss thru 80 lp/mm lens EKT 100GX 0.0167 + 0.010 = 0.0267 = 37 lp/mm = 1880 ppi 38% loss thru 100 lp/mm lens EKT 100GX 0.0167 + 0.0083 = 0.025 = 40 lp/mm = 2032 ppi 33% loss thru 120 lp/mm lens Kodak Tri-X 400 (2004) has 3302 native resolution Kodak Tri-X 0.0154 + 0.05 = 0.0654 = 25 lp/mm = 1257 ppi 58% loss thru 40 lp/mm lens Kodak Tri-X 0.0154 + 0.0167 = 0.0321 = 31 lp/mm = 1582 ppi 52% loss thru 60 lp/mm lens Kodak Tri-X 0.0154 + 0.0125 = 0.0275 = 36 lp/mm = 1847 ppi 44% loss thru 80 lp/mm lens Kodak Tri-X 0.0154 + 0.010 = 0.0254 = 39 lp/mm = 2000 ppi 39% loss thru 100 lp/mm lens Kodak Tri-X 0.0154 + 0.0083 = 0.0237 = 42 lp/mm = 2143 ppi 35% loss thru 120 lp/mm lens Kodak Tri-X 0.0154 + 0.0071 = 0.0225 = 44 lp/mm = 2258 ppi 32% loss thru 140 lp/mm lens Kodak Tri-X 0.0154 + 0.005 = 0.0204 = 49 lp/mm = 2490 ppi 25% loss thru 200 lp/mm lens Fuji Velvia RVP has 4064 (80 lp/mm) native resolution Kodak Portra 160NC color negative film has 4064 ppi native resolution Kodak Plus-X 125 (2006) has 4064 ppi native resolution Kodak Plus-X 0.0125 + 0.05 = 0.0625 = 16 lp/mm = 813 ppi 75% loss thru 20 lp/mm lens Kodak Plus-X 0.0125 + 0.025 = 0.0375 = 27 lp/mm = 1355 ppi 66% loss thru 40 lp/mm lens Kodak Plus-X 0.0125 + 0.0167 = 0.0292 = 34 lp/mm = 1740 ppi 57% loss thru 60 lp/mm lens Kodak Plus-X 0.0125 + 0.0125 = 0.025 = 40 lp/mm = 2032 ppi 50% loss thru 80 lp/mm lens Kodak Plus-X 0.0125 + 0.010 = 0.0225 = 44 lp/mm = 2235 ppi 45% loss thru 100 lp/mm lens Kodak Plus-X 0.0125 + 0.0083 = 0.0208 = 48 lp/mm = 2442 ppi 40% loss thru 120 lp/mm lens Kodak Plus-X 0.0125 + 0.0071 = 0.0196 = 51 lp/mm = 2592 ppi 36% loss thru 140 lp/mm lens Kodak Plus-X 0.0125 + 0.005 = 0.0175 = 57 lp/mm = 2896 ppi 29% loss thru 200 lp/mm lens Kodak VR100 color negative film has 5080 ppi native resolution Kodak VR 100 0.010 + 0.05 = 0.06 = 17 lp/mm = 847 ppi 83% loss thru 20 lp/mm lens Kodak VR 100 0.010 + 0.025 = 0.035 = 29 lp/mm = 1473 ppi 75% loss thru 40 lp/mm lens Kodak VR 100 0.010 + 0.0167 = 0.0267 = 37 lp/mm = 1880 ppi 63% loss thru 60 lp/mm lens Kodak VR 100 0.010 + 0.0125 = 0.0225 = 44 lp/mm = 2235 ppi 56% loss thru 80 lp/mm lens Kodak VR 100 0.010 + 0.010 = 0.020 = 50 lp/mm = 2540 ppi 50% loss thru 100 lp/mm lens Kodak VR 100 0.010 + 0.0083 = 0.0183 = 54 lp/mm = 2776 ppi 45% loss thru 120 lp/mm lens Kodak VR 100 0.010 + 0.0071 = 0.0171 = 54 lp/mm = 2776 ppi 45% loss thru 140 lp/mm lens Kodak VR 100 0.010 + 0.005 = 0.015 = 67 lp/mm = 3387 ppi 33% loss thru 200 lp/mm lens
<[email protected]> 510-594-8277 Tim Vitale © 2006 use by permission only
24
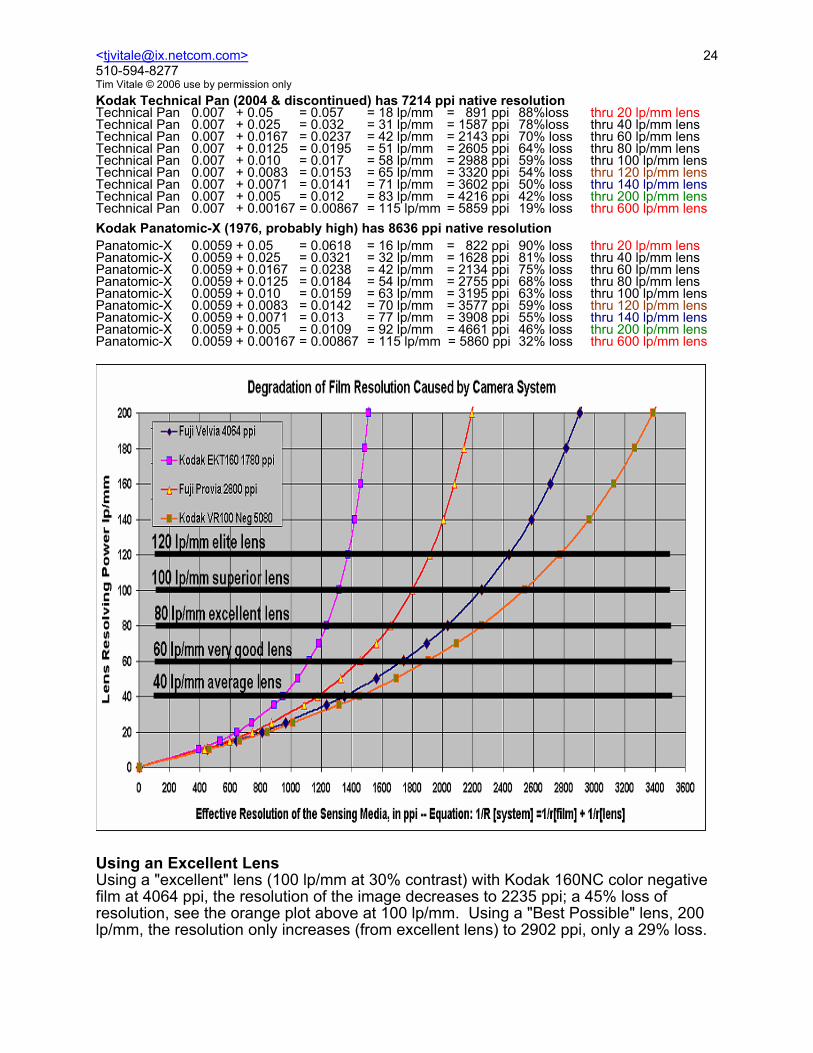
Kodak Technical Pan (2004 & discontinued) has 7214 ppi native resolution Technical Pan 0.007 + 0.05 = 0.057 = 18 lp/mm = 891 ppi 88%loss thru 20 lp/mm lens Technical Pan 0.007 + 0.025 = 0.032 = 31 lp/mm = 1587 ppi 78%loss thru 40 lp/mm lens Technical Pan 0.007 + 0.0167 = 0.0237 = 42 lp/mm = 2143 ppi 70% loss thru 60 lp/mm lens Technical Pan 0.007 + 0.0125 = 0.0195 = 51 lp/mm = 2605 ppi 64% loss thru 80 lp/mm lens Technical Pan 0.007 + 0.010 = 0.017 = 58 lp/mm = 2988 ppi 59% loss thru 100 lp/mm lens Technical Pan 0.007 + 0.0083 = 0.0153 = 65 lp/mm = 3320 ppi 54% loss thru 120 lp/mm lens Technical Pan 0.007 + 0.0071 = 0.0141 = 71 lp/mm = 3602 ppi 50% loss thru 140 lp/mm lens Technical Pan 0.007 + 0.005 = 0.012 = 83 lp/mm = 4216 ppi 42% loss thru 200 lp/mm lens Technical Pan 0.007 + 0.00167 = 0.00867 = 115 lp/mm = 5859 ppi 19% loss thru 600 lp/mm lens Kodak Panatomic-X (1976, probably high) has 8636 ppi native resolution Panatomic-X 0.0059 + 0.05 = 0.0618 = 16 lp/mm = 822 ppi 90% loss thru 20 lp/mm lens Panatomic-X 0.0059 + 0.025 = 0.0321 = 32 lp/mm = 1628 ppi 81% loss thru 40 lp/mm lens Panatomic-X 0.0059 + 0.0167 = 0.0238 = 42 lp/mm = 2134 ppi 75% loss thru 60 lp/mm lens Panatomic-X 0.0059 + 0.0125 = 0.0184 = 54 lp/mm = 2755 ppi 68% loss thru 80 lp/mm lens Panatomic-X 0.0059 + 0.010 = 0.0159 = 63 lp/mm = 3195 ppi 63% loss thru 100 lp/mm lens Panatomic-X 0.0059 + 0.0083 = 0.0142 = 70 lp/mm = 3577 ppi 59% loss thru 120 lp/mm lens Panatomic-X 0.0059 + 0.0071 = 0.013 = 77 lp/mm = 3908 ppi 55% loss thru 140 lp/mm lens Panatomic-X 0.0059 + 0.005 = 0.0109 = 92 lp/mm = 4661 ppi 46% loss thru 200 lp/mm lens Panatomic-X 0.0059 + 0.00167 = 0.00867 = 115 lp/mm = 5860 ppi 32% loss thru 600 lp/mm lens
Using an Excellent Lens Using a "excellent" lens (100 lp/mm at 30% contrast) with Kodak 160NC color negative film at 4064 ppi, the resolution of the image decreases to 2235 ppi; a 45% loss of resolution, see the orange plot above at 100 lp/mm. Using a "Best Possible" lens, 200 lp/mm, the resolution only increases (from excellent lens) to 2902 ppi, only a 29% loss.

<[email protected]> 510-594-8277 Tim Vitale © 2006 use by permission only
25
Note that the Canon Lenses listed in the plot above (EF 50mm f1.4 USM, EF 85 mm f-1.2 USM and EF 200 mm f-1.8 USM) are projected to have a resolution of 90-110 lp/mm (f8) based on data from the Photodo website <http://www.photodo.com/nav/prodindex.html> at the 30% contrast limit. The Schneider APO Symmar 150/5.6 MTF data is included to show the proper shape of an MTF curve for a excellent large format lens at f-11. The Canon lenses, above, probably have an additional 10-15% more resolution (at 30% contrast) that cannot be directly shown from the linear projection of the Lars Kjellberg <Photodo.com> lens evaluations. Lars Kjellberg <Photodo.com> used one of the standard high-end lens evaluation protocols that terminated MTF evaluation at 40 lp/mm. MTF is measured from the center of the lens to the edge of the lens glass, and is plotted along the x-axis. They evaluated MTF performance at 10, 20 and 40 lp/mm. It is rare to find MTF data to extinction (30% contrast, or even, to 1% contrast) at specific f-stops as in the Schneider APO Symmar 150/5.6 lens above. Another common evaluation protocol (used by Schneider, Zeiss and Rodenstock) ranges through the point of focus; they evaluate image height along the x-axis, through the center of the lens. Most lenses have best performance when focused at infinity, and poor performance at close focus, 1:1 or 1:2. When the <Photodo.com> data was harvested for use in these plots, the resolution was evaluated at the midpoint of evaluation: (a) 9 mm from the center for 35 mm lenses and (b) 21.5 mm from the center for MF lenses, with the sagittal and tangential axes averaged. Evaluation at the center of the lens would be too favorable for all but the ideal f-stop on the best lenses. It would increase MTF evaluations by 10-15 % at the wider f-stops (f 1.2 - 2.8) and the poorer lenses. Characteristically, this makes very little difference for f-8 iris setting and for the excellent lenses listed in these evaluations. For an Excel worksheet with the data contact the author [email protected].

<[email protected]> 510-594-8277 Tim Vitale © 2006 use by permission only
26
Note that in the Nikkor Lens MTF plot above, the Nikkor (a) AF 50mm f1.8, (b) MF 55 mm f2.8 and (b) AF 85 mm f-1.8, lenses show excellent behavior at f-8 (30% MTF contrast). As with the Canon, Zeiss and Leica lenses, they have resolution of approximately 90-100 lp/mm, this is referred to as “excellent” in the Resolution Power Equation section above. Nikkor zoom lenses have a reputation for good performance; unfortunately this just isn’t the case except for a few listed above. I have recommended the Nikkor 24-120 mm AF ED zoom lens in the past. In the <Photodo.com> MTF tests, their example had very poor performance, as all the zoom lenses of any manufacturer, except LeicaR 80-200/4.
<[email protected]> 510-594-8277 Tim Vitale © 2006 use by permission only
27
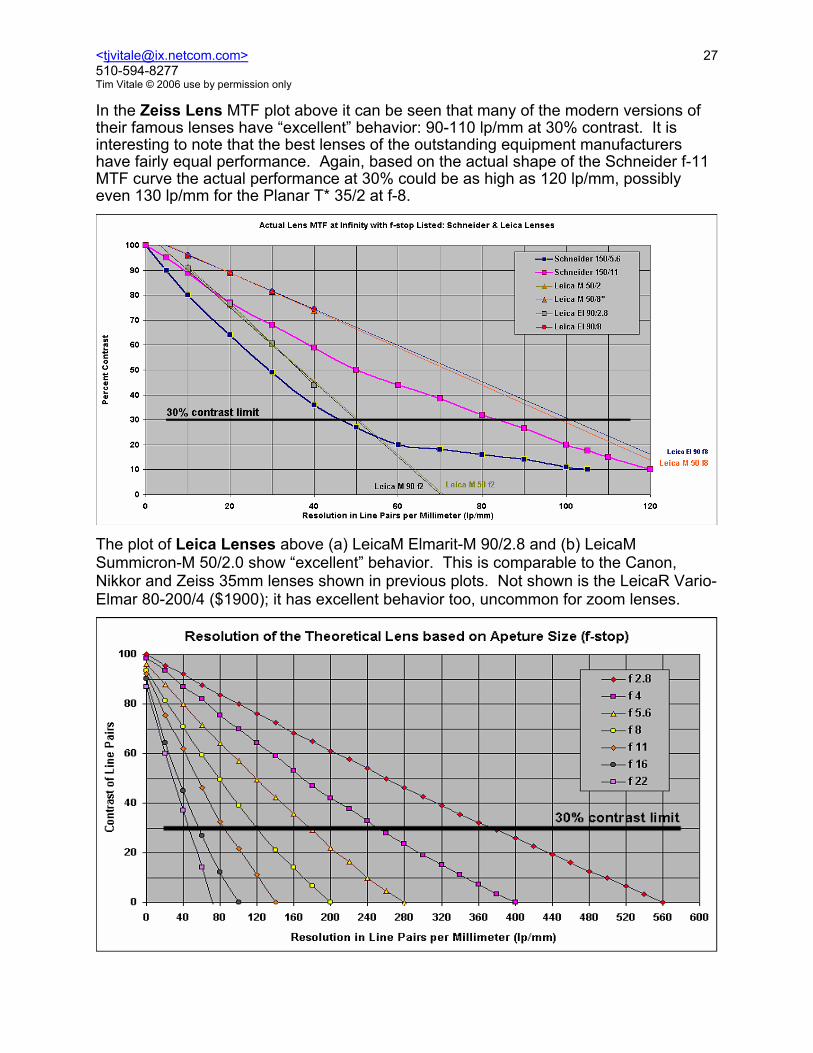
In the Zeiss Lens MTF plot above it can be seen that many of the modern versions of their famous lenses have “excellent” behavior: 90-110 lp/mm at 30% contrast. It is interesting to note that the best lenses of the outstanding equipment manufacturers have fairly equal performance. Again, based on the actual shape of the Schneider f-11 MTF curve the actual performance at 30% could be as high as 120 lp/mm, possibly even 130 lp/mm for the Planar T* 35/2 at f-8.
The plot of Leica Lenses above (a) LeicaM Elmarit-M 90/2.8 and (b) LeicaM Summicron-M 50/2.0 show “excellent” behavior. This is comparable to the Canon, Nikkor and Zeiss 35mm lenses shown in previous plots. Not shown is the LeicaR Vario-Elmar 80-200/4 ($1900); it has excellent behavior too, uncommon for zoom lenses.

<[email protected]> 510-594-8277 Tim Vitale © 2006 use by permission only
28
Theoretical Lens Resolution In the plot below, the resolution performance a “theoretical lens” is based on the limitations of the diffusion of light around the lens iris aperture. The smaller the aperture the greater the proportion of light diffused by the edge of the iris. Thus, the smaller the aperture (higher the f-number), the lower the resolution. Unfortunately, the small apertures (f-16, 22 and 32) are considered best by most large format photographers, because depth-of-field is greater when the aperture is smaller. Few lenses can perform in a theoretical manner. However, note that the excellent Schneider Apo Symmar 150/5.6 lens has almost theoretical behavior, at f-11. I had questioned whether the Lars Kjellberg Schneider APO Symmar 150/5.6 data is factual, but the f-5.6 plot convinced me that it was.
spherical and chromatic aberrations, coma and unflat field of focus, along with the flare from the eight air-glass interfaces (above right), compromise image quality when the Schneider APO Symmar 150/5.6. The f-8 lens aperture is commonly considered the best aperture for most lenses; that data was not provided for this lens.
In the plot above, the performance of a theoretical lens with an f8 aperture (green dotted line) has been overlaid onto the plot of the Leica lenses seen earlier. Notice in the plot above this graph, that the f-11 behavior of the Schneider APO Symmar 150/5.6 (purple) is almost identical to the behavior of the theoretical lens at f-11 aperture (brown). If the
Because of huge the hunks of glass used in a large format lens, they perform very poorly when wide open. The 150/5.6 is wide open at f-5.6. The plot for its f-5.6 aperture of the Schneider is similar to the f-22 plot for the theoretical lens, the worst aperture behavior shown. For comparison, the theoretical behavior of an f-5.6 aperture is the third line down from the top. Astigmatism,

<[email protected]> 510-594-8277 Tim Vitale © 2006 use by permission only
29
behavior of the two Leica lenses at f8 (two graphs above) also comes close to theoretical lens f8 behavior, as it does in the 10-40 lp/mm data points (4 red dots, in upper left), then the performance may be as high as 130-140 lp/mm, at 30% contrast. This could also be true of the excellent Canon, Nikkor & Zeiss lenses show in their respective plots earlier. In the following plot, two excellent new large format lenses are shown. More evaluation of the BetterLight Repro 180/5.6, 10:1, fixed at f8, when its development is completed. This performance data is theoretical and provided by the manufacturer. The lens is optimized for use at f8, the ideal f-stop, and for focus at 10:1 reduction on the film plane. All data below 30% contrast should be ignored.

<[email protected]> 510-594-8277 Tim Vitale © 2006 use by permission only
30
5 - Image File Format -- Introduction The file format is critical to the preservation of an image. The TIFF file (tagged image file format) is the current preservation format. This is because it holds all the spatial (resolution), color, tone, metadata and preservation information required to create a digital master of the original; see Section 3 “Digital is Excellent to Other Imaging Technology.” TIFF vs JPEG vs JPEG2000 The (original) JPEG format is a “lossy” compression format that decreases file size from 100 to 4000 times, by permanently removing image information. The compression changes spatial resolution, tonal range, color and further compression of the numerical derivatives of the all file components. It is not a preservation format. It is a very good tool for displaying images on a computer monitor with high access speeds. JPEG2000 is the next generation of image compression tools, using “wavelet” technology. It is called lossless, but this term is use relative to its predecessor, which was lossy and destroyed image information permanently. It will not replace the ease of use and simplicity of the original JPEG format. It improves the quality of the image at high transmission rates. At low transmission rates it offers improved image quality over JPEG, but the file size is larger. The use of JPEG2000 requires special software downloads (1) for creation in Photoshop and (2) in order to open the file in web browsers. The implementation is still in the “initial users” phase; widespread adoption seems slow for some reason. TIFF is a file wrapper only. It preserves the original capture information in either Mac or PC word order, at full resolution and bit depth. It does not transform the data. Faulty capture and storage protocols will be reflected in the saved image file; use of good software tools such as Photoshop must be used for best performance. TIFF header and tag readers are available. TIFF File Format A TIFF file (Tagged Image File Format) is a “file wrapper” that contains all the elements and tags required to hold bitmapped raster or vector images in Grayscale, RGB, CMYK, CIELab and YCbCr color spaces. Other properties include:
• Uncompress 8-, 12-, 14-, 16- & 32-bit images • Compression possible: LZW lossless, and, JPEG & JBIG: lossy • Any Resolution: (typically 100-10,000 ppi) • Metadata • ICC profiles • 32-bit architecture • 4 GB file size limit • 255+ tags (v6): 25 Baseline tags, including pixel density, image copyright, date and time;
65 Extended tags, white point, JPEG tags and YCrCb coordinates; 80+ Private tags, including Photoshop options and ICC profiles; 55 EXIF tags, camera technical metadata; 30 GPS tags, geographical location metadata
<[email protected]> 510-594-8277 Tim Vitale © 2006 use by permission only
31
The virtue of a file wrapper is that it holds original data in the original order and format. The value of the TIFF format is that it can contain a perfect version of the capture, with full resolution and color, pixel-by-pixel. Data is held uncompressed with relevant metadata about the technical creation parameters, including device and settings, image visual description terms, copyright data, and file preservation parameters. The TIFF format does not require a license. The specific software used to make the TIFF image file is critical. Some brands of imaging software can make TIFF image files that may not be able to be opened by other imaging software, because of proprietary methods of tiling, row layout and cell dimensions. Adobe Photoshop is the only package to use for fully functional imaging. The new Apple Aperture is still too new to be evaluated. A TIFF file has the RGB, CMYK, Lab, YCrCb or grayscale values assigned to each pixel. The number of pixels with attached color data is defined by the size and resolution of the image. Every pixel in the captured image is stored in the file. If an ICC profile is not applied, the image is captured without the use of automated routines and the grayscale is corrected to neutral, with a very high probability that the colors of the original scene or image match the original within the format. A PowerPoint presentation on “Getting the Most from a TIFF image” can be found at <http://aic.stanford.edu/sg/emg/library/2005-06-vitale-documentation-tiff-image/2005-06-vitale-documentation-tiff_files/v3_document.htm>. The tags in the TIFF file can be viewed in the Windows platform using TiffTagViewer <http://www.awaresystems.be/imaging/tiff/astifftagviewer.html>. TIFF Lossless Compression Option LZW compression is the lossless type. However, it will only decrease the file size by 3-30%. If compression must be used, lossless compression is the most sympathetic. Use of any type of compression is NOT recommended. BigTIFF – Next Generation The current limitation of a TIFF image file is that it uses 32-bit offset architecture, which means it is limited to a maximum of 4 GB file size. Up until about 2004, Photoshop could not handle greater than 2 GB of RAM, and could not open or create images with more that 90,000 pixels in one direction, with a 4 GB file size limitation. The next generation of the tagged image file format is BigTIFF <http://www.awaresystems.be/imaging/tiff/bigtiff.html> with 64-bit architecture. BigTIFF closely resembles today’s TIFF format. The existing TIFF libraries can quite easily extend their support to the new BigTIFF variant; additional documentation needs are minimal. All the properties of TIFF that have been around for a decade, which have been extended and expanded several times, are still present in BigTIFF. All known tags are being reused in BigTIFF; all supported bit-depths and data types remain valid. The arbitrary number of extra channels, tiling and striping schemes, variety of optional compression schemes and the private tag schemes that made TIFF useful in pre-press, storing scientific data, preservation and many other applications, all remain intact. JPEG File Format Images saved in lossy compression formats such as JPEG are not meant for high-resolution imaging, nor, was the format created to be used for image preservation. The JPEG format was created by the Joint Photographers Expert Group (started in 1986, released 1992) to allow for quick access and display of an image on the web. Its use as a primary imaging format such as in DSLR cameras was not an intended goal of
<[email protected]> 510-594-8277 Tim Vitale © 2006 use by permission only
32
the committee. The JPEG format was adopted by the camera manufacturers to compensate for the small size of the original memory cards (8-32 MB) used to store images onboard the camera. In an era of 1 GB+ memory cards, the JPEG format is not necessary for the storage of 150, 7-MB, Camera RAW format images. JPEG is a discrete cosign algorithm. For a given quality setting (1-12), different images will yield widely differing file sizes and image appearances. An image with lots of texture and fine detail will produce a large JPEG file, while one consisting only of blue sky will be very small. The JPEG compression process uses the DCT (Discrete Cosign Transfer) coding algorithm. The compression process is built on:
• 8-bit RGB support only, forces higher bit rates to 8-bit, possible 2:1 compression • Conversion to YUV/YCrCb color space, 128 steps rather than 256 per channel • YUV (4:4:4) values are downsampled to 4:1:1 -- 3:2 compression • Spatial compression in 8x8 blocks of 8-bit pixels – approx. 2:1 compression • High frequency data zeroed out of 8x8 DCT blocks – data lost • 8x8-DCT block coefficients are quantitized to variable levels of data compression • Entropy coding to reduce repetitive Hex codes, called Huffman coding, based on a zigzag
pattern using variable length codes and integers -- an additional level of variable data compression
Lossy compression is an irreversible way of reducing the size of data by approximating it from the original bitmap image. Once bitmapped (raster) image information has been lost it cannot be recovered, except by starting the process from the original bitmap. Trying to improve the appearance of a JPEG image by re-compressing at a higher quality setting achieves very little except an increase in file-size. JPEG Rate of Compression: Example An 87 MB, TIFF color file, that is down-sampled to a 40-60 KB JPEG file will be compressed about 1500:1 through the above process. Much of the valuable image information has been lost in this process, but the JPEG file is good enough for viewing on a monitor. CRT monitors (cathode ray tube) are imperfect analog output devices with resolution equivalent to about 72-96 dpi and a tonal range of 35:1 (CRT) or about 5 f-stops of light. The average film has about 7-12 f-stops of light. An original image before compression has the tonal range of the device, which can range from 5-stops (8-bit) to 13-stops in 16-bit imaging systems. Many of the better monitors, both CRT and LCD, have higher resolution depending on settings. Modern LCD displays can have a tonal range of 300:1, 7.5-stops of light, up to 900:1, about 10 f-stops of light, for the most expensive ($4k) LCD, 21-23” displays. The BrightSide DP37-P LCD display <http://www.brightsidetech.com/products/dr37p.php> and <http://www.bit-tech.net/hardware/2005/10/03/brightside_hdr_edr/1.html> has a 200000:1 dynamic range, that is 17-2/3rds stops, with a Dmax of 5.3. At $7000, it is out of the reach of most, but in 5 years it will be common. The prints from a high-resolution inkjet printer have a resolution of about 1440 dpi, and 2880 in one direction. At 1440 dpi, its resolution is a 20-times increase in resolution over the 72-ppi resolution of the standard monitor. The typical tonal range of an Epson Ultrachrome inkjet print is about 2.1 D, or 7-stops of light.
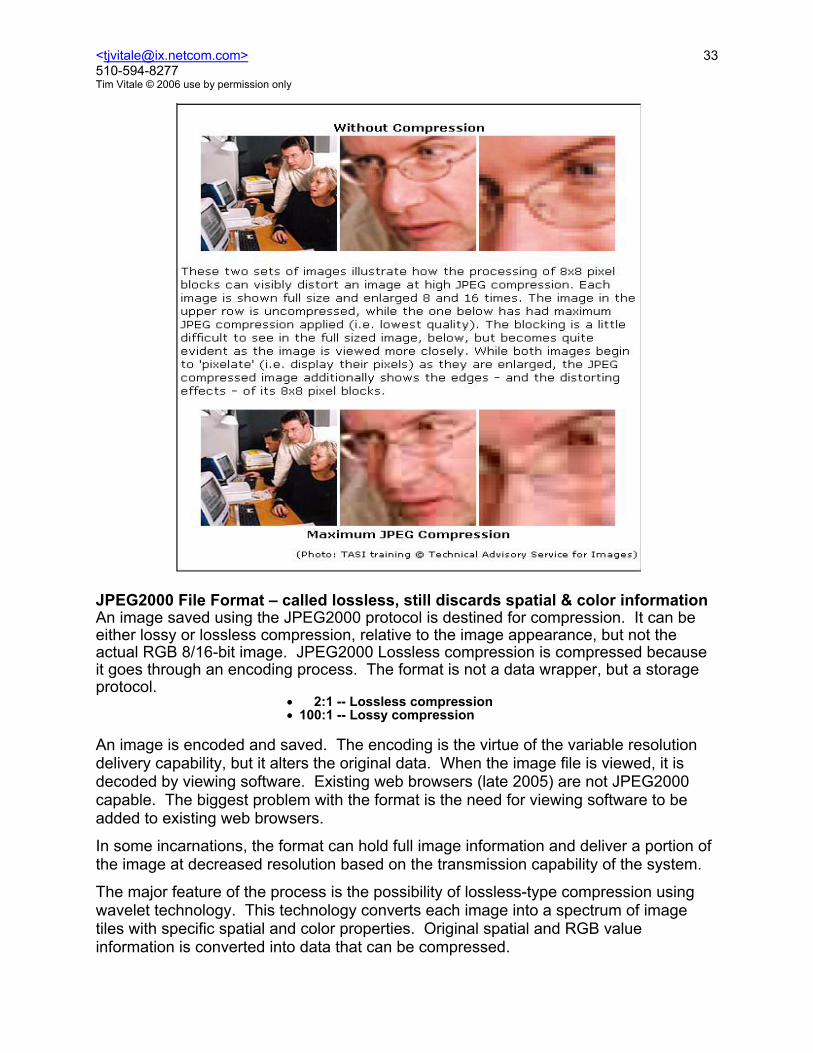
<[email protected]> 510-594-8277 Tim Vitale © 2006 use by permission only
33
JPEG2000 File Format – called lossless, still discards spatial & color information An image saved using the JPEG2000 protocol is destined for compression. It can be either lossy or lossless compression, relative to the image appearance, but not the actual RGB 8/16-bit image. JPEG2000 Lossless compression is compressed because it goes through an encoding process. The format is not a data wrapper, but a storage protocol.
• 2:1 -- Lossless compression • 100:1 -- Lossy compression
An image is encoded and saved. The encoding is the virtue of the variable resolution delivery capability, but it alters the original data. When the image file is viewed, it is decoded by viewing software. Existing web browsers (late 2005) are not JPEG2000 capable. The biggest problem with the format is the need for viewing software to be added to existing web browsers. In some incarnations, the format can hold full image information and deliver a portion of the image at decreased resolution based on the transmission capability of the system. The major feature of the process is the possibility of lossless-type compression using wavelet technology. This technology converts each image into a spectrum of image tiles with specific spatial and color properties. Original spatial and RGB value information is converted into data that can be compressed.

<[email protected]> 510-594-8277 Tim Vitale © 2006 use by permission only
34
In a format that is larger than a TIFF file, the original data can be saved in the file, and delivered at lower resolution upon request. However, when seeking file size compression, original spatial and color information is lost. The wavelet compression process is said to preserve more of the color and spatial information than the former JPEG process; thus, it is given the designation of “lossless compression.” The encoding process follows these steps:
• Data Ordering • Arithmetic Coding • Coefficient Bit Modeling • Quantization • Wavelet Transformation • DC Level Component Transformation
The purity of the Mac or PC bit stream, at any bit depth and any color space is altered when saved in the JPEG2000 format. JPEG2000 is excellent for delivering lightly color-compressed images with at variable levels of resolution. This is best done with known area of interest. Variable resolution access with no areas of interest is completely possible, but at higher files sizes. There are very few implementations of the JPEG2000 technology, more work needs to be done before general understanding and acceptance will be possible. There are supporters of the format <http://www.oreillynet.com/pub/a/javascript/2003/11/14/digphoto_ckbk.html>, while <http://graphicssoft.about.com/gi/dynamic/offsite.htm?zi=1/XJ&sdn=graphicssoft&zu=http%3A%2F%2Fwww.levien.com%2Fgimp%2Fjpeg2000%2Fcomparison.html> some evaluations draw the value of JPEG2000 into question. Additional information can be found at <http://rii.ricoh.com/~gormish/pdf/dcc2000_jpeg2000_note.pdf>, which has 24-page overview of the format. An early version of the ITU specifications can be found online at <http://www.jpeg.org/public/fcd15444-1.pdf>; modern versions have to be purchased through standards organizations.

<[email protected]> 510-594-8277 Tim Vitale © 2006 use by permission only
35
6 - Storage of Digital Image Files The safest and most cost effective method of storing image files is to use a hard drive (HD). A modern HD will have a useful life of about 5 years before its size will become impossibly small and the data will be migrated to a new HD. Based on average MTBF data (mean time between failure), file migration will occur long before a HD will fail. Even though MTBF data suggests otherwise, backup of primary storage is always recommended because the drive could fail before the predicted MTBF. In the past CDR were considered suitable for archival storage. Life expectancy (LE) predictions for optical media vary widely and are based upon multiple factors including: data density, layer bonding, reflective & dye layers and writing speed. DVD-R’s have few independent performance records, but they are certainly not as stable as CDR because the density of data is about 6-times higher and they are not using the most stable dye layer. Optical disks hold only relatively small amounts of data for the effort required to make and certify the disks for archival use. In time CDR and DVD-R drives will become obsolete, just as Floppy drives are now rare to find on new computer hardware. In addition, optical media is not as easy to migrate as External HDs. One just plugs in the External HD, drags the target folder(s) to the new HD and walks away while the file transfer proceeds. No additional action is required upon completion; file verification is integral to the process. Storage Recommendation Purchase a new External HD every year, as you would a “brick” or two of film (20 rolls to a brick), for storage of the year’s digital records. Back-up last year’s HD on this year’s drive. Migrate data from older drives to a larger drive after 3 to 5 years. Notice that the purchase cost of a new HD each year is well below the cost of film and development it replaces. Any External HD can be used to back-up files on several computers or External HDs. Eventually, purchasing a new HD every year will become accepted digital documentation practice. A generic External HD in metal case with fan holding a 7200 RPM, 8-16 MB buffer, 250 GB HD is about $150; next year a 500 GB External HD will be $150. Try using the Pricewatch website <<http://www.pricewatch.com/>> to find the best price for a HD, external case or External HD. Favor External HD enclosures that have an internal fan ($15 more expensive); metal cases transmit heat more efficiently than plastic. IT Department Many conservators are finding that the IT department has become the default curator of their images. The principal reason for this is that the IT department runs the servers that store institutional information, and, they often limit the purchase of computer equipment, forcing files to be held on their servers. The IT Department has a very different set of working criteria than those needed for storing image files. The IT folks want small files so they can be moved around quickly on a standard Ethernet and served up quickly to the Internet. The large size of image

<[email protected]> 510-594-8277 Tim Vitale © 2006 use by permission only
36
files means they clog the Ethernet and take up a disproportionate amount of precious storage space on IT servers. The experience of the IT department is that text files can be compressed with no observable loss of information and that the heavily compressed JPEG images look fine on computer screens. They have little experience with, or appreciation for, the numerical RGB values behind the screen color in a TIFF file. Compressing image files destroys information that cannot be restored later. LZW lossless compression of TIFF files decreases size by no more than 30%, and often only 3-10%, depending of subject matter. This compression rate is of little value when TIFF files are 100 -1000 times the size of a JPEG file. The true value of a TIFF image is the RGB color numbers that are attached to each pixel. While this data cannot be seen on the screen or in a print, it is of immense added value over film that misrepresents color and has no numerical data that is potentially traceable to the actual color in the image. More information on this topic was presented at the AIC 2005 General Session in a PowerPoint presentation entitled “Getting the Most from a TIFF Image”; it is available in the EMG Library. In many cases an IT Department will be using older equipment because it can still serve up information at accustomed rates. A simple solution might be to increase the storage capabilities of these older servers. However, increasing storage on older IT equipment is expensive; although modern servers can add a Terabyte (TB) for about $10K, 5-year-old equipment will cost $250K to add a TB and 10-year-old technology would run about $½ -1M. A direct solution is to store full-sized TIFF image files locally, while sending a JPEG version to the IT Department. This satisfies institutional requirements, saves IT staff time and forestalls expensive upgrades to older IT equipment. An automated routine for making JPEG images with a specific resolution, pixel width and degree of compression can be made and saved in Photoshop (see notes at end). Negotiating with the IT department to store TIFF image files locally will require sophistication and cunning similar to that used to keep fragile artworks from travel or display. Remember to:
• offer to make the JPEG yourself • use your budget for local HD storage • stress the color fidelity of the RGB values • stress that you are saving IT staff time and money
Photography departments in some institutions may be in the process of adopting an all-digital workplace, requiring purchase of all new equipment including cameras, film scanners and computers with more RAM and storage. The size of this expenditure serves to focus the IT Department on the needs of their professional photographers. Photographers are using the TIFF format for storing and archiving an image. In addition, many institutions are adopting institutional storage of large numbers of, large-sized image files, in new centralized image servers. Often this involves installing a new dedicated Gig-Ethernet (1000-10,000 Mb/s) over wire or optical fiber, and a new multi-TB file server. Optimistic conservators are suggesting that this new commitment to

<[email protected]> 510-594-8277 Tim Vitale © 2006 use by permission only
37
imaging by some institutions will, in time, bring an understanding of image technology to all IT Departments. Internal and External Hard Drives Most computer boxes have space for one to two additional internal HDs. One could add two internal SATA, 7200 RPM, 500 GB HDs (1 TB) with 16 MB buffer for $800; this makes phenomenal economic sense. Buying large HDs from the computer vendor will be easier, but will cost you about 100% more (think “options” at the auto dealer). There is nothing easier than adding a HD to an existing computer. External HDs are just a HD in a powered external case. Enclosures can be of three types: FireWire, USB or a combination of both FireWire and USB. The size of the HD is also significant: a 2.5” HD (more expensive HD used in laptops), often called “Pocket HD” can run from USB or FireWire bus power (greater battery drain on notebooks, however) while the larger 3.5” drives require larger enclosures with external power supplies (and a fan, if lucky). Pocket External HDs (think iPod) are easier to use but cost about 100% more. There are numerous online sources to explain the port speeds and advantages; but computers that originally supported USB 1.0 (very slow, 1.25MB/s) and FireWire400 (50 MB/s) cannot support the faster second generation port speeds without the upgrade of an internal PCI card, or PC card (notebook). If you don’t know, assume the slower speed and add an extra $50-100 to your budget. Because FireWire has peer-to-peer architecture it will perform better, especially when multiple drives are attached. USB connectivity is more common, so will be simpler to use when you need to share files with someone else. While transferring a whole HD has never been easier using FireWire800 (100 MB/s) or USB 2.0 at 480 Mb/s (60 MB/s), moving 250 GB of files will still take hours depending on your computer's internals. If an external HD should fail to work, check the power transformer (light on, if supplying power) because they fail more often than the HD, and swap out the cable from your backup supply of 2-3 extra cables. Cable failure is much more common than any other problem. The most desirable external image storage solution is to use what digital videographers have been using for a few years: a dedicated External RAID Array running in the RAID 3 or 5 mode. The use of a modern RAID Array will generally get the attention of your IT department because it is similar to their technology, prudent redundant storage and more economical than past incarnations, which could cost thousands of dollars for a few tens of GBs of storage when using expensive SCSI dives internally. Today’s RAID Arrays use inexpensive but reliable SATA or EIDE drives internally and start at $1300. Longevity of Hard Drives Most modern HDs have a rating of 100,000+ hours MTBF, about 11 years of continuous use, with a 5-year warranty (about half MTBF). Most HDs have MTBF data on the label physically attached to the HD; this information is commonly not found online. Modern HDs use liquid bearings <http://www.ebearing.com/news2001/news187.htm> and other technology to increase life substantially. Many Maxtor, Seagate and Hitachi SATA drives have a predicted life of 100,000 (11 yrs) to 600,000 hours (69 yrs); some are far higher. Only 10 years ago HDs had a real life of 3 years, or less. I have used at least 25 HDs

<[email protected]> 510-594-8277 Tim Vitale © 2006 use by permission only
38
since 2000, and have not had a failure in 5 years. The HDs were migrated and retired, as too small, or they are still active. It is expected that in 5 years, HDs will have tens-of-TB capacities; this will make today’s 250 GB HDs impossibly small, and therefore, inefficient in a computer or external enclosure. The key to HD longevity is to keep it as cool as possible. Metal enclosures transfer heat better than plastic. Stand an external case on edge with space all around. Favor larger enclosures with an internal fan, or multiple fans, even in single drive enclosures. Some RAID systems have multiple fans with excellent cooling capacity because it is meant for the continuous transfer of video data at 1.6 Gb/s. RAID Array Systems Consider using a RAID Array <<http://en.wikipedia.org/wiki/Redundant_array_of_independent_disks>> for image storage. RAID 0 uses all drives in the array for storage while RAID 5 uses one drive for parity storage (80% total capacity), but can rebuild a failed drive from the redundant information. The redundant distribution of the data around a mode 3 or 5 array will allow reconstitution of the lost data when the failed drive is replaced (about $150-350). HUGE System’s SCSI RAID (0/3/5) array uses an SATA internal bus and a 320 UltraSCSI interface with the computer <<http://www.hugesystems.com/Products/>>. They use inexpensive SATA drives with 150-325 MB/s bus speed. The 320 UltraSCSI interface maintains a sustained 200 MB/s transfer rate with your computer. The 800 GB-version of the SCSI external RAID (0/3/5) Array is about $2500 and the 4.2 TB-version is about $10,000, but prices are dropping monthly. Each array appears as one drive on your computer and has a programmable RAID controller that takes care of formatting, striping, RAID functions and built-in diagnostics to monitor performance and health. A less expensive solution is the LeCie F800 external FireWire RAID Array (0/0+1/5). The 1 TB-version is $1300 and uses four internal 250 GB drives. The 1.6 TB-version costs $1700 and uses four 400 GB drives. Anthology Systems has just announced its NAS (network attached storage) “Yellow Machine” with RAID 0, 0+1,1 & 5 Array with integral LAN switch using eight 12.5 MB/s (100 Mb/s) LAN ports, firewall and more. The 1 TB version is $1300, and the 1.6 TB version is $2000 <https://www.anthologysolutions.com/products/index.htm (there is also a very nice description of RAID configurations in PDF). LAN speed is significantly slower than USB and FireWire port systems because it is based on 10/100 Ethernet (12.5 MB/s maximum). CD and DVD Optical Storage There are differing opinions concerning the life expectancy (LE) of optical discs. In 1996 the NML rated the average CDR at 2.5 years LE, these 10-year-old predictions have proved correct for some of the older CDR. Joe Iraci (CCI Senior Scientist) rates the average modern CDR at 15 years, but this has yet to be tested by time. An average CDR is projected by Iraci to have a (Phthalocyanine) green dye layer with silver-colored backing and burned at 48x without verification. I have several CDR that failed within 3-5 years. I also have many more CDR that are older and remain readable; the difference is that I "believe" that they are on borrowed time based on NML prediction and I have therefore backed-up the information on HDs.
<[email protected]> 510-594-8277 Tim Vitale © 2006 use by permission only
39
Both CDR and DVD-R have much less longevity than predicted by their manufactures. Kodak Ultima CDR, Gold-on-Gold and Silver-on-Gold with Phthalocyanine dye layer, were rated by Kodak at 217+ and 100+ years respectively. The NML predicted 50 and 25 years LE, respectively. The Kodak Gold-on-Gold CDR were discontinued as too expensive to make, but the Ultima Silver-on-Gold are still available. MAM (formerly Mitsui) the industry leader, rate their Gold/Phthalocyanine CDR at 300+ years < <http://www.mam-a.com/technology/quality/longevity.htm>> but their actual life is probably no more than 50 years. MAM predicts 100+ years for their Gold DVD-R but the actual longevity is probably 15+ years (three times less than CDR) because of higher density (6x higher) and lack of a Phthalocyanine dye layer. Many other media distributors relabel MAM disks; check the AMIA-L listserv for details. There is no doubt that the CDR and DVD-R recording process can be made quite reliable with:
• Outside testing of your system (optical disk test service) • Slow write speeds of 2X - 8X • Reliable media such as Kodak or MAM (or resellers) • Phthalocyanine dye layer • Gold reflective layer • Committed technician
Hard Drives Always Live Always live, is the current accepted best practice for HDs. "Live," means connected to a computer or a server; always accessible; always on and active. Network administrators recognized that the current MTBF data predict that HDs will be migrated before they fail. Additional Digital Storage Information Readers can find a full version of this essay posted on the EMG website <<http://aic.stanford.edu/sg/emg/library.html>> -- Google <EMG Library>. It contains additional CDR and DVD-R information. The EMG Library has a PDF of Joe Iraci’s latest publication on “The Stability of Optical Disc Formats” from the most recent Restaurator (v26, #2, pp 134-150); unfortunately there are no life expectance predictions. The EMG will also be posting step-by-step methods for making automated JPEG routines in Photoshop:
• >File >Automate >Batch • >File >Automate >Make Droplet
Jeffery Warda created the excellent how-to diagrams. Making automated routines is similar to programming: patience, attention to detail and debugging are required. Grateful acknowledgement is given to Lisa Goldberg for excellent editing and insightful contributions. The errors are mine. Tim Vitale Paper, Photographs & 510-594-8277 Electronic Media Conservator 510-594-8799 fax Digital Imaging & Facsimiles <[email protected]> Film Migration to Digital Preservation and Imaging Consulting Preservation Associates 1500 Park Ave. Suite 132 Emeryville, CA 94608