Embed Size (px)
Citation preview
European Journal of Neuroscience, Vol. 9, pp. 396-409, 1997 0 European Neuroscience Association
Differential Effects of Acetylcholine on Neuronal Activity and Interactions in the Auditory Cortex of the Guinea-pig
Daniel E. Shulzl, Shuki Cohen, Sebastian Haidarliu and Ehud Ahissar Department of Neurobiology, Weizmann Institute of Science, 76100 Rehovot, Israel ’Equipe Cognisciences, lnstitut A. Fessard, CNRS, 91 190 Gif sur Yvette, France
Keywords: acetylcholinesterase, autocorrelation, carbachol, cross-correlation, functional connectivity
Abstract During normal brain operations, cortical neurons are subjected to continuous cholinergic modulations. In vitm studies have indicated that, in addition to affecting general cellular excitability, acetylcholine also modulates synaptic transmission. Whether these cholinergic mechanisms lead to a modulation of functional connectivity in vivo is not yet known. Herein, the effects were studied of an iontophoretic application of acetylcholine and of the muscarinic agonist, carbachol, on the ongoing activity and co-activity of neurons simultaneously recorded in the auditory cortex of the anaesthetized guinea-pig. lontophoresis of cholinergic agonists mainly affected the spontaneous firing rates of auditory neurons, affected autocorrelations less (in most cases their central peak areas were reduced), and rarely affected cross-correlations. These findings are consistent with cholinergic agonists primarily affecting the excitability of cortical neurons rather than the strength of cortical connections. However, when changes of cross-correlations occurred, they were usually not correlated with concomitant changes in average firing rates nor with changes in autocorrelations, which suggests a secondary cholinergic effect on specific cortico-cortical or thalamo-cortical connections,
Introduction
The neocortex is innervated by cholinergic fibres that originate in the basal forebrain (reviewed in Mesulam, 1995). In the auditory cortex of the rat (Lysakowski et al., 1989), cat (Irle and Markowitsch, 1984) and monkey (Mesulam et al., 1983), the presence of cholinergic innervation was demonstrated by using different cholinergic markers, such as acetylcholinesterase [AChE, the degradative enzyme of acetylcholine (ACh)] and choline acetyltransferase (ChAT, the synthesizing enzyme of ACh). The majority of the cholinergic projections to the cortex originate in extracortical structures, mainly in the nucleus basalis magnocellularis (Mesulam, 1995).
The possible implication of ACh in cortical sensory processing has become of considerable interest because of ACh’s involvement in behavioural processes related to selective attention, arousal, motiva- tion and reward (reviewed in Semba, 1991), as well as in cellular plasticity (Hars et al., 1993; Auerbach and Segal, 1994; Ahissar et al., in press). The role of ACh in these processes has been analysed at the biophysical and functional levels in different species and cortical sensory areas (McCormick, 1992a). The iontophoretic application of ACh or the stimulation of the basal forebrain result in a muscarinic- mediated modulation of firing modes (McCormick and Prince, 1986; Metherate el al., 1992; Cox et al., 1994). Studies of the modulation by ACh of receptive field properties of sensory cortical neurons for different modalities (Sillito and Kemp, 1983; Sat0 et al., 1987; Lamour et al., 1988: Metherate et al., 1988; Bassant et al., 1990) generally show a facilitatory influence of muscarinic agonists on cortical neurons, with varying proportions of cells inhibited by ACh.
This latter inhibitory effect is usually attributed to the excitation of intracortical inhibitory interneurons (McCormick and Prince, 1986; Muller and Singer, 1989).
Despite a wealth of studies focusing on the effects of ACh on ongoing activity and sensory responses at the level of the single cell, studies on the possible modulatory effects of ACh at the level of intercellular communication are lacking. It is usually assumed that most action potentials discharged by cortical neurons are the result of a joint effect of correlated inputs (Abeles, 1982b). Modulation of correlated activity could be achieved by activation of the cortical cholinergic basal forebrain system, which is known to change the global activity state of the cortex (Semba, 1991) and the thalamo- cortical transmission gain (Metherate and Ashe, 1993). The various effects of ACh that have been described at the biophysical level, usually in in vitro preparations, predict different outcomes on the network activity and cross-interactions between cells. While the modulation of excitatory synaptic transmission (Markram and Segal, 1990, 1992) predicts increased levels of functional coupling between neurons, which result in turn in changes in firing activity, the effects of ACh on excitability and firing modes (McCormick and Prince, 1986) predict a different scenario in which the firing rates will be primarily affected by ACh in vivo and interneuronal interactions will be affected to a lesser degree, if at all.
In this study, we compared the effect of ACh on neuronal excitability and functional connectivity. The effects of an iontophoretic application of ACh or of a muscarinic agonist, carbachol, on the ongoing firing
~~
Correspondence to: Dr Daniel E. Shulz, CNRS, Institut A. Fessard, 1 Avenue de la Terrasse, 91190 Gif sur Yvette, France
Received I July 1996, revised 30 September 1996, accepted 9 October 1996
Cholinergic modulation of correlated activity 397
rates and auto- and cross-correlations were studied in the auditory cortex of the anaesthetized guinea-pig. Preliminary accounts of these data have been presented in abstract form (Cohen et al., 1994; Shulz et al., 1995).
Materials and methods
Histochemical localization of acetylcholinesterase A standard histochemical staining procedure (Biegon et al., 1986) was used to localize AChE in the auditory cortex. Briefly, an adult guinea-pig was decapitated, and its brain was quickly removed, blocked in the plane of section, and frozen on dry ice. Two series of interleaved coronal sections of 30 mm were made with a cryostat and collected on gelatin-coated slides. One series was used for Nissl staining and the other for AChE histochemistry. For the latter, the sections were fixed on the slides in 10% phosphate-buffered formalin for 30 s. The sections were then washed in PBS and incubated (2 h, 37” C) in a 0.05 M acetate buffer (pH 5) containing 10 mM glycine, 2 mM copper sulphate, 4 mM acetylthiocholine iodide, and 10 mM ethopropazine. The stain was developed for 1 min at room temperature in 1.25% sodium sulphide at pH 7.5 and intensified for 1 min in a 1% silver nitrate solution. Finally, the slides were transferred to phosphate-buffered formalin for 30 min, dehydrated through a series of alcohols, cleared in xylene, and coverslipped. Distribution of the AChE staining was determined by microscopic examination and compared to the cytoarchitectonic structure of the cortex revealed with the Nissl staining.
Preparation Thirty-eight Dunkin-Hartley guinea-pigs (Cavia porcellus Linnaeus) weighing 380-940 g (median, 580 g) were used in these experiments. The animals were anaesthetized by an i.p. injection of urethane (1.2 g k g ) followed by an i.m. injection of Combelen (propionylpromazine hydrochloride, 3.6 gkg) . Surgical levels of anaesthesia were then achieved by an i.m. injection of Rompun (xylazine hydrochloride, 8 mgkg). Throughout each experiment, supplementary i.m. injections of Ketalar (ketamine hydrochloride, 100-200 mgkg) were adminis- tered to maintain an adequate level of anaesthesia. In a typical experiment, recording from cortical units was not started for at least 2 h after the initial induction of anaesthesia.
The animal was mounted on a head-holder without ear bars, which permits free access to the auditory cortex and avoids damage to the tympanum membrane (Haidarliu, 1996 j. A local anaesthetic (lidocaine, 2%) was applied to all wounds. A small hole (3 mm diameter) was made in the skull to expose the auditory cortex, and the dura was removed. Drying of the surface of the cortex was prevented by repeated topical applications of saline. The animal was placed in a sound-attenuating chamber for the recording session.
Electrodes and drug applications The multi-electrode setup used for combined micro-iontophoresis and multiple single-unit recordings has been described previously (Haidarliu et al., 1995). Briefly, the setup consists of two types of electrodes included within a metallic guide tube: regular tungsten-in- glass electrodes (TE; 0 .2-0.8 MR at 1 H z ; median, 0.3 MR) and a combined electrode (CE), which consisted of a tungsten electrode (0.2-0.8 M a ) within the central barrel of a seven-barrelled glass pipette. Within the stainless steel guide tube, the regular and combined electrodes were assembled in two different configurations: (i) one CE and three TEs, referred to as the ‘single combined’ configuration (SC), and (ii) two CEs and two TEs, called the ‘double combined’
configuration (DC). Depending on the configuration, the horizontal distance between the electrode tips was 300-600 pm. The guide tube was brought close to the exposed brain, and each of the four electrodes was introduced independently into the auditory cortex with a multi-electrode microdrive system. Four spike sorters (MSD-2; Alpha-Omega, Nazareth, Israel), one for each electrode, were used to isolate single- and multi-unit spikes. The separations of units from a given electrode were classified according to the following five categories: well isolated units (q5), well isolated units of which up to 10% of the spikes were not detected (q4), two-single units that could not be separated reliably on the basis of their templates (q3), multi-units (q2j, and multi-units with amplitudes too close to noise level (ql; these were excluded from the analysis). Hereafter, ‘well- isolated units’ refers to q4 or q5, ‘isolated units’ to q3, q4 and q5, and ‘multi-unit’ to q2 units. The templates and the recorded action potentials were carefully and continuously inspected with both the spike-sorter software and the oscilloscope. Recording of isolated single units was usually stable for several hours (Fig. 4 in Haidarliu et al., 1995). Whenever a deviation from the steady state was noticed, measures to correct the deviation were taken, including changes in the sorting threshold and template updating. In extreme cases, the electrode was moved a few micrometres to restore the original recording situation. The data collected during these periods of template recovery were excluded from analysis. If restoration of the original template could not be achieved, the cell recording was stopped.
For the iontophoretic application of neuroactive drugs, the CE was filled with the different solutions before insertion into the guide tube. The six barrels were filled with an aqueous solution of ACh chloride (1 M, pH 4.3, carbamylcholine chloride (carbachol; 1 M, pH 6.0), atropine sulphate (0.1 M, pH 4.3, (-)artereno1 bitartrate (noradrenaline; 0.5 M in 100 mM ascorbic acid solution, pH 4.3, or NaCl (3 M). All these solutions were frozen and stored at -20°C as aliquots and were thawed immediately before the experiment, The impedance of the glass barrels varied from 10 to 100 MR (median, 30 MQ), depending on the diameter of the capillary orifice and on the filling solution. Retaining currents of -5 nA were used to prevent the drugs from leaking. The ejection currents used were 20-200 nA (positive current). Balanced ejections were not systematically applied in order to avoid ejection of the active drug by the balance barrel during retention periods (Sillito and Kemp, 1983). No qualitative difference was found between balanced and unbalanced applications. The use of high current levels to affect the activity of units recorded far from the site of ejection increases the possibility that some of the effects observed might result from current effects. However, most of the drug applications were in the 20-100 nA range, and the time course of the effects was generally too slow to be caused by direct current effects. Moreover, the blockade of the effects by atropine (see Results) strengthens the probability of a specific effect of cholinergic agonists via muscarinic receptors.
Data analysis The modulation of the firing rate by ACh or carbachol was assessed as follows. The firing rate was plotted as a function of time (a ‘rate meter’) with a resolution (bin size) of 20 s. This function was visually inspected for deviations from baseline that occurred during or immediately after the drug application. A deviation was considered significant if it was unmistakably larger andlor consistently longer than any other deviation prior to the application. In cases where a given unit received more than one drug application, the unit was considered cholinoceptive only if the effect (deviation) was reprodu- cible. A statistical value was assigned to these visually judged effects by the following calculation (see also Metherate et al., 1988). First,
398 Cholinergic modulation of correlated activity
120 recorded units were selected from the total of 235 recorded units in which the spontaneous period before application was long enough (at least 300 s) to estimate the relationship between the average and the standard deviation (SD) of the firing rate (for the calculation of the SD, this spontaneous period was divided in 6 bins of 50 s each). A single regression function could be fitted to the data [log(SD(R))= (0.69 f 0.04) X log(Avg(R)) - (1.46 f 0.05), r = 0.87, P < 0.001; R is the firing rate]. Then, for each of the 235 cells and for each application of ACh, the expected SD was estimated according to the regression function and the average firing rate of the cell during the spontaneous period preceding the application. Any modulation of the firing rate, during or soon after the application of the drug, was considered as significant if the firing rate differed from the expected firing rate by 2 or more SDs. For 80% of the visually selected significant effects, the deviations were larger than 2 4 SD of the mean firing rate.
Auto- and cross-correlation histograms (Perkel et al., 1967a, b; time bins of 1, 2 or 5 ms) were calculated for spike trains recorded during periods of spontaneous activity. The correlograms were tested by (i) visually inspecting for qualitative changes in shape, and (ii) quantitatively analysing the central peaks of the histograms within two time-lag ranges (0-20 and 0-300 ms). For each histogram, the expected rate of coincidences was estimated (Abeles, 1982a) within a baseline range defined between -200 and -120 ms for the 0- 20 ms time lag and between -1000 and -500 ms for the 0-300 ms lag. The area under the peak of the histogram that was above this expected level and within each time-lag range was divided by the number of trigger spikes used to construct the histogram. This measure, known as the asynchronous gain (asg; Levick el a/., 1972; Abeles, 1982b; Vaadia et al.; 1991), was used to estimate the functional coupling between neurons. Two ‘asg meters’, which describe the evolution of the asg value as a function of time in 50 s intervals, were computed for each pair of simultaneously recorded neurons. The modulations of the asg-meters due to ACh or carbachol applications were studied and tested statistically with the same method as that used for rate meters. The corresponding regression functions for auto- and cross-correlograms were: log(SD(asg,,,)) = (0.38 F 0.03) X log(Avg(asgaut0) X (1.06 +- 0.05), where n = 767, r = 0.74, P < 0.001 and log(SD(asg,,,,)) = (0.43 f 0.02) X log(Avg- (asg,,,,) - (0.69 f 0.05), where n = 767, r = 0.66, P < 0.001. The dependency of the results on the specific normalization of the peak area was tested by repeating all the calculations with the modified correlation coefficient [cc’, which equals the area under the peakid-, where N1 and N2 are the spike counts of the two units; Lavner (1989)l. Although for any given neuronal pair the cc’ values differed from the asg values, significant differences for the population as a whole were not found when measuring the effects of cholinergic applications.
Results
Staining for AChE in the auditory cortex
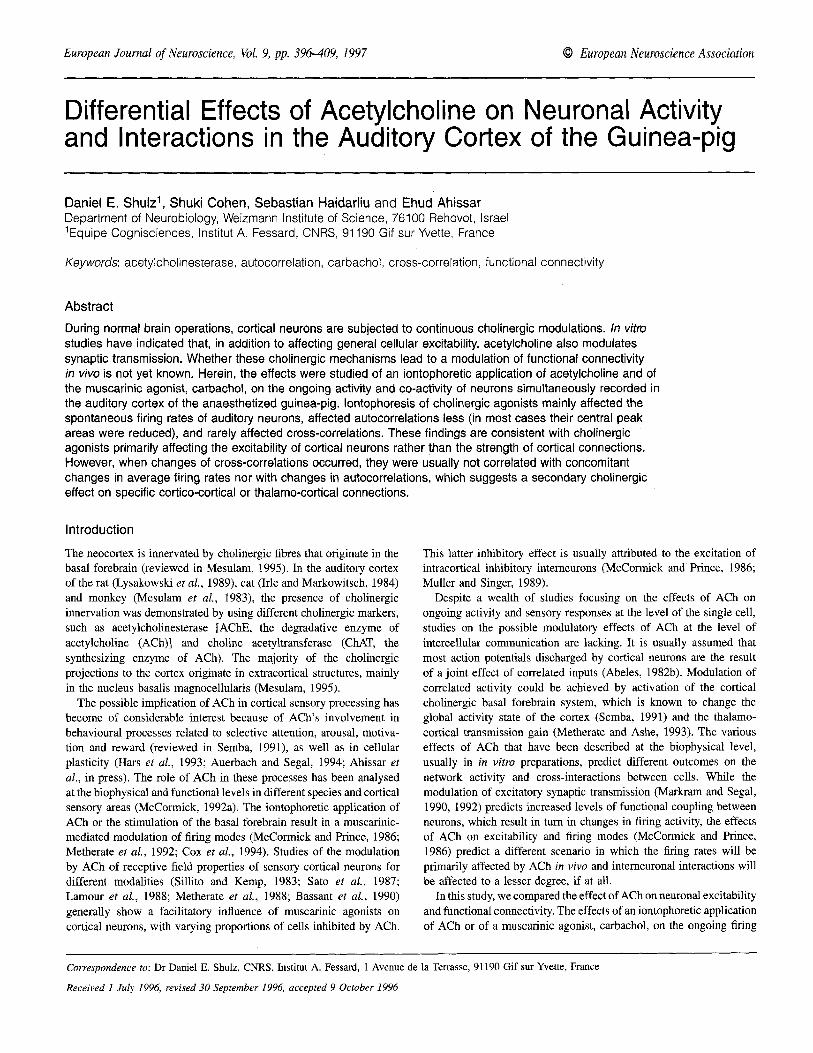
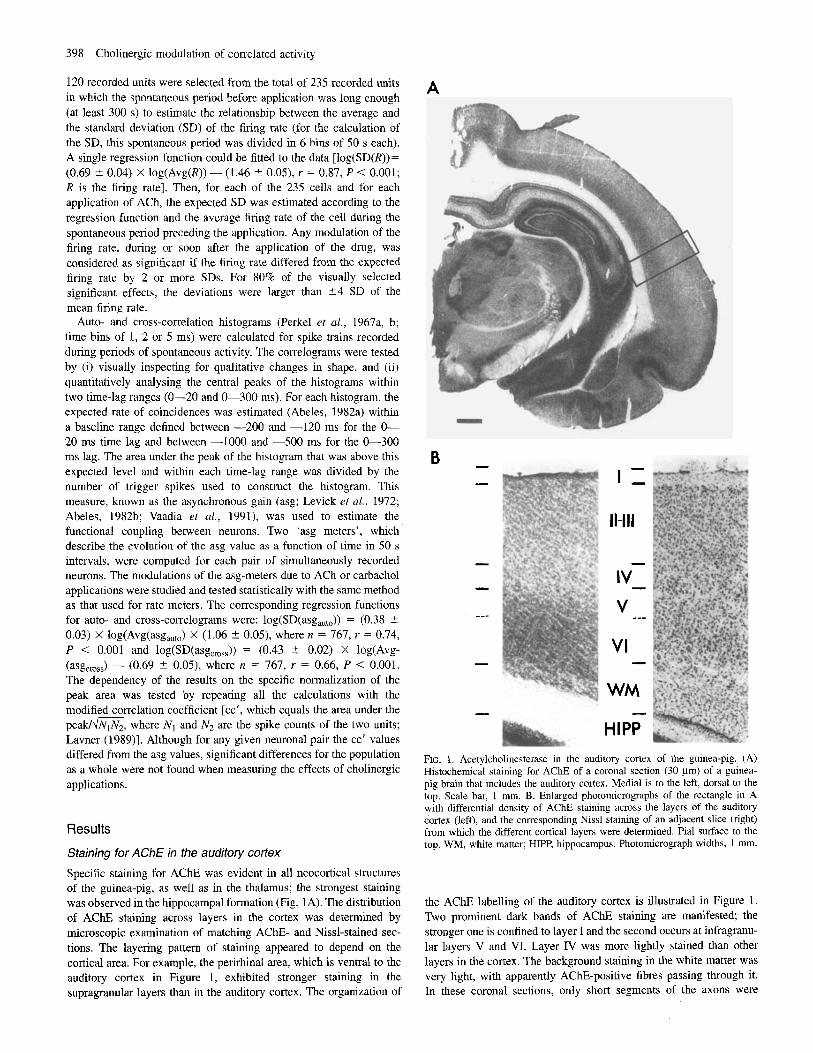
Specific staining for AChE was evident in all neocortical structures of the guinea-pig, as well as in the thalamus; the strongest staining was observed in the hippocampal formation (Fig. 1A). The distribution of A C E staining across layers in the cortex was determined by microscopic examination of matching AChE- and Nissl-stained sec- tions. The layering pattern of staining appeared to depend on the cortical area. For example, the perirhinal area, which is ventral to the auditory cortex in Figure 1, exhibited stronger staining in the supragranular layers than in the auditory cortex. The organization of
A
B
WM
HIPP FIG. 1. Acetylcholinesterase in the auditory cortex of the guinea-pig. (A) Histochemical staining for AChE of a coronal section (30 pn) of a guinea- pig brain that includes the auditory cortex. Medial is to the left, dorsal to the top. Scale bar, I mm. B. Enlarged photomicrographs of the rectangle in A with differential density of AChE staining across the layers of the audjtory cortex (left), and the corresponding Nissl staining of an adjacent slice (right) from which the different cortical layers were determined. Pial surface to the top. WM, white matter: HIPP, hippocampus. Photomicrograph widths, 1 mm.
the AChE labelling of the auditory cortex is illustrated in Figure 1 . Two prominent dark bands of AChE staining are manifested the stronger one is confined to layer I and the second occurs at infragranu- lar layers V and VT. Layer IV was more lightly stained than other layers in the cortex. The background staining in the white matter was very light, with apparently AChE-positive fibres passing through it. In these coronal sections, only short segments of the axons were
Cholinergic modulation of correlated activity 399
TABLE 1. Modulation of firing rates upon exposure to acetylcholine or carbachol
Application of Acetylcholine or Changes in firing rate Acetylcholine Carbachol Carbachol
Increased 16 (18%) 44 (30%) 60 (25.5%) Decreased 14 (16%) 21 (14%) 35 (15%) Unchanged 58 (66%) 82 (56%) 140 (59.5%) Total number of cells 88 147 235
visualized, which suggests that A C E positive axons run parallel to the antero-posterior axis in cortical white matter.
Cholinergic electrophysiological effects Two hundred and ninety one units were recorded in the auditory cortex of 38 guinea-pigs. The response to the iontophoretic application of ACh or carbachol was tested for all units. However, those penetrations in which none of the recorded cells responded to the applied drugs, even at high levels of current, were excluded from the statistical analyses. A total of 56 cells were excluded (nine experi- ments, ten penetrations), and the database was restricted to 235 units, of which 150 were recorded with the SC electrode configuration and 85 cells with the DC configuration. The exclusion probably led to an overestimation of the proportion of cholinoceptive cells, but was used since there was no indication in the excluded cases that the drug was effectively ejected from the pipette. In all these experiments, only one penetration (with the four electrodes simultaneously) was made per animal, and lasted on average 10 h; in only three cases were two different groups of units successively recorded during a given penetration. According to the quality of the discrimination of action potentials from a given electrode, 94 recordings were from well isolated units (q4 and q5), 72 from two single units (which could not be separated reliably on the basis of their templates, q3), and 69 from multi-units (q2). Statistical analyses were performed on both the total and restricted samples, as a function of electrode configuration, distance from the site of ejection, and spike separation quality (see below). In addition to ACh, the agonist carbachol was iontophoresed, since its slower hydrolysis rate increases the probability of diffusion over larger volumes of cortical tissue. The percentage of units that exhibited significant modification of their spontaneous activity upon separate exposure to both drugs is shown in Table 1. Cells were not tested with both ACh and carbachol. However, since the effects of the two agonists did not differ qualitatively or quantitatively in the percentage of modified cells (x2, P = 0.134), the data obtained separately with both agonists were pooled for subsequent analysis.
Effects of cholinergic agonists on the spontaneous activity rates The cholinergic agonists affected the ongoing activity of 40.5% (95/ 235) of the cells tested. In 25.5% of all the cases the spontaneous activity was significantly increased, whereas in 15% of the cases it was reduced. The mean current levels used for inducing excitatory and inhibitory effects were not significantly different. In a few cases (n = 7), the drugs induced biphasic responses (Fig. 2).
A clear relationship was not observed between the initial level of spontaneous activity and the probability of affecting the ongoing activity. Quiescent cells, which had 0-0.5 spikeds, did not appear to be less readily excited by ACh or carbachol (19/81, 23.5%) than cells with spontaneous activity of 0.5-20 spikes/s (40/154, 25.9%), as previously reported in the somatosensory cortex (Bassant et al., 1990). The probability of a rate decrement showed an initial trend;
cells with lower initial levels of spontaneous activity were less affected than cells with higher initial activity. This trend, which could be due to the lower detectability of decrements for initial low firing rates, holds for discharge frequencies up to five spikes per second and reverts above it. When the analysis was restricted to isolated units, the same relationship between the spontaneous rate and the probability of being affected by ACh application was observed both for rate increments and decrements. Multiunit recordings showed a smaller, but still not significantly different, percentage of modification than well-isolated units (24.5% versus 39.6%, x2, P = 0.1; Table 2).
Effect on neuronal activity of the distance between the recording and iontophoresis sites
Depending on the electrode configuration (SC or DC), one or two sites of ejection were used, respectively. For each configuration, two groups of cells were defined, those recorded from the electrode through which the drugs were applied (near cells) and those recorded by one of the other electrodes at a variable distance (usually 300- 600 pm) from the site of application (far cells). Herein, the extent of the modulatory action between the two groups of cells is compared without considering the exact distance between the tips of the electrodes.
The population of near cells recorded with the SC configuration is the one that should be compared with cells in previous studies in which one electrode was used for both recording and ejection. The percentage of isolated (single or two) units with a modification of the ongoing firing rate was determined as a function of the recording site relative to the application site when the SC setup was used (Table 3). Iontophoresis of cholinergic agonists affected (i.e. caused rate increments, decrements or biphasic effects) almost twice as many isolated units (n = 101) recorded with the CE (61 3% of near cells, n = 21) than cells recorded simultaneously through one of the other three electrodes (33.7% o f far cells, n = 80, x2, P < 0.036). The proportion of cells that exhibited a facilitatory effect was similar for far and near groups (17.5 and 19% respectively of the total units). The proportion of far cells (13.7%) that exhibited a decreased level of spontaneous activity was less than that of near cells (33.3%). This is consistent with an ACh-induced decrease in spontaneous activity being mediated by the activation of local GABAergic interneurons (McCormick and Prince, 1986; Muller and Singer, 1989). An interneu- ron effect on far cells is expected to be less effective, since (i) local interneurons do not directly drive far ( 3 0 0 6 0 0 pm) neurons, and (ii) far interneurons are probably only weakly affected by the diffused cholinergic agent, and this effect is insufficient to be expressed in the second-order neuron’s activity.
Involvement of muscarinic receptors
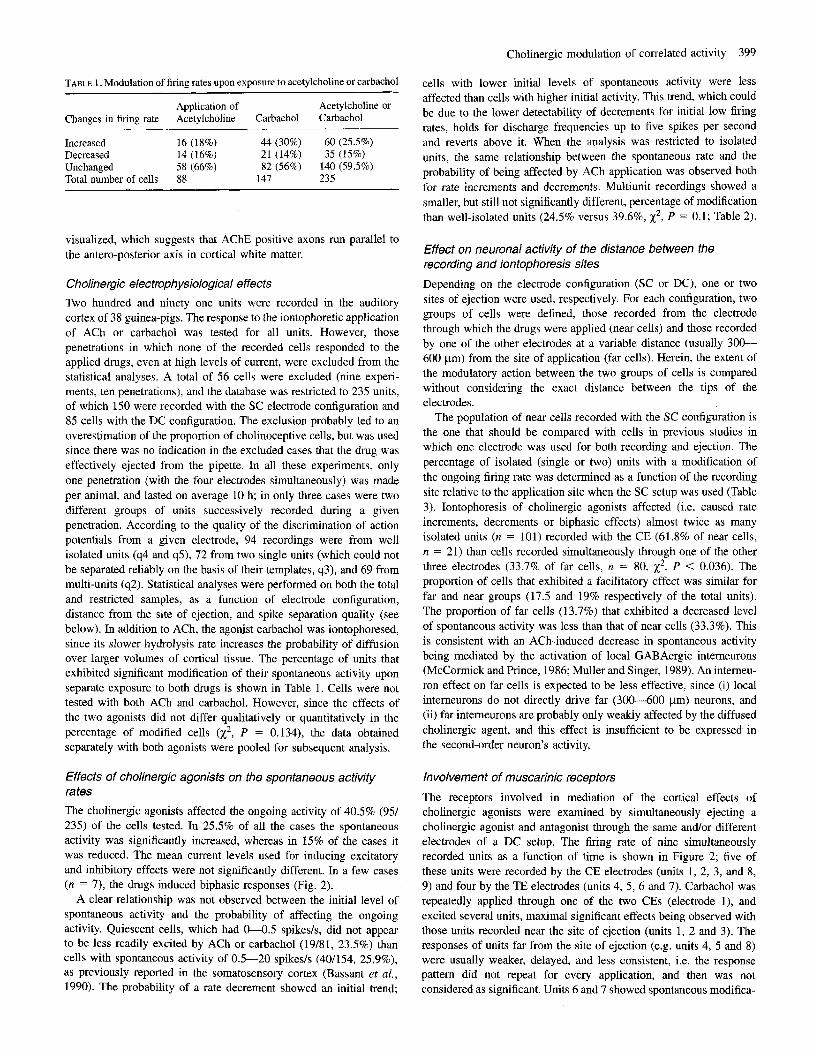
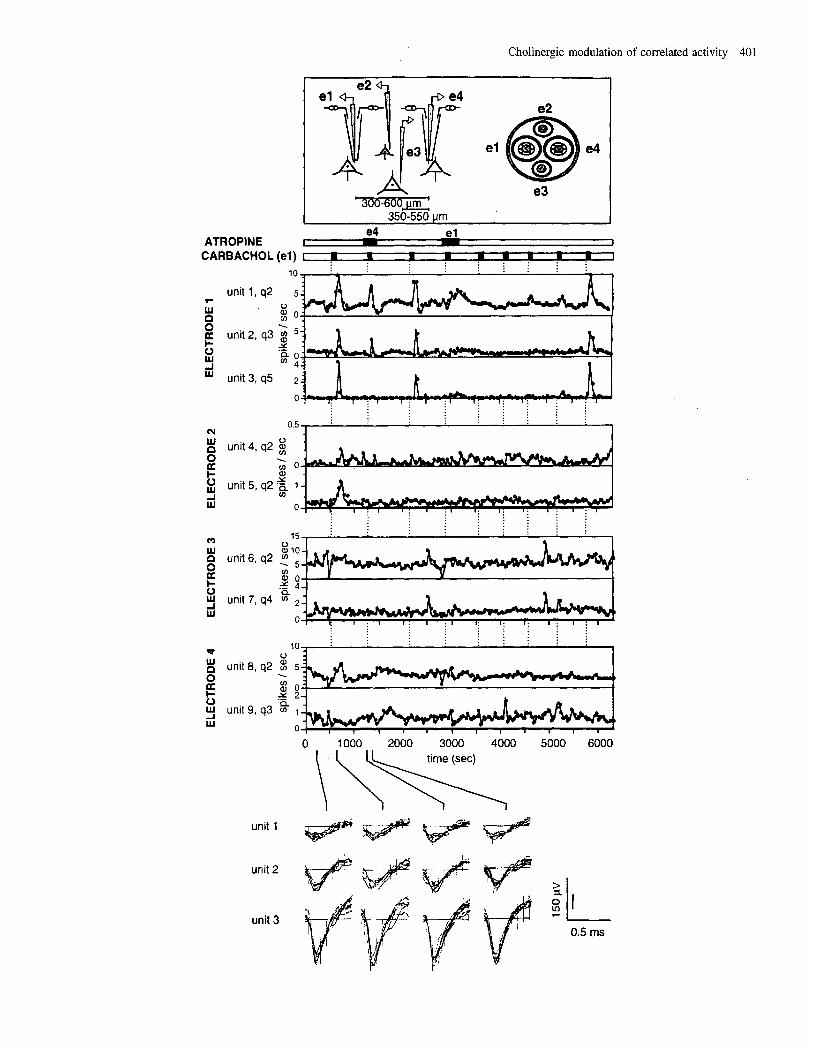
The receptors involved in mediation of the cortical effects of cholinergic agonists were examined by simultaneously ejecting a cholinergic agonist and antagonist through the same and/or different electrodes of a DC setup. The firing rate of nine simultaneously recorded units as a function of time is shown in Figure 2; five of these units were recorded by the CE electrodes (units 1, 2, 3, and 8, 9) and four by the TE electrodes (units 4, 5, 6 and 7). Carbachol was repeatedly applied through one of the two CEs (electrode l), and excited several units, maximal significant effects being observed with those units recorded near the site of ejection (units 1, 2 and 3). The responses of units far from the site of ejection (e.g. units 4, 5 and 8) were usually weaker, delayed, and less consistent, i.e. the response pattern did not repeat for every application, and then was not considered as significant. Units 6 and 7 showed spontaneous modifica-

400 Cholinergic modulation of correlated activity
tions of firing rates just preceding the first application. Neither unit was considered as showing a significant effect. Unit 9 did not show any significant effect. Application of atropine through the second CE (electrode 4), which was several hundred micrometres from the site of ejection of carbachol, partially and reversibly blocked the effect, thus suggesting that atropine diffused several hundreds of microns to block the muscarinic receptors on the membrane of the cells recorded by the other CE (electrode I). When atropine was applied simultan- eously with carbachol through the same electrode, the effect of carbachol was completely blocked and the blockade lasted -50 min (see last application of carbachol). Since the effects of iontophoresis of ACh or carbachol could be completely blocked by a simultaneous application of atropine, the cortical effects of these cholinergic agonists appeared to be mediated through muscarinic receptors.
Cholinergic effecfs on firing patterns assessed by autocorrelations At short time lags (a few to a few tens of milliseconds), the shape of an autocorrelation histogram usually reflects the tendency of the cell to fire in regular or bursting modes. Accordingly, the autocorrelation histograms were quantified for 235 cells before, during and after the application of ACh by calculating the asg values for a 20 ms time lag. Since many of the neurons recorded in this study usually exhibited a peak of a few hundreds of milliseconds in the autocorrelation, the asg values for a 300 ms time lag were also calculated.
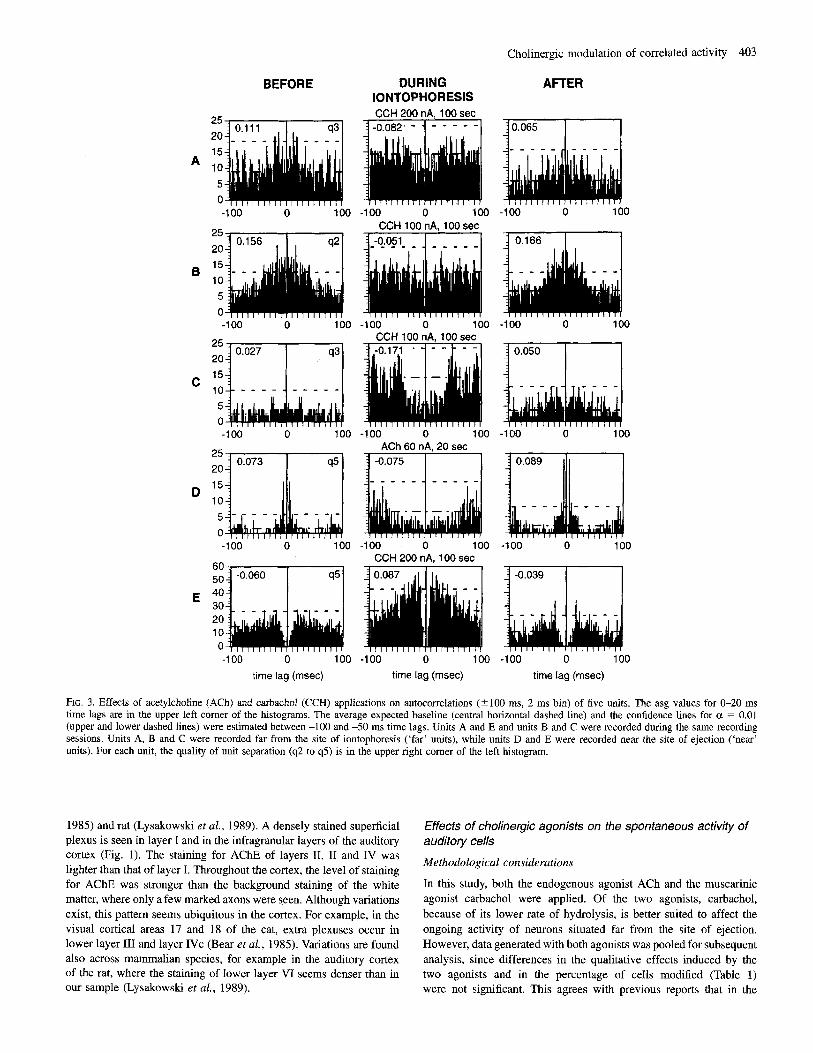
The percentage of autocorrelation histograms significantly affected by the application of ACh or carbachol was 9.4% (22/235) and 10.6% (25/235) for the 20 and 300 ms time lags respectively. Only eight of the units having their autocorrelation significantly affected for the 20 ms time lag were also significantly affected for the 300 ms time lag. By restricting the analysis to isolated units whose initial spontaneous activity was at least 0.5 spike& (below this firing rate the number of action potentials was not sufficient for estimation of the autocorrelation function), the percentage of affected cells increased to 13.6% (151 110) and 16.4% (18/110) respectively. In the majority of cases where a modification was observed, a significant decrease in the probability of firing within both delay periods was observed [60% (9/15) for the 20 ms time lag and 77.8% (141’18) for the 300 ms time lag]. The autocorrelograms of five representative cells, four of which showed a significant decrease in the area of the histogram at 0-20 ms, are depicted in Figure 3. One cell (Fig. 3E) displayed an increase in its tendency to fire bursts of spikes upon application of ACh. For this latter cell, the absolute refractory period (4 ms) was unchanged, while the relative refractory period was shorter and the probability of firing after each action potential during the first 20 ms increased. ACh decreased the probability of repetitive firing by 0.29 % 0.17 (SD) spikes on the average of the cells that exhibited a reduction of the asg (n = 13) in the 0-20 ms delay. The cells that showed an increase of the asg (n = 9), upon application of ACh tended to fire an extra 0.32 -t 0.18 spikes during the first 20 ms.
In the majority of cases (93 and 83% for the 20 and 300 ms time lag groups respectively), changes in the autocorrelograms were
concomitant with changes in the firing rate levels. The occurrence of changes in the autocorrelograms was significantly correlated with the occurrence of rate changes (x2. P < 0.0001 and P < 0.007 for the 20 and 300 ms time lag groups, respectively). However, the directions of the changes were not correlated (x’, P = 0.69 and P = 0.78 for the 20 and 300 ms time lag groups, respectively).
Cholinergic effects on funcfional coupling assessed by cross- correlograms Cross-correlations measure the net effect, mediated by synaptic connections, of one cell on another. Thus, changes in cross-correlations reflect changes in the underlying synaptic weights, and steady cross- correlations reflect either steady synaptic weights or balanced changes within the synaptic array.
For the 235 units analysed with either of the two electrode setups, 1710 cross-correlations were computed, as were the asg values for two regions of time lags (20 and 300 ms) during periods of spontaneous activity and during the application of ACh or carbachol. These time lags were chosen since similar time lags were used for previously reported distributions of cross-correlogram peak widths (Kriiger and Aiple, 1988; Lavner, 1989; Nelson et al., 1992). The number of pairs of cells whose functional coupling, as assessed by asg values, changed significantly upon application of cholinergic agents was extremely low; only 3.2% (54/1710) and 4.3% (73/1710) of the cross-correlog- rams were affected within the 20 and 300 ms time lags respectively. These percentages remained low (3.3 and 5.6% respectively, n = 642) even if only isolated units with spontaneous activity levels such that the product of the individual firing rate was higher than 0.25 spike& were considered. Furthermore, significant differences were not observed for pairs in which at least one cell was recorded near the site of iontophoresis or in which both cells were recorded by the far electrodes. The probability of modification was similar for the DC and SC setups. With the DC configuration, the distance of recording, the quality of the unit isolation, and even the initial firing rate did not significantly affect the probability of inducing a change in the functional coupling. Of the 54 pairs of cells whose asg values for the 20 ms delay changed, 43 (79.6%) had an increase in the asg value, Only ten pairs of units showed significant modulations of the asg values for both 20 and 300 ms time lags.
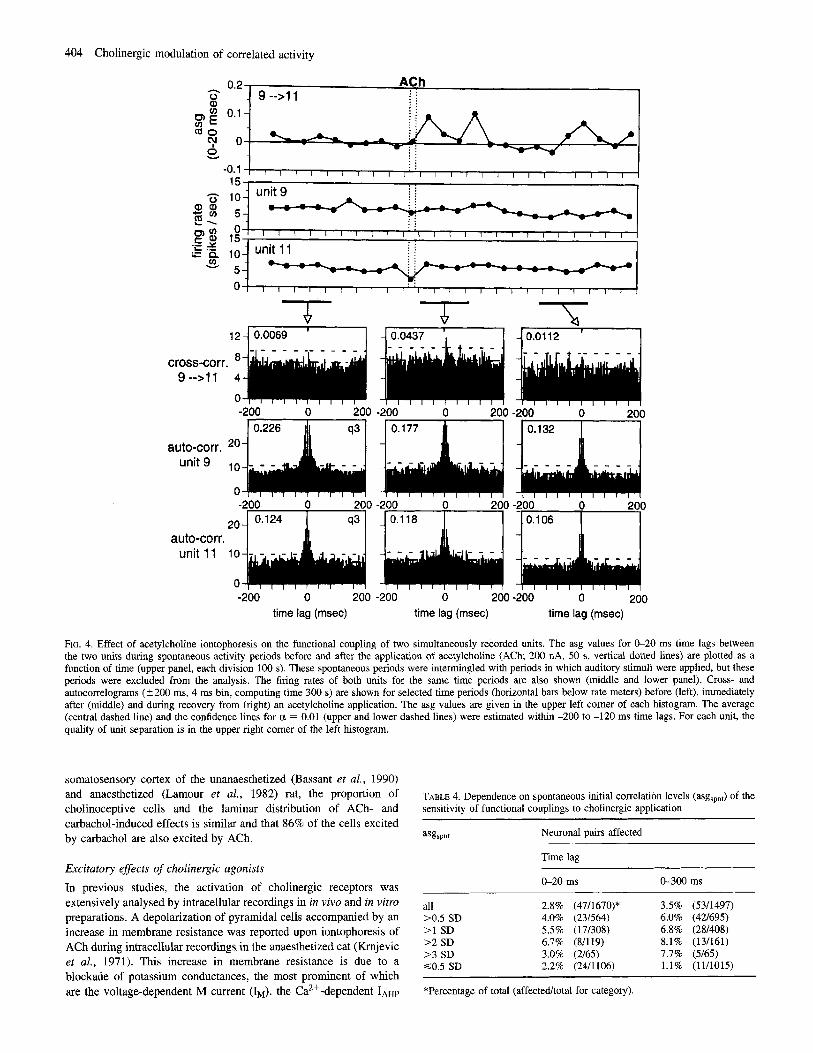
An example of a one-sided peak that appeared immediately after the application of ACh is depicted in Figure 4. The units of the pair were recorded by two different electrodes, and the supposedly postsynaptic unit (cell 11) was recorded near the site of ejection. The asg was increased by ACh by >8 SD (peak asg, 0.11; spontaneous asg, 0.007 ? 0.012). The significant change in the cross-correlogram occurred in the absence of a noticeable change in the firing rate or pattern of either unit, as shown by the unchanged autocorrelograms and rate meters in Figure 4.
Whether the detection of a change in the cross-correlogram depends on the spontaneous level of correlation was tested by computing the percentages of modified pairs as a function of their initial spontaneous correlation level (Table 4). To avoid artificial bias due to few
~~
FIG. 2. Effects of carbachol and atropine on the ongoing activity of units recorded simultaneously in the auditory cortex. Rate meters (bin size, 50 s) describe the firing rate of nine units during 105 min of recording that included spontaneous activity periods and applications of carbachol and atropine. For each unit, the quality of the unit separation (q2 to q5) is to the right of its serial number. The spatial relationship between electrodes in the double combined setup is schematized in the upper inset. On the right side of the inset, a cross-section of the stainless steel guide is depicted to indicate the relative positions of the two combined electrodes (el and e4) and the two tungsten-in-glass electrodes (e2 and e3). The tracings at the bottom of the figure show the spike shapes of the three units recorded though electrode 1 during spontaneous and application (carbachol and atropine) periods. The same combined electrode (el) was used for the nine consecutive applications of carbachol (200 nA, 100 s). Atropine was applied (30 nA, starting 100 s before the carbachol application) twice, first (300 s duration) from electrode 4 (e4j and then from electrode 1 (el; 400 s duration).
Cholinergic modulation of correlated activity 401
e4 e l ATROPINE 1 I - I CARBACHOL(e1) I m m I m = . m . I
- . . . . . . . . . . .
. . . . . . . _ . . . . . . .
. . . . . . . . . . . . . . . . . . . . . 15 p 10
$ 0 .g 4
unit 6, q2 . unit 7, 94 tn
. . . . . . 0
u unit 8, q2 % 5
$ 0 . Y 2
unit 9, q3 tn 1 a
0
unit 1
unit 2
unit 3
0 1000 2000 3000 4000 5000 6000
I 0.5 rns
402 Cholinergic modulation of correlated activity
TABLE 2. Effects of acetylcholine and carbachol on firing rate as a function of spike discrimination
Firing rate Spike discrimination All
Isolated units Multi-units (q3,94, q5) (q2)
Increased 18 (17.8%) 6 (12.2%) 24 (16.0%) Decreased 18 (17.8%) 3 (6.1%) 21 (14.0%) Biphasic 4 (4.0%) 3 (6.1%) 7 (4.6%) Unchanged 61 (60.4%) 37 (75.5%) 98 (65.3%) Total number of units 101 49 150
SC configuration used to record all units.
TABLE 3. Effects of acetylcholine and carbachol on the firing rate of isolated units as a function of proximity to the application site
Firing rate Application site
Near Far Near or far
Increased 4 (19.0%) 14 (17.5%) 18 (17.8%) Decreased 7 (33.3%) I1 (13.7%) 18 (17.8%) Biphasic 2 (9.5%) 2 (2.5%) 4 (4.0%) Unchanged 8 (38.1%) 53 (66.3%) 61 (60.4%) Total number of units 21 80 101
SC configuration used to record all units.
outliners, this analysis was restricted to the population of pairs whose spontaneous absolute asg values were <3 SDs of the total population. The total population had means and SDs of 0 034 2 0.103 for the 20 ms and 0.162 2 0.238 for the 300 ms time lag. The restricted population included pairs whose lasgl < 0.3 (asg = 0.022 & 0.045) for the 20 ms time lag and lasgl < 0.7 (asg = 0.11 t 0.179) for the 300 ms time lag. The SDs of the spontaneous asg values of these restricted populations were used to categorize the spontaneous asg levels of single pairs. The percentage of affected pairs increased as the spontaneous initial correlation increased, up to -2 SDs, and then decreased. It is worth noting, however, that even the highest percentages of affected pairs (6.7% for the 20 ms and 8.1% for the 300 ms time lag) were still significantly lower than the percentage of units whose firing rates were affected. In only -1% of the pars that showed small spontaneous correlation (<0.5 SD; Table 4) did cholinergic applications induce a significant change (Fig. 4).
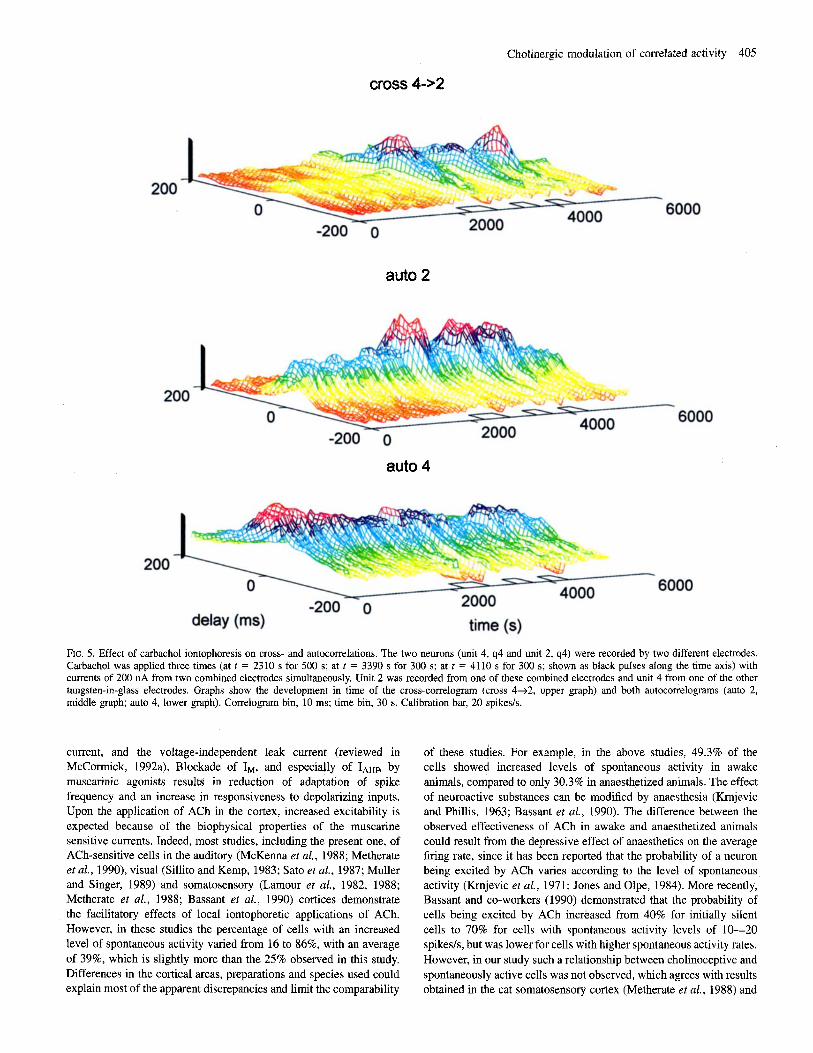
An example of a clear change in cross-correlation for a pair of units with an initial spontaneous correlahon is depicted in Figure 5. Three successive cholinergic applications induced three successive increments in the peak area of the cross-correlation between the two neurons, which were recorded by different electrodes. These changes were accompanied by concomitant increments of the peak area of the autocorrelation of the target neuron (unit 2) and decrements in the background level (flanks) of the autocorrelation of the trigger unit (unit 4).
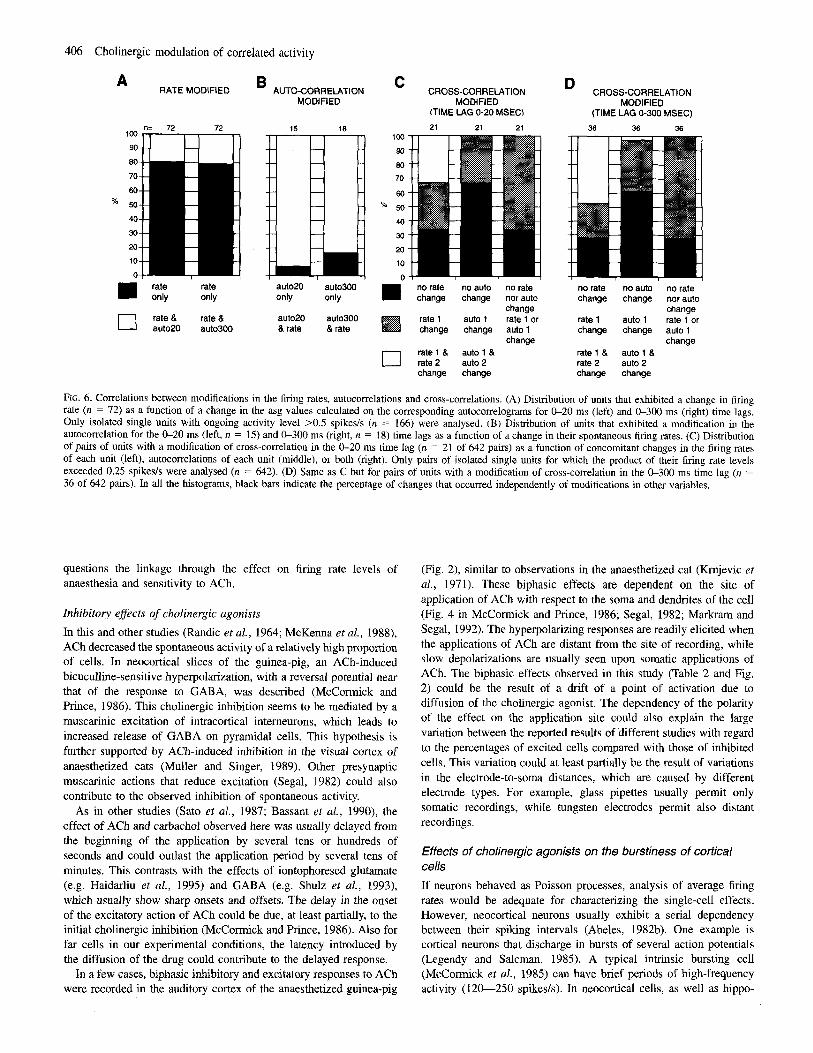
No systematic correlation was observed between changes in the asg values of the cross-correlograms and changes in the firing rates and patterns (autocorrelograms). The distribution of modified auto- and cross-correlations is shown as a function of concomitant changes in the firing rates and patterns (Fig. 6). While most of the changes in the autocorrelograms were accompanied by changes in the levels of spontaneous activity, the latter was not a reliable predictor of a
change in the cross-correlation. For example, 33% of the changes in the cross-correlograms occurred without any change in firing rate (Fig. 6C, D, left columns). Moreover, two thirds of the changes in the cross-correlogram occurred without any significant change in either of the autocorrelograms (Fig. 6 C , D, middle columns), while a third of the changes in cross-correlograms occurred without any change in the firing rate and in the autocorrelations of both units of the pair (Fig. 6C, D, right columns).
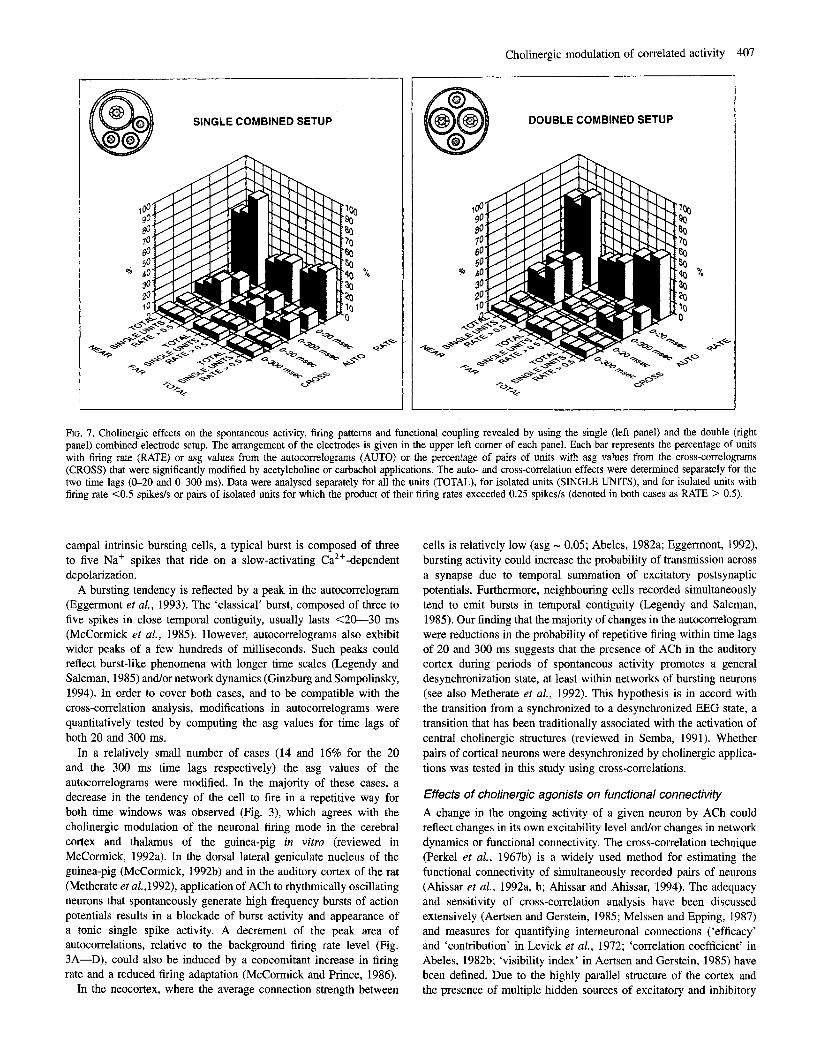
The relative effect of ACh on firing rate and auto- and cross- correlations was assessed by computing the percentages of affected units or pairs of units using different criteria. The cases were grouped according to which electrode setup (SC or DC) and site of recording (near or far) was used. For cross-correlations, cases in which both neurons were recorded far from the site of iontophoresis were considered as ‘far,’ and all other cases as ‘near’. These groups were further reduced to sets that included only isolated units (g 2 3), and then to sets containing only isolated units with a spontaneous firing level >0.5 spikeds. For cross-correlations, the product of the spontaneous firing rates of both units had to exceed 0.25 spike&. The parameter mainly affected by ACh was the cellular average firing rate (Fig. 7). Autocorrelations were affected to a lesser degree and the percentage of affected cross-correlations was very small. These relationships were consistent for all the different groups, except the group of far units recorded with the DC setup, where autocorrelations were rarely affected.
Discussion
The effects of exogenously applied cholinergic agents on cellular activity and functional neuronal connectivity in the auditory cortex of anaesthetized guinea-pigs were studied. In agreement with previous reports, iontophoresis of ACh and of the muscarinic receptor agonist, carbachol, were shown to modulate the ongoing activity of cortical cells. These changes in the firing rates of the cells usually occurred in the absence of a noticeable change in the firing patterns of the neurons, as judged by their autocorrelograms. The effects of ACh and carbachol were studied at the intercellular level by the use of simultaneous recordings of up to 12 units and of cross-correlation techniques. Despite a significant percentage of cells showing a modification in their firing rates upon application of the cholinergic agents, the functional coupling between units, as judged by their cross-correlograms, was almost unchanged. These findings are consist- ent with the involvement of ACh in neuromodulation of the auditory cortex by modifying the discharge rate of cortical units. They do not support significant promotion by endogenous ACh of synchronization of the firing activity of spontaneously active neurons. However, they do not disprove or support the hypothesis that ACh promotes synchronization of an assembly of neurons upon co-activation by a coherent sensory input (Munk et al., 1996).
Distribution of AChE in the auditory cortex of the guinea-pig Although various enzymatic histochemical, immunocytochemical and autoradiographic procedures have been used to elucidate the cho- linergic innervation of neocortical areas of many species commonly used for experimentation (Bear et al., 1985; Lysakowski et al., 1989), a description of cholinergic innervation in the guinea-pig was not available. In these preparations, the histochemical staining for AChE corresponds well with that for other cholinergic markers (Mesulam and Geula, 1992; Criswell and Brandon, 1993). The distribution of AChE in the auditory cortex of the guinea-pig (Fig. 1) is similar to that previously published for the neocortex of the cat (Bear et al.,
Cholinergic modulation of correlated activity 403
BEFORE DURING AFTER IONTOPHORESIS CCH 200 nA, 100 sec
_ _ 10.111 . I -0.082, - - - - - - 10.065 25
-1 00 0 100 -100 0 100 -100 0 100 CCH 100 nA, 100 sec 36 --
20 15 10 5 0 -1 00 0 100 -100 0 100 -100 0 100
76 CCH 100 nA, 100 sec -1
20 15 10 5 0
0 -
25 20 15 10 5 0 -1 00 0 100 -100 0 100 -100 0 100
CCH 200 nA. 100 sec 60 50
:: 20 10 0 -1 OD 0 100 -100 0 100 -100 0 1 00
time lag (msec) time lag (msec) time lag (msec)
FIG. 3. Effects of acetylcholine (ACh) and carbachol (CCH) applications on autocorrelations (2100 ms, 2 ms bin) of five units. The asg values for &20 ms time lags are in the upper left corner of the histograms. The average expected baseline (central horizontal dashed line) and the confidence lines for ct = 0.01 (upper and lower dashed lines) were estimated between -100 and -50 ms time lags. Units A and E and units B and C were recorded during the same recording sessions. Units A, B and C were recorded far from the site of iontophoresi? (‘far’ units), while units D and E were recorded near the site of ejection (‘near’ units). For each unit, the quality of unit separation (92 to 95) is in the upper right comer of the left histogram.
1985) and rat (Lysakowski et al., 1989). A densely stained superficial plexus is seen in layer [ and in the infragranular layers of the auditory cortex (Fig. 1). The staining for A C E of layers 11, I1 and IV was lighter than that of layer I. Throughout the cortex, the level of staining for AChE was stronger than the background staining of the white matter, where only a few marked axons were seen. Although variations exist, this pattern seems ubiquitous in the cortex. For example, in the visual cortical areas 17 and 18 of the cat, extra plexuses occur in lower layer 111 and layer IVc (Bear et al., 1985). Variations are found also across mammalian species, for example in the auditory cortex of the rat, where the staining of lower layer VI seems denser than in our sample (Lysakowski et al., 1989).
Effects of cholinergic agonists on the spontaneous activity of auditory cells
Methodological considerations
In this study, both the endogenous agonist ACh and the muscarinic agonist carbachol were applied. Of the two agonists, carbachol, because of its lower rate of hydrolysis, is better suited to affect the ongoing activity of neurons situated far from the site of ejection. However, data generated with both agonists was pooled for subsequent analysis, since differences in the qualitative effects induced by the two agonists and in the percenlage of cells modified (Table 1) were not significant. This agrees with previous reports that in the
404 Cholinergic modulation of correlated activity
0 I , l I , I I I , I : I i l l l , l , l l 15 I l l
unit 11 5- 0 1 1 ~ 1 1 1 1 1 1 1 ' 1 1 1 1 1 1 1 1 1 , 1 1 ,
I 40.0112 T
12 4 0.0069 ' I 400437 I,
T
- I I I I I I I I I I I I I I I I i I I I I I I I 1 I T IT r m -200 0 200 -200 0 200 -200 0 200
auto-corr. 20 unit 9
0
20
unit 11 10
0
auto-corr.
-200 0 200 -200 0 200 -200 0 200 time lag (msec) time lag (msec) time lag (msec)
FIG. 4. Effect of acetylcholine iontophoresis on the functional coupling of two simultaneously recorded units. The asg values for 0-20 ms time lags between the two units during spontaneous activity periods before and after the application of acetylcholine (ACh; 200 nA, SO s, vertical dotted lines) are plotted as a function of time (upper panel, each division 100 s). These spontaneous periods were intermingled with periods in which auditory stimuli were applied, hut these periods were excluded from the analysis. The firing rates of both units for the same time periods are also shown (middle and lower panel). Cross- and autocorrelograms (5200 ms, 4 ms bin, computing time 300 s) are shown for selected time periods (horizontal bars below rate meters) before (left), immediately after (middle) and during recovery from (right) an acetylcholine application. The asg values are given in the upper left comer of each histogram. The average (central dashed line) and the confidence lines for c1 = 0.01 (upper and lower dashed lines) were estimated within -200 to -120 ms time lags. For each unit, the quality of unit separation is in the upper right comer of the left hstogram.
somatosensory cortex of the unanaesthetized (Bassant et aZ., 1990) and anaesthetized (Lamour et al., 1982) rat, the proportion of cholinoceptive cells and the laminar distribution of ACh- and carbachol-induced effects is similar and that 86% of the cells excited by carbachol are also excited by ACh.
Excitatory effects of cholinergic agoiaists In previous studies, the activation of cholinergic receptors was extensively analysed by intracellular recordings in in vivo and in vitro preparations. A depolarization of pyramidal cells accompanied by an increase in membrane resistance was reported upon iontophoresis of ACh during intracellular recordings in the anaesthetized cat (Krnjevic el al., 1971). This increase in membrane resistance is due to a blockade of potassium conductances, the most prominent of which are the voltage-dependent M current (IM), the Ca2+-dependent IArp
TABLE 4. Dependence on spontaneous initial correlation levels (asgSpnt) of the sensitivity of functional couplings to cholinergic application
asgspnt Neuronal pairs affected
Time lag
G20 ms 0-300 ms
~~
all 2.8% (47/1670)* 3S% (53/1497) >0.5 SD 4.0% (23/564) 6.0% (42695) >1 SD 5.5% (17/308) 6.8% (28/408) >2 SD 6.7% (8/119) 8.1% (131161)
C0.5 SD 2.2% (24/1106) 1.1% (11/1015) > 3 SD 3.0% (U65) 7.7% (5/65)
*Percentage of total (affectedtotal for category).
Cholinergic modulation of correlated activity 405
cross 4->2
200 6000
auto 2
6000
auto 4
200 6000
time (s) FIG. 5. Effect of carbachol iontophoresis on cross- and autocorrelations. The two neurons (unit 4, 94 and unit 2, 44) were recorded by two different electrodes. Carbachol was applied three times (at t = 2310 s for 500 s; at t = 3390 s for 300 s: at f = 4110 s for 300 s; shown as black pulses along the time axis) with currents of 200 nA from two combined electrodes simultaneously. Unit 2 was recorded from one of these combined electrodes and unit 4 from one of the other tungsten-in-glass electrodes. Graphs show the development in time of the cross-correlogram (cross 4+2, upper graph) and both autocorrelograms (auto 2, middle graph; auto 4, lower graph). Comelogram bin, 10 ms; time bin, 30 s. Calibration bar, 20 spikesk.
current, and the voltage-independent leak current (reviewed in McCormick, 1992a). Blockade of IM, and especially of ImR by muscarinic agonists results in reduction of adaptation of spike frequency and an increase in responsiveness to dcpolarizing inputs. Upon the application of ACh in the cortex, increased excitability is expected because of the biophysical properties of the muscarine sensitive currents. Indeed. most studies, including the present one, of ACh-sensitive cells in the auditory (McKenna et al., 1988; Metherate et al., 1990), visual (Sillito and Kemp, 1983; Sat0 et al., 1987; Muller and Singer, 1989) and somatosensory (Lamour et al., 1982, 1988; Metherate et al., 1988; Bassant et nl., 1990) cortices demonstrate the facilitatory effects of local iontophoretic applications of ACh. However, in these studies the percentage of cells with an increased level of spontaneous activity varied from 16 to 86%, with an average of 39%, which is slightly more than the 25% observed in this study. Differences in the cortical areas, preparations and species used could explain most of the apparent discrepancies and limit the comparability
of these studies. For example, in the above studies, 49.3% of the cells showed increased levels of spontaneous activity in awake animals, compared to only 30.3% in anaesthetized animals. The effect of neuroactive substances can be modified by anaesthesia (Kmjevic and Phillis, 1963; Bassant et al., 1990). The difference between the observed effectiveness of ACh in awake and anaesthetized animals could result from the depressive effect of anaesthetics on the average firing rate, since it has been reported that the probability of a neuron being excited by ACh vanes according to the level of spontaneous activity (Kmjevic er al., 1971; Jones and Olpe, 1984). More recently, Bassant and co-workers (1990) demonstrated that the probability of cells being excited by ACh increased from 40% for initially silent cells to 70% for cells with spontaneous achvity levels of 10-20 spikesh, but was lower for cells with higher spontaneous activity rates. However, in our study such a relationship between cholinoceptive and spontaneously active cells was not observed, which agrees with results obtained in the cat somatosensory cortex (Metherate et al., 1988) and
406 Cholinergic modulation of correlated activity
RATE MODIFIED A
n= 72 72 100
90
80
70
60
% 50
40
30
20 10
I" rate rate only only
rate 8 rate & auto20 auto300
CROSS-CORRELATION C
AUTO-CORRELATION MODIFIED
15 18
auto20 auto300 only only
auto20 auto300 &rate &rate
MODIFIED (TIME LAG 0-20 MSECI
21 21 21
no rate no auto no rate change change norauto
change rate 1 auto 1 rate 1 or change change auto1
change rate 1 & 0 rate2 auto2 change change
auto 1 &
CROSS-CORRELATION MODIFIED
(TIME LAG 0-300 MSEC)
36 36 36
no rate no auto no rate change change nor auto
change rate 1 auto 1 rate 1 or change change auto 1
rate 1 B rate 2 auto 2 change change
change auto 1 &
FIG. 6. Correlations between modifications in the firing rates, autocorrelations and cross-correlations. (A) Distribution of units that exhibited a change in firing rate (n = 72) as a function of a change in the asg values calculated on the corresponding autocorrelograms for &20 ms (left) and 0-300 ms (right) time lags. Only isolated single units with ongoing activity level X . 5 spike& (n = 166) were analysed. (B) Distribution of units that exhibited a modification in the autocorrelation for the &20 ms (left, n = 15) and 0-300 ms (right, n = 18) time lags as a function of a change in their spontaneous firing rates. (C) Distribution of pairs of units with a mohfication of cross-correlation in the 0-20 ms time lag (n = 21 of 642 pairs) as a function of concomitant changes in the firing rates of each unit (left), autocorrelations of each unit (middle), or both (right). Only pairs of isolated single units for which the product of their firing rate levels exceeded 0.25 spikesls were analysed (n = 642). (D) Same as C but for pairs of units with a modification of cross-correlation in the 0-300 ms time lag (n = 36 of 642 pairs). In all the histograms, black bars indicate the percentage of changes that occurred independently of modifications in other variables.
questions the linkage through the effect on firing rate levels of anaesthesia and sensitivity to ACh.
Inhibitory effects of cholinergic agonists In this and other studies (Randic ef nl., 1964; McKenna et al., 1988), ACh decreased the spontaneous activity of a relatively high proportion of cells. In neocortical slices of the guinea-pig, an ACh-induced bicuculline-sensitive hyperpolarization, with a reversal potential near that of the response to GABA, was described (McCormick and Prince, 1986). This cholinergic inhibition seems to be mediated by a muscarinic excitation of intracortical interneurons, which leads to increased release of GABA on pyramidal cells. This hypothesis is further supported by ACh-induced inhibition in the visual cortex of anaesthetized cats (Muller and Singer, 1989). Other presynaptic muscarinic actions that reduce excitation (Segal, 1982) could also contribute to the observed inhibition of spontaneous activity.
As in other studies (Sat0 et al., 1987; Bassant et nl., 1990), the effect of ACh and carbachol observed here was usually delayed from the beginning of the application by several tens or hundreds of seconds and could outlast the application period by several tens of minutes. This contrasts with the effects of iontophoresed glutamate (e.g. Haidarliu et al., 1995) and GABA (e.g. Shulz et nl., 1993), which usually show sharp onsets and offsets. The delay in the onset of the excitatory action of ACh could be due, at least partially, to the initial cholinergic inhibition (McCormick and Prince, 1986). Also for far cells in our experimental conditions, the latency introduced by the diffusion of the drug could contribute to the delayed response.
In a few cases, biphasic inhibitory and excitatory responses to ACh were recorded in the auditory cortex of the anaesthetized guinea-pig
(Fig. 2), similar to observations in the anaesthetized cat (Krnjevic et al., 1971). These biphasic effects are dependent on the site of application of ACh with respect to the soma and dendrites of the cell (Fig. 4 in McCormick and Prince, 1986; Segal, 1982; Markram and Segal, 1992). The hyperpolarizing responses are readily elicited when the applications of ACh are distant from the site of recording, while slow depolarizations are usually seen upon somatic applications of ACh. The biphdsic effects observed in this study (Table 2 and Fig. 2) could be the result of a drift of a point of activation due to diffusion of the cholinergic agonist. The dependency of the polarity of the effect on the application site could also explain the large variation between the reported results of different studies with regard to the percentages of excited cells compared with those of inhibited cellr. This variation could at least partially be the result of variations in the electrode-to-soma distances, which are caused by different electrode types. For example, glass pipettes usually permit only somatic recordings, while tungsten electrodes permit also distant recordings.
Effects of cholinergic agonists on the burstiness of cortical cells If neurons behaved as Poisson processes, analysis of average firing rates would be adequate for characterizing the single-cell effects. However, neocortical neurons usually exhibit a serial dependency between their spiking intervals (Abeles. 1982b). One example is cortical neurons that discharge in bursts of several action potentials (Legendy and Salcman, 1985). A typical intrinsic bursting cell (McCormick et al., 198s) can have brief periods of high-frequency activity (120-250 spikesh). In neocortical cells, as well as hippo-
%
3
Cholinergic modulation of correlated activity
%
>
407
FIG. 7. Cholinergic effects on the spontaneous activity, firing patterns and functional coupling revealed by using the single (left panel) and the double (right panel) combined electrode setup. The arrangement of the electrodes is given in the upper left corner of each panel. Each bar represents the percentage of units with firing rate (RATE) or asg values from the autocorrelograms (AUTO) or the percentage of pairs of units with asg values from the cross-correlograms (CROSS) that were significantly modified by acetylcholine or carbachol applications. The auto- and cross-correlation effects were determined separately for the two time lags (0-20 and 0-300 ms). Data were analysed separately for all the units (TOTAL), for isolated units (SINGLE UNITS), and for isolated units with firing rate c0.5 spikes/s or pairs of isolated units for which the product of their firing rates exceeded 0.25 spikes/s (denoted in both cases as RATE > 0.5).
campal intrinsic bursting cells, a typical burst is composed of three to five Na’ spikes that ride on a slow-activating Ca2’-dependent depolarization.
A bursting tendency is reflected by a peak in the autocorrelogram (Eggermont et al., 1993). The ‘classical’ burst, composed of three to five spikes in close temporal contiguity, usually lasts <20-30 ms (McCormick et al., 1985). However, autocorrelograms also exhibit wider peaks of a few hundreds of milliseconds. Such peaks could reflect burst-like phenomena with longer time scales (Legendy and Salcman, 1985) andor network dynamics (Ginzburg and Sompolinsky, 1994). In order to cover both cases, and to be compatible with the cross-correlation analysis, modifications in autocorrelograms were quantitatively tested by computing the asg values for time lags of both 20 and 300 ms.
In a relatively small number of cases (14 and 16% for the 20 and the 300 ms time lags respectively) the asg values of the autocorrelograms were modified. In the majority of these cases, a decrease in the tendency of the cell to fire in a repetitive way for both time windows was observed (Fig. 3), which agrees with the cholinergic modulation of the neuronal firing mode in the cerebral cortex and thalamus of the guinea-pig in vitro (reviewed in McCormick, 1992a). In the dorsal lateral geniculate nucleus of the guinea-pig (McCormick, 1992b) and in the auditory cortex of the rat (Metherate et al.,1992), application of ACh to rhythmically oscillating neurons that spontaneously generate high frequency bursts of action potentials results in a blockade of burst activity and appearance of a tonic single spike activity. A decrement of the peak area of autocorrelations, relative to the background firing rate level (Fig. 3A-D), could also be induced by a concomitant increase in firing rate and a reduced firing adaptation (McCormick and Prince, 1986).
In the neocortex, where the average connection strength between
cells is relatively low (asg - 0.05; Abeles, 1982a; Eggermont, 1992), bursting activity could increase the probability of transmission across a synapse due to temporal summation of excitatory postsynaptic potentials. Furthermore, neighbouring cells recorded simultaneously tend to emit bursts in temporal contiguity (Legendy and Salcman, 1985). Our finding that the majority of changes in the autocorrelogram were reductions in the probability of repetitive firing within time lags of 20 and 300 ms suggests that the presence of ACh in the auditory cortex during periods of spontaneous activity promotes a general desynchronization state, at least within networks of bursting neurons (see also Metherate et al., 1992). This hypothesis is in accord with the transition from a synchronized to a desynchronized EEG state, a transition that has been traditionally associated with the activation of central cholinergic structures (reviewed in Semba, 1991). Whether pairs of cortical neurons were desynchronized by cholinergic applica- tions was tested in this study using cross-correlations.
Effects of cholinergic agonists on functional connectivity A change in the ongoing activity of a given neuron by ACh could reflect changes in its own excitability level and/or changes in network dynamics or functional connectivity. The cross-correlation technique (Perkel et al., 1967b) is a widely used method for estimating the functional connectivity of simultaneously recorded pairs of neurons (Ahissar et al., 1992a, b; Ahissar and Ahissar, 1994). The adequacy and sensitivity of cross-correlation analysis have been discussed extensively (Aertsen and Gerstein, 1985; Melssen and Epping, 1987) and measures for quantifying interneuronal connections (‘efficacy’ and ‘contribution’ in Levick et al., 1972; ‘correlation coefficient’ in Abeles, 1982b; ‘visibility index’ in Aertsen and Gerstein, 1985) have been defined. Due to the highly parallel structure of the cortex and the presence of multiple hidden sources of excitatory and inhibitory
408 Cholinergic modulation of correlated activity
connections, it is generally accepted that these quantifications provide an estimation of the effective connectivity (Aertsen et al., 1989) or functional coupling (Aertsen et aL, 1994), and not of the structural connectivity, between two simultaneously recorded units. Most of the cross-comelograms computed in this study were of the ‘common input’ type, in agreement with other studies of sensory cortices (Kriiger and Aiple, 1988; Vaadia et aL, 1991; Nelson et al., 1992). This type of correlogram can reflect correlated activity over large groups of neurons, a case in which the detection of changes occurring in single synapses is impossible. This study was concerned with detecting changes in coordinated activity within recorded neuronal groups. If ACh affected a significant amount of synapses, the effect should have been reflected in the coordinated activity.
Since few cross-comelograms exhibited a statistically significant change upon application of ACh, the sensitivity of this method for the detection of significant changes was of concern. However, the observed significant changes in the asg or modified cc‘ values, the majority of which were in the direction of an increase of the coupling, were usually very strong (>4 SD above background; Figs 4 and 5) , indicating that this method was sensitive enough to detect such changes when they occurred. Whether some cholinergic-induced changes in the cross-correlograms were smaller than or equivalent to the background fluctuations, and whether large simultaneous synaptic changes occurred that balanced out each other and, thus, were not reflected in the cross-correlograms could not be ruled out. Another possibility is that connectivity changes can be detected only with neuron pairs that exhibit some spontaneous initial correlation, either due to the limited power of the cross-correlation technique or to the lack of significant anatomical links between those pairs that show no initial correlation. In our sample, indeed, the probability of a given neuronal interaction to he modified by cholinergic applications depended on the strength of the spontaneous correlation (Table 4). However, even with neuron pairs that were significantly correlated spontaneously, the percentage of modified interactions was < 10%.
The endogenous cholinergic levels that occur during normal pro- cessing are not yet known. The cholinergic levels achieved in this study significantly affected the firing rates of cortical neurons, while rarely affecting the functional couplings between cortical neurons, as revealed by cross-correlations. Thus, in the auditory cortex of the anaesthetized guinea-pig, ACh appears to primarily affect the excitab- ility rather than the synaptic transmission of the cortical neurons. Furthermore, these excitability changes are not large enough to be significantly reflected in the functional coupling of spontaneously active neurons.
Acknowledgements We wish to thank J. Auerbach, M. Segal and V. Greenberger for their assistance with the histology, Y. Frtgnac, H. Markram, M. Segal for helpful comments on the manuscript and B. Schick for reviewing the manuscript and help with the English. This study was supported by the Israel Science Foundation, administered by the Israel Academy of Sciences and Humanities and by the Minerva Foundation, Munich, Germany. D. E. S . was supported by the MDRI- CNRS, HFSP and the French Ministry of Foreign Affairs during his visits to the Weizmann Institute.
Abbreviations ACh acetylcholine AChE acetylcholinesterase
cc‘ modified Correlation coefficient CE combined electrode ChAT choline acetyltransferase
asynchronous gain
DC double combined electrode configuration GABA y-aminobutyric acid sc single combined electrode configuration TE tungsten-in-glass electrode
References Abeles, M. (1982a) Quantification, smoothing and confidence limits for single
unit’s histograms. J. Neurosci. Methods, 5, 317-325. Abeles, M. (1982b) Lucul Cortical Circuits. An Electrophysiological Study.
Springer-Verlag, New York. Aertsen, A. M. H. J. and Gerstein, G. L. (1985) Evaluation of neuronal
connectivity: sensitivity of cross-correlation. Brain Res., 340, 341-354. Aertsen, A. M. H. J., Gerstein, G. L., Habib, M. K. and Palm, G. (1989)
Dynamics of neuronal firing correlation: modulation of ‘effective connectivity’. J . Neurophysiol., 61, 900-917.
Aertsen, A. M. H. J., Erb, M. and Palm, G. (1994) Dynamics of functional coupling in the cerebral cortex: an attempt at a model-based interpretation.
Ahissar, E. and Ahissar, M. (1994) Plasticity in auditory cortical circuitry. Curr: Opin. Neurobiol., 4, 580-587.
Ahissar, E., Vaadia, E., Ahissar, M., Bergman, H., Arieli, A. and Abeles, M. (1992a) Dependence of cortical plasticity on correlated activity of single neurons and on behavioral context. Science, 257, 1412-1415.
Ahissar, E., Haidarliu, S. and Shula, D. E. (in press) Possible involvement of neuromodulatory systems in cortical Hebbian-like plasticity. J. Physiol. (Paris).
Ahissar, M., Ahissar, E., Bergman, H. and Vaadia, E. (1992b) Encoding of sound source and movement: the activity of single neurons and interactions between adjacent neurons in the primary auditory cortex of monkeys. J. Neurophysiol., 67, 203-215.
Auerbach, J. M. and Segal, M. (1994) A novel cholinergic induction of Iong- term potentiation in rat hippocampus. J. Neurophysiol.; 72, 2034-2040.
Bassant, M. H., Baleyte, J. M. and Lamour, Y. (1990) Effects of acetylcholine on single cortical somatosensory neurons in the unanesthetized rat. Neuroscience, 39, 189-197.
Bear, M. F., Carnes, K. M. and Ebner, F. F. (1985) An investigation of cholinergic circuitry in cat striate cortex using acetylchohesterase histochemistry. J. Comp. Neurol., 234, 411430.
Biegon, A., Greenberger, V. and Segal, M. (1986) Quantitative histochemistry of brain acetylcholinesterase and learning rate in the aged rat. Neurobiol. of Aging, 7, 215-217.
Cohen, S., Haidarliu, S., Ahissar, E. and Shulz, D. (1994) Cholinergic modulation of functional connectivity of local cortical circuits in the auditory cortex. Eur: Neurosci. Assoc. Abstr., 1, 12.
Cox, C. L., Metherate, R. and Ashe, J. H. (1994) Modulation of cellular excitability in neocortex: muscarinic receptor and second messenger- mediated actions of acetylcholine. Synapse, 16, 123-136.
Criswell, M. H. and Brandon, C. (1993) Acetylcholinesterase and choline acetyltransferase localization patterns do correspond in cat and rat retinas. Virion Res., 33, 1141-1753.
Eggermont, J. J. (1992) Neural interaction in cat primary auditory cortex. Dependence on recording depth, electrode separation, and age. J. Neurophysiol., 68, 12161228.
Eggermont, J. J., Smith, G. M. and Bowman, D. (1993) Spontaneous burst firing in cat primary auditory cortex: age and depth dependence and its effect on neural interaction measures. J . Neurophysiol., 69, 1292-1313.
Ginzburg, I. and Sompolinsky, H. (1994) Theory of correlations in stochastic neural networks. Phys. Rev. E, 50, 3171-3191.
Haidarliu, S., Shulz, D. and Ahissar, E. (1995) A multielectrode array for combined microiontophoresis and multiple single-unit recording. J. Neurosci. Methods, 56, 125-131.
Haidarliu, S. (1996) An anatomically-adapted, injury free headholder for guinea pigs. Physiol. Eehav., 60, 111-114.
Hars, B., Maho, C. , Edeline, J. M. and Hennevin, E. (1993) Basal forebrain stimulation facilitates tone evoked responses in the auditory cortex of the awake rat. Neuroscience, 56, 61-74.
Irle, E. and Markowitsch, H. J. (1984) Basal forebrain efferents reach the whole cerebral cortex in the cat. Brain Res. Bull., 12,493-512.
Jones, R. S. and Olpe, H. R. (1984) On the role of the baseline firing rate in determining the responsiveness of cingulate cortical neurons to iontophoretically applied substance P and acetylcholine. J. Pharm. Pharmacol., 36, 623-625.
Kmjevic, K. and Phillis, J. W. (1963) lontophoretic studies of neurones in the mammalian cerebral cortex. J. Physiol. ( h n d . ) , 165, 274-304.
PhYsica-D, 75, 103-128.
Cholinergic modulation of correlated activity 409
rich and choline acetyltransferase-positive (cholinergic) axons in human cerebral cortex. Bruin Res., 577, 112-120.
Mesulam, M. M., Mufson, E. J., Levey, A. I. and Wainer, B. H. (1983) Cholinergic innervation of cortex by basal forebrain: cytochemistry and cortical connections of the septa1 area, diagonal band nuclei, nucleus basalis (substantia innominata) and hypothalamus in the rhesus monkey. J. Comp. Neurol., 214, 170-197.
Metherate, R. and Ashe, J. H. (1993) Nucleus basalis stimulation facilitates thalamocortical synaptic transmission in the rat auditory cortex. Synapse, 14, 132-143.
Metherate, R., Tremblay, N. and Dykes, R. W. (1988) Transient and prolonged effects of acetylcholine on responsiveness of cat somatosensory cortical neurons. J. Neurophysiol., 59, 1253-1276.
Metherate, R., Ashe, J. H. and Weinberger, N. M. (1990) Acetylcholine modifies neuronal acoustic rate-level functions in guinea pig auditory cortex by an action at muscarinic receptors. Synapse, 6, 364368.
Metherate, R., Cox, C. L. and Ashe, J. H. (1992) Cellular bases of neocortical activation: modulation of neural oscillations by the nucleus basalis and endogenous acetylcholine. J. Neurosci., 12, 470 1 4 7 11.
Muller, C. M. and Singer, W. (1989) Acetylcholine-induced inhibition in the cat visual cortex is mediated by a GABAergic mechanism. Brain Res., 487,
Munk, M. H. J., Roelfsema, P. R., Konig, P., Engel, A. K. and Singer, W. (1996) Role of reticular activation in the modulation of intracortical synchronization. Science, 272, 271-274.
Nelson, J. I., Salin, P. A., Munk, M. H. J., Arzi, M. and Bullier, J. (1992) Spatial and temporal coherence in cortico-cortical connections: a cross- correlation study in areas 17 and 18 in the cat. Vis. Neurosci., 9, 21-37.
Perkel, D. H., Gerstein, G. L. and Moore, G. P. (1967a) Neuronal spike trains and stochastic point processes. I. The single spike train. Biophys. J., 7, 391418.
Perkel, D. H., Gerstein, G. L. and Moore, G. P. (1967b) Neuronal spike trains and stochastic point processes. 11. Simultaneous spike train. Biophys. J. , 7, 419-440.
Randic, M., Siminoff, R. and Straughan, D. W. (1 964) Acetylcholine depression of cortical neurons. Exp. Neurol., 9, 236-242.
Sato, H., Hata, Y., Masui, H. and Tsumoto, T. (1987) A functional role of cholinergic innervation in neurons in the cat visual cortex. J. Neurophysiol.,
Segal, M. (1982) Multiple actions of acetylcholine at a muscarinic receptor studied in the rat hippocampal slice. Brain Rex, 246, 77-87.
Semba, K. (1991) The cholinergic basal forebrain: a critical role in cortical arousal. In Napier, T. C., Kalivas, P. W. and Hanin, I. (eds), The Basal Forebrain. Plenum Press, New York, pp. 197-217.
Shulz, D. E., Bringuier, V. and Fregnac, Y. (1993) Complex-like structure of simple visual cortical receptive fields is masked by GABAA intracortical inhibition. Soc. Neurosci. Absts, 19, 638.
Shulz, D. E., Cohen, S., Haidarliu, S. and Ahissar, E. (1995) Effects of acetylcholine on correlated activity of auditory cortical neurons in the anesthetized guinea pig. Soc. Neurosci. AbstK, 21, 668.
Sillito, A. M. and Kemp, J. A. (1983) Cholinergic modulation of the functional organization of the cat visual cortex. Brain Rex, 289, 143-155.
Vaadia, E., Ahissar, E., Bergman, H. and Lavner, Y. (1991) Correlated activity of neurons: a neural code for higher brain functions? In Kruger, J. (ed.), Neuronal Cooperativity. Springer Verlag, Berlin, pp. 250-279.
335-342.
58, 765-780.
Kmjevic, K., Pumain, R. and Reanud, L. (1971) The mechanism of excitation by acetylcholine in the cerebral cortex. J . Physiol. (Lond.), 215, 247-268.
Kruger, J. and Aiple, F. (1988) Multielectrode investigation of monkey striate cortex: spike train correlations in the infragranular layers. J . Neurophysiol.,
Lamour, Y., Dutar, P. and Jobert, A. (1982) Excitatory effect of acetylcholine on different types of neurons in the first somatosensory neocortex of the rat: laminar distribution and pharmacological characteristics. Neuroscience, 7, 1483-1494.
Lamour, Y., Dutar, P., Jobert, A. and Dykes, R. W. (1988) An iontophoretic study of single somatosensory neurons in rat granular cortex serving the limbs: a laminar analysis of glutamate and acetylcholine effects on receptive- field properties. J. Neurophysiol., 60, 725-750.
Lavner, Y. (1 989). Functional interactions between cells in the prefrontal cortex of behaving monkeys. MSc Thesis, Hebrew University, Jerusalem,
Legendy, C. R. and Salcman, M. (1985) Bursts and recurrences of bursts in the spike trains of spontaneously active striate cortex neurons. J. Neurophysiol., 53, 926939.
Levick, W. R., Cleland, B. G. and Dubin, M. W. (1972) Lateral geniculate neurons of cat: retinal inputs and physiology. Invest. Ophthalml., 1, 302-3 10.
Lysakowski, A., Wainer, B. H., Bruce, G. and Hersh, L. B. (1989) An atlas of the regional and laminar distribution of choline acetyltransferase immunoreactivity in rat cerebral cortex. Neuroscience, 28, 291-336.
Markram, H. and Segal, M. (1990) Long-lasting facilitation of excitatory postsynaptic potentials in the rat hippocampus by acetylcholine. J. Physiol. (Lond.}, 427, 381-393.
Markram, H. and Segal, M. (1992) The inositol 1,4,5-triphosphate pathway mediates cholinergic potentiation of rat hippocampal neuronal responses to NMDA. J. Physiol. (Lond.}, 447, 513-533.
McCormick, D. A. (1992a) Neurotransmitter actions in the thalamus and cerebral cortex and their role in neuromodulation of thalamocortical activity. Prog. Neumbiol., 39, 337-388.
McCormick, D. A. (1992b) Cellular mechanisms underlying cholinergic and noradrenergic modulation of neuronal firing mode in the cat and guinea pig dorsal lateral geniculate nucleus. J. Neurosci., 12, 278-289.
McCormick, D. A,, Connors, B. W., Lighthall, J. W. and Prince, D. A. (1985) Comparative electrophysiology of pyramidal and sparsely spiny stellate neurons of the neocortex. J. Neurophysiol., 54, 782-806.
McCormick, D. A. and Prince, D. A. (1986) Acetylcholine induces burst firing in thalamic reticular neurones by activating a potassium conductance. Nature, 319, 402-406.
McKenna, T. M., Ashe, J. H., Hui, G. K. and Weinberger, N. M. (1988) Muscarinic agonists modulate spontaneous and evoked unit discharge in auditory cortex of cat. Synapse, 2, 54-68.
Melssen, W. J. and Epping, W. J. M. (1987) Detectiod and estimation of neural connectivity based on cross-correlation analysis. Biol. Cybern., 57, 403-414.
Mesulam, M. M. (1995) Structure and function of cholinergic pathways in the cerebral cortex, limbic system, basal ganglia, and thalamus of the human brain. In Bloom, E E. and Kupfer, D. J. (eds), Psychopharmacology: The Fourth Generation of Progress. Raven Press, New York, pp. 135-146.
Mesulam, M. M. and Geula, C. (1992) Overlap between acetylcholinesterase-
60, 798-828.


![SciHub - WordPress.com · 11/09/2016 · leads to an overabundance of acetylcholine at the neuronal synapses and the neuromuscular junction [12,13]. After ... hub.cc](https://img.dokumen.tips/doc/110x75/5ad692f27f8b9aff228e79bc/scihub-to-an-overabundance-of-acetylcholine-at-the-neuronal-synapses-and-the-neuromuscular.jpg)