Embed Size (px)
Citation preview

Research ArticleDifferential Diagnosis Model of Hypocellular MyelodysplasticSyndrome and Aplastic Anemia Based on the Medical BigData Platform
Jianhui Wu,1,2 Lu Zhang,1 Sufeng Yin,1,2 Haidong Wang,1 Guoli Wang,1,2
and Juxiang Yuan 1,2
1School of Public Health, North China University of Science and Technology, Tangshan, Hebei 063210, China2Hebei Province Key Laboratory of Occupational Health and Safety for Coal Industry, North China University of Scienceand Technology, Tangshan, Hebei 063210, China
Correspondence should be addressed to Juxiang Yuan; [email protected]
Received 10 July 2018; Revised 4 September 2018; Accepted 12 September 2018; Published 12 November 2018
Guest Editor: Zhihan Lv
Copyright © 2018 Jianhui Wu et al. This is an open access article distributed under the Creative Commons Attribution License,which permits unrestricted use, distribution, and reproduction in any medium, provided the original work is properly cited.
The arrival of the era of big data has brought new ideas to solve problems for all walks of life. Medical clinical data is collected andstored in the medical field by utilizing the medical big data platform. Based onmedical information big data, new ideas andmethodsfor the differential diagnosis of hypo-MDS and AA are studied. The basic information, peripheral blood classification counts,peripheral blood cell morphology, bone marrow cell morphology, and other information were collected from patients diagnosedwith hypo-MDS and AA diagnosed in the first diagnosis. First, statistical analysis was performed. Then, the logistic regressionmodel, decision tree model, BP neural network model, and support vector machine (SVM) model of hypo-MDS and AA wereestablished. The sensitivity, specificity, Youden index, positive likelihood ratio (+LR), negative likelihood ratio (−LR), area undercurve (AUC), accuracy, Kappa value, positive predictive value (+PV), negative predictive value (−PV) of the four model trainingset and test set were compared, respectively. Finally, with the support of medical big data, using logistic regression, decision tree,BP neural network, and SVM four classification algorithms, the decision tree algorithm is optimal for the classification of hypo-MDS and AA and analyzes the characteristics of the optimal model misjudgment data.
1. Introduction
Myelodysplastic syndrome (MDS) is a clonal disease ofacquired hematopoietic stem/progenitor cells, which is trans-formed into clinical features by myelocyte hematopoiesis andhigh risk to acute myeloid leukemia [1]. Some patients withMDS have low bone marrow hyperplasia, called hypocellularmyelodysplastic syndrome (hypo-MDS). Hypo-MDS is aspecial type of MDS, accounting for 8.2%–29.0% of the totalnumber of MDS, up to 38.0% [1]. Aplastic anemia (AA)refers to the primary bone marrow hematopoietic failure syn-drome. The etiology is unknown, mainly manifested as lowbone marrow hematopoietic function and complete bloodcell reduction. Clinically, there may be bleeding and infectionperformance [2, 3].
At present, the differential diagnosis of hypo-MDS andAA is mainly carried out by hematology, cell morphology,bone marrow biopsy, and cytogenetics. In different stages ofdisease development, the peripheral blood of patients withhypo-MDS and AA may be reduced in one line, two lines,or three lines simultaneously [4, 5]. Pathological hematopoi-esis is a major indicator of clinical diagnosis of hypo-MDS,but it has the disadvantages of poor reproducibility, poorspecificity, and low sensitivity. Furthermore, pathologicalhematopoiesis can also be seen in some patients with AA[5]. Some studies have also found that there is no pathologi-cal hematopoietic MDS [6]. These show the nonspecificity ofpathological hematopoiesis. Previously, cytogenetic abnor-malities were considered to be reliable diagnostic criteriafor hypo-MDS, but the detection rate of chromosomal
HindawiComplexityVolume 2018, Article ID 4824350, 12 pageshttps://doi.org/10.1155/2018/4824350

abnormalities in MDS patients ranged from 40% to 60%[7, 8] and even lower in hypo-MDS patients [9]. It can beseen that the abnormal cytogenetic ratio of MDS is not veryhigh, suggesting that the index is not specific. In recent years,the value of flow cytometry (FCM) in the differential diagno-sis of AA and hypo-MDS has become increasingly important[10, 11], but the differential diagnosis of hypo-MDS and AAwith a single immunophenotypic marker is too low. The useof FCM to assess erythroid malignancies (a milestone in thediagnosis of MDS morphology) is difficult, limiting the wide-spread use of FCM in the diagnosis of MDS [12].
It can be seen that the pathological features and clinicalmanifestations of hypo-MDS and AA are very similar, andthere are many differential diagnosis indicators, but thespecificity is not high and the differential diagnosis of thesetwo diseases is difficult in clinical practice. Every diagnosisprocess of disease will produce a large amount of data, andthe data contain a lot of information about the disease.Therefore, using the collected big data for data mining, wecan effectively analyze the disease.
Data mining refers to the process of extracting knowl-edge and information that has potential application valuefrom large databases. It is a new type of the informationprocessing system that has been rapidly developed in recentyears [13]. Classification is a very important task in data min-ing. Commonly used methods include logistic regression,neural networks, decision trees, and SVM. Each of thesemethods has its own characteristics, has a strong representa-tion in the classification algorithm, and has been widely andsuccessfully applied in the medical field [14–16].
Some scholars have compared the classification effects ofdata mining classification methods in the medical field. Forexample, Agarwal et al. [17] compared the Bayesian, SVM,and decision tree classification results using medical data.The results show that the SVM has the highest classificationaccuracy. Heydari et al. [18] compared neural network,SVM, decision tree, and Bayesian methods in the diagnosisof type 2 diabetes and found that the highest accuracy ofthe neural network model is 97.44%, the decision tree is95.03%, and the Bayesian network is 91.60%, while theaccuracy of SVM is only 81.19%. Lui et al. [19] used SVM,Bayesian networks, radial basis neural networks, and multi-layer perceptrons to establish a classification model of mag-netic resonance features of mild traumatic brain injury. Thehighest accuracy rate is the radial basis neural networks(74%); the worst is the multilayer sensor (66%), and SVMand Bayesian network are 70%. Tseng et al. [20] used deci-sion trees and neural network methods to analyze the prog-nosis of oral cancer patients and found that both methodshad higher accuracy, but compared to neural networks, theresults of the decision tree model are easier to explain andeasier to accept. Wu et al. [21] compared the classificationperformance of the BP neural network and logistic regressionand found that the classification accuracy of the BP neuralnetwork (93.5%) was higher than that of the logistic regres-sion model (90.7%).
Based on the current clinical problems of differentialdiagnosis of hypo-MDS and AA, the case data of hypo-MDS patients and AA patients were analyzed, the data that
did not conform to the actual and the errors were deleted,and the pure data was obtained. Then, applying pure big datato the data mining algorithm was done to compare theeffects. In this study, logistic regression, decision tree, BPneural network, and SVM are used to establish the differen-tial diagnosis model of two diseases. Through the evaluationof the model, a better classification model is finally obtained,combined with the clinical features of the misdiagnosed casesof the best differential diagnosis model, and the combineddifferential diagnosis is performed. This provides an effectivenew idea and method for the differential diagnosis of hypo-MDS and AA.
2. Medical Big Data Acquisition and StorageSystem Based on the Medical BigData Platform
2.1. Medical Big Data Platform Software Architecture. Medi-cal big data platform (MBDP) is a distributed system infra-structure developed by the Apache Foundation that allowsusers to develop distributed programs without knowing theunderlying details of the distribution and take advantage ofthe power of clusters for high-speed computing and storage.Medical big data platform provides developers with a reli-able, efficient, and scalable open source software frameworkfor processing massive amounts of data. It realizes distrib-uted computing of massive data in a cluster composed of alarge number of computers. The medical big data platformopen source distributed computing platform is mainly com-posed of two parts: medical big data platform distributed filesystem and MapReduce distributed computing framework(see Figure 1).
Medical big data platform is an open source, distributedstorage, distributed computing platform that extends a singleserver to a cluster machine, with each node providing localcomputing and storage without relying on hardware for highavailability. As the core component, MapReduce is used toimplement task decomposition and scheduling. MBDP isused to store massive amounts of data. By storing the medicalbig data of clinical patients in real time and further effectivelycalculating and processing, the application value of the med-ical big data platform is fully utilized.
2.2. Research on Distributed Optimization of MBDP Based onBig Data. MBDP has been excellent enough in stability andperformance, but it has low storage efficiency, cluster load
Others(data processing)
MapReduce(data processing)
YARN(cluster resource management)
MBDP(redundrant, reliable, storage)
Figure 1: The core of the medical big data platform.
2 Complexity

balancing ability is poor, NameNode single point failure, Job-Tracer load is too large, small file problem, hot spot problem,etc. Both seriously restrict the further development of MBDP.In order to achieve higher storage efficiency and more opti-mized load balancing capabilities for MBDP, an improvedsolution for MBDP is Noah. The management of the sectionis done by the mapping file to each node of the cluster, whichsolves the performance bottleneck problem of the centralnode (see Figure 2).
The experimental results show that Noah improves thedata recovery speed of MBDP while ensuring the security ofcluster data, optimizes the load balancing capability ofMBDP, and reduces the overall storage cost of the medicalbig data platform. This has obvious implications for improv-ing the actual operational efficiency of the medical big dataplatform and its associated cloud computing architecture.
2.3. Storage Platform Framework Based on Hypo-MDS andAA Case Big Data. According to the timeliness and largereserves of hypo-MDS and AA case data, the medical big dataplatform distributed storage system is placed in the virtuali-zation pool of the resource management platform, with themedical big data platform slave node deployed dynamically,and the medical big data platform distributed storage isquickly built.
The newly built big data storage platform has good com-patibility and long life cycle. The medical diagnosis processdata is stored in the platform in real time to realize dataanalysis and processing. In the process of data storage,patient’s basic information, peripheral blood classificationcount, peripheral blood cell morphology, bone marrow cellmorphology, and other quantifiable data are included. Fur-ther interface with the classification system to achieve differ-ential diagnosis of hypoplastic myelodysplastic syndromeand aplastic anemia is needed.
3. Big Data Based on Hypo-MDS and AA Cases
3.1. Storage Database Construction of Hypo-MDS and AACases Big Data
3.1.1. Data Collection for Hypo-MDS and AA Cases. Casedata of hypo-MDS patients and AA patients were taken fromthe Affiliated Hospital of North China University of Technol-ogy and the Chinese Academy of Medical Sciences BloodDisease Hospital. A medical information database was madeto collect basic information and medical history of eligiblepatients including the patient’s gender, age, occupation, mar-ital status, and smoking and drinking history. And the clini-cal examination data of the patients, including the peripheralblood classification count, peripheral blood cell morphology,and bone marrow cell morphology, were also collected.
3.1.2. Inclusion Criteria. The inclusion criteria include thefollowing data:
(1) Newly diagnosed cases admitted from January 1,2008, to December 31, 2016
(2) All hypo-MDS and AA cases met the 2008 revisedWHO MDS classification criteria and blood diseasediagnosis and efficacy criteria (third edition). Thehypo-MDS also needs to meet the bone marrow tis-sue biopsy. The bone marrow cell volume is less than30% for those under 60 years old or less than 20% forthose over 60 years old and confirmed by a number ofblood disease experts
(3) Patient case information was recorded using stan-dard cases
3.1.3. Exclusion Criteria. The exclusion criteria include thefollowing data:
Stan
dby
top
nam
e nod
eTo
p na
me n
ode
No.1 storage biock
No.1 storage biock
No.1 storage biockNo.N name node
No.1 standby name node
No.2 name node
No.1 standby name node
No.1 name node
No.1 standby name node
No.1 data node
No.1 data node
No.1 data node
……
……
……
……
Bloc
k po
ol
Figure 2: The structure diagram of the MBDP system for distributed nodes.
3Complexity

(1) Have severe wasting diseases
(2) Have a history of malignant tumors
3.2. Hypo-MDS and AA Diagnostic Criteria [2]. Hypo-MDSand AA disease diagnostic criteria overlap in hematologyand cell morphology such as peripheral blood cell reductionand bone marrow hyperplasia [22]. How to distinguishbetween the two is often a big problem that plagues clini-cians. The use of data mining methods to apply the collecteddata to the differential diagnosis of low proliferative myelo-dysplastic syndrome and aplastic anemia will greatly improvethe accuracy of diagnosis.
3.2.1. Hypo-DMS Diagnostic Criteria. Hypo-MDS has so farno unified diagnostic criteria. The reference conditions forhypo-MDS diagnosis are as follows. (1) Peripheral bloodshowed more than two series of cytopenias, and the originalcells or nucleated red blood cells could be seen in the classifi-cation. (2) Bone marrow smears show hyperplasia at morethan two sites. (3) Bone marrow sections show a decreasein the bone marrow hematopoietic area and bone marrowcell volume, less than 30% for those under 60 years old andless than 20% for those over 60 years old. (4) The bone mar-row has a pathological hematopoiesis in one or both bloodcells, and the number of primitive cells varies depending onthe MDS subtype.
3.2.2. AA Diagnostic Criteria. The AA diagnostic criteriainclude the following data: (1) the reduction of whole bloodcells, the percentage of reticulocytes< 1%, and the increaseof the proportion of lymphocytes; (2) generally withouthepatosplenomegaly; (3) reduced hyperplasia of bone mar-row (<normal 50%) or severe reduction (<normal 25%),decreased hematopoietic cells, increased proportion of non-hematopoietic cells, and empty bone marrow granules (bonemarrow biopsy shows that hematopoietic tissue is reduced);(4) can exclude other diseases that cause pancytopenia, suchas PNH, acute hematopoietic function arrest, megaloblasticanemia, myelofibrosis, and acute leukemia.
3.3. Analysis of Big Data in Hypo-MDS and AA Cases
3.3.1. General Situation of the Research Object. From January1, 2008, to December 31, 2016, patients with hypo-MDS andAA diagnosed at the Institute of Hematology, Chinese Acad-emy of Medical Sciences, and the Affiliated Hospital of North
China University of Technology were selected as the studysubjects. A total of 325 cases of AA patients were collected,among which 118 were not diagnosed for the first time and51 cases were incomplete. A total of 156 AA patients enteredthe study. We collected 162 cases of patients with hypo-MDS,of which 19 were not first diagnosed and 13 cases wereincomplete. In total, 130 patients with hypo-MDS enteredthe study (see Figure 3).
Of 156 patients with AA, 83 were men (53.20%) and 73were women (46.80%). The age range was 6–80 years, andthe average age was 28.51± 15.46 years. Of the 130 patientswith hypo-MDS, 69 (53.08%) were males and 61 (46.92%)were females. The age range was 11–82 years, and the averageage was 36.81± 16.42 years. The difference in age between thetwo diseases was statistically significant (χ2 = 16 74, P =0 001). The two diseases are in gender composition (χ2 <0 001, P = 0 983), marital status (χ2 = 1 26, P = 0 261), his-tory of smoking (χ2 = 1 70, P = 0 193), ethnic (χ2 = 0 79,P = 0 374), and drinking history (χ2 = 3 80, P = 0 051); therewere no statistically significant differences in such aspects.
In terms of occupational composition of patients, thepatient populations of the two diseases are mainly concen-trated in workers, farmers, and students. The difference inoccupational composition between the two diseases was sta-tistically significant (χ2 = 49 87, P < 0 001). The proportionof farmers with hypo-MDS is the highest (38.46%), whilethe percentage of students with AA is the highest (51.92%)(see Table 1).
3.3.2. Results of Laboratory Tests in Two Groups of Patients.Peripheral blood cell counts, blood smears, and bone marrowsmears were analyzed in 130 patients with hypo-MDS and156 patients with AA. Blood cell counts showed that thered blood cell content and hemoglobin content in hypo-MDS patients were lower than those in AA patients, andthe difference was statistically significant (P < 0 05). Theplatelet content of patients with hypo-MDS was lower thanthat of patients with AA, but there was no significant differ-ence between the two groups (P > 0 05).
Blood smear showed that the proportion of neutrophilsin rod-shaped nucleus was lower in hypo-MDS patients thanin AA patients, and the proportion of mature lymphocyteswas lower in AA patients than in AA patients (P < 0 05).The proportion of neutrophilic neutrophils and maturemononuclear cells in patients with hypo-MDS was higher
325 AA confirmed
118 not the first confirmed patients
51 incomplete information
156 AA patients entered the study
162 hypo-MDS confirmed
19 not the first confirmed
13 incomplete patient
130 hypo-MDS patients entered the study
Figure 3: The selection of research object.
4 Complexity

than that in patients with AA, but there was no significantdifference between the two groups (P > 0 05).
The morphology of myeloid cells showed that theproportion of precocious neutrophils, late neutrophils,neutrophils, polymorphonuclear neutrophils, and maturelymphocytes was lower in patients with hypo-MDS than inpatients with AA. The proportion of early red blood cells,medium and young red blood cells, late young red blood cells,and mature plasma cells is higher in hypo-MDS patients than
in AA patients. And the difference was statistically significant(P < 0 05). The proportion of mature monocytes in patientswith hypo-MDS is higher than that of patients with AA. Theproportion of neutrophils and rod-shaped nuclear neutrophilsis lower than that of AA patients, but the difference was notstatistically significant (P > 0 05) (see Table 2).
3.3.3. Variable Selection and Assignment.Although the differ-ence in occupational composition between hypo-MDS and
Table 1: The basic characteristics of the patients.
General information Category AA (%) Hypo-MDS (%) χ2 P
Age
0~14 26 (16.67) 5 (3.85)
18.04 <0.00115~29 70 (44.87) 50 (39.23)
30~59 54 (33.97) 63 (48.46)
≥60 6 (4.49) 12 (9.23)
SexMale 83 (53.21) 69 (53.08) <0.01 0.983Female 73 (46.79) 61 (46.92)
Marital statusUnmarried 80 (51.28) 58 (44.62)
1.26 0.261Married 76 (48.72) 72 (55.38)
EthnicMinority 8 (5.13) 10 (7.69)
0.79 0.374Ethnic Han 148 (94.87) 120 (92.31)
Profession
Cadres 10 (6.41) 0 (0.00)
60.93 <0.001
Workers 36 (20.08) 19 (14.62)
Farmers 24 (15.39) 50 (38.46)
Self-employed 2 (1.28) 4 (3.08)
Students 81 (51.92) 36 (27.69)
No work 3 (1.92) 21 (16.15)
Table 2: Laboratory results (x ± s).
Item Index Hypo-MDS (n = 130) AA (n = 156) t P
Blood cell count
WBC (×1012/L) 2.87 ± 1.25 3.05 ± 1.22 1.21 0.229
RBC (×1012/L) 2.08 ± 0.71 2.57 ± 0.78 5.45 <0.001HGB (g/L) 68.89 ± 22.13 83.13 ± 24.85 5.07 <0.001
PLT (×109/L) 44.12 ± 77.81 34.31 ± 35.32 1.33 0.186
Blood smear (%)
Rod-like nuclear neutrophils 8.26 ± 11.28 7.13 ± 8.42 0.97 0.335
Lobular nuclear neutrophils 25.88 ± 14.63 21.54 ± 16.23 2.34 0.020
Mature lymphocyte 59.07 ± 18.51 65.62 ± 20.78 2.79 0.006
Mature monocyte 3.35 ± 3.70 2.73 ± 2.68 1.57 0.117
Marrow smear (%)
Progranulocyte 0.55 ± 0.94 0.34 ± 0.59 2.14 0.033
Neutrophil neutrophils 3.18 ± 2.65 3.27 ± 3.61 0.25 0.804
Neutrophil metamylocyte 2.90 ± 2.31 3.93 ± 4.06 2.70 0.008
Rod-like nuclear neutrophils 7.65 ± 3.54 8.86 ± 6.19 1.97 0.050
Lobular nuclear neutrophils 4.79 ± 4.67 7.14 ± 7.73 3.17 0.002
Basophilic normoblast 0.81 ± 1.11 0.47 ± 0.92 2.75 0.006
Polychromatic normoblast 11.16 ± 11.41 5.53 ± 7.48 4.83 <0.001Orthochromatic normoblast 21.85 ± 15.61 12.75 ± 10.95 5.59 <0.001
Mature lymphocyte 43.42 ± 25.43 52.27 ± 24.75 2.97 0.003
Mature monocyte 2.00 ± 6.50 1.38 ± 1.56 1.16 0.249
Mature plasma cell 0.64 ± 0.92 0.98 ± 1.49 2.37 0.019
5Complexity
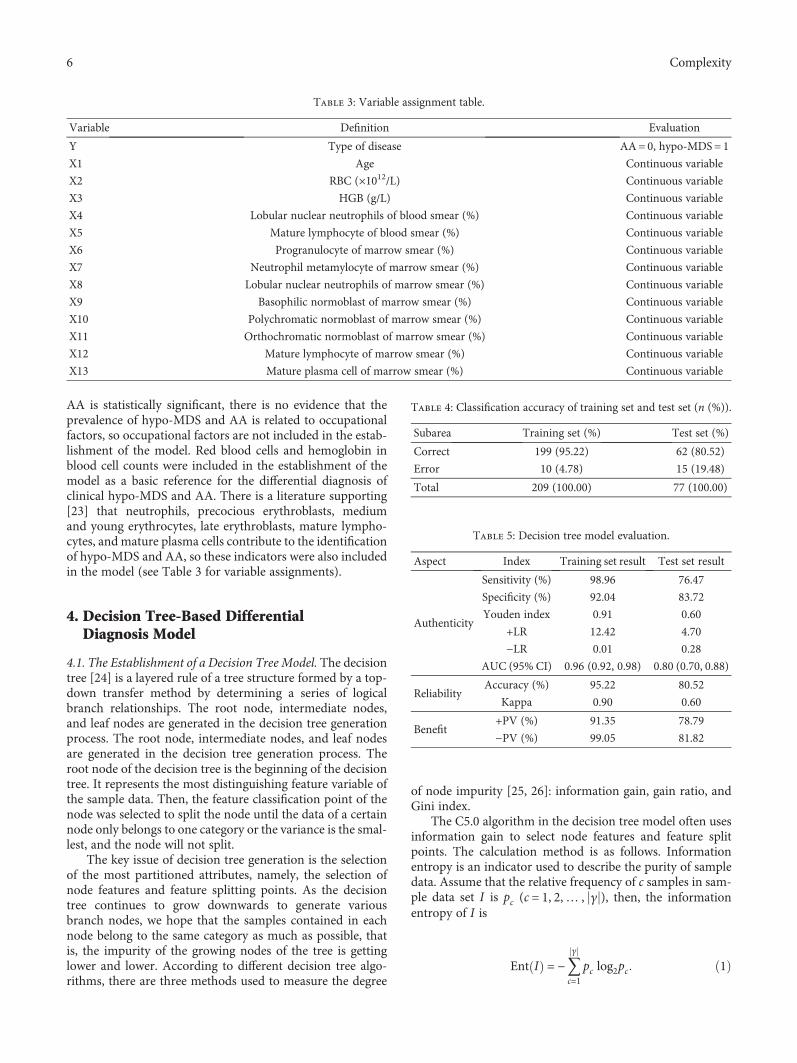
AA is statistically significant, there is no evidence that theprevalence of hypo-MDS and AA is related to occupationalfactors, so occupational factors are not included in the estab-lishment of the model. Red blood cells and hemoglobin inblood cell counts were included in the establishment of themodel as a basic reference for the differential diagnosis ofclinical hypo-MDS and AA. There is a literature supporting[23] that neutrophils, precocious erythroblasts, mediumand young erythrocytes, late erythroblasts, mature lympho-cytes, and mature plasma cells contribute to the identificationof hypo-MDS and AA, so these indicators were also includedin the model (see Table 3 for variable assignments).
4. Decision Tree-Based DifferentialDiagnosis Model
4.1. The Establishment of a Decision Tree Model. The decisiontree [24] is a layered rule of a tree structure formed by a top-down transfer method by determining a series of logicalbranch relationships. The root node, intermediate nodes,and leaf nodes are generated in the decision tree generationprocess. The root node, intermediate nodes, and leaf nodesare generated in the decision tree generation process. Theroot node of the decision tree is the beginning of the decisiontree. It represents the most distinguishing feature variable ofthe sample data. Then, the feature classification point of thenode was selected to split the node until the data of a certainnode only belongs to one category or the variance is the smal-lest, and the node will not split.
The key issue of decision tree generation is the selectionof the most partitioned attributes, namely, the selection ofnode features and feature splitting points. As the decisiontree continues to grow downwards to generate variousbranch nodes, we hope that the samples contained in eachnode belong to the same category as much as possible, thatis, the impurity of the growing nodes of the tree is gettinglower and lower. According to different decision tree algo-rithms, there are three methods used to measure the degree
of node impurity [25, 26]: information gain, gain ratio, andGini index.
The C5.0 algorithm in the decision tree model often usesinformation gain to select node features and feature splitpoints. The calculation method is as follows. Informationentropy is an indicator used to describe the purity of sampledata. Assume that the relative frequency of c samples in sam-ple data set I is pc (c = 1, 2,… , γ ), then, the informationentropy of I is
Ent I = −〠γ
c=1pc log2pc 1
Table 3: Variable assignment table.
Variable Definition Evaluation
Y Type of disease AA= 0, hypo-MDS= 1
X1 Age Continuous variable
X2 RBC (×1012/L) Continuous variable
X3 HGB (g/L) Continuous variable
X4 Lobular nuclear neutrophils of blood smear (%) Continuous variable
X5 Mature lymphocyte of blood smear (%) Continuous variable
X6 Progranulocyte of marrow smear (%) Continuous variable
X7 Neutrophil metamylocyte of marrow smear (%) Continuous variable
X8 Lobular nuclear neutrophils of marrow smear (%) Continuous variable
X9 Basophilic normoblast of marrow smear (%) Continuous variable
X10 Polychromatic normoblast of marrow smear (%) Continuous variable
X11 Orthochromatic normoblast of marrow smear (%) Continuous variable
X12 Mature lymphocyte of marrow smear (%) Continuous variable
X13 Mature plasma cell of marrow smear (%) Continuous variable
Table 4: Classification accuracy of training set and test set (n (%)).
Subarea Training set (%) Test set (%)
Correct 199 (95.22) 62 (80.52)
Error 10 (4.78) 15 (19.48)
Total 209 (100.00) 77 (100.00)
Table 5: Decision tree model evaluation.
Aspect Index Training set result Test set result
Authenticity
Sensitivity (%) 98.96 76.47
Specificity (%) 92.04 83.72
Youden index 0.91 0.60
+LR 12.42 4.70
−LR 0.01 0.28
AUC (95% CI) 0.96 (0.92, 0.98) 0.80 (0.70, 0.88)
ReliabilityAccuracy (%) 95.22 80.52
Kappa 0.90 0.60
Benefit+PV (%) 91.35 78.79
−PV (%) 99.05 81.82
6 Complexity

The smaller the Ent I , the higher the purity of I.When sample data is evenly distributed in each category,the maximum entropy log2C is used to indicate the lowestpurity. When all samples belong to the same category, theinformation entropy has a minimum value of 0, indicatingthe highest purity.
Assume that a is the attribute of the sample data set I,there are V possible values a1, a2,… , aV ; then, we canuse the attribute a to make a V branch nodes after zappingthe sample data set I. We note that in sample data set I con-tained in the v branch node, all samples on a that have an av
value are Iv . Therefore, the information gain obtained bydividing attribute data set I with attribute a is
Gain I, a = Ent I − 〠V
v=1
Iv
IEnt Iv 2
In general, the greater the information gain, the greaterthe purity of the division of the sample data set by the attri-bute a. Therefore, the information gain can be used to selectthe division attribute of the decision tree.
Node 0
Group
CategoryAAHypo-MDSTotal 100.000
54.06745.933
11396
209
% n
Node 1
x3
x5
x11
x12
x8
<= 2.000
<= 59.000
<= 0.500 > 0.500
x10
<= 21.000 > 21.000
x2
<= 2.380 > 2.380
x13
<= 1.000 > 1.000
x7
<= 7.500 > 7.500
x3
<= 117.000 > 117.000
> 21.500
x9
<= 0.000 > 0.000
x5
<= 67.000 > 67.000
> 59.000
> 2.000
CategoryAAHypo-MDSTotal
67.15332.84765.550
9246
137
17.64782.353
8.134
31417
74.16725.83357.416
8931
120
67.74232.25844.498
633093
31.57968.421
9.091
61319
77.02722.97335.407
671774
100.0000.0001.435
303
18.75081.250
7.656
31316
100.0000.0000.957
202
7.14392.857
6.699
11314
0.000100.000
3.349
077
22.22277.778 4.306
279
100.0000.0001.435
303
7.31792.68319.617
33841
100.0000.0000.957
202
0.000100.000
1.914
044
100.0000.0001.435
303
42.85757.143
3.349
347
12.50087.50022.967
64248
71.42928.571
3.349
627
100.0000.0002.392
505
29.16770.83334.450
215172
23.88176.11932.057
165167
18.33381.66728.708
114960
41.66758.338
5.742
67
12
96.2963.704
12.919
261
27
% nNode 12
CategoryAAHypo-MDSTotal
% n
Node 13CategoryAAHypo-MDSTotal
% n
Node 14CategoryAAhypo-MDSTotal
% n
Node 15CategoryAAhypo-MDSTotal
% n
Node 16CategoryAAHypo-MDSTotal
% nNode 19
CategoryAAHypo-MDSTotal
% nNode 21
CategoryAAHypo-MDSTotal
% nNode 22
CategoryAAHypo-MDSTotal
% n
Node 20CategoryAAhypo-MDSTotal
% n
Node 25CategoryAAhypo-MDSTotal
% n
Node 26CategoryAAHypo-MDSTotal
% nNode 2
CategoryAAHypo-MDSTotal
% nNode 3
CategoryAAHypo-MDSTotal
% n
Node 4CategoryAAHypo-MDSTotal
% n
Node 5CategoryAAHypo-MDSTotal
% n
Node 6CategoryAAHypo-MDSTotal
% nNode 7
CategoryAAHypo-MDSTotal
% n
Node 8CategoryAAHypo-MDSTotal
%Node 9
CategoryAAHypo-MDSTotal
%n nNode 17
CategoryAAHypo-MDSTotal
% nNode 18
CategoryAAHypo-MDSTotal
% nNode 23
CategoryAAHypo-MDSTotal
% nNode 24
CategoryAAHypo-MDSTotal
% n
Node 10CategoryAAHypo-MDSTotal
% n
Node 11CategoryAAHypo-MDSTotal
% n
x11
<= 21.500
<= 49.500
<= 84.000 > 84.000
> 49.000
Figure 4: Decision tree model of hypo-MDS and AA.
7Complexity

The common gain rate of the C4.5 algorithm in the deci-sion tree model is used to select node features and featuresplitting points. Using the same sign as the information gaincalculation, the gain rate is defined as
Gain ratio I, a = Gain I, aDV a
, 3
where
DV a = −〠V
v=1
Iv
Ilog2
Iv
I4
This is called the intrinsic value of the attribute a. Themore possible the value V of the attribute a, the larger thevalue of the DV a will generally be.
The CART algorithm in the decision tree model uses theGini index to select node features and feature splitting points.Using the same sign as the information gain calculation, theGini index of sample data set I can be expressed as
Gini I = 〠γ
c=1〠c,≠c
pcpc, = 1 − 〠γ
c=1p2c 5
From the sample data set I, randomly selected twosamples, according to the above formula, can be obtained,Gini D reflects the probability of inconsistency betweenthe two random sample categories. Thus, the smaller theGini D , the higher the purity of the sample data set I.
The Gini index for attributes is defined as
Gini index D, a = 〠V
v=1
Iv
IGini Iv 6
Therefore, we choose the attribute with the smallest Giniindex as the optimal partition attribute in the candidate attri-bute set A, namely,
a∗ = arg mina∈A
Gini index I, a 7
4.2. Pruning of Decision Trees. In the top-down generationprocess of decision trees, overfitting often occurs if there isno restriction on its growth. At this point, the decision treeneeds to be pruned to correct overfitting. The pruning ofdecision trees cannot be arbitrarily done, and it often needsto take into account the prediction accuracy and complexityof the decision tree; otherwise, it will cause decision loss.Pruning is divided into prepruning and postpruning accord-ing to the time of pruning [27]. Prepruning occurs during thegrowth of the decision tree and is estimated before thenode is divided. If the division at this time does not improvethe performance of the decision tree, then the partitioning isstopped and the decision branch of the decision tree is
reduced. After the pruning occurs after the completion ofthe growth of the decision tree, the nonleaf node is evaluated.If the subtree under the node can replace the leaf node toimprove the performance of the decision tree, it is prunedto prevent overfitting.
5. Decision Tree Model Establishmentand Solution
5.1. Establishment of Hypo-MDS and AA Decision TreeModels. The sample big data is partitioned; the training par-tition is 73% in the model establishment process, and the testpartition accounts for 27%. The C5.0 algorithm is used toselect the boosting method and cross-validation. The prun-ing severity is set to 75, and the minimum number of recordsper subbranch is 2. The global pruning is chosen to establisha decision tree model for the two diseases. The model of thetraining set was 209 cases: 199 cases were correctly classifiedand 10 cases were misclassified. The test set samples were 77cases: 62 cases were correctly classified and 15 cases weremisclassified (see Table 4). Sensitivity, specificity, Youdenindex, positive likelihood ratio, negative likelihood ratio,AUC, accuracy, Kappa value, positive predictive value, andnegative predictive value of the model classification wereevaluated (see Table 5).
The dendrogram depth is 8, and there are 9 layerednodes. The proportion of late erythroblasts in bone marrowcells is used as the root node to develop the growth of thedecision tree. After the growth of the decision tree is com-pleted, we can extract valid information according to thedecision rules of the decision tree, in order to achieve the pur-pose of identifying hypo-MDS and AA (see Figure 4). Forexample, the decision message passed to us by node 4 is thatthe percentage of late erythroblasts in bone marrow cells isless than 26.50% and that of peripheral blood red blood cellsis greater than 1.36%. When the age is less than 39 years old,the likelihood of the patient being AA is 76.92% and theprobability of the patient being hypo-MDS is 23.08%. Theanalysis of the effect of independent variables on the modelshowed that peripheral blood red blood cells had the greatestinfluence on model classification, followed by medium andyoung red and late young red blood cells in bone marrowcells (see Figure 5).
0.0830.0820.081
0.0790.0780.0770.0760.0750.074
X12 X10X9 X13 X6 X1 X7 X2 X3X5
0.08
Figure 5: Analysis of the importance of independent variables tothe model.
8 Complexity

5.2. Comparison of Hypo-MDS and AA ClassificationEffects by Four Models
5.2.1. Results for Training Set Samples. Combining the aboveresults, logistic regression, decision tree, BP neural network,and SVM are used to evaluate the classification models ofhypo-MDS and AA big data from three aspects: authenticity,reliability, and benefit. The results show that, in terms of thecomparison of authenticity evaluation, logistic regression,decision tree, BP neural network, and SVM, the decision treemodel has the best authenticity. In terms of reliability evalu-ation, the reliability of the decision tree model is best com-pared with logistic regression, decision trees, BP neuralnetworks, and SVM. In terms of model benefits, logisticregression, decision tree, BP neural network, and supportvector machine have the highest benefit compared to thedecision tree model (see Table 6).
After comparison, the sensitivity difference between logis-tic regression model and decision tree model and betweendecision tree model and support vector machine has statisticalsignificance (P < 0 05) (Table 7). There is no statisticallysignificant difference among other models (P > 0 05). Thedifference in specificity between logistic regression modeland decision tree model, decision tree model and BP neuralnetwork, and decision tree model and support vectormachine has statistical significance (P < 0 05). There is nostatistically significant difference among other models
(P > 0 05). The difference in accuracy between logistic regres-sion model and decision tree model, decision tree model andBP neural network, and decision tree model and support vec-tor machine has statistical significance (P < 0 05). There is nostatistically significant difference among other models(P > 0 05). There was a statistically significant difference inthe ROC curve area between logistic regression model anddecision tree model, between decision tree model and BPneural network, and between decision tree model and sup-port vector machine (P < 0 05). There is no statistically sig-nificant difference among other models (P > 0 05). Throughthe distribution map of AUC, it can be found that the areaunder the curve of the decision tree is the largest, indicatingthat the effect is the best, as shown in Figure 6.
Combining the above model evaluation indicators, thedecision tree model is the optimal model for classifying bigdata of hypo-MDS and AA in terms of model authenticity,reliability, and benefit evaluation.
5.2.2. Results for Test Set Samples. Combined with the aboveresults, the logistic regression, decision tree, BP neural net-work, and support vector machine hyper-MDS and AA bigdata classification model are evaluated from three aspects:authenticity, reliability, and benefit. The results show that,in terms of the comparison of authenticity evaluation, logisticregression, decision tree, BP neural network, and SVM, thedecision tree model has the best authenticity. In terms of
Table 6: The comparison of the training set evaluation index.
Aspects Index Logistic Decision tree BP neural network SVM
Authenticity
Sensitivity (%) 68.75 98.96 84.38 69.79
Specificity (%) 78.76 92.04 78.76 82.30
Youden index 0.48 0.91 0.63 0.52
+LR 3.24 12.42 3.97 3.94
−LR 0.40 0.01 0.20 0.37
AUC (95% CI) 0.74 (0.67, 0.80) 0.96 (0.92, 0.98) 0.82 (0.76, 0.87) 0.76 (0.70, 0.82)
ReliabilityAccuracy (%) 74.16 95.22 81.34 76.56
Kappa 0.48 0.90 0.63 0.53
Benefit+PV (%) 73.33 91.35 77.14 77.01
−PV (%) 74.79 99.05 85.58 76.23
Table 7: The comparison of the test set evaluation index [28].
Aspects Index Logistic Decision tree BP neural network SVM
Authenticity
Sensitivity (%) 70.59 76.47 76.47 67.65
Specificity (%) 72.09 83.72 72.09 76.74
Youden index 0.43 0.60 0.49 0.44
+LR 2.53 4.70 2.74 2.91
−LR 0.41 0.28 0.33 0.42
AUC (95% CI) 0.71 (0.60, 0.81) 0.80 (0.70, 0.88) 0.74 (0.63, 0.84) 0.72 (0.61, 0.82)
ReliabilityAccuracy (%) 71.43 80.52 74.03 72.73
Kappa 0.42 0.60 0.48 0.45
Benefit+PV (%) 66.67 78.79 68.42 69.70
−PV (%) 75.61 81.82 79.49 75.00
9Complexity

reliability evaluation, the reliability of the decision tree modelis best compared with logistic regression, decision trees, BPneural networks, and SVM. In terms of model benefits, logis-tic regression, decision trees, BP neural networks, and SVMcompare the decision tree models with the highest returns.After comparison, the sensitivity, specificity, accuracy, andarea under the ROC curve of the four models were not statis-tically significant (P > 0 05) (see Figure 7). Although theresults of the two comparisons show that the differencesbetween the models are not statistically significant, the per-formance of the decision tree model is significantly betterthan the other three models in terms of various indicatorsof model evaluation. In summary, the decision tree modelis the optimal model for classifying hypo-MDS and AA big
data, both in terms of model authenticity, reliability, and ben-efit evaluation. Through the distribution map of AUC, it canbe found that the area under the curve of the decision tree isthe largest, indicating that the effect is the best, as shown inFigure 7.
5.3. Analysis of Cases of Hypojudgment of Hypo-MDS andAA. Through the model evaluation, we find that the decisiontree model is the optimal classification model. Although thedecision tree model has a good prediction effect, this modelstill has the potential to misjudge hypo-MDS and AA. There-fore, it is more conducive to the differential diagnosis of thesetwo diseases of the in-depth analysis of misdiagnosed cases.
5.3.1. Hypo-MDS Misjudgment Case Analysis. The optimalmodel decision tree model classified 130 patients with hypo-MDS and classified 13 patients with hypo-MDS as AApatients. Comparing the misjudgment cases with the positivecases, it was found that the red blood cell content and hemo-globin content in the misjudged cases in the peripheral bloodcell count were higher than the positive cases. The proportionof mature lymphocytes in misdiagnosed cases in bone marrowsmear is higher than that in positive cases. The proportion ofearly erythroblasts and late erythroblasts was lower than thatof positive culprit cases, and the difference was statisticallysignificant (P < 0 05). There was no significant differenceamong other indicators (P > 0 05).
5.3.2. AA Misjudgment Case Analysis. The optimal modeldecision tree model classified 156 patients with AA, and 15patients with AA were misclassified as hypo-MDS patients.Comparing the erroneously judged case with the positivecase, it was found that the erythrocyte content and hemoglo-bin content in the erroneously judged cases in the peripheralblood cell count were lower than the positive case. The pro-portion of early erythroblasts, the ratio of red blood cells toyoung erythroblasts, and the proportion of late erythroblastsin misdiagnosed cases in bone marrow smears are higherthan that in positive cases. The proportion of mature lym-phocytes was lower than that of positive cases, and the differ-ence was statistically significant (P < 0 05). However, therewas no significant difference in other indicators (P > 0 05).
6. Conclusion
According to the analysis of basic patient data and diseaseindex data, the difference in age and occupational compo-sition between patients with hypo-MDS and AA was sta-tistically significant (P < 0 05). There was no significantdifference in other basic data (P > 0 05). For training set,logistic regression, BP neural network, support vectormachine and decision tree sensitivity, Youden index, positivelikelihood ratio, classification accuracy, positive predictivevalue, and negative predictive value were evaluated. Therewas a statistically significant difference in sensitivity betweenlogistic regression model and decision tree model andbetween decision tree model and support vector machine(P < 0 05). The specificity, accuracy, and area under ROCcurve between decision tree model and logistic regressionmodel, decision tree model and BP neural network, and
0
20
40
60
80
100
0 20 40 60 80 100100 − specificity
Sens
itivi
ty
LogisticDecision tree
BP neural networkSVM
Figure 6: The ROC curve of four prediction models.
0
20
40
60
80
100
0 20 40 60 80 100100 − specificity
Sens
itivi
ty
LogisticDecision tree
BP neural networkSVM
Figure 7: The ROC curve of four prediction models.
10 Complexity

decision tree model and support vector machine were statis-tically significant (P < 0 05). For the test set, logistic regres-sion, BP neural network, support vector machine anddecision tree sensitivity, Youden index, positive likelihoodratio, classification accuracy, positive predictive value, nega-tive predictive value, the sensitivity, specificity, accuracy,and area under the ROC curve of the four models were notstatistically significant (P > 0 05).
The classification effects of logistic regression, decisiontree, BP neural network, and support vector machine arecompared. The decision tree algorithm has the best classifica-tion effect on hypo-MDS and AA, which can help the clini-cians to identify and diagnose the two diseases.
Data Availability
From January 1st, 2008, to December 31st, 2016, thepatients diagnosed with hypo-MDS and AA were diagnosedat the First Affiliated Hospital of Chinese Academy of Med-ical Sciences and the Affiliated Hospital of North ChinaUniversity of Science and Technology. All the cases werecompletely recorded.
Conflicts of Interest
All the authors do not have any possible conflicts of interest.
Acknowledgments
This study was funded by Hebei Provincial Natural ScienceFoundation (H2017209172) (to Jianhui Wu).
References
[1] J. R. Krause,WHO Classification of Tumours of Haematopoie-tic and Lymphoid Tissues, IARC Press, Lyon, 2008.
[2] J. W. Vardiman, J. Thiele, D. A. Arber et al., “The 2008revision of the World Health Organization (WHO) classifi-cation of myeloid neoplasms and acute leukemia: rationaleand important changes,” Blood, vol. 114, no. 5, pp. 937–951, 2009.
[3] J. Shi and Y. Z. Zheng, “Thoughts on differential diagnosisbetween aplastic anemia and hypoplastic myelodysplasticsyndrome,” Chinese Journal of Hematology, vol. 34, no. 10,pp. 910–912, 2013.
[4] S. B. Killick, N. Bown, J. Cavenagh et al., “Guidelines for thediagnosis and management of adult aplastic anaemia,” BritishJournal of Haematology, vol. 172, no. 2, pp. 187–207, 2015.
[5] J. Huang, M. F. Deng, Y. L. Chen, Y. Y. Tang, and Z. P.Huang, “Diagnosis and differential diagnosis between hypo-plastic myelodysplastic syndrome (Hypo-MDS) and aplasticanemia (AA),” Chinese Journal of Health Laboratory Tech-nology, vol. 24, no. 16, pp. 2371–2373, 2014.
[6] R. Hast, M. Eriksson, S. Widell, I. Arvidsson, and P. Bemell,“Neutrophil dysplasia is not a specific feature of the abnormalchromosomal clone in myelodysplastic syndromes,” LeukemiaResearch, vol. 23, no. 6, pp. 579–584, 1999.
[7] A. Rashid, M. Khurshid, U. Shaikh, and S. Adil, “Chromo-somal abnormalities in primary myelodysplastic syndrome,”Journal of the College of Physicians and Surgeons Pakistan,vol. 24, no. 9, pp. 632–635, 2014.
[8] L. Wu, W. Shi, X. Li et al., “High expression of the humanequilibrative nucleoside transporter 1 gene predicts a goodresponse to decitabine in patients with myelodysplastic syn-drome,” Journal of Translational Medicine, vol. 14, no. 1,p. 66, 2016.
[9] D. C. de Souza, C. de Souza Fernandez, A. Camargo et al.,“Cytogenetic as an important tool for diagnosis and prog-nosis for patients with hypocellular primary myelodysplasticsyndrome,” BioMed Research International, vol. 2014, no. 1,Article ID 542395, 10 pages, 2014.
[10] J. Huang, M. Ge, S. Lu et al., “Impaired autophagy in adultbone marrow CD34+ cells of patients with aplastic anemia:possible pathogenic significance,” PLoS One, vol. 11, no. 3,article e0149586, 2016.
[11] F. Jiang, Y. Y. Wang, J. N. Cen et al., “Autophagy activity andclinical significance of CD34(+) cells in myelodysplastic syn-dromes,” Chinese Journal of Experimental Hematology,vol. 24, no. 3, pp. 779–783, 2016.
[12] A. A. van de Loosdrecht, C. Alhan, M. C. Bene et al., “Stan-dardization of flow cytometry in myelodysplastic syndromes:report from the first European LeukemiaNet working confer-ence on flow cytometry in myelodysplastic syndromes,” Hae-matologica, vol. 94, no. 8, pp. 1124–1134, 2009.
[13] F. Lu, H. Bi, M. Huang, and S. Duan, “Simulated annealinggenetic algorithm based schedule risk management of IT out-sourcing project,” Mathematical Problems in Engineering,vol. 2017, Article ID 6916575, 17 pages, 2017.
[14] Y. Le Manach, G. Collins, R. Rodseth et al., “Preoperative scoreto predict postoperative mortality (POSPOM),” Anesthesiol-ogy, vol. 124, no. 3, pp. 570–579, 2016.
[15] F. M. Santin, R. V. da Silva, and J. M. V. Grzybowski, “Artifi-cial neural network ensembles and the design of performance-oriented riparian buffer strips for the filtering of nitrogenin agricultural catchments,” Ecological Engineering, vol. 94,pp. 493–502, 2016.
[16] M. Stoia, Z. Kurtanjek, and S. Oancea, “Reliability of adecision-tree model in predicting occupational lead poisoningin a group of highly exposed workers,” American Journal ofIndustrial Medicine, vol. 59, no. 7, pp. 575–582, 2016.
[17] V. Agarwal, S. Thakare, and A. Jaiswal, “Survey on classifica-tion techniques for data mining,” International Journal ofComputer Applications, vol. 132, no. 4, pp. 13–16, 2015.
[18] M. Heydari, M. Teimouri, Z. Heshmati, and S. M. Alavinia,“Comparison of various classification algorithms in thediagnosis of type 2 diabetes in Iran,” International Journalof Diabetes in Developing Countries, vol. 36, no. 2, pp. 167–173, 2016.
[19] Y. W. Lui, Y. Xue, D. Kenul, Y. Ge, R. I. Grossman, andY. Wang, “Classification algorithms using multiple MRIfeatures in mild traumatic brain injury,” Neurology, vol. 83,no. 14, pp. 1235–1240, 2014.
[20] W.-T. Tseng, W.-F. Chiang, S.-Y. Liu, J. Roan, and C.-N. Lin,“The application of data mining techniques to oral cancerprognosis,” Journal of Medical Systems, vol. 39, no. 5, pp. 59–57, 2015.
[21] J. H. Wu, G. L. Wang, X. M. Li, and S. F. Yin, “Comparison ofBP neural network model and logistic regression in the analy-sis of influencing factors of violence in hospitals,” AppliedMechanics and Materials, vol. 50-51, pp. 964–967, 2011.
[22] Z. N. Zhang, Hematological Diagnosis and Efficacy Criteria,Science Press, 2007.
11Complexity

[23] X. Wang, Clinical Comparison of Hypoproliferative Myelodys-plastic Syndrome and Aplastic Anemia, Jilin University, 2007.
[24] J. R. Quinlan, “Induction of decision trees,”Machine Learning,vol. 1, no. 1, pp. 81–106, 1986.
[25] S. R. Safavian and D. Landgrebe, “A survey of decision treeclassifier methodology,” IEEE Transactions on Systems, Man,and Cybernetics, vol. 21, no. 3, pp. 660–674, 1991.
[26] F. Q. Lu, M. Huang, W. K. Ching, and T. K. Siu, “Credit port-folio management using two-level particle swarm optimiza-tion,” Information Sciences, vol. 237, no. 13, pp. 162–175, 2013.
[27] S. Shan, “Decision tree learning,” inMachine Learning Modelsand Algorithms for Big Data Classification, pp. 1–28, Springer,US, 2016.
[28] S. H. Hwang, D. H. Ham, and J. H. Kim, “Forecastingperformance of LS-SVM for nonlinear hydrological timeseries,” KSCE Journal of Civil Engineering, vol. 16, no. 5,pp. 870–882, 2012.
12 Complexity

Hindawiwww.hindawi.com Volume 2018
MathematicsJournal of
Hindawiwww.hindawi.com Volume 2018
Mathematical Problems in Engineering
Applied MathematicsJournal of
Hindawiwww.hindawi.com Volume 2018
Probability and StatisticsHindawiwww.hindawi.com Volume 2018
Journal of
Hindawiwww.hindawi.com Volume 2018
Mathematical PhysicsAdvances in
Complex AnalysisJournal of
Hindawiwww.hindawi.com Volume 2018
OptimizationJournal of
Hindawiwww.hindawi.com Volume 2018
Hindawiwww.hindawi.com Volume 2018
Engineering Mathematics
International Journal of
Hindawiwww.hindawi.com Volume 2018
Operations ResearchAdvances in
Journal of
Hindawiwww.hindawi.com Volume 2018
Function SpacesAbstract and Applied AnalysisHindawiwww.hindawi.com Volume 2018
International Journal of Mathematics and Mathematical Sciences
Hindawiwww.hindawi.com Volume 2018
Hindawi Publishing Corporation http://www.hindawi.com Volume 2013Hindawiwww.hindawi.com
The Scientific World Journal
Volume 2018
Hindawiwww.hindawi.com Volume 2018Volume 2018
Numerical AnalysisNumerical AnalysisNumerical AnalysisNumerical AnalysisNumerical AnalysisNumerical AnalysisNumerical AnalysisNumerical AnalysisNumerical AnalysisNumerical AnalysisNumerical AnalysisNumerical AnalysisAdvances inAdvances in Discrete Dynamics in
Nature and SocietyHindawiwww.hindawi.com Volume 2018
Hindawiwww.hindawi.com
Di�erential EquationsInternational Journal of
Volume 2018
Hindawiwww.hindawi.com Volume 2018
Decision SciencesAdvances in
Hindawiwww.hindawi.com Volume 2018
AnalysisInternational Journal of
Hindawiwww.hindawi.com Volume 2018
Stochastic AnalysisInternational Journal of
Submit your manuscripts atwww.hindawi.com