Embed Size (px)
Citation preview

Differential Analysis in Screening Assays for Extractable and Leachable CompoundsUsing an Agilent 7200 GC/Q-TOF System Combined with Data Mining Software
Application Note
AuthorsSyed Salman Lateef, Upendra Simha, and Andreas Tei Agilent Technologies, Inc.
Pharmaceutical
AbstractThe analysis of extractable and leachable (E&L) compounds presents challenges for data interpretation and compound identification. The interpretation of data for controls and samples is traditionally performed manually, and can be very time-consuming. Software-based data interpretation greatly alleviates this challenge. Mass Profiler Professional (MPP), a chemometric software application, performs differential analysis, and provides a means to readily visualize the distribution of compounds across samples.
The identification of compounds encountered during E&L analysis using GC/MS with electron ionization (EI) requires a degree of specialized knowledge. The use of EI often results in a mass spectrum that does not contain a distinct molecular ion, and identification is dependent on matching characteristic fragmentation patterns. In E&L studies, fragmentation matching scores can be relatively poor, where compounds are present in minor concentrations or interfered by strong chemical background noise. Therefore, not all compounds may be identified unequivocally based on their fragmentation pattern alone. In this study, an Ophthalmic Drug Product (ODP) and its container closure system were analyzed using an accurate mass high resolution Agilent 7200 GC/Q-TOF system in both EI and chemical ionization (CI) modes.
MPP software was used to elucidate compound distribution, and aid in data interpretation. CI helped in the identification of compounds based on the accurate mass of the molecular peak (or its ion adducts). Also, with the help of databases, CI was used to confirm the identification of compounds detected by EI, and allowed detection of additional compounds.
2
new compounds that are more amenable to soft ionization (such as CI) were also detected with the help of custom databases. Here, custom databases were used to mine CI data to increase the coverage of E&Ls.
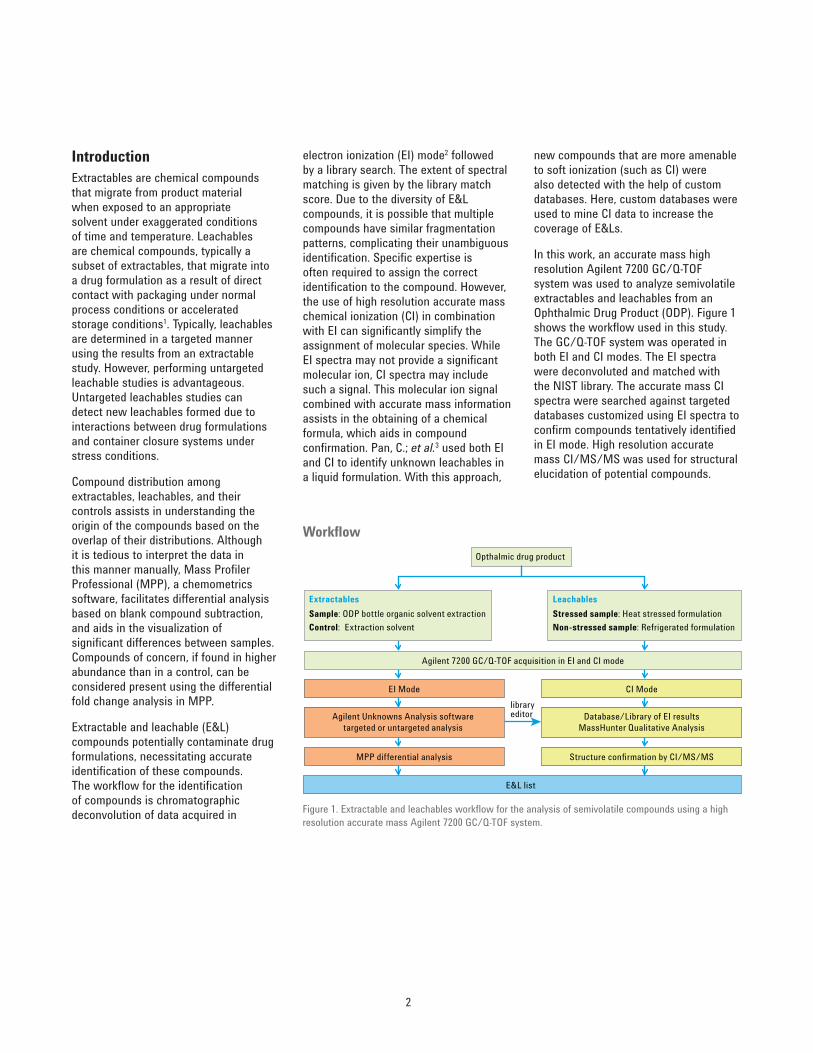
In this work, an accurate mass high resolution Agilent 7200 GC/Q-TOF system was used to analyze semivolatile extractables and leachables from an Ophthalmic Drug Product (ODP). Figure 1 shows the workflow used in this study. The GC/Q-TOF system was operated in both EI and CI modes. The EI spectra were deconvoluted and matched with the NIST library. The accurate mass CI spectra were searched against targeted databases customized using EI spectra to confirm compounds tentatively identified in EI mode. High resolution accurate mass CI/MS/MS was used for structural elucidation of potential compounds.
electron ionization (EI) mode2 followed by a library search. The extent of spectral matching is given by the library match score. Due to the diversity of E&L compounds, it is possible that multiple compounds have similar fragmentation patterns, complicating their unambiguous identification. Specific expertise is often required to assign the correct identification to the compound. However, the use of high resolution accurate mass chemical ionization (CI) in combination with EI can significantly simplify the assignment of molecular species. While EI spectra may not provide a significant molecular ion, CI spectra may include such a signal. This molecular ion signal combined with accurate mass information assists in the obtaining of a chemical formula, which aids in compound confirmation. Pan, C.; et al.3 used both EI and CI to identify unknown leachables in a liquid formulation. With this approach,
IntroductionExtractables are chemical compounds that migrate from product material when exposed to an appropriate solvent under exaggerated conditions of time and temperature. Leachables are chemical compounds, typically a subset of extractables, that migrate into a drug formulation as a result of direct contact with packaging under normal process conditions or accelerated storage conditions1. Typically, leachables are determined in a targeted manner using the results from an extractable study. However, performing untargeted leachable studies is advantageous. Untargeted leachables studies can detect new leachables formed due to interactions between drug formulations and container closure systems under stress conditions.
Compound distribution among extractables, leachables, and their controls assists in understanding the origin of the compounds based on the overlap of their distributions. Although it is tedious to interpret the data in this manner manually, Mass Profiler Professional (MPP), a chemometrics software, facilitates differential analysis based on blank compound subtraction, and aids in the visualization of significant differences between samples. Compounds of concern, if found in higher abundance than in a control, can be considered present using the differential fold change analysis in MPP.
Extractable and leachable (E&L) compounds potentially contaminate drug formulations, necessitating accurate identification of these compounds. The workflow for the identification of compounds is chromatographic deconvolution of data acquired in
Workflow
Figure 1. Extractable and leachables workflow for the analysis of semivolatile compounds using a high resolution accurate mass Agilent 7200 GC/Q-TOF system.
Opthalmic drug product
Extractables LeachablesStressed sample: Heat stressed formulationNon-stressed sample: Refrigerated formulation
Sample: ODP bottle organic solvent extraction Control: Extraction solvent
Agilent 7200 GC/Q-TOF acquisition in EI and CI mode
Agilent Unknowns Analysis software targeted or untargeted analysis
CI Mode
MPP differential analysis
EI Mode
E&L list
Database/Library of EI resultsMassHunter Qualitative Analysis
library editor
Structure confirmation by CI/MS/MS

3
Semiquantitative estimationTriphenyl phosphate relative response was used to estimate the amount of leachables using the procedure described by Jenke; et al.5.
E&L PCD (Personal Compound Database)A custom database of literature reported extractables and leachables was created. The database entries consisted of chemical formula, accurate mass, and CAS ID.
CI data analysisThe CI data were processed in Agilent MassHunter Qualitative Analysis software using the Find by Formula algorithm with possible adducts [M+H]+, [M+C2H5]+, and [M+C3H5]+. The EI .xml library used as the formula database. The CI data were also searched for other extractables using the E&L PCD.
Structure elucidation using CI/MS/MSThe CI/MS/MS data files were processed using the Find by Targeted MS/MS feature within MassHunter Qualitative Analysis software. The fragment structures were drawn using ACD software (ACD Labs, Toronto).
Data acquisition and processingAll samples were spiked with triphenyl phosphate as internal standard at a 1 ppm concentration for both EI and CI analysis. The following Agilent software was used for data acquisition and processing:
• Agilent MassHunter Acquisition Software (B.07.02)
• Agilent MassHunter Qualitative Analysis Software including PCDL Manager Standalone tools (B.07.00)
• Agilent MassHunter Quantitative Analysis Software including Library Editor and Unknown Analysis standalone tools (B.07.01)
• Agilent Mass Profiler Professional Software (Ver. 13.1)
EI data analysisThe data files were processed using Agilent MassHunter Unknowns Analysis software to deconvolute spectra, and matched against the NIST14 library. A match score of > 80 was used to select compounds.
Creating an accurate mass EI libraryThe EI search hits with match scores > 80 were sorted and exported to Library Editor Software. The library (in .xml format) contained compound information such as name, formula, retention time (RT), and spectra.
MPP analysisThe EI data were reprocessed by an Unknowns Analysis tool to deconvolute and match spectra and retention time using the the accurate mass EI .xml library. This step helped to filter the results to be exported into MPP software. The compound’s intensity within each sample was normalized to the intensity of the internal standard (triphenyl phosphate). The compounds found in the blank (n-hexane) were subtracted from all samples based on 2x intensity fold change.
ExperimentalMaterialsHPLC grade n-hexane, 99 %, was purchased from RCI Labscan (Thailand).
Sample preparation for the leachables studyThe ophthalmic drug product (5 mL) was purchased from a local drug store. The formulation, along with its container closure system, was used in the leachables study. The sample preparation was adapted from Jenke; et al.4. The leachable-stressed sample was prepared by heating 5 mL of formulation in its container closure system for 24 hours at 60 °C. The leachable nonstressed samples were the drug formulation stored at manufacturer-recommended conditions. Both stressed and nonstressed formulations were extracted in n-hexane using liquid-liquid extraction with 3x volume of n-hexane, repeating the extraction twice. The n-hexane solvent was dried and reconstituted to 5 mL using n-hexane. All glassware used in this experiment was cleaned by soaking in hexane overnight.
Sample preparation for the extractables studyAn empty ODP bottle (same formulation as in the leachables study) was used in the extractables study. The extractables study was performed by adding 5 mL of n-hexane to a rinsed container closure system, and sonicating for 1.5 hours. The solvent was taken for analysis after sonication. The extraction solvent, n-hexane, was used as the control/blank.

4
Instrument parametersTable 1 shows the instrument parameters used in this analysis.
Instrument
Parameter Value
Agilent 7890A GCInjection port Multimode Inlet (MMI)Mode SplitlessSeptum purge flow 3 mL/minInlet program 70 °C (0.2 minutes) to 325 °C (7 minutes) at 600 °C/minLiner Ultra Inert Splitless, single taper, glass wool (p/n 5190-3163)Carrier gas HeliumFlow 1.3 mL/min (constant)Purge flow to split vent 60 mL/min at 2.73 minutesGas saver 20 mL/min at 3 minutes
Oven program 50 °C (3 minutes) to 320 °C (7 minutes) at 6 °C/minEquilibration time: 1 minuteRun time: 55 minutes
Columns Agilent DB-5ms, 30 m × 250 µm, 0.25 µm (p/n 122-5532)
Injection volume 2 µL
Instrument Agilent 7200 GC/Q-TOFTune AutotuneTransfer line 280 °CMS source (EI and CI) 300 °CMS Quad 175 °CMass range 55 to 700 amu Acquisition rate 5.00 spectra/secElection ionization
GC
MS
EI emission current 35 µAEI electron energy 70 eVChemical ionizationCI emission current 240 µACI gas flow 20 % EPCCI electron energy 115 eVMode PositiveCI reagent gas MethaneCollision cell EPC Nitrogen, 1.5 mL/min
Table 1. Agilent 7200 GC/Q-TOF instrument parameters used in this experiment.
5
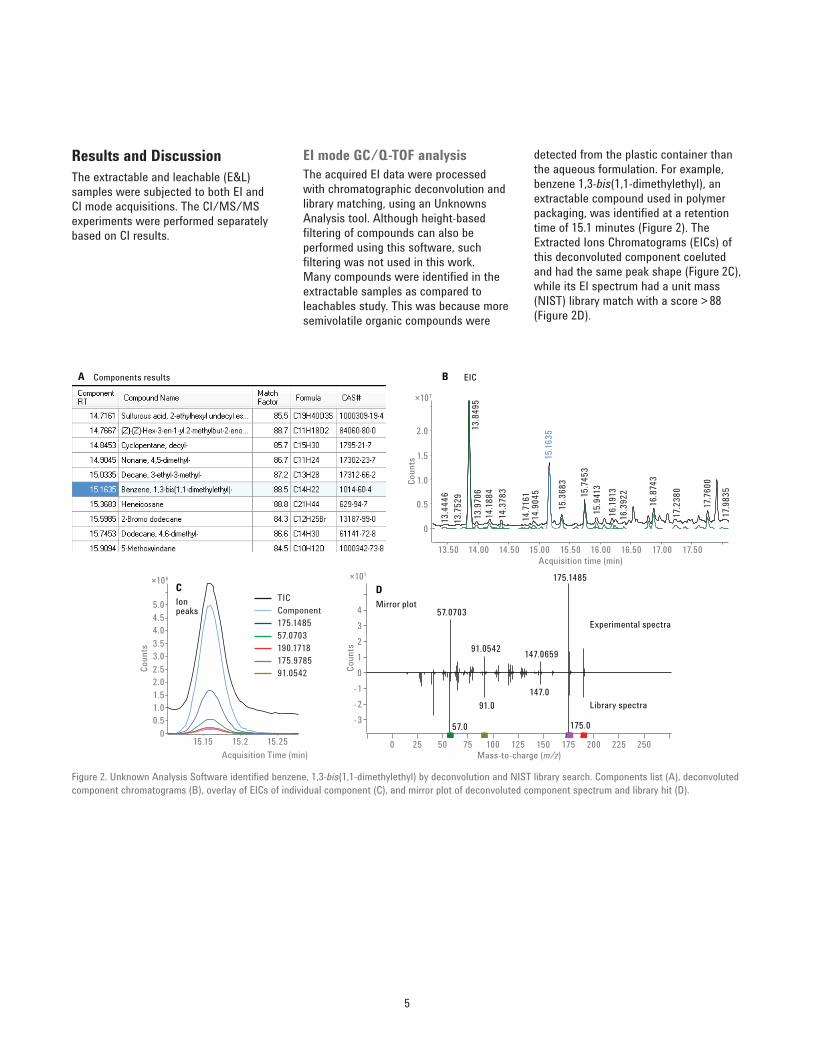
detected from the plastic container than the aqueous formulation. For example, benzene 1,3-bis(1,1-dimethylethyl), an extractable compound used in polymer packaging, was identified at a retention time of 15.1 minutes (Figure 2). The Extracted Ions Chromatograms (EICs) of this deconvoluted component coeluted and had the same peak shape (Figure 2C), while its EI spectrum had a unit mass (NIST) library match with a score > 88 (Figure 2D).
EI mode GC/Q-TOF analysisThe acquired EI data were processed with chromatographic deconvolution and library matching, using an Unknowns Analysis tool. Although height-based filtering of compounds can also be performed using this software, such filtering was not used in this work. Many compounds were identified in the extractable samples as compared to leachables study. This was because more semivolatile organic compounds were
Results and DiscussionThe extractable and leachable (E&L) samples were subjected to both EI and CI mode acquisitions. The CI/MS/MS experiments were performed separately based on CI results.
Acquisition time (min)13.50 14.00 14.50 15.00 15.50 16.00 16.50 17.00 17.50
×107
0
0.5
1.0
1.5
2.0
Components results
Coun
ts
EICA B
×101
Mass-to-charge (m/z)0 25 50 75 100 125 150 175 200 225 250
-3-2-101234
175.0
175.1485
57.0
57.0703
91.0
91.0542
147.0
147.0659
Experimental spectra
Library spectra
Coun
ts
Mirror plotD
×106
Ion peaks
Acquisition Time (min)15.15 15.2 15.25
00.51.01.52.02.53.03.54.04.55.0
TICComponent175.148557.0703190.1718175.978591.0542Co
unts
C
13.4
446
13.8
495
13.9
706
14.18
8414
.378
3
14.7
161
14.9
045
15.16
3515
.368
3
15.74
5315
.941
316
.1913
16.3
922
16.8
743
17.2
380
17.7
600
17.9
835
13.7
529
Figure 2. Unknown Analysis Software identified benzene, 1,3-bis(1,1-dimethylethyl) by deconvolution and NIST library search. Components list (A), deconvoluted component chromatograms (B), overlay of EICs of individual component (C), and mirror plot of deconvoluted component spectrum and library hit (D).

6
compounds remained in the sample after heat stress treatment. The four compounds found uniquely in the nonstressed sample appear to degrade under heat stress conditions based on these comparisons.
To understand if any of those 15 common compounds came from an extractable, an overlap display was produced (Figure 3C). The results show that six of the 15 compounds present in the nonstressed leachable sample originated from the container. One of these, benzene, 1,3-bis(1,1-dimethylethyl), leached even under nonstressed conditions. (E)-3-Eicosene is a nonpolar alkane found in the formulation and unaffected by heat stress, but does not originate as an extractable. The use of Venn diagrams to visualize the results helps to understand the E&L results, and determine their possible origin.
as a subtraction technique. In fold change analysis, compounds that are found with greater than a 2-fold increase in intensity when compared to the blank were considered differential and retained.
MPP data interpretation and the associated Venn diagrams allow users to visualize compound distribution across several samples. Figure 3 shows the Venn diagram of the leachable-stressed sample compared to the extractable (3A), and to leachable nonstressed (3B). Comparison of leachable stressed and extractable samples identified eight common compounds.
Analysis of the data reveals the leachable-stressed sample and nonstressed sample (Figure 3B) contained 15 compounds in common, and 16 compounds found uniquely in the stressed sample. The common
Data interpretation and differential analysisCompounds with a library match score > 80 were exported to MPP software as a CEF file for further processing. These steps included normalization, fold change based blank subtraction, and visualization. The normalization step normalizes the intensity of all compounds with respect to the intensity of the spiked internal standard within each sample. This normalization helps to account for differences in the intensity of individual compounds across samples. Post normalization, the data were processed by subtraction compounds found in the n-hexane blank sample. Since it is possible to find additives and extractables in blank solvent, a mere blank subtraction may inadvertently remove compounds from the sample. Therefore, it is important to apply fold change analysis
14 1152
1
6
9 3
Common compounds between leachable stressed and extractable samplesOctane, 3,5-dimethyl Octane, 3,5-dimethyl
Octane, 3,5-dimethyl
Benzene, 1,3-bis(1,1-dimethylethyl)-Benzene, 1,3-bis(1,1-dimethylethyl)-
Benzene, 1,3-bis(1,1-dimethylethyl)-
Dodecane, 4,6-dimethyl
Dodecane, 4,6-dimethyl
Dodecane, 4,6-dimethyl
TridecaneNonadecaneCyclohexasiloxane, dodecamethyl
Cyclohexasiloxane, dodecamethyl
Sulfurous acid, pentyl undecyl ester
Sulfurous acid, pentyl undecyl esterSulfurous acid, pentyl undecyl ester
Cycloheptasiloxane, tetradecamethyl-
Cycloheptasiloxane, tetradecamethyl- Cycloheptasiloxane, tetradecamethyl-
Selected common compounds between leachable stressed and nonstressed samples
Dodecane
3-Eicosene, (E)Tetradecane dodecamethylCyclohexasiloxaneHeptadecane, 2,6,10,15-tetramethylDodecane, 2,6,10-trimethyl
Common compounds between leachable stressed, extractable and leachable nonstressed samples
Leachablestressed
Leachablestressed Extractable
Leachablestressed Extractable
Leachable nonstressed
Leachable nonstressed
A B C
23 8 118 16 15 4
Figure 3. MPP Venn diagram showing the overlap of compounds found between leachable-stressed and extractable (A), leachable-stressed and nonstressed (B), and among all three: leachable-stressed, extractable, and nonstressed (C) samples. The table below each overlap results shows the selected list of compounds that were common among the samples compared.

7
Semiquantitative estimation of leachables from the ophthalmic formulationA semiquantitative estimation of leachable compounds was determined using triphenyl phosphate as the internal standard, as described earlier by Jenke; et al.5. The Analytical Evaluation Threshold (AET) is a threshold above which the chemist would report the need for a toxicological assessment. According to the latest PQRI working group report6, AETs for ODPs continue to be reported based on concentrations (ppm). Leachables found in excess of 1 ppm are reported; above 10 ppm are identified, while above 20 ppm are used for risk assessment. The semiquantitative results of leachable-stressed samples are shown in Table 2. Four compounds were found to exceed the 20 ppm mark, and would require a safety assessment test.
Confirmation and additional coverage of extractables and leachables by CI sourceCompounds with similar fragmentation patterns often share the same library hit with little difference in library match score. Usually, the best practice is to select the compound that produces the maximum library match score. Here, CI was performed alternatively to confirm some, if not all, of the compounds identified by EI. The CI data were searched against a custom database created from the EI mode results. Table 3 shows the list of EI compounds found in extractables also confirmed in CI mode. For example, benzene, 1,3-bis(1,1-dimethylethyl) (C14H22), which was common between leachable-stressed, nonstressed, and extractable, had a library match score of 88. Other compounds, Benzo[c]furanone, 3,3,4,7-tetramethyl (C12H14O2), and 2,3,4,5,6-pentamethyl acetophenone (C13H18O) matched with the experimental spectra with similar score values of 78 and 77, respectively. The CI results confirmed the presence of benzene,1,3-bis(1,1-dimethylethyl) with mass accuracy of 2 ppm, confirming the EI results.
Table 2. The semiquantitation estimation of compounds common between leachable stressed and extractable samples.*
*quantification values can vary up to 4-fold5
Leachable stressed sample Semiquantitation estimation (ppm)*Octane, 3,5-dimethyl 3Benzene, 1,3-bis(1,1-dimethylethyl)- 132Dodecane, 4,6-dimethyl 7Tridecane 12Nonadecane 8Cyclohexasiloxane, dodecamethyl- 80Sulfurous acid, pentyl undecyl ester 39Cycloheptasiloxane, tetradecamethyl- 22
CompoundExtractables
Mass Formula Mass error (ppm)
Naphthalene 128.0626 C10H8 1.810,18-Bisnorabieta-8,11,13-triene 242.2026 C18H26 1.2Benzene, (1-butylheptyl)- 232.2190 C17H28 2.8Benzene, (1-butylhexyl)- 218.2030 C16H26 1.8Benzene, (1-butyloctyl)- 246.2350 C18H30 4.8Benzene, 1,3-bis(1,1-dimethylethyl)- 190.1720 C14H22 2.0Benzene, 1,3-dichloro- 145.9690 C6H4Cl2 0.4Biphenyl 154.0780 Cl2H10 0.4Cyclopentane, decyl- 210.2350 C15H30 1.1
Cyclotrisiloxane, hexamethyl- 222.0560 C6H18O3Si3 0.7
Methyl salicylate 152.0470 C8H8O3 1.9Naphthalene, 1,2,3,4-tetrahydro-1-phenyl 208.1250 C16H16 1.1Naphthalene, 2-methyl- 142.0780 C11H10 0.1Stigmasta-3,5-diene 396.3760 C29H48 0.1
Leachables
3-Carene 136.1250 C10H16 4.2
3-Hexanone 100.0890 C6Hl2O 2.1
Benzoic acid, 2-benzoyl-, methylester (o-methylbenzyl benzoate)
240.0790 C15Hl2O3 0.7
9H-Thioxanthen-9-one, 2-(1-methylethyl) 254.0770 C16H14OS 0.8
Table 3. CI mode results showing the list of extractables and leachables confirming the EI mode compounds.
8
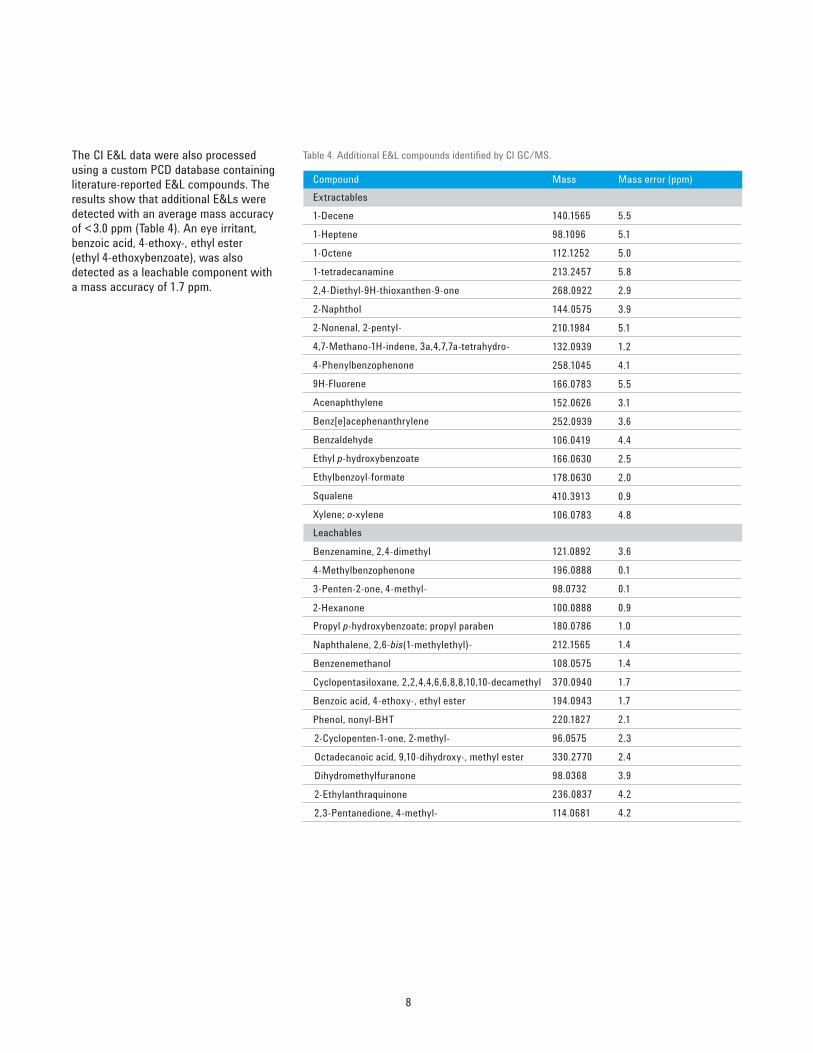
The CI E&L data were also processed using a custom PCD database containing literature-reported E&L compounds. The results show that additional E&Ls were detected with an average mass accuracy of < 3.0 ppm (Table 4). An eye irritant, benzoic acid, 4-ethoxy-, ethyl ester (ethyl 4-ethoxybenzoate), was also detected as a leachable component with a mass accuracy of 1.7 ppm.
CompoundExtractables
Mass Mass error (ppm)
Leachables
1-Decene 140.1565 5.5
Benzenamine, 2,4-dimethyl 121.0892 3.6
1-Heptene 98.1096 5.1
4-Methylbenzophenone 196.0888 0.1
1-Octene 112.1252 5.0
3-Penten-2-one, 4-methyl- 98.0732 0.1
1-tetradecanamine
2,4-Diethyl-9H-thioxanthen-9-one213.2457 5.8
268.0922 2.9
Propyl p-hydroxybenzoate; propyl paraben 180.0786 1.0
2-Naphthol 144.0575 3.9
Naphthalene, 2,6-bis(1-methylethyl)- 212.1565 1.4
2-Nonenal, 2-pentyl- 210.1984 5.1
Benzenemethanol 108.0575 1.4
4,7-Methano-1H-indene, 3a,4,7,7a-tetrahydro- 132.0939 1.2
2-Hexanone 100.0888 0.9
4-Phenylbenzophenone 258.1045 4.1
Cyclopentasiloxane, 2,2,4,4,6,6,8,8,10,10-decamethyl 370.0940 1.7
9H-Fluorene 166.0783 5.5
Benzoic acid, 4-ethoxy-, ethyl ester 194.0943 1.7
Acenaphthylene 152.0626 3.1
Phenol, nonyl-BHT 220.1827 2.1
Benz[e]acephenanthrylene 252.0939 3.6Benzaldehyde 106.0419 4.4
2-Cyclopenten-1-one, 2-methyl- 96.0575 2.3
Ethyl p-hydroxybenzoate 166.0630 2.5
Octadecanoic acid, 9,10-dihydroxy-, methyl ester 330.2770 2.4
Ethylbenzoyl-formate 178.0630 2.0
Dihydromethylfuranone 98.0368 3.9
Squalene 410.3913 0.9
2-Ethylanthraquinone 236.0837 4.2
Xylene; o-xylene 106.0783 4.8
2,3-Pentanedione, 4-methyl- 114.0681 4.2
Table 4. Additional E&L compounds identified by CI GC/MS.

9
EI spectra of decylcylcopentane did not yield the molecular peak at 210 (Figure 5A). Upon using CI and CI/MS/MS, the identity of decylcyclopentane was confirmed (Figure 5B and 5C). The CI/MS/MS spectra can also be stored in custom libraries for automated identification of additional samples.
the CI mode analysis was analyzed by CI/MS/MS. The accurate mass data helped to assign the empirical formulae of the molecular ion and all of the related fragment ions. Figure 4 shows the CI/MS/MS analysis of ethyl 4-thoxybenzoate, with assigned structures to the fragment ions at m/z 195.1016. In another example,
Structure confirmation by CI/MS/MSAccurate mass CI/MS/MS was used to confirm and elucidate the structures for tentatively identified, and unknown compounds. As an example, to confirm identification, the eye irritant, benzoic acid, 4-ethoxy-ethyl ester (ethyl 4-ethoxybenzoate) detected by
Figure 4. Structure confirmation of ethyl 4-ethoxybenzoate.
Ethyl 4-ethoxybenzoate
C9H11O3+m/z 167.0703
OH
OOH+
H3C
C9H9O2+m/z 149.0597
C+OO
H3C
m/z 195.1016 C11H15O3+
OO
OH+
CH3
H3C
0
0.5
1.0
1.5
2.0
120 140 160 180 200 220 240
CI MS×104
Coun
ts
Mass-to-charge (m/z)
195.1013([C11H14O3]+H)+
223.1362([C11H14O3]+C2H5)+
00.10.20.30.40.50.60.70.80.91.01.11.21.31.41.5
30 40 50 60 70 80 90 100 110 120 130 140 150 160 170 180 190
CI MS/MS×103
Coun
ts
Mass-to-charge (m/z)
37.0
295
77.0
391
105.
0728
139.
0368
163.
1109
195.1
005
198.
9037
95.0490[C6H7O]+
123.0790[C8H11O]+
149.0594[C9H9O2]+
167.0695[C9H11O3]+
Figure 5. Structure confirmation of decylcyclopentane. EI spectra of decylcyclopentane (A), CI MS spectra (B), CI MS/MS spectra (C), and proposed fragmentation pathway (D).
0
1
2
3
4
5
6
7
8
170 190 210 230 250 270 290
0
1
2
3
4
5
6
7
40 60 80 100 120 140 160 180 200
CI MS
A B
CDFragmentation sites
CI MS/MS
Decylcyclopentane
Component RT: 16.5707
20 40 60 80 100 120 140 160 180 200 220
00.10.20.30.40.50.60.70.80.9
69.0703
83.0858
211.2413([C15H30]+H)+
57.0686
62.2
603
113.1317 133.5895 167.0554 192.3031202.6950 211.2421
C4H971.0848C5H11
85.1009C6H13
([C15H30]+C2H5)+
([C15H30]+C3H5)+
239.2733
251.2767
55.055297.1015
EI spectra
×102 ×102
×101
Coun
ts
Coun
tsCo
unts
Mass-to-charge (m/z) Mass-to-charge (m/z)
Mass-to-charge (m/z)
m/z 211.2413
m/z 85.1009
C15H31+
C6H13+
m/z 71.0848C5H11
+

10
References1. Recommendations for Extractables
and Leachables Testing Part 1: Introduction, Regulatory Issues, and Risk Assessment. BioProcess International, Dec 2007.
2. Wong, D. M., Firor, R. L. Analysis of Extractable/Leachable Compounds from Generic Liquid Drug Formulations Using GC/MSD System, Agilent Technologies Application Note, publication number 5991-5632EN 2015.
3. Pan, C.; et al. Strategy for Identification of Leachables in Packaged Pharmaceutical Liquid Formulations. J. Pharm. Biomed. Analysis 2008, 46, 520–527.
4. Jenke, D.; et al. Extractables Characterization for Five Materials of Construction Representative of Packaging Systems Used for Parenteral and Ophthalmic Drug Products. PDA J. Pharm. Sci. Technol. 2013, 67, 448-511.
5. Jenke, D.; et al. Utilization of Internal Standard Response Factors to Estimate the Concentration of Organic Compounds Leached from Pharmaceutical Packaging Systems and Application of Such Estimated Concentrations to Safety Assessment. J. Chromat. Sci. 2012, 50, 206-212.
6. Houston, C. T. The PQRI PODP Approach: Understanding Threshold Concepts and Their Application To Different Routes of Administration.Talk present at E&L Europe 2015, November 2015.
ConclusionsAn Agilent 7200 GC/Q-TOF was used to perform high resolution accurate mass qualitative screening and identification of E&L compounds from ODPs. The EI data from the analysis of E&L compounds were matched with the NIST 14.0 library to help compound identification. Data processing and interpretation was facilitated using Agilent Mass Profiler Professional software, which enables differential analysis of sample sets. Venn diagrams were used to help determine unique and common compounds across sample groups. Semi-quantitative analysis showed that the concentration for four compounds were of concern. Further quantification and safety assessment tests are required for these compounds. The custom databases that combine experimental as well as literature data were created and used to interrogate the CI data. The accurate mass CI data helped to confirm tentative hits, and expand the list of identified compounds. The versatility of database and library creation and the use of CI and CI/MS/MS GC/Q-TOF with accurate mass data increased the number of detected and identified compounds.

11

www.agilent.com/chem
This information is subject to change without notice.
© Agilent Technologies, Inc., 2016, 2018 Published in the USA, January 29, 2018 5991-6688EN