Embed Size (px)
Citation preview

A R T I C L E
Differences in regional oceanography and preybiomass influence the presence of foragingodontocetes at two Atlantic seamounts
Miriam Romagosa1 | Carlos Lucas2 | Sergi Pérez-Jorge1 |
Marta Tobeña1 | Patrick Lehodey3 | Jesus Reis2 | Irma Cascão1 |
Marc O. Lammers4,5 | Rui M. A. Caldeira2 | Mónica A. Silva1,6
1Okeanos R & D Centre and Institute of Marine Research (IMAR), University of the Azores, and Marine and Environmental Sciences
Centre (MARE), Horta, Portugal
2Oceanic Observatory of Madeira, Agência Regional para o Desenvolvimento da Investigação Tecnologia e Inovação, Funchal,
Madeira, Portugal
3MEMMS (Marine Ecosystems Modeling and Monitoring by Satellites), CLS, Space Oceanography Division, Ramonville, France
4NOAA's Hawaiian Island Humpback Whale National Marine Sanctuary, Kihei, Hawaii
5Oceanwide Science Institute, Honolulu, Hawaii
6Biology Department, Woods Hole Oceanographic Institution, Woods Hole, Massachusetts
Correspondence
Miriam Romagosa, Okeanos R & D Centre and
Institute of Marine Research (IMAR)
Department of Oceanography and Fisheries,
University of the Azores, Rua Professor
Dr. Frederico Machado 4, 9901-862 Horta,
Portugal.
Email: [email protected]
Funding information
Fundo Regional para a Ciência e Tecnologia
(FRCT), Grant/Award Number: doctoral grant
(M3.1.a/F/028/2015); EEA Grants, Grant/
Award Number: BIOMETORE
(PT02_Aviso2_0001); Fundação para a Ciência
e a Tecnologia, Grant/Award Number: FCT-
Investigator contract (IF/00943/2013);
European Social Fund; Fundo Europeu de
Desenvolvimento Regional (FEDER)
Abstract
The importance of seamounts as foraging hotspots for
cetaceans depends on interactions between ocean flow
and topographical features that concentrate prey. However,
the oceanographic processes driving these aggregations are
still unclear. Here, we analyzed two months of passive acous-
tic recordings from two remote seamounts in the Northeast
Atlantic, Atlantis and Irving, in relation to regional oceanogra-
phy and estimates of prey biomass. Delphinids and sperm
whales were detected in both seamounts with higher forag-
ing activity at night, indicating feeding on diel migrating prey.
There were more detections of delphinids and sperm whales
at Atlantis than at Irving. These two seamounts lie in different
oceanographic settings created by the Azores Current that
separates colder and less saline water masses in the north
(Atlantis seamount) from warmer and more saline waters in
the south (Irving seamount). Irving seamount is only affected
by transient features like eddies that enhance productivity
Received: 16 October 2018 Revised: 6 May 2019 Accepted: 13 May 2019
DOI: 10.1111/mms.12626
Mar Mam Sci. 2019;1–22. wileyonlinelibrary.com/journal/mms © 2019 Society for Marine Mammalogy 1

for short time periods. These conditions translate into more
productive waters at Atlantis seamount than at Irving, as
shown by predicted prey biomasses that ultimately attract
top predators. Comparative studies such as this one can help
to explain the main drivers of presence of top predators at
seamounts.
K E YWORD S
Azores Current, delphinids, foraging ecology, oceanography,
odontocetes, passive acoustics, prey, seamount, sperm whale
1 | INTRODUCTION
Cetaceans actively seek and associate with areas of high biological productivity (Barlow, Kahru & Mitchell, 2008;
Mannocci et al., 2014). In the open-ocean, where biophysical processes driving biological productivity are highly
dynamic, seamounts may provide spatially and temporally persistent prey aggregations and create predictable forag-
ing opportunities for cetaceans (Baumann-Pickering, Trickey, Wiggins & Oleson, 2016; Morato et al., 2008). Sea-
mount density was found to be a predictor of habitat suitability of short-beaked common (Delphinus delphis) and
spotted (Stenella frontalis) dolphins in the Azores, but not of bottlenose (Tursiops truncatus) and striped
(S. coeruleoalba) dolphins (Tobeña, Prieto, Machete & Silva, 2016). Several studies reported significant associations of
sperm whales (Physeter macrocephalus) to seamounts (Hann, Smith & Torres, 2016; Skov et al., 2008; Tobeña et al.,
2016; Waring, Hamazaki, Sheehan, Wood & Baker, 2001; Wong & Whitehead, 2014) while others have not found
any significant relationship (Morato et al., 2008; Torres, Smith, Sutton, MacDiarmid & Bannister, 2011). Hann et al.
(2016) attributes this discrepancy to differences in the size of the study area, scale, sample size, seamount classifica-
tion, and data resolution.
The importance of seamounts for cetaceans likely depends on local and regional biophysical coupling. The interac-
tion of the abrupt topography with the background ocean circulation may generate a range of physical forcing mecha-
nisms (e.g., currents, internal waves, eddies and fronts) that enhance the horizontal flux and aggregation of food
particles and plankton over seamounts (Clark et al., 2010; Genin & Dower, 2007). Oceanographic processes, such as
the formation of eddies, vortices, and Taylor caps around seamounts, may also advect and entrain allochthonous plank-
ton and micronekton feeding in surface waters at night. These organisms may become trapped over shallow seamount
summits when trying to descend the next dawn (“topographic blockage”) (Genin & Dower, 2007; Pusch, Beckmann,
Porteiro & Westernhagen, 2004). In addition, seamounts may also provide habitat and refuge for benthic and micro-
nekton fish (Genin, 2004). How local and regional oceanographic conditions influence the seamount effect at aggregat-
ing prey and attracting predators, including cetaceans, is unclear (McFarland & Levin, 2002; Morato, Hoyle, Allain, &
Nicol, 2010). Studies on predator distribution and behavior at seamounts subject to different oceanographic conditions
are needed to understand the drivers promoting and sustaining predator aggregations (Kvile, Taranto, Pitcher &
Morato, 2014). The main reason behind the lack of these studies is that seamounts are often in remote locations, which
limit the duration of cetacean and oceanographic surveys. One way of overcoming the lack of pelagic cetacean surveys
is the use of passive acoustic techniques, which allow the long-term monitoring of vocalizing animals, independently of
weather conditions or remoteness (Baumann-Pickering et al., 2016; Giorli et al., 2015; Hastie, Swift, Slesser,
Thompson, & Turrell, 2005; Soldevilla, Wiggins, Hildebrand, Oleson, & Ferguson, 2011; Wong &Whitehead, 2014).
Another important limitation is that data on prey distribution are usually not available at desired spatiotemporal
scales. Regular transects with active acoustic sounders can offer a series of abundance indices of prey organisms,
2 ROMAGOSA ET AL.

especially on the vertical migration of the deep scattering layer. However, there are still key issues in the interpreta-
tion of such data. Without sampling of organisms inhabiting the water column, the result may be misleading due to
differences in target strength of organisms. For instance, gas-bearing siphonophores can produce huge acoustic
backscatter that is not representative of the true prey biomass (e.g., Davison, Koslow & Kloser, 2015; Proud,
Handegard, Kloser, Cox, & Brierley, 2018).
A potential useful alternative is emerging with the rapid progress achieved in operational oceanography, combin-
ing satellite observations and hundreds of thousands in situ data assimilated in numerical models to produce ocean
reanalyses (Le Traon et al., 2015). Thanks to data assimilation, predicted temperature and currents are now suffi-
ciently accurate to analyze fine scale movements of remote tracked animals (e.g., Abecassis et al., 2013; Gaspar
et al., 2006). Relying on these realistic ocean reanalyses and satellite ocean color data for primary production, the
Lower and Mid Trophic Level (LMTL) component of the model SEAPODYM (Spatial Ecosystem and Population
Dynamics Model) offers potential additional explanatory variables (micronekton) to study large ocean predator ecol-
ogy. SEAPODYM-LMTL simulates the biomass of six different functional groups of micronekton in the epipelagic
and mesopelagic layers (Lehodey, Murtugudde & Senina, 2010; Lehodey et al., 2015). It has been successfully used
to predict turtle habitat and movements (Abecassis et al., 2013), population dynamics of different tuna species
(Dragon, Senina, Hintzen & Lehodey, 2017; Lehodey, Senina & Murtugudde, 2008; Senina, Sibert & Lehodey, 2008;
Sibert, Senina, Lehodey, & Hampton, 2012) and cetacean habitats (Lambert, Mannocci, Lehodey, & Ridoux, 2014;
Roberts et al., 2016) at large regional and basin scales.
In this study, we use passive acoustic records collected at two seamounts in the North Atlantic to investigate
how local and regional oceanography influence the distribution and the usage of these seamounts by dolphins and
sperm whales. In addition to physical oceanographic variables, we use a high-resolution simulation at 0.08� produced
with SEAPODYM-LMTL to explore possible explanations of the variability observed based on foraging behavior.
2 | METHODS
2.1 | Study area
The Meteor seamount complex is located in the Northeast Atlantic Ocean, ~600 km south of the Azores archipelago
and 1,500 km off Northwest Africa. It is a group of seven large banks and a few seamounts extending 550 km from
the northernmost to the southernmost seamount. The complex lies between two surface currents: the southern
branch of the Azores Current that flows southeastwards and the cold Canary Current flowing offshore from the
African coast. Exact directions and intensities of these currents vary seasonally (Johnson & Stevens, 2000; Klein &
Siedler, 1989; Kraus, Kaese, & Hinrichsen, 1990). The Azores Current Front System also has deep-sea currents
moving opposite to the surface currents with a complex and dynamic mesoscale circulation, that is, eddies (Alves &
de Verdière, 1999; Richardson, 1996). In addition, the Meteor complex is also affected by westward propagating sur-
face intensified eddies (Barbosa-Aguiar, Peliz, Cordeiro Pires, & Le Cann, 2011).
In this study, two seamounts from the Meteor complex were investigated: Atlantis, which is the northernmost
seamount, and Irving located 316 km southeast of Atlantis (Figure 1). The Atlantis seamount is approximately
410 km2, with summit depths ranging from 250 m to 400 m (Bednarz, 1991). Its topography is complex with numer-
ous underwater plateaus and pinnacles (Pusch et al., 2004). Irving seamount rises from a broad plateau and has a flat
summit of ~8 km radius at 270–290 m depth (Smith & Sandwell, 1997).
2.2 | Acoustic recordings and analysis
Two broad-band static hydrophones, specifically Ecological Acoustic Recorders (EAR) (Lammers, Brainard, Au,
Mooney & Wong, 2008), were moored at the Atlantis and Irving seamounts for approximately 2 months between
July and September 2015 at 294 m and 264 m depth, respectively (Table 1). The EARs consist of a sensor
ROMAGOSA ET AL. 3

Technology SQ26-01 hydrophone with a response sensitivity of −194.17 dB re 1 V/μPa for Atlantis and −193.14 dB
re 1 V/μPa for Irving and a flat frequency response (±1.5 dB) from 18 Hz to 28 kHz. A Burr-Brown ADS8344 A/D con-
verter was used with a zero-to-peak voltage of 1.25 V. EARs were set up at a sampling rate of 50 kHz in order to reach
the maximum frequency band capacity of the system (1–25 kHz) and a duty cycle of 20% (3 min on, 15 min off) so bat-
teries could last for the whole deployment period (Table 1).
Files generated by the EARs were analyzed by manually scanning spectrograms using Adobe Audition 3.0 (Adobe
Systems Inc., San Jose, CA). For every 3-min file, detections were entered in a database by logging the start and end
time of each one and the type of sound. Although beaked whales were sighted over these seamounts during a visual
survey in September of 2015 and have been detected in other seamounts further north (Giorli et al., 2015), the sam-
ple rate used in this study (50 kHz) with maximum frequencies of 25 kHz, did not allow us to detect either Cuvier's
beaked whales (Ziphius cavirostris), with clicks centred at 42 kHz (Zimmer, Johnson, Madsen, & Tyack, 2005), or
Blainvillle's beaked whales (Mesoplodon densirostris), with clicks ranging from 26 to 51 kHz (Johnson, Madsen,
Zimmer, Soto, & Tyack, 2006). Sperm whale clicks and delphinid sounds could be successfully detected, and were
classified based on descriptions from the literature. Sperm whales produce regularly spaced echolocation clicks
below 20 kHz with an interclick interval varying from 0.5 to 1 s, as well as creaks and codas (Goold & Jones, 1995).
F IGURE 1 Map showing the location of Atlantis and Irving seamounts in relation to the Azores archipelago.
TABLE 1 Summary of acoustic data used in this work including dates, sampling rate, duty cycle, sensitivity, depth,and position of EARs.
Location Sample period
Sample
rate (kHz)
Duty
cycle (%)
Sensitivity
(dB re 1 V/μPa) Depth (m)
Position
Latitude Longitude
Atlantis 25 July–21 September 50 20 −194.17 294 34�80 37.300N 30�150 24.100W
Irving 30 July–25 September 50 20 −193.14 264 32�20 47.800N 27�580 8.04”W
4 ROMAGOSA ET AL.
With the exception of the very distinctive vocalizations produced by Globicephala spp., Orcinus orca, or Pseudorca
crassidens, that were not found in our recordings, sounds produced by most delphinids overlap in frequency
characteristics, remaining challenging to identify to the level of species. Thus, delphinid vocalizations were clas-
sified at family level (excluding the former three genera). Only those delphinid vocalizations attributed to forag-
ing activities, such as echolocation clicks, burst-pulses, buzzes and bray calls (e.g., Au, 1993; Herzing, 2000;
Janik, 2000; dos Santos, Ferreira, & Harzen, 1995), were included in the analysis to investigate usage of these
seamounts by foraging dolphins. These foraging vocalizations represented 87.2% of total vocalizations in Atlan-
tis and 91.2% in Irving.
The expected detection range of the EARs of delphinid foraging sounds is <4 km (MOL, unpublished data).
Detection range of sperm whale echolocation clicks range from 10 km (Watkins, 1980) up to 16 km (Madsen,
Wahlberg & Møhl, 2002). Given that the radius of Atlantis and of Irving plateaus is >8 km, we assume that delphinid
detections were from animals present over plateau areas, while sperm whale detections could be from whales pre-
sent above plateaus, slopes of seamounts, or open water.
From the database of logged sounds, the following parameters were calculated for each seamount: the percent-
age of days with detections, the number of consecutive hours with detections, and percentage of time with detec-
tions per hour and day.
2.3 | Oceanographic analysis
2.3.1 | Regional data
The climatological World Ocean Atlas 2013 (WOA13, https://www.nodc.noaa.gov/OC5/WOD13/) (Locarnini et al.,
2013, Zweng et al., 2013) was used to investigate if differences in oceanographic settings between Atlantis and
Irving were representative of long-term patterns. WOA13 is a compound of historical in situ measures, which are
interpolated to produce a high-resolution regional climatology. It consists of a long-term set of climatologies
(at annual, seasonal, and monthly periods) for temperature, salinity, oxygen, phosphate, silicate, and nitrate. In this
study, we used climatologies built using 102 levels from the surface to 5,500 m depth on a 0.25� latitude/longitude
grid (27.7 km × 21.3 km). We only used measurements from August and September, corresponding to the study
period, from 1955 to 2012.
Based on the WOA13 climatological data, we calculated the geostrophic currents using profiles of density, which
is a function of temperature and salinity. The geostrophic current is an oceanic flow in which the pressure gradient
force is balanced by the Coriolis effect. The direction of geostrophic flow is parallel to the isobars, with the high pres-
sure to the right of the flow in the Northern Hemisphere. The geostrophic equations are a simplified form of the
Navier–Stokes equations in a rotating reference frame. It is assumed that there is no acceleration (steady-state) or
viscosity, and that the pressure is hydrostatic.
To investigate if climatological data compared well with data from the study period (August and September
2015), regional maps were produced using Absolute Dynamic Topography (ADT) and speed and flow vectors
from the MERCATOR-OCEAN operational ocean circulation model PSY2V4R4 (http://marine.copernicus.eu
/services-portfolio/access-to-products/). This physical configuration is based on the tripolar ORCA grid type
(Madec & Imbard, 1996) with a horizontal resolution of 9 km at the equator. The 50-level vertical discretization
retained for the system had 1 m resolution at the surface decreasing to 450 m at the bottom, with 22 levels
within the upper 100 m. The atmospheric fields forcing NEMO were taken from the ECMWF (European Centre
for Medium-Range Weather Forecasts) Integrated Forecast System. A 3-hr sampling was used to reproduce the
diurnal cycle, in order to force the upper layers of the ocean model, with a thickness of 1 m for the uppermost
level. MERCATOR forecasting system did not include tides (see Caldeira et al., 2016 for model details and
validation).
ROMAGOSA ET AL. 5

2.3.2 | Local data
Daily numerical data of sea surface temperature (SST), salinity, current speed, and mixed layer depth (MLD) used
for the statistical analysis and boxplots were extracted from MERCATOR – Ocean GLORYS-12v1 (Global Ocean
ReanalYsis and Simulations product) model, centered at the position of the EARs with a grid size of 0.08�
latitude/longitude grid (8.8 km × 6.8 km). MERCATOR – Ocean GLORYS-12v1 model is a reanalysis, thus it
assimilates most of the oceanographic data available for each day. Observations are assimilated by means of a
reduced-order Kalman filter, which estimates a joint probability distribution over the variables for each time-
frame resulting in a more accurate algorithm than those based on single measurements alone (Kalman, 1960).
Track altimeter data (sea level anomaly), satellite SST, and sea ice concentration are jointly assimilated with in
situ temperature and salinity vertical profiles. Moreover, a three-dimensional variational (3D-VAR) assimilation
scheme provides a correction for the slowly evolving large-scale biases in temperature and salinity. This model
captures climate signals and trends well and describes mesoscale variability in a realistic manner. A more recent
data-model comparison, using a similar approach was partially validated by Drévillon et al. (2008) and evaluated
by Caldeira et al. (2016) in the Northeast Atlantic. Weekly potential temperature data were also extracted in
order to compare seamounts environment. Potential temperature is the temperature a parcel of water would
have if it were moved adiabatically (i.e., without loss of heat) to a reference pressure which allows for compari-
son between waters of different depths.
Chlorophyll-A (CHLA) data were extracted from an agglomeration of optical images collected by different satel-
lites (MODIS and VIIRS). CHLA data were preprocessed by the Plymouth Marine Laboratory Remote Sensing Group
and has a horizontal resolution of 1 km. Although there is a daily product, the delayed time data used in this study
offers better quality because it uses hindcast data for processing. The algorithms used are presented in McClain
et al. (1995) and Smyth, Moore, Hirata & Aiken (2006).
The eddy kinetic energy (EKE) was derived using the velocity components of the surface currents obtained by
satellite altimetry and calculated as follows:
EKE=U2 +V2
2
These products were processed by SSALTO/DUACS and distributed by AVISO+ (https://www.aviso.altimetry.fr)
with support from CNES (Centre National d'Études Spatiales) with a 0.25� spatial resolution and a daily periodicity.
2.4 | Prey data
Prey data were obtained from the SEAPODYM-LMTL model. This model represents six functional groups of migrant
and nonmigrant micronekton in three vertical layers—elagic, upper mesopelagic and lower mesopelagic—defined in
relation to the euphotic depth (Lehodey et al., 2010, 2015). The boundary between epipelagic and upper mesope-
lagic layers is defined as 1.5 euphotic depths, while the limit between upper mesopelagic and lower mesopelagic
layers is 4.5 euphotic depths, with estimates to a maximum depth of 1,000 m. The model simulates spatial and tem-
poral biomass dynamics of micronekton functional groups based on their diel vertical migration patterns: epipelagic,
upper mesopelagic, migrant upper mesopelagic, lower mesopelagic, migrant lower mesopelagic and highly migrant
lower mesopelagic. Day and night biomasses for each layer were calculated by adding the different micronekton
functional groups accordingly (Table 2).
Micronekton is comprised of myriads of cephalopods, crustaceans, fishes and jellyfish species with body sizes
ranging from 1 to 20 cm in length (Brodeur, Seki, Pakhomov & Suntsov, 2005). Each functional group is modeled as a
single multispecies population, with continuous mortality and recruitment controlled by an allometric relationship to
water temperature. Organisms are transported by currents according to the time spent in each layer. The model
6 ROMAGOSA ET AL.

simulation uses 3D temperature and currents provided by the physical operational Mercator model PSY4 (interpolated
on a regular grid of 0.08� as for the GLORYS12v1 reanalysis). The primary production and euphotic depth computed
from ocean color satellite data was processed in CLS (Collecte Localisation Satellites) using the vertically generalized
production model (VGPM) (Behrenfeld & Falkowski, 1997). The micronekton model outputs have the same horizontal
grid and resolution as the physical model (0.08� × day). The predicted total abundance is linked to the energy transfer
efficiency coefficient from primary production to the functional groups. While there is a considerable uncertainty on
this coefficient and thus the biomass of mesopelagic micronekton (e.g., Proud et al., 2018), the approach used in this
study considers only the relative spatial and temporal variability of these biomass distributions.
Prey abundances were extracted from the model grid cells surrounding the hydrophone position according to the
presumed detection range of each cetacean group: 4 km for delphinids and 10 km for sperm whales.
Small oceanic dolphins feed primarily in the first 200 m of the water column with occasional dives to 400–500 m
(Klatsky, Randall, & Sweeney, 2007). Thus, we only considered the first two vertical layers with three associated
functional groups (epipelagic, upper mesopelagic and migrant upper mesopelagic) for delphinids. Sperm whales are
known to forage mostly on cephalopods found in water depths ranging from 400 m to 1,200 m (Watwood, Miller,
Johnson, Madsen & Tyack, 2006). Above seamounts, where depths are below 400 m, only upper mesopelagic groups
could be included. Grids surrounding the hydrophone within the detection range of sperm whales were included for
the lower mesopelagic micronekton group.
2.5 | Statistical analysis
We used Kruskal–Wallis ANOVA to (1) compare the consecutive number of hours delphinids and sperm whales were
detected at each seamount; (2) test for differences in salinity, SST, current speed, MLD, EKE, and CHLA between the
two seamounts; and (3) test for diel differences in micronekton biomass between the two seamounts.
A generalized additive mixed model (GAMM) with a binomial distribution and a logit link function was used to
investigate diel variations in delphinid and sperm whale detections. As the diel pattern was similar between sea-
mounts, data from the two seamounts were pooled into a single model. Hour of the day was the predictor variable
while presence of detections per hour was the response variable. A temporal autocorrelation structure corAR(1) from
package “nmle” was also included in the model.
To investigate which oceanographic and prey variables influenced the presence of foraging delphinids and sperm
whales, minutes with detections of each cetacean group were related with biomass of micronekton functional groups
and local oceanographic data. Daily biomass of micronekton functional groups as well as delphinid and sperm whale
minutes with detections were calculated for day and night periods (based on sunrise and sunset times extracted from
the U.S. Naval Observatory Astronomical Applications Department database) to explore how variations of the daily
pattern in prey affect predators presence. In the models, period (day and night) was added as an interaction term to
allow dissimilar relationships in the two periods (Zuur, 2012). Local oceanographic variables were included in the
models at a daily scale, the only available resolution. Prior to running the models, we investigated the collinearity
TABLE 2 Distribution of micronekton functional group biomass by day and night for each layer.
Layer Day Night
Epipelagic Epipelagic Epipelagic + upper migrant mesopelagic +
highly migrant upper mesopelagic
Upper mesopelagic Upper mesopelagic +
migrant upper mesopelagic
Upper mesopelagic + migrant lower mesopelagic
Lower mesopelagic Lower mesopelagic + migrant
lower mesopelagic + highly
migrant lower mesopelagic
Lower mesopelagic
ROMAGOSA ET AL. 7
between pairs of covariates using multi-panel scatterplots (Zuur, 2012) (Supplemental Material: Figures 1, 2, and 3)
and selected those with a Pearson's correlation coefficient <0.7 (Dormann et al., 2013; Sutton, Jenner, & Jenner,
2018; Zuur, 2012). As a first step, a generalized additive model (GAM) was built to investigate if explanatory vari-
ables had similar effects on the detections at the two seamounts. Results showed considerable differences in several
variables so separate models were developed for each seamount. Then a model was run using one predictor at a time
to check which of the correlated variables explained best the observed response variable by selecting the one with
lowest Akaike information criteria (AIC) value. In addition, we checked that the covariates resulting from this best
model had low levels of concurvity, which represent nonlinear dependencies among predictor variables, and could lead
towards unstable or imprecise estimates of the covariates' functional effects. We also checked if temporal autocorrela-
tion still existed after running the models by looking at the autocorrelation function of residuals and choosing the best
model accordingly. Inspection of the data indicated a possible lag between EKE and presence of delphinids and sperm
whales in Atlantis. To select which temporal lag to use in the final model, we ran models using one lag at a time (0, 7,
14, 21, 28, and 35 days) and selected the one with the lowest AIC (Burnham & Anderson, 2002).
GAMs were fit with a Gaussian distribution and an identity link function using restricted maximum likelihood
(REML) (Wood, 2011). Predictors with P-values >.05 and estimated degrees of freedom <0.85 were removed
(Roberts et al., 2016). Models were checked by looking at Q-Q plots of deviance residuals, histogram of residuals,
response vs. fitted values and plots of random quantile residuals vs. linear predictor. Sperm whale detections in Irving
were not included in the statistical analyses because of small sample size (detections in only 3.8% of days) and the
high number of zeros in the response resulted in models with poor fit to the data. All statistical analysis were per-
formed using R software (RStudio Team, 2016. Version 1.0.153).
3 | RESULTS
3.1 | Acoustic detections
A total of 277.5 hr were recorded in Atlantis seamount and 274.3 h in Irving seamount during 58 and 59 days,
respectively. Only days with simultaneous recordings in both seamounts were used (244.8 hr recorded during
51 days). Two types of natural sounds were identified; dolphin vocalizations (Family Delphinidae) that included high,
mid-, and low frequency clicks, click trains, buzzes, bray calls (Figure 2a), and whistles (Figure 2b) and sperm whale
clicks and creaks (Figure 2c).
Delphinids were detected every day in 14% of the total recording time in Atlantis, and in 73% of days and 6.2%
of the recording time in Irving (Figure 3). Sperm whale clicks were present in 42.3% of the recording days (6% of the
total recording time) in Atlantis and in 3.8% of days (0.3% of the total recording time) in Irving (Figure 4).
Delphinids and sperm whales spent more consecutive hours in Atlantis than in Irving (delphinids: KW: 8.715,
p = .003; sperm whales: KW: 11.72, p < .001) with a mean of 7.4 hr for delphinids and 5.2 hr for sperm whales in
Atlantis and 4.3 hr for delphinids and 3.5 hr for sperm whales in Irving.
Hour of the day had a significant effect on delphinid foraging vocalizations (GAMM smoother for hour: edf = 2.88,
F = 25.11, p < .001) and sperm whale clicks (GAMM smoother for hour: edf = 2.24, F = 3.88, p < .05) with more
detections at night (~2000–0800) than during the day (~0800–2000) (Figures 3 and 4; Supplemental Material:
Figures 4a and b).
3.2 | Regional and local oceanography
Data from the WOA13 showed that Atlantis and Irving seamounts were under different oceanographic regimes at a
depth of 1,500 m, with Atlantis located in colder and less saline waters relative to Irving (Figure 5a,b). The frontal
system formed between the two seamounts reached 1�C of temperature and 0.15 PSU of salinity. Geostrophic
velocities computed along a line separating the two seamounts highlighted these north–south differences.
8 ROMAGOSA ET AL.

The Azores current (AzC) affected Atlantis from the surface down to 1,000 m (Figure 5c), while Irving was not
affected at all by the core of the AzC (Figure 5d). In fact, at the surface, the geostrophic current affecting Irving
flowed in opposite direction relative to the AzC. Also, geostrophic currents that affected Atlantis were stronger
(15 cm/s) than those reaching Irving (5 cm/s).
Ocean circulation forecasts for August 2015 showed similar results as the climatological scenarios from the
WOA13. The Azores Frontal system separating Atlantis from Irving was evident in the ADT plot (Figure 5e) and
speed and flow vectors (Figure 5f). Atlantis was strongly affected by the Azores surface current, whereas Irving was
affected by a cyclonic eddy traveling westwards.
F IGURE 2 Long-Term Spectral Average (LTSA) plots (above) and spectrograms (below) of (a) delphinid clicks,whistles and bray calls, (b) delphinid whistles and (c) sperm whale clicks.
ROMAGOSA ET AL. 9

At the local scale, differences between the two seamounts were also obvious. During the study period (July–
September 2015), Atlantis showed lower salinity (KW: 215.25, p < .001), lower potential temperature (KW: 49.28,
p < .001), higher EKE (KW: 99.27, p < .001), and higher CHLA concentration (KW: 22.07, p < .001) than Irving (Figure 6).
3.3 | Micronekton model distributions
During the study period, Atlantis had higher biomass of epipelagic (KW: 38.46, p < .001), upper mesopelagic (KW: 42.13,
p < .001), and lower mesopelagic biomass (KW: 42.18, p < .001) than Irving seamount (Figure 7). The micronekton
F IGURE 3 Heatmaps showing delphinid detections (in minutes) in Atlantis (a) and Irving (b) seamounts for eachhour and for each deployment day. Vertical lines indicate time limits between sunset and sunrise (U.S. NavalObservatory Astronomical Applications Department database). On the right: the bar-charts show the number ofminutes per day with delphinid detections.
10 ROMAGOSA ET AL.

biomass in the epipelagic layer was higher at night than during the day (Atlantis: KW: 84.75, p < .001; Irving: KW:
83.25, p < .001), with the opposite pattern in the upper and lower mesopelagic layers. At a larger scale, higher bio-
mass of all micronekton functional groups, except the lower mesopelagic, were found in the northern area that
includes Atlantis seamount. Further south, where Irving is located, there were scattered patches of high biomass
(Figure 8). Higher biomasses of lower mesopelagic, migrant lower mesopelagic, and highly migrant lower mesope-
lagic micronekton were found in the northwest side of Irving seamount (Figure 8).
F IGURE 4 Heatmaps showing sperm whale detections (in minutes) in Atlantis (a) and Irving (b) seamounts foreach hour and for each deployment day. Vertical lines indicate time limits between sunset and sunrise (U.S. NavalObservatory Astronomical Applications Department database). On the right: the bar-chart showing the number ofminutes per day with sperm whale detections.
ROMAGOSA ET AL. 11

3.4 | Delphinid acoustic detections in relation to local oceanography andmicronekton prey
The best GAM model explaining the presence of foraging delphinids in Atlantis included night epipelagic biomass,
MLD and EKE with a 28-day lag (46% of deviance explained) (Supplemental Material: Table 1). Minutes with
F IGURE 5 Maps of temperature (a) and salinity (b) at 1,500 m depth and geostrophic velocities (cm/s) at thesurface (c) and at 1,000 m depth (d) for Atlantis and Irving corresponding to August and September climatology fromWOA13 data set. Maps of forecasted ADT (e), and speed and flow vectors (f) for mid-August of 2015 in the Great
Meteor area. Lines represent the bathymetry around these seamounts.
12 ROMAGOSA ET AL.

delphinid detections increased with increased night epipelagic biomass and 28-day lag EKE and decreased with
deeper MLD (Figures 9a,b,c; Supplemental Material: Table 1). In Irving, the best model included night epipelagic bio-
mass and EKE (31% of deviance explained). Delphinid detections increased with increasing night epipelagic biomass
and EKE. (Figures 9d,e) (Supplemental Material: Table 1). For sperm whale detections in Atlantis, none of the predic-
tors used in the model were significant.
F IGURE 6 Boxplots of Salinity (a), Potential temperature (b), Speed current (c), Mixed layer depth (d), Eddykinetic energy (e), and Chlorophyll A (f) data from July through September of 2015.
F IGURE 7 Boxplots of day and night epipelagic (a), upper mesopelagic (b) and lower mesopelagic biomass (c) atAtlantis and Irving seamounts for the deployment period (July–September 2015).
ROMAGOSA ET AL. 13

4 | DISCUSSION
Most delphinid vocalizations found in the recordings (64.2% of recordings in Atlantis and 79.2% in Irving) contained
low frequency pulses, named bray calls, described by dos Santos et al. (1995). This type of vocalization was found in
other areas and attributed to bottlenose dolphins engaged in foraging activity (e.g., Hastie, Wilson & Thompson,
2006; Janik 2000; King & Janik, 2015). In addition, bottlenose dolphins were the most frequently sighted cetacean
during a 2-week visual survey at both seamounts in September (Supplemental Material: Table 2). Although sightings
were made outside of the EARs detection range, night-time recordings of bray calls occurred on the same day that
bottlenose dolphins were observed in the area. Therefore, we hypothesize that most of delphinid vocalizations were
produced by bottlenose dolphins.
Delphinid acoustic activity was higher at night than during the day in both seamounts, consistent with vocal pat-
terns of dolphins in coastal habitats, island slopes and other seamounts (e.g., Au et al., 2013; Giorli & Au, 2017; Hodge,
Bell, Kumar & Read, 2013). Increased acoustic activity of dolphins at night is believed to be related to higher foraging
activity on vertically migrating prey (Hastie et al., 2006; Janik, 2000; King & Janik, 2015; Simonis et al., 2017). Results
F IGURE 8 SEAPODYM modelled biomass of epipelagic (a), upper mesopelagic (b), migrant upper mesopelagic (c),migrant lower mesopelagic (d), highly migrant lower mesopelagic (e), and lower mesopelagic micronekton(f) averaged across the deployment period (July 27 to September 22, 2015) at a grid resolution of 0.25�
latitude/longitude.
14 ROMAGOSA ET AL.
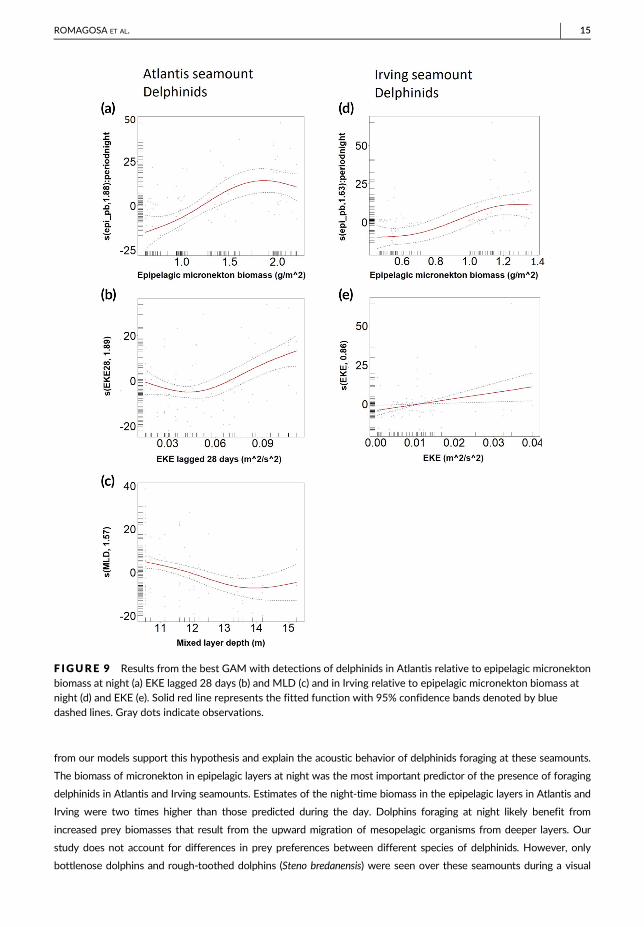
from our models support this hypothesis and explain the acoustic behavior of delphinids foraging at these seamounts.
The biomass of micronekton in epipelagic layers at night was the most important predictor of the presence of foraging
delphinids in Atlantis and Irving seamounts. Estimates of the night-time biomass in the epipelagic layers in Atlantis and
Irving were two times higher than those predicted during the day. Dolphins foraging at night likely benefit from
increased prey biomasses that result from the upward migration of mesopelagic organisms from deeper layers. Our
study does not account for differences in prey preferences between different species of delphinids. However, only
bottlenose dolphins and rough-toothed dolphins (Steno bredanensis) were seen over these seamounts during a visual
F IGURE 9 Results from the best GAM with detections of delphinids in Atlantis relative to epipelagic micronektonbiomass at night (a) EKE lagged 28 days (b) and MLD (c) and in Irving relative to epipelagic micronekton biomass atnight (d) and EKE (e). Solid red line represents the fitted function with 95% confidence bands denoted by bluedashed lines. Gray dots indicate observations.
ROMAGOSA ET AL. 15

survey in the area (Supplemental Material: Table 2). Little is known about the rough-toothed dolphin's feeding habits.
The few existing reports suggest they feed on a variety of fish and cephalopod species. As a deep-water species
frequently associated with other species such as bottlenose dolphins, may suggest they share similar prey preferences
and may also take advantage of the night availability of micronekton on the surface (Baird et al., 2008; Miyzaki &
Perrin, 1994). Atlantic spotted dolphins (Stenella frontalis) were also encountered while in transit between seamounts.
However, in September this species is known to migrate south to spend winter months off Madeira or the Canary
Islands (Silva et al., 2014) and residence time over the seamounts may be short.
Sperm whales were also detected more often at night in Atlantis and Irving. Au et al. (2013) found the same
diel pattern using EARs deployed off two Hawaiian Islands but another study that used animal-borne tags did
not report significant differences in acoustic activity between day or night (Klinck et al., 2012). These differ-
ences could be due to the different methodologies used in these studies. While tags record animal acoustic
activity independently of their movements, static hydrophones can only detect animals when they are within
the instrument detection range. In our study, more sperm whale detections during the night may mean that
animals are closer to seamounts during that time. Seamount slopes are potential foraging sites for sperm
whales (Clarke, 2007). Cephalopods swim or drift to seamounts for spawning and feeding and may be easier to
catch if concentrated against steep topographies (Clarke, 2007; Kaschner, 2007). Oceanic squid species also
follow a diel migration feeding at shallow waters on miconekton fish such as Myctophids (Clarke, 2007). Sperm
whales may find it easier to catch squid on shallower waters during the night and concentrated against sea-
mount slopes.
Delphinids and sperm whales were more frequently detected in Atlantis and spent more time foraging at this sea-
mount than at Irving. Differences in usage between these seamounts can be at least partly explained by their differ-
ent oceanographic regimes and mesoscale features, which ultimately drive productivity and prey distribution.
However, simulated prey biomass was not the only variable explaining foraging activity of delphinids at each sea-
mount, and in the case of sperm whales detected in Atlantis, the models did not show a significant relationship with
any of the micronekton variables. Furthermore, delphinid foraging activity was associated with different oceano-
graphic variables in each seamount. Together, these results suggest that factors influencing the aggregation of prey
and not only prey biomass may influence selection of foraging habitats in these taxa and that oceanographic pro-
cesses creating favorable foraging conditions differs between the two seamounts.
The regional and local oceanographic conditions found during the study period were consistent with the long-
term climatologies and should represent well the main oceanographic features at that time of the year. Our results
clearly show that Atlantis and Irving seamounts are located in areas with distinct water mass properties, mesoscale
variability, and primary productivity. Situated to the north but very close to the mean axis of the AzC (~34�N), Atlan-
tis has persistently colder and less saline waters, higher eddy activity, more variable current speeds and higher con-
centrations of CHLA than Irving, located south of the AzC. These results are supported by previous studies reporting
sharp thermal and density gradients across this frontal system, and increased primary productivity inside the frontal
zone region, probably associated with upwelling processes. In addition, the high instability of the AzC and the inter-
action with the shallow bottom topography also result in more intensive meandering and eddy activity in the Atlantis
region (Barbosa-Aguiar et al., 2011), in agreement with the higher EKE we observed at this seamount. Moreover,
cyclonic and anticyclonic eddies dominating the Atlantis region (Barbosa-Aguiar et al., 2011), can enhance productiv-
ity through upwelling of nutrients from ocean depths and concentration and retention of plankton and nekton
(Condie & Condie 2016; McGillicuddy et al., 1998). On the other hand, Irving is less affected by the AzC but is occa-
sionally exposed to cyclonic eddies that generate from the outflow of Mediterranean water (i.e., eddies) and propa-
gate westwards across the Northeastern Atlantic (Bashmachnikov, Neves, Calheiros, & Carton, 2015). These
transient features could be responsible for temporary enrichments at Irving, by bringing nutrients into the euphotic
zone through increased vertical mixing, or by aggregating plankton at the surface through horizontal convergence
(Condie & Condie, 2016). Cetaceans appear to concentrate at productive fronts and eddies (Davis et al., 2002), which
could make Atlantis seamount a more suitable foraging area than Irving.
16 ROMAGOSA ET AL.

Results from GAM models reflect these different processes affecting the two seamounts. In addition to prey
biomass, EKE was an important predictor of the presence of foraging dolphins with higher number of detections
associated with more intense eddy flows at both seamounts. However, in Atlantis, EKE was a significant predictor
when lagged 28 days, while in Irving EKE was significant without a lag. The lagged EKE in Atlantis suggests a role of
upwelling processes associated with the existence of the AzC front which may be sustained by the numerous passing
eddies. Eddies can concentrate and retain phytoplankton that increase productivity with a lagged response in preda-
tor's presence (Condie & Condie, 2016). In Irving, where no major upwelling processes exist, temporary increases in
EKE may be associated with the passage of cyclonic eddies which retain and aggregate prey explaining the absence
of lagged relationship with dolphin detections. The vertical distribution and structure of prey patches also seems to
influence the foraging behavior of dolphins through their effect on accessibility. In Atlantis, the GAM model also
selected the MLD with a slightly positive effect of shallower MLD on the number of delphinid detections. Another
positive effect of shallower MLD would be through the retention and concentration of small particles like phyto-
plankton (Gardner, Chung, Richardson & Walsh, 1995; Wolf & Woods, 1988) and the zooplankton feeding on them.
Besides, it has been observed that mesozooplankton density declines with increasing mixing depth (Kunz, 2005).
Thus, a thin MLD would have a higher concentration of phytoplankton, which in turn would aggregate zooplankton
and secondary predators like myctophids. Delphinids may use this MLD-induced prey aggregation to feed more effi-
ciently. At Irving seamount, however, MLD was not a significant predictor of delphinid foraging. It could be due to
smaller MLD ranges above this seamount caused by the absence of strong currents and/or different aggregating pro-
cesses (currents vs. temporary eddies) affecting this seamount. Nevertheless, these results should be considered
with some caution, as the range of MLD was very limited, and the relevance of such variability to foraging dolphins
is questionable. Sperm whale detections in Atlantis were not associated with any predictor used in the model.
The small temporal scale of this study, together with the few sperm whale detections, may have an influence on our
model results.
Consistent with the expectations from the physical dynamics of the region, comparatively higher biomass of epi-,
upper meso-, migrant upper meso-, migrant lower meso-, and highly migrant lower mesopelagic micronekton were
predicted north of the AzC, where Atlantis is located. The SEAPODYM-MTL also predicted increased biomass of
micronekton at Irving, coincidental with the passage of an eddy during the study period (August 2015). This feature
was observed to pass near Irving seamount with predicted micronekton aggregation on its edge and trapped by the
seamount slope in the lower mesopelagic layer, that is, below 400 m depth. However, the GAM model for sperm
whales at Atlantis did not select the micronekton variable. There may be multiple reasons such as the small temporal
scale, few sperm whale detections or large spatial scale and resolution of the prey model. Another plausible explana-
tion may be the mismatch between the target prey of sperm whales and those simulated with the micronekton func-
tional groups. The diet of sperm whales caught in commercial whaling in the Azores was mainly composed of squids
of the families Histioteuthidae, Octopoteuthidae and Architeuthidae, namely Histiotheuthis bonnellii, Taningia danae,
and Architeuthis dux (Clarke, 2007). Thus, prey items of sperm whales may exceed the size range of micronekton
organisms in the SEAPODYM-MTL (<20 cm) and occupy water depths beyond the 1,000 m considered in the model.
At a smaller scale, the interaction of mesoscale and submesoscale features with seamount topography can gener-
ate internal waves, permanent or semipermanent eddies, and local upwelling that enrich the productivity of the
pelagic water column (Clark et al., 2010; Genin & Dower, 2007). Barbosa-Aguiar et al. (2011) found that bottom
topographic features from this area induced variability in eddies and meander activity of the AzC. Therefore, the AzC
affecting Atlantis seamount even at depths of 1,000 m could potentially cause nutrient-enriched waters through pro-
cesses of upwelling and/or enhanced horizontal flux. Since the micronekton model relies on satellite ocean color data
for the primary production, local enrichments are integrated to the dynamics of micronekton functional groups.
However, the spatial resolution of the ocean circulation model (0.08�, ~9 km) is likely not enough to properly simu-
late local effects of the seamount on micronekton biomass. Finally, the micronekton model does not include a repre-
sentation of the benthos and demersal component on the summit and slopes of the seamount that eventually may
be an additional attractive feature for large pelagic predators.
ROMAGOSA ET AL. 17

In summary, increased productivity and micronekton biomass in Atlantis relative to Irving probably explains why
delphinids and sperm whales preferred to forage in Atlantis. Nevertheless, dolphins and sperm whales occasionally
foraged in Irving possibly because of the temporarily enriched waters by cyclonic eddies that act as little oasis of pro-
ductivity in oligotrophic environments (Godø et al., 2012). SEAPODYM-MTL may not represent the fine-scale dol-
phin prey distribution and accessibility well, which may demonstrate why oceanographic variables (EKE and MLD),
proxies of vertical distribution and aggregation, are important predictors in the models.
This study provides novel information on cetacean presence in the remote area of the Great Meteor seamount
complex and adds to the few studies investigating the influence of regional oceanography on predator distribution.
Longer-term studies with more sampling locations including abyssal areas are necessary to describe in more detail
the mechanisms influencing the abundance and distribution of marine top predators and their prey.
ACKNOWLEDGMENTS
We are grateful to Rui Prieto, Sergio Ricardo Gómez, Alexandra Rosa, Sérgio Ricardo Gomes and the skippers and
crew members of Gago Coutinho and Arquipélago research vessels that helped with the deployment and retrieval of
EARs. We are also grateful to Tiago Marques for his statistical feedback during the revision of this manuscript. Com-
ments made by three anonymous reviewers significantly improved the present paper. This work was supported by
an EEA grant under project BIOMETORE (PT02_Aviso2_0001), and by Fundação para a Ciência e Tecnologia (FCT)
through research project FCT-Exploratory project (IF/00943/2013/CP1199/CT0001) co-funded by FEDER,
COMPETE, QREN, POPH, FSE, and the Portuguese Ministry for Science and Education. MR is supported by a
Fundo Regional para a Ciência e Tecnologia (FRCT) doctoral grant (M3.1.a/F/028/2015 QREN European Social
Fund and the Portuguese Ministry for Science and Education). MAS is supported by POPH, QREN, ESF and the
Portuguese Ministry for Science and Education through an FCT-Investigator contract (IF/00943/2013). Field-
work was approved and conducted under scientific permits from the Regional Directorate for the Environment,
Regional Government of the Azores (N�30/2015/DRA). Authors have no conflict of interest to declare.
ORCID
Miriam Romagosa https://orcid.org/0000-0003-2781-5528
Jesus Reis https://orcid.org/0000-0001-6905-3555
REFERNCES
Abecassis, M., Senina, I., Lehodey, P., Gaspar, P., Parker, D., Balazs, J., & Polovina, J. (2013). A model of loggerhead sea turtle
(Caretta caretta) habitat and movement in the oceanic North Pacific. PLoS One, 8, e73274.
Alves, M. L. G. R., & Verdière, A. C. (1999). Instability dynamics of a subtropical jet and applications to the Azores Front Cur-
rent System: Eddy-driven mean flow. Journal of Physical Oceanography, 29, 837–864.
Au, W. W. L. (1993). The sonar of dolphins. New York, NY: Springer.
Au, W. W. L., Giorli, G., Chen, J., Copeland, A., Lammers, M., Richlen, M., … Klinck, H. (2013). Nighttime foraging by deep div-
ing echolocating odontocetes off the Hawaiian islands of Kauai and Ni'ihau as determined by passive acoustic monitors.
Journal of the Acoustical Society of America, 133, 3119–3127.
Baird, R. W., Webster, L.,. D., Mahaffy, S. D., McSweeney, D. J., Schorr, G. S., & Ligon, A. D. (2008). Site fidelity and associa-
tion patterns in a deep-water dolphin: Rough-toothed dolphins (Steno bredanensis) in the Hawaiian Archipelago. Marine
Mammal Science, 24, 535–553.
Barbosa-Aguiar, A. C., Peliz, A. J., Cordeiro Pires, A., & Le Cann, B. (2011). Zonal structure of the mean flow and eddies in
the Azores Current system. Journal of Geophysical Research, 116, C02012.
Barlow, J., Kahru, M., & Mitchell, B. G. (2008). Cetacean biomass, prey consumption, and primary production requirements
in the California Current ecosystem. Marine Ecolology Progress Series, 371, 285–295.
18 ROMAGOSA ET AL.

Bashmachnikov, I., Neves, F., Calheiros, T., & Carton, X. (2015). Properties and pathways of Mediterranean water eddies in
the Atlantic. Progress in Oceanography, 137A, 149–172.
Baumann-Pickering, S., Trickey, J. S., Wiggins, S. M., & Oleson, E. M. (2016). Odontocete occurrence in relation to changes
in oceanography at a remote equatorial Pacific seamount. Marine Mammal Science, 32, 805–825.
Bednarz, U. (1991). Petrologie des Atlantis-Seamount-Komplexes [Petrology of the Atlantis Seamount Complex]. In
G. Wefer, W. Weigel, & O. Pfannkuche (Eds.). Eastern Atlantic ‘90 Expedition, (RV Meteor) Cruise No. 12, 13th March to
30th June 1990 (pp. 115–123). Meteor-Ber. 91–1. Hamburg, Germany: University of Hamburg.
Behrenfeld, M. J., &. Falkowski. P. G. (1997). Photosynthetic rates derived from satellite- based chlorophyll concentration.
Limnology and Oceanography, 42, 1–20.
Brodeur, R. D., Seki, M. P., Pakhomov, E. A., & Suntsov, A. V. (2005). Micronekton–What are they and why are they important?
North Pacific Marine Science Organization (Vol. 13, pp. 7–11). Sidney, British Columbia, Canada: Pices Press.
Burnham, K. P., & Anderson, D. R. (2002). Model selection and multimodel inference: A practical information- theoretic approach
(2nd ed.). New York, NY: Springer.
Caldeira, R., Couvelard, X., Vieira, R. R., Lucas, C., Sala, I., & Casanova, I. V. (2016). Challenges of building an operational
ocean forecasting system for small island regions: Regional to Local. Journal of Operational Oceanography, 9, 1–12.
Clarke, M. R. (2007). Seamounts and cephalopods. In T. J. Pitcher, T. Morato, P. J. B. Hart, M. R. Clark, N. Haggan, &
R. S. Santos (Eds.), Seamounts: Ecology, fisheries and conservation (pp. 207–229). Oxford, UK: Blackwell Publishing.
Clark, M. R., Rowden, A. A., Schlacher, T., Williams, A., Consalvey, M., Stocks, K. I., … Hall-Spencer, J. M. (2010). The ecology
of seamounts: Structure, function, and human impacts. Annual Review of Marine Science, 2, 253–278.
Condie, S., & Condie, R. (2016). Retention of plankton within ocean eddies. Global Ecology and Biogeography, 25,
1264–1277.
Davis, R. W., Ortega-Ortiz, J. G., Ribic, C. A., Evans, W. E., Biggs, D. C., Ressler, P. H., … Würsig, B. (2002). Cetacean habitat
in the northern oceanic Gulf of Mexico. Deep-Sea Research Part I, 49, 121–142.
Davison, P. C., Koslow, J. A., & Kloser, R. J. (2015). Acoustic biomass estimation of mesopelagic fish: backscattering from
individuals, populations, and communities. ICES Journal of Marine Science, 7, 1413–1424.
Dormann, C. F., Elith, J., Bacher, S., Buchmann, C., Carl, G., Carré, G., … Lautenbach, S. (2013). Collinearity: A review of
methods to deal with it and a simulation study evaluating their performance. Ecography, 36, 027–046.
dos Santos, M. E., Ferreira, A. J., & Harzen, S. (1995). Rhythmic sound sequences emitted by aroused bottlenose dolphins in
the Sado Estuary, Portugal. In R. A. Kastelein, J. A. Thomas, & P. E. Nachtigall (Eds.), Sensory systems of aquatic mammals
(pp. 325–334). Woerden, Netherlands: De Spil Publishers.
Dragon, A.-C., Senina, I., Hintzen, N., & Lehodey, P. (2017). Modelling South Pacific jack mackerel spatial population dynam-
ics and fisheries. Fisheries Oceanography, 27, 97–113.
Drévillon, M., Bourdallé-Badie, R., Derval, C., Lellouche, M., Rémy, E., Tranchant, B., … Parent, L. (2008). The GODAE/Mercator-
Ocean global ocean forecasting system: results, applications and prospects. Journal of Operational Oceanography, 1, 51–57.
Gardner, W. D., Chung, S. P., Richardson, M. J., & Walsh, I. D. (1995). The oceanic mixed-layer pump. Deep Sea Research Part
II: Tropical Studies in Oceanography, 42, 757–775.
Gaspar, P., Georges, J.-Y., Fossette, S., Lenoble, A., Ferraroli, S., & Le Maho, Y. (2006). Marine animal behaviour: Neglecting
ocean currents can lead us up the wrong track. Proceedings of the Royal Society B: Biological Sciences, 273, 2697–2702.
Genin, A. (2004). Bio-physical coupling in the formation of zooplankton and fish aggregations over abrupt topographies.
Journal of Marine Systems, 50, 3–20.
Genin, A., & Dower, J. F. (2007). Seamount plankton dynamics. In T. J. Pitcher, T. Morato, P. J. B. Hart, M. R. Clark,
N. Haggan, & R. S. Santos (Eds.), Seamounts: Ecology, fisheries and conservation (pp. 85–100). Oxford, UK:
Blackwell.
Giorli, G., Au, W. W. L., Ou, H., Jarvis, S., Morrissey, R., & Moretti, D. (2015). Acoustic detection of biosonar activity of deep
diving odontocetes at Josephine Seamount High Seas Marine Protected Area. Journal of the Acoustical Society of
America, 137, 2495–2501.
Giorli, G., & Au, W. W. L. (2017). Spatio-temporal variation and seasonality of odontocetes' foraging activity in the leeward
side of the island of Hawaii. Deep Sea Research Part I: Oceanography Research Papers, 121, 202–209.
Godø, O. R., Samuelsen, A., Macaulay, G. J., Patel, R., Hjøllo, S. S., Horne, J., … Johannessen, J. A. (2012). Mesoscale Eddies
Are Oases for Higher Trophic Marine Life. PLoS One, 7, e30161.
Goold, J. C., & Jones, S. E. (1995). Time and frequency domain characteristics of sperm whale clicks. Journal of the Acoustical
Society of America, 98, 1279–1291.
Hann, C. H., Smith, T. D., & Torres, L. G. (2016). A sperm whale's perspective: The importance of seasonality and seamount
depth. Marine Mammal Science, 32, 1470–1481.
Hastie, G. D., Swift, R. J., Slesser, G., Thompson, P. M., & Turrell, W. R. (2005). Environmental models for predicting oceanic
dolphin habitat in the Northeast Atlantic. ICES Journal of Marine Science, 62, 760–770.
ROMAGOSA ET AL. 19

Hastie, G. D., Wilson, B., &. Thompson, P. M. (2006). Diving deep in a foraging hotspot: Acoustic insights into bottlenose
dolphin dive depths and feeding behaviour. Marine Biology, 148, 1181–1188.
Herzing, D. L. (2000). Acoustics and social behavior of wild dolphins: Implications for a sound society. In W. W. L. Au &
R. R. Fay (Eds.), Hearing in whales and dolphins (pp. 225–272). New York: NY: Springer.
Hodge, L. E. W., Bell, J. T., Kumar, A., & Read, A. J. (2013). The influence of habitat and time of day on the occurrence of
odontocete vocalizations in Onslow Bay, North Carolina. Marine Mammal Science, 29, 411–427.
Janik, V. M. (2000). Food-related bray calls in wild bottlenose dolphins (Tursiops truncatus). Proceedings of the Royal
Society B: Biological Sciences, 267, 923–927.
Johnson, J., & Stevens, I. (2000). A fine resolution model of the eastern North Atlantic between the Azores, the Canary
Islands and the Gibraltar Strait. Deep-Sea Research, 47, 875–899.
Johnson, M., Madsen, P. T., Zimmer, W. M. X., Aguilar de Soto, N., & Tyack, P. L. (2006). Foraging Blainville's beaked whales
(Mesoplodon densirostris) produce distinct click types matched to different phases of echolocation. Journal of Experimen-
tal Biology, 209, 5038–5050.
Kalman, R. E. (1960). A new approach to linear filtering and prediction problems. Transactions of the American Society of
Mechanical Engineers, Series D. Journal of Basic Engineering, 82, 35–45.
Kaschner, K. (2007). Air-breathing visitors to seamounts: Marine mammals. In T. J. Pitcher, T. Morato, P. J. B. Hart,
M. R. Clark, N. Haggan, & R. S. Santos (Eds.), Seamounts: Ecology, conservation and management (pp. 230–238). Oxford,
UK: Blackwell.
King, S. L., & Janik, V. M. (2015). Come dine with me: Food-associated social signaling in wild bottlenose dolphins (Tursiops
truncatus). Animal Cognition, 18, 969–974.
Klatsky, L. J., Randall, S. W., & Sweeney, J. C. (2007). Offshore bottlenose dolphins (Tursiops truncatus): Movement and dive
behaviour near the Bermuda pedestal. Journal of Mammalogy, 88, 59–66.
Klein, B., & Siedler, G. (1989). On the origin of the Azores Current. Journal of Geophysical Research, 94, 6159–6168.
Klinck, H., Mellinger, D. K., Klinck, K., Bogue, N. M., Luby, J. C., Jump, W. A., … Baird, R. W. (2012). Near-real-time acoustic
monitoring of beaked whales and other cetaceans using a Seaglider™. PLoS One, 7, 1–8.
Kraus, W., Kaese, R. H., & Hinrichsen, H. H. (1990). The branching of the Gulf Stream southeast of the Grand Banks. Journal
of Geophysical Research, 95, 13089–13103.
Kunz, T. J. (2005). Effects of mixing depth, turbulent diffusion and nutrient enrichment on enclosed marine plankton communities
(Doctoral dissertation). Ludwig Maximilian University of Munich, Munich, Germnay.
Kvile, K. �., Taranto, G. H., Pitcher, T. J., & Morato, T. (2014). A global assessment of seamount ecosystems knowledge using
an ecosystem evaluation framework. Biology Conservation, 173, 108–120.
Lambert, C., Mannocci, L., Lehodey, P., & Ridoux, V. (2014). Predicting cetacean habitats from their energetic needs and the
distribution of their prey in two contrasted tropical regions. PLoS One, 9, e105958.
Lammers, M. O., Brainard, R. E., Au, W. W. L., Mooney, T. A., & Wong, K. B. (2008). An Ecological Acoustic Recorder (EAR)
for long-term monitoring of biological and anthropogenic sounds on coral reefs and other marine habitats. Journal of the
Acoustical Society of America, 123, 1720–1728.
Lehodey, P., Conchon, A., Senina, I., Domokos, R., Calmettes, B., Jouanno, J., … Kloser, R. (2015). Optimization of a micro-
nekton model with acoustic data. ICES Journal of Marine Science, 72, 1399–1412.
Lehodey, P., Murtugudde, R., & Senina, I. (2010). Bridging the gap from ocean models to population dynamics of large marine
predators: A model of mid-trophic functional groups. Progress in Oceanography, 84, 69–84.
Lehodey, P., Senina, I., & Murtugudde, R. (2008). A spatial ecosystem and populations dynamics model (SEAPODYM)–Modeling of tuna and tuna-like populations. Progress in Oceanography, 78, 304–318.
Le Traon, P.-Y., Antoine, D., Bentamy, A., Bonekamp, H., Breivik, L. A., Chapron, B., …Wilkin, J. (2015). Use of satellite obser-
vations for operational oceanography: Recent achievements and future prospects. Journal of Operational Oceanography,
8, 12–27.
Locarnini, R. A., Mishonov, A. V., Antonov, J. I., Boyer, T. P., Garcia, H. E., Baranova, O. K., … Seidov, D. (2013). World Ocean
Atlas 2013, Volume 1: Temperature. In S. Levitus (Ed.), & A. Mishonov (Technical Ed.). NOAA Atlas NESDIS. (pp. 40).
Madec, G., & Imbard, M. (1996). A global ocean mesh to overcome the north pole singularity. Climate Dynamics, 12,
381–388.
Madsen, P. T., Wahlberg, M., & Møhl, B. (2002). Male sperm whale (Physeter macrocephalus) acoustics in a high-latitude habi-
tat: Implications for echolocation and communication. Behavioral Ecology and Sociobiology, 53, 31–41.
Mannocci, L., Catalogna, M., Dorémus, G., Laran, S., Lehodey, P., Massart, W., & Ridoux, V. (2014). Predicting cetacean and
seabird habitats across a productivity gradient in the South Pacific gyre. Progress in Oceanography, 120, 383–398.
McClain, C. R., Arrigo, K. R., Esaias, W., Darzi, M., Patt, F. S., Evans, R. H., … Kumar, L. (1995). SeaWiFS Algorithms, Part 1.
U.S. Department of Commerce, NASA Technical Memorandum 104566, Volume 28.
McFarland, W., & Levin, S. A. (2002). Modelling the effects of current on prey acquisition in planktivorous fishes. Marine and
Freshwater Behaviour and Physiology, 35, 55–69.
20 ROMAGOSA ET AL.

McGillicuddy, D. J., Jr., Robinson, A. R., Jannasch, H. W., Johnsonk, R., Michaels, T. A. F., & Knapk, A. H. (1998). Influence of
mesoscale eddies on new production in the Sargasso Sea. Nature, 394, 263–266.
Morato, T., Hoyle, S. D., Allain, V., & Nicol, S. J. (2010). Seamounts are hotspots of pelagic biodiversity in the open ocean.
Proceedings of the National Academy of Sciences of the United States of America, 107, 9707–9711.
Morato, T., Varkey, D. A., Damaso, C., Machete, M., Santos, M., Prieto, R., … Pitcher, J. (2008). Evidence of a seamount effect
on aggregating visitors. Marine Ecology Progress Series, 357, 23–32.
Miyzaki, N., & Perrin, W. F. (1994). Rough-toothed dolphin (Lesson, 1828). In S. H. Ridgway & R. Harrison (Eds.), Handbook
of marine mammals (Vol. 5, pp. 1–21). London, UK: Academic Press.
Proud, R., Handegard, N. O., Kloser, R. J., Cox, M. J., & Brierley, A. S. (2018). From siphonophores to deep scattering layers:
Uncertainty ranges for the estimation of global mesopelagic fish biomass. ICES Journal of Marine Science, 76, 718–733.
Pusch, C., Beckmann, A., Porteiro, F. M., & Westernhagen, H. V. (2004). The influence of seamounts on mesopelagic fish
communities. Archive of Fishery and Marine Research, 51, 165–186.
Richardson, P. R. (1996). Tracking ocean eddies. In R. G. Pirie. In Oceanography (Third ed., pp. 88–104). Oxford, UK: Oxford
University Press.
RStudio Team. (2016). RStudio: Integrated development for R. Boston, MA: RStudio, Inc. Retrieved from. http://www.rstudio.com/
Roberts, J. J., Best, B. D., Mannocci, L., Fujioka, E., Halpin, P. N., Palka, D. L., … Lockhart, G. G. (2016). Habitat-based ceta-
cean density models for the U.S. Atlantic and Gulf of Mexico. Nature Scientific Reports, 6, 22615.
Senina, I., Sibert, J., & Lehodey, P. (2008). Parameter estimation for basin-scale ecosystem-linked population models of large
pelagic predators: Application to skipjack tuna. Progress in Oceanography, 78, 319–335.
Sibert, J., Senina, I., Lehodey, P., & Hampton, J. (2012). Shifting from marine reserves to maritime zoning for conservation of
Pacific bigeye tuna (Thunnus obesus). Proceedings of the National Academy of Sciences of the United States of America,
109, 18221–18225.
Silva, M. A., Prieto, R., Cascão, I., Seabra, M. I., Machete, M., Baumgartner, M. F., & Santos, R. S. (2014). Spatial and temporal
distribution of cetaceans in the mid-Atlantic waters around the Azores. Marine Biology Research, 10, 123–137.
Simonis, A. E., Roch, M. A., Bailey, B., Barlow, J., Clemesha1, R. E. S., Iacobellis, S., … Baumann-Pickering, S. (2017). Lunar
cycles affect common dolphin (Delphinus delphis) foraging in the Southern California Bight. Marine Ecology Progress Series,
577, 221–235.
Skov, H., Gunnlaugsson, T., Budgell, W. P., Horne, J. K., Nøttestad, L., Olsen, E., … Waring, G. (2008). Small-scale spatial vari-
ability of sperm and sei whales in relation to oceanographic and topographic features along the Mid-Atlantic Ridge.
Deep-Sea Research Part II: Topical Studies in Oceanography, 55, 254–268.
Smith, W. H. F., & Sandwell, D. T. (1997). Global sea floor topography from satellite altimetry and ship depth soundings. Sci-
ence, 277, 1956–1962.
Smyth, T. J., Moore, G. F., Hirata, T., & Aiken, J. (2006). Semianalytical model for the derivation of ocean color inherent opti-
cal properties: description, implementation, and performance assessment. Applied Optics, 45, 8116–8131.
Soldevilla, M. S., Wiggins, S. M., Hildebrand, J. A., Oleson, E. M., & Ferguson, M. C. (2011). Risso's and Pacific white-sided
dolphin habitat modeling from passive acoustic monitoring. Marine Ecology Progress Series, 423, 247–267.
Sutton, A. L., Jenner, K. C. S., & Jenner, M. M.. (2018). Habitat associations of cetaceans and seabirds in the tropical eastern
Indian Ocean. Deep Sea Research Part II: Topical Studies in Oceanography. Retrieved from. https://doi.org/10.1016/j.dsr2.
2018.06.002. In press
Tobeña, M., Prieto, R., Machete, M., & Silva, M. A. (2016). Modeling the potential distribution and richness of cetaceans in
the Azores from Fisheries Observer Program data. Frontiers in Marine Science, 3, 202.
Torres, L. G., Smith, T. D., Sutton, P., MacDiarmid, A., & Bannister, J. (2011). Habitat use and distribution patterns of southern
right whales and sperm whales discerned from spatial analyses of 19th century whaling records. National Institute of Water
and Atmospheric Research, Ltd. (NIWA) client report WLG2011–52, Auckland, New Zealand. 135 pp.
Waring, G. T., Hamazaki, T., Sheehan, D., Wood, G., & Baker, S. (2001). Characterization of beaked whale (Ziphiidae) and
sperm whale (Physeter macrocephalus) summer habitat in shelf-edge and deeper waters off the northeast U.S. Marine
Mammal Science, 17, 703–717.
Watkins, W. A. (1980). Acoustics and the behavior of sperm whales. In R.-G. Busnel & J. F. Fish (Eds.), Animal sonar systems
(pp. 283–289). New York, NY: Plenum Press.
Watwood, S. L., Miller, P. J. O., Johnson, M., Madsen, P. T., & Tyack, P. L. (2006). Deep-diving foraging behavior of sperm
whales (Physeter macrocephalus). Journal of Animal Ecology, 75, 814–825.
Wolf, K. U., & Woods, J. D. (1988). Lagrangian simulation of primary production in the physical environment- the deep chlo-
rophyll maximum and nutricline. In B. J. Rothschild (Ed.), Toward a theory of biological-physical interactions in the world
ocean. Dordrecht, Netherlands: Kluwer Academic Publishers.
Wong, S. N. P., & Whitehead, H. (2014). Seasonal occurrence of sperm whales (Physeter macrocephalus) around Kelvin Sea-
mount in the Sargasso Sea in relation to oceanographic processes. Deep-Sea Research Part I: Oceanographic Research
Papers, 91, 10–16.
ROMAGOSA ET AL. 21

Wood, S. N. (2011). Fast stable restricted maximum likelihood and marginal likelihood estimation of semiparametric general-
ized linear models. Journal of the Royal Statistical Society: Series B (Statistical Methodology), 73, 3–36.Zimmer, W. M. X., Johnson, M. P., Madsen, P. T., & Tyack, P. L. (2005). Echolocation clicks of free-ranging Cuvier's beaked
whales (Ziphius cavirostris). Journal of the Acoustical Society of America, 117, 3919–3927.Zuur, A. F. (2012). A Beginner's guide to generalized additive models with R. Newburgh, UK: Highland Statistics Ltd.
Zweng, M. M., Reagan, J. R., Antonov, J. I., Locarnini, R. A., Mishonov, A. V., Boyer, T. P., … Biddle, M. M. (2013). World
Ocean Atlas 2013, Volume 2: Salinity. In S. Levitus (Ed.), & A. Mishonov (Technical Ed.). NOAA Atlas NESDIS 74 (pp. 39).
Silver Spring, MD: U.S Department of Commerce, NOAA.
SUPPORTING INFORMATION
Additional supporting information may be found online in the Supporting Information section at the end of this
article.
How to cite this article: Romagosa M, Lucas C, Pérez-Jorge S, et al. Differences in regional oceanography
and prey biomass influence the presence of foraging odontocetes at two Atlantic seamounts.Mar Mam Sci.
2019;1–22. https://doi.org/10.1111/mms.12626
22 ROMAGOSA ET AL.