Embed Size (px)
Citation preview

1
Differences in leaf temperature between lianas and trees in the Neotropical canopy
J. Antonio Guzmán Q.1, G. Arturo Sánchez-Azofeifa1*, Benoit Rivard1
1 Center for Earth Observation Sciences, Department of Earth and Atmospheric Sciences,
University of Alberta, Edmonton, Alberta, Canada, T6G 2E3.
* Author to whom correspondence should be addressed.
J. Antonio Guzmán Q. Email: [email protected]; ORCID: 0000-0002- 0721-148X
Arturo Sánchez-Azofeifa. Email: [email protected]; ORCID: 0000-0001- 7768-6600
Benoit Rivard. Email: [email protected]; ORCID: 0000-0002- 1318-2400
Preprints (www.preprints.org) | NOT PEER-REVIEWED | Posted: 20 April 2018 doi:10.20944/preprints201804.0266.v1
© 2018 by the author(s). Distributed under a Creative Commons CC BY license.
Peer-reviewed version available at Forests 2018, 9, 307; doi:10.3390/f9060307

2
Abstract 1
Leaf temperature (Tleaf) influences photosynthesis and respiration. Currently, there is a growing 2
interest on including lianas in productivity models due to their increasing abundance, and their 3
detrimental effects on net primary productivity in tropical environments. Therefore, 4
understanding the differences of Tleaf between lianas and trees is important for future of forest on 5
whole ecosystem productivity. Here we determined the displayed leaf temperature (Td= Tleaf – 6
ambient temperature) of several species of lianas and their host trees during ENSO and non-7
ENSO years to evaluate if the presence of lianas affects the Td of their host trees, and if leaves of 8
lianas and their host trees exhibit differences in Td. Our results suggest that close to midday, the 9
presence of lianas does not affect the Td of their host trees; however, lianas tend to have higher 10
values of Td than their hosts across seasons, in both ENSO and non-ENSO years. Although lianas 11
and trees tend to have similar physiological-temperature responses, differences in Td could lead 12
to significant differences in rates of photosynthesis and respiration based temperature response 13
curves. Future models should thus consider differences in leaf temperature between these life 14
forms to achieve robust predictions of productivity. 15
16
Key words: gas exchange, leaf canopy temperature, life forms, thermography, woody vines. 17
18
1 Introduction 19
Variations in leaf temperature (Tleaf) have been considered a factor that can affect the net 20
primary productivity of the biosphere. Most Terrestrial Biosphere Models (TBMs) use kinetic 21
constants of Tleaf dependence to evaluate the response of photosynthesis and respiration in a 22
given ecosystem [1]. However, the increasing effects of global warming and the high diversity of 23
Preprints (www.preprints.org) | NOT PEER-REVIEWED | Posted: 20 April 2018 doi:10.20944/preprints201804.0266.v1
Peer-reviewed version available at Forests 2018, 9, 307; doi:10.3390/f9060307
3
species and ecological strategies pose a challenge to determining with accuracy the Tleaf of 24
different individuals and plant communities. In tree communities of temperate regions, 25
Leuzinger & Körner [2] have found that the presence or absence of certain tree species in the 26
canopy can play a significant role in the control of the forest surface temperature. This control 27
depends in large part on the spatial arrangement and leaf functional traits of such species, such as 28
the stomatal conductance and the capacity of leaf cooling associated with water transpiration [3–29
5]. Currently, there is no concrete evidence how the spatial arrangement of species can affect the 30
forest surface temperature of tropical forest; nevertheless, it could be expected that high diversity 31
of species, life forms, and functional traits produce a highly dynamic surface temperature that 32
could reduce our ability to predict different ecological processes. 33
Studies have shown several implications of the increasing temperature on ecological 34
processes at different levels. For example, at the leaf level, increases in temperature above the 35
photosynthesis optimum are associated with the decline of CO2 assimilation rates [6,7], stomatal 36
conductance [8], and increases in respiration [9]; trends that can vary widely among species and 37
life forms [7,9,10]. Likewise, at the ecosystem level in tropical forests, climate warming are 38
associated with long-term increases in biomass [11] and dominance of plants such as lianas [12]. 39
Associated with this later life form, since 2002 studies have reported a notable increase in 40
liana abundance in tropical and temperate environments [13–17]. Likewise, other studies have 41
shown significant detrimental effects of lianas presence on the tree recruitment, growth, survival, 42
and carbon stock [18–20]. Together, these trends have cast doubt the accuracy of TBMs that 43
predict the carbon cycle [21]; highlighting the need to incorporate lianas a future factor in such 44
models for a better understanding of the ecosystem dynamics. Currently, most of the 45
temperature–response studies that have compared the physiological performance of lianas and 46
Preprints (www.preprints.org) | NOT PEER-REVIEWED | Posted: 20 April 2018 doi:10.20944/preprints201804.0266.v1
Peer-reviewed version available at Forests 2018, 9, 307; doi:10.3390/f9060307
4
trees at the leaf-level suggest that there is no need to make a distinction between the 47
physiological behavior of these life forms in future models [7,9,10,22]. However, the higher 48
interception of light by lianas [23] and the greater competitive advantage of lianas in water use 49
[24] suggests that their Tleaf may differ from that of their host trees, and might also affect Tleaf of 50
their hosts; such differences in Tleaf between these life forms could reduce our ability to predict 51
carbon fluxes in tropical forest canopies accurately. 52
In this study, we analyze the intra- and inter-specific trends in Tleaf for full-sun exposed 53
leaves of several liana species and four host trees of a neotropical seasonal forest in Panama. We 54
achieved this by using thermography and addressed two hypotheses at the canopy level: i) the 55
presence of lianas affects the leaf temperature of their host trees (intra-specific trends), and ii) 56
leaves of lianas and their host trees exhibit differences in leaf temperature (inter-specific trends). 57
These hypotheses were addressed by observing temporal variations during the wet and dry 58
seasons in contrasting El Niño (2015-2016) and La Niña years (2016-2017). Our hypotheses 59
were analyzed using the displayed leaf temperature (Td) as the difference of Tleaf obtained from 60
the thermal images less the ambient air temperature (Ta). The Td was estimated as a proxy of Tleaf 61
in order to reduce the effect of the variation of the surrounding Ta during each measurement and 62
perform temporal comparisons. 63
We hypothesized that leaves of trees with lianas would experience higher values of Td 64
than leaves of trees without lianas. This is based on the negative effects of lianas on trees 65
associated with the ability of lianas to reduce the water availability of around their host trees 66
[25]; a process that could affect the transpirational cooling of leaves of host trees [26]. Likewise, 67
we expect that leaves of lianas would show lower Td in comparison with host tree leaves; due to 68
their ability to grow in drought environments [16] and their greater competitive advantage on the 69
Preprints (www.preprints.org) | NOT PEER-REVIEWED | Posted: 20 April 2018 doi:10.20944/preprints201804.0266.v1
Peer-reviewed version available at Forests 2018, 9, 307; doi:10.3390/f9060307
5
acquisition, regulation, and efficient use of water in comparison with trees [24,27–29]. To 70
address our hypotheses, we first had to estimate the emissivity of leaves for each life form to 71
calculate the Tleaf. To show the impact of the differences in Td, and consequently Tleaf, on carbon 72
fluxes between these life forms, we calculated rates of photosynthesis (P) and respiration (R) 73
using equations of temperature-response previously published by Slot et al. [9] and Slot & 74
Winter [7], and our estimations of Tleaf. Our results highlight the fact that lianas are an important 75
biotic factor at the canopy level, that in turn can affect forest temperature. Therefore, their 76
differential expression in Tleaf should be considered for future predictions of forest productivity; 77
that could become a part of the challenges of including lianas in future global vegetation models 78
[30]. 79
80
2 Materials and Methods 81
2.1 Study site 82
This study was conducted in Parque Natural Metropolitano (PNM, 8° 59’ 39.95’’ N, 79° 83
32’ 34.68’’ W, 150 m a.s.l.) that is located west in Panama City on the Pacific coast of the 84
Republic of Panama. This site presents a tropical dry forest with a mean annual temperature of 85
26.5 °C and annual rainfall average of 1740 mm. In general, the region is characterized by two 86
contrasting seasons: a wet season between May and December when most of the rainfall occurs, 87
and a dry season between January and March (Fig S1). The PNM contains 265 ha of natural 88
forest reserve with an old secondary forest of 80-150 years with tree heights of up to 40 m. This 89
site has a 42 m standing crane with a 51 m long jib with a suspended cage that was used to 90
access the top of the canopy. The crane covers approximately 8,000 m2 of forest in which 65 and 91
20 species of trees and lianas can be found, respectively [31]. Using this crane, we conducted 92
Preprints (www.preprints.org) | NOT PEER-REVIEWED | Posted: 20 April 2018 doi:10.20944/preprints201804.0266.v1
Peer-reviewed version available at Forests 2018, 9, 307; doi:10.3390/f9060307
6
four data collection campaigns: November 2015, February 2016, October 2016, and February 93
2017 (two in wet and two in dry seasons). The first two campaigns were conducted during a 94
strong El Niño year (2015-2016), while the last two campaigns occur during a starting La Niña 95
year (2016-2017). 96
97
2.2 Species selection and field design 98
At the top of the canopy we selected four of the most abundant tree species that were 99
fully exposed to the sun: Anacardium excelsum (Bertero & Balb. ex Kunth), a late-successional 100
species; Annona spraguei (Saff.), a mid-successional species; Castilla elastica (Liebm.), a mid-101
successional species; and Luehea seemannii (Triana & Planch), an early-successional species. 102
We took between four and six fusion images (RGB and thermal) over two or three individuals of 103
each species with lianas and without lianas using a thermal infrared camera (FLIR T400, Oregon, 104
USA). This camera has a wavelength range between 7.3 and 13 µm, a standard calibration range 105
from -20 to 650 °C, an image of 320 x 240 pixels, and a temperature error of 2% (e.g., 2% of 30 106
°C = ±0.6 °C). The thermal imagery was acquired between 10:00 am and 12:00 pm (Fig S2) at 107
1.8 m to the leaves leading to a nominal spatial resolution of ~26.37 mm per pixel. 108
109
2.3 Estimation of the leaf temperature 110
From each thermal image acquired with the FLIR T410, we estimated the Tleaf for the 111
upper-middle region of the leaf blade from five leaves of trees and lianas (in trees with liana 112
infestation). Selected leaves did not have apparent mechanical damage or had herbivore attacks. 113
The estimation of Tleaf from the thermal images was performed using the FLIR Tools 5.12 114
software (http://www.flir.com/instruments/display/?id=51975). To compute the Tleaf, we used the 115
Preprints (www.preprints.org) | NOT PEER-REVIEWED | Posted: 20 April 2018 doi:10.20944/preprints201804.0266.v1
Peer-reviewed version available at Forests 2018, 9, 307; doi:10.3390/f9060307
7
mean relative air humidity and air temperature (Ta) recorded every 15 min by a meteorological 116
station located at the crane’s structure. These meteorological station data sets were provided by 117
the Physical Monitoring Program of the Smithsonian Tropical Research Institute. Likewise, we 118
used the same value of Ta as a reflected temperature (or commonly known as background 119
radiance) to compute the Tleaf; due to high emissivity and closed objects allow accurate 120
temperature measurements in almost any background radiance conditions [32]. In addition, to 121
compute Tleaf, the emissivity of leaves for the four tree species and seven liana morpho-species 122
was estimated in February 2017. The calculation of the Tleaf for lianas was performed using the 123
mean value of emissivity (0.983) estimated for this life form, while the calculation for leaves of 124
trees was conducted using the mean value of emissivity determined for each species. The 125
estimation of the leaf emissivity is described in the next section. 126
Following the estimation of Tleaf, we compute the displayed leaf temperature (Td) for each 127
leaf as the difference of Tleaf - Ta. For its nature, Td can show positive and negative values, where 128
positive values describe hottest leaves and negative values cooler leaves according to the 129
surrounding environment. This calculation was conducted as a parameter that can allow us to 130
reduce the temporal variation of the ambient temperature between seasons and years. These 131
values of Td were used later to perform the statistical comparisons below. 132
133
2.4 Estimations of photosynthesis and leaf respiration 134
We calculated the leaf photosynthesis (P, μmol CO2 m−2 s−1) and leaf dark respiration (R, 135
μmol CO2 m−2 s−1) to show that despite the similar physiological–temperature behavior of these 136
life forms [7], differences in leaf temperature combined with the physiological performance can 137
produce different estimations of productivity for these functional groups at the leaf level. These 138
Preprints (www.preprints.org) | NOT PEER-REVIEWED | Posted: 20 April 2018 doi:10.20944/preprints201804.0266.v1
Peer-reviewed version available at Forests 2018, 9, 307; doi:10.3390/f9060307
8
gas exchange traits were estimated using the equations and parameters published by Slot & 139
Winter [7] (See Equ. 1) and derived from Slot et al. [9] (See Equ. 2) for the species of trees and 140
lianas of this study: 141
푃 = 푃 ×푒
(1) 142
푅 =푅 ×푄( )/
(2) 143
144
where Popt is the maximum rate of photosynthesis at an optimum temperature (Topt), Ω represent 145
the difference in temperature between Topt and the temperature in which P drops to e-1 (37%) of 146
its value at Topt, R25 is the leaf respiration at 25 ºC, Q10 is the proportional increase in R with a 10 147
ºC temperature rise, and Tleaf is our actual measurements of leaf temperature using thermography. 148
Because we do not make an identification of lianas species, we estimate the gas exchange traits 149
using the mean values reported by [7] and [9] as a functional group. Likewise, for the case of A. 150
excelsum, we estimated P by the published values for Parque Nacional San Lorenzo, Panama. 151
Using the selected leaves for our second hypothesis, we solved these equations assuming that the 152
kinetic leaf temperature is equal to our estimation of Tleaf. This aims to simulate the productivity 153
at leaf level based on the surface canopy temperature that it is commonly used by most of the 154
TBMs. 155
Although studies have reported a significant variation in photosynthesis and respiration 156
performance of lianas and trees between seasons [28], we conduct these calculations assuming a 157
lack of seasonal variation in the physiological behavior. From the values of P and R extracted 158
above, we calculate the normalized differences based on each species of host tree following: 159
160
NormalizedPorR =
(3) 161
Preprints (www.preprints.org) | NOT PEER-REVIEWED | Posted: 20 April 2018 doi:10.20944/preprints201804.0266.v1
Peer-reviewed version available at Forests 2018, 9, 307; doi:10.3390/f9060307
9
162
This latter calculation was implemented to reduce the temporal variation of leaf temperature 163
which can produce erroneous interpretations from the comparisons of P and R across seasons and 164
ENSO years. The resulted values from this normalization are unitless, and the magnitude of their 165
variation can be compared between life forms, seasons, and ENSO years. 166
167
2.5 Data analysis 168
To address our hypotheses, we used linear mixed-effect models to compare the variability 169
of the Td according to the season, ENSO year and: i) the presence of lianas on the Td of trees, or 170
ii) differences between leaf type (liana and tree) on the Td. On average, more than 240 samples 171
were used in each analysis (Table S1 and Table S2). Due to the hierarchical nature of our design, 172
linear mixed-effect models that combine fixed and random components [33] were used to reduce 173
the “random” factors that we cannot control in the field such as micro-climatic variations on 174
leaves or the health of the individuals. Specifically, our model can be described by the following 175
equation: 176
177
푇 = 훼 +훽 + 푆푒푎푠표푛 + 퐸푁푆푂 +훽 × 푆푒푎푠표푛 + 훽 × 퐸푁푆푂 + 푆푒푎푠표푛 ×178
퐸푁푆푂 + 훽 × 푆푒푎푠표푛 × 퐸푁푆푂 + 푎 | + 푒 (4) 179
180
where α represents the intercept, β1 the presence of lianas for our first hypothesis and the leaf 181
type for our second hypothesis, e the unexplained error, and a the random factor which is 182
affected by each thermal image (i) nested within each individual (j). Likewise, we applied this 183
same analysis to compare the variations of the normalized differences of P and R using these 184
Preprints (www.preprints.org) | NOT PEER-REVIEWED | Posted: 20 April 2018 doi:10.20944/preprints201804.0266.v1
Peer-reviewed version available at Forests 2018, 9, 307; doi:10.3390/f9060307
10
parameters as response variables and β1 as leaf type. These analyses were performed using the 185
nlme package [34] under the open-source statistical software R version 3.3.1 [35]. Box-Cox 186
transformations were performed when the normality of the data was not reached. 187
188
3 Results 189
3.1 Leaf temperature of trees with and without lianas 190
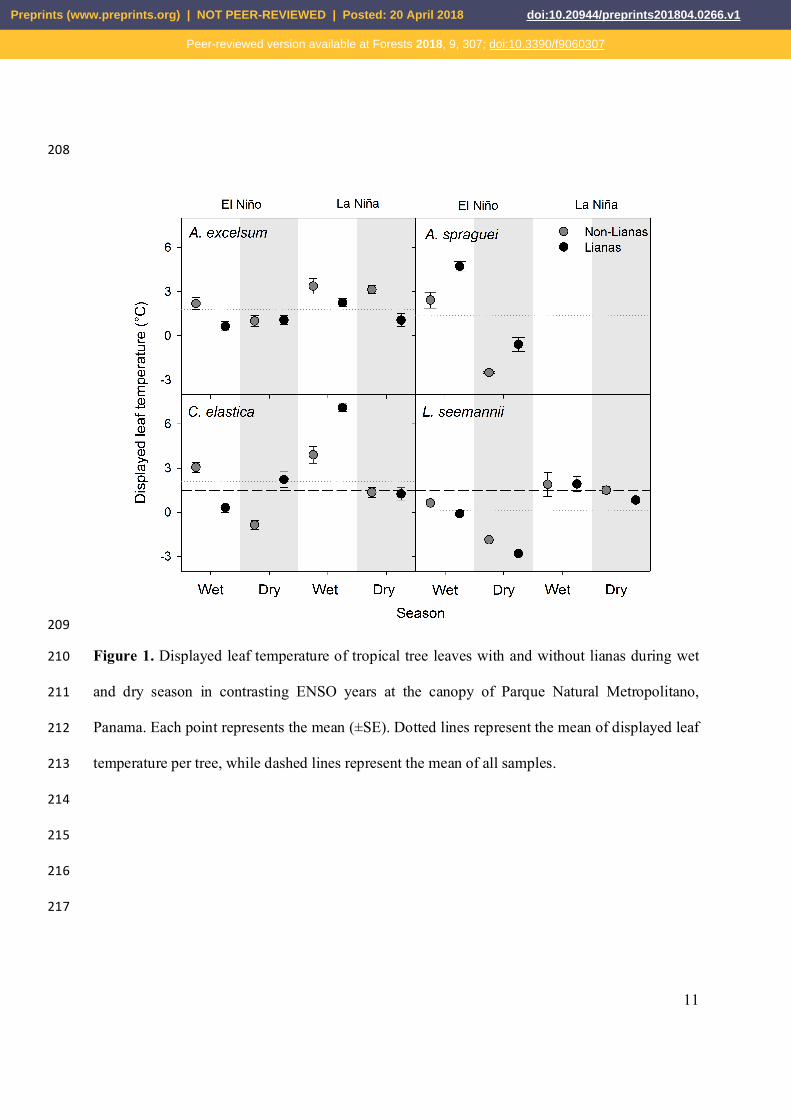
The intra-specific comparison of Td in each of our four tree species between leaves of 191
trees with and without lianas suggest that the presence of lianas does not affect the Td of host 192
trees across seasons or ENSO years during our measurement times (Table 1). In general, tree 193
species with and without lianas showed values of Td in a range of -4.11 ºC and 9.91 ºC with 194
mean values close to 1.48 ± 2.99 ºC (sd) (Fig. 1). Regardless of the tree species, season, or 195
ENSO year, trees without lianas showed values of Td of 1.39 ºC on average (sd ± 2.84), while 196
trees with lianas showed values of Td of 1.57 ºC (sd ± 3.14). As such trees with lianas were 197
12.94% hotter than trees without lianas based on the average value, but this difference was not 198
significant. At the species level, the lowest values of Td (-2.81 ± 0.58 ºC) was observed for L. 199
seemanni trees measured in the dry season of an El Niño year, while trees of C. elastica with 200
lianas showed the highest values of Td (7.10 ± 1.54 ºC) in the wet season of La Niña year. Across 201
seasons and ENSO years, A. excelsum trees without lianas tended to have slightly higher values 202
of Td than trees of the same species with lianas. Conversely, during an El Niño year trees without 203
lianas of A. spraguei had marginally lower values of Td than trees with lianas; however, both 204
trends are not significant. Trees of L. seemanni and A. excelsum with and without lianas showed 205
the most contrasting—albeit non-significant—trends between years, with leaves during El Niño 206
year showing lower values of Td than during La Niña year. 207
Preprints (www.preprints.org) | NOT PEER-REVIEWED | Posted: 20 April 2018 doi:10.20944/preprints201804.0266.v1
Peer-reviewed version available at Forests 2018, 9, 307; doi:10.3390/f9060307
11
208
209
Figure 1. Displayed leaf temperature of tropical tree leaves with and without lianas during wet 210
and dry season in contrasting ENSO years at the canopy of Parque Natural Metropolitano, 211
Panama. Each point represents the mean (±SE). Dotted lines represent the mean of displayed leaf 212
temperature per tree, while dashed lines represent the mean of all samples. 213
214
215
216
217
Preprints (www.preprints.org) | NOT PEER-REVIEWED | Posted: 20 April 2018 doi:10.20944/preprints201804.0266.v1
Peer-reviewed version available at Forests 2018, 9, 307; doi:10.3390/f9060307
12
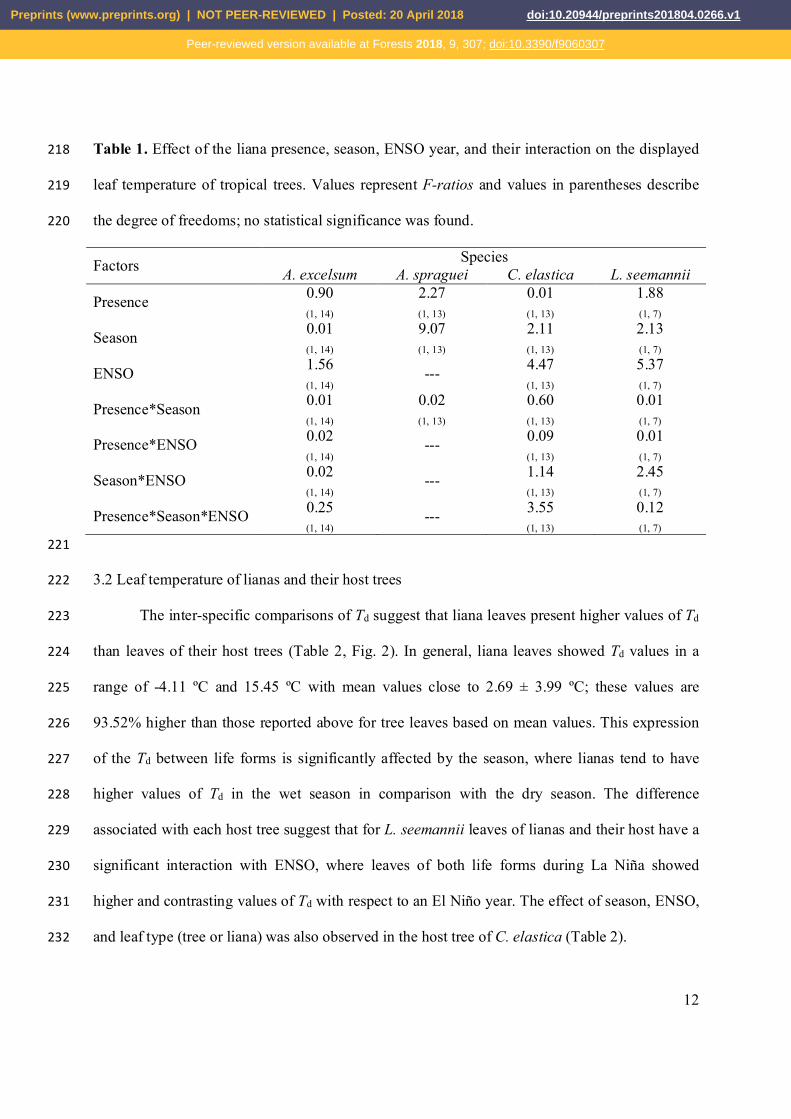
Table 1. Effect of the liana presence, season, ENSO year, and their interaction on the displayed 218
leaf temperature of tropical trees. Values represent F-ratios and values in parentheses describe 219
the degree of freedoms; no statistical significance was found. 220
Factors Species A. excelsum A. spraguei C. elastica L. seemannii
Presence 0.90 (1, 14)
2.27 (1, 13)
0.01 (1, 13)
1.88 (1, 7)
Season 0.01 (1, 14)
9.07 (1, 13)
2.11 (1, 13)
2.13 (1, 7)
ENSO 1.56 (1, 14)
--- 4.47 (1, 13)
5.37 (1, 7)
Presence*Season 0.01 (1, 14)
0.02 (1, 13)
0.60 (1, 13)
0.01 (1, 7)
Presence*ENSO 0.02 (1, 14)
--- 0.09 (1, 13)
0.01 (1, 7)
Season*ENSO 0.02 (1, 14)
--- 1.14 (1, 13)
2.45 (1, 7)
Presence*Season*ENSO 0.25 (1, 14)
--- 3.55 (1, 13)
0.12 (1, 7)
221
3.2 Leaf temperature of lianas and their host trees 222
The inter-specific comparisons of Td suggest that liana leaves present higher values of Td 223
than leaves of their host trees (Table 2, Fig. 2). In general, liana leaves showed Td values in a 224
range of -4.11 ºC and 15.45 ºC with mean values close to 2.69 ± 3.99 ºC; these values are 225
93.52% higher than those reported above for tree leaves based on mean values. This expression 226
of the Td between life forms is significantly affected by the season, where lianas tend to have 227
higher values of Td in the wet season in comparison with the dry season. The difference 228
associated with each host tree suggest that for L. seemannii leaves of lianas and their host have a 229
significant interaction with ENSO, where leaves of both life forms during La Niña showed 230
higher and contrasting values of Td with respect to an El Niño year. The effect of season, ENSO, 231
and leaf type (tree or liana) was also observed in the host tree of C. elastica (Table 2). 232
Preprints (www.preprints.org) | NOT PEER-REVIEWED | Posted: 20 April 2018 doi:10.20944/preprints201804.0266.v1
Peer-reviewed version available at Forests 2018, 9, 307; doi:10.3390/f9060307

13
233
234
Figure 2. Displayed leaf temperature of lianas and their host tree in four tree species during wet 235
and dry season in contrasting ENSO years at the canopy of Parque Natural Metropolitano, 236
Panama. Each point represents the mean (±SE). Dotted lines represent the mean of displayed leaf 237
temperature per host tree, while dashed lines represent the mean of all samples. 238
239
240
241
242
Preprints (www.preprints.org) | NOT PEER-REVIEWED | Posted: 20 April 2018 doi:10.20944/preprints201804.0266.v1
Peer-reviewed version available at Forests 2018, 9, 307; doi:10.3390/f9060307
14
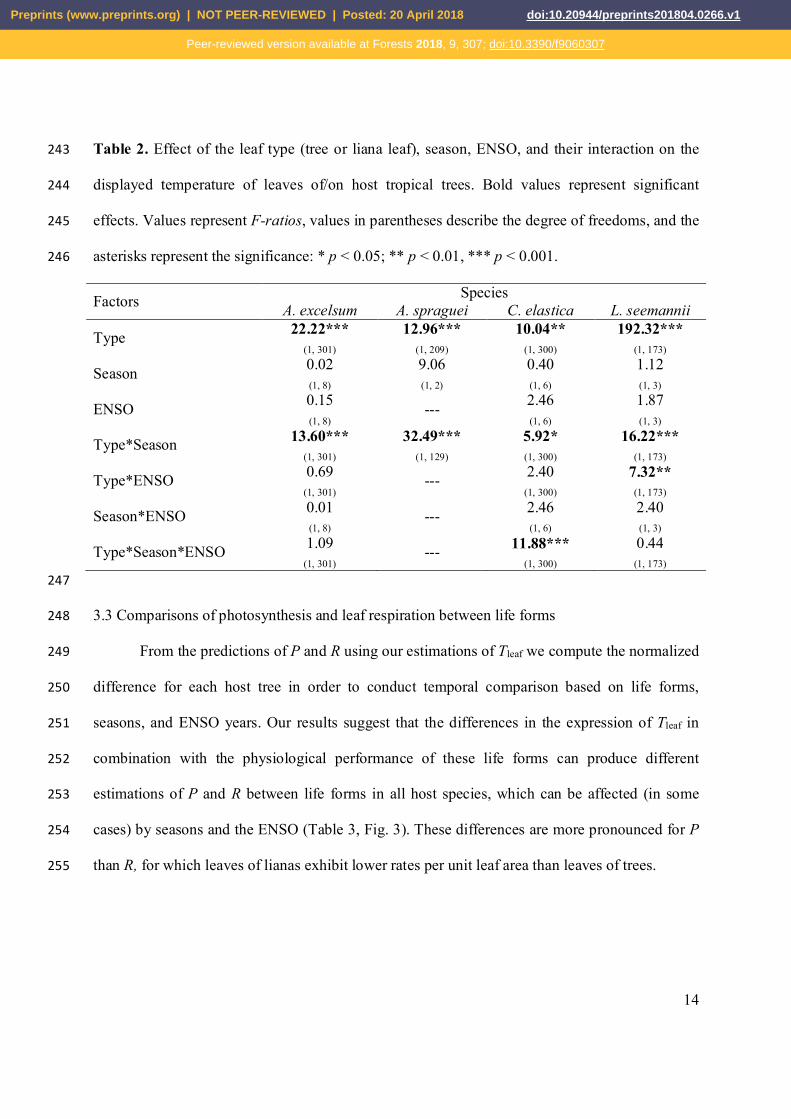
Table 2. Effect of the leaf type (tree or liana leaf), season, ENSO, and their interaction on the 243
displayed temperature of leaves of/on host tropical trees. Bold values represent significant 244
effects. Values represent F-ratios, values in parentheses describe the degree of freedoms, and the 245
asterisks represent the significance: * p < 0.05; ** p < 0.01, *** p < 0.001. 246
Factors Species A. excelsum A. spraguei C. elastica L. seemannii
Type 22.22*** (1, 301)
12.96*** (1, 209)
10.04** (1, 300)
192.32*** (1, 173)
Season 0.02 (1, 8)
9.06 (1, 2)
0.40 (1, 6)
1.12 (1, 3)
ENSO 0.15 (1, 8)
--- 2.46 (1, 6)
1.87 (1, 3)
Type*Season 13.60*** (1, 301)
32.49*** (1, 129)
5.92* (1, 300)
16.22*** (1, 173)
Type*ENSO 0.69 (1, 301)
--- 2.40 (1, 300)
7.32** (1, 173)
Season*ENSO 0.01 (1, 8)
--- 2.46 (1, 6)
2.40 (1, 3)
Type*Season*ENSO 1.09 (1, 301)
--- 11.88*** (1, 300)
0.44 (1, 173)
247
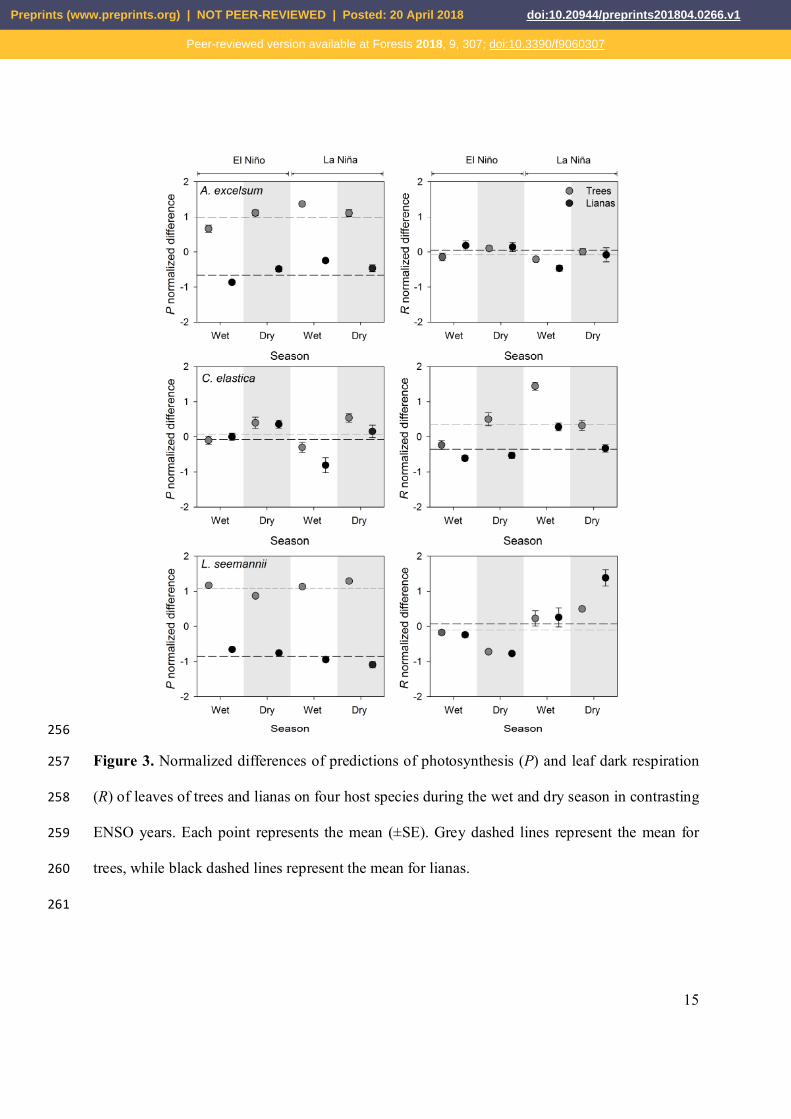
3.3 Comparisons of photosynthesis and leaf respiration between life forms 248
From the predictions of P and R using our estimations of Tleaf we compute the normalized 249
difference for each host tree in order to conduct temporal comparison based on life forms, 250
seasons, and ENSO years. Our results suggest that the differences in the expression of Tleaf in 251
combination with the physiological performance of these life forms can produce different 252
estimations of P and R between life forms in all host species, which can be affected (in some 253
cases) by seasons and the ENSO (Table 3, Fig. 3). These differences are more pronounced for P 254
than R, for which leaves of lianas exhibit lower rates per unit leaf area than leaves of trees. 255
Preprints (www.preprints.org) | NOT PEER-REVIEWED | Posted: 20 April 2018 doi:10.20944/preprints201804.0266.v1
Peer-reviewed version available at Forests 2018, 9, 307; doi:10.3390/f9060307
15
256
Figure 3. Normalized differences of predictions of photosynthesis (P) and leaf dark respiration 257
(R) of leaves of trees and lianas on four host species during the wet and dry season in contrasting 258
ENSO years. Each point represents the mean (±SE). Grey dashed lines represent the mean for 259
trees, while black dashed lines represent the mean for lianas. 260
261
Preprints (www.preprints.org) | NOT PEER-REVIEWED | Posted: 20 April 2018 doi:10.20944/preprints201804.0266.v1
Peer-reviewed version available at Forests 2018, 9, 307; doi:10.3390/f9060307
16
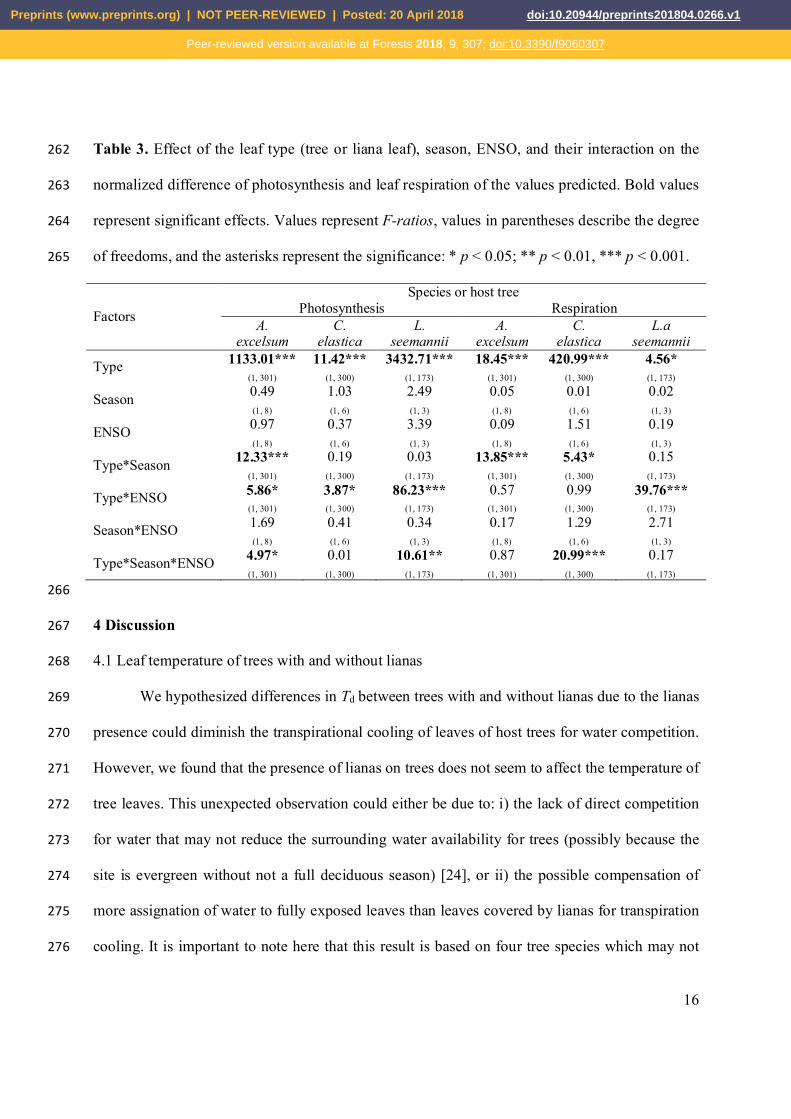
Table 3. Effect of the leaf type (tree or liana leaf), season, ENSO, and their interaction on the 262
normalized difference of photosynthesis and leaf respiration of the values predicted. Bold values 263
represent significant effects. Values represent F-ratios, values in parentheses describe the degree 264
of freedoms, and the asterisks represent the significance: * p < 0.05; ** p < 0.01, *** p < 0.001. 265
Factors
Species or host tree Photosynthesis Respiration
A. excelsum
C. elastica
L. seemannii
A. excelsum
C. elastica
L.a seemannii
Type 1133.01*** (1, 301)
11.42*** (1, 300)
3432.71*** (1, 173)
18.45*** (1, 301)
420.99*** (1, 300)
4.56* (1, 173)
Season 0.49 (1, 8)
1.03 (1, 6)
2.49 (1, 3)
0.05 (1, 8)
0.01 (1, 6)
0.02 (1, 3)
ENSO 0.97 (1, 8)
0.37 (1, 6)
3.39 (1, 3)
0.09 (1, 8)
1.51 (1, 6)
0.19 (1, 3)
Type*Season 12.33*** (1, 301)
0.19 (1, 300)
0.03 (1, 173)
13.85*** (1, 301)
5.43* (1, 300)
0.15 (1, 173)
Type*ENSO 5.86* (1, 301)
3.87* (1, 300)
86.23*** (1, 173)
0.57 (1, 301)
0.99 (1, 300)
39.76*** (1, 173)
Season*ENSO 1.69 (1, 8)
0.41 (1, 6)
0.34 (1, 3)
0.17 (1, 8)
1.29 (1, 6)
2.71 (1, 3)
Type*Season*ENSO 4.97* (1, 301)
0.01 (1, 300)
10.61** (1, 173)
0.87 (1, 301)
20.99*** (1, 300)
0.17 (1, 173)
266
4 Discussion 267
4.1 Leaf temperature of trees with and without lianas 268
We hypothesized differences in Td between trees with and without lianas due to the lianas 269
presence could diminish the transpirational cooling of leaves of host trees for water competition. 270
However, we found that the presence of lianas on trees does not seem to affect the temperature of 271
tree leaves. This unexpected observation could either be due to: i) the lack of direct competition 272
for water that may not reduce the surrounding water availability for trees (possibly because the 273
site is evergreen without not a full deciduous season) [24], or ii) the possible compensation of 274
more assignation of water to fully exposed leaves than leaves covered by lianas for transpiration 275
cooling. It is important to note here that this result is based on four tree species which may not 276
Preprints (www.preprints.org) | NOT PEER-REVIEWED | Posted: 20 April 2018 doi:10.20944/preprints201804.0266.v1
Peer-reviewed version available at Forests 2018, 9, 307; doi:10.3390/f9060307
17
cover the whole spectrum of liana-trees relationship. For example, Visser et al. [37] suggest that 277
liana infestation can have negative effects on tree population growth rates; however, this effect is 278
more harmful to fast-growing species than slow-growing species. Therefore, we can not exclude 279
the possibility that lianas could have an effect on leaf temperature on trees of others life history 280
groups, or even other sites. Likewise, it is important to note that in our study we use the presence 281
and absence of lianas on trees; that is why we consider that the density and extent of lianas on 282
tree crowns may influence that host tree performance and should be examined in the future. 283
284
4.2 Leaf temperature of trees and lianas 285
We hypothesized that leaves of lianas might have lower temperatures in comparison with 286
their host tree due to their greater competitive advance on the acquisition, regulation, and 287
efficient use of water as compared with trees. By contrast, our results suggest that liana leaves 288
have considerably higher values of Td than tree leaves. This result reinforces previous 289
observations conducted on few leaves of three species of trees and two species of lianas using 290
thermocouples [38]. Although the aim of this study was not to determinate which are the biotic 291
drivers that can lead to differences in Td between life forms, it is clear that several factors can 292
influence Tleaf, such as leaf size [39], leaf inclination [40], anatomical traits [41], or the presence 293
of photo-protection pigments. Although we do not have direct measurements of leaf inclination 294
associated with our Td estimations, perhaps the leaf angle distribution of liana leaves on the 295
canopy facing the sun more directly may contribute to the highest Td. As Rey-Sánchez et al. [42] 296
pointed out, leaves that are facing the sun more directly have shown to have higher solar 297
irradiation that strongly affects the Tleaf. On the other hand, the higher values of Td of lianas could 298
be related to the stomatal control. A recent study conducted in a botanical garden in China 299
Preprints (www.preprints.org) | NOT PEER-REVIEWED | Posted: 20 April 2018 doi:10.20944/preprints201804.0266.v1
Peer-reviewed version available at Forests 2018, 9, 307; doi:10.3390/f9060307
18
suggests that lianas tend to have earlier stomatal closure in comparison to trees to reduce the 300
water transpiration close to noon [43]. If this pattern occurs at the forest canopy of the PNM, it is 301
expected that lianas would present higher values of temperature associated with the physiological 302
regulation, which could be detected using thermography [44]. Moreover, the differences Td 303
between life forms could be associated with the highest concentration of photo-protection 304
pigments in trees in comparison with lianas [45]. Currently, there is strong evidence that the 305
presence of pho-protection pigments is associated with the efficiency of thermal dissipation of 306
the excess of energy from light stress environments such as the canopies [46,47]. Therefore, it 307
could be expected that such differences in photo-protection pigments between life forms 308
influence the efficiency of thermal dissipation and the Td. 309
310
4.3 Effect of the temperature on photosynthesis and respiration of lianas and trees 311
Although lianas have a similar physiological–temperature response compared to trees 312
[7,9,22], higher displayed temperatures of lianas would have significant implications for future 313
TBMs. Specifically, in a future scenario of modelling in which there is a lack of seasonal 314
variation in the physiological behavior of leaves and the differences in leaf temperature between 315
these life forms are not taken into consideration, predictions of productivity of lianas could be 316
underestimated in comparison to trees, mainly regarding photosynthesis. Although our 317
calculations of gas exchange are based on Tleaf at noon, differences in Tleaf through the day could 318
have a major role in diurnal courses of productivity between life forms. A daily course of Tleaf of 319
leaves of lianas and trees has been reported by Sánchez-Azofeifa et al. [38] suggesting liana 320
leaves had higher overall temperatures than tree leaves. The Sánchez-Azofeifa et al. [38] and our 321
trends of Tleaf between life forms together with their physiological sensitivity to the temperature 322
Preprints (www.preprints.org) | NOT PEER-REVIEWED | Posted: 20 April 2018 doi:10.20944/preprints201804.0266.v1
Peer-reviewed version available at Forests 2018, 9, 307; doi:10.3390/f9060307
19
may lead to different expectations of productivity of lianas and trees. Therefore, future models 323
should thus consider differences in leaf thermo-regulation between these life forms in order to 324
achieve robust predictions of productivity. 325
326
4.4 Conclusion 327
Currently, there is a strong need to understand the variations of abiotic factors that can 328
affect the forest productivity [1]. Like Slot & Winter [7] pointed out, in the absence of a solid 329
understanding of the abiotic controls over physiological processes such as temperature, future 330
predictions of productivity will remain speculative. We have shown that the presence of lianas 331
may not affect the leaf temperature of their host trees; however, lianas leaves tend to have higher 332
values of temperature than their host trees. Our results highlight these differences in the 333
expression of the temperature of lianas as an important biotic factor at canopy levels that can 334
influence the forest temperature; therefore, their differential expression may have a significant 335
weight in future predictions of forest productivity. We consider that future studies should explore 336
the spatial variability of liana leaf temperature between forest strata such as in trees [42], and 337
consider the differential expression of leaf temperature between life forms in order to predict the 338
productivity of ecosystems. Likewise, future studies should explore this differential expression 339
of leaf temperature in other regions such as wet forest, where species present lower thermal 340
optima of photosynthesis [7], in order to know if the magnitude and direction of this expression 341
vary among environments. 342
343
Supplementary Materials 344
345
Preprints (www.preprints.org) | NOT PEER-REVIEWED | Posted: 20 April 2018 doi:10.20944/preprints201804.0266.v1
Peer-reviewed version available at Forests 2018, 9, 307; doi:10.3390/f9060307
20
Fig S1. Monthly total precipitation and average monthly temperature during wet and dry seasons 346
in contrasting ENSO years at Parque Natural Metropolitano, Panama. 347
Fig. S2. Mean values of temperature (red lines) and relative humidity (blue lines) during the days 348
of data collection according to the meteorological station on the crane at Parque Natural 349
Metropolitano, Panama. 350
Table S1. Number of leaves measured to address the first hypothesis during the wet and dry 351
season in contrasting ENSO years at the canopy of Parque Natural Metropolitano, Panama. 352
Table S2. Number of leaves measured to address the second hypothesis during the wet and dry 353
season in contrasting ENSO years at the canopy of Parque Natural Metropolitano, Panama. 354
355
Acknowledgements 356
We thank S. Joseph Wright for previous discussions of the experimental design. Likewise, we 357
are grateful to Edwin Andrades for operating the canopy crane. We thanks to Martijn Slot who 358
provided valuable comments and recommendations to early versions of this manuscript. This 359
work was carried out with the aid of a grant from the Inter-American Institute for Global Change 360
Research (IAI) Collaborative Research Network CRN3-025, and the support from the National 361
Science and Engineering Research Council of Canada (NSERC) Discovery Grant program. JAG 362
receives funding from a Vanier Canada Graduate Scholarship from the NSERC. We 363
acknowledge the support of STRI from Physical Monitoring Program for the data sets provided. 364
365
Author Contributions 366
Preprints (www.preprints.org) | NOT PEER-REVIEWED | Posted: 20 April 2018 doi:10.20944/preprints201804.0266.v1
Peer-reviewed version available at Forests 2018, 9, 307; doi:10.3390/f9060307
21
A.S.A conceived and designed the field data collection at the crane. J.A.G. processed and 367
analyzed the data and drafted the manuscript. A.S.A. and B.R. helped with the interpretation and 368
revision of the manuscript. All authors read and approved the manuscript. 369
370
Conflicts of Interest 371
The authors declare no conflict of interest. The founding sponsors had no role in the design of 372
the study; in the collection, analyses, or interpretation of data; in the writing of the manuscript, 373
and in the decision to publish the results. 374
375
References 376
1. Rogers, A.; Medlyn, B. E.; Dukes, J. S.; Bonan, G.; von Caemmerer, S.; Dietze, M. C.; 377
Kattge, J.; Leakey, A. D. B.; Mercado, L. M.; Niinemets, Ü.; Prentice, I. C.; Serbin, S. P.; 378
Sitch, S.; Way, D. A.; Zaehle, S. A roadmap for improving the representation of 379
photosynthesis in Earth system models. New Phytol. 2017, 213, 22–42, 380
doi:10.1111/nph.14283. 381
2. Leuzinger, S.; Körner, C. Tree species diversity affects canopy leaf temperatures in a 382
mature temperate forest. Agric. For. Meteorol. 2007, 146, 29–37, 383
doi:http://dx.doi.org/10.1016/j.agrformet.2007.05.007. 384
3. Jones, H. G. Use of thermography for quantitative studies of spatial and temporal variation 385
of stomatal conductance over leaf surfaces. Plant. Cell Environ. 1999, 22, 1043–1055, 386
doi:10.1046/j.1365-3040.1999.00468.x. 387
4. Dai, Y.; Dickinson, R. E.; Wang, Y.-P. A two-big-leaf model for canopy temperature, 388
photosynthesis, and stomatal conductance. J. Clim. 2004, 17, 2281–2299, 389
Preprints (www.preprints.org) | NOT PEER-REVIEWED | Posted: 20 April 2018 doi:10.20944/preprints201804.0266.v1
Peer-reviewed version available at Forests 2018, 9, 307; doi:10.3390/f9060307
22
doi:10.1175/1520-0442(2004)017<2281:ATMFCT>2.0.CO;2. 390
5. Meinzer, F. C.; Andrade, J. L.; Goldstein, G.; Holbrook, N. M.; Cavelier, J.; Jackson, P. 391
Control of transpiration from the upper canopy of a tropical forest: the role of stomatal, 392
boundary layer and hydraulic architecture components. Plant. Cell Environ. 1997, 20, 393
1242–1252, doi:10.1046/j.1365-3040.1997.d01-26.x. 394
6. Vargas, G.; Cordero, R. A. Photosynthetic responses to temperature of two tropical 395
rainforest tree species from Costa Rica. Trees 2013, 27, 1261–1270, doi:10.1007/s00468-396
013-0874-0. 397
7. Slot, M.; Winter, K. In situ temperature response of photosynthesis of 42 tree and liana 398
species in the canopy of two Panamanian lowland tropical forests with contrasting rainfall 399
regimes. New Phytol. 2017, 214, 1103–1117, doi:10.1111/nph.14469. 400
8. Slot, M.; Garcia, M. N.; Winter, K. Temperature response of CO2 exchange in three 401
tropical tree species. Funct. Plant Biol. 2016, 43, 468–478. 402
9. Slot, M.; Wright, S. J.; Kitajima, K. Foliar respiration and its temperature sensitivity in 403
trees and lianas: in situ measurements in the upper canopy of a tropical forest. Tree 404
Physiol. 2013, 33, 505–515, doi:10.1093/treephys/tpt026. 405
10. Slot, M.; Rey-Sánchez, C.; Winter, K.; Kitajima, K. Trait-based scaling of temperature-406
dependent foliar respiration in a species-rich tropical forest canopy. Funct. Ecol. 2014, 28, 407
1074–1086, doi:10.1111/1365-2435.12263. 408
11. Lin, D.; Xia, J.; Wan, S. Climate warming and biomass accumulation of terrestrial plants: 409
a meta-analysis. New Phytol. 2010, 188, 187–198, doi:10.1111/j.1469-8137.2010.03347.x. 410
12. Durán, S. M.; Sánchez-Azofeifa, G. A.; Rios, R. S.; Gianoli, E. The relative importance of 411
climate, stand variables and liana abundance for carbon storage in tropical forests. Glob. 412
Preprints (www.preprints.org) | NOT PEER-REVIEWED | Posted: 20 April 2018 doi:10.20944/preprints201804.0266.v1
Peer-reviewed version available at Forests 2018, 9, 307; doi:10.3390/f9060307
23
Ecol. Biogeogr. 2015, 24, 939–949, doi:10.1111/geb.12304. 413
13. DeWalt, S. J.; Chave, J. Structure and biomass of four lowland Neotropical forests. 414
Biotropica 2004, 36, 7–19. 415
14. Londré, R.; Schnitzer, S. The distribution of lianas and their change in abundance in 416
temperate forests over the past 45 years. Ecology 2006, 87, 2973–2978, doi:10.1890/0012-417
9658(2006)87[2973:TDOLAT]2.0.CO;2. 418
15. Phillips, O. L.; Vasquez Martinez, R.; Arroyo, L.; Baker, T. R.; Killeen, T.; Lewis, S. L.; 419
Malhi, Y.; Monteagudo Mendoza, A.; Neill, D.; Nunez Vargas, P.; Alexiades, M.; Ceron, 420
C.; Di Fiore, A.; Erwin, T.; Jardim, A.; Palacios, W.; Saldias, M.; Vinceti, B. Increasing 421
dominance of large lianas in Amazonian forests. Nature 2002, 418, 770–774. 422
16. Schnitzer, S. A mechanistic explanation for global patterns of liana abundance and 423
distribution. Am. Nat. 2005, 166, 262–276, doi:10.1086/431250. 424
17. Schnitzer, S. Increasing liana abundance in neotropical forests: causes and consequences. 425
In Ecology of Lianas; John Wiley & Sons, Ltd, 2015; pp. 451–464 ISBN 9781118392409. 426
18. Martínez-Izquierdo, L.; García, M. M.; Powers, J. S.; Schnitzer, S. A. Lianas suppress 427
seedling growth and survival of 14 tree species in a Panamanian tropical forest. Ecology 428
2016, 97, 215–224, doi:10.1890/14-2261.1. 429
19. Schnitzer, S. A.; Carson, W. P. Lianas suppress tree regeneration and diversity in treefall 430
gaps. Ecol. Lett. 2010, 13, 849–857, doi:10.1111/j.1461-0248.2010.01480.x. 431
20. Durán, S. M.; Gianoli, E. Carbon stocks in tropical forests decrease with liana density. 432
Biol. Lett. 2013, 9, 20130301. 433
21. Verbeeck, H.; Kearsley, E. The importance of including lianas in global vegetation 434
models. Proc. Natl. Acad. Sci. 2016, 113, E4–E4, doi:10.1073/pnas.1521343113. 435
Preprints (www.preprints.org) | NOT PEER-REVIEWED | Posted: 20 April 2018 doi:10.20944/preprints201804.0266.v1
Peer-reviewed version available at Forests 2018, 9, 307; doi:10.3390/f9060307
24
22. Slot, M.; Rey-Sánchez, C.; Gerber, S.; Lichstein, J. W.; Winter, K.; Kitajima, K. Thermal 436
acclimation of leaf respiration of tropical trees and lianas: response to experimental 437
canopy warming, and consequences for tropical forest carbon balance. Glob. Chang. Biol. 438
2014, 20, 2915–2926, doi:10.1111/gcb.12563. 439
23. Rodríguez-Ronderos, M. E.; Bohrer, G.; Sanchez-Azofeifa, A.; Powers, J. S.; Schnitzer, S. 440
A. Contribution of lianas to plant area index and canopy structure in a Panamanian forest. 441
Ecology 2016, 97, 3271–3277, doi:10.1002/ecy.1597. 442
24. Chen, Y.-J.; Cao, K.-F.; Schnitzer, S. A.; Fan, Z.-X.; Zhang, J.-L.; Bongers, F. Water-use 443
advantage for lianas over trees in tropical seasonal forests. New Phytol. 2015, 205, 128–444
136, doi:10.1111/nph.13036. 445
25. Ichihashi, R.; Chiu, C.-W.; Komatsu, H.; Kume, T.; Shinohara, Y.; Tateishi, M.; Tsuruta, 446
K.; Otsuki, K. Contribution of lianas to community-level canopy transpiration in a warm-447
temperate forest. Funct. Ecol. 2017, 31, 1690–1699, doi:10.1111/1365-2435.12881. 448
26. Lin, H.; Chen, Y.; Zhang, H.; Fu, P.; Fan, Z. Stronger cooling effects of transpiration and 449
leaf physical traits of plants from a hot dry habitat than from a hot wet habitat. Funct. 450
Ecol. 2017, doi:10.1111/1365-2435.12923. 451
27. De Guzman, M. E.; Santiago, L. S.; Schnitzer, S. A.; Álvarez-Cansino, L. Trade-offs 452
between water transport capacity and drought resistance in neotropical canopy liana and 453
tree species. Tree Physiol. 2016, 0, 1–11, doi:10.1093/treephys/tpw086. 454
28. Cai, Z.-Q.; Schnitzer, S. A.; Bongers, F. Seasonal differences in leaf-level physiology give 455
lianas a competitive advantage over trees in a tropical seasonal forest. Oecologia 2009, 456
161, 25–33, doi:10.1007/s00442-009-1355-4. 457
29. Zhu, S.-D.; Cao, K.-F. Hydraulic properties and photosynthetic rates in co-occurring 458
Preprints (www.preprints.org) | NOT PEER-REVIEWED | Posted: 20 April 2018 doi:10.20944/preprints201804.0266.v1
Peer-reviewed version available at Forests 2018, 9, 307; doi:10.3390/f9060307
25
lianas and trees in a seasonal tropical rainforest in southwestern China. Plant Ecol. 2009, 459
204, 295–304, doi:10.1007/s11258-009-9592-5. 460
30. Schnitzer, S. A.; van der Heijden, G. M. F.; Powers, J. S. Reply to Verbeeck and Kearsley: 461
Addressing the challenges of including lianas in global vegetation models. Proc. Natl. 462
Acad. Sci. 2016, 113, E5–E6, doi:10.1073/pnas.1521823113. 463
31. Avalos, G.; Mulkey, S. S. Seasonal changes in liana cover in the upper canopy of a 464
neotropical dry forest. Biotropica 1999, 31, 186–192, doi:10.2307/2663973. 465
32. Usamentiaga, R.; Venegas, P.; Guerediaga, J.; Vega, L.; Molleda, J.; Bulnes, F. G. 466
Infrared thermography for temperature measurement and non-destructive testing. Sensors 467
2014, 14, 12305–12348, doi:10.3390/s140712305. 468
33. Zuur, A. F.; Ieno, E. N.; Walker, N. J.; Saveliev, A. A.; Smith, G. M. Mixed effects models 469
and extensions in ecology with R; Springer Science and Business Media: New York, NY, 470
USA, 2009; 471
34. Pinheiro, J.; Bates, D.; DebRoy, S.; Sarkar, D.; R Development Core Team nlme: linear 472
and nonlinear mixed effects models Available online: http://cran.r-473
project.org/package=nlme. 474
35. R Development Core Team R: a language and environment for statistical computing. R 475
Found. Stat. Comput. 2017, 1, 409. 476
36. Visser, M. D.; Schnitzer, S. A.; Muller-Landau, H. C.; Jongejans, E.; de Kroon, H.; 477
Comita, L. S.; Hubbell, S. P.; Wright, S. J. Tree species vary widely in their tolerance for 478
liana infestation: A case study of differential host response to generalist parasites. J. Ecol. 479
2017, On-line, doi:10.1111/1365-2745.12815. 480
37. Visser, M. D.; Schnitzer, S. A.; Muller-Landau, H. C.; Jongejans, E.; de Kroon, H.; 481
Preprints (www.preprints.org) | NOT PEER-REVIEWED | Posted: 20 April 2018 doi:10.20944/preprints201804.0266.v1
Peer-reviewed version available at Forests 2018, 9, 307; doi:10.3390/f9060307
26
Comita, L. S.; Hubbell, S. P.; Wright, S. J. Tree species vary widely in their tolerance for 482
liana infestation: A case study of differential host response to generalist parasites. J. Ecol. 483
2017, On-line, doi:10.1111/1365-2745.12815. 484
38. Sánchez-Azofeifa, G. A.; Rankine, C.; do Espirito Santo, M. M.; Fatland, R.; Garcia, M. 485
Wireless sensing networks for environmental monitoring: two case studies from tropical 486
forests. In IEEE Seventh International Conference on eScience; 2011; pp. 70–76. 487
39. Leigh, A.; Sevanto, S.; Close, J. D.; Nicotra, A. B. The influence of leaf size and shape on 488
leaf thermal dynamics: does theory hold up under natural conditions? Plant. Cell Environ. 489
2017, 40, 237–248, doi:10.1111/pce.12857. 490
40. Medina, E.; Sobrado, M.; Herrera, R. Significance of leaf orientation for leaf temperature 491
in an amazonian sclerophyll vegetation. Radiat. Environ. Biophys. 1978, 15, 131–140, 492
doi:10.1007/BF01323262. 493
41. Pérez-Estrada, L. B.; Cano-Santana, Z.; Oyama, K. Variation in leaf trichomes of 494
Wigandia urens: environmental factors and physiological consequences. Tree Physiol. 495
2000, 20, 629–632. 496
42. Rey-Sánchez, A. C.; Slot, M.; Posada, J. M.; Kitajima, K. Spatial and seasonal variation in 497
leaf temperature within the canopy of a tropical forest. Clim. Res. 2016, 71, 75–89. 498
43. Chen, Y.-J.; Schnitzer, S. A.; Zhang, Y.-J.; Fan, Z.-X.; Goldstein, G.; Tomlinson, K. W.; 499
Lin, H.; Zhang, J.-L.; Cao, K.-F. Physiological regulation and efficient xylem water 500
transport regulate diurnal water and carbon balances of tropical lianas. Funct. Ecol. 2017, 501
31, 306–317, doi:10.1111/1365-2435.12724. 502
44. Prytz, G.; Futsaether, C. M.; Johnsson, A. Thermography studies of the spatial and 503
temporal variability in stomatal conductance of Avena leaves during stable and oscillatory 504
Preprints (www.preprints.org) | NOT PEER-REVIEWED | Posted: 20 April 2018 doi:10.20944/preprints201804.0266.v1
Peer-reviewed version available at Forests 2018, 9, 307; doi:10.3390/f9060307
27
transpiration. New Phytol. 2003, 158, 249–258, doi:10.1046/j.1469-8137.2003.00741.x. 505
45. Sánchez-Azofeifa, G. A.; Castro, K.; Wright, S. J.; Gamon, J.; Kalacska, M.; Rivard, B.; 506
Schnitzer, S. A.; Feng, J. L. Differences in leaf traits, leaf internal structure, and spectral 507
reflectance between two communities of lianas and trees: Implications for remote sensing 508
in tropical environments. Remote Sens. Environ. 2009, 113, 2076–2088, 509
doi:10.1016/j.rse.2009.05.013. 510
46. Demmig-Adams, B.; Adams, W. W. Photoprotection and other responses of plants to high 511
light stress. Annu. Rev. Plant Physiol. Plant Mol. Biol. 1992, 43, 599–626, 512
doi:10.1146/annurev.pp.43.060192.003123. 513
47. Demmig-Adams, B. Survey of thermal energy dissipation and pigment composition in sun 514
and shade leaves. Plant Cell Physiol. 1998, 39, 474–482. 515
516
Preprints (www.preprints.org) | NOT PEER-REVIEWED | Posted: 20 April 2018 doi:10.20944/preprints201804.0266.v1
Peer-reviewed version available at Forests 2018, 9, 307; doi:10.3390/f9060307