Embed Size (px)
Citation preview

GUIDANCE FOR DIETARY EXPOSURE ASSESSMENT
DPR MT-3 Version IV
Health Assessment Section Medical Toxicology Branch
Department of Pesticide Regulation
March 2009

Guidance for Dietary Exposure Assessment DPR MT-3 Version IV
ACKNOWLEDGEMENT
This Document is a product of the Health Assessment Section in Medical Toxicology Branch, Department of Pesticide Regulation, California Environmental Protection Agency.
This document should be cited as:
DPR MT-3, 2009. Guidance for Dietary Exposure Assessment, Version IV. Medical Toxicology Branch, Department of Pesticide Regulation, California Environmental Protection Agency, Sacramento, CA.
The following staff (alphabetically listed) contributed to the production of this document: R. Duncan, B.S., D.A.B.T.; S. Koshlukova, Ph.D.; L. Lim, Ph.D., D.A.B.T. and N. R. Reed, Ph.D., D.A.B.T. (Lead person).
2

Guidance for Dietary Exposure Assessment DPR MT-3 Version IV
Table of Content List of Tables ...................................................................................................................................4 A. Introduction.................................................................................................................................5
B. General Information ....................................................................................................................5 B.1. Food Definition ........................................................................................................................5 B.2. Residue Concentration .............................................................................................................6 B.2.a. Selection of Residue Value ...................................................................................................6 B.2.b. Adjustment of Residue Value ...............................................................................................9 B.3. Consumption Databases .........................................................................................................12 B.4. Dietary Exposure Computation Model ..................................................................................12 B.4.a. Residue Input and Consumption Profile..............................................................................13 B.4.b. Acute and Chronic Exposure Analyses...............................................................................15 B.4.c. Exposure Contribution.........................................................................................................15
C. Total Dietary Exposure Assessment .........................................................................................16C.1. Acute and Chronic Exposure Tier Approaches......................................................................16 C.1.a. Acute Exposure ...................................................................................................................17 C.1.b. Chronic Exposure................................................................................................................19 C.1.c. Criteria for Data Refinement ...............................................................................................22 C.1.d. Acute Dietary Exposure Assessment Presentation..............................................................22 C.1.e. Exposure Uncertainties........................................................................................................22 C.2. Subchronic Exposure..............................................................................................................24 C.3. Lifetime Exposure ..................................................................................................................25 C.4. Other Exposure Scenarios ......................................................................................................26 C.4.a. Exposure from Residue in Water ........................................................................................26C.4.b. Exposure from Metabolites and Degradates .......................................................................26 C.4.c. Aggregate Exposure ............................................................................................................28 C.4.d. Other Scenarios ...................................................................................................................28
D. Tolerance Assessment...............................................................................................................28 D.1. Acute Exposure ......................................................................................................................29 D.2. Chronic Exposure...................................................................................................................30
E. References .................................................................................................................................32
Appendices.....................................................................................................................................35 A. Glossary and Abbreviations ..........................................................................................35 B. Blended Food and Food Forms ....................................................................................40 C. List of Surrogate Commodities .....................................................................................41 D. Default Processing Factors............................................................................................42 E. Examples of Data Presentation......................................................................................45 E.1. Residue Data Summary ............................................................................................46 E.2. Margins of Exposure for Acute Tier 3 Exposure Assessment ...................................47 E.3. Margins of Exposure for Chronic Exposure Assessment...........................................48 E.4. Margins of Exposure for Acute Tolerance Assessment .............................................49
3

Guidance for Dietary Exposure Assessment DPR MT-3 Version IV
List of Tables
1. Summary of residue data sources ................................................................................................7 2. Total person-days for selected populations in the Continuing Survey of Food Intake by
Individuals..........................................................................................................................14 3. The tier approach for acute and chronic dietary exposures .......................................................21 4. Comparison of acute exposure to all commodities and selected individual commodities ........24 5. The most commonly consumed fruits and vegetables in the US. ..............................................31
4

Guidance for Dietary Exposure Assessment DPR MT-3 Version IV
A. Introduction
The Department of Pesticide Regulation (DPR) evaluates the risks of human dietary exposures to pesticides under the mandate of Assembly Bill 2161 (Chapter 1200, Statutes of 1989, sometimes called the Food Safety Act of 1989) (Bronzan and Jones, 1989). For the evaluation of dietary exposure, DPR conducts two types of assessments: total dietary exposure assessment and tolerance assessment. The total dietary exposure assessment provides an estimate of the risk from exposure to residues on all commodities with established tolerances for the pesticide of concern. The tolerance assessment evaluates the health-protectiveness of the pesticide tolerance for each individual commodity.
This document provides guidance for conducting the dietary exposure assessments at the DPR Medical Toxicology Branch. As general guidelines, they are considered non-binding policy. The purpose is to describe the approaches and their scientific support, and to ensure consistent methodologies and default assumptions are applied by the exposure assessors. The approaches are designed to address specifically the dietary exposure of Californians. The U.S. Environmental Protection Agency (USEPA) documents (USEPA, 1999 a and b; 2000a, b, and c), which addressed dietary exposures at the national level, were used as a guide. The DPR approach is similar in concept to that developed by the USEPA. In the selection of residue values for the exposure calculation, the progression is from established tolerances to field trial and monitoring data, with refinements based on the processing factors, detection limits, and percentage of crop treatment information at the later tiers of analysis. Both DPR and USEPA use the same consumption surveys and exposure computation software. As a working document, this guidance is an updated version of the 2004 guidance (DPR MT-3, 2004) and will be further updated as new methodologies and scientific information become available.
This guidance consists of four sections: Introduction, General Information, Total Dietary Exposure Assessment, and Tolerance Assessment. A glossary (Appendix A) and other supplemental information are provided in the Appendices. The selection of the critical no-observed-effect level (NOEL) to quantify the risk from dietary exposure is not included in this guidance.
B. General Information
The exposure to a pesticide in the diet is the product of residue concentration on the food and the amount of food consumed by the individual during a specified time period. This section provides general information about these components of the exposure calculation.
B.1. Food Definition
In the context of dietary exposure assessment, foods refer to commodities with established tolerances for the pesticide being addressed. These commodities can be referred to as the raw agricultural commodities (RAC; e.g., fresh apples, tomatoes) and processed products (e.g., apple juice, tomato paste, etc.). In the conduct of the exposure analysis, the list of commodities is expanded to include all food forms (i.e., uncooked, cooked, canned, juice etc.) for each commodity, available in the dietary exposure computation model. In dietary exposure
5

Guidance for Dietary Exposure Assessment DPR MT-3 Version IV
assessment, these food forms are conceptually identified with respect to the extent of blending, the amount of mixing and commingling of individual units of the food that occurs prior to distribution and consumption. This classification (unblended, partially blended, and blended) is necessary in the determination of appropriate residue concentration for the dietary exposure analysis (to be discussed in detail in C. Total Dietary Exposure Assessment). A list of blended foods and food forms is provided in Appendix B.
B.2. Residue Concentration
The potential sources of pesticide concentration data are the tolerance; the monitoring programs conducted by U.S. Department of Agriculture Pesticide Data Program (USDA PDP), Food and Drug Administration (FDA), and DPR; and registrant submitted field trial and survey studies. The tolerance1 is the legal maximum residue concentration on a RAC or processed food. The monitoring programs and registrant surveys provide data on measured residue levels on the commodities in the channels of trade such as farmer’s market, distribution centers, and retail stores.2 The commodity sampling strategies are dictated by the purpose of the program or studies, and are important to consider in the selection of the residue data from the databases. A summary of these data sources is presented in Table 1. In addition to these sources, residue values from similar commodities could be considered as surrogate values. These commodities should be within the same crop group as specified in the Code of Federal Regulations (CFR 40 Part 180.41; CFR, 2004). The permissible crop translations used by the USEPA are presented in Appendix C (USEPA, 1999c). In addition, consideration should be given to the pesticide use pattern such that the on-going application rate and the extent of use in the surrogating commodity would likely not be less than the surrogated commodity. When the high-end residue level in the surrogating commodity reaches within 50% of the tolerance, it may be prudent not to use any surrogate data. Instead, it may be valid to assume that the residue can be at tolerance or at levels determined from field trial studies.
B.2.a. Selection of Residue Value
When an actual measured residue value is needed for the exposure assessment, the ideal residue data set would be one with the pesticide concentration measured in many samples (e.g., more than one hundred) and different food forms, during the years which reflect actual range of weather and pest conditions and current use practices, from representative samples collected at the consumer level. In practice, the residue data from multiple sources are often used due to the inherent limitations in each data set. The following considerations can be used to select one value or one set of values. Overall, the USDA PDP is the preferred source because it is designed to provide pesticide residue data for dietary exposure assessment and it also includes samples specifically collected in California.
1 Discussion on data requirement and the establishment of the tolerance is provided in D. Tolerance Assessment. 2 Full descriptions of the programs and reports from USDA, FDA, and DPR, are available in the following websites: www.ams.usda.gov/science/pdp/download.htm, www.cfsan.fda.gov/~dms/pesrpts.html, http://www.cdpr.ca.gov/docs/pstrsmon/rsmonmnu.htm
6

Guidance for Dietary Exposure Assessment DPR MT-3 Version IV
B.2.a. (1) Sampling Protocol
Sample Location Residue data for a commodity may be collected from field trials, channel of trade, and the grocery stores. Samples collected closer to the consumer level (e.g., monitoring programs) would be more appropriate than those collected at or near the sites of application (e.g., field trials, fumigation chambers). They would likely have lower residues because of loss from environmental degradation and preparation (cleaning and removal of outer leaves) but more reflective of what people eat.
Residue data for samples collected in California are available in the California component of the PDP and the DPR monitoring program. Because of the sampling strategy, the PDP data are expected to be more representative of residue distribution in the State. On the other hand, because part of the DPR monitoring program selects sites based on violation history, it may have a higher probability of detecting high residue values than the PDP. This higher value, if below the tolerance, is appropriate for acute exposure. There could be exceptions for including data from monitoring programs that give highest residue levels. One example is when the higher residue is due to non-edible parts that may contain greater amount of residue (e.g., non-systemic pesticides on non-edible outer peels). Data from other States should also be considered if factors such as use patterns and weather conditions are similar, or if the commodities treated out-of-state are available in California.
Table 1. Summary of residue data sourcesa. Components Field Trials USDA PDP FDA
Monitoring DPR Monitoring
Registrant Surveys
Purpose Tolerance establishment
Dietary risk assessment
Tolerance enforcement
Tolerance enforcement and dietary exposure
Dietary exposure
Geographical Locations
Single or multiple sites
10 States, including CA
Multiple states Multiple sites within CA
Multiple sites
Sampling Location
Treated fields Large distribution centers, close to consumers
Channels of trade
Channels of trade, treatment sites
Channels of trade
Sampling Form
Directly from the field, composite
Prepared as eaten, composite or single serving
Same form as available at the sampling point, composite
Sampling Frequency
Study duration Multi-years Multi-years Multi-years Study duration
Sample Size Typically one representative crop per crop group
Few commodities, many samples per commodity
Many commodities, varying sample size per commodity
Few commodities, many samples per commodity
Detection Limit
LOD or LOQ LOD Not readily available
Lowest reported detected level
LOD or LOQ
a/ The information in this table is generalization to illustrate the major components in the data sources. They may not be applicable at the commodity level. Abbreviations: LOD=limit of detection, LOQ=limit ofquantitation, PDP=Pesticide Data Program. Relevance of these components for dietary exposureassessment is discussed in B.2.a. Selection of Residue Value.
7

Guidance for Dietary Exposure Assessment DPR MT-3 Version IV
Sample Form It is desirable to have the food form of the residue data be the same as that included in the exposure assessment. The DPR monitoring program and field trials collect residue data only for the RAC, while the PDP and FDA monitoring programs collect data for both the RAC and processed products.
Preference is given to residue data for samples prepared in the same way (e.g., peeled banana or cantaloupe, but not necessarily washed fruits or lettuce with outer leaves removed) as eaten by the consumer. PDP is the primary source that provides residue data for edible portions of commodities.
For each commodity, residue data for a single serving or unit (e.g., one banana) are preferred over those based on composite sampling where several units of a commodity are combined into a single sample before residue sampling. Single serving data are available only for a few commodities; for example, data for apples, pears, peaches, and potatoes from the PDP Special Single Serving Project (USDA, 1996-2000). The PDP and most of other data sources collect composite samples. The practice of composite sampling may mask individual units with residue levels above the average in a batch of samples. This could lead to an underestimation of exposure to commodities generally eaten as a single unit. Underestimation could also occur if there are few samples collected and analyzed as single units.
Sampling Frequency In general, residue data from multiple sampling periods rather than from a single sampling time point would be needed to provide a representative range of the pesticide concentration. However, relatively high residue level from a particular sampling period, when compared to other sampling periods, may be appropriate for use alone, if the reasons for the higher level (i.e., increased pest infestation) are pertinent and realistic. The DPR program is an ongoing surveillance program with residue data for many commodities routinely sampled for each year. Data from recent years (i.e., 5 years) should provide an adequate residue pattern. The PDP program is more selective in that the commodities to be analyzed are usually collected for a limited duration (1 to 2 years). Field trials and registrant survey studies are generally not ongoing, and are limited to the time period of the survey.
Sample Size The database with a large number of samples for a particular commodity is preferred especially if it represents the distribution of potential residue levels. If the use pattern and sampling protocol remain the same in a monitoring program, data from multiple years may be combined to yield a range of potential residue values for a given commodity.
Databases with fewer samples for a certain commodity can be used in dietary exposure under some circumstances. One example is when the measured residue value is consistent with the food form for the exposure assessment, e.g., residue data for canned food that show lower residue level than the RAC due to residue degradation in food processing (e.g., canning).
8

Guidance for Dietary Exposure Assessment DPR MT-3 Version IV
B.2.a. (2) Analytical Methodology
When considering residue values from different sources for a commodity, the analyte specificity and detection limit are also important factors. The latter is especially critical because it is used as the default pesticide concentration for a sample with no detectable residue level (referred to as a non-detect sample, or ND sample) in C. Total Dietary Exposure Assessment.
Analyte Specificity The residue data can be from multi-screen or single analyte analytical method. A multi-screen analysis is useful to detect multiple pesticides on a sample, and can provide comprehensive data on many pesticides without processing as many samples. On the other hand, single analyte method developed for a specific pesticide may offer a more accurate measurement of the residue without interference from other pesticides in the same sample. It generally has a lower detection limit than that from a multi-screen method for the same pesticide.
Detection Limit The detection limit is the lowest concentration of an analyte in a sample that can be detected, but not quantified. In addition to analytical method feasibility, the detection limit should be set pertinent to the toxicity threshold of the pesticide, and lower than the level of toxicological significance. If the detection limit is higher than this threshold, the lack of detected residue is not an assurance of acceptable risk from exposure.
The detection limit may be expressed as the limit of detection, limit of quantitation, or minimum detection limit.3 In the case where the detection limit for a study is not specified, the lowest reported detected level may be considered as a surrogate detection limit. In this guidance, the expression limit of detection (LOD) is used as a generic term for any of those terms, recognizing that these terms are not equivalent. Depending on the assessment, the default residue assumption for non-detect samples at the LOD or 1/2 of the LOD is discussed in C.1. Acute and Chronic Exposure Tier Approaches.
B.2.b. Adjustment of Residue Value
The available residue data may be modified for use in estimating the exposure according to the pesticide use pattern and common food processing practices.
B.2.b. (1). Percent of Crop Treated (PCT) Adjustment
When a residue dataset is selected for a particular commodity, the default assumption is that all samples for this commodity have been treated with the given pesticide (100% PCT). This means all samples can potentially contain some level of the pesticide, even if it cannot be detected. This may be the case when the commodity comes from a field treated with the pesticide, and is available to consumers at or near the application site. Thus, all non-detect samples can be assumed to contain residues at or below the LOD. When there is a possibility that some samples within a dataset may not have been treated, adjustment can be made for the non
3 LOD= 3:3 (SD/S), LOQ= 10 (SD/S), where SD is the standard deviation of the response, S is the slope of the calibration curve.
9

Guidance for Dietary Exposure Assessment DPR MT-3 Version IV
detect samples to reflect the PCT for some exposures (C.1. Acute and Chronic Exposure Tier Approaches). For example, instead of assuming that the diet consists of only treated commodity over a long period of time, residue levels for non-blended foods in chronic exposure may be adjusted by a PCT factor if it is known that less than 100% of the crop is treated over time.
PCT is the quotient of acres treated and acres harvested per year. The following are three ways to calculate the PCT based on type of data from USEPA, USDA, and DPR 4:
PCT based on CA data on acreage and chemical usage: The total acreage of crop planted or harvested in California is available from the USDA National Agricultural Statistical Service (NASS). Since some crops are planted, but not harvested, it is probably more accurate to use total acreage of harvested crop (rather than total planted area) to calculate the PCT. The total number of acres treated for the year can be obtained from the DPR Pesticide Use Report (PUR) Data. For example, a PCT of 27% for a pesticide on broccoli is calculated based on its use on 32,705.93 acres from the Use Report, and 120,000 acres harvested in 2003. It should be noted that the PCT calculated through this method might be an overestimation since the sum of treated acres from the DPR PUR data does not allow differentiation whether a field has been treated multiple times (e.g., a 50-acre field treated twice in the same year is counted as 100 acres).
PCT based on USDA dataThe PCT is available from the Agricultural Chemical Usage database of the USDA Economic, Statistics and Market Information System. This database is based on surveys of the largest producers of a particular crop to estimate the national and individual state PCT.
PCT from USEPA Biological and Ecological Analysis Division (BEAD)PCT information can also be requested from the USEPA BEAD, which provides PCT estimates based on pesticide market sales and shares data. The PCTs generated for the USEPA dietary risk assessments can be made available to DPR.
When there are data from multiple sources or years, the following considerations are important to determine the magnitude of the PCT for dietary exposure assessment:
Use VariationPCT should reflect current use patterns and preferably derived from the most recent 5 years of use data. However, if there is an increase in the use pattern (i.e., due to increased pest pressure) in the last one or two years, the most current use information should have precedence.
4 The information for PCT could be obtained from: USEPA Biological and Economical Analysis Division, (BEAD http://www.epa.gov/oppbead1/contacts_bead.htm, USDA National Agricultural Statistical Service http://www.nass.usda.gov/ca/ and http://www.nass.usda.gov/ca/indexhist.htm , USDA Economic, Statistics and Market Information System http://usda.mannlib.cornell.edu/, and DPR Pesticide Use Report Data http://www.cdpr.ca.gov/docs/pur.
10

Guidance for Dietary Exposure Assessment DPR MT-3 Version IV
Location PCT values for CA are most appropriate compared to those for the entire U.S. or from other states. However, PCT for other states should be considered if there is a possibility that out-ofstate treated commodities are available in CA.
Data Uncertainty There is uncertainty in the calculation of the PCT. In general, data for both the acres treated and acres harvested per year are estimated values based on selected sampling or survey. The acres harvested are generally collective numbers based on survey data, and may not be representative of the use at an individual or regional field level. Except for the DPR Pesticide Use Report (PUR), the acres treated data are based on market share or pesticide sales data. California has a regulation for 100% use reporting, where the growers are required to report the acres treated to DPR. Even with the PUR, there is some uncertainty due to the reporting method where multiple applications to the same field are treated as individual applications. This would lead to an overestimation of the acres treated and thus a higher than actual PCT value. Therefore, the source of the data and the uncertainty associated with the PCT values should be specified in the exposure assessment.
Because of the variability and uncertainty in the PCT values, the DPR default procedure is to select the highest PCT from available data, and to round this number to the next higher multiple of five. For example, if the PCT is 20, then the modified value is 25%. If the PCT is 27%, then the modified value is 30%. This highest modified value is used for acute exposure. For chronic exposure, the default procedure is the average PCT from different sources or years. Any deviations from these procedures should be justified in the risk assessment. One example is the use of actual calculated values from BEAD for acute exposure, when the PCT was verified to accurately reflect the very high-end of current use pattern. Another example is the use of the highest PCT for chronic exposure when there is evidence that high use of the pesticide can occur in any single year. The use of average PCTs from several years could underestimate the PCT for that year.
B.2.b. (2) Hydration/Processing Factors
When the residue data for a RAC is used as a surrogate for a processed food, hydration and processing factors may be applied to account for the potential change in residues in the final product. Dehydration (e.g., dry onions, dried tomato paste, lemon juice-concentrate) is expected to result in higher residues in the processed product than the RAC. Potential increase or decrease in residue due to other processing procedures can also be considered. Washing, peeling and heating are common practices for commercial food preparation. At home, removing peels for oranges and bananas should be considered as a common practice; however washing fruits should not be regarded as a required or assumed practice. After these factors are used, however, the final residue value for the commodity should not exceed the tolerance. Specific uses of the processing factors are further discussed in C. Total Dietary Exposure Assessment. The registrants may conduct processing studies as part of data submission for pesticide registration. A set of default factors is presented in Appendix D.
11

Guidance for Dietary Exposure Assessment DPR MT-3 Version IV
B.3. Consumption Databases
The consumption rate of a commodity by individuals is the other major element in the exposure equation. The primary source of consumption information is the USDA Continuing Survey of Food Intake by Individuals (CSFII), which reports food consumption from a representative sample of the U.S. population, including California residents.5 If the CSFIIs are found to be inadequate to address the eating habits of groups with different cultural and ethnic backgrounds for certain commodities, established serving portions may provide additional information about the consumption rate (FDA, 2002 and 2005).
CSFII 1994-1996, 1998 This database is the most recent and representative consumption database that is available through the existing exposure models. The U.S. 1994-1996 food consumption survey provides information on a 2-day nonconsecutive food intake by 20,607 individuals of all ages from 62 geographical areas, including California. In addition, the 1998 Supplemental Children's Survey provides food consumption information for an additional 5,559 children from birth to 9 years old.
CSFII 1989-1992 This older consumption database contains fewer records for infants and children than the CSFII 1994-1996, 1998. It is, however, useful to compare consumption of commodities, which contribute to high dietary exposure, especially for population subgroups with a smaller number of dietary intake records (e.g., women 13-19 years old) in the more current survey.
B.4. Dietary Exposure Computational Model
A computation model is used to calculate the exposure. The two software currently available at DPR are the Dietary Exposure Evaluation Model (DEEM™, version 7.74), and The DEEM™- Food Commodity Ingredient Database (DEEM-FCID™, version 2.036). DEEM™ is a mathematical model that contains a version of the CSFII translated into basic units of agricultural commodities or commonly analyzed food form, such as tomato paste or wine. The main difference between the two softwares is the recipe translation for some foods. DPR preliminary analyses of exposures to multiple commodities showed no significant or fixed pattern of difference in the exposures between these two softwares.
The primary software for DPR assessments is the DEEM-FCID™. This decision is based on several considerations. First, the software manufacturer, Exponent, has no clear plan to update DEEM™ in the future. Second, the USEPA has adopted DEEM-FCID™ for tolerance establishment (USEPA, 2002a). In addition, the recipes used in DEEM-FCID™ are linked to USEPA-defined food commodities using publicly available recipe translation files developed jointly by the USEPA and USDA (FCID, 2000). The recipes are used to translate the form of food reported as eaten into respective food ingredients (e.g., apple pie into apples, flour, sugar,
5 Detailed information about these surveys are available from these websites: http://www.barc.usda.gov/bhnrc/foodsurvey/pdf/Csfii98.pdf, http://www.barc.usda.gov/bhnrc/foodsurvey/Csfii89.html6 This program should be cited as: DEEM™ - FCID version 2.03, Exponent. http://www.exponent.com/home.html
12

Guidance for Dietary Exposure Assessment DPR MT-3 Version IV
etc.). Moreover, the DEEM-FCID™ also specifies baby foods as a food form and incorporated the most recent consumption databases (CSFII 1994-1996, 1998). The exposure assessor should consult the DEEM™ user manual for the use of the software.
B.4.a. Residue Input and Consumption Profile
The residue data inputs to DEEM-FCID™ may be a fixed value (point estimate) or a distribution (available only for the acute exposure module) for each of the commodities included in the analysis. A residue distribution may consist of measured residue values for all samples, or also residues at or below the detection limit for some samples. The distributional residue data file (RDF) is incorporated into the exposure model. For modification to account for changes in residue levels due to hydration and processing, these factors are entered as Adjustment Factor #1 and Adjustment Factor #2, respectively. A list of default hydration and processing factors are included in Appendix D. However, the final residue value should not exceed the tolerance established for the commodity or food form. For example, if the tolerance for raisins is 5 ppm, the product of residues on grapes (i.e., < 1.1 ppm) and a dehydration factor of 4.3 should not exceed 5 ppm. To account for PCT, the residue value is adjusted before entry to the residue file.
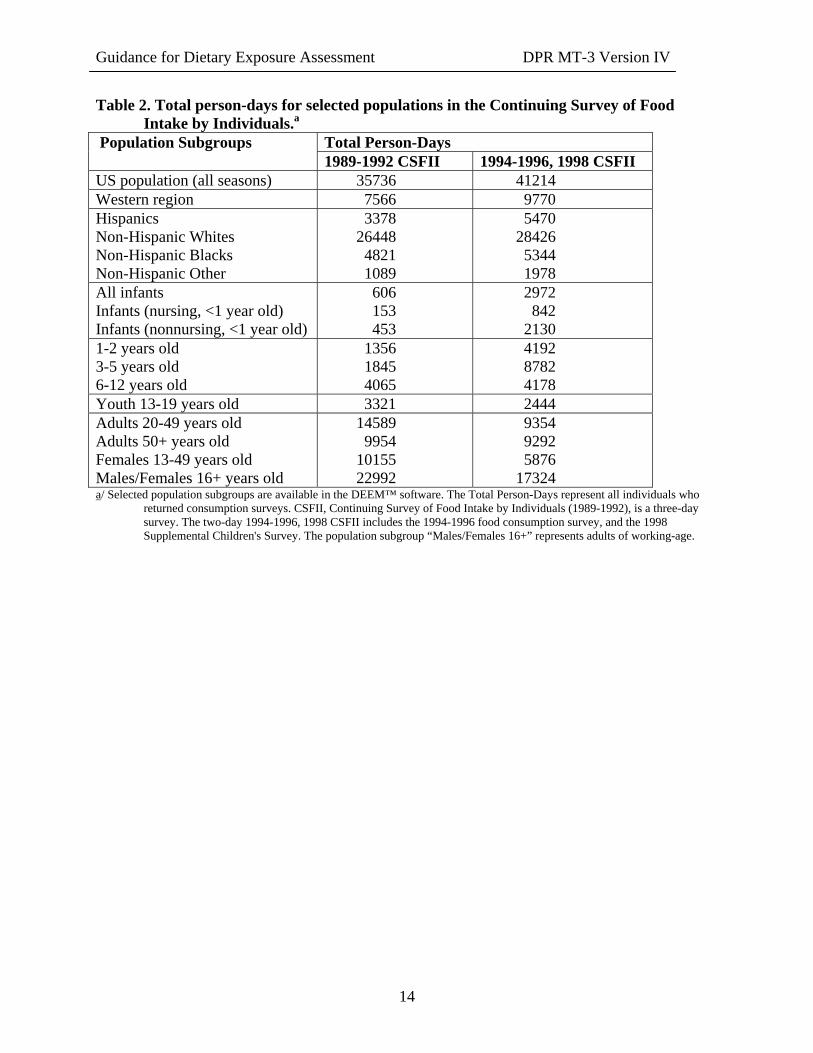
In the computational model, the population consumption profile is expressed as per Person-Day and User-Day. Total Person-Days is equivalent to the number of people in the survey multiplied by the number of days surveyed. For example, 50 people returning a 2-day survey results in 100 Person-Days. The numbers of Person-Days in the 1994-1998 survey for infants and children (1 to 5 years old) are higher than the 1989-1992 survey, because of the inclusion of the 1998 supplement survey for children only (Table 2). User-Days is the number of days during the survey in which at least one of the listed commodities was consumed by an individual. For example, if apple is one of the commodities and a person ate an apple only for one of the two days surveyed, this consumption is counted as one user-day for apples.
A large survey sample size (i.e., >100 user-days) provides an adequate representation of the consumption pattern of a given population subgroup for a particular commodity. In the computational model, the surveyed individuals are divided into default subgroups based on age, gender, ethnicity, season, and pregnancy/lactation status. Of the available subgroups, DPR has selected the following groups for routine assessment: U.S. population, western region (consisting of mostly Californians), Hispanics, non-Hispanic whites, non-Hispanic blacks, non-Hispanic other, infants (all, nursing, and non-nursing), children (1-2, 3-5, and 6-12 years old), youth (1319 years old), females (13-49 years old), and adults (20-49 years old, and 50+ years old). An additional group, such as adults 16+ years old, is added as a custom population, when appropriate (C.4.c. Aggregate Exposure).
13
Guidance for Dietary Exposure Assessment DPR MT-3 Version IV
Table 2. Total person-days for selected populations in the Continuing Survey of Food Intake by Individuals.a
Population Subgroups Total Person-Days 1989-1992 CSFII 1994-1996, 1998 CSFII
US population (all seasons) 35736 41214 Western region 7566 9770 Hispanics Non-Hispanic Whites Non-Hispanic Blacks Non-Hispanic Other
3378 26448 4821 1089
5470 28426 5344 1978
All infants Infants (nursing, <1 year old) Infants (nonnursing, <1 year old)
606 153 453
2972 842
2130 1-2 years old 3-5 years old 6-12 years old
1356 1845 4065
4192 8782 4178
Youth 13-19 years old 3321 2444 Adults 20-49 years old Adults 50+ years old Females 13-49 years old Males/Females 16+ years old
14589 9954
10155 22992
9354 9292 5876
17324 a/ Selected population subgroups are available in the DEEM™ software. The Total Person-Days represent all individuals who
returned consumption surveys. CSFII, Continuing Survey of Food Intake by Individuals (1989-1992), is a three-day survey. The two-day 1994-1996, 1998 CSFII includes the 1994-1996 food consumption survey, and the 1998 Supplemental Children's Survey. The population subgroup “Males/Females 16+” represents adults of working-age.
14

Guidance for Dietary Exposure Assessment DPR MT-3 Version IV
B.4.b. Acute and Chronic Exposure Analyses
The DEEM-FCID™ software expresses exposures in terms of acute and chronic exposures. For acute exposure, the module determines exposures on both per user-day (consumers only) and per capita (all individual surveyed) basis. DPR has selected user-day as the basis for acute exposure because the focus of the assessment is on those who eat at least one of the assessed commodities. In a point estimate analysis, the exposure is based on the distribution of consumption rates and a fixed residue level for each commodity. In a distributional analysis, the residue level is a distribution for a particular commodity and the exposure is calculated using Monte Carlo method. For chronic exposure, the module calculates total exposure by multiplying the average residue level with the average daily consumption for each food. The 2-day cross-sectional consumption survey in a population is used as a surrogate for the longitudinal consumption pattern.
In addition, the DEEM-FCID™ software compares the exposures with the toxicity information input (NOEL, reference concentration, or cancer potency factor) by the risk assessor. This comparison provides risk estimates associated with the exposure for the various durations. Thus, a margin of exposure (MOE)7 from the acute module describes the potential for an adverse effect occurring following exposure to pesticide residues on all foods consumed by an individual in a single meal or within a single day. The margins of exposure or % of reference concentration8
from the chronic exposure module expresses the potential for an adverse effect based on the average daily exposure to the pesticide residues over a period of time (i.e., in a year). The chronic exposure module also provides the oncogenic risk probability applying the average daily exposure over a lifetime to the cancer potency factor9.
B.4.c. Exposure Contribution
The DEEM-FCID™ software provides analyses of commodity contribution to the exposures. For acute exposures, the Critical Exposure Commodity (CEC) analysis provides a consumption profile for survey records in an acute dietary exposure determination. It identifies individual survey record with the high-end exposures (i.e., in the top 5% or less) and allows detailed review of any apparent errors in the consumption record (e.g., unreasonable body weight for a given age, or high consumption of a particular commodity). For chronic exposures, the Commodity Contribution Analysis delineates the contribution of crop groups or individual food forms to the overall chronic dietary exposure. It is an useful tool to guide the focus of the next tier's refinement analysis. A plot file is also available to examine the number of user-days represented for each population group and the number of users represented at each percentile of exposure under weighted and unweighted scenarios.
7 Margins of exposure = NOEL/dietary exposure. Dietary Exposure8 % Reference concentration = NOEL/Uncertainty Factor x 100% .
9 Potency factor describes the relationship between the dose and tumor formation. See Appendix A for more explanation.
15

Guidance for Dietary Exposure Assessment DPR MT-3 Version IV
C. Total Dietary Exposure Assessment
The total dietary exposure assessment provides an estimate of risk for the exposure to the residues on all commodities with established tolerances for a particular pesticide. DPR commonly assesses the acute and chronic dietary exposures. Depending on the use pattern of the pesticide and its toxicity, seasonal and lifetime exposures may also be determined.
As discussed earlier, food for this part will be discussed with respect to blending, rather than RAC and processed food terms. Blended foods are those that are mixed over a wide geographic region prior to consumption, such as grains, beans, and sugars (Appendix B). Non-blended foods are those for which no mixing occurs prior to consumption, for example, whole apples, bananas, and carrots. "Blended food" is also a relative term that is used when comparing the food form being evaluated to the food form from which residue data are available. For example, if residues that were measured on whole tomatoes will be applied to the food form tomato paste, tomato paste should be considered blended, since whole tomatoes are blended together when making tomato paste. However, if residue values from samples of tomato paste will be used directly in the analysis, tomato paste should not be considered blended with respect to the assignment of residues, since blending has already been accounted for in the residue measurement. The USEPA also distinguishes foods that are partially blended in their decomposition analysis (USEPA, 1999b). Partially blended commodities are generally small to medium sized fruits, such as berries and nuts, for which small-scale mixing occurs prior to consumption. Since DPR does not decomposite residue samples, the residue values for partially blended foods are treated the same as non-blended foods in the exposure calculation.
This blending classification is also particularly important when conducting acute dietary analyses because average residue values are generally used for blended foods while high-end values are used for non-blended foods. The assumption of a zero residue value for non-detect samples, when incorporating PCT data, is also different for blended and non-blended foods. For crops or foods which are blended on a wide scale before consumption, it is likely that no samples may be entirely free of pesticide residues; therefore, PCT is not a valid indicator for the probability of encountering a treated commodity. For residue data sets on blended foods, it may not be appropriate to adjust NDs for PCT by replacing them with zeroes.
C.1. Acute and Chronic Exposure Tier Approaches
The total exposure is determined using a tiered approach to define the residue value for each commodity. The tiered approach is designed for resource conservation such that each subsequent tier represents a greater requirement for data and complexity in analysis in exchange for a more realistic exposure that reduces the level of overestimation in the previous tier. Each next tier of analysis is only conducted when the more simplistic tier indicates an exposure level of concern when the exposure is unrealistically overestimated. In any tier of analysis, there should be sufficient confidence that the actual exposure based on the available database is not likely to be above the estimated level. Thus, tolerances are used as the residue value for the first tier since they are readily available. These are replaced with residues from monitoring data, field trials, or survey studies, if available, in the second tier. Only residues at or below the tolerance should be included. Any values higher than the tolerance should be replaced with the tolerance.
16

Guidance for Dietary Exposure Assessment DPR MT-3 Version IV
They are not included in this assessment because they represent illegal uses (C.4.d. Other Scenarios). PCT adjustment and residue distributions are further refinements added in the third tier. A summary of the tiered approach is presented at the end of this section in Table 3. The need for data refinement is determined by the magnitude of the risk at a given level of overestimation (C.1.c. Criteria for Data Refinement).
C.1.a. Acute Exposure
In acute exposure, the default assumption is that all commodities for which a tolerance has been established can contain residues up to the tolerance value.
Tier 1 The tolerance is used as the residue value for all commodities since it is the legal residue level and therefore, can potentially be present in the commodities that are available to the consumers. Within the legal pesticide use, this tier of analysis is likely more applicable when the time for further pesticide degradation before reaching the consumer is short, e.g., at the farm gate and farmer's market. Besides, there is no consideration for potential increase or decrease in residues due to hydration or processing.
Tier 2 In this tier, the highly unlikely scenario of assuming all commodities all at the tolerance is replaced by available data from field trials or monitoring programs. The years of national (PDP) and statewide (DPR) monitoring results showed very low incidence of residue (usually within 1% of sample) (USDA, 2003; DPR 2004b). Thus, it is reasonable to replace the tolerance with the actual measured residue value. When residue data are available for both unblended and blended foods, the highest measured residue value is selected, with non-detect samples assumed to be at the LOD, the highest possible residue value. If residue data are not available for blended foods, the average residue value for the unblended form may be used, and the non-detect samples also assumed to be at the LOD. Factors accounting for change in residue levels due to dehydration and/or processing are included in this latter case.
Tier 3 In this final tier, the single residue levels used in the previous tier analysis, especially for those commodities that have high contribution to the overall exposure, are replaced with relevant residue distributional data. The probabilistic analysis provides a more realistic profile of exposure for each given population subgroup. As with Tier 2, when anticipated residues from the unblended are applied to blended foods, factors accounting for changes in residue levels due to dehydration and/or processing are accounted for in this tier. One key feature is the use of PCT data to structure the distribution of residue levels. A common residue profile consists of samples with detected and non-detected residue. Instead of assuming 100% of each commodity is treated with the pesticide (i.e., all samples contain certain level of pesticides), PCT information enables the estimation of the number of non-detect samples that may not be treated with pesticide and thus can reasonably assume to contain no pesticide residue. The estimation of PCT was previously described (section B.2.b. (1)). When there is more than one PCT estimate for a commodity, the maximum PCT value should be selected for acute exposure.
17

Guidance for Dietary Exposure Assessment DPR MT-3 Version IV
Residue data for distributional analysis To develop a distribution of residues, sufficient data (i.e., > 30 data points) for the commodity should be available. PDP is the preferred database because the sample collection was designed to be representative. When residue data are not available from PDP, two approaches are possible. One is to use the PDP data for surrogate crops. Another is to use DPR monitoring data for the specific commodity being addressed. While they may not be representative in the collection sites, the DPR data may provide an adequate distribution pattern when samples are collected from many sites and for multiple years. Data from different monitoring databases can be used for different commodities (e.g., residue distribution from beans from a 3-year monitoring by the PDP, and residue distribution from green onions from a 5-year DPR monitoring) within the same analysis. However, different sources of residue data should not be combined in one distribution for a particular commodity.
For resource conservation sake, it may not be necessary to obtain and use distributional data for all commodities in this final tier of assessment. Tier 3 should be initiated with a few commodities with high contribution to the total exposure. These commodities are identified by the CEC analysis, or from the FDA list of the most frequently consumed foods (FDA, 2002). The decision on the number of commodities with distributional data input can be determined by how the exposure from each additional commodity with distributional input will impact the profile and magnitude of the total exposure, especially at the high-end range of exposure. With appropriate strategy in identifying high contributing commodities, it may not be necessary to go beyond a 4 commodity-residue distribution, if the exposure with 2 commodity-residue distributions is similar to that for 3 commodity-residue distributions.
Use of PCT data In the residue distribution, when there is reliable PCT data, a portion of the non-detect samples is assigned a value of ½ of the LOD as a reasonable estimate since the actual residue value is between zero and the LOD. When there is more than one LOD for a given dataset for a commodity, the highest LOD should be used for this purpose Alternatively, a weighted LOD approach may be used to proportionally assign the LODs to samples expected to contain residues (USEPA, 2000c) if this additional refinement is expected to have an impact on the exposure. Another portion of the samples can be assumed to contain no residues, or zero residue value. In general, when using PCT to estimate the number of non-detect samples that could actually contain no residue, and there are more than one PCT estimate available for a commodity, the maximum PCT value should be used for acute exposure. For the residue distribution of blended foods, PCT adjustment is not applicable since the data are assumed to derive from both treated and non-treated batches of the food.
The actual application of PCT in refining the residue distribution can be illustrated in the following two examples, assuming a PCT of 10% and a residue sample size of 100. Under these assumptions, no more than 10 samples can be expected to contain residue (Example 1). However, since PCT is an estimate based on information not related to residue collection programs, this may not always be the case (Example 2).
18

Guidance for Dietary Exposure Assessment DPR MT-3 Version IV
Example 1. When the number of samples with measured residues is fewer than the theoretical number estimated from the PCT.
The non-detect samples would be assigned a value of ½ of the LOD or zeros. For example, if 5 of 100 samples contained detected values, the distribution would consist of 5 detected values, 5 at ½ of the LOD, and the rest assigned zero values.
Example 2. When the number of samples with measured residues is greater than the theoretical number estimated from the PCT.
The detected samples would be assigned their measured values with the rest of the samples assigned zeros. For example, if 20 of 100 samples actually had quantifiable residues, then the distribution would contain the 20 quantified samples and 80 samples with “zeros” (versus 90 “zeros” which would have been expected based on the 10% of PCT).
C.1.b. Chronic Exposure
In chronic exposure, the default assumption is that for repeated exposures over time, the residue for all commodities for which a tolerance has been established can be equivalent to some average level at or below the tolerance.
Tier 1 The residues for all commodities are assumed to be at ½ of the tolerance, since consumers are likely, over time, to be exposed to residues ranging from zero residues and up to the tolerance. One-half of the tolerance is a reasonable default average. No correction is made for potential increase or decrease in residues due to hydration or processing.
Tier 2 Instead of the tolerance, monitoring data or field trials are used to reflect a more realistic scenario in this tier. The residue concentrations for unblended and blended foods are calculated as the arithmetic mean of reported residues. Samples with residues at or below the detection limit, are assigned ½ of the LOD in calculating the overall mean residue value. In contrast to assuming the high-end residue level for acute exposure, the use of the average and ½ LOD for chronic exposure is reasonable to represent a range of residue level over time. When anticipated residues from the unblended are used for blended foods, factors accounting for change in residue levels due to dehydration and/or processing are included.
Tier 3 Given the inherent complexity in estimating a longitudinal consumption pattern from a discontinuous 2-day CSFII survey data, a distributional analysis with both residue and consumption as distributions, is not conducted for chronic exposures. The residue values for non-detect samples from Tier 2 are refined with the PCT. When anticipated residues from the unblended are used for blended foods, factors accounting for change in residue levels due to dehydration and/or processing are included.
19

Guidance for Dietary Exposure Assessment DPR MT-3 Version IV
When there are more than one PCT available for a commodity, the average value should be selected. If the non-detect samples came from field trials (100% treated), the following equation is used:
LOD
AR = ∑R N 1 +
N ( 2 x N2 )
x PCT
In this equation, ½ of the detection limit (LOD) is used as the residue value for non-detect samples, and the average PCT is used. AR = average residue; RN1 = residues for the number of samples (N1) in which residues were detected, N2 = number of samples in which residue was not detected; N = total number of residue samples.
When there are non-detect samples from monitoring data, their residue values may be ½ of the LOD or zero depending on the PCT. This is described in the following formula:
∑R N 1 +( LOD xN2 )+(0 xN3 ) ∑R N1 +[ LOD x( NxPCT − N1 )]AR = 2
N = 2
N
where, AR = average residue, LOD= detection limit, RN1 = residue for the number of samples (N1) in which residues were detected, N2= the number of samples theoretically can contain residues with N2=N x PCT – N1) and residues assumed at ½ LOD, N3= number of samples theoretically contain no residues with N3=N x (1-PCT) and residue assumed at zero.
20

Guidance for Dietary Exposure Assessment DPR MT-3 Version IV
Table 3. The tier approach for acute and chronic dietary exposures.
Dietary Analysis
Residue Value for Each Commodity Adjustment Factors Unblended (NB) and Partially blended (PB) Foods; or Blended if analyzed directly
Blended Foods (using NB or PB residues)
Hydration Processing
Acute Exposure
Tier 1 Tolerance (100% PCT) Tolerance (100% PCT) No
Tier 2 Highest measured FT/Monit value using LOD for NDs
Average FT/Monit value using LOD for NDs
Yes, when unblended data are used for blended foods
Tier 3 Residue distribution from FT/Monit using ½ LOD for NDs and max. PCT adjustment on NDs, if available (*no PCT for blended NDs)
Average FT/Monit value using ½ LOD and max. PCT for NDs
Chronic Exposure
Tier 1 ½ Tolerance ½ Tolerance No
Tier 2 Average FT/Monit value using ½ LOD for NDs Yes, when data for unblended are used for blended foodsTier 3 Average FT/Monit value using ½ LOD and average PCT for
NDs (*no PCT for blended NDs).
a/ Abbreviations: B=blended, FT/Monit=field trial or monitoring/survey data, LOD=limit of detection, max.=maximum, NB=not blended, ND=non-detect samples, PB=partially blended, PCT=percent of crop treated.
21

Guidance for Dietary Exposure Assessment DPR MT-3 Version IV
C.1.c. Criteria for Data Refinement
In a tiered approach, the need for an additional tier of analysis is determined by a comparison of the risk, expressed as the MOE, associated with the estimated exposure and the health protective level. DPR established two threshold MOE levels for indicating if the next tier of assessment for acute exposure is needed. These thresholds should be used as a guide, and they are intended to allow for additional exposures from other routes as in aggregate exposure assessment (C.4.c.), which may not be included when dietary exposure assessment was conducted. The two thresholds for acute exposures are:
(1) The MOEs at the 99th percentile exposure for all foods are 5-fold higher than the health protective level, or
(2) The MOEs at the 95th percentile exposure for all foods are 10-fold higher than the health protective level.
For chronic exposure, the threshold is 5-fold higher than the health protective level.
For NOEL based on laboratory animal studies, a MOE of at least 100 is generally considered as health protective. Using a MOE of 100 as health protective, the analysis should proceed to the next tier if the MOEs for the 99th percentile acute exposures or average chronic exposures for any population subgroups were #500.
C.1.d. Acute Dietary Exposure Assessment Presentation
For the calculation of MOEs, the DPR has selected the 95th and 99th percentiles of the user-day exposure levels for each population subgroup as the default upper bound of exposures when the final tier is either Tier 1 or 2. The MOEs for the 95th percentile was chosen by the DPR for comparison with the USEPA dietary exposure assessment. However, it should be noted that the USEPA assessment is generally based on per-capita, rather than user-days as practiced by DPR (B.4.b. Acute and Chronic Exposure Analyses).When Tier 3 is the final tier, the upper bound percentiles are the 95th, 99th, and 99.9th percentiles of exposures should be presented. . Since the MOEs for more than one exposure percentile are presented, an explanation of the implications between the 95th and higher percentile of exposure should be included in the risk appraisal section of the risk characterization document. A discussion of the impact of percentile selection for all commodities on the exposure of high consumers to a single commodity is presented under C.1.e. (2) Uncertainty in the Approach.
C.1.e. Uncertainties
C.1.e. (1) Uncertainty in Input Parameters
The exposure parameters, such as residue values, consumption rates, and PCT contribute toward the uncertainty of the exposure estimate.
22

Guidance for Dietary Exposure Assessment DPR MT-3 Version IV
The dietary exposure estimates could be further refined if more residue data specific for dietary exposure are available. Uncertainty in the residue data commonly encountered include: (1) limited sampling time-period, which may not be representative of the current or longer time use pattern, (2) small sample size, (3) use of tolerance as residue value, (4) residue data based on composite samples, (5) use of surrogate residues from similar crops, and (5) the estimate of PCT values. These could lead to over- or under-estimation of exposure. For example, the exposure may be overestimated when there is a change in the residue level over time, or residue reduction of non-systemic pesticide through washing/peeling are not accounted for. There may also be an overestimation of exposure if the tolerance is used for many commodities, especially for the major contributors to the total dietary exposure. On the other hand, the practice of composite sampling may mask individuals units with higher residue levels. This could lead to an underestimation of acute exposure to commodities generally eaten as a single unit.
There is uncertainty in the consumption data based on the limited 2-day non-continuous consumption survey. There is under-representation of actual dietary consumption for less common dietary patterns or culinary practices associated with ethnic background. These are difficult to delineate since currently only CSFII food surveys are programmed into the existing exposure computational models. If and when the National Health and Nutrition Examination Survey (NHANES) on health and food consumption conducted by the US Centers for Disease Control10 are translated and coded for modeling use, these would provide additional information in the future.
The dietary exposure estimate for a population subgroup with a small consumption sample size (i.e., <100), may not be representative of actual consumption patterns. DPR currently excludes from the dietary risk assessment any population subgroup with fewer than 25 user-days, because of the high uncertainty associated with consumption data. For population subgroups with more than 25, but fewer than 100 user days, their exposures and MOE values should be interpreted with caution. They may not represent a wide range of possible exposures in a population. Additional analysis using the 1989-1992 CSFII, although more dated, may provide some comparison of exposures. The impact of the excluding or including certain population subgroups in the total exposure should be discussed in the risk appraisal. The populations with user-days within this range should be indicated in the tabulated results.
C.1.e. (2) Uncertainty in the Approach
In the Tier analysis, the refinement involves the use of measured pesticide levels from monitoring programs or field trial studies and adjustment factors for food hydration. The Tier 2 exposures may not be significantly different from the Tier 1 analysis if monitoring data are not available to replace the tolerance used for the high contributing commodities. In this case, assigning monitored residues to other foods would have less impact on the overall exposure.
In the acute dietary exposure analysis using point estimate residue values, the size of the total user-day population base increases as more commodities are added to the analysis. The change in this reference population between the single and multiple commodity analyses is likely to result in a shift of the distributional placement of individuals who have high, yet reasonable
10 http://www.cdc.gov/nchs/nhanes.htm
23

Guidance for Dietary Exposure Assessment DPR MT-3 Version IV
exposure from a particular commodity alone. Thus, there is a need to ensure that the exposure of such individuals is captured within the specified benchmark regulatory percentiles (e.g., 95th, 99th, and 99.9th) of the multiple commodity analysis. This could be accomplished by comparing the acute exposure for all commodities at these percentiles and those from individual commodities.
An example of the comparison is presented in Table 4. In this example, the exposures of the population subgroups for all foods at the 95th percentile were compared to those for a single commodity (rice or dry bean) at the 95th percentile. The 95th percentile exposures for rice only were lower than those from all foods for all groups at the 95th percentile. This result indicates that exposures of high rice consumers are quantitatively accounted for in the percentile selected for all foods. On the other hand, the exposure for the group "Non-Hispanic Other" from residues in dry beans at the 95th percentile (0.00147 mg/kg/day) was higher than the 95th percentile from all foods (0.00119 mg/kg/day). This indicates that a higher percentile (>95th percentile) of exposure needs to be selected for all foods when evaluating the risk of exposure for this population subgroup.
Table 4. Comparison of acute exposure to all commodities and selected individual commodities.
Population Subgroup Acute Exposure (mg/kg/day)a
All foods Rice Only Dry Beans Only 95th percentile 95th percentile 95th percentile
US population 0.00051 0.00032 0.00089 Western Region 0.00061 0.00041 0.00104 Hispanics Non-Hispanic Other
0.00094 0.00083
0.00039 0.00064
0.00109 0.00147
All infants 0.00064 0.00063 0.00125b
Children 1-2 years old Children 3-5 years old Children 6-12 years old
0.00110 0.00069 0.00044
0.00056 0.00039 0.00023
NA 0.00114 0.00061
Adults 20-49 years old 0.00046 0.00024 0.00069 a/ DEEM™ software and USDA CSFII from 1994-1996, 1998 were used for the analysis. The exposures represent percentiles of
user days. NA: Insufficient user-days (<25) in the CSFII database. “All foods” =all commodities with tolerances for a particular pesticide. “Rice Only” and “Dry Beans Only” was exposure for each single commodity alone. Exposures for dry beans only, which are higher than those for all foods, are highlighted.
b/ Exposure estimates were based on ≥ 25 but <100 user-days, therefore the exposure may not be representative of this population subgroup.
C.2. Subchronic Exposure
Subchronic dietary exposure analysis is not routinely conducted. When dietary exposure is a major contributor to the total aggregate risk (C.4.c. Aggregate Exposure), seasonal dietary exposure may be appropriate for certain scenarios, i.e., the aggregate exposure of a worker exposed to a pesticide in the diet and at work only during the summer. In particular, when chronic exposure is near the risk level of concern, and the subchronic and chronic NOELs are similar, a seasonal exposure may be useful for a thorough assessment. It should be noted that a
24

Guidance for Dietary Exposure Assessment DPR MT-3 Version IV
seasonal exposure should only be conducted with pertinent residue data for the specified season. More importantly, the seasonal focus greatly reduces the sample size of the consumption database (i.e., fewer number of user-days for the specified season compared to all seasons) and may introduce greater uncertainty in the exposure estimates.
An alternative to conducting seasonal exposure analysis is to closely examine both the acute and chronic dietary exposures for the possibility of using them as a bounding range for the seasonal exposure. In a subchronic exposure scenario, individuals in a population subgroup could potentially have higher than chronic (average) exposure depending on the consumption pattern and residues on the seasonal commodities. The overall exposure for the group is, however, expected to be closer to the chronic than acute exposure because it is highly unlikely that individuals would consume commodities containing residue levels at the highest detected residues (under Tiers 1 and 2 acute exposures) for the entire season. On the other hand, the exposure for a shorter-term (e.g., 2-week) can be closer to the acute than the chronic exposure especially if the same or similar batch of food could be consumed over this period of time.
C.3. Lifetime Exposure
Dietary exposure assessment for oncogenic endpoints can be estimated based on the model output for chronic exposure analysis. Theoretically, the lifetime exposure is an amortized expression for all age groups. The following equation specifically accounts for the higher intake early in life (i.e., through infant and childhood years) than during adulthood.
1 2 3LADD = ( x AADDinfant ) + ( x AADD1-2 ) + ( x AADD3-5 )70 70 70
7 7 30 + (
70xAADD 6-12 ) + (
70xAADD 13-19 ) + (
70xAADD 20-49 )
20 + ( xAADD50+ )70
where, LADD = lifetime average daily dose; AADD = annual average daily dose. The subscripts of infants, children 1-2 years, children 3-5 years, children 6-12 years, youth 13-19 years, adults 20-49 years, and adults 50+ years refer to standard subpopulations in the DEEM-FCID™ software. This equation can be modified to incorporate the extra default uncertainty factors for addressing the genotoxic mechanism of carcinogenicity during early-lifestage (USEPA, 2005).
Alternatively, with DEEM-FCID™, the amortized lifetime exposure is usually the same as the chronic exposure output for the "U.S. population". Therefore, unless the early-lifestage sensitivity adjustment is needed, the combined consumption of the entire U.S. population can be used as a surrogate for a LADD (Lifetime Average Daily Dose). A NOEL (or its equivalent, e.g., ED or LED) or potency factor is entered for the oncogenic endpoint and the calculated exposure is expressed as a MOE (for NOEL) or as a lifetime cancer risk (for potency factor).
25

Guidance for Dietary Exposure Assessment DPR MT-3 Version IV
C.4. Other Exposure Scenarios
C.4.a. Exposure from Residues in Water
Drinking water exposure should be included in the dietary exposure assessment when there is information showing a likelihood for contamination, and when residues are detected in the drinking water. The two main sources of data for residue are the USDA PDP and DPR water monitoring databases. The USDA PDP drinking water project initially collected water samples from water treatment facilities in New York and California in 2001, and 3 additional states (Colorado, Kansas, and Texas) in 2002 (USDA, 2005). In 2004, paired samples of both raw water at the intake and finished water exiting the treatment plants were collected at 16 sites in Michigan, North Carolina, Ohio, Oregon, Pennsylvania, and Washington State.
The DPR well-water monitoring database provides an estimate of residues, but may not be representative of that in the drinking water (DPR, 2004a). Well water is often mixed and treated before delivered to the households. Any well water concentration that exceeds the maximum contaminant level (MCL) should not be used in the total exposure assessment because it exceeds the regulatory limit and in itself would represent a level of health risk of concern. A drinking water MCL is also not used as a default residue value for dietary exposure of a pesticide because it is a standard for drinking water from all sources of contamination, not only from pesticidal use (USEPA, 2002b). The establishment of the MCL also incorporates considerations other than health risk (e.g., benefits and technological feasibility of removing the contaminant), which are outside the scope of the DPR health risk assessment.
C.4.b. Exposure from Metabolites and Degradates
Some pesticides produce toxicologically significant environmental degradates or metabolites. DPR procedure is to assess the exposures of these chemicals, even if there are no established tolerances. When there are inadequate or lack of residue data for the metabolites or degradates, the potential for exposure and toxicity should be discussed in the risk appraisal of the risk assessment. When there are sufficient residue data, the exposures to these metabolites or degradates are included as a part of the dietary exposure assessment for the parent chemical. Toxicity Equivalence Factor (TEF) can be used to calculate the total residue level that is equivalent to the parent chemical. When toxicity data are insufficient, a default TEF of 1 can be assumed. The following two approaches can be used to address the total exposure, depending on what is known about the mode of action or any common toxicity endpoint.
Similar Mode of Action or Common Endpoint For some pesticides, the parent chemical is converted to active metabolites with a similar mode of action or common endpoint. The most common class is the organophosphates, in which the parent and metabolites can cause cholinesterase inhibition. One example is the chemical-metabolite pair of methyl parathion and methyl paraoxon in which the metabolite is more toxic than the parent chemical. Another example is the pesticide chemical-pair of naled and DDVP in which naled degrades to DDVP while both of them are also separately registered as pesticides. In these cases, the total residue is the sum of the parent chemical residue and the adjusted residue for the metabolite(s).
26

Guidance for Dietary Exposure Assessment DPR MT-3 Version IV
Total Equivalent Residue = Parent residue level + (Degradate residue level x TEF)
The TEF accounts for the quantitative difference in the toxicity (the ratio of NOEL, ED, or LED for the same toxicity endpoint, e.g., cholinesterase inhibition, or, less desirably, the LD50s) between these compounds. It is highly desirable that the total equivalent residue is calculated for each sample that accounts for co-existence of the parent chemical and its degradates. The highest total residue value and the average of all values are used for acute and chronic exposures, respectively.
If measured metabolite levels are not available, the extent of the potential metabolism could be estimated from the information (i.e., environmental fate, processing studies; surrogate commodities) available for the parent chemical. The highest measured residue value for the parent should be used in the following equation.
Total Residue = Parent residue level + (Parent highest residue level x fraction converted x TEF)
Different Mode of Action or Endpoint In cases where the toxicologically significant metabolites or degradates show different modes of action or endpoints of concern, the risk associated with their exposure is determined separately from that for the parent chemical. An example is the metabolic conversion of mancozeb residues (measured as ethylene bis-dithiocarbamate, EBDC) to ethylene thiourea (ETU) in the environment and following ingestion. While a value for environmental conversion has not been established, the USEPA estimated an in vivo bioconversion factor of 7.5% by weight (Kocialski, 1989). Thyroid tumors were reported in laboratory animals treated with ETU, but only pre-neoplastic effects (thyroid hyperplasia) were observed in those treated with mancozeb.
The total metabolite residue can be calculated in one of three ways depending on the type of residue data available. EBDC and the formation of ETU are used in the following for illustration.
1. For foods where both the parent and the metabolite were measured on the same food sample, the bioconversion factor is used as a surrogate for the environmental conversion factor:
Total ETU = ETUsample A + (EBDCsample A x bioconversion factor)
2. For processed foods where the parent and metabolite are not measured on the same sample, the bioconversion factor is applied to the highest level of the metabolite in the raw agricultural commodity, e.g., no EBDC data for processed carrots:
Total ETUprocessed carrots = ETUprocessed carrots + (EBDC highest value for all raw carrot samples x bioconversion factor)
3. For foods where ETU residue data were not available, 7.5% of the acute mancozeb residue was used as an estimate of the ETU residue. In some cases, the acute mancozeb residue was the tolerance, so the acute ETU residue was 7.5% of the mancozeb tolerance.
27

Guidance for Dietary Exposure Assessment DPR MT-3 Version IV
C.4.c. Aggregate Exposure
DPR evaluates the potential human exposure for the general public from all possible routes of exposure: oral via the diet, inhalation via the air and dermal absorption via the skin. For workers, the aggregate exposure accounts for the potential exposure as general public during non-working hours plus their exposure from the work environment. For the dietary exposure component, DPR determines that workers are best represented by food consumption data for males and females 16+ years old, which is the legal age for employment in the U.S. Aggregate exposure is the sum of all exposures (e.g., dietary exposure, ambient air and dermal exposure while not at work) and including the occupational exposures (i.e., work place inhalation and/or dermal exposures). The dietary exposure should be in the same units as those for the other routes. For example, the dietary exposure values should be adjusted with an oral absorption factor, if the exposures for the occupational routes are expressed as absorbed doses. When the aggregate exposure results in MOEs below the health protective level, additional refinement for the overestimated dietary exposure to achieve more realistic analysis may be appropriate.
C.4.d. Other Scenarios
The DPR dietary exposure assessment is concerned with pesticides with established tolerances for use in California. In cases where the pesticide with established tolerances is not registered for use in California, but treated commodities are available to the State, the dietary exposure assessment for this pesticide could be conducted to include commodities under such use or the exposures already estimated by the USEPA that include this use can be taken as a surrogate. The NOEL to estimate the risk should be that established by the DPR.
In the dietary exposure approaches described, the residue values selected are at or below the tolerance. Occasionally, a monitoring residue database shows samples with values higher than the tolerance (over tolerance). Over tolerance occurrences are relatively rare, usually less than 1% of all sampled commodities (USDA, 2003; DPR, 2004b). The concerns for exposure at over tolerance levels varies, depending on the extent of the over tolerance (the percentage of over tolerance samples, how often does over tolerance occur with a pesticide-commodity pair, where were these samples collected with respect to the consumers and edible portions, and how much higher was the residue over the tolerance). When an over tolerance is detected in California, the DPR procedure is to evaluate the dietary risk for the incident as concerns are raised. If necessary, the impact of these incidences on the overall risk can be included in the risk appraisal discussion of the total dietary risk assessment.
D. Tolerance Assessment
A tolerance is the legal maximum residue concentration of a pesticide, which may exist in or on a raw agricultural commodity or processed food. USEPA is responsible under the Federal Food, Drug, and Cosmetic Act (FFDCA) for setting tolerances for pesticide residues in raw agricultural commodities (Section 408 of FFDCA) and processed commodities. The tolerances are established at levels necessary for the maximum application rate and frequency, and are not expected to produce deleterious health effects in humans from chronic dietary
28

Guidance for Dietary Exposure Assessment DPR MT-3 Version IV
exposure (USEPA, 1991). The USEPA tolerances for crops can be found in the CFR 40 part 180 (Code of Federal Regulations, 2004).
The data requirements for the registration of pesticides and for establishment of tolerances include: (1) residue chemistry which includes measured residue levels from field studies, (2) environmental fate, (3) toxicology, (4) product performance such as efficacy, and (5) product chemistry (Code of Federal Regulations, 2004). The field studies must reflect the proposed use with respect to the rate and mode of application, number and timing of applications and the proposed formulations (USEPA, 1982).
In 1996, the Food Quality Protection Act (FQPA) amended the overall regulation of pesticide residues under Federal Insecticide Fungicide Rodenticide Act (FIFRA) and Federal Food Drug and Cosmetic Act (FFDCA) (USEPA, 1997a and b). One major change was the removal of the Delaney Clause that prohibited residues of cancer-causing pesticides in processed foods. FQPA requires scientific evidence to show that tolerances are safe for children. USEPA must consider applying an additional safety factor of up to 10-fold to take into account potential pre- and post-natal developmental toxicity and the completeness of the data. Under FQPA, USEPA is also required to reassess all existing tolerances and exemptions from tolerances for both active and inert ingredients by 2006 (USEPA, 1997c; 1998). Previously, USEPA reassessed tolerances as part of its reregistration and Special Review processes. In the evaluation of tolerances, the USEPA uses a tiered approach and the assessment includes all label-use commodities.
In California, Assembly Bill 2161 requires DPR to evaluate the health protectiveness of established tolerances in produce and processed food treated with pesticides (Bronzan and Jones, 1989). When the exposure to the pesticide posed health concern, DPR is to take regulatory action to modify the use or modify the tolerance.
D.1. Acute Exposure
DPR evaluates a tolerance through the assessment of the acute exposure to an individual commodity at the tolerance level. It does not include all commodities at their respective tolerance levels in the same analysis, because acute exposure at those levels is highly improbable. This conclusion is supported by data from both federal and DPR pesticide monitoring programs, which indicate that less than one percent of all sampled commodities have residue levels at or above the established tolerance (USDA, 2003; DPR, 2004b).
If a pesticide is registered for use on many commodities, it may only be necessary to carry out tolerance assessments for those with high dietary exposure due to high tolerance (i.e., >5 ppm) and/or consumption rate. The CEC report from the total "all food" acute dietary exposure using tolerance as the residue (Tier 1) provides some indication of which are the high contributing commodities. In addition, the tolerance assessment should consider commodities on the list of most frequently consumed commodities (FDA, 2002 and 2005; Table 5).
29

Guidance for Dietary Exposure Assessment DPR MT-3 Version IV
The acute tolerance analysis is conducted in two steps:
Step 1: Acute Tolerance Exposure Commodity “A” + Chronic Exposure all other foods (including “A”) Step 2: Acute Tolerance Exposure Commodity “A” + Chronic Exposure all other foods (excluding “A”)
Step 1 The acute exposure is estimated as the sum of the 95th percentile exposure for the single commodity "A" at the tolerance and a background exposure. For the single commodity analysis, the default hydration factors and the processing/cooking factors should be set at 1.0. The background exposure is added to account for residues in other commodities, which may also be treated with the same pesticide and consumed at the same time. The chronic dietary exposure from the total dietary exposure is used as a surrogate for background exposure. In this step, the exposure contribution of the commodity of interest is “double counted” (e.g., having pesticide residues at the tolerance and having average “chronic” residues). If the MOE for all population subgroup at this step is above the benchmark for acceptable exposure (i.e., MOE of 100), the acute tolerance assessment is concluded.
Step 2 If the MOE for any population subgroup from Step 1 is below the benchmark, the background dietary exposure is assessed again but without the commodity for which the tolerance is being evaluated. For example, if acute tolerance assessment is conducted for pesticide residues on tomatoes and tolerances existed for a total of 10 commodities, the chronic exposure is estimated for 9 commodities, with tomatoes excluded. Appendix E.4. is an example of the presentation of the acute dietary risk estimates at the tolerance.
D.2. Chronic Exposure
A chronic exposure assessment using residues equal to the established tolerances for individual or combinations of commodities is not conducted, because it is highly improbable that an individual would repeatedly consume a single or multiple commodities with pesticide residues at tolerance levels.
30

Guidance for Dietary Exposure Assessment DPR MT-3 Version IV
Table 5. The most commonly consumed fruits and vegetables in the US.a
Fruits Vegetables Apple Asparagus Avocado, California Bell pepper Banana Broccoli Cantaloupe Carrot Grapefruit Cauliflower Grape Celery Honeydew melon Corn, sweet Kiwi fruit Cucumber Lemon Green (snap) bean Lime Green cabbage Nectarine Green onion Orange Lettuce, iceberg Peach Lettuce, leaf Pear Mushroom Pineapple Onion Plum Potato Strawberry Potato, sweet Sweet cherry Radish Tangerine Summer squash Watermelon Tomato a/ Information from FDA, 2002. Foods are listed in alphabetical order.
31

Guidance for Dietary Exposure Assessment DPR MT-3 Version IV
E. References
Bronzan and Jones, 1989. Assembly Bill 2161, Addition to the Food and Agriculture Code SEC 8 section 13060. California Food and Agriculture Code, Sacramento, CA.
Code of Federal Regulations, 2004. Code of Federal Regulations 40 Parts 150 to 189, Revised as of July 1, 2004. Protection of Environment. Office of the Federal Register National Archives and Records Administration, Washington, D.C.
DPR, 2004a. Sampling for Pesticide Residues in California Well Water. 2004 Update of the Well Inventory Database. Department of Pesticide Regulation, California Environmental Protection Agency, Sacramento, CA. http://www.cdpr.ca.gov/docs/wellinv/wirmain.htm
DPR, 2004b. Residues in Fresh Produce, Pesticide Enforcement Branch, Department of Pesticide Regulation, Sacramento, CA.
FCID, 2000. Food commodity intake database (FCID). NTIS Order Number: PB2000-500101 Available through http://www.ntis.gov.
FDA, 2002. Food Labeling: Nutrition Labeling of Raw Fruit, Vegetables and Fish; Proposed Rule. Code of Federal Regulations, 21 CFR, Part 101. 1991.
FDA, 2005. Food Labeling; Guidelines for Voluntary Nutrition Labeling of Raw Fruits, Vegetables, and Fish; Identification of the 20 Most Frequently Consumed Raw Fruits, Vegetables, and Fish; Reopening of the Comment Period. Federal Register 70(63):1699517007, April 4, 2005.
Kocialski, A.B., 1989. (1) Establishment of an in vivo Metabolic Conversion Factor of 7.5% for All Ethylene bis(dithio) Carbamates (EBDCs) When Converting EBDCs to Ethylene Thiourea (ETU) in vivo, and (2) Recalculation of the Previously Considered 20% in vivo Conversion/Exposure Factor for EBDCs to ETU. Health Effects Division, Office of Pesticide and Toxic Substances, U.S. Environmental Protection Agency, Washington, DC.
USDA, 1996-2000. Special Single Serving Project Testing. Pesticide Data Program, U.S. Department of Agriculture, Manassas, VA. http://www.ams.usda.gov/science/pdp/CommodHist.pdf
USDA, 2005. Finished Drinking Water Monitoring Survey. Pesticide Data Program, U.S. Department of Agriculture, Manassas, VA. http://www.ams.usda.gov/science/pdp/Water.htm
USEPA, 1982. Pesticide Assessment Guidelines Subdivision O-Residue Chemistry. Office of Pesticides and Toxic Substances, # EPA-540/9-82-023. U.S. Environmental Protection Agency, Washington, D.C.
32

Guidance for Dietary Exposure Assessment DPR MT-3 Version IV
USEPA, 1991. For Your Information – Pesticide Tolerances. Pesticide and Toxic Substances (H7506C) August 1991. U.S. Environmental Protection Agency, Washington, D.C.
USEPA, 1997a. The Federal Insecticide Fungicide, and Rodenticide Act (FIFRA) and Federal Food, Drug, and Cosmetic Act (FFDCA) as Amended by the Food Quality Protection Act (FQPA) of August 3, 1996. Document no. 730L97001, March 1997. Office of Pesticide Programs, U.S. Environmental Protection Agency, Washington, D.C.
USEPA, 1997b. The 1996 Food Quality Protection Act Implementation Plan. March 1997. Office of Prevention, Pesticides and Toxic Substances 7506C, U.S. Environmental Protection Agency, Washington, D.C.
USEPA, 1997c. Raw and Processed Food Schedule for Pesticide Tolerance Reassessment. Federal Register 62(149):42020-42030. U.S. Environmental Protection Agency, Washington, D.C.
USEPA, 1998. Framework of Addressing Key Scientific Issues Presented by the Food Quality Protection Act (FQPA) as Developed through the Tolerance Reassessment Advisory Committee (TRAC). Federal Register vol. 63, Number 209, October 29, 1998. http://www.epa.gov/fedrgstr/EPA-PEST/1998/October/Day-29/p29013.htm
USEPA, 1999a. Use of Pesticide Data Program (PDP) in Acute Dietary Assessment (May 5, 1999, Draft). Office of Pesticide Programs, U.S. Environmental Protection Agency, Washington, DC.
USEPA, 1999b. Classification of Food Forms with Respect to Level of Blending. HED Standard Operating Procedure 99.6 (8/20/99). Office of Prevention, Pesticides and Toxic Substances, U.S. Environmental Protection Agency, Washington, DC.
USEPA, 1999c. Translation of Monitoring Data. HED Standard Operating Procedure 99.3 (3/26/1999). Memorandum from M. Stasikowski to HED staff. U.S. Environmental Protection Agency, Washington, DC.
USEPA, 2000a. Choosing a Percentile of Acute Dietary Exposure as a Threshold of Regulatory Concern. Office of Pesticide Programs, U.S. Environmental Protection Agency, Washington, DC. http://www.epa.gov/oppfead1/trac/science/trac2b054.pdf.
USEPA, 2000b. Guidance for Refining Anticipated Residue Estimates Used in Acute Dietary Probabilistic Risk Assessments. Office of Pesticide Programs, U.S. Environmental Protection Agency, Washington, DC.
USEPA, 2000c. Assigning Values to Non-Detected/Non-Quantified Pesticide Residues in Human Health Food Exposure Assessments. Office of Pesticide Programs, U.S. Environmental Protection Agency, Washington, DC.
33

Guidance for Dietary Exposure Assessment DPR MT-3 Version IV
USEPA, 2002a. OPP/HED Transition from DEEM™ 7 to DEEM™-FCID: Handling of Default Processing Factors. Health Effects Division, Office of Pesticide Programs, U.S. Environmental Protection Agency, Washington, DC.
USEPA, 2002b. List of Drinking Water Contaminants & MCLs. Office of Water, U.S. Environmental Protection Agency, Washington, D.C. http://www.epa.gov/safewater/mcl.html
USEPA, 2005. Supplemental Guidance for Assessing Susceptibility from Early-Life Exposure to Carcinogens. EPA/630/R-03/003F, March 2005. Risk Assessment Forum, U.S. Environmental Protection Agency, Washington, DC.
34

Guidance for Dietary Exposure Assessment DPR MT-3 Version IV
Appendix A. Glossary and Abbreviations
AADD Annual Average Daily Dose BEAD Biological and Ecological Analysis Division CEC Critical Exposure Commodity Analysis CFR Code of Federal Regulations CSFII Continuing Survey of Food Intake by Individuals DEEM™ Dietary Exposure Evaluation Model DEEM-FCID™ DEEM-Food Commodity Ingredient Database DPR Department of Pesticide Regulation FDA Food and Agriculture Administration FIFRA Federal Insecticide Fungicide, and Rodenticide Act FFDCA Federal Food Drug and Cosmetic Act FQPA Food Quality Protection Act LADD Lifetime Average Daily Dose LOD Limit of Detection MCL Maximum Contaminant Level. MOE Margin of Exposure NASS National Agricultural Statistical Service ND Non-Detect NOEL No-Observed-Effect Level PCT Percent of the Crop Treated PDP Pesticide Data Program RAC Raw Agricultural Commodity RDF Residue Data File USDA United State Department of Agriculture USEPA United State Environmental Protection Agency
35

Guidance for Dietary Exposure Assessment DPR MT-3 Version IV
Acute Exposure Exposure for 1 to a few days
Blended Food Foods are mixed over a wide geographic region prior to consumption, such as grains, beans, and sugars. "Blended food" is also relative term that is used when comparing the food being evaluated to the food that was used in the residue analysis.
Chronic Exposure Repeated exposure in one year
Commodity Contribution Analysis This analysis in DEEM-FCID™ identifies the contribution of crop groups or individual food forms to the overall chronic dietary exposure. It is used to select the commodities with high contribution to the exposure for residue refinement in the tier approaches.
Critical Exposure Commodity (CEC) Analysis This analysis in DEEM-FCID™ identifies commodities contributing to the dietary exposure and provides individual consumption records included in the acute dietary exposure. The records are useful to identify individuals with high-end exposures or any apparent error in the consumption database (e.g., unreasonable body weight for a given age, or high consumption of a particular commodity).
Department of Pesticide Regulation (DPR) Monitoring Program DPR's marketbasket surveillance program collects RAC samples in California for tolerance enforcement. Some sample sites are selected based on violation history. The samples are tested with multiresidue screens capable of detecting more than 200 pesticides and breakdown products. In addition, selected samples receive specific analysis for non-screenable pesticides of enforcement concern. DPR also collects and analyzes samples for the PDP program for use in dietary exposure. There are overlaps in the sample sites between this program and the surveillance program. In comparison to the PDP, the DPR database contains residue values for many more commodities for multiple years, but generally fewer samples per commodity.
Food and Drug Administration (FDA) Monitoring Program The FDA monitors residues in domestic and imported commodities (RAC and processed foods) for the enforcement of tolerances set by the USEPA. Domestic samples are collected close to the point of production, while imported samples are collected at the port of entry. The RAC are analyzed as unwashed and whole (unpeeled, with outer leaves). The sampling strategy considers history of residue data, pesticide use, dietary importance of the food, information on the amount of domestic food that enters interstate commerce and of imported food, chemical
36

Guidance for Dietary Exposure Assessment DPR MT-3 Version IV
characteristics and toxicity of the pesticide, as well as production volume and pesticide usage patterns.
Food Quality Protection Act This Act of 1996 amended the Federal Food, Drug, and Cosmetic Act (FFDCA) and Federal Insecticide, Rodenticide, and Fungicide Act (FIFRA) to require greater health and environmental protection for pesticide use. It also requires special consideration for the protection of infants and children using an additional safety factor in setting exposure standard.
Hydration Factor A factor used to account for the change in hydration due to processing from the RAC to its food form (e.g., dry onions, dried tomato paste, lemon juice-concentrate). This factor is set to 1.0 when the residue value is based on the tolerance. This user-specified factor is entered as Adjustment Factor #2 in the DEEM™ software.
Lifetime Exposure Exposure during a person’s normal lifetime
Limit of Detection A generic term used in this Guidance to represent the limit of detection (LOD), limit of quantitation (LOQ), minimum detection limit, or lowest reported residue level.
Maximum Contaminant Level The maximum level of a contaminant permitted to be present in water delivered to users of the public water system. It is established under the Safe Drinking Water Act.
Margin of Exposure A term to express the risk associated with human exposure to a chemical. It is the ratio of the NOEL to the human exposure level. The NOEL is the highest dose level in a toxicological study at which no effects are observed.
No-Observed-Effect Level The highest dose level in a toxicological study at which no biologically and/or statistically significant effects are observed.
Partially Blended Partially blended commodities are generally small to medium sized fruits, such as berries and nuts, for which small-scale mixing occurs prior to consumption.
37

Guidance for Dietary Exposure Assessment DPR MT-3 Version IV
Pesticide Data Program (PDP) This program is designed to collect data, which best represent pesticide residues in the food supply, and is specifically developed for dietary risk assessments conducted by the USEPA. The program collects a large number of random samples (RAC and processed foods) close to the consumer level from several states, including California, and analyzes only the edible portions using methods to detect multiple pesticide residues per sample. The selection of the pesticide analyzed and commodities sampled are based on the toxicity of the pesticide, and has focused on commodities common in the diets of infants and children. Additional projects have included comparison of residues in single serving size versus composite samples; and collection of data for residues in grains, frozen and canned foods, beef, poultry, butter, milk, and drinking water.
Plot File The Plot File in the DEEM™ software provides the frequency of exposure distribution at a specified statistical bin and for each of the population subgroups under analysis. It is reviewed for the number of user-days at the high-end of exposure.
Potency Factor The potency is the slope of the dose-response curve describing the proportion of experimental animals with cancer, in relationship to the dose of the chemical given. It is expressed as the maximum likelihood estimate (q1) or its 95% confidence limit (q1*); these are referred to as potency factors. Mathematical models are used to determine the slope with the assumption that a threshold does not exist for the effect to be manifested. Any minute increase in the exposure will result in a proportional increase of risk. The risk is assumed to be proportional to the total amount of exposure over a lifetime.
Processing Factor A factor used to account for the potential increase or decrease in residues when a treated RAC is processed such as washing, cooking, or freezing. This factor is set to 1.0 when the residue value is based on the processed food samples. This user-specified factor is entered as Adjustment Factor #2 in the DEEM™ software. When this factor is included, the final residue value should not exceed the tolerance.
Residue Data File For acute analyses performed with DEEM-FCID™ software, the pesticide residue values are entered into residue data files (RDF files), which are randomly paired with the CSFII consumption data during the Monte Carlo analysis.
Reference Concentration The exposure limit below which no adverse health effects are expected in humans after long-term exposure. It is the ratio of the NOEL to the uncertainty factor. Percent of Reference Concentration, an expression of risk, is the ratio of human exposure level to the Reference Concentration multiplied by 100%.
38

Guidance for Dietary Exposure Assessment DPR MT-3 Version IV
Registrant Conducted Studies Registrants of pesticides conduct field trial studies for RAC to gather data for the establishment of tolerances and to the DPR as part of the registration process for use in California. These studies are conducted for new uses or modification of current use patterns (i.e., higher application rate, and shorter pre-harvest interval). The trials are generally conducted on limited number of commodities, with the number of trials depending on the use pattern, and includes higher application and shorter preharvest interval than those proposed to be on the label. These RAC samples are also not pre-cleaned before analysis.
The registrants may also conduct residue survey studies for RAC and processed foods to provide data to regulatory agencies, for example in response to USEPA Data Call-In Notices due to the lack of adequate residue data. The duration of these studies is generally limited and the sampling strategy depends on the deficiencies in the existing database.
Subchronic Exposure Repeated exposure for more than a few days but less than 1 year.
Total Person-Days The number of total Person-Days (or records) is equivalent to the number of people participating in the CSFII survey multiplied by the number of days surveyed. For example, 50 people returning a 2-day survey results in 100 Person-Days.
Tolerance A tolerance is the legal maximum residue concentration of a pesticide, which may exist in or on a raw agricultural commodity or processed food. It is established by the U.S. Environmental Protection Agency.
Unblended foods Foods for which no mixing occurs prior to consumption, for examples, whole apples, bananas and carrots.
Uncertainty factor A numerical value to express the uncertainty in the toxicological database, as well as uncertainty in the variability of response between species (interspecies) and individual humans (intraspecies).
User Days The number of days during the survey in which at least one of the commodities with established tolerance was consumed by an individual. For example, the record for a person who ate an apple only for one day of the two day surveyed is considered as one User-Day. In the Acute Exposure result, the size of the user-days for each population subgroup is indicated as a percent of the total person days (i.e., % person-days that are user-days). The actual number of user-days is shown in the Plot File (*.PLT).
39

Guidance for Dietary Exposure Assessment DPR MT-3 Version IV
Appendix B. Blended Food and Food Forms
The appendix is organized for the most part according to groups (bolded). When there is/are specific form(s) unique to the commodity, it is listed as a separate entry.
Arrowroot: flour Beans: dried Beet: sugar Carob Cocoa bean: chocolate, powder Coffee: roasted bean, instant Dairy: milk (fat, nonfat solids, water, sugar), egg (whole, white, yolk) Fruits, dried: coconut, apple, apricot, peach, pear, banana, papaya, pineapple, plantain Grains: barley (pearled, flour), buckwheat, corn-field (flour, meal, bran, starch, syrup, oil), corn-pop, hop, millet (grain), oat (bran, flour, groats/rolled oats), rice (white, brown, flour, bran, wild), rye (grain), sorghum (syrup), triticale (flour), wheat (grain, flour, germ, bran) Herbs: amaranth (grain), basil (fresh and dried), chive, dill, marjoram, parsley, peppermint, savory, and others. Maple: sugar, syrup Oils: almond, coconut, cottonseed, flaxseed, olive, palm, peanut, rapeseed, sesame, sunflower Peanut: peanuts, peanut butter Potato: chips, dried potato, potato flour Seeds: pumpkin, guar, alfalfa, psyllium, sunflower Soybean: seed, flour, soy milk, oil Spices: cinnamon, coriander (leaves, seed), dill (seed), pepper (white, black), and others Sugar cane: sugar, molasses Tea: dried, instant Tomato: paste, puree, dried Vinegar Vegetables: dried: garlic, ginger, onion (dry bulb, dried), pepper (bell and non-bell) a/ Information from CARES (Cumulative and Aggregate Risk Evaluation System), Version 2.0 (Build date 11/ 24/2004);
http://cares.ilsi.org/.
40

Guidance for Dietary Exposure Assessment DPR MT-3 Version IV
Appendix C. List of Surrogate Commodities
In the following table, the commodities commonly monitored in residue programs are paired with the applicable crop groups (USEPA, 1999c) when surrogate residue data are needed. The crop grouping is specified in 40 CFR 180.41 and 180.34.
Commodity Analyzed Use as Surrogates For: Apple or Pear Group 11 Bean, green Subgroups 6-A and 6-B Broccoli Cauliflower, Chinese broccoli, Chinese
cabbage bok choy, Chinese mustard, kohlrabi
Cantaloupe or winter squash Subgroup 9-A and pumpkin Carrot Subgroup 1-A or 1-C Cucumber Subgroup 9-B Grape Kiwifruit Lettuce, head Cabbage, Chinese cabbage napa (tight
headed varieties), Brussel spouts, radicchio Milk Meat (but only if metabolism study shows
residues in meat are expected to be at or lower than those in milk).
Peach Group 12, except cherries (sweet and tart) Potato Subgroup 1-C Soybean Subgroup 6-C Spinach Subgroup 4-A, Subgroup 5-B and Subgroup
4-B (except celery and fennel, which may contain higher residues due to the leaf formation)
Tomato, or Pepper, bell Group 8 Wheat Group 15, except corn, rice, or wild rice
41

Guidance for Dietary Exposure Assessment DPR MT-3 Version IV
Appendix D. Default Processing Factors
The default processing factors (including dehydration) presented in the following table are from DEEM™ (version 7.6) and should be manually entered into the DEEM-FCID™ residue file. This table does not include DEEM™ default adjustment factors for all "juice concentrates", "fishfinish-salt water-dried", "tomato catsup" and "veal, dried" because these food forms are not in the DEEM-FCID™ software. On the other hand, because of the difference in translation recipe between the two software, some food forms in DEEM-FCID™ to which these factors should be applied are not listed in the table because they are not in DEEM™. One example is "potatoes, flour", a food form in DEEM-FCID™, is not included in the following table because it is not a food form in DEEM™. In this case, the DEEM™ factor for "potatoes, white, dried" should be extended to "potatoes, flour" in DEEM-FCID™ (see illustration at the end of this Appendix).
Commodities Dehydration and Processing Factors for use in DEEM-FCID™
Commodities Dehydration and Processing Factors for use in DEEM-FCID™
Apples, dried Apples, juice
8.0 1.3
Lychees, dried 1.85
Apricots, dried 6.0 Onions, dried 9.0 Bananas, dried 3.9 Oranges, juice 1.8 Beef, dried 1.92 Papayas, dried
Papayas, juice 1.8 1.5
Cherries, dried Cherries, juice
4.0 1.5
Peaches, dried 7.0
Coconut, dried 2.1 Peanuts, butter 1.9 Corn grain/sugar, hfcs Corn grain/sugar, molasses
1.5 1.5
Pears, dried 6.25
Cranberries, juice 1.1 Pineapples, dried Pineapples, juice
5.0 1.7
Grapefruit, juice 2.1 Plums/prunes, dried Plums/prunes, juice
5.0 1.4
Grapes, raisins Grapes, juice
4.3 1.2
Potatoes white, dried Potatoes, flour
6.5
Lemons, juice 2.0 Tangerines, juice 2.3 Limes, juice 2.0 Tomatoes, juice
Tomatoes, puree Tomatoes, paste Tomatoes, dried
1.5 3.3 5.4
14.3
42

Guidance for Dietary Exposure Assessment DPR MT-3 Version IV
USEPA (2002a) recommended that some low level factors be set to 1 because they don't appear to make significant difference to the overall exposure. These items include: various fruit juice (i.e., apple, cranberries, grapes, lemons, limes, tangerines, cherries, plums/prune, papayas, tomatoes), dried beef and veal, and corn grain sugar (hfcs and molasses). These recommendations are not adopted by DPR at this time because setting these factors to 1 can significantly reduce the estimate of exposure in the context of user day distribution for a single commodity. This can be illustrated with the following 3 examples.
1) The following two examples illustrate the use of DEEM™ adjustment factors in DEEMFCID™ with or without setting the juice factor from 1.5 to 1.
a) Total apple food consumption from DEEM-FCID™
Total user-day apple consumption (g/kg BWt) with either "juice" adjustment factor of 1.5 from DEEM™ or set to 1 as proposed by USEPA.
1.0 factor for apple juice 1.5 factor for apple juicea
95th 99th 99.9th 95th 99th 99.9th U.S. population 14.98 34.24 69.21 18.23 42.98 88.02 1-2 yr 43.73 70.78 120.90 56.36 110.87 155.60 3-5 yr 29.52 49.23 96.13 36.58 73.80 124.11 20-49 yr 5.47 11.80 18.20 6.53 14.70 23.71 a/ The total consumption include all baby foods ("juice", "sauce", "peeled fruit") but the 1.5 factor is only applicable to "juice".
b) Total tomato consumption from DEEM-FCID™ Total user-day tomato consumption (g/kg BWt) with "juice" adjustment factor of 1.5 from DEEM™ or set to 1 as proposed by USEPA.
1.0 factor for tomato juice 1.5 factor for tomato juice 95th 99th 99.9th 95th 99th 99.9th
U.S. population 9.84 20.33 44.09 10.02 20.41 44.32 1-2 yr 25.92 44.47 83.21 25.95 44.80 84.30 3-5 yr 21.23 37.34 70.55 21.20 37.48 70.91 20-49 yr 7.62 14.45 29.17 7.76 14.52 29.33
43

Guidance for Dietary Exposure Assessment DPR MT-3 Version IV
2) Total potato consumption from DEEM-FCID™
This example illustrates the use of DEEM™ adjustment factors for "potatoes, white, dried" to "potatoes, flour" in DEEM-FCID™, although this factor is not explicitly listed for "flour" in the adjustment factor table because it is not coded in DEEM™. The application of proper adjustment factor should be carried out regardless of the impact to the final analysis.
Total potato consumption (g/kg BWt) when adjustment factor #1 of 6.5 is applied to "dried" or both "dried" and "flour" food forms.
6.5 factor for potatoes "dried" only 6.5 factor for potatoes "dried" & "flour" 95th 99th 99.9th 95th 99th 99.9th U.S. population 4.49 8.51 18.95 4.51 8.57 19.19 1-2 yr 10.41 18.85 37.19 10.47 18.90 37.00 3-5 yr 9.02 15.05 28.25 9.09 15.31 28.30 20-49 yr 3.75 6.00 10.20 3.79 6.03 10.27
44

Guidance for Dietary Exposure Assessment DPR MT-3 Version IV
Appendix E. Examples of Data Presentation
In the following appendices, examples of the pertinent information to be presented in the dietary exposure assessment tables are provided. The residue data table should contain a summary of the residue information for each commodity as indicated in the example (Appendix E.1). For the margins of exposure tables (Appendices E.2 to E.4), input parameters (e.g., residue data, consumption database, NOEL, and the number of iterations and the Seed number in the Monte Carlo simulation) used in the dietary exposure determination should be indicated in the Figure legend. The legend should also indicate population subgroups with few user-days (< 25 user-days) as shown in Appendix E.4.
E.1. Residue Data E.2. Margins of Exposure for Acute Tier 3 Exposure Assessment E.3. Margins of Exposure for Chronic Exposure Assessment E.4. Margins of Exposure for Acute Tolerance Assessment
45

Guidance for Dietary Exposure Assessment DPR MT-3 Version IV
Appendix E.1. Residue Data Summary
Commodity Source of Data Year Number
Samples
Number Detected Samples
Detected Residues
(ppm)
Range LOD (ppm)
% Crop Treateda
Adj. Factorb
Acute Residue (ppm)
Tier 2 Tier 3
Chronic Average Residue (ppm)
Beans dry (blackeye peas/cowpea, broadbeans, garbanzo/ chick pea, great northern, hyacinth, kidney, lima, navy, pigeon, pinto, others)
PDP datac
for processed
green beans
1996 531 18
0.003-0.38 0.0020.013 4% 1 0.380 RDF1d 0.0024 1997 707 33
1998 360 15
Corn grain (bran, endosperm, oil, sweet corn)
PDP data for
processed sweet corn
in CA
1994 69 0
No detectable residues 0.003 7 % 1 0.003 RDF2 0.0015 1995 139 0
1996 40 0
Cottonseed (meal and oil)
Field trial data 1985 37 37 0.06-0.66 0.010 17% 1 0.660 0.660 0.3460
Oats FDA datae 1999 332 0 No detectable residues 0.006 1% 1 0.006 RDF4 0.0030
Onions (dehydrated or dried, dry-bulb cipollini)
DPR dataf 19912000 1221 0 No detectable
residues 0.010 9% 9x 0.010 RDF5 0.0050
Onions (green) DPR data 1995
2000 744 2 0.01-0.03 0.020 9% 1 0.030 RDF6 0.0110
a/ The Percent Crop Treated was from the 1999 report by the USDA Biological and Economical Analysis Division (BEAD). b/ DEEM™ default factors to account for changes in the hydration state of foods. c/ Pesticide Data Program (PDP) implemented by the United States Department of Agriculture (USDA).d/ Residue Distribution File (RDF) containing all detected residue values to determine the exposure distribution.e/ Regulatory Residue Monitoring Program of the Food and Drug Administrations (FDA). f/ Department of Pesticide Regulation (DPR) Priority Pesticide and Market Basket Surveillance Program.
46

Guidance for Dietary Exposure Assessment DPR MT-3 Version IV
Appendix E.2. Margins of Exposure for Acute Tier 3 Exposure Assessment
ACUTE MOEa
PCT-Adjusted ExposuresbPopulation Subgroup
95 Percentile 99th Percentile 99.9th Percentile
US Population (all seasons) 112 51 26
Western Region 83 40 22
Hispanics 75 37 21
Non-Hispanic Other 42 26 14
All infants 55 23 9
Children 1-2 years 58 30 16
Children 3-5 years 60 44 28
Children 6-12 years 162 78 42
Adults 20-49 years 125 59 34
Adults 50+ years 195 92 37
Females 13-49 years 140 67 32
a/ DEEM™software was used for this Tier 3 analysis with the following input parameters: (i) USDA CSFII from 1994-1998, (ii) acute NOEL of 0.025 mg/kg (cited reference), (iii) 500 iterations, and (iv) Seed of 10 for the Monte Carlo analysis. MOE is defined as NOEL/Acute Dietary Exposure. Acute dietary exposure was calculated at the 95th
to 99.9th percentiles of user-days for all population subgroups.
b/ The percent crop treated adjustment factors from USEPA BEAD were applied to the commodities (specify).
47

Guidance for Dietary Exposure Assessment DPR MT-3 Version IV
Appendix E.3. Margins of Exposure for Chronic Exposure Assessment
Population Subgroup Chronic MOEa,b
US Population (all seasons) 3837
Western Region 3549
Hispanics 3319
Non-Hispanic Whites 2745
Non-Hispanic Blacks 4316
Non-Hispanic Other 1582
All infants 2282
Infants (nursing, <1 year) 5051
Infants (non-nursing, <1year) 3357
Children 1-2 years 3824
Children 3-5 years 5045
Children 6-12 years 6300
Youth 13-19 years 3772
Adults 20-49 years 4331
Adults 50+ years 4988
Females 13-49 years 5009
US Population (spring season)c 3991
a/ The DEEM™ software was used for the chronic dietary analysis with the following input parameters: (i) USDA CSFII from 1994-1998, and (ii) Chronic NOEL of 0.01 mg/kg/d (reference cited). MOE is defined as NOEL/Chronic Dietary Exposure. The lowest MOEs are indicated in bold.
b/ The percent crop treated adjustment factors were used for the commodities (specify).
c/ The dietary exposure of the US population during the spring season was used to estimate the combined subchronic (two month) exposure from occupational and dietary sources for workers.
48

Guidance for Dietary Exposure Assessment DPR MT-3 Version IV
Appendix E.4. Margins of Exposure for Acute Tolerance Assessment
Commodity Tolerance (ppm) Range of Exposure (μg/kg/day) a
Range of Margin of Exposure b,c
Barley 1.00 4.28-0.07 5 – 336d
Beans (dry) 1.00 4.47-1.49 5 - 16 Corn 1.00 10.86-2.03 2 - 12 Cotton 0.75 0.27-0.04 93 - 623 Oats 1.00 5.09-0.91 4 - 27 Onions 1.00 1.66-0.70 15 - 35 Peas (dry) 1.00 2.15-0.59 11 - 42 Pecans 0.10 0.03-0.02 757 -1355 Potatoes 0.10 1.13-0.34 22 - 74 Rice 1.00 1.72-5.03 4 - 14 Soybeans 0.10 0.74-0.07 33 – 370e
Walnut 0.10 0.03-0.01 981 -2374 Wheat 1.00 8.66-2.48 2 - 10
a/ Acute dietary exposure assessment was conducted for a pesticide (give actual name) on each of the registered commodities in California at a level equal to the U.S.EPA tolerance. DEEM™ software was used for the analysis with the following input parameters: (i) USDA CSFII from 1994-1988 and (ii) acute NOEL of 0.025 mg/kg (reference cited). The exposure was calculated as the sum of the 95th percentile exposure for each commodity at the tolerance and the chronic dietary exposure, as a surrogate for background exposure.
b/ Margin of Exposure (MOE) is defined as NOEL/Acute Dietary Exposure; The number of user-days ranged from 26 to 40070 .
c/ Total of 19 consumer groups were considered to be exposed to tolerance levels of methyl parathion residue. These include: US Population (all seasons), Western Region, Hispanics, Non-Hispanic whites, Non-Hispanic, Blacks, Non-Hispanic Other, All infants, Infants (nursing, <1yr.), Infants (non-nursing, <1yr.), Children 1-6 yrs, Children 7-12 yrs, Females 13+ yrs (pregnant, not nursing), Females 13+ yrs nursing, Females 13-19 yrs (not pregnant or nursing), Females 20+ yrs (not pregnant or nursing), Females 13-50 yrs, Males 13-19 yrs, Males 20+ yrs, Seniors 55+ yrs.
The following population subgroups had less than 25 user-days and were not included in the tolerance assessment: Nursing Infants (dry beans, peas), Females 13+ nursing (dry beans, pecans, walnuts, peas), Females 13+ pregnant (oats, pecans, walnuts, peas), All Infants (pecans, walnuts, peas) and Children 7-12 yrs., Non-Hispanic-non-white-non-black, Females 13-19 yrs., and Males 13-19 yrs (peas).
d/ The MOEs were greater than 100 for only four population subgroups with barley at the tolerance value: Children 1-6 yrs., Children 7-12 yrs., Pregnant females 13+ yrs., and Females 13-19 yrs. The remaining population subgroups had MOEs that were 55 or less.
e/ The MOEs were greater than 100 for all population subgroups with soybeans, except for all infants (nursing and non-nursing).
49