Embed Size (px)
Citation preview

NBER WORKING PAPER SERIES
DID FIRMS SUBSTITUTE DIVIDENDS FOR SHARE REPURCHASES AFTERTHE 2003 REDUCTIONS IN SHAREHOLDER TAX RATES?
Jennifer L. BlouinJana Smith Raedy
Douglas A. Shackelford
Working Paper 13601http://www.nber.org/papers/w13601
NATIONAL BUREAU OF ECONOMIC RESEARCH1050 Massachusetts Avenue
Cambridge, MA 02138November 2007
The authors have benefited greatly from discussions with Jeff Brown, Raj Chetty, Emmanuel Saez,and Scott Weisbenner and research assistance from Kevin Markle. We are responsible for all remainingerrors. The views expressed herein are those of the author(s) and do not necessarily reflect the viewsof the National Bureau of Economic Research.
© 2007 by Jennifer L. Blouin, Jana Smith Raedy, and Douglas A. Shackelford. All rights reserved.Short sections of text, not to exceed two paragraphs, may be quoted without explicit permission providedthat full credit, including © notice, is given to the source.

Did Firms Substitute Dividends for Share Repurchases after the 2003 Reductions in ShareholderTax Rates?Jennifer L. Blouin, Jana Smith Raedy, and Douglas A. ShackelfordNBER Working Paper No. 13601November 2007JEL No. G3,G35,H24,H25
ABSTRACT
This paper tests whether firms altered their dividend and share repurchase policies in response to the2003 reductions in shareholder tax rates. We predict that firms substituted dividends for repurchases,because the reduction in dividend tax rates exceeded the reduction in the capital gains tax rates. Asexpected, we find substitution and find that it is increasing in the percentage of the company ownedby individual investors, the only shareholders affected by the legislation. These findings are consistentwith boards of directors considering the tax preferences of individual stockholders (particularly officersand managers) when setting dividend and share repurchase policies.
Jennifer L. BlouinUniversity of PennsylvaniaThe Wharton School3620 Locust Walk1315 Steinberg Hall-Dietrich HallPhiladelphia, PA [email protected]
Jana Smith RaedyKenan-Flagler Business SchoolUniversity of North Carolina, Chapel HillCampus Box 3490, McColl BuildingChapel Hill, NC [email protected]
Douglas A. ShackelfordKenan-Flagler Business SchoolUniversity of North Carolina, Chapel HillCampus Box 3490, McColl BuildingChapel Hill, NC 27599-3490and [email protected]

Did Firms Substitute Dividends for Share Repurchases after the
2003 Reductions in Shareholder Tax Rates?
1. Introduction
This paper examines the extent to which shareholder taxes affect dividends and share
repurchases. Specifically, we study changes in the mix of dividends and share repurchases
following the enactment of the Jobs and Growth Tax Relief Reconciliation Act of 2003 (2003
Act). The 2003 Act reduced dividend tax rates from 38.6 percent to 15 percent and the capital
gains tax rates (which apply to share repurchases) from 20 percent to 15 percent for individual
investors. Because the dividend tax cut exceeded the capital gains tax cut, we predict a shift
from repurchases to dividends following enactment of the 2003 Act. We also predict that,
because the legislation only affected individual investors, the shift increased in the probability
that the distributions would be taxed on individual tax returns.
Our prediction that managers substituted dividends for repurchases does not mean that we
expect that total share repurchases declined. To the contrary, since capital gains tax rates fell,
share repurchases should have risen. However, for firms with large individual ownership, we
expect an even greater percentage increase in dividends (because the dividend tax rate reductions
exceeded the capital gains tax rate reductions), resulting in dividends comprising a larger
percentage of total payouts. That said, we could envision an alternative outcome. If firms are
less responsive to a cut in the dividend tax rate (e.g., because dividends are stickier than
repurchases) than to a cut in the capital gains tax rate (albeit a smaller reduction), then we could
find that substitution flowed in the opposite direction—from dividends to repurchases.
While understanding the extent to which taxes affect corporate decisions (in this case,
payouts) is central to accounting, finance, and economics, we know relatively little about the

2
substitution of dividends and repurchases. The reason is that it is difficult to construct tests that
can link taxes to an increase in dividends and a corresponding decrease in repurchases (or vice
versa). Consequently, scholars observe payout patterns and attempt to attribute them to taxes.
For example, Bagwell and Shoven (1989) document an increase in repurchases in the 1980s,
which they attribute to firms finally learning the tax advantages of repurchases vis a vis
dividends. In other words, they infer substitution from an increase in repurchases. However,
Fama and French (2001) show that most repurchases are undertaken by dividend issuers who do
not reduce their dividends. They conclude that firms increase repurchases to provide additional
distributions, rather than substitute for dividends. That said, Grullon and Michaely (2002) look
at similar data and conclude that those repurchases are supplanting dividends and that taxes are
driving the substitution. This lack of consensus arises partly because none of the studies can
directly link changes in payouts to changes in taxes.
The Tax Reform Act of 1986 (TRA86) seemed to provide an opportunity to link taxes
and substitution. TRA86 reduced the dividend tax rate from 50 percent to 28 percent and
increased the capital gains tax rate from 20 percent to 28 percent. Using the same logic as in this
paper, researchers expected dividends to soar and repurchases to tumble. Yet, DeAngelo et al.
(2000), Jagannathan et al. (2000), and others point out that, after TRA86, aggregate repurchases
soared, while dividends languished; prima facie evidence that TRA86 did not lead to
substitution. Grullon and Michaely (2002), however, report tax-motivated substitution at the
firm level. They study market responses to announcements of repurchase programs around
TRA86, find lower returns after passage, (consistent with a decline in the tax advantages of
repurchases), and conclude that substitution increased following the enactment of TRA86. Lie

3
and Lie (1999) concur, reporting that managers were less likely to repurchase shares after
TRA86.
A problem with studying TRA86 is that it overhauled almost every element of personal
and business taxes and phased-in the changes over two years. Thus, it is very difficult to isolate
the effects of dividend and capital gains taxes on payouts around TRA86.
In this paper, we study a tax bill with equally dramatic changes in tax rates, but without
the confounding effects of other changes in the tax system. The scope of the 2003 Act was
narrow. Its genesis was individual dividend tax reduction. Its primary amendment was
individual capital gains tax relief.1 The final bill did little more than reduce dividend and capital
gains tax rates. Because of its narrow focus, the 2003 Act provides a stronger setting than
TRA86 to isolate the effects of taxes on the substitution of dividends and repurchases.
That said, initial studies of the 2003 Act and its impact on substitution have proved
inconclusive with disagreements reminiscent of the TRA86 studies. Brav et al. (2007) point out
that repurchases have risen more rapidly than dividends after 2003, prima facie rejection of tax-
driven substitution. They conclude that the 2003 Act might have mattered for a few firms
(primarily dividend initiators) at the margin, but it had little effect on most firms’ payouts. Brav
et al. (2005) add that 69 percent of CFOs stated that the elimination of dividend taxation would
“definitely not” or “probably not” affect their firms’ dividend decisions.2 Chetty and Saez (2005,
2006) argue that post-enactment increases in both dividends and share repurchases (a finding
confirmed by all studies of the 2003 Act), are inconsistent with substitution. They point to
dividend initiations as the key response to the 2003 Act.
1 For the legislative history, see Auerbach and Hassett (2006). For background about the political forces surrounding the capital gains tax rate reduction, see Becker and Gellman, Washington Post, June 26, 2007. 2 Similarly, when President Bush first mentioned dividend tax relief, International Paper’s CEO, John Dillon said that even if dividends were tax-exempt, it would “not change our behavior with respect to dividends.” (McKinnon, Wall Street Journal, January 17, 2003).

4
Brown et al. (2007) counter that repurchases funded many of those dividend initiations.
They report a positive relation between insider holdings and increases in dividends from 2002 to
2003, but no relation between insider holdings and increases in total payouts (dividends plus
repurchases). They interpret these results as evidence of substitution by dividend initiators.
Since dividends were rising in insider ownership but total payouts were not, they infer that
repurchases must have been falling in executive ownership. Hence, they conclude “…that firms
with executive ownership-induced dividend initiations in response to the 2003 tax cut often
engaged in dividend substitution…” (p.22).3
Concurrent work by Aboody and Kasznik (2007) also looks at executive compensation,
but they find mixed evidence of substitution. They compare 2003 and 2002 CEO grants of
restricted stock and stock options. Consistent with substitution, they report that the positive
correlation between the change (from 2002 to 2003) in the percentage of payouts distributed as
dividends and the change in dividend-protected restricted stock grants is increasing in individual
ownership. They conclude from this increase in the correlation that the higher the percentage of
shares owned by individuals, the more firms were both increasing dividends and compensating
CEOs with dividend-protected restricted stock, which became more attractive following the cuts
in dividend tax rates. However, contrary to substitution, they find no evidence that the
correlation between the change in the percentage of payouts distributed as dividends and the
change in non-dividend-protected stock option grants is increasing in individual ownership.
3 Brown et al. (2007) are careful to state that their inferences about substitution are limited to 2003 dividend initiators. That said, because their sample includes both initiators and non-initiating firms, it was unclear to us whether the findings reported in Table VI of their paper shed any light on the issue of substitution among non-initiators. Private conversations with the authors confirmed that their conclusions were limited to 2003 dividend initiators. In addition, to enable us to investigate the non-initiators in their study more closely, the authors kindly provided us with their data for which we were most appreciative. We replicated their results, and, consistent with the inferences in their paper and our conversations with them, we found that their results only hold for firms that initiated in 2003.

5
They had expected a negative correlation, consistent with firms with low individual ownership
continuing to repurchase and compensate CEOs with non-dividend-protected CEO stock option.
Our study extends prior work on four fronts. First, we study the firms that paid almost all
of the country’s dividends in 2003 and subsequent years—the non-initiators. Even if the 2003
Act caused substitution among initiators (as reported in Brown et al., 2007), the fact remains that
initiators paid only a tiny portion of the country’s dividends (3 percent in the four quarters
following enactment).4 If firms paying the other 97 percent did not substitute dividends for
repurchases, then substitution was a minor event, limited to a few dividend initiators.
Second, we test for the influence of all shareholders, not just individuals, on the mix of
dividends and repurchases. We expect that only investors who enjoyed reduced dividend and
capital gains tax rates, i.e., individual investors, would have pushed for substitution. Therefore,
in addition to the insiders that Brown et al. (2007) study and the individuals that Aboody and
Kasznick (2007) examine, we evaluate the influence of all investors—managers and officers,
non-executive individual investors, mutual funds, and non-individual investors—on the
dividend-repurchase choice following the 2003 Act. Finding that investors, other than
individuals, affected payouts will produce evidence inconsistent with the substitution hypothesis.
Third, we extend our analysis through 2005. Brown et al. (2007) and Aboody and
Kasznick (2007) study substitution for two quarters after passage of the legislation. It is unclear
how quickly firms could adjust their dividends and repurchase policy in response to the tax rate
reductions. By investigating a longer window, we can calibrate the speed with which firms
readjusted their payout policies.
4 This is not to imply that initiations arising from the 2003 Act were unimportant. Initiators began issuing dividends that they might not have paid and likely will continue to issue dividends in the future because dividend payments are sticky and the market takes a dim view of dividend cuts.

6
Fourth, we only treat dividends declared and shares repurchased after passage of the 2003
Act as post-enactment payouts. Brown et al. (2007), Chetty and Saez (2006, 2005), and Aboody
and Kasznik (2007) treat all dividends paid in 2003 as responses to the 2003 Act, even those
declared months before the May passage of the legislation, (e.g., Microsoft’s initial dividend
announcement on January 7, 2003). By using the day that the dividends were paid, they even
include some dividends declared in 2002 before President Bush ever mentioned possible
dividend tax relief in January, 2003. Brav et al. (2007) state that it is implausible that firms were
so clairvoyant that they declared tax-motivated dividends months before passage. Among other
factors, President Bush’s initial comments were vague and preliminary, and weeks passed before
details of his proposal emerged. Furthermore, passage of the highly controversial legislation was
uncertain until Vice-President Richard Cheney cast a tie-breaking vote in the U.S. Senate to gain
passage of the legislation.
To summarize, we extend prior work in four directions. We expand our analysis: (a) to
include firms other than dividend initiators, (b) to consider the tax incentives of all taxpayers,
including those unaffected by the legislation (thus providing an important control group), (c) to
examine changes in payouts for eight quarters after enactment, and (d) to better specify the event
period.
We test for substitution by examining a sample of firms that either paid dividends or
repurchased shares during the two years preceding enactment of the 2003 Act. We find that
these firms increased both dividends and share repurchases during the two years following
passage. We also find that dividends constituted a larger percentage of their payouts after
enactment than they had before enactment. Most importantly, we find that this shift toward
dividends was increasing in the proportion of the firm owned by individuals, particularly officers

7
and managers. As a result, we can link the change in the mix of payouts to the tax rate changes
of those shareholders affected by the legislation, i.e., individual investors. We find no evidence
that non-individual investors affect the change in the distribution mix. Linking the change in the
mix to individuals and not to other investors greatly mitigates the likelihood that the mix
changed for non-tax reasons, i.e., omitted correlated variables. Finally, we find that substitution
began in the second quarter following passage and accelerated over the next two years,
consistent with firms needing time to adjust their dividend and repurchase policies.
We infer from these results that firms substituted dividends for repurchases after the
enactment of the 2003 Act. These findings are consistent with boards of directors (of all firms,
not just dividend initiators) considering the tax preferences of stockholders when setting
dividend and share repurchase policies (albeit with a lag) and dividends qualifying as substitutes
for at least some share repurchases. To our knowledge, this is the first study to consider the
influence of all investor groups on substitution and to quantify how quickly firms adjusted their
payouts in response to the new tax incentives.
It is important to note this paper does not attempt to tackle the longstanding puzzle of
why firms pay dividends when they could distribute profits through share repurchases, which
remain tax-advantaged, though less so, even after the legislation.5 Rather, we: (a) accept the fact
that some firms paid dividends before the 2003 Act (obviously for non-tax reasons), (b) assume
that the mix of dividends and repurchases was optimal before passage of the legislation, (c)
predict that firms will pay even more dividends after 2003, (d) test whether part of that increase 5 For a sampling of the “dividend puzzle” literature, see Miller and Modigliani (1961), Feldstein and Green (1983), Bagwell and Shoven (1989), Berhheim (1991), DeAngelo, DeAngelo, and Skinner (2000), Jagannathan, Stephens, and Weisbach (2000), Fama and French (2001), Grullon and Michaely (2002), Dhaliwal and Li (2006), Gordon and Dietz, 2006 and Chetty and Saez, 2007, among many others. On a different note, even though both repurchases and dividends now face a maximum tax rate of 15 percent, repurchases remain tax-advantaged for at least two reasons. First, sellers can offset the tax basis of the shares that they sell against the proceeds from the sale in computing their capital gains. Second, they can offset those capital gains with capital losses that otherwise might not be deductible. This contrasts with dividends, where the entire amount is taxed upon receipt.

8
was funded by a smaller increase in repurchases than would otherwise have occurred, and (e)
find evidence consistent with substitution from repurchases to dividends.
The next section discusses the regression model. Section 3 details the sample selection.
Section 4 presents the findings. Closing remarks follow.
2. Regression Model
As discussed above, we test the correlation between the individual ownership of the firm
and the percentage of total payouts (dividends plus repurchases) that are dividends. We predict
that dividends as a percentage of payouts increased with the firm’s individual ownership
following passage of the 2003 Act. This section details the research design that we employ.
Dependent variable
The dependent variable (DIV%) is a ratio. The numerator is the sum of dividends over an
eight-quarter period. The denominator is the sum of dividends and repurchases over the same
eight quarters. There are two eight-quarter periods for each firm. The first eight quarters are
those quarters immediately before the fiscal quarter in which the 2003 Act was enacted. The
second eight quarters are those quarters immediately following the fiscal quarter in which the
2003 Act was enacted.6 Consequently, each firm has two DIV% measures—one before
enactment and one after enactment.
6 We exclude the enactment quarter (May 2003) because it is unclear which tax regime managers were contemplating when they issued dividends and repurchased shares during that quarter. We treat the first quarter of 2003 as a pre-enactment quarter, even though the legislation was retroactive to the beginning of the year. The reason is that, as discussed above, passage of the legislation was uncertain until Vice-President Cheney’s tiebreaking vote in the U.S. Senate in May. However, inferences hold if we exclude any 2003 quarters from the pre-enactment period. On a different note, Blouin and Krull (2007) show that share repurchases rose in 2005 as firms enjoyed a tax holiday for repatriating earnings from foreign subsidiaries. When we replicate our analysis excluding the 2005 quarters, inferences hold.

9
We can measure repurchases in two ways. One option is total share repurchases.
Another option is net repurchases, i.e., total share repurchases less stock issuances.7 We use net
repurchases because we are interested in the cash that the firm could have distributed as
dividends (i.e., the discretionary repurchases). Fama and French (2001) note that dividends
cannot substitute for repurchases in many situations. Firms need shares for executive
compensation, stock option exercises, stock acquisitions, and funding employee stock ownership
plans, among other things. Thus, consistent with Fama and French (2001), we measure net
repurchases as the change in treasury stock.8 If there is a net decrease in treasury stock, then we
truncate our measure of repurchases at zero. For those firms that do not use the treasury stock
method, we measure net repurchases as total repurchases from the statement of cash flows less
decreases in preferred stock.
Key explanatory variables
We employ three explanatory variables in an attempt to capture the portion of the firm
owned by individual investors. We design the first one, INSIDER, to test whether companies
held disproportionately by a particularly influential set of individuals, i.e., officers and managers,
were more likely to substitute dividends for repurchases. We measure INSIDER as the
percentage of shares held by officers and directors as reported in Thomson Financial’s Insider
Filing Data.9
7 For further detail, see the discussion in footnotes 5 and 6 of Boudoukh, Michaely, Richardson and Roberts (2007) and footnote 9 of Skinner (2007). 8 Using treasury stock to measure repurchases is not without limitations. As Fama and French (2001) point out, using annual changes in treasury stock will fail to match a repurchase in one year and its reinsurance in another year. This problem is mitigated in our research design because we combine two years of activity into one observation. However, this two-year aggregation does not fully eliminate the potential mismeasurement. 9 The holdings of insiders is mandated by Section 16 of the Securities Exchange Act of 1934, which applies to every person who is the beneficial owner of more than 10 percent of any class of equity security registered under Section 12 of the Exchange Act and each officer and director (collectively, "reporting persons" or "insiders") of the issuer of

10
The second measure of individual ownership is NONEXEC, a measure designed to
estimate the extent to which individual shareholders, other than insiders, influenced the payout
mix. Following Ayers et al. (2002, 2003), Blouin et al. (2003), Dhaliwal et al. (2003) and others,
we use 13-F filings to estimate the percentage of the firm held by individual shareholders.
NONEXEC is one less (a) the percentage of shares that institutional investors own, as reported in
13-F filings and collected by Thomson Financial’s Institutional Holdings database, (b) the
percentage of shares held by non-officer/director beneficial owners as reported in Thomson
Financial’s Insider Filing data, and (c) INSIDER.
13-F filings crudely measure individual ownership. Ideally, we would measure the
number of shares for which the dividends and capital gains are expected to flow through to
individual tax returns, i.e., those shares held by individuals or flow-through entities (e.g., mutual
funds, partnerships, trusts, S corporations, or limited liability corporations) whose income is
reported on U.S. individual tax returns. This ideal measure would exclude all other holdings,
i.e., those shares for which the dividends and capital gains do not flow through to individual tax
returns, such as tax-exempt organizations, corporations, foreigners, and tax-deferred accounts
(e.g., qualified retirement plans, including pensions, 401(k), and IRAs). Unfortunately, the ideal
measure does not exist. Thus, we cannot observe whether personal taxes affect the returns from
the investments.
To try to address this measurement problem, we include a third measure of ownership,
MF, which is the percentage of the firm owned by mutual funds, as reported in 13-F filings and
collected by Thomson Financial’s Institutional Holdings database. Mutual funds include both
investments that are subject to personal taxes and investments that are not subject to personal
the security. On a different note, conclusions do not change if we limit INSIDER to direct holdings, excluding shares held by family members, trusts and corporations controlled by the insider, and similar related parties.

11
taxes. Sometimes the dividends and capital gains realized by mutual funds are taxed at the
individual level. At other times, they are exempt because they are held in deferred tax accounts,
such as 401(k) or IRAs. We include MF in the study as an attempt to capture the potential
influence on the distribution mix of those mutual fund investors who are taxed on their personal
tax returns.
For post-enactment observations, we interact POST, a categorical variable that equals one
for observations after the May 23, 2003 enactment (i.e., quarters after the second quarter of
2003), with each of the individual ownership measures. A positive coefficient on
INSIDER*POST will be interpreted as evidence that, after passage of the 2003 Act, the
percentage of payouts distributed as dividends was increasing in insider ownership. A positive
coefficient on NONEXEC*POST will be interpreted as evidence that, after passage, DIV% was
increasing in the percentage of the firm held by non-executive shareholders. A positive
coefficient on MF*POST will be interpreted as evidence that, after passage, DIV% was
increasing in the percentage of the firm held by mutual funds. Given the fact that non-
individuals invest in mutual funds, we expect the coefficient on MF*POST will be less than
those on INSIDER*POST and NONEXEC*POST.
We also include POST as a separate variable in the regression. The coefficient on
POST should capture any influence on the change in the mix, arising from the influence of the
investors excluded from INSIDER, NONEXEC and MF, i.e., the remaining non-individual
investors. Since the 2003 Act only affected individual investors and INSIDER, NONEXEC, and
MF are intended to capture all individual holdings, we do not expect the coefficient on POST to
be positive. A positive coefficient on POST will raise doubts about whether the change in the
mix after enactment was related to the tax rate reductions for individual investors.

12
Control variables
Theory is not sufficiently rich to provide much guidance concerning the control variables
in a regression where the dependent variable is the mix of dividends and repurchases. To our
knowledge, no paper models the non-tax variables that should vary with the percentage of
payouts that are dividends. Thus, we take the approach of including various measures that are
known to affect dividends or repurchases. As detailed below, we find that the inferences from
our tests are largely insensitive to the control variables, which suggests that our results are not
dependent on our ad hoc specification of control variables.
First, we include lagged retained earnings scaled by lagged total assets (RE) in the
model. A firm must have earnings and profits (as defined in the tax law) for its distributions to
be taxed as dividends. Since earnings and profits are only found in confidential corporate tax
returns and thus unobservable, we use retained earnings as a proxy for earnings and profits. If
firms with low or no retained earnings have fewer distributions that qualify as dividends, then
DIV% should increase in RE. Consistent with this expectation and liquidity constraints,
DeAngelo et al. (2005) report that firms with low or no retained earnings pay fewer dividends.
Next, we include earnings in the model. Jagannathan et al. (2000) and Guay and Harford
(2000) report that dividends are paid from permanent earnings, whereas, repurchases are paid
from transitory earnings. Dittmar and Dittmar (2004) contend that both are paid from permanent
earnings, but agree that repurchases come from transitory earnings. Thus, we dichotomize
earnings into a permanent part (PERM) and a transitory part (TRANS). We measure PERM with
operating income and TRANS as the difference between net income and operating income. We

13
scale both components by lagged assets. Based on the conflicts in the prior work, we make no
prediction about the sign of PERM. However, we expect DIV% should decrease in TRANS.
We also include a measure of the firm’s payout capacity, free cash flow, scaled by lagged
assets (FCF). Dividends may be a mechanism to reduce agency problems in firms with free cash
flow (Jenson and Meckling, 1986). Thus, we anticipate that DIV% is increasing in FCF. We
include the lagged ratio of dividends to the market value of equity (DYIELD), expecting DIV% to
be increasing in the DYIELD. We add lagged long-term debt, scaled by lagged assets,
(LEVERAGE) to control for cross-firm variation in capital structure. Finally, we include the
natural logarithm of total assets (SIZE) to control for any size effects. We have no expectations
about the sign of the LEVERAGE and SIZE coefficients.
3. Sample Selection
To test whether firms substituted dividends for repurchases after the 2003 Act, we started
by identifying corporations that declared dividends and/or repurchased stock during the eight
quarters preceding passage of the 2003 Act. We drew our initial sample from the 14,122 firms in
the Compustat database between the second quarter of 2001 and the quarter preceding the one
including May 2003. After excluding firms whose shares were not common or publicly traded,
9,373 firms remained. To exclude firm changes to payout policy related to a change in fiscal
year-end, we eliminated the 195 firms who changed their fiscal year-end during our sample
period, leaving 9,178 firms. We required firms to be in existence from July 1, 2001, to June 30,
2005, leaving us with 3,840 firms. We also eliminated financial institutions and insurance
companies since regulatory constraints may inhibit management from altering the firm’s payout

14
policy (eliminates 412 firms). Firms also must have all applicable Compustat information
available for the 16 quarters surrounding the event (eliminates 1,199 firms).
Table 1 categorizes the remaining 2,229 firms based on their dividend payments and
share repurchases before and after enactment. The 534 firms that paid dividends at least once
before and at least once after enactment are “consistent payers.” The 850 firms that repurchased
shares at least once before and at least once after enactment are “consistent repurchasers.” Cell
(a) in Table 1 shows that there are 309 firms that are both consistent payers and consistent
repurchasers. That is, they both paid dividends and repurchased stock at least once during the
eight quarters preceding passage of the bill and at least once during the eight quarters following
passage.
Working through Table 1, we see that 163 firms did not pay dividends before enactment,
but did pay dividends after enactment (“initiating payers”), 29 firms paid dividends before
enactment, but did not pay dividends after enactment (“omitting payers”), and 1,503 firms
neither paid dividends during the eight quarters before passage nor paid dividends during the
eight quarters after passage. Likewise, 256 firms initiated repurchases after enactment; 408
repurchased before but not after passage; and 715 firms never repurchased shares.
Focusing on the firms that were either paying dividends or repurchasing shares during the
eight quarters preceding passage of the 2003 Act, we construct five samples to use in our tests:
a. unbalanced panel of 1,639 firms with at least one distribution over the 16 quarters
(All Obs);
b. balanced panel of 1,105 firms with either a dividend or repurchase in the eight
quarters preceding enactment (All Firms);
c. balanced panel of the 545 pre-enactment dividend payers (Dividend Payers);
d. balanced panel of the 955 pre-enactment repurchasers (Repurchasers);

15
e. balanced panel of the 395 firms that both paid dividends and repurchased shares
in the eight quarters before passage of the 2003 Act (D&R).
Besides detailing the sample selection, Table 1 provides some initial evidence consistent
with firms shifting from repurchases to dividends. We find that 28 firms both initiated dividends
and ceased repurchasing (cell g) after passage of the 2003 Act, while only two firms omitted
dividends and began repurchasing (cell j). We also find that, among consistent repurchasers, 99
firms initiated dividends (cell e) while only nine firms omitted dividends (cell i), a net increase in
dividend issuers of 90 firms. Conversely, among consistent dividend payers, 55 companies
began repurchasing after passage (cell b), but 77 stopped buying back shares (cell c), a net
decrease in repurchasers of 22 firms. Expanding this comparison to all firms, we find that 163
companies initiated dividends while only 29 firms omitted dividends (a net increase of 134
dividend issuers). Meanwhile, 256 firms began repurchasing after enactment while 408
companies stopped repurchasing (a net reduction of 152 repurchasers). All of these comparisons
are consistent with a shift from repurchases to dividends following enactment of the 2003 Act.
Descriptive statistics
Table 2 provides means and medians for the regression variables, both before and after
enactment of the 2003 Act and reports whether the pre and post enactment means and medians
significantly differ.10 We compare means and medians for both the “All Firms” sample of 1,105
firms (those firms that had at least one dividend or one repurchase before enactment) and its
“D&R” subsample of 395 firms that both paid dividends and repurchased shares before passage
of the 2003 Act. We find that the D&R subsample is larger with more repurchases, dividends, 10 Means are tested using a t-test of the means. The p-values for the medians are the larger p-value using the Wilcoxon and Kruskal-Willis tests.

16
retained earnings (RE), free cash flow (FCF) and assets (SIZE). They also pay more of their
distributions as dividends (DIV%). Otherwise, the two samples appear similar.
In both samples, we find that dividends and repurchases increased following the 2003
Act, consistent with the lower tax rates encouraging both types of payouts. Mean and median
values for DIV% increased for both samples after passage, consistent with a shift in the mix of
distributions from repurchases to dividends. The mean DIV% for the All Firms sample rose from
35 percent to 41 percent and for the D&R sample from 59 percent to 62 percent.
Mean and median insider (INSIDER) and mutual fund (MF) holdings are larger after
enactment, while non-executive individual (NONEXEC) holdings fell substantially with a mean
decrease of 9 percentage points in both samples.11 Following enactment, insiders held 13 percent
of the shares; non-executive individual investors held 27 percent; mutual funds held 29 percent
and, thus, other non-individual investors held the remaining 31 percent for the All Firms sample.
The values for the control variables are similar before and after enactment with no mean values
changing at the one percent level. Nonetheless, one statistic is noteworthy. The post-enactment
mean value for retained earnings (RE) is negative in the All Firms sample. Upon further
investigation, we found a few small firms with large deficits. Inferences are unaltered if we
exclude the observations with deficits from the analysis.
11 The decline in individual shareholdings is partly explained by the increase in mutual fund holdings over the sample period. According to the Investment Company Institute (see www.ICI.org), from 2001 to 2005 mutual fund ownership of all publicly traded equity securities increased from 21% to 25%. In addition, over our sample period, individuals have increased the proportion of their financial assets held by mutual funds from 40% in 2001 to 47% in 2005. On a different note, the shift from individual holdings to mutual fund holdings provides no support for the formation of tax clienteles, i.e., the notion that individuals would have increased their overall investments in equities following the tax rate reductions.

17
4. Results
Primary findings
Table 3 presents summary statistics from regressing the ratio of dividends to total payouts
(DIV%) on the measures of individual ownership and control variables.12 We employ a Tobit
regression because net repurchases is truncated at zero. However, as detailed below, results are
not qualitatively different if we use ordinary least squares.
We predict that the coefficients on INSIDER*POST and NONEXEC*POST will be
positive, indicative of firms responding to the changed tax incentives for insiders and non-
executives, respectively. To the extent MF captures the mutual fund investments whose
dividends and capital gains are taxed on individual returns, we expect the coefficients on
MF*POST will be positive. Finally, we predict that the sign on POST will not be positive. The
coefficient on POST captures the influence of the investors not included in the other three
shareholder groups. This fourth group is designed specifically to capture non-individual
investors. If the coefficient on POST is positive, this will raise serious questions about the
impact of the 2003 Act on changes in the mix of dividends and repurchases, because the
investors in this group were unaffected by the legislation.
Overall, we find evidence consistent with firms shifting from repurchases to dividends in
response to the tax rate reductions in the 2003 Act. Specifically, we find that the shift from share
repurchases to dividends increased in individual stock ownership, particularly insider holdings.
The INSIDER*POST coefficient is always positive and significant. The NONEXEC*POST
coefficient is always positive and usually significant. The MF*POST and POST coefficients are
insignificant. Results are robust across specifications and samples. 12 Throughout the paper, inferences are unaltered if we use Huber-White or clustered standard errors.

18
Table 3 reports regression results for each of the five samples, discussed above. Column
A shows the findings using the unbalanced panel of 1,639 firms with at least one distribution
over the 16 quarters (“All Obs”). The panel is unbalanced because some firms made a
distribution before enactment, but not after, or vice versa. (Recall DIV% is undefined if neither a
dividend nor a repurchase occurs.)
We regress DIV% on the shareholder groups and their interactions with POST. As
predicted, the coefficients on INSIDER*POST and NONEXEC*POST are positive. The
INSIDER*POST coefficient is significant at conventional levels, but the NONEXEC*POST
coefficient is not significantly greater than zero. The coefficients imply non-trivial influences
from personal tax considerations on dividends and share repurchases. A one percentage point
increase in INSIDER implies a 0.99 percentage point increase in DIV%. A one percentage point
increase in NONEXEC implies a 0.27 percentage point increase in DIV%. Neither the MF*POST
coefficient nor the POST coefficient is significant. We interpret these initial results as evidence
that the shift from repurchases to dividends at the margin was increasing in the holdings by
officers and directors, but not in the holdings of other investors.
Column B uses the same regression model, but with the All Firms sample, i.e., the
balanced panel of 1,105 firms that paid at least one dividend or repurchased at least one share in
the eight quarters preceding passage of the bill. By balanced, we mean that each firm has two
observations—one before enactment and one after enactment. (Note that we conduct all of the
remaining tests using balanced panels.) Using this balanced panel, results are qualitatively
unchanged for both INSIDER*POST and NONEXEC*POST (both remain positive with
INSIDER*POST significant). The coefficient on MF*POST is positive, as expected, but not
significantly different from zero. The POST coefficient is insignificant. The similarity between

19
the results in Columns A and B suggests that the balanced panel constraint does not materially
affect the results.
Column C employs the same sample of 1,105 firms (the All Firms sample) but adds the
control variables discussed above. The coefficients on Operating income (PERM), other
earnings (TRANS), retained earnings (RE), total assets (SIZE), debt (LEVERAGE) and lagged
dividend yield are significantly greater than zero. The inclusion of the control variables has little
effect on INSIDER*POST (it remains positive and significant). However, the NONEXEC*POST
coefficient is now significantly greater than zero, as predicted. The coefficients on MF*POST
and POST remain insignificant. These results are consistent with the substitution of dividends
for share repurchases increasing in both insider and non-executive individual shareholdings, but
not in mutual fund holdings. As expected, substitution is unrelated to non-individual
investments.
Column D uses the same sample and regression model as Column C, but adds industry
categorical variables (which are not tabulated). The inclusion of the industry dummies has no
qualitative effect on the variables of interest. This regression model is the primary one that we
use in subsequent tests detailed below.
Moving across Table 3, Column E employs the same regression model as Column D;
however, it uses the sample of 545 firms that paid dividends at least once before enactment
(Dividend Payers). The coefficients on both INSIDER*POST and NONEXEC*POST are much
smaller than in Column D. The INSIDER*POST coefficient is 0.29 and significant at the 5
percent level. The NONEXEC*POST coefficient is 0.12 and no longer significant.
This decline in magnitude and significance is not surprising for at least two reasons.
First, firms must pay repurchases for there to be substitution from repurchases to dividends and

20
some of these firms only paid dividends. Second, dividend-paying firms likely had less capacity
for dividend increases than non-dividend paying firms. Consistent with these explanations, the
findings suggest that the shift from repurchases to dividends primarily occurred among those
firms that were distributing less in dividends and more in repurchases before enactment.
Nonetheless, we still detect evidence of substitution (a positive INSIDER*POST coefficient)
among this set of pre-enactment dividend issuers.
Column F provides further evidence that pre-enactment repurchasers engaged in more
substitution than the pre-enactment dividend issurers. Examining the sample of 955 firms that
repurchased shares at least once in the eight quarters preceding passage (Repurchasers), we find
the largest coefficients in Table 3 for both INSIDER*POST (1.01) and NONEXEC*POST (0.48).
Both coefficients are highly significant. We infer from Columns E and F that the shift from
repurchases to dividends was mostly among firms that had been repurchasing shares.
The last three columns (G, H, and I) look at the D&R sample, i.e., the 395 firms that both
paid dividends and repurchased shares before enactment of the 2003 Act. Since these 395 firms
had distributed profits through both dividends and repurchases before enactment, their marginal
costs of substitution may have been less than those of other firms, assuming they still had
dividend capacity. The reason is that these firms would not face start-up costs associated with
initiating dividends and repurchasing shares, such as signals to the market. Thus, they may have
been able to respond to their shareholders’ tax preferences without incurring as many costs as
other firms would have.
Column G employs the same regression model, as in Columns D, E, and F. Results are
similar. As would be expected, the coefficients on INSIDER*POST (0.42) and

21
NONEXEC*POST (0.24) are between those for dividend payers in Column E and repurchasers in
Column F. Both are significant.
Column H repeats the same regression using ordinary least squares. The coefficient on
INSIDER*POST remains significantly greater than zero. The NONEXEC*POST coefficient is
positive, but not significant at conventional levels (p-value of 0.07). We infer from these results
that use of the logit regression model has little impact on our inferences.
Column I adds firm fixed effects to the logit regression model in Column G. The
coefficients become slightly smaller. The coefficients on INSIDER*POST (0.31) and
NONEXEC*POST (0.16) remain significantly greater than zero. One new development is that
the MF*POST coefficient (0.23), which is insignificant in all of the other specifications, is
statistically greater than zero at the 5 percent level when we employ firm fixed effects.
The theme throughout Table 3 is that the dividend/repurchase mix shifted after the 2003
Act in a manner consistent with the changed tax incentives of officers, directors, and, to a lesser
extent, other individual investors. The failure (except in Column I) to detect any influence from
mutual funds is consistent with the managers of mutual firms ignoring the tax considerations of
their individual investors. At the same time, it is possible that our test is too weak to detect the
influence of individual investors in mutual funds because we cannot observe the extent to which
individuals hold the shares in the funds. We also find no evidence that non-individual investors
affected substitution (the POST coefficient is never significantly greater than zero), an important
finding for establishing that the shift was tax-motivated.

22
Comparisons with other years
As a robustness check, we repeat the tests in this study for other years, when tax rates
were not reduced. Finding similar relations between DIV% and the individual ownership
variables in years without rate reductions will raise questions about the inferences drawn above.
Using the same sample selection process, variables, and regression model as employed in
Table 3, Column D, we repeat the analysis for every year from 1994 to 2001.13 Table 4 reports
the regression results for each year, assuming Congress passed legislation in May of that year.
(We select May because Congress passed the 2003 Act in May.) For example, for 1994, we
compute a DIV% from the eight quarters preceding the one that included May 1994 and a DIV%
from the eight quarters following the quarter that included May 1994. For the 1994 regression,
we find that the POST coefficient is -0.17; the INSIDER*POST coefficient is 0.11; the
NONEXEC*POST coefficient is 0.18; and the MF*POST coefficient is 0.04. None is
significantly different from zero. More importantly, none of the 1994 coefficients is
significantly different from its 2003 counterpart, except INSIDER*POST, which is significantly
less at the 0.01 level. We repeat the process for every year through 2001. We stop with 2001
because 2002 would result in the inclusion of some of the period following enactment of the
2003 Act in our tests.
As predicted and consistent with the inferences drawn above, we find that the 2003
INSIDER*POST coefficient exceeds its counterparts in every year from 1994 to 2001 at the 0.01
level. The 2003 NONEXEC*POST coefficient is always greater than its counterpart estimates
and is statistically significantly larger in two of the eight years. The 2003 MF*POST coefficient
is never statistically greater than its counterparts, although its value does exceed the estimated
13 We are prevented from analyzing earlier years because the Thomson ownership data are more sparse and, therefore, less reliable.

23
coefficients in every year, except 2001. As predicted and consistent with the inferences drawn
above, the 2003 POST coefficient is never statistically different from its counterparts from 1994
to 2001.
The findings in Table 4 provide comfort about the inferences that we drew from Table 3.
Whatever happened in 2003 between DIV% and the individual ownership measures differs from
the relations between those variables in the prior decade. Once again, we infer that substitution
from repurchases to dividends was increasing in the shareholdings of officers and directors and,
to a lesser extent, other individual investors. We find no evidence that mutual fund investors or
investors other than individuals affected the change in the distribution mix.
There is an important caveat for this robustness check. The capital gains tax rate fell
from 28 percent to 20 percent in 1997 without any change in the dividend tax rate. Using the
same logic developed in this study, we would have predicted a shift from dividends to
repurchases following that rate reduction, albeit of a lesser extent because the rate change was
more modest. If that change in the distribution mix did occur, it would bias in favor of our
finding that the 2003 coefficients were more positive than those in previous years. The reason is
that the tax incentives facing individual investors after the rate reductions in 1997 would have
called for the mix of distributions to shift toward repurchases and away from dividends.
Therefore, if firms responded accordingly, we would expect the coefficients on the
individual tax measures to be negative. We do notice that INSIDER*POST coefficients became
more negative with each year from 1997 to 2000. Thus, firm responses to changing tax
incentives following the 1997 Act may have biased in favor of our rejecting the null hypothesis
that the distribution mix did not change after 2003. However, if this is the case, i.e., firms altered
their payout mix in response to the 1997 capital gains tax rate reduction, then these results

24
provide further evidence that firms consider the personal taxes of their shareholders in issuing
dividends and repurchasing shares.
Speed of payout adjustments
Table 3 reports summary statistics from tests that aggregate dividends and repurchases
over the eight quarters before enactment and the eight quarters after enactment, creating two
observations (pre and post) for each firm. The results reported in Table 5 are from tests that treat
every quarter as a different observation. Thus, there are 16 observations for each firm. POST
equals one if the observation is drawn from the eight quarters following the quarter that includes
May 2003.
For the quarterly analysis, we use the same samples to estimate the same nine regressions
as those reported in Table 3. The inferences that we draw from Table 5 are qualitatively the
same as those from Table 3. The coefficient on INSIDER*POST is always positive and
significant. The coefficient of NONEXEC*POST is always positive and is significant in six of
the nine regressions. The MF*POST coefficient is positive in seven of the nine regressions, but
is never significant. The POST coefficient is never significantly greater than zero. In short, as
would be expected, when we treat each quarter as a separate observation, we reach the same
inferences as we do when we aggregate the pre and post quarters.
More importantly, a quarterly analysis enables us to look at the coefficients for each
quarter separately and study the pace of substitution. Using the balanced sample in Table 5,
Column D, we suppress the intercept and include a categorical variable for each quarter from the
earliest quarter (eight quarters before enactment—the quarter including May 2001) to the most
recent quarter (eight quarters after enactment—the quarter including May 2005). We then

25
interact the categorical variable for each of the 16 quarters with INSIDER, NONEXEC, and MF.
Since the categorical variable captures the influence of all investors not included in INSIDER,
NONEXEC, and MF, i.e., the non-individual investors, we term the categorical variable,
NOTIND.
Table 6 reports the coefficients for each quarter for NOTIND, INSIDER, NONEXEC, and
MF, while Figure 1 provides a graph of the 16 coefficients for the four variables. We find a
striking increase in the INSIDER coefficients beginning with quarter +2, i.e., the second quarter
following the enactment quarter, which would be the quarter ending December 31, 2003, for
most companies (i.e., those with March, June, September and December year-ends). In all nine
quarters before then, including the quarter immediately following the quarter of enactment
(quarter +1), the INSIDER coefficient is negative. Beginning with quarter +2, the INSIDER
coefficient is always positive. Using a binomial test, we can reject that this pattern is random at
the 0.01 level.
Furthermore, the INSIDER coefficients show no indication that substitution was
increasing in insider ownership before enactment. The INSIDER coefficient in quarter -1, which
for most firms would have been the quarter ending March 31, 2003, is -0.40. This may partially
explain Brown et al. (2007)’s inability to find substitution for firms that were not initiating
dividends in 2003 and Aboody and Kasznick (2007)’s failure to link repurchases, stock options,
and individual ownership. Recall that both studies treated all dividends paid and shares
repurchased in 2003 as post-enactment payouts. If substitution was delayed until the last quarter
of 2003 and, in fact, firms were making distribution choices in the first quarter of 2003 contrary
to post-enactment predictions (as implied by the negative coefficient), then it is understandable
that their tests would have struggled to detect movement from repurchases to dividends.

26
The quarterly pattern for the NONEXEC coefficients shows a similar break in quarter +2.
The last seven quarters (+2 to +8) include all but one of the eight largest NONEXEC coefficients.
Using the binomial test, we can reject at the 0.01 level this clustering of the largest NONEXEC
coefficients in the most recent quarters. Furthermore, there is a steady climb in the NONEXEC
coefficients from quarter +4 to quarter +8. Unlike the INSIDER coefficient, the NONEXEC
coefficient for quarter -1 is positive (though not as large as any of those after quarter +1),
implying that a little substitution may have begun in quarter before enactment, though at a
modest level, compared with later periods.
The INSIDER coefficients and, to a lesser extent, the NONEXEC coefficients are
consistent with a delay of one quarter before firms responded to the tax incentives of individual
investors. This finding is consistent with firms being unable or unwilling to respond to the new
tax rates in the quarter immediately following passage. Perhaps they had already made their
dividend and repurchase decisions for the third quarter of 2003 by May 2003. However, by the
last quarter of 2003, it appears that firms held disproportionately by individuals were beginning
to shift from dividends to repurchases, at the margin, and that this change in the mix of
distributions accelerated for several quarters thereafter.
Consistent with the findings throughout the paper, we see no trend for the MF
coefficients, providing further evidence that mutual fund investors were not influencing
substitution from repurchases to dividends. We also find no pattern among the NOTIND
coefficients, as predicted. This provides further support for tax-induced substitution, since the
non-individual investors were unaffected by the tax rate reductions and, thus, should not have
influenced substitution.

27
5. Closing remarks
This paper tests for changes in dividend and repurchase policies following the 2003
reductions in dividend and capital gains tax rates. We hypothesize that firms increased dividends
at the expense of share repurchases because the reduction in dividend tax rates exceeded the
reduction in capital gains tax rates. Because individuals were the only investors who benefited
from the tax rate reductions, we predict that substitution increased in the percentage of shares
held by individuals.
We find evidence consistent with dividends crowding out repurchases. Our findings
suggest that managers and officers consider the tax preferences of stockholders (particularly
themselves) when setting dividend and share repurchase policies and also provide evidence that
dividends can serve as substitutes for at least some share repurchases. As predicted, we find no
evidence that firms are responsive to non-individual investors.
Previous studies struggled to produce compelling evidence of substitution because their
settings did not provide a clear link between taxes, changes in dividends, and corresponding
changes in repurchases. In contrast, the 2003 Act provided a clean setting in which substitution
could be established by documenting that the shift from repurchases to dividends was increasing
in the percentage of the firm held by individuals. Nonetheless, prior work had failed to reach a
consensus about whether firms substituted dividends for repurchases following the 2003 Act. By
broadening the analysis to investigate more firms (namely, non-dividend initiators), shareholders
(including mutual funds and non-individuals), and time (eight quarters following enactment), we
construct a more powerful test of substitution which enables us to link changes in shareholder tax
rates to changes to the distribution mix.

28
Besides its scholarly contribution, understanding the impact of the 2003 Act on payouts
has implications for ongoing discussions about future reductions in shareholder taxes.14 In 2003,
President Bush and Republican Congressional leaders advocated slashing the shareholder tax
rates because it would dislodge profits that firms were suboptimally (from a non-tax perspective)
retaining as cash. They argued that by reducing the cost of distributing earnings, funds would
flow to firms with better investment opportunities.15
While estimating the efficiency gains from the legislation is beyond the scope of this
paper, the results in this paper do suggest that some firms (particularly those with
disproportionate insider ownership) responded to the rate reductions by reallocating their
distributions from repurchases to dividends. In other words, rather than increasing their total
payout, they merely shifted from one distribution method to another. Consequently, their
dividend increases overstate their aggregate increase in payouts because they funded some of
their dividend increases with reductions in their share repurchases. Thus, to the extent
substitution occurred, aggregate distributions were unchanged.
These findings raise at least two questions for future research. First, the fact that
substitution was most dramatic for firms with high manager and officer ownership implies that
insiders were considering their own personal tax considerations when setting distribution policy.
Non-executive individual investors at those firms benefited because their tax personal incentives
were aligned with the those of the individuals running the company. Conversely, non-individual
investors in those firms were disadvantaged because insiders were responding to changes in
personal tax law that did not affect the non-individuals. This raises questions about the downside 14 For the latest discussions on this topic, see the U.S. Department of the Treasury’s Treasury Conference on Business Taxation and Global Competitiveness: A Background Paper, July 23, 2007, at http://www.treas.gov/press/releases/reports/07230%20r.pdf. 15 The size of the tax savings has been very large. In September 2007, the U.S. Congress’ Joint Committee on Taxation reported that the 2003 dividend and capital gains tax rates will cost the Treasury $632 billion between 2007 and 2011, the largest tax expenditure in the tax code.

29
for non-individual investors of compensating insiders with stock, since the tax law differs for
individuals and non-individuals.
Second, our finding that it took so long (at least eight quarters) to fully implement
substitution raises interesting questions about the speed in which companies respond to changes
in the tax law, particularly laws affecting their shareholders. The efficiency of the tax law is an
interesting, but largely unexplored area of inquiry.

30
References
Aboody, David, and Ron Kasznik, 2007, Executive stock-based compensation and firms’ cash payout: The role of shareholders’ tax-related payout preferences, Working paper, University of California at Los Angeles.
Auerbach, Alan J. and Kevin A. Hassett, 2007, The 2003 Dividend Tax Cuts and the Value of
the Firm: An Event Study, Taxing Corporate Income in the 21st Century, edited by Alan J. Auerbach, James R. Hines, Jr., and Joel Slemrod, Cambridge University Press, 93-126.
Ayers, Benjamin, C. Bryan Cloyd, and John Robinson, 2002, The effect of shareholder-level
dividend taxes on stock prices: Evidence from the Revenue Reconciliation Act of 1993, Accounting Review 77, 933-947.
Ayers, Benjamin, Craig Lefanowicz, and John Robinson, 2003, The effect of shareholder-level
capital gains taxes on the structure of corporate acquisitions, Journal of Finance, forthcoming.
Bagwell, Laurie S., and John B. Shoven, 1989, Cash Distributions to Shareholders, Journal of
Economic Perspectives, 3, Summer, 129-149. Berhheim, B. Douglas, 1991, Tax Policy and the Dividend Puzzle, Rand Journal of Economics
22:4, Winter, 455-476. Blouin, Jennifer and Linda Krull, 2007, Bringing it home: A study of the incentives surrounding
the repatriation of foreign earnings under the American Jobs Creation Act of 2004, University of Pennsylvania working paper.
Blouin, Jennifer, Jana Raedy, and Douglas Shackelford, 2003, Capital gains taxes and equity
trading: Empirical evidence, Journal of Accounting Research 41, 611-651. Boudoukh, Jacob, Roni Michaely, Matthew Richardson, and Michael Roberts, 2007, On the
Importance of Measuring Payout Yield: Implications for Empirical Asset Pricing, Journal of Finance, 62: 877-915.
Brav, Alon, John Graham, Campbell Harvey, and Roni Michaely, 2005, Payout policy in the 21st
century, Journal of Financial Economics 77, 483-527. Brav, Alon, John Graham, Campbell Harvey and Roni Michaely, 2007, Managerial Response to
the May 2003 Dividend Tax Cut, Duke University working paper. Brown, Jeffrey, Nellie Liang, and Scott Weisbenner, 2007, Executive financial incentives and
payout policy: Firm responses to the 2003 dividend tax cut, Journal of Finance, forthcoming.

31
Chetty, Raj and Emmanuel Saez, 2007, An agency theory of dividend taxation, NBER working paper number 13538.
Chetty, Raj and Emmanuel Saez, 2005, Dividend taxes and corporate behavior: Evidence from
the 2003 dividend tax cut, Quarterly Journal of Economics CXX:3, 791-833. Chetty, Raj and Emmanuel Saez, 2006, The effects of the 2003 dividend tax cur on corporate
behavior: Interpreting the evidence, American Economic Review Papers and Proceedings 96:2, p.124-129
DeAngelo, Harry, Linda DeAngelo, and Rene Stulz, 2005, Dividend policy and the
earned/contributed capital mix: A test of the lifecycle theory, forthcoming in the Journal of Financial Economics.
DeAngelo, Harry, Linda DeAngelo, and Doug Skinner, 2004, Are dividends disappearing?
Dividend concentration and the consolidation of earnings. Journal of Financial Economics 72, 425-456.
DeAngelo, Harry, Linda DeAngelo, and Douglas J. Skinner, 2000, Special dividends and the
evolution of dividend signalling, Journal of Financial Economics 57, 309-354. Dhaliwal, Dan and Oliver Li, 2006, Investor Tax Heterogeneity and Ex-Dividend Day Trading
Volume. Journal of Finance 51:1, 463-490. Dhaliwal, Dan, Oliver Li, and Robert Trezevant, 2003, Is a dividend tax penalty incorporated
into the return on a firm’s common stock? Journal of Accounting and Economics 35, 155-178.
Dittmar, Amy K. and Robert F. Dittmar, 2004, Stock repurchase waves: An explanation of the
trends in aggregate corporate payout policy. Working paper, University of Michigan. Fama, Eugene and Kenneth French, 2001, Disappearing dividends: Changing firm
characteristics or lower propensity to pay, Journal of Financial Economics 60, 3-43. Feldstein, Martin and Jerry Green, 1983, Why do companies pay dividends?, American
Economic Review 73:1, 17-30. Gordon, Roger and Martin Dietz, 2006, Dividends and taxes, NBER Working Paper No. 12292. Grullon, Gustavo and Roni Michaely, 2002, Dividends, share repurchases and the substitution
hypothesis. Journal of Finance LVII: 4, (August): 1649-1684. Guay, Wayne and Jarrod Harford, 2000, The cash-flow permanence and information content of
dividend increases versus repurchases, Journal of Financial Economics 57, p. 385-415.

32
Jagannathan, Murali , Clifford P Stephens and Michael S Weisbach, 2000, Financial flexibility and the choice between dividends and stock repurchases, Journal of Financial Economics 57:3, 355-384.
Lie, Erik and Heidi Lie, 1999, The role of personal taxes in corporate decision: An empirical
analysis of share repurchases and dividends, Journal of Financial and Quantitative Analysis 34, 533-552.
Miller, Merton, and Franco Modigliani, 1961, Dividend policy, growth and the valuation of
shares, Journal of Business 34, 411-433. Skinner, Douglas J., 2007, The evolving relation between earnings, dividends and stock
repurchases, forthcoming in Journal of Financial Economics.

33
TABLE 1
Sample Firms Segregated by the Consistency of their Dividends and Share Repurchases
The 2,229 firms in the study are drawn from the 14,122 firms in the Compustat database between the second quarter of 2001 and the third quarter of 2005 less (a) firms that are not publicly traded, (b) issues that are not common, (c) firms who changed their fiscal year end, (d) firms not in existence throughout the entire period, (e) firms that are financial institutions or insurance companies and (f) firms missing Compustat data.
Firms that paid dividends at least once before and once after enactment are “consistent payers.” Firms that repurchased shares at least once before and once after enactment are “consistent repurchasers.” Initiating payers (initiating repurchasers) paid no dividends (repurchased no shares) in the eight quarters before enactment, but did pay dividends (repurchase shares) at least once in the eight quarters following passage. Omitting payers (Omitting repurchasers) paid dividends (repurchased shares) in the eight quarters before enactment, but did not pay dividends (repurchase shares) at least once in the eight quarters following passage.
DIVIDEND PAYERS
REPURCHASERS
Consistent Payers
Initiating Payers
Omitting Payers
None Total
Consistent Repurchasers
309 (a) 99 (e) 9 (i) 433 (m) 850
Initiating Repurchasers
55 (b) 16 (f) 2 (j) 183 (n) 256
Omitting Repurchasers
77 (c) 28 (g) 6 (k) 297 (o) 408
None 93 (d) 20 (h) 12 (l) 590 (p) 715 Total 534 163 29 1,503 2,229

34
Composition of the “All Obs” sample: Firms meeting original criteria 2,229 Less: Firms with neither dividends nor repurchases before or after enactment 590 All observations with at least one dividend or one repurchase 1,639 Composition of the “All Firms” sample: Firms meeting original criteria 2,229 Less: Firms with neither dividends nor repurchases: Before enactment (f, h, n) (219) After enactment (k, l, o) (315) Before or after enactment (p) (590) (1,124) All firms with at least one distribution before and after enactment 1,105 Composition of the “Dividend Payers” sample: All firms with at least one distribution before and after enactment (above) 1,105 Less: Firms never paying dividends (m) (433) Firms not paying dividends before enactment (e, g) (127) (560) Firms paying dividends before enactment 545 Composition of the “Repurchasers” sample: All firms with at least one distribution before and after enactment (above) 1,105 Less: Firms never repurchasing (d) (93) Firms not repurchasing before enactment (b, j) (57) (150) Firms paying dividends before enactment 955 Composition of the “D&R” sample: All firms with at least one distribution before and after enactment (above) 1,105 Less: Firms not paying dividends before enactment (e, g) (127) Firms not repurchasing before enactment (b, j) (57) Consistent dividend payers that never repurchased (d) (93) Consistent repurchasers that never paid dividends (m) (433) (710) Firms both paying dividends and repurchasing shares before enactment 395

35
TABLE 2 Descriptive Statistics
Means and Medians for Regression Variables
This table reports descriptive statistics for subsamples of the 2,229 firms in Table 1. If the firm uses the treasury stock method, Total Repurchases is the change in treasury stock (data98). If there is a net decrease in treasury stock, Total Repurchases is set to zero (i.e., if there are net stock issuances). If the firm does not use the treasury stock method, then Total Repurchases is the repurchase amount from the statement of cash flows (data 93) less decreases in preferred stock (change in data55 and data71) Total Dividends is dividends as reported by Compustat (data16xdata61). Repurchases per Assets is Total Repurchases scaled by lagged assets (data44). Dividends per Assets is Total Dividends scaled by lagged assets (data44). DIV% is Total Dividends over the sum of Total Dividends and Total Repurchases. NONEXEC is one less the percentage of shares that are held by institutional investors as reported in 13-F filings and collected by Thomson Financial’s Institutional Holdings database less INSIDER(see below) less non-officer/director beneficial owners as reported in Thomson Financial’s Insider Filing data. POST is a categorical variable that equals 1 if the repurchase was declared after 5/23/03; zero, otherwise. INSIDER is the percentage of shares held by insiders as measured by holdings of officers and directors as reported in Thomson Financial’s Insider Filing Data MF is the percentage of the firm owned by mutual funds as reported in 13-F filings and collected by Thomson Financial’s Institutional Holdings database. RE is lagged retained earnings scaled by lagged assets (data58/data44). PERM is operating income (data21 – data5 – data22) scaled by lagged assets (data44). TRANS is net income scaled by lagged assets (data69/data44) less PERM. FCF is defined as income before extraordinary items (data 8) plus interest expense (data 22) less the change in the applicable balance sheet accounts: (assets (data44), liabilities (data54), debt (data45, data51)) scaled by lagged assets (data44). DYIELD is the lagged ratio of dividends per share to price, expressed in percentages (data16/data14). LEVERAGE is lagged long-term debt (data51 + data 45) scaled by lagged assets (data44). SIZE is the natural log of assets (data44). All Firms Sample
1105 firms (at least one dividend or repurchase before enactment of the 2003 Act)
D&R Sample 395 firms
(at least one dividend and one repurchase before enactment of the
2003 Act) MEANS MEDIANS MEANS MEDIANS Before After Before After Before After Before After Total Dividends 126 194 0 4 ** 288 457 27 41 * Total Repurchases 166 279 * 4 4 347 518 20 13 Dividends per Assets 0.02 0.03 ** 0 0.01 ** 0.04 0.05 ** 0.03 0.03 *
Repurchases per Assets
0.06 0.07 ** 0.01 0.02 0.07 0.07 0.02 0.02
DIV% 0.35 0.41 ** 0 0.24 ** 0.59 0.62 0.62 0.68 * INSIDER 0.11 0.13 ** 0.05 0.06 ** 0.08 0.10 0.03 0.04 * NONEXEC 0.36 0.27 ** 0.31 0.21 ** 0.35 0.26 ** 0.32 0.23 ** MF 0.26 0.29 ** 0.22 0.30 ** 0.26 0.29 ** 0.26 0.28 ** RE 0.11 -0.02 0.22 0.23 0.36 0.35 0.35 0.36 PERM 0.16 0.19 * 0.13 0.19 ** 0.22 0.25 0.19 0.21 ** TRANS -0.10 -0.09 -0.08 -0.07 -0.09 -0.09 -0.08 -0.08 FCF -0.03 -0.09 0.05 0.03 ** 0.06 0.04 0.09 0.06 ** DYIELD 0.25 0.22 0 0 0.47 0.43 0.36 0.36 LEVERAGE 0.22 0.20 * 0.19 0.17 * 0.22 0.20 0.23 0.19 SIZE 6.29 6.41 6.26 6.42 7.19 7.33 7.05 7.24

36
TABLE 3 Estimated Coefficients from Regressing the Percentage of Shareholder Payouts that are Dividends on the Individual Ownership of the Firm
and Control Variables, where 8 quarters before and after enactment of the 2003 Act are aggregated
This table reports estimated regression statistics for subsamples of the 2,229 firms in Table 1. The dependent variable (DIV%) is Total Dividends over the sum of Total Dividends and Total Repurchases. Total Repurchases is the change in treasury stock (data98). If there is a net decrease in treasury stock, Total Repurchases is set to zero (i.e., if there are net stock issuances). If the firm does not use the treasury stock method, then Total Repurchases is the repurchase amount from the statement of cash flows (data 93) less decreases in preferred stock (change in data55 and data71) Total Dividends is dividends as reported by Compustat (data16xdata61). NONEXEC is one less the percentage of shares that are held by institutional investors as reported in 13-F filings and collected by Thomson Financial’s Institutional Holdings database less INSIDER(see below) less non-officer/director beneficial owners as reported in Thomson Financial’s Insider Filing data. POST is a categorical variable that equals 1 for quarters after enactment (i.e. quarters after 2nd quarter 2003), ; zero, otherwise. INSIDER is the percentage of shares held by insiders as measured by holdings of officers and directors as reported in Thomson Financial’s Insider Filing Data MF is the percentage of the firm owned by mutual funds as reported in 13-F filings and collected by Thomson Financial’s Institutional Holdings database. RE is lagged retained earnings scaled by lagged assets (data58/data44). PERM is operating income (data21 – data5 – data22) scaled by lagged assets (data44). TRANS is net income scaled by lagged assets (data69/data44) less PERM. FCF is defined as income before extraordinary items (data 8) plus interest expense (data 22) less the change in the applicable balance sheet accounts: (assets (data44), liabilities (data54), debt (data45, data51)) scaled by lagged assets (data44). DYIELD is the lagged ratio of dividends per share to price, expressed in percentages (data16/data14). LEVERAGE is lagged long-term debt (data51 + data 45) scaled by lagged assets (data44). SIZE is the natural log of assets (data44).
Pred (A) (B) (C) (D) (E) (F) (G) (H) (I) All Obs All Firms All Firms All Firms Dividend
Payers Repurchasers D&R D&R D&R
Intercept 0.47 ** 0.60 ** -0.59 ** -0.26** 0.84 ** -0.40 0.74 ** 0.71 ** -0.18 POST (≤0) 0.07 -0.05 -0.10 -0.10 -0.09 0.14 -0.15 * -0.14 -0.14 * INSIDER -1.51 ** -1.41 ** -0.44 ** -0.45 ** -0.07 -0.49 ** -0.17 -0.19 -0.50 ** INSIDER*POST (+) 0.99 ** 0.99 ** 0.89 ** 0.89 ** 0.29 * 1.01 ** 0.42 ** 0.44 ** 0.31 ** NONEXEC -0.70 ** -0.46 ** 0.12 0.11 -0.03 0.00 -0.12 -0.11 -0.70 ** NONEXEC*POST (+) 0.27 0.21 0.34 * 0.33 * 0.12 0.48 ** 0.24 * 0.21 0.16 * MF -0.64 -0.79 * -0.01 0.01 -0.25 -0.26 -0.54 ** -0.48 ** -0.88 ** MF*POST (+) -0.27 0.09 0.20 0.20 0.17 0.34 0.36 0.33 0.23 * RE 0.37 ** 0.37 ** 0.06 * 0.34 ** 0.06 * 0.04 0.35 ** PERM 0.26 ** 0.22 ** -0.45 ** 0.28 ** -0.40 ** -0.35 ** -0.18 * TRANS 0.63 ** 0.61 ** -0.20 0.51 ** -0.26 -0.16 -0.18 FCF 0.03 0.04 -0.17 ** 0.09 * -0.13 ** -0.14 ** 0.26 ** DYIELD 0.72 ** 0.69 ** 0.17 ** 0.69 ** 0.19 ** 0.26 ** 0.05 * LEVERAGE 0.16 * 0.08 0.19 ** 0.03 0.15 * 0.12 0.55 ** SIZE 0.07 ** 0.06 ** -0.03 ** 0.07 ** -0.03 ** -0.03 ** 0.15 ** # of Obs 2,744 2,210 2,210 2,210 1,090 1,910 790 788 790 # of Firms 1,639 1,105 1,105 1,105 545 955 395 394 395 Industry Dummy? no no no yes Yes yes yes yes yes Fixed Effects? no no no no No no no no yes Specification tobit tobit tobit tobit tobit tobit tobit OLS tobit
* (**) indicate that the coefficients are significantly different from zero at the 5% (1%) level

37
TABLE 4 Estimated Coefficients from Regressing the Percentage of Shareholder Payouts that are Dividends on
Various Ownership Measures of the Firm and Control Variables; Comparison of Quarters Surrounding Various Non-event Periods and Quarters Surrounding the Enactment of the 2003 Act
This table reports a summary of the estimated regression statistics for the subsample of 1,105 firms who paid either dividends or repurchase prior to enactment of the 2003 Act. Model D in Table 3 is estimated. The dependent variable (DIV%) is Total Dividends over the sum of Total Dividends and Total Repurchases. Total Repurchases is the change in treasury stock (data98). If there is a net decrease in treasury stock, Total Repurchases is set to zero (i.e., if there are net stock issuances). If the firm does not use the treasury stock method, then Total Repurchases is the repurchase amount from the statement of cash flows (data 93) less decreases in preferred stock (change in data55 and data71) Total Dividends is dividends as reported by Compustat (data16xdata61). POST is a categorical variable that equals 1 for quarters after enactment or deemed enactment (e.g., in 2003, quarters after 2nd quarter 2003), ; zero, otherwise. NONEXEC is one less the percentage of shares that are held by institutional investors as reported in 13-F filings and collected by Thomson Financial’s Institutional Holdings database less INSIDER(see below) less non-officer/director beneficial owners as reported in Thomson Financial’s Insider Filing data. INSIDER is the percentage of shares held by insiders as measured by holdings of officers and directors as reported in Thomson Financial’s Insider Filing Data MF is the percentage of the firm owned by mutual funds as reported in 13-F filings and collected by Thomson Financial’s Institutional Holdings database. RE is lagged retained earnings scaled by lagged assets (data58/data44). PERM is operating income (data21 – data5 – data22) scaled by lagged assets (data44). TRANS is net income scaled by lagged assets (data69/data44) less PERM. FCF is defined as income before extraordinary items (data 8) plus interest expense (data 22) less the change in the applicable balance sheet accounts: (assets (data44), liabilities (data54), debt (data45, data51)) scaled by lagged assets (data44). DYIELD is the lagged ratio of dividends per share to price, expressed in percentages (data16/data14). LEVERAGE is lagged long-term debt (data51 + data 45) scaled by lagged assets (data44). SIZE is the natural log of assets (data44).
POST INSIDER
*POST NONEXEC
*POST MF
*POST 2003 Estimated Regression Coefficient
(from Table 3, Column C above)
-0.10 0.89
0.33 0.20
Assume Law Had Passed in May of: 1994 -0.17 0.11 ** 0.18 0.04 1995 -0.11 0.09 ** 0.06 -0.14 1996 -0.11 -0.01 ** 0.14 -0.18 1997 -0.05 -0.06 ** 0.02 -0.27 1998 0.03 -0.07 ** -0.18 * -0.20 1999 0.03 -0.17 ** -0.02 -0.07 2000 0.15 -0.29 ** -0.11 * -0.08 2001 -0.03 -0.03 ** 0.17 0.34
Descriptive Stats for 1994—2001
Mean -0.03 -0.05 0.03 -0.07 Median -0.04 -0.05 0.04 -0.11
Maximum 0.15 0.11 0.18 0.34
* (**) indicate that the estimated regression coefficient for that year differs from its 2003 counterpart at the 5% (1%) level.

38
TABLE 5
Estimated Coefficients from Regressing the Percentage of Shareholder Payouts that are Dividends on the Individual Ownership of the Firm and Control Variables, where 8 quarters before and after enactment of the 2003 Act are treated as separate observations
This table reports estimated regression statistics for subsamples of the 2,229 firms in Table 1. The dependent variable (DIV%) is Total Dividends over the sum of Total Dividends and Total Repurchases. Total Repurchases is the change in treasury stock (data98). If there is a net decrease in treasury stock, Total Repurchases is set to zero (i.e., if there are net stock issuances). If the firm does not use the treasury stock method, then Total Repurchases is the repurchase amount from the statement of cash flows (data 93) less decreases in preferred stock (change in data55 and data71) Total Dividends is dividends as reported by Compustat (data16xdata61). NONEXEC is one less the percentage of shares that are held by institutional investors as reported in 13-F filings and collected by Thomson Financial’s Institutional Holdings database less INSIDER(see below) less non-officer/director beneficial owners as reported in Thomson Financial’s Insider Filing data. POST is a categorical variable that equals 1 for quarters after enactment (i.e. quarters after 2nd quarter 2003),; zero, otherwise. INSIDER is the percentage of shares held by insiders as measured by holdings of officers and directors as reported in Thomson Financial’s Insider Filing Data MF is the percentage of the firm owned by mutual funds as reported in 13-F filings and collected by Thomson Financial’s Institutional Holdings database. RE is lagged retained earnings scaled by lagged assets (data58/data44). PERM is operating income (data21 – data5 – data22) scaled by lagged assets (data44). TRANS is net income scaled by lagged assets (data69/data44) less PERM. FCF is defined as income before extraordinary items (data 8) plus interest expense (data 22) less the change in the applicable balance sheet accounts: (assets (data44), liabilities (data54), debt (data45, data51)) scaled by lagged assets (data44). DYIELD is the lagged ratio of dividends per share to price, expressed in percentages (data16/data14). LEVERAGE is lagged long-term debt (data51 + data 45) scaled by lagged assets (data44). SIZE is the natural log of assets (data44).
pred (A) (B) (C) (D) (E) (F) (G) (H) (I) All Obs All Firms All Firms All Firms Dividend
Payers Repurchasers D&R D&R D&R
Intercept 0.70 ** 0.67 ** -0.31 ** -0.02 ** 1.00 ** -0.12 1.01 ** 1.02 ** 0.89 ** POST (≤0) -0.04 -0.03 -0.01 -0.02 0.01 -0.04 -0.01 -0.04 -0.01 INSIDER -0.20 ** -1.01 ** -0.38 ** -0.37 ** 0.01 -0.39 ** -0.03 -0.04 -0.17 * INSIDER*POST (+) 0.78 ** 0.67 ** 0.54 ** 0.55 ** 0.11 * 0.64 ** 0.15 * 0.17 * 0.15 ** NONEXEC -0.55 ** -0.29 ** 0.22 ** 0.21 ** -0.01 0.19 ** -0.07 -0.10 * -0.30 ** NONEXEC*POST (+) 0.47 ** 0.28 ** 0.26 ** 0.26 ** 0.05 0.33 ** 0.10 0.13 * 0.07 MF -0.48 ** -0.42 ** -0.04 -0.01 -0.09 -0.19 -0.25 ** -0.26 ** -0.43 ** MF*POST (+) -0.14 -0.02 0.01 0.03 -0.03 0.15 0.05 0.09 0.05 RE 0.54 ** 0.51 ** -0.00 0.56 ** 0.02 0.01 0.03 PERM -1.64 ** -1.70 ** -3.01 ** -0.76 ** -2.63 ** -2.47 ** -0.57 * TRANS 0.46 * 0.47 * -0.34 0.35 -0.37 -0.50 * -0.40 FCF -0.25 ** -0.22 ** -0.24 ** -0.18 ** -0.25 ** -0.43 ** -0.22 ** DYIELD 0.05 ** 0.05 ** 0.03 ** 0.04 ** 0.03 ** 0.08 ** -0.02 ** LEVERAGE 0.35 ** 0.24 ** 0.15 ** 0.19 ** 0.15 ** 0.12 ** 0.62 ** SIZE 0.07 ** 0.06 ** -0.03 ** 0.08 ** -0.02 ** -0.02 ** -0.00 # of Obs 13,728 12,436 12,436 12,436 8,109 10,293 5,966 5,959 5,966 # of Firms 1,639 1,105 1,105 1,105 545 955 395 395 395 Industry Dummy? no No no yes yes yes Yes Yes Yes Fixed Effects? no No no no no no no no Yes Specification tobit Tobit tobit tobit tobit tobit tobit OLS tobit
* (**) indicate that the coefficients are significantly different from zero at the 5% (1%) level.
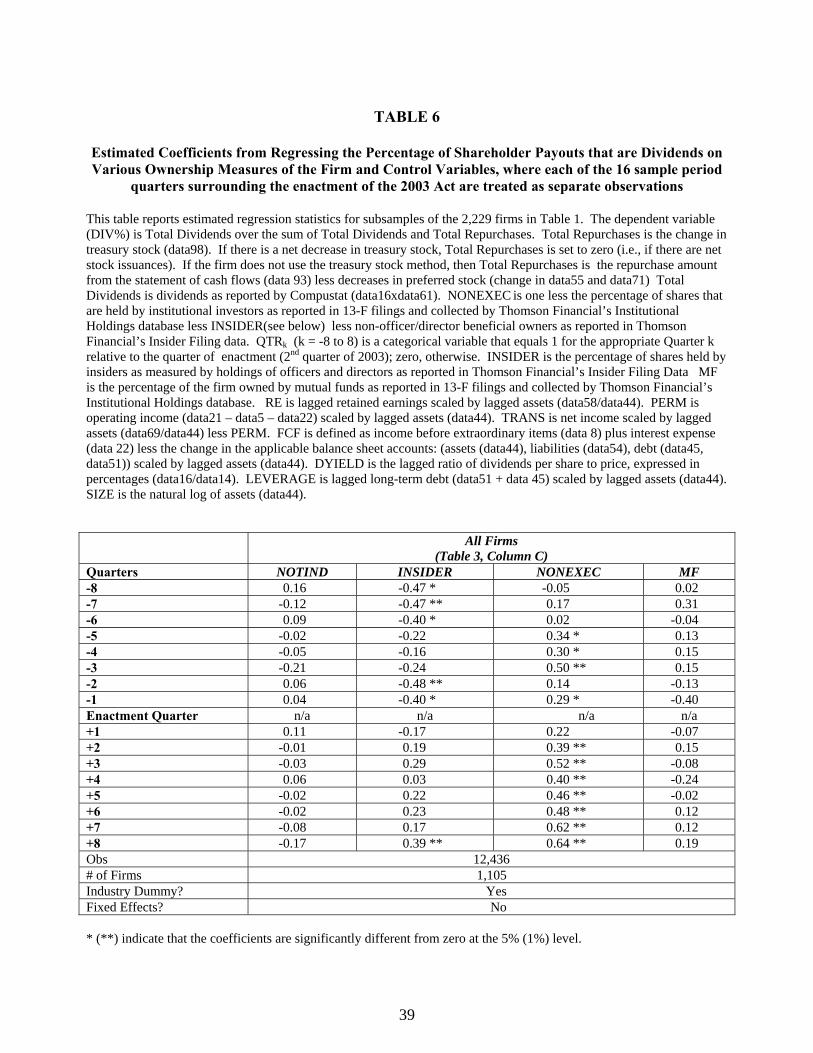
39
TABLE 6
Estimated Coefficients from Regressing the Percentage of Shareholder Payouts that are Dividends on Various Ownership Measures of the Firm and Control Variables, where each of the 16 sample period
quarters surrounding the enactment of the 2003 Act are treated as separate observations
This table reports estimated regression statistics for subsamples of the 2,229 firms in Table 1. The dependent variable (DIV%) is Total Dividends over the sum of Total Dividends and Total Repurchases. Total Repurchases is the change in treasury stock (data98). If there is a net decrease in treasury stock, Total Repurchases is set to zero (i.e., if there are net stock issuances). If the firm does not use the treasury stock method, then Total Repurchases is the repurchase amount from the statement of cash flows (data 93) less decreases in preferred stock (change in data55 and data71) Total Dividends is dividends as reported by Compustat (data16xdata61). NONEXEC is one less the percentage of shares that are held by institutional investors as reported in 13-F filings and collected by Thomson Financial’s Institutional Holdings database less INSIDER(see below) less non-officer/director beneficial owners as reported in Thomson Financial’s Insider Filing data. QTRk (k = -8 to 8) is a categorical variable that equals 1 for the appropriate Quarter k relative to the quarter of enactment (2nd quarter of 2003); zero, otherwise. INSIDER is the percentage of shares held by insiders as measured by holdings of officers and directors as reported in Thomson Financial’s Insider Filing Data MF is the percentage of the firm owned by mutual funds as reported in 13-F filings and collected by Thomson Financial’s Institutional Holdings database. RE is lagged retained earnings scaled by lagged assets (data58/data44). PERM is operating income (data21 – data5 – data22) scaled by lagged assets (data44). TRANS is net income scaled by lagged assets (data69/data44) less PERM. FCF is defined as income before extraordinary items (data 8) plus interest expense (data 22) less the change in the applicable balance sheet accounts: (assets (data44), liabilities (data54), debt (data45, data51)) scaled by lagged assets (data44). DYIELD is the lagged ratio of dividends per share to price, expressed in percentages (data16/data14). LEVERAGE is lagged long-term debt (data51 + data 45) scaled by lagged assets (data44). SIZE is the natural log of assets (data44).
All Firms
(Table 3, Column C) Quarters NOTIND INSIDER NONEXEC MF -8 0.16 -0.47 * -0.05 0.02 -7 -0.12 -0.47 ** 0.17 0.31 -6 0.09 -0.40 * 0.02 -0.04 -5 -0.02 -0.22 0.34 * 0.13 -4 -0.05 -0.16 0.30 * 0.15 -3 -0.21 -0.24 0.50 ** 0.15 -2 0.06 -0.48 ** 0.14 -0.13 -1 0.04 -0.40 * 0.29 * -0.40 Enactment Quarter n/a n/a n/a n/a +1 0.11 -0.17 0.22 -0.07 +2 -0.01 0.19 0.39 ** 0.15 +3 -0.03 0.29 0.52 ** -0.08 +4 0.06 0.03 0.40 ** -0.24 +5 -0.02 0.22 0.46 ** -0.02 +6 -0.02 0.23 0.48 ** 0.12 +7 -0.08 0.17 0.62 ** 0.12 +8 -0.17 0.39 ** 0.64 ** 0.19 Obs 12,436 # of Firms 1,105 Industry Dummy? Yes Fixed Effects? No * (**) indicate that the coefficients are significantly different from zero at the 5% (1%) level.

40
FIGURE 1
-0.8
-0.6
-0.4
-0.2
0
0.2
0.4
0.6
-8 -7 -6 -5 -4 -3 -2 -1 +1 +2 +3 +4 +5 +6 +7 +8
Coefficient
Quarter Relative to the Event
Relation Between Ownership Type and Proportion of Dividends to Total Payout
Individuals
Insiders
Mutual Funds
All Other Owners (NotIndividuals)