Embed Size (px)
Citation preview

WIRSCHAFFENWISSEN–HEUTEFÜRMORGEN
Diagnostics for FELs and ERLs CERNAcceleratorSchool:FreeElectronLasersandEnergyRecoveryLinacs2016-06-08
RasmusIschebeck
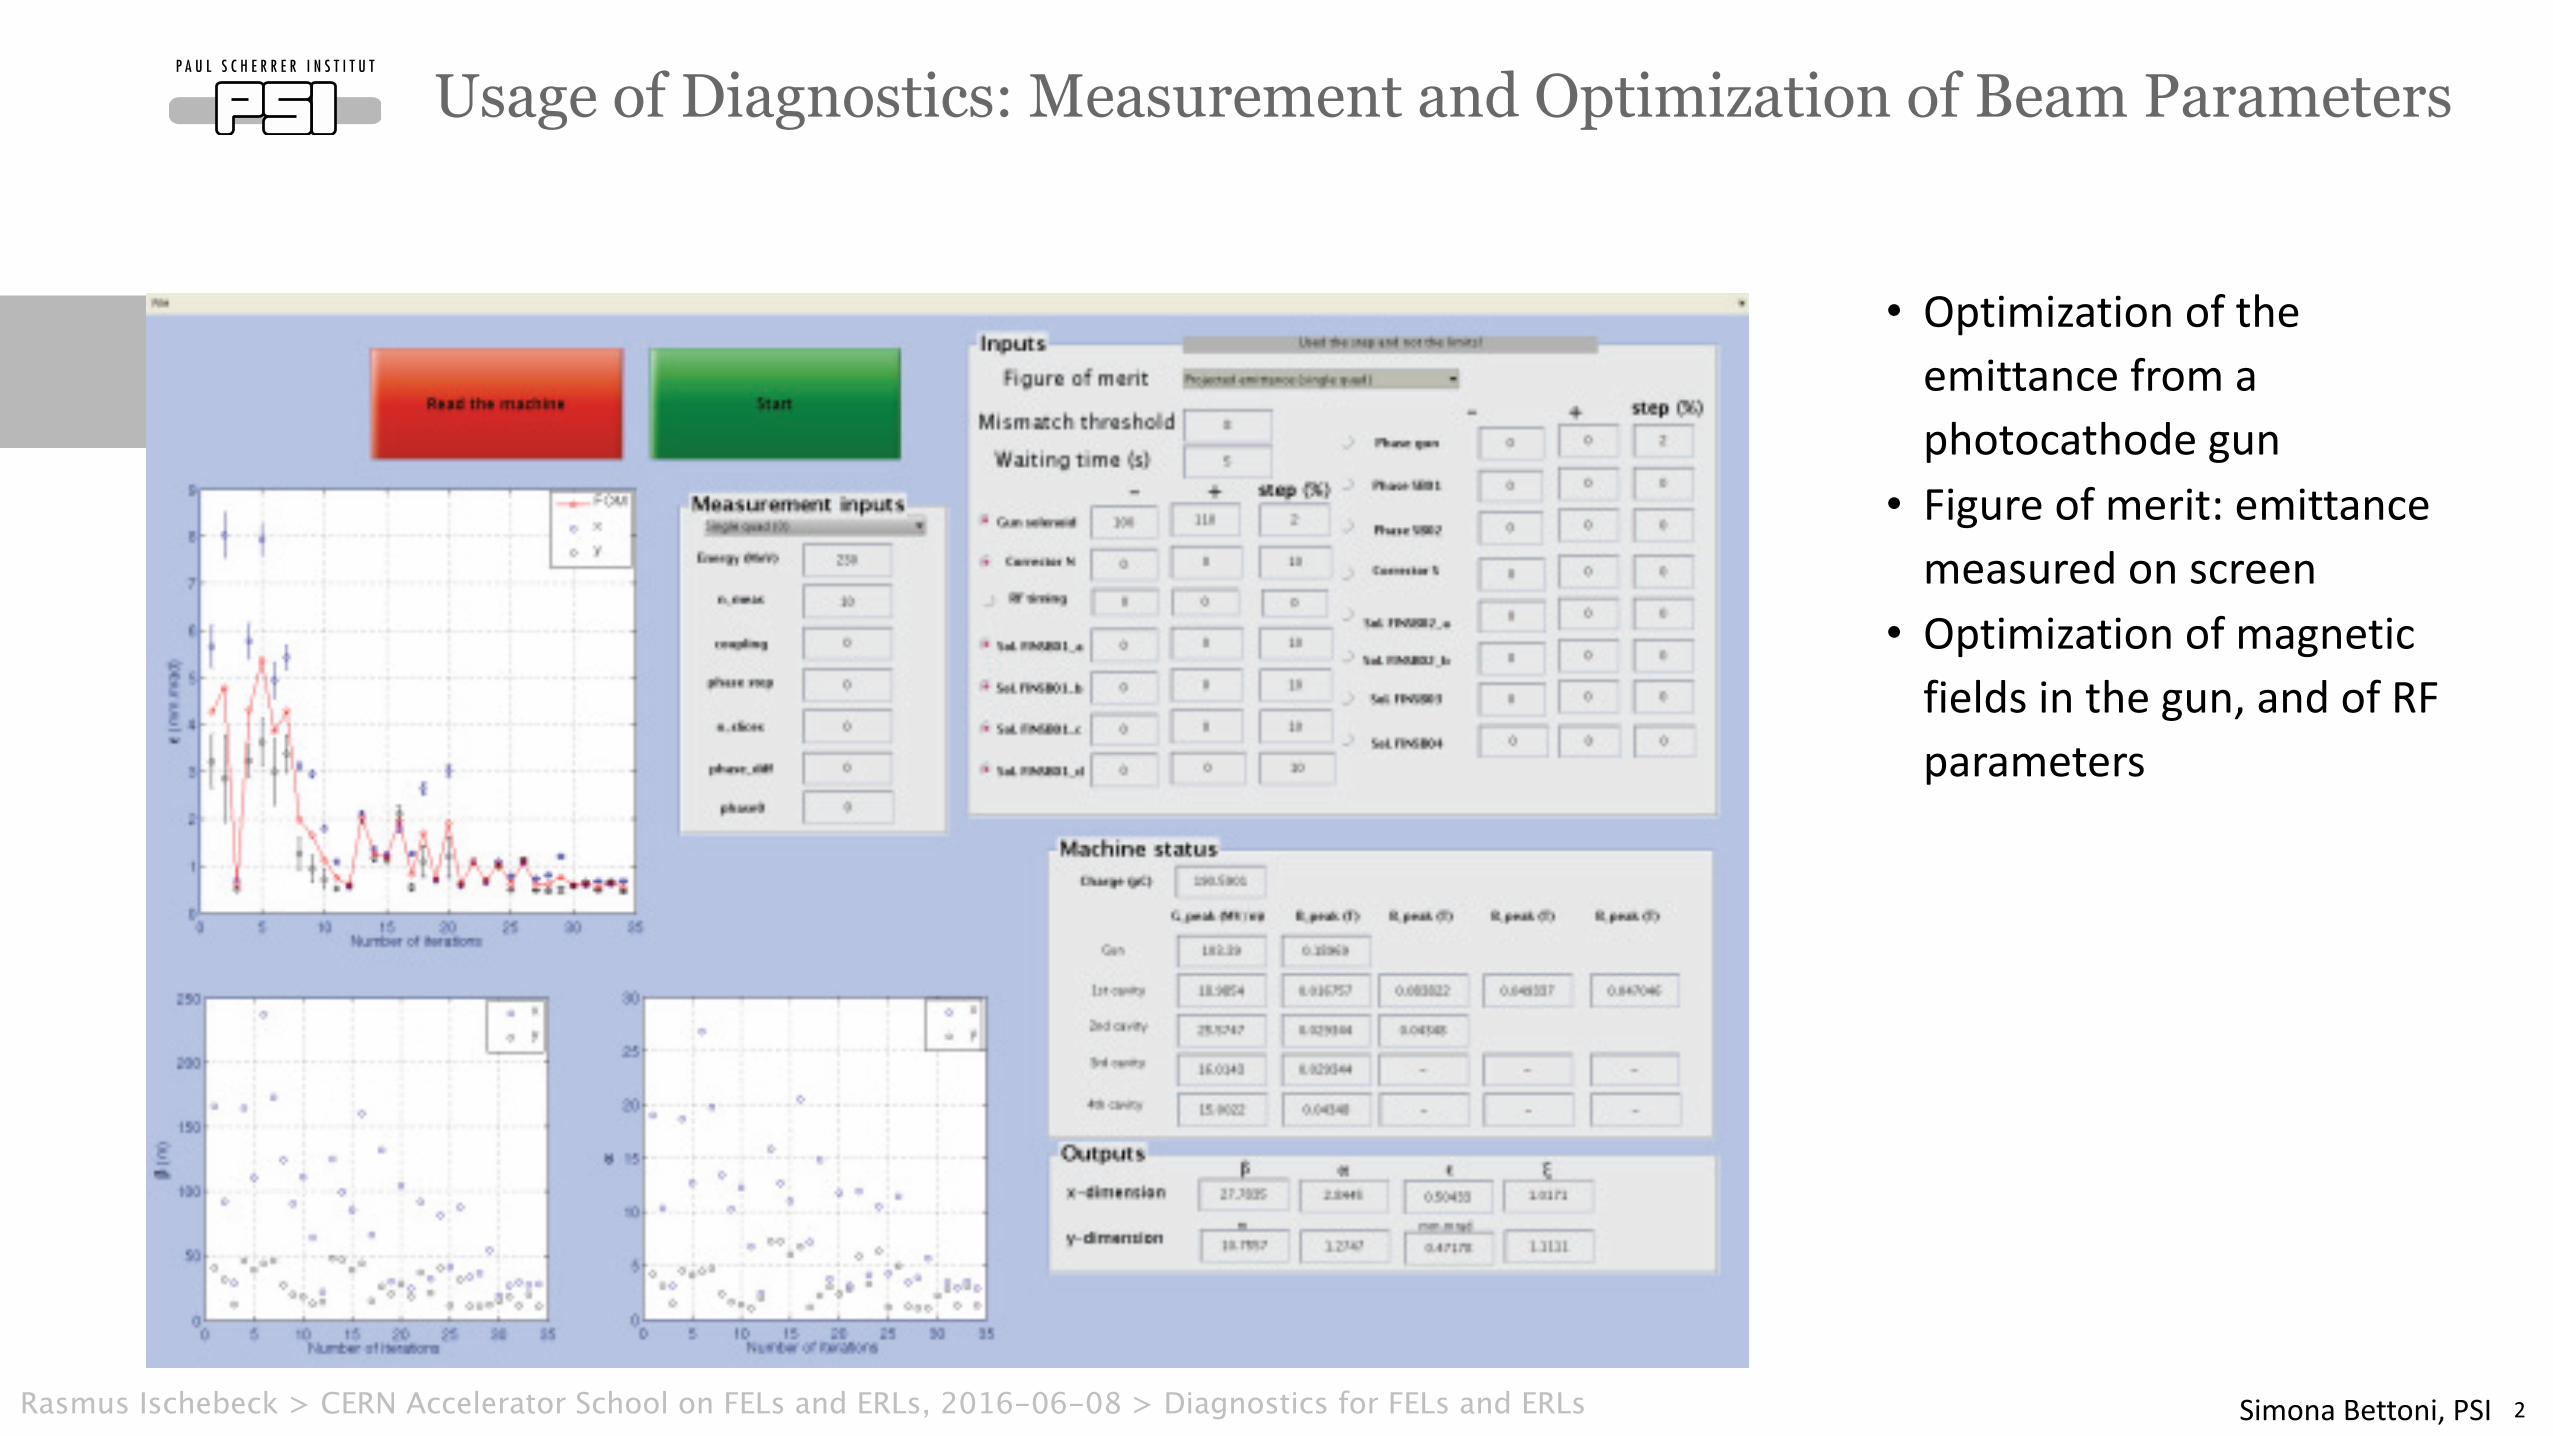
• Optimizationoftheemittancefromaphotocathodegun
• Figureofmerit:emittancemeasuredonscreen
• Optimizationofmagneticfieldsinthegun,andofRFparameters
Usage of Diagnostics: Measurement and Optimization of Beam Parameters
2SimonaBettoni,PSI
Figure 13: emittance along the bunch for the SwissFEL design assuming the LCLS and the SITF measured thermal emittance value for 266.7 nm laser wavelength.
Table 4: Optimized SwissFEL Injector Using the Thermal Emittance Measured at SITF
682 nm/mm
Charge (pC) 200
Laser pulse length (ps) 9.9 (FWHM)
Gun gradient (MV/m) 100
Laser sigma (mm) 0.38
THE APPLICATION OF THE OPTIMIZER IN THE MACHINE
The structure of the automatic optimizer could be very easily adapted to be applied directly to the machine. To do this it’s enough to send the settings to the machine control system instead of writing an Astra input file, and to measure the emittance and the mismatch instead of running the simulations. The Matlab based GUI written to do such optimization is shown in Fig. 14.
In the GUI the method to measure the emittance can be selected in a menu and the FOM can be defined. At each step the Twiss parameters, the emittances and the mismatch parameters with respect to the design values are computed.
The most important difference of the code applied to the machine with respect to the one used in the simulations is the way the noise is treated. In the case of the simulations this problem was solved by simply increasing the number of particles, considering the limited amount of time necessary to have a meaningful solution. In the case of the machine it was necessary to dedicate more attention to this aspect. In the optimization only the cases for which the measured emittances differ more than the standard deviation of the previous measurement are considered. Until now this was enough to obtain reasonable results. If necessary other tricks have to be applied: this measurement can be repeated several times or the changed parameters can be varied of a larger amount.
Figure 14: GUI developed to perform the emittance optimization in the machine. This particular test has been carried out with the X-band installed without power (minimum projected emittance 0.5 mm.mrad).
To have a robust and evident test of the optimizer we intentionally strongly degraded the emittance to about 4 mm.mrad, and after that we left the code recovering. In Fig. 15 the FOM (defined in that case as the geometric average of the projected horizontal and vertical emittances) is plotted as a function of the iteration number.
Figure 15: FOM and H and V projected emittances during the optimizer run in SITF.
As it can be seen the code brought back the emittance to slightly less than the emittances measured in that machine configuration.
CONCLUSIONS The new PSI gun and the new optimization of the
injector allows decreasing the simulated slice emittance of more than 30% in the 200 pC case. Several charges configurations have been optimized for the different operation modes. The thermal emittance as a function of the laser wavelength has been measured and this information with other constraints has been used to check the final wavelength for SwissFEL. Assuming the value measured at the SITF the design for SwissFEL has been refined. The new gun will be installed in the next winter shut-down to profit and to verify this design. Other more exotic possibilities have been explored for SwissFEL, as the best shape for the initial laser pulse and a higher current at the exit of the injector.
-2 -1 0 1 2x 10⁻³
0.2
0.3
0.4
0.5
z (m)
Nor
mal
ized
H (m
m.m
rad)
LCLS thermal HSITF thermal H
TUPSO07 Proceedings of FEL2013, New York, NY, USA
ISBN 978-3-95450-126-7
224Cop
yrig
htc �
2013
CC
-BY-
3.0
and
byth
ere
spec
tive
auth
ors
FEL Technology I : Guns, Injectors, Accelerator
Rasmus Ischebeck > CERN Accelerator School on FELs and ERLs, 2016-06-08 > Diagnostics for FELs and ERLs
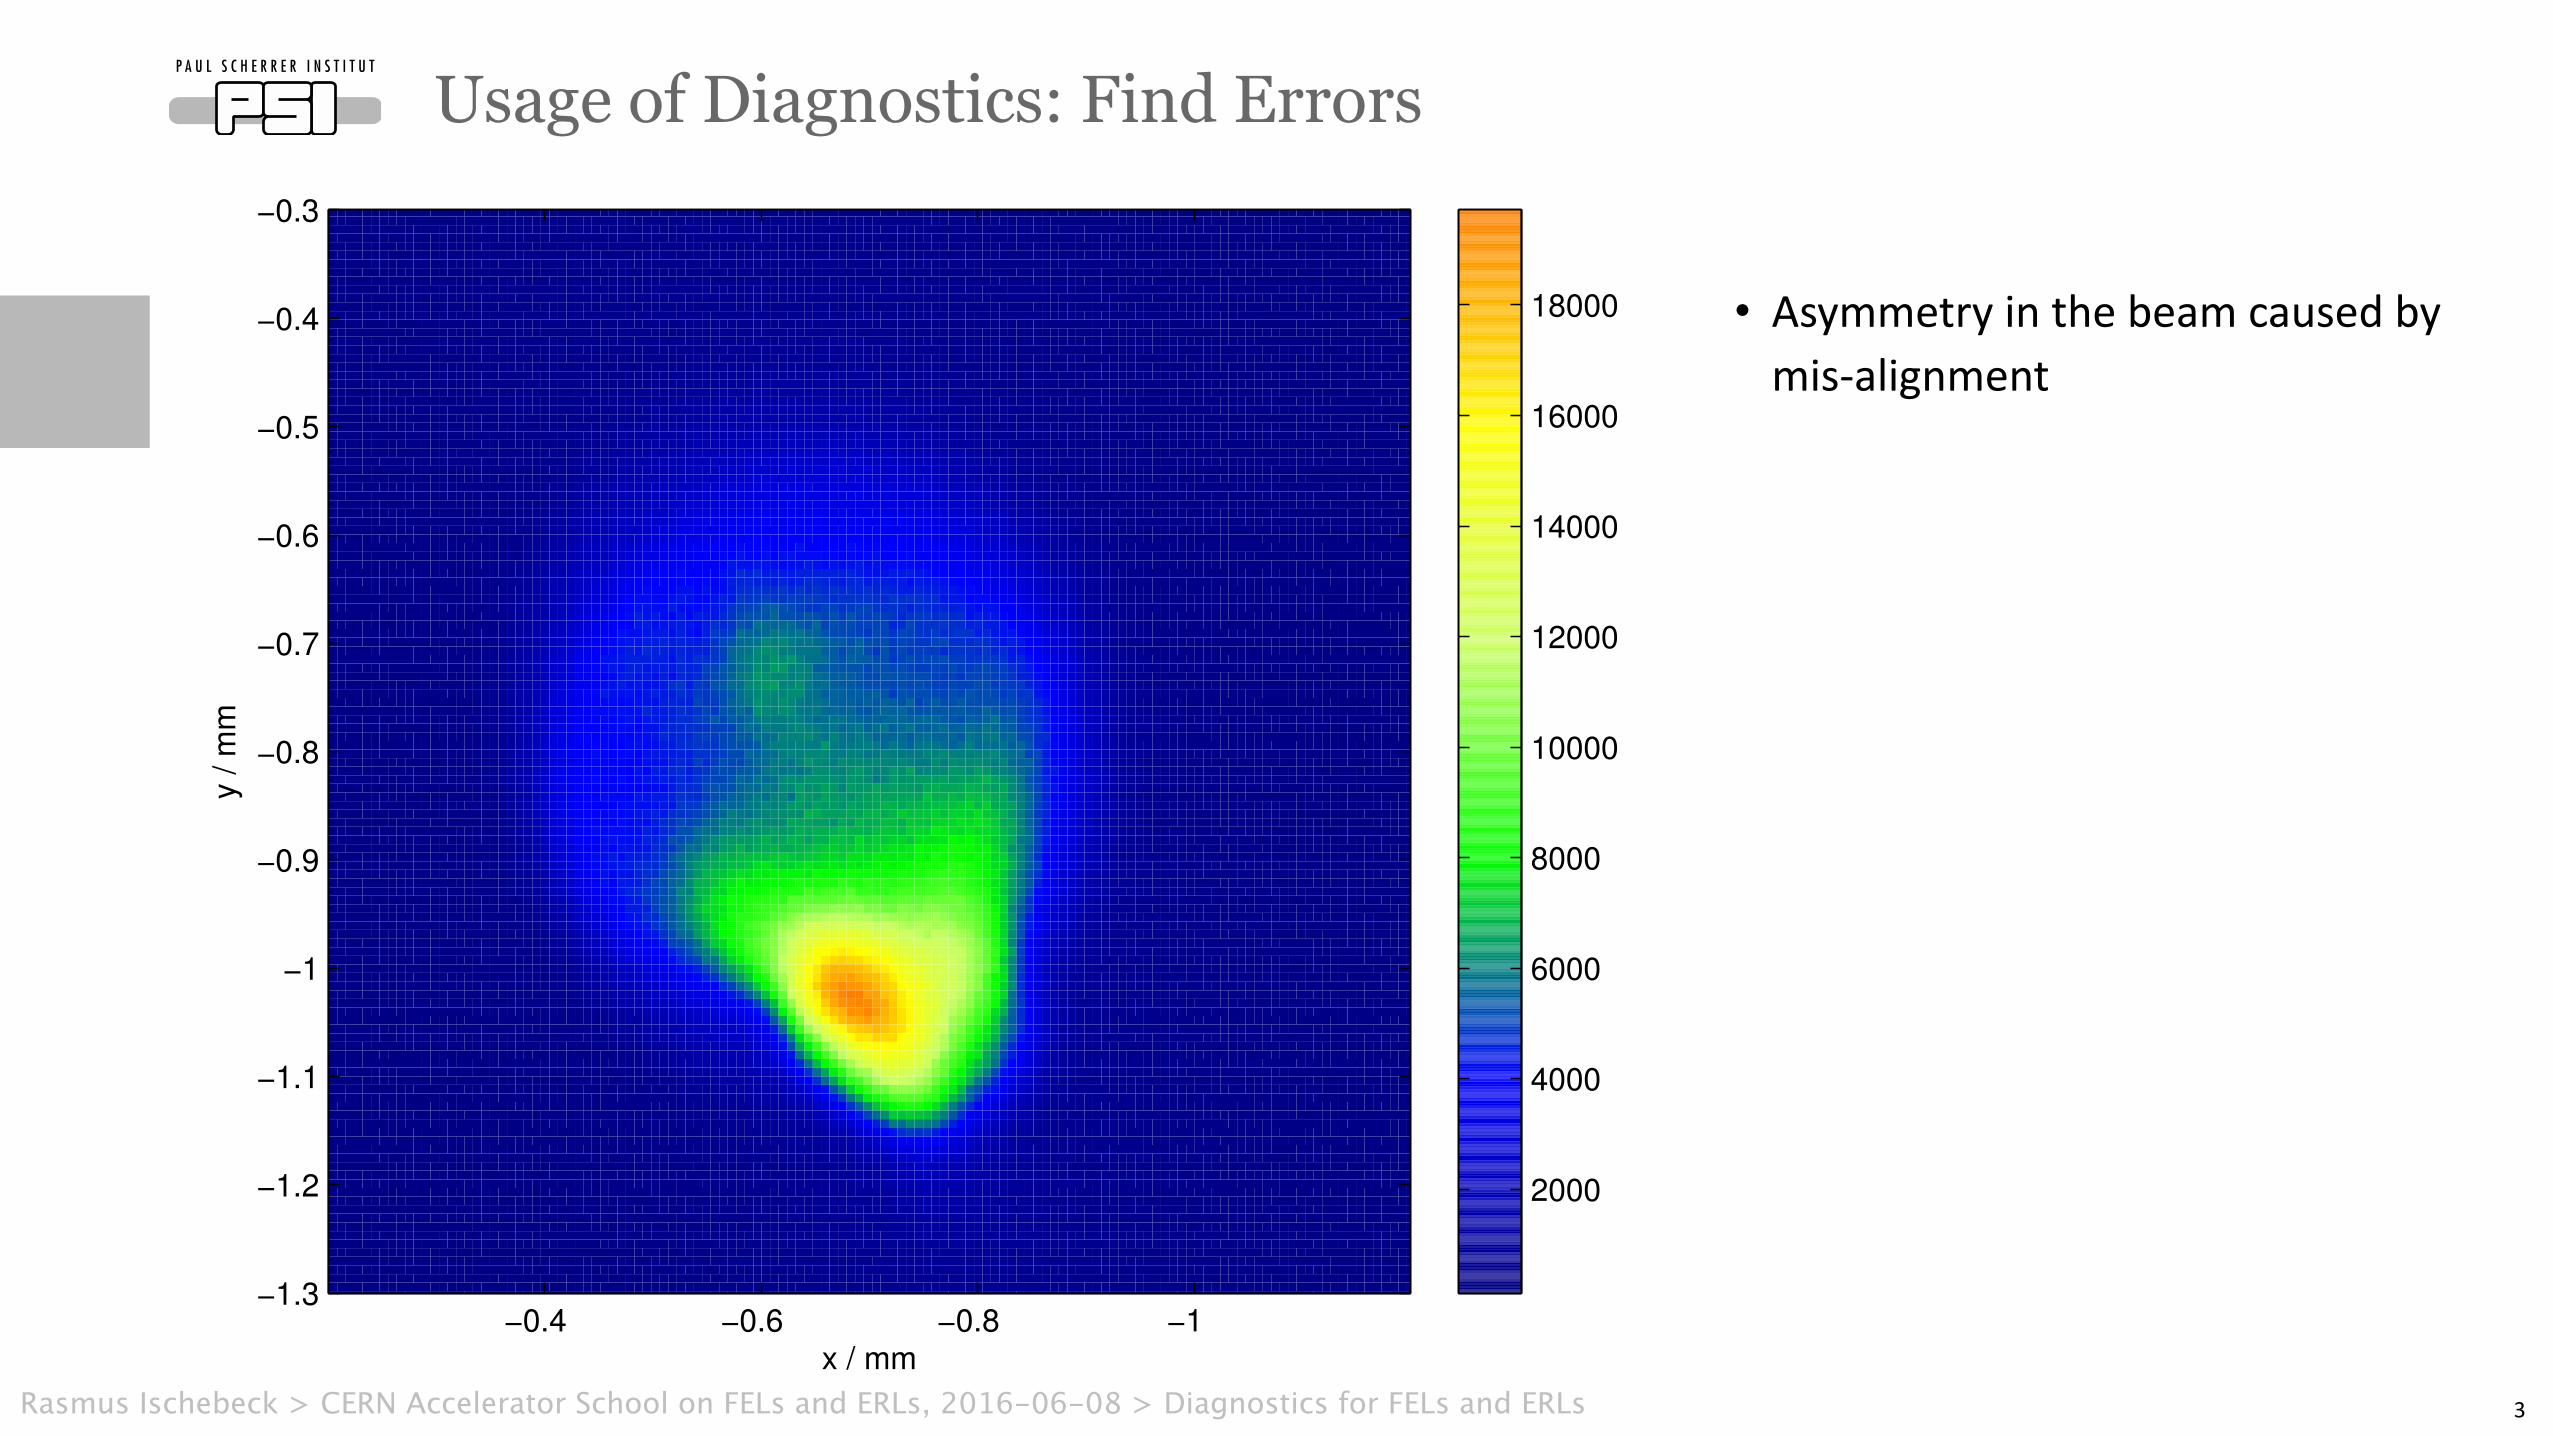
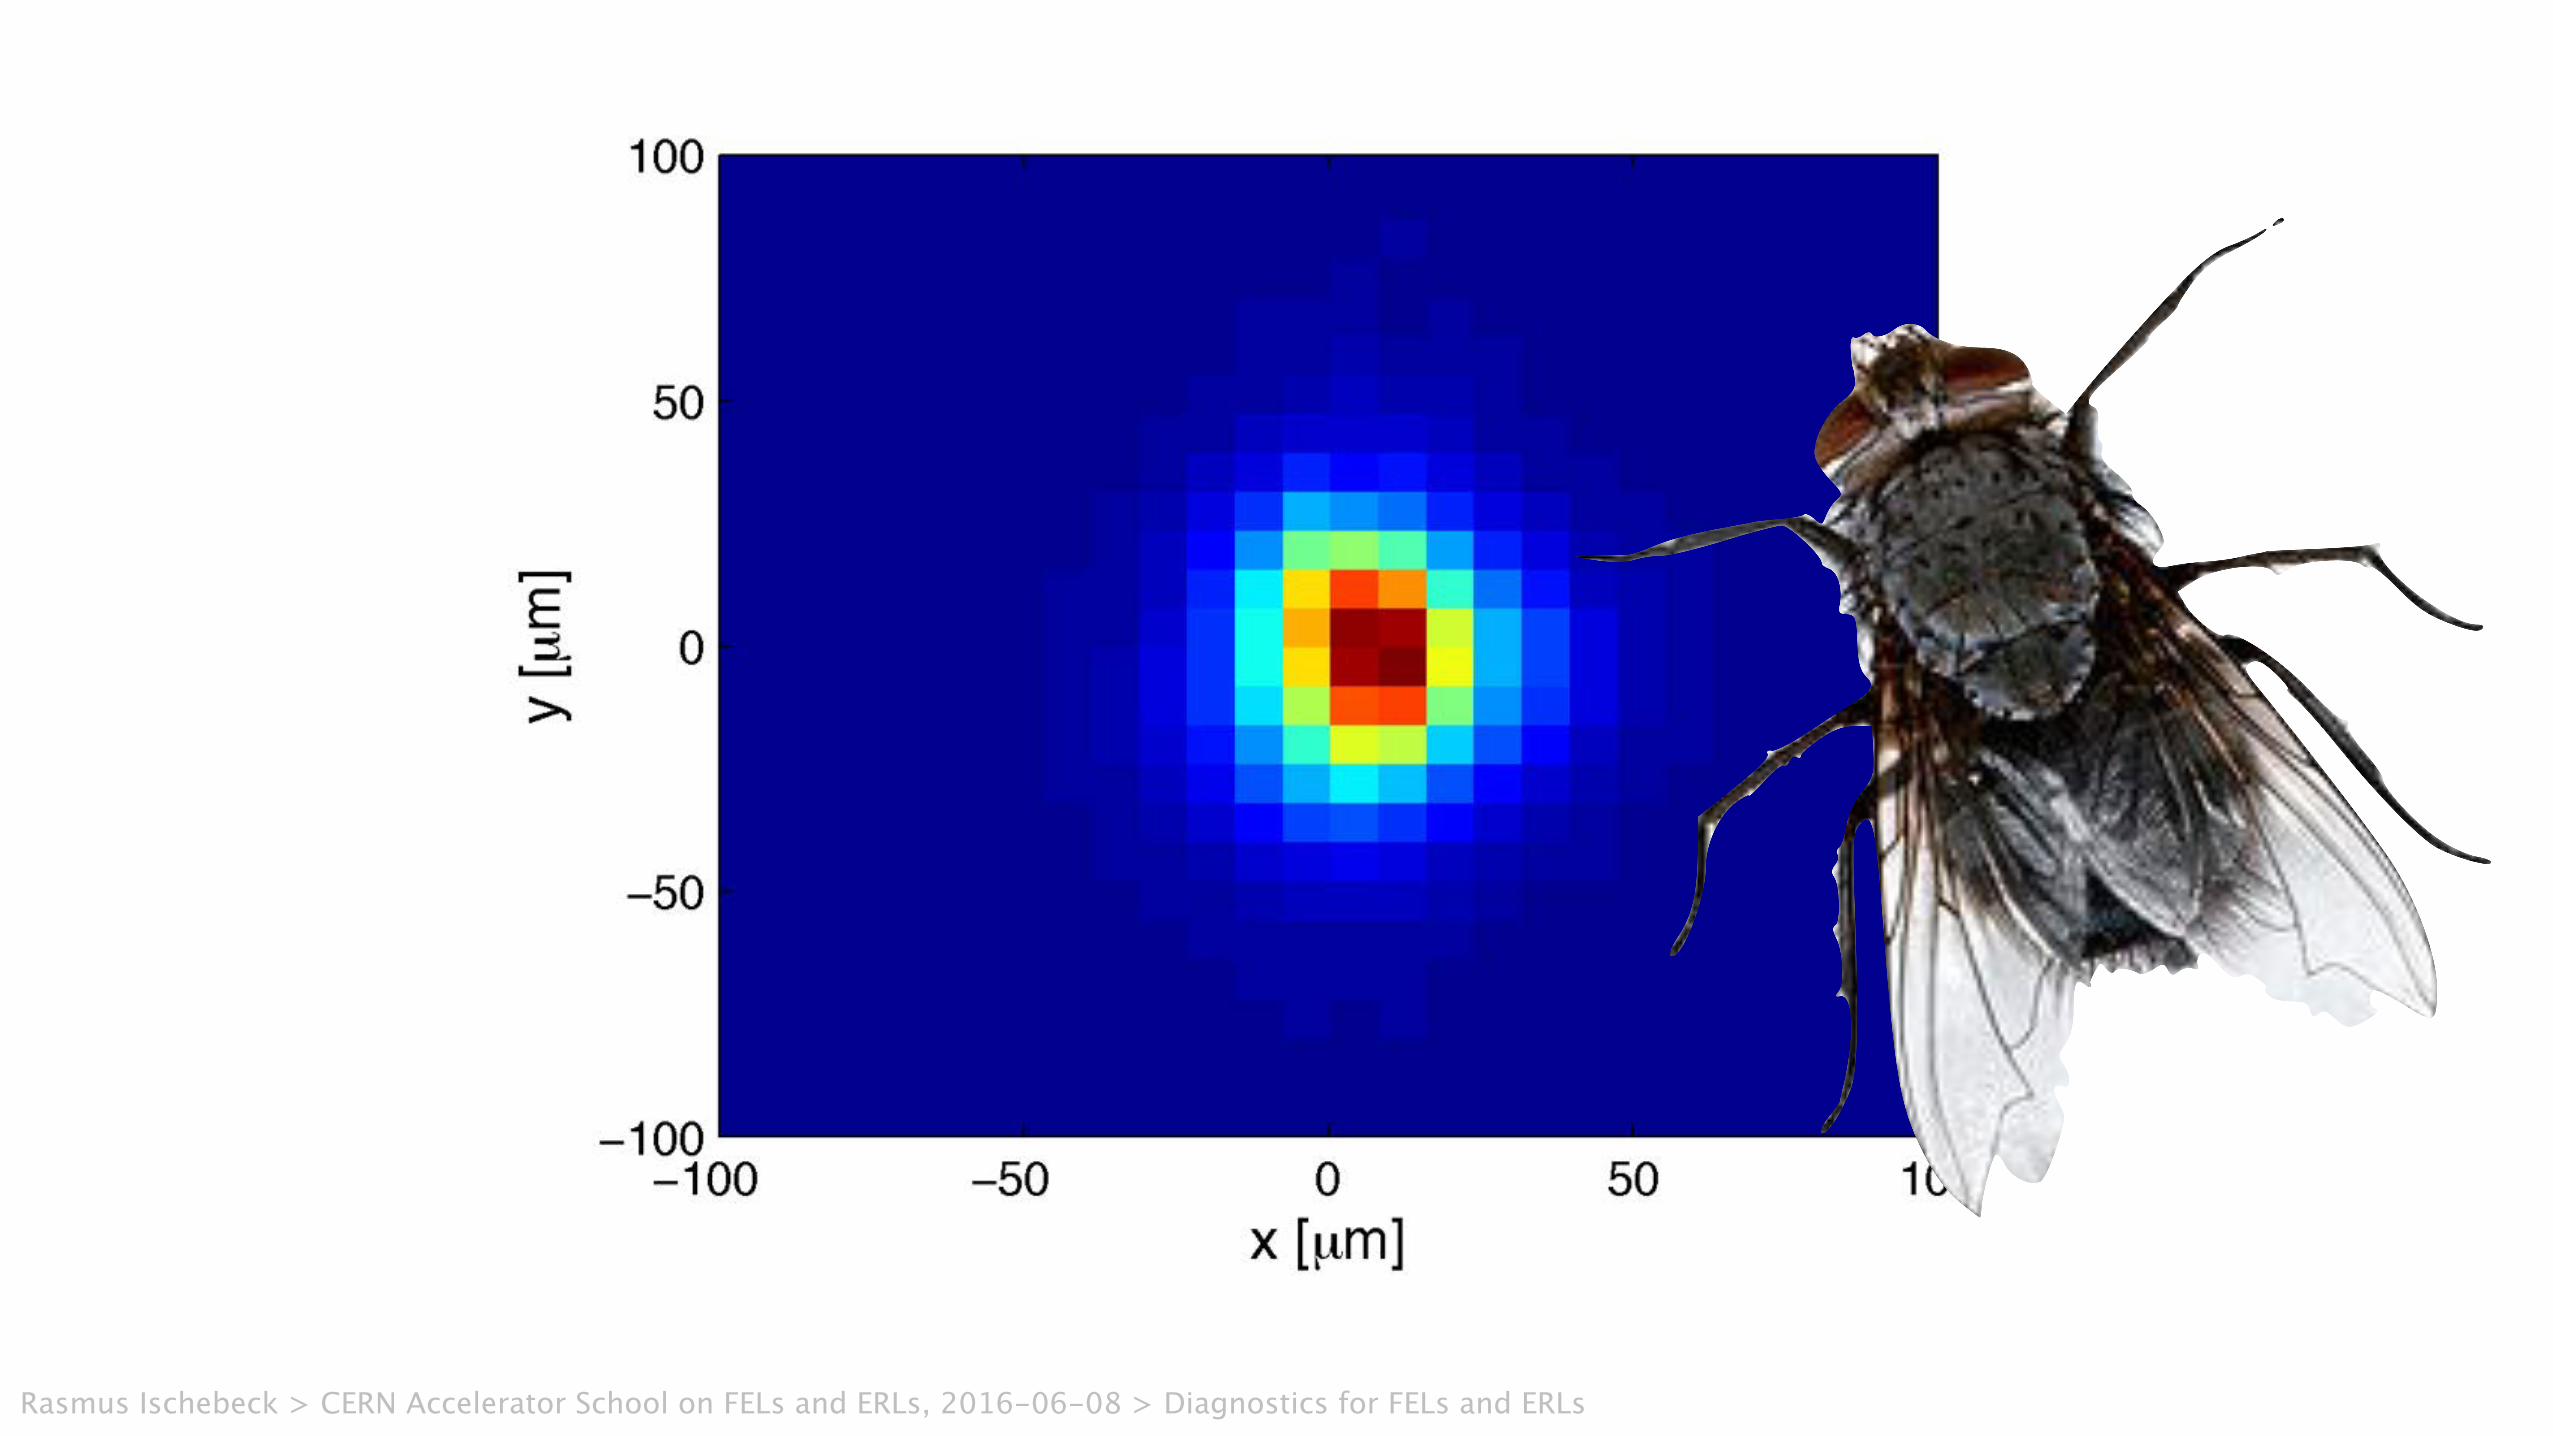
• Asymmetryinthebeamcausedbymis-alignment
Usage of Diagnostics: Find Errors
3
x / mm
y / m
m
−1−0.8−0.6−0.4−1.3
−1.2
−1.1
−1
−0.9
−0.8
−0.7
−0.6
−0.5
−0.4
−0.3
2000
4000
6000
8000
10000
12000
14000
16000
18000
Rasmus Ischebeck > CERN Accelerator School on FELs and ERLs, 2016-06-08 > Diagnostics for FELs and ERLs
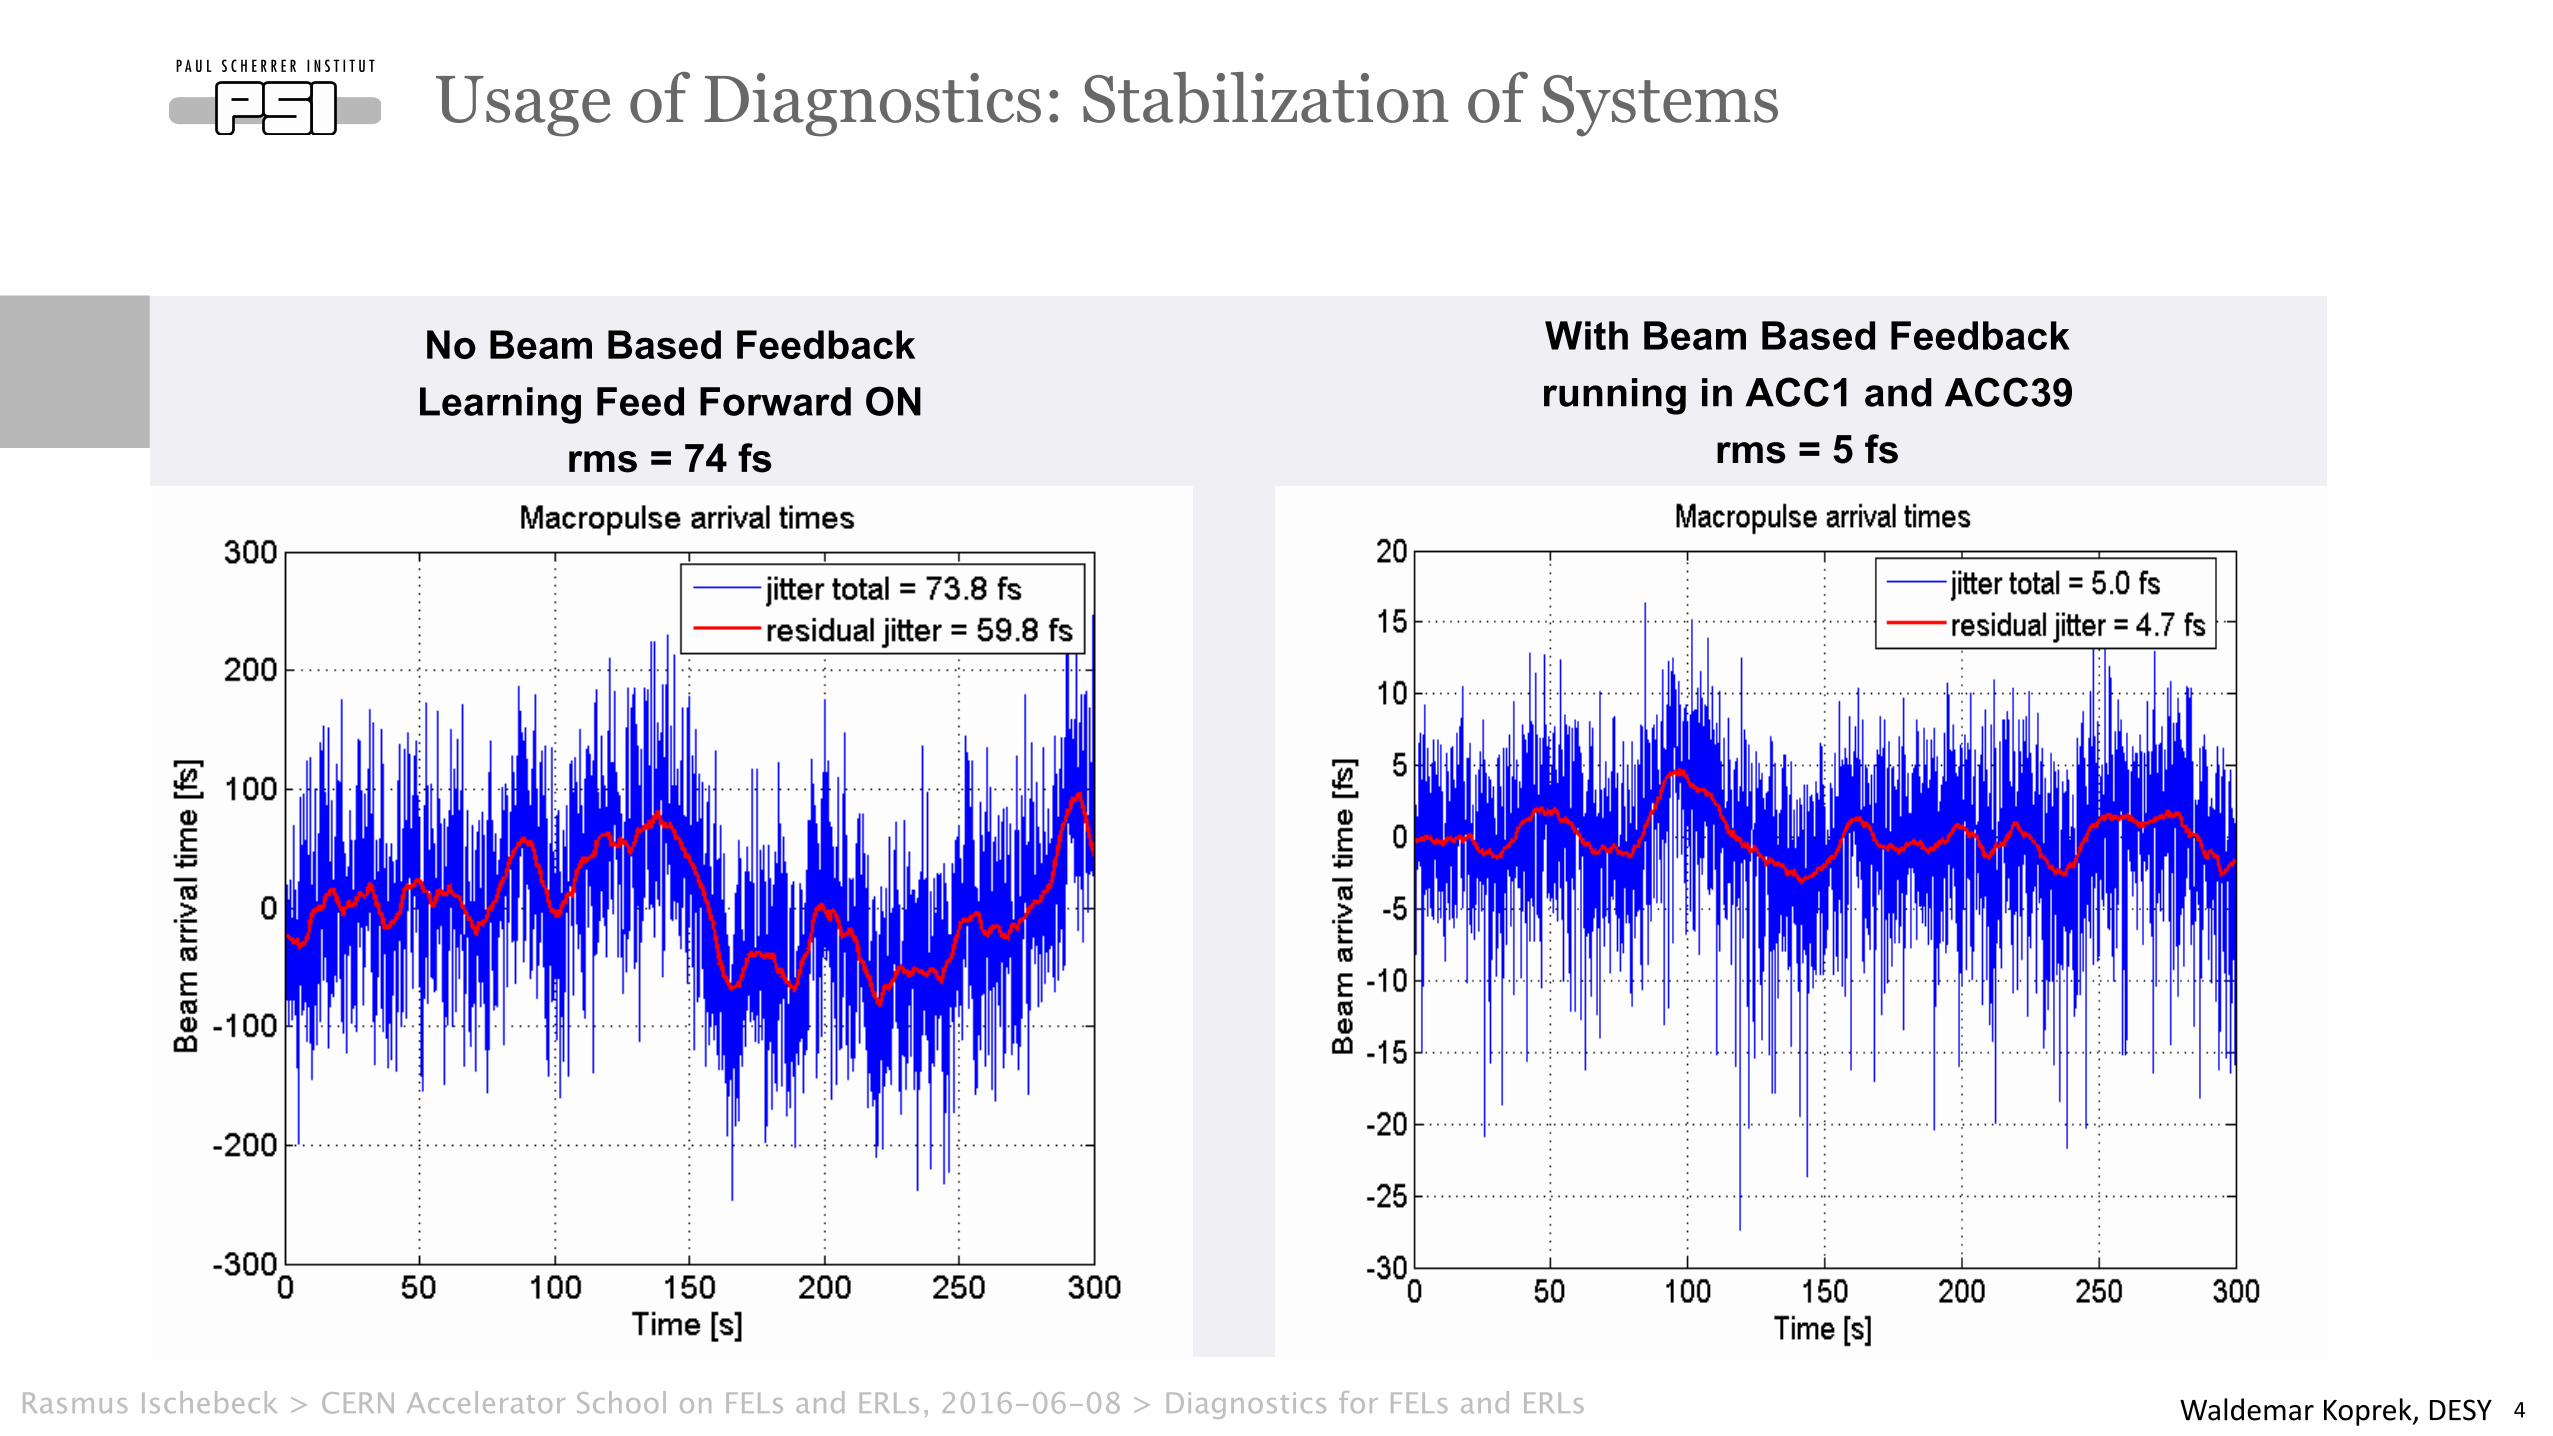
Usage of Diagnostics: Stabilization of Systems
4WaldemarKoprek,DESY
24
FLASH/XFEL
Waldemar Koprek, DESYFLASH Seminar, 02.11.2010
MeasurementMacro pulse arrival time jitter
With Beam Based Feedbackrunning in ACC1 and ACC39
rms = 5 fs
No Beam Based FeedbackLearning Feed Forward ON
rms = 74 fs
ΔA1/ A1~10e-4
Δφ1< 0.03OLLRF
Regulation Performance
• resolution of BAM ~ 10 fs for single bunch can be improved to ~ fs for macro pulse
Rasmus Ischebeck > CERN Accelerator School on FELs and ERLs, 2016-06-08 > Diagnostics for FELs and ERLs
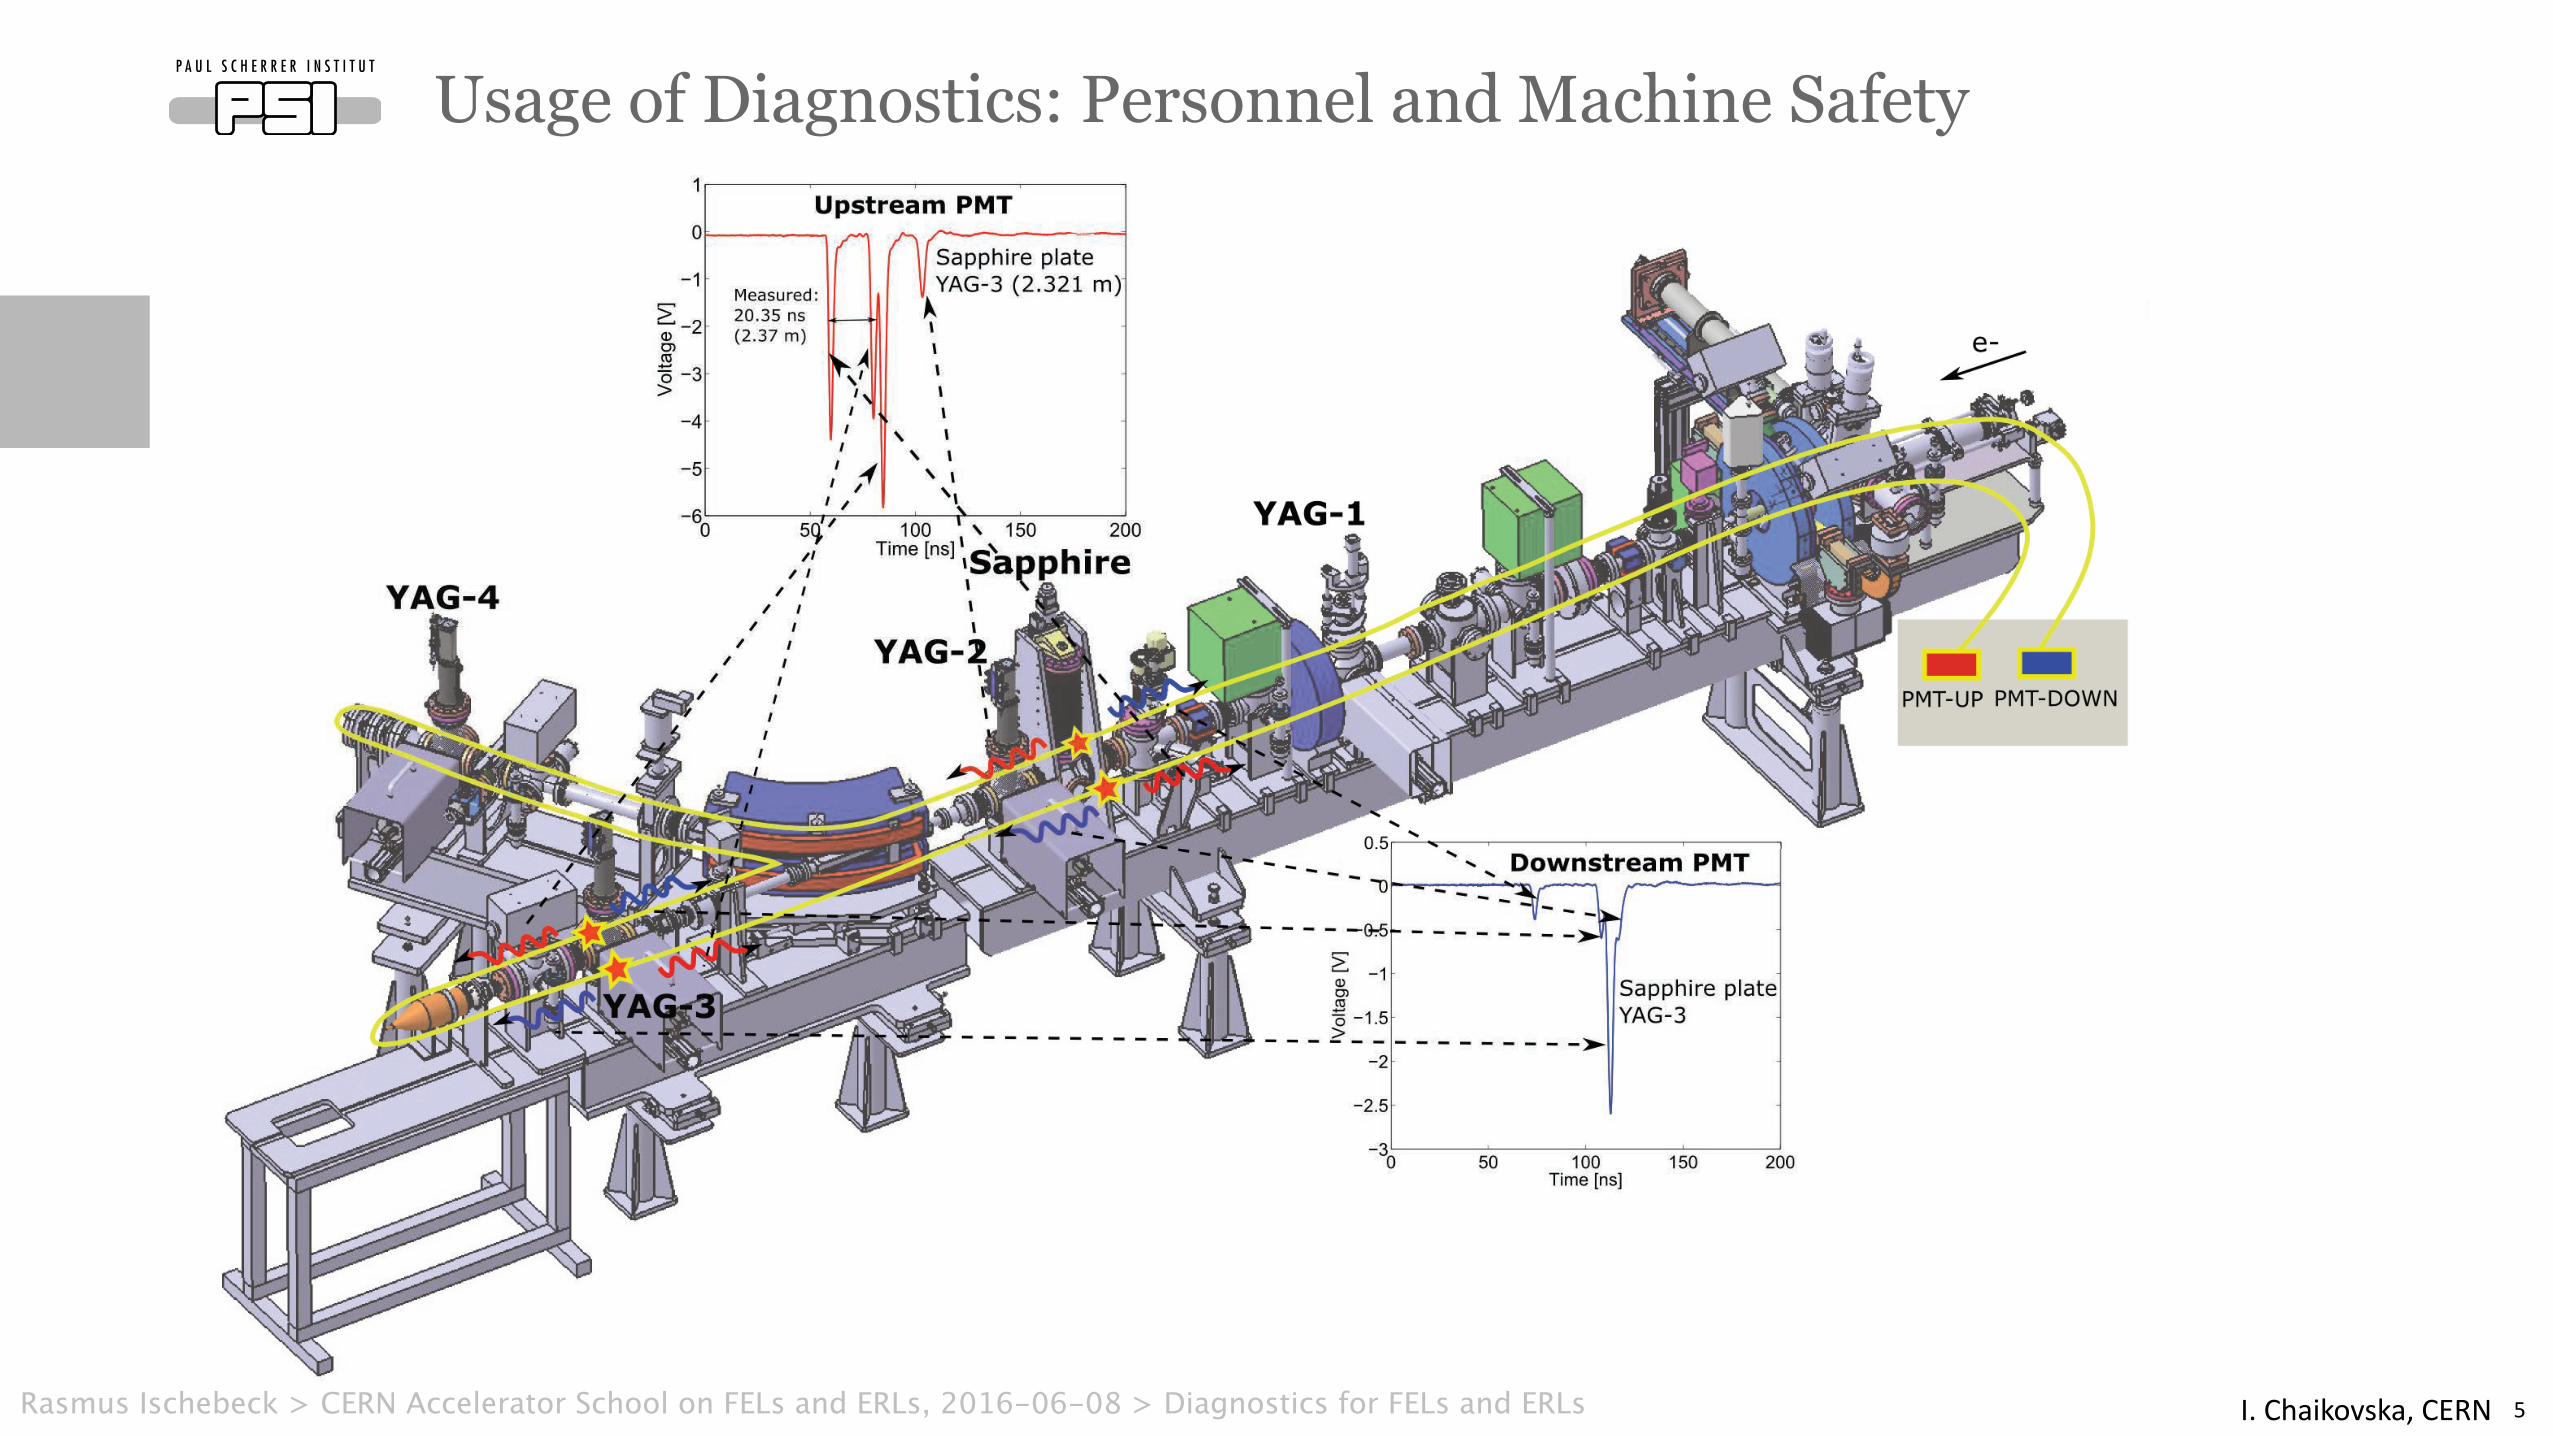
Usage of Diagnostics: Personnel and Machine Safety
5I.Chaikovska,CERNFigure 1: Scheme of the FBLM installed at PHIL. The red stars indicate the positions of the loss points at Sapphire plate andYAG-3 locations. In this case, two plots illustrate the typical beam losses measured by the upstream and downstream PMTs.
Although the strength of the signal detected is propor-tional to the beam loss intensity, it is also dependent on thetype and mass of the material within which the electromag-netic shower is developed. Various beam line elements andhardware will cause the signal variations since the fiber hasto be pulled around such components. This, together withthe absorption of the signal by the fiber as it transmits tothe detector makes difficult to extract the exact amount ofthe beam loss and use the FBLM to measure the absoluteintensity of the losses.
The time calibration of the FBLM can be accomplishedby several techniques [4]. The one, adopted by our schemeuses the beam loss signal produced by inserting a knowndevice such as the vacuum valve, collimator, screen, etc.as the reference. Knowing the speed of light in the fiber,one can calibrate the oscilloscope display (time between thebeam losses measured in seconds) to real distance alongthe accelerator (distance between the beam losses measuredin meters). In our case, the speed of light in the fiber wasmeasured to be 0.63 c (0.19 m/ns), where c is a speed oflight in vacuum. This calibration gives that every meteralong the accelerator is 8.6 ns on the oscilloscope. There-fore, by measuring the time between the reference and theunknown beam loss signal and dividing it by 8.6 ns/m onecan determine the location in meters from the reference tothe unknown beam loss point.
As mentioned before, in some locations due to the beamline elements the fiber covers a slightly longer path than
the beam line. The further measurements are done fromthe reference, the greater chance for the error to penetrateinto the measurements. This results in the deterioration ofthe FBLM accuracy. Therefore, to reduce the errors in theabsolute loss position measurements, it is required to have asmany references as possible. Moreover, the fiber should beplaced as close to the beam pipe as allowed by the geometryof the beam line components.
FBLM INSTALLATIONFibers for the FBLM
The fiber installed at PHIL facility is made by the LEONIFiber Optics GmbH. It belongs to the Hard Plastic CladSilica (HPCS) fibers which combines fused silica glass coreand polymer cladding consisting of a fluorinated acrylate.Numerical aperture of the HPCS fibers can go up to 0.49.This kind of the fibers are positioned as a cost-effectivealternative to the silica/silica glass fibers. As far as radiationhardness is concerned, the fibers with plastic core/claddingsuffer from radiation damages. Radiation damage of theoptical fibers can be an issue because it will degrade the lightpropagation. Therefore, depending on the expected radiationlevel the fibers having silica glass core and cladding arepreferable (e.g. AS600/660UVST, LEONI Fiber Optics) [5].
The fibers used at PHIL have a 600 µm fused silica glasscore, 630 µm of optical cladding made from polymer and950 µm Tefzel! jacket. Since the jacket surrounding the
TUPD23 Proceedings of IBIC2014, Monterey, CA, USA
ISBN 978-3-95450-141-0
464Copyright
©2014
CC
-B
Y-3.0
and
by
the
respective
authors
Beam Loss Detection
Rasmus Ischebeck > CERN Accelerator School on FELs and ERLs, 2016-06-08 > Diagnostics for FELs and ERLs
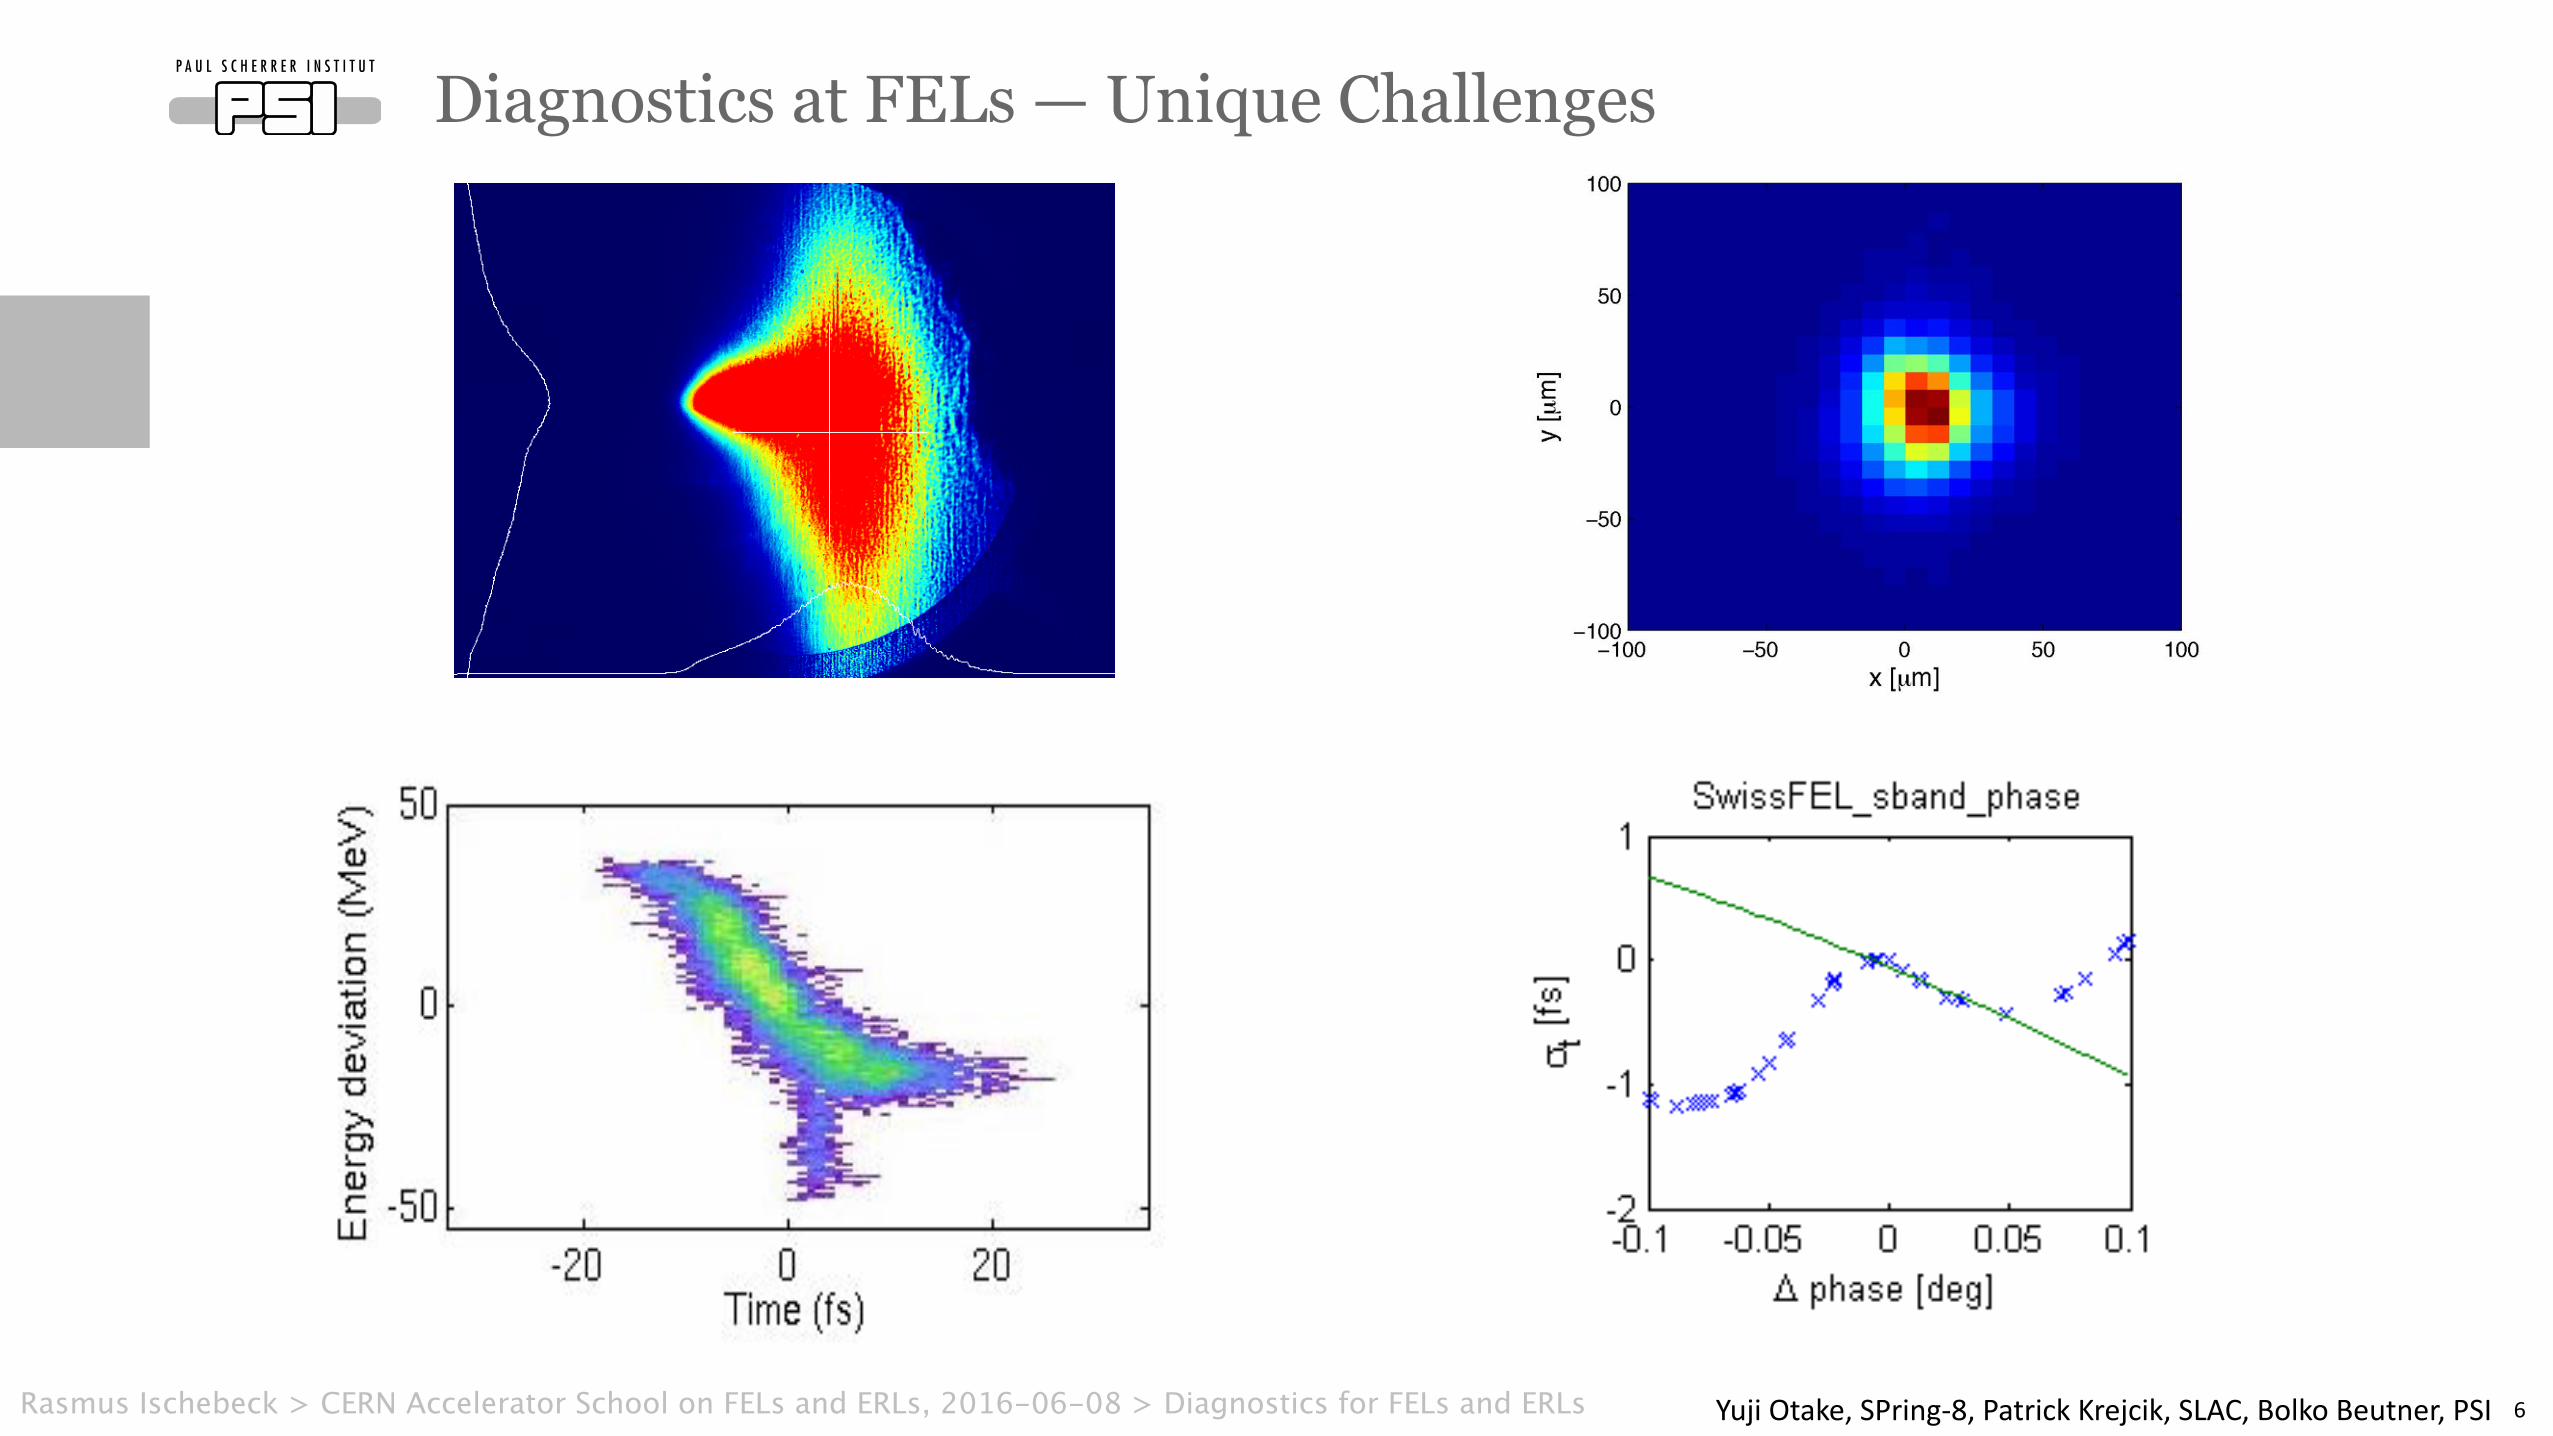
Diagnostics at FELs — Unique Challenges
6
20pC, 1keV short bunch setup Lasing off Lasing on
X-rays
4.5 fs
electrons YujiOtake,SPring-8,PatrickKrejcik,SLAC,BolkoBeutner,PSIRasmus Ischebeck > CERN Accelerator School on FELs and ERLs, 2016-06-08 > Diagnostics for FELs and ERLs
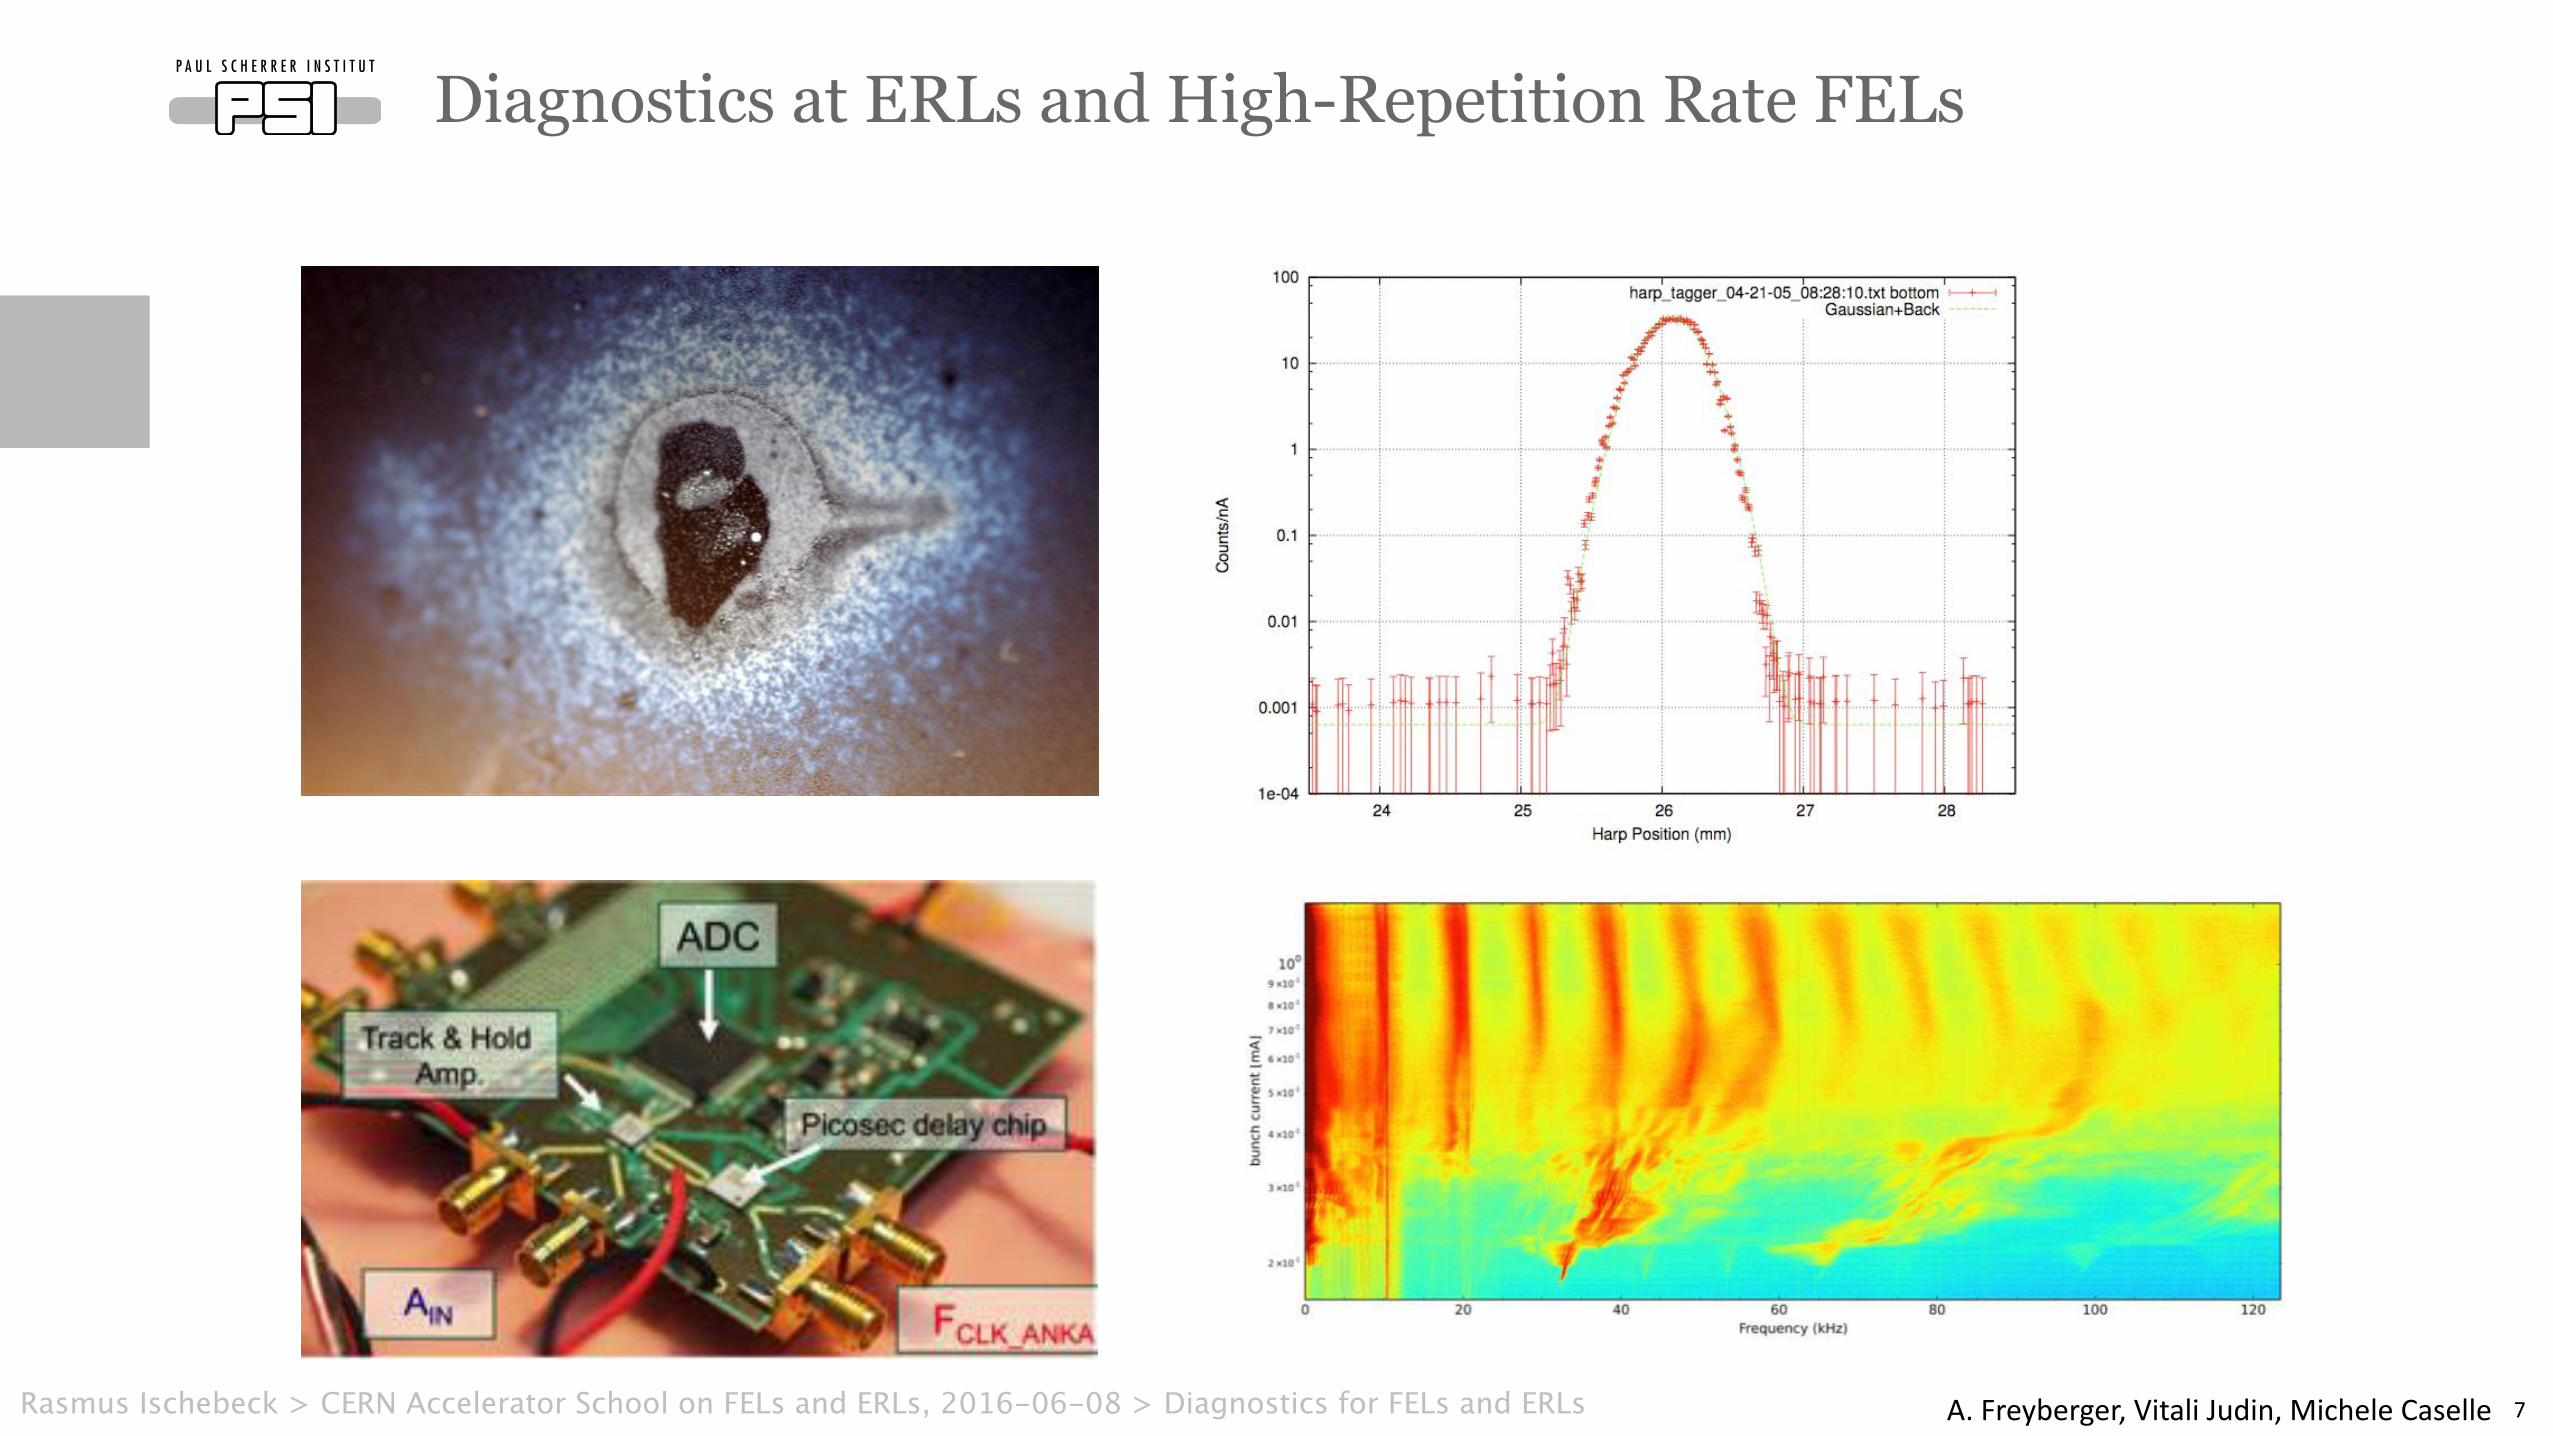
Diagnostics at ERLs and High-Repetition Rate FELs
7
Large dynamic range measurements (example)
! Main principal of one of the ways to make large dynamic range measurements is to reduce a measurement to frequency measurements.Then make it work for 1 Hz and for 100 MHz and this is 108 dynamic range.
! For instance use PMT and keep them working in counting mode.! Can be applied to e- beam measurements, laser, (light), X-rays.! Example: wire scanner measurements:
Courtesy of A. Freyberger (measured at CEBAF)
A.Freyberger,VitaliJudin,MicheleCaselleRasmus Ischebeck > CERN Accelerator School on FELs and ERLs, 2016-06-08 > Diagnostics for FELs and ERLs
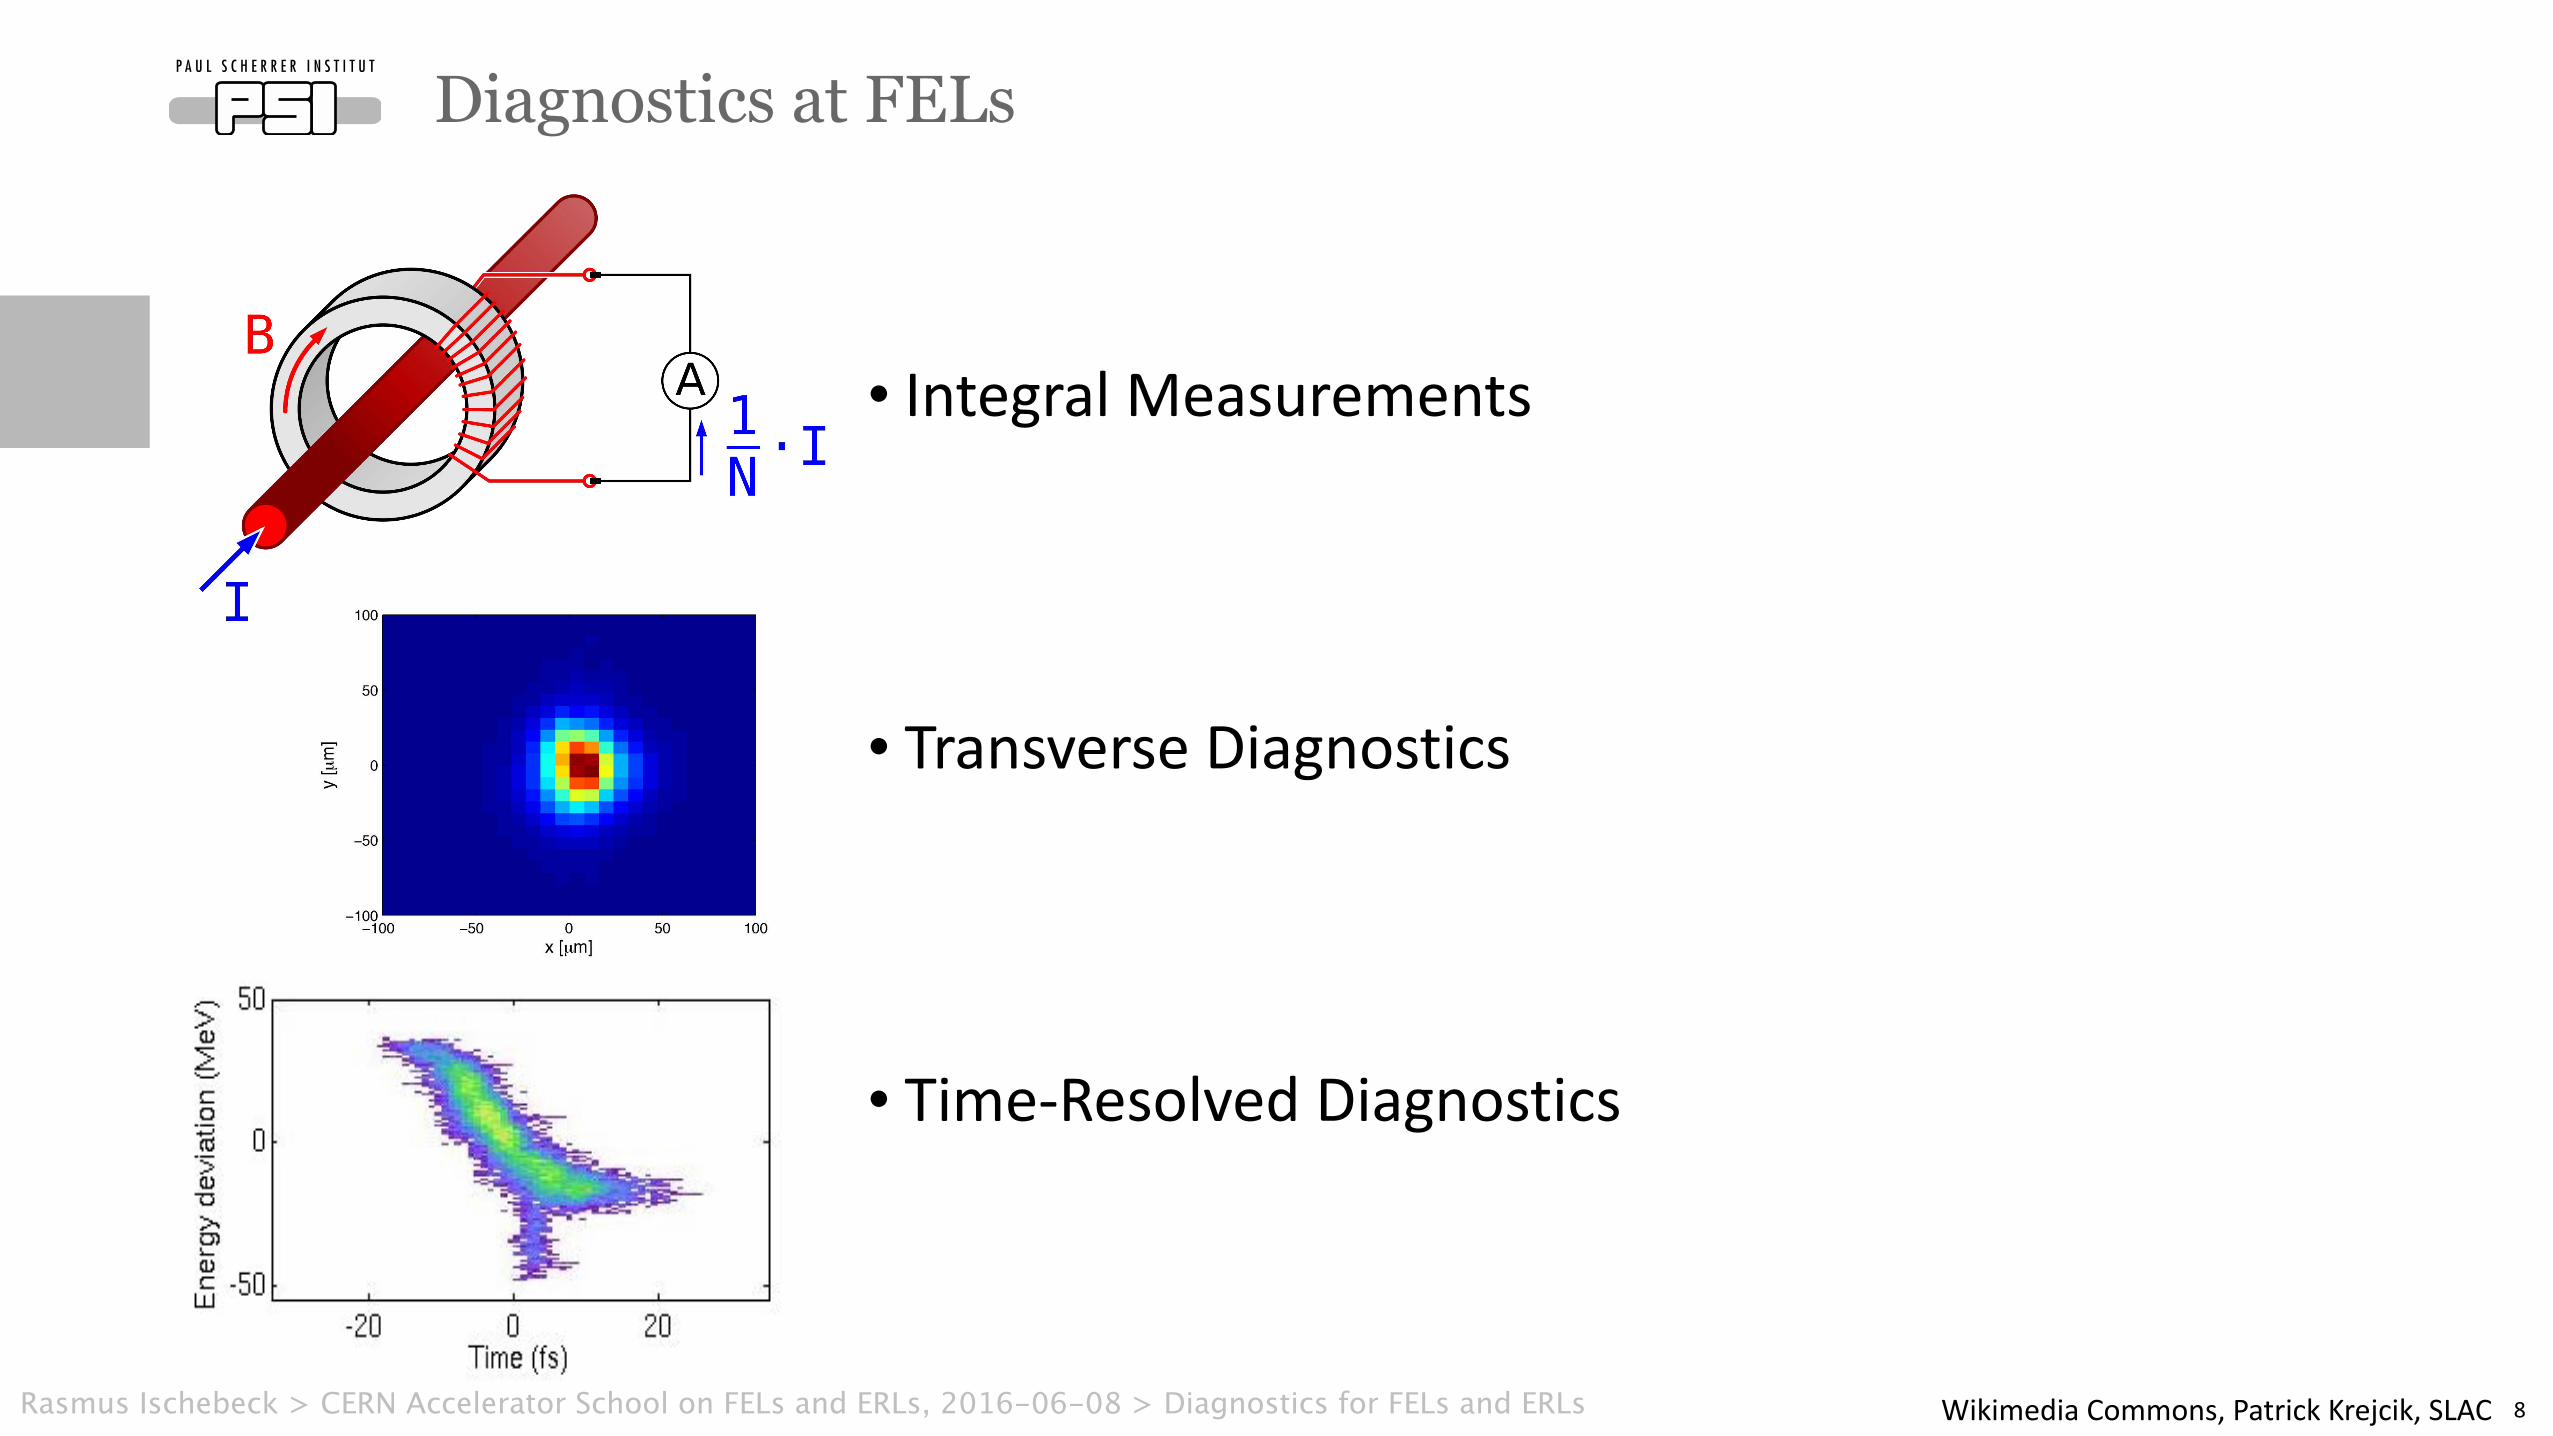
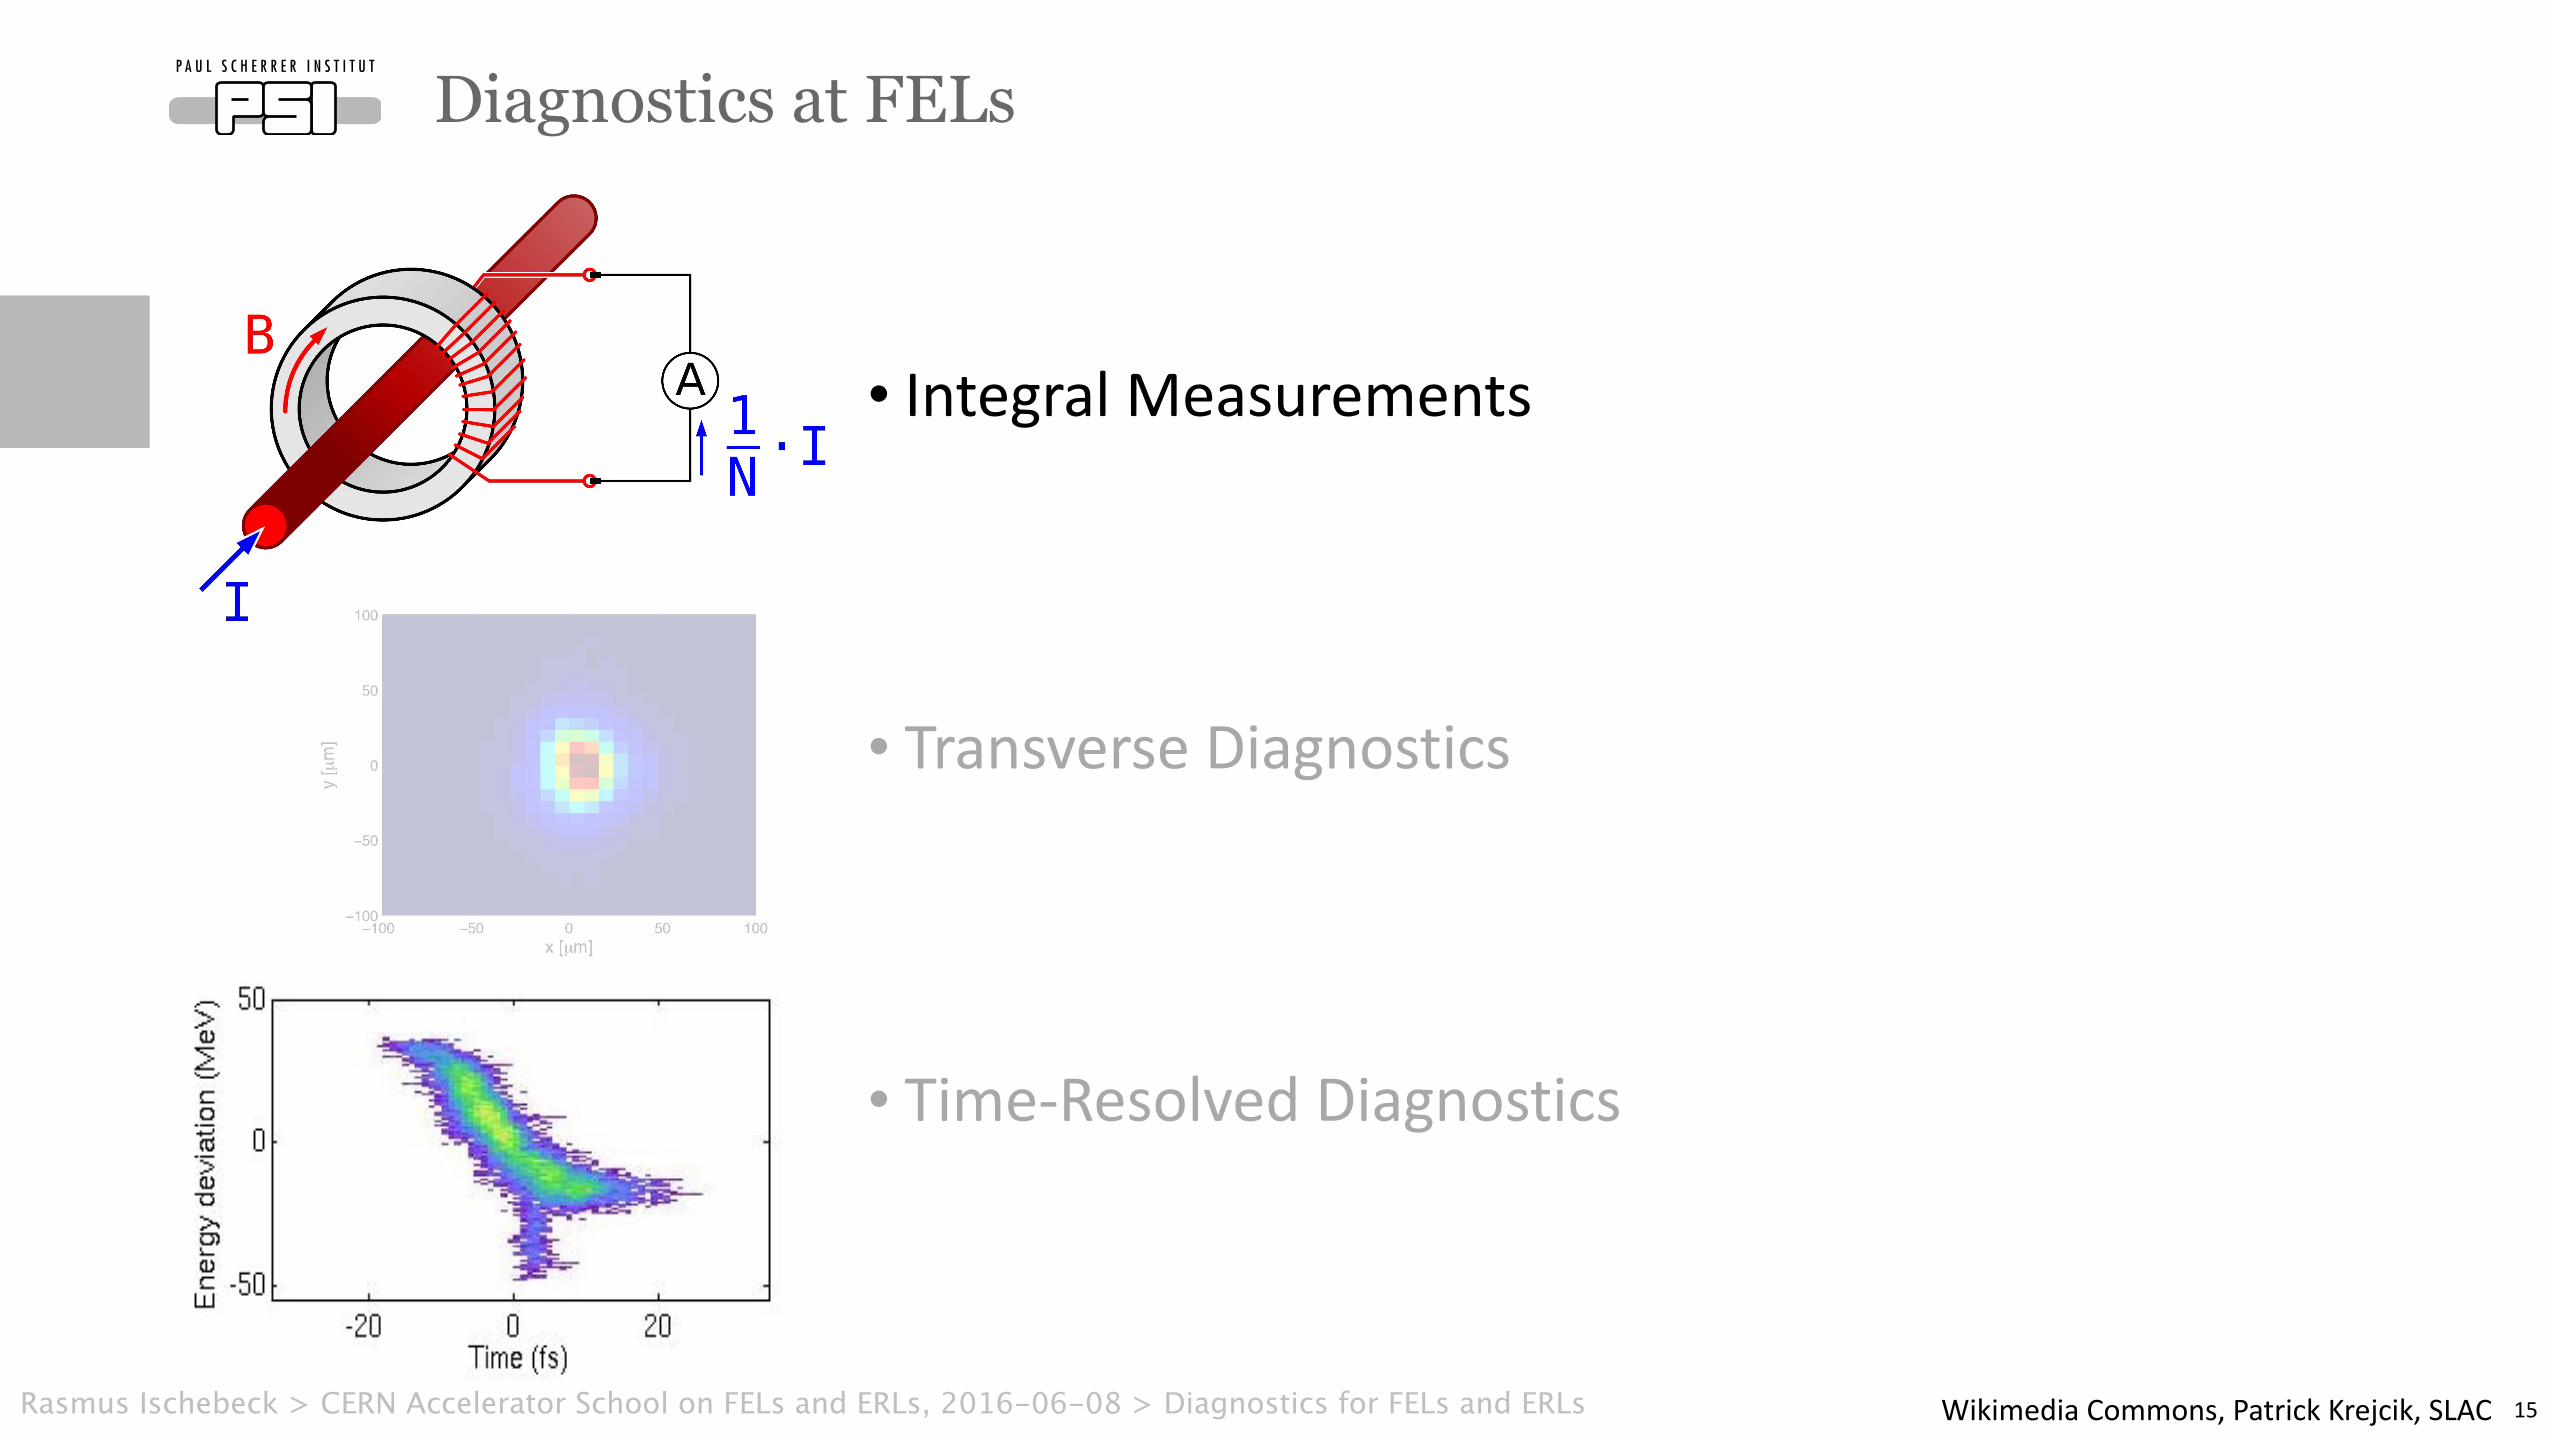
• IntegralMeasurements
• TransverseDiagnostics
• Time-ResolvedDiagnostics
Diagnostics at FELs
8
20pC, 1keV short bunch setup Lasing off Lasing on
X-rays
4.5 fs
electrons WikimediaCommons,PatrickKrejcik,SLACRasmus Ischebeck > CERN Accelerator School on FELs and ERLs, 2016-06-08 > Diagnostics for FELs and ERLs
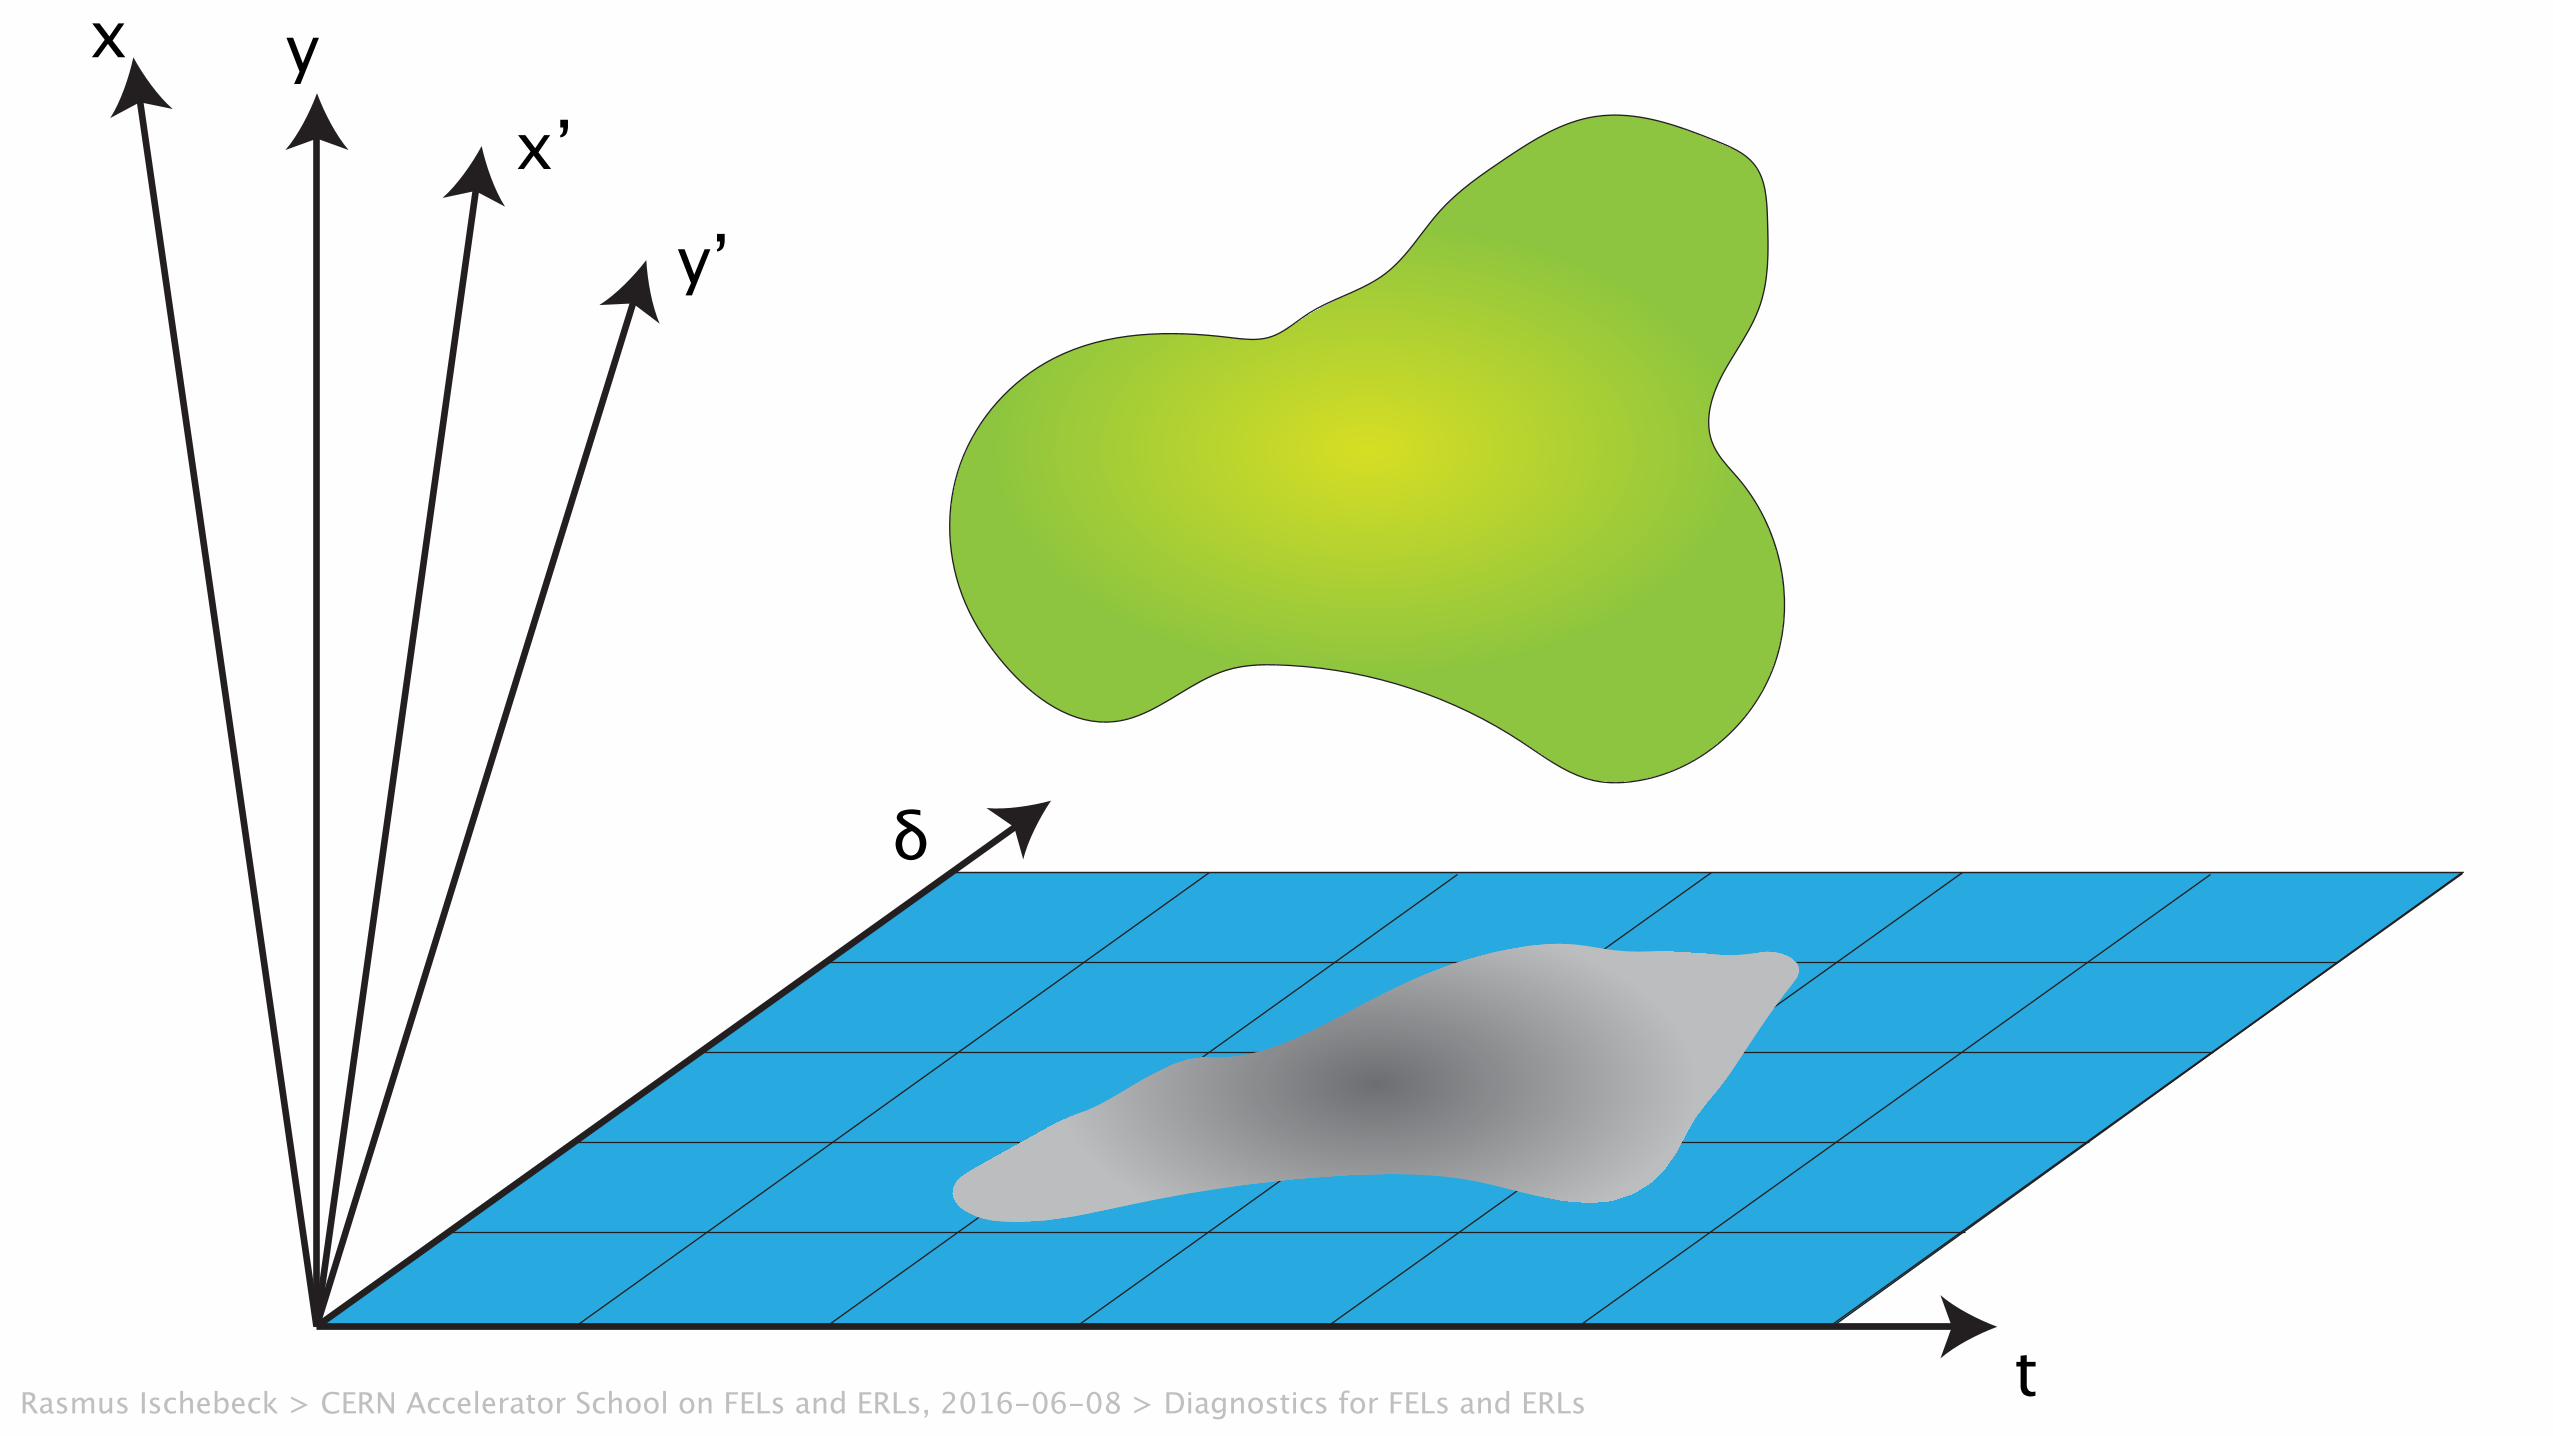
x y
yʼxʼ
t
δ
Rasmus Ischebeck > CERN Accelerator School on FELs and ERLs, 2016-06-08 > Diagnostics for FELs and ERLs
Rasmus Ischebeck
.
27
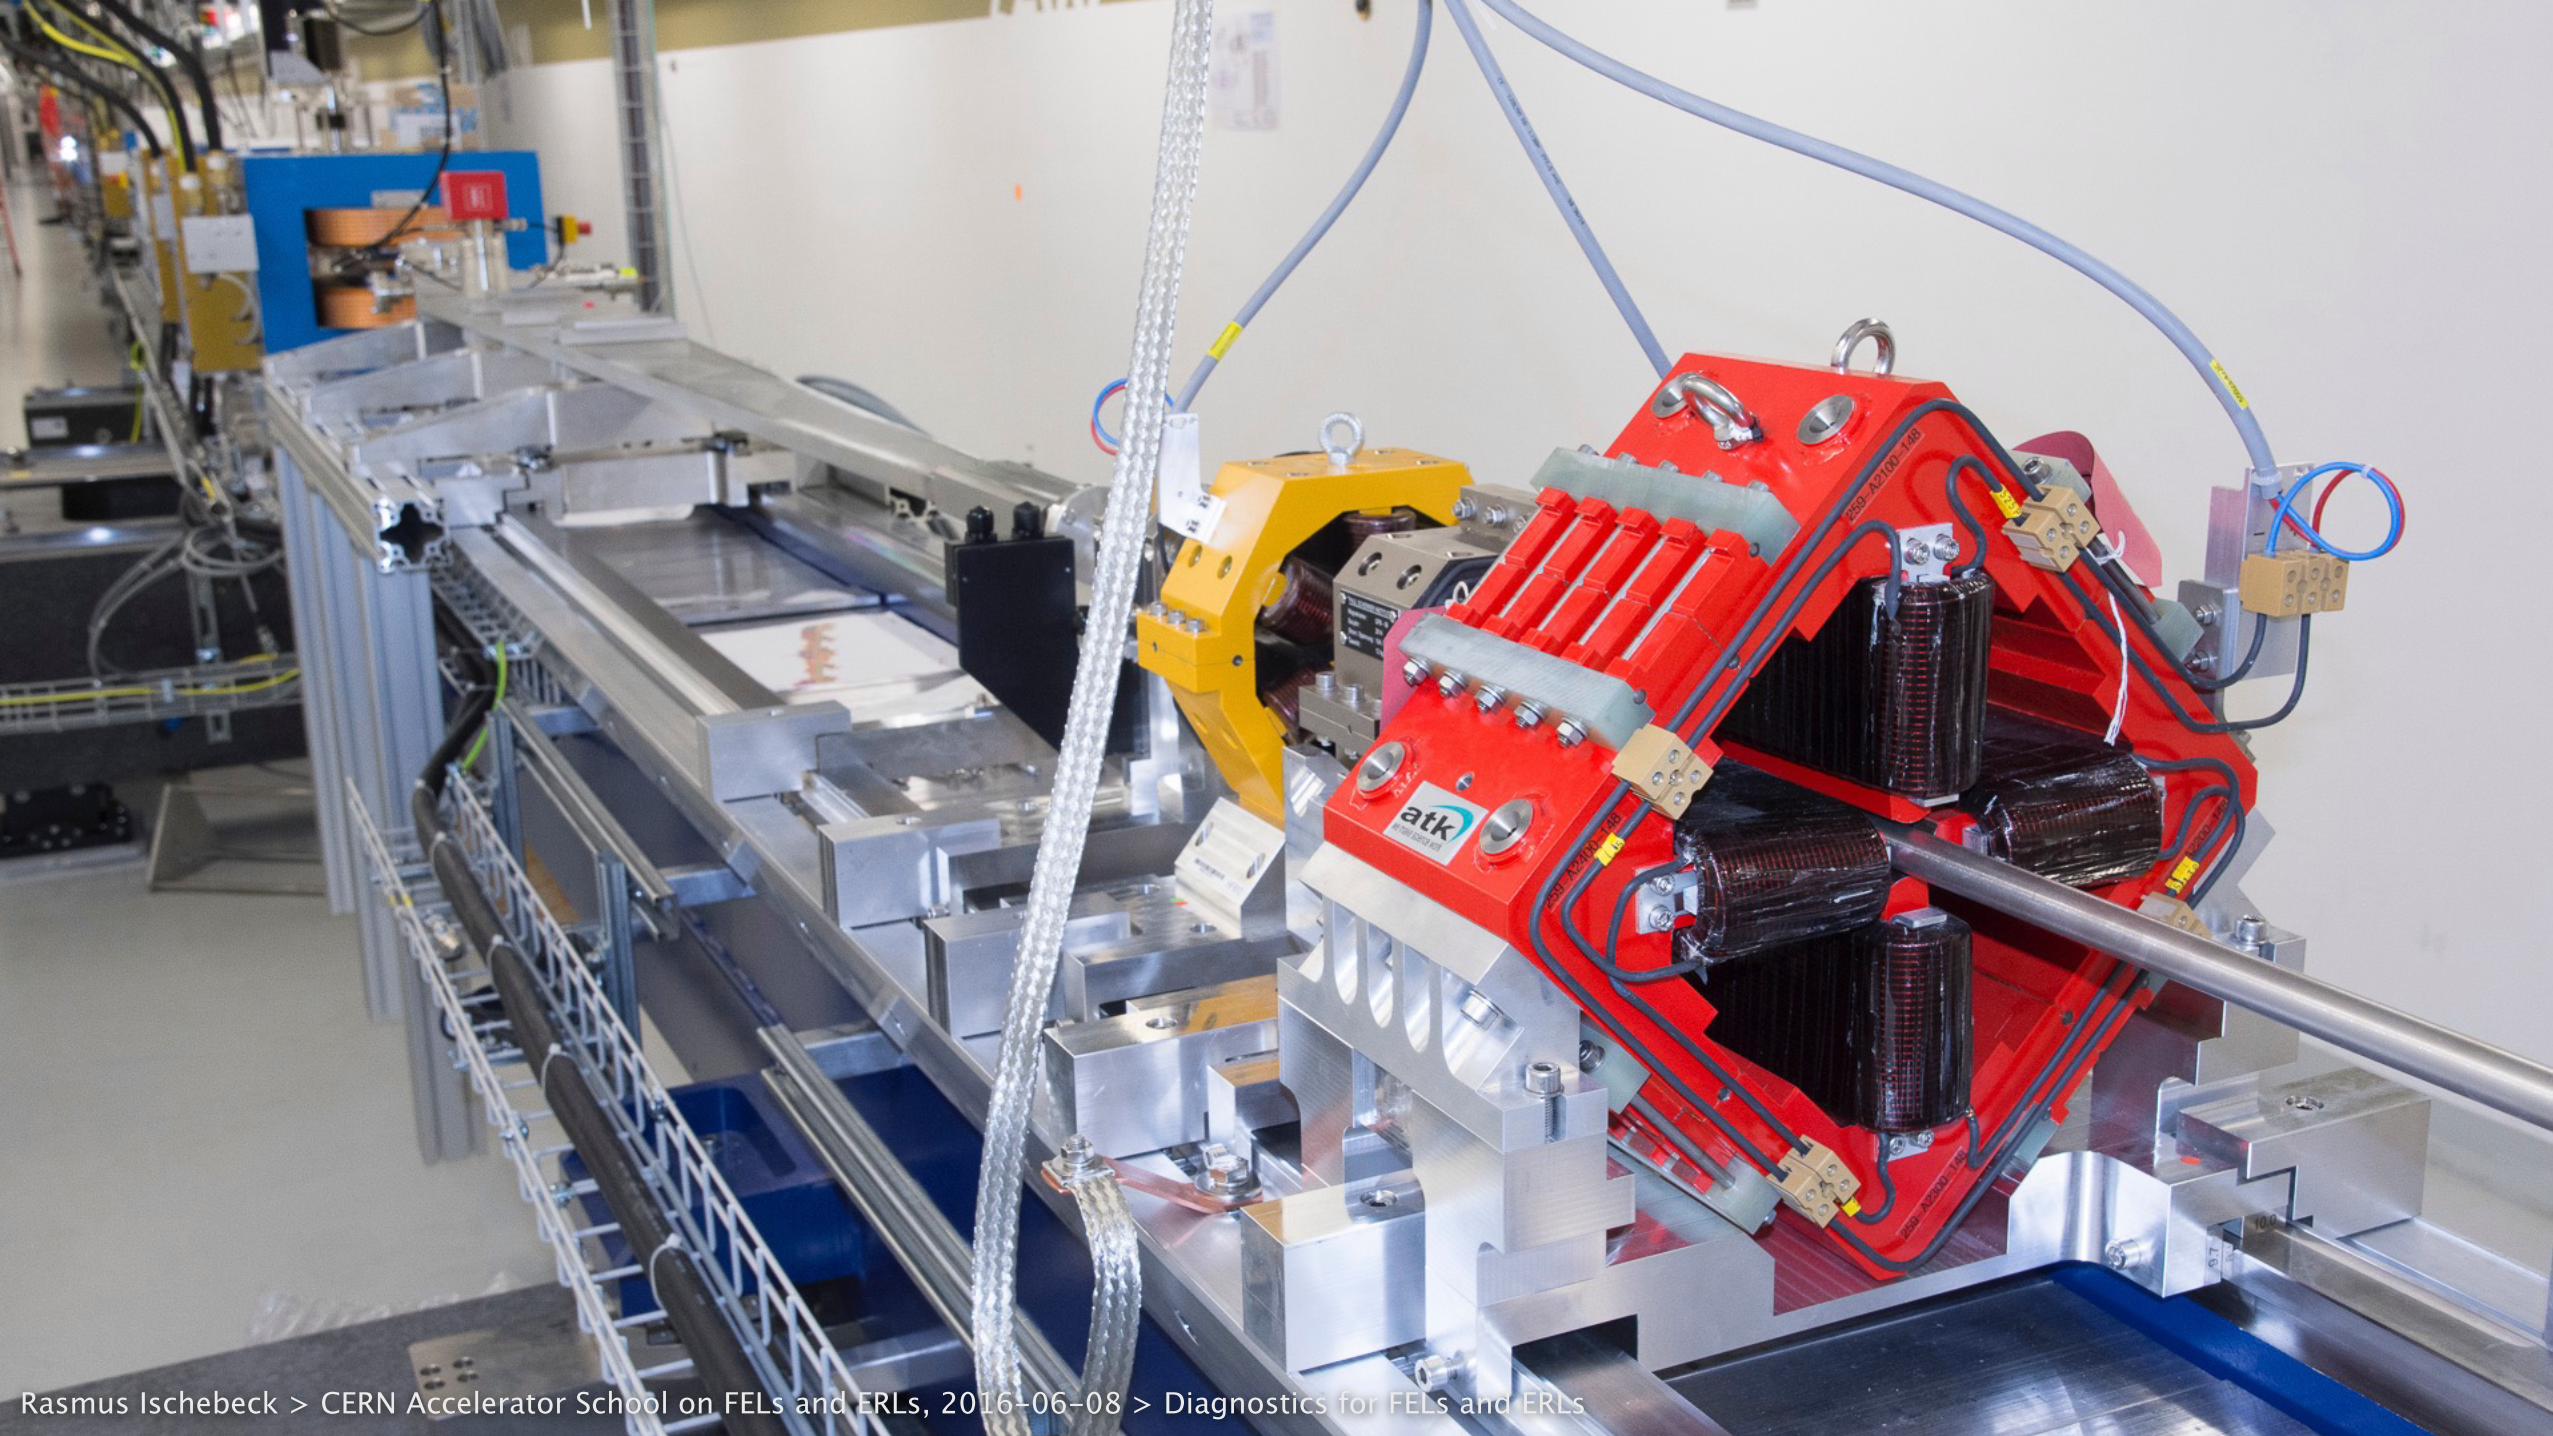
Structure installed on bench before waveguide connected.
Patrick Krejcik, IBIC 2013
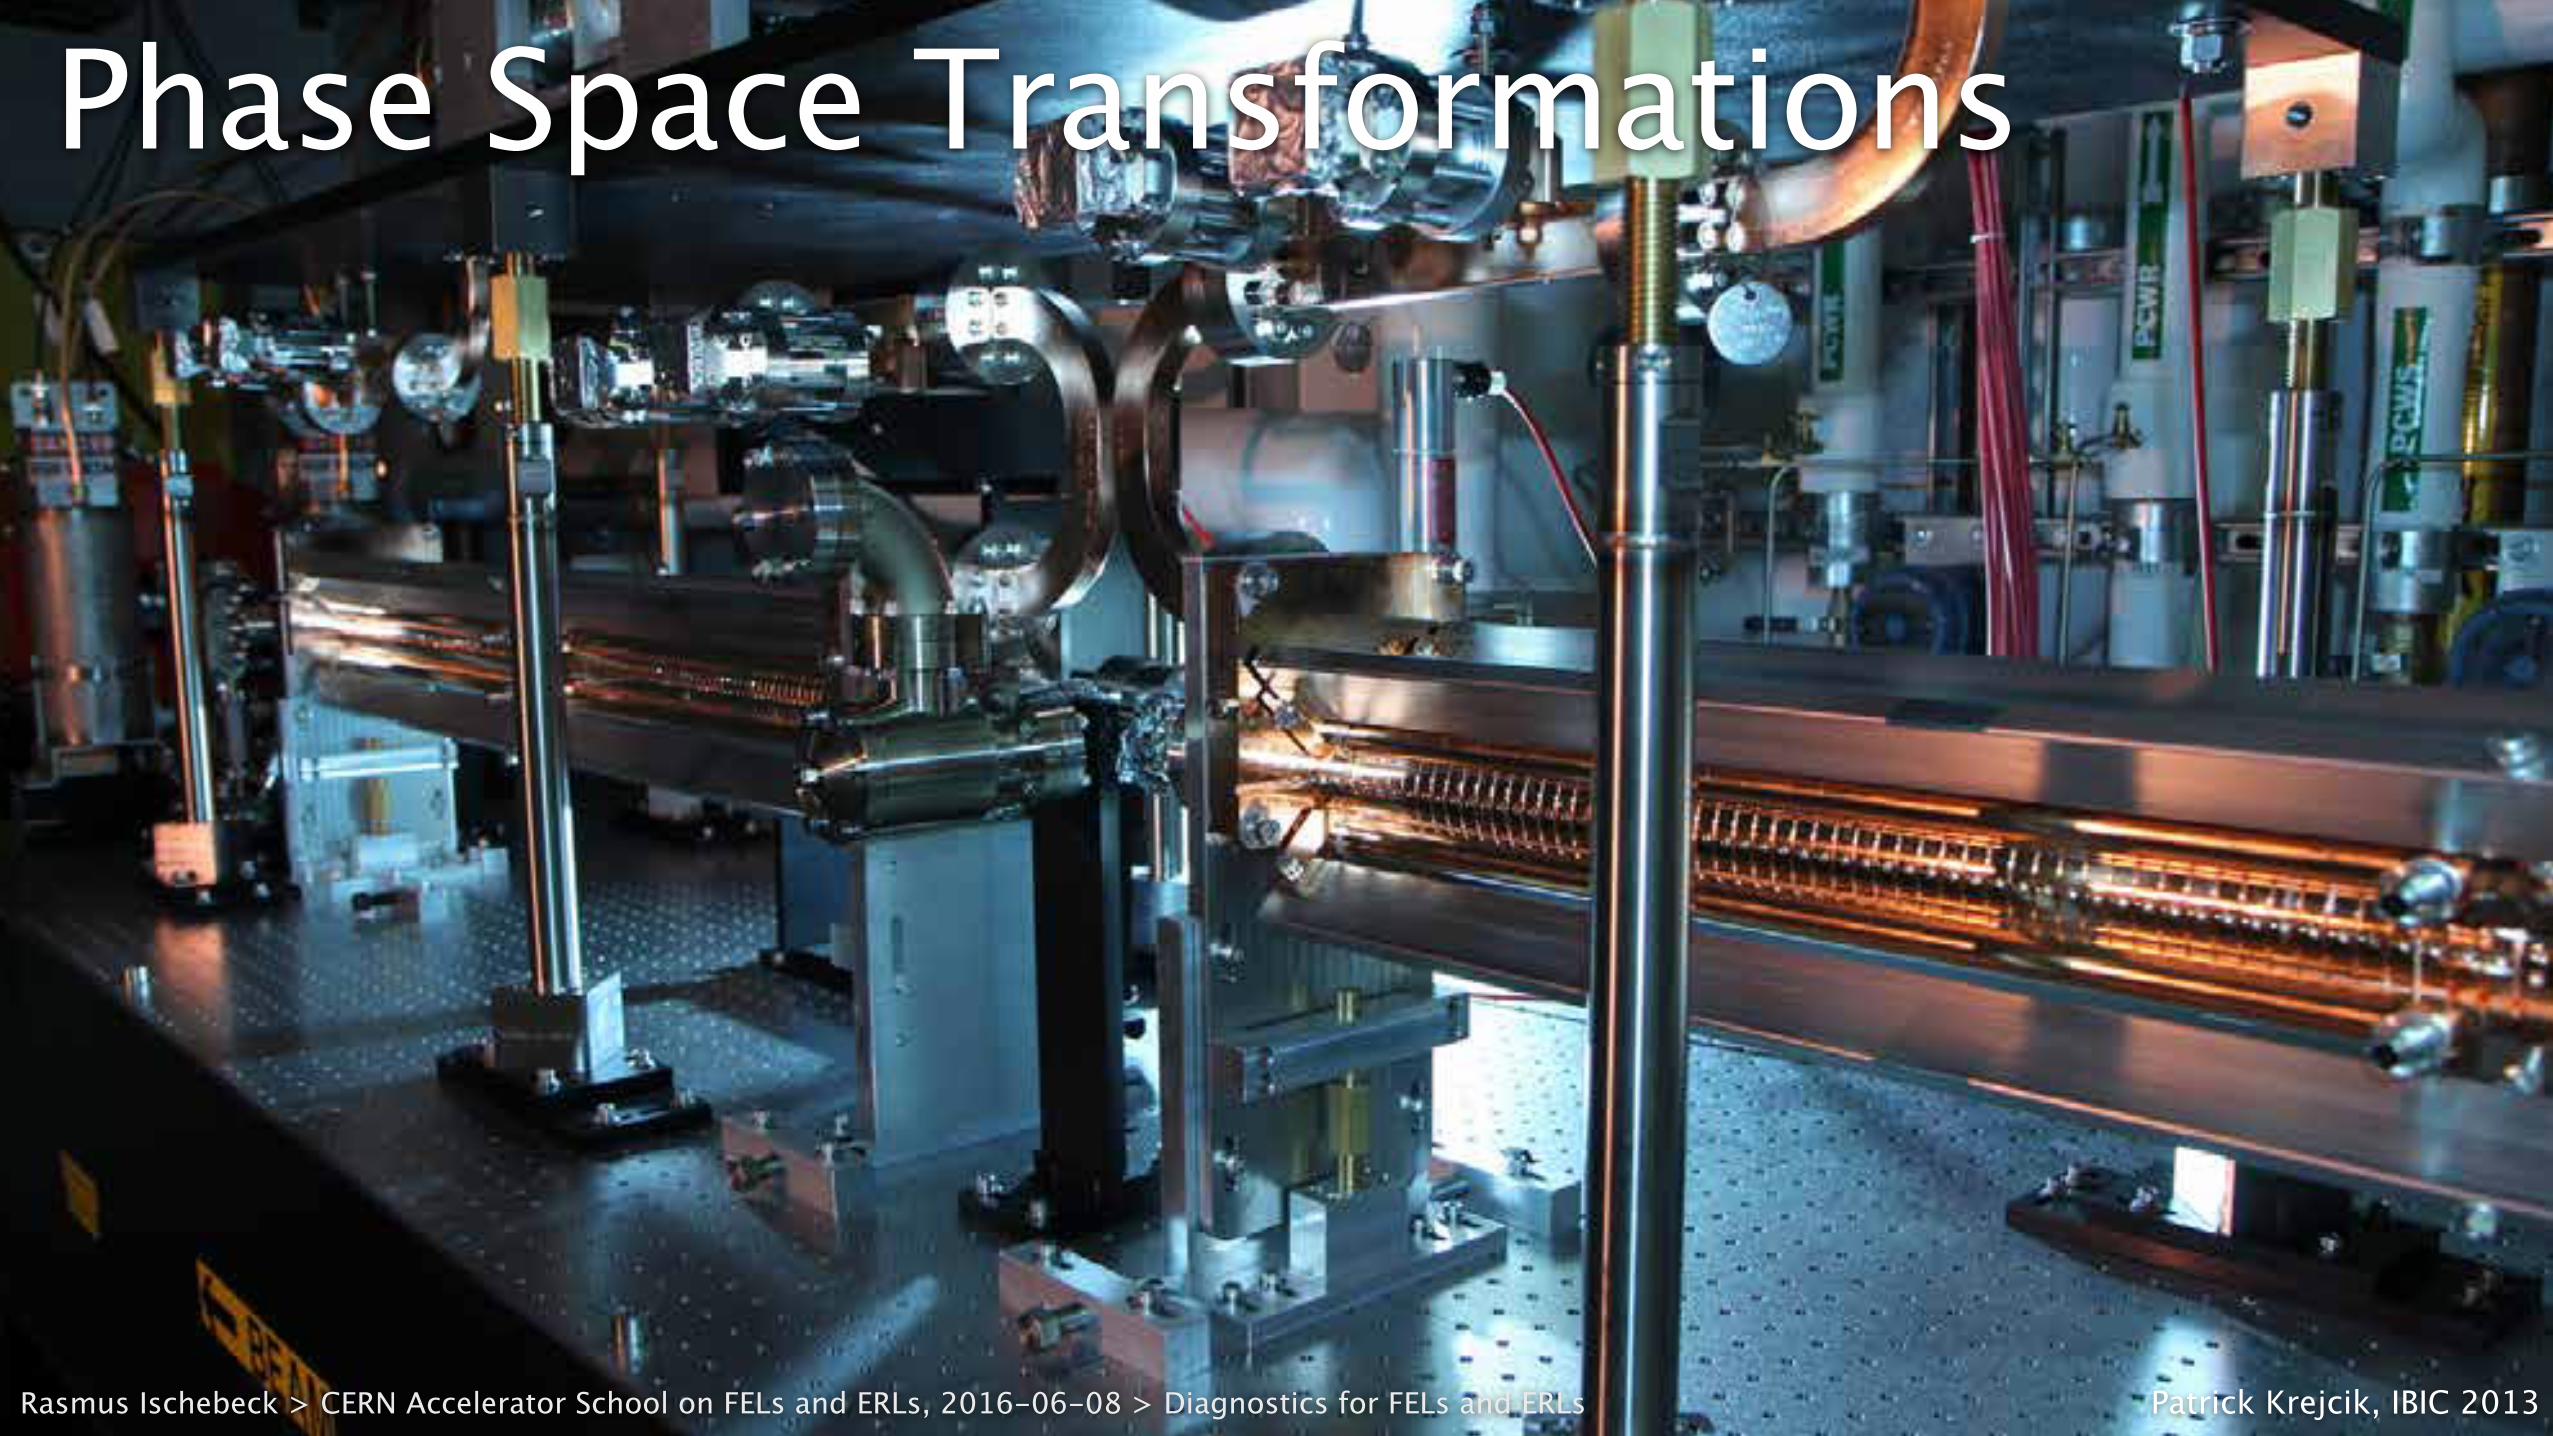
Phase Space Transformations
Rasmus Ischebeck > CERN Accelerator School on FELs and ERLs, 2016-06-08 > Diagnostics for FELs and ERLs

Rasmus IschebeckRasmus Ischebeck > CERN Accelerator School on FELs and ERLs, 2016-06-08 > Diagnostics for FELs and ERLs
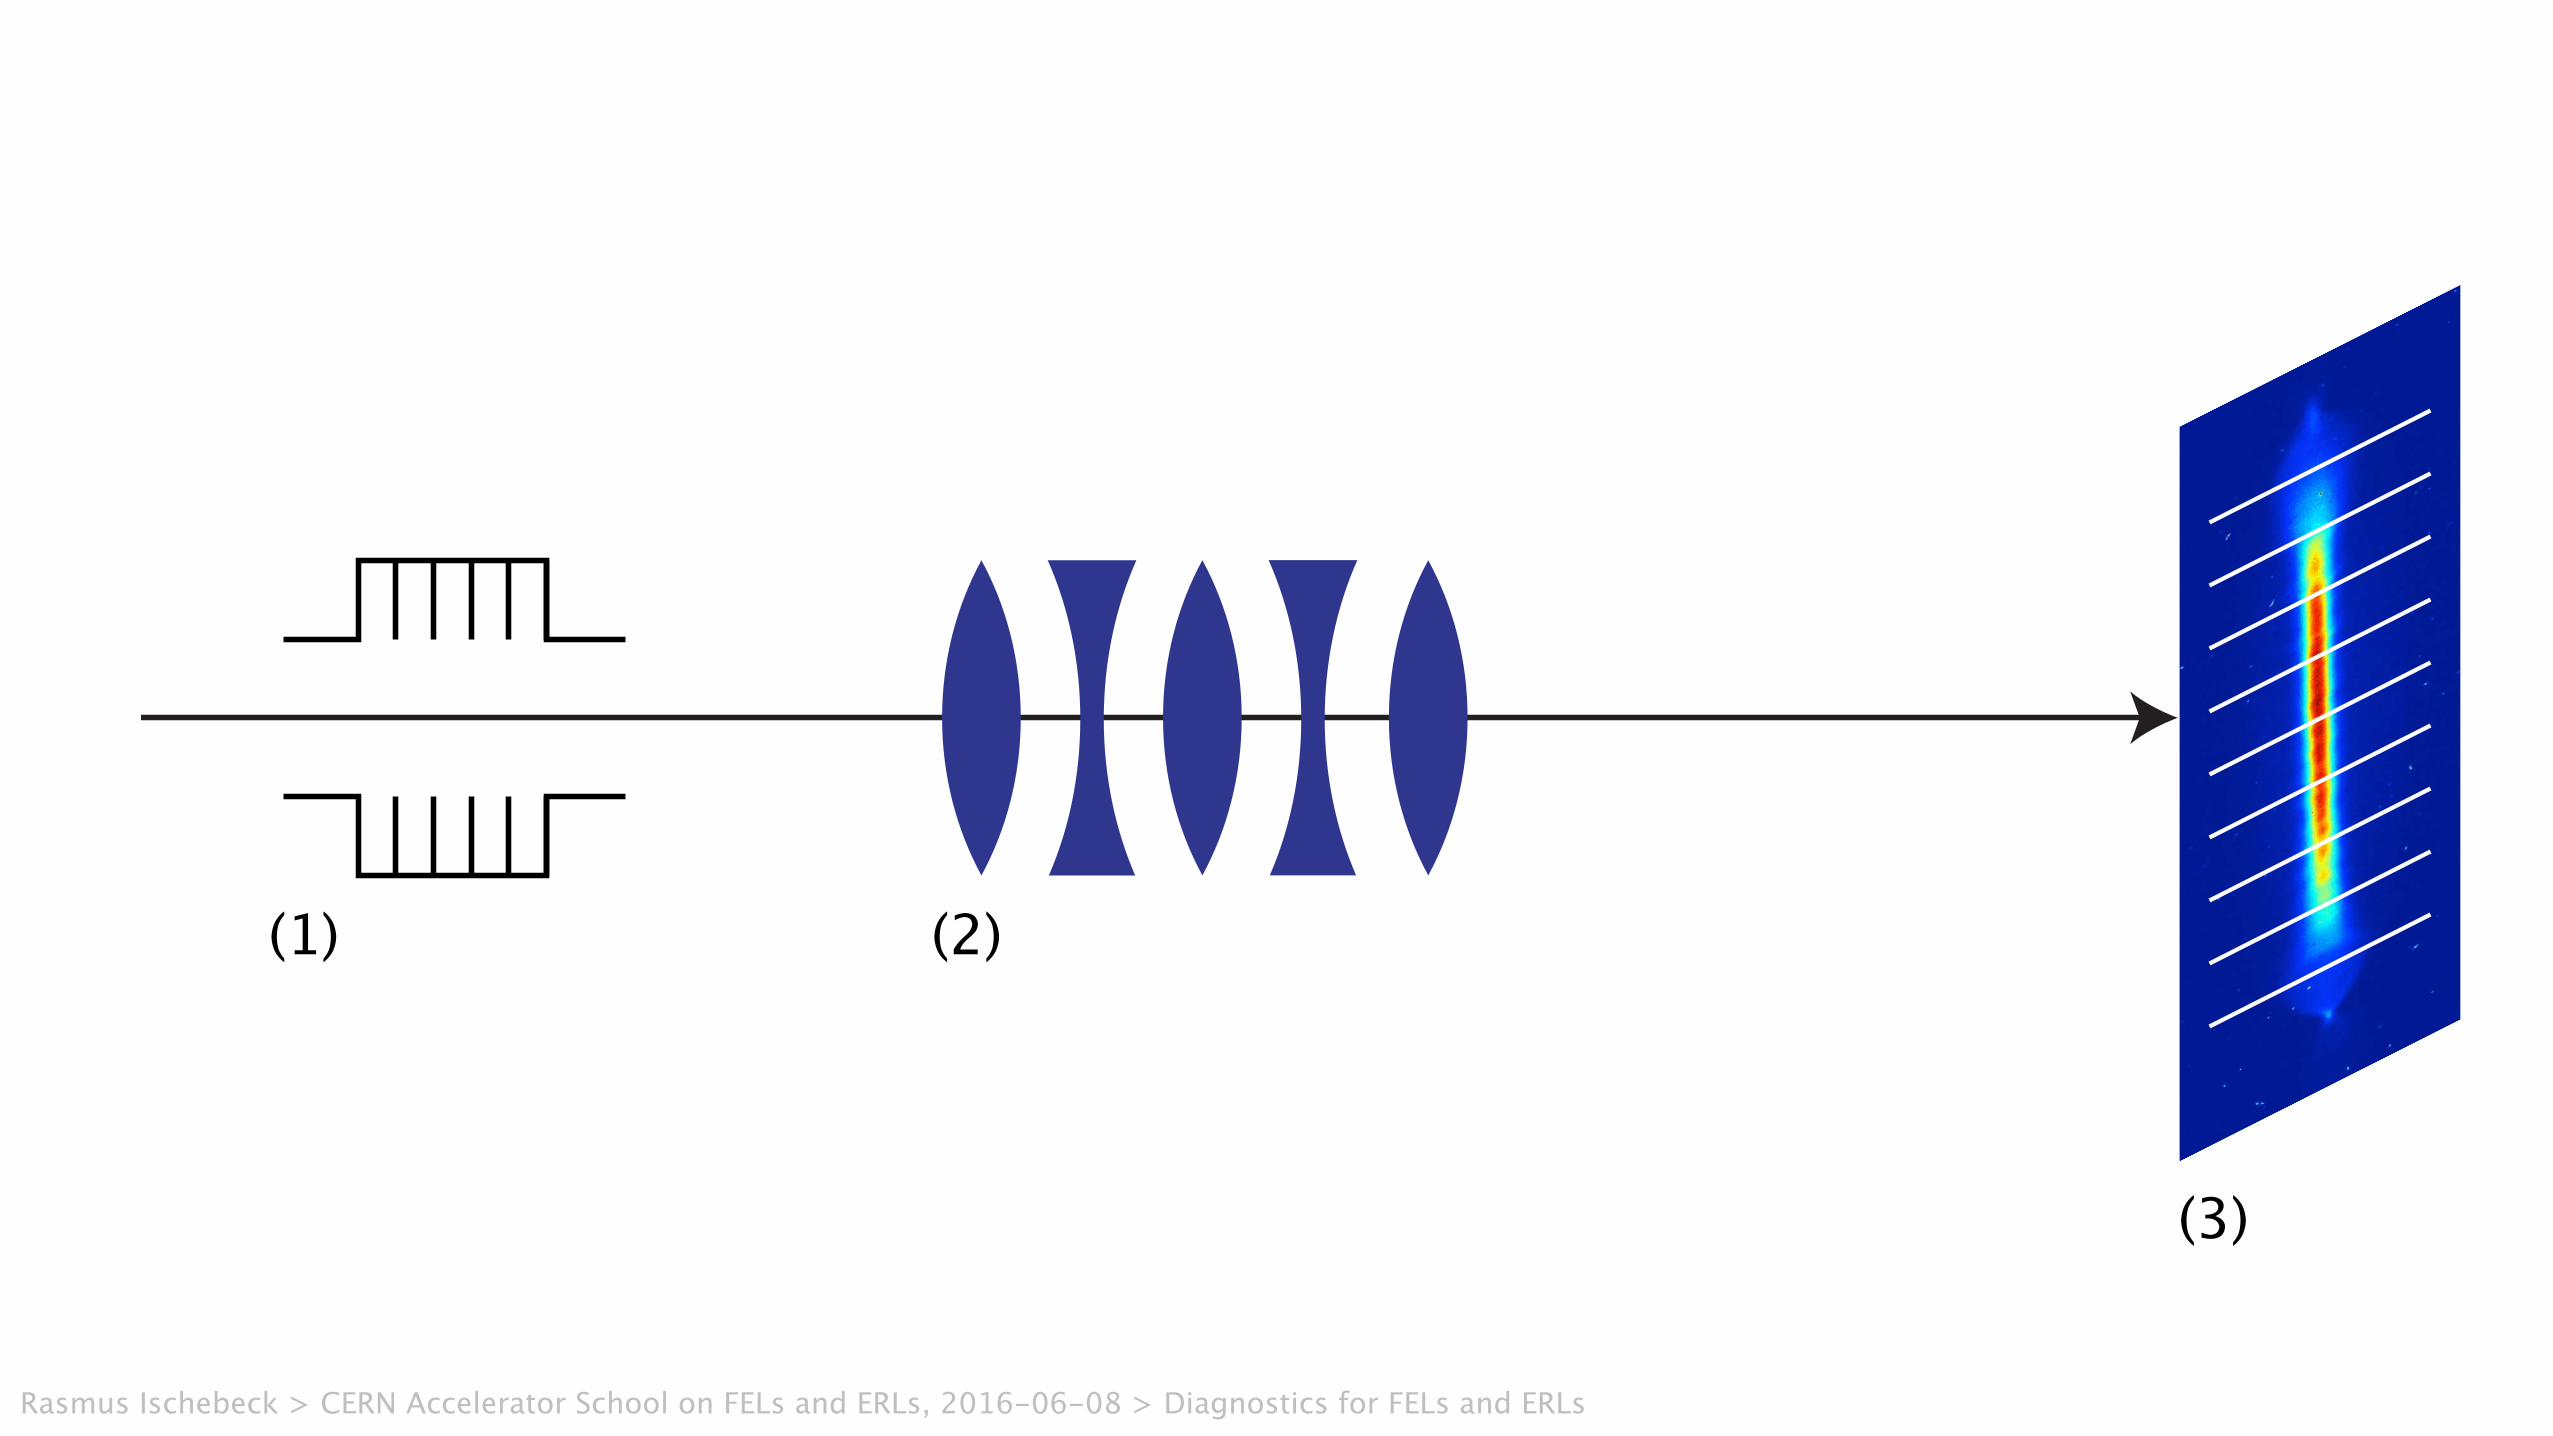
(1) mapping of the time axis onto the vertical angle by the transverse deflecting strucutre, (2) variation of the horizontal phase advance between the deflector and the profile monitor by adjusting the quadrupole lenses, while keeping the vertical phase advance approximately constant such that a vertical angle is transformed into a vertical position, and (3) measurement of the horizontal beam size in several slices of the beam
(1) (2)
(3)
Rasmus Ischebeck > CERN Accelerator School on FELs and ERLs, 2016-06-08 > Diagnostics for FELs and ERLs
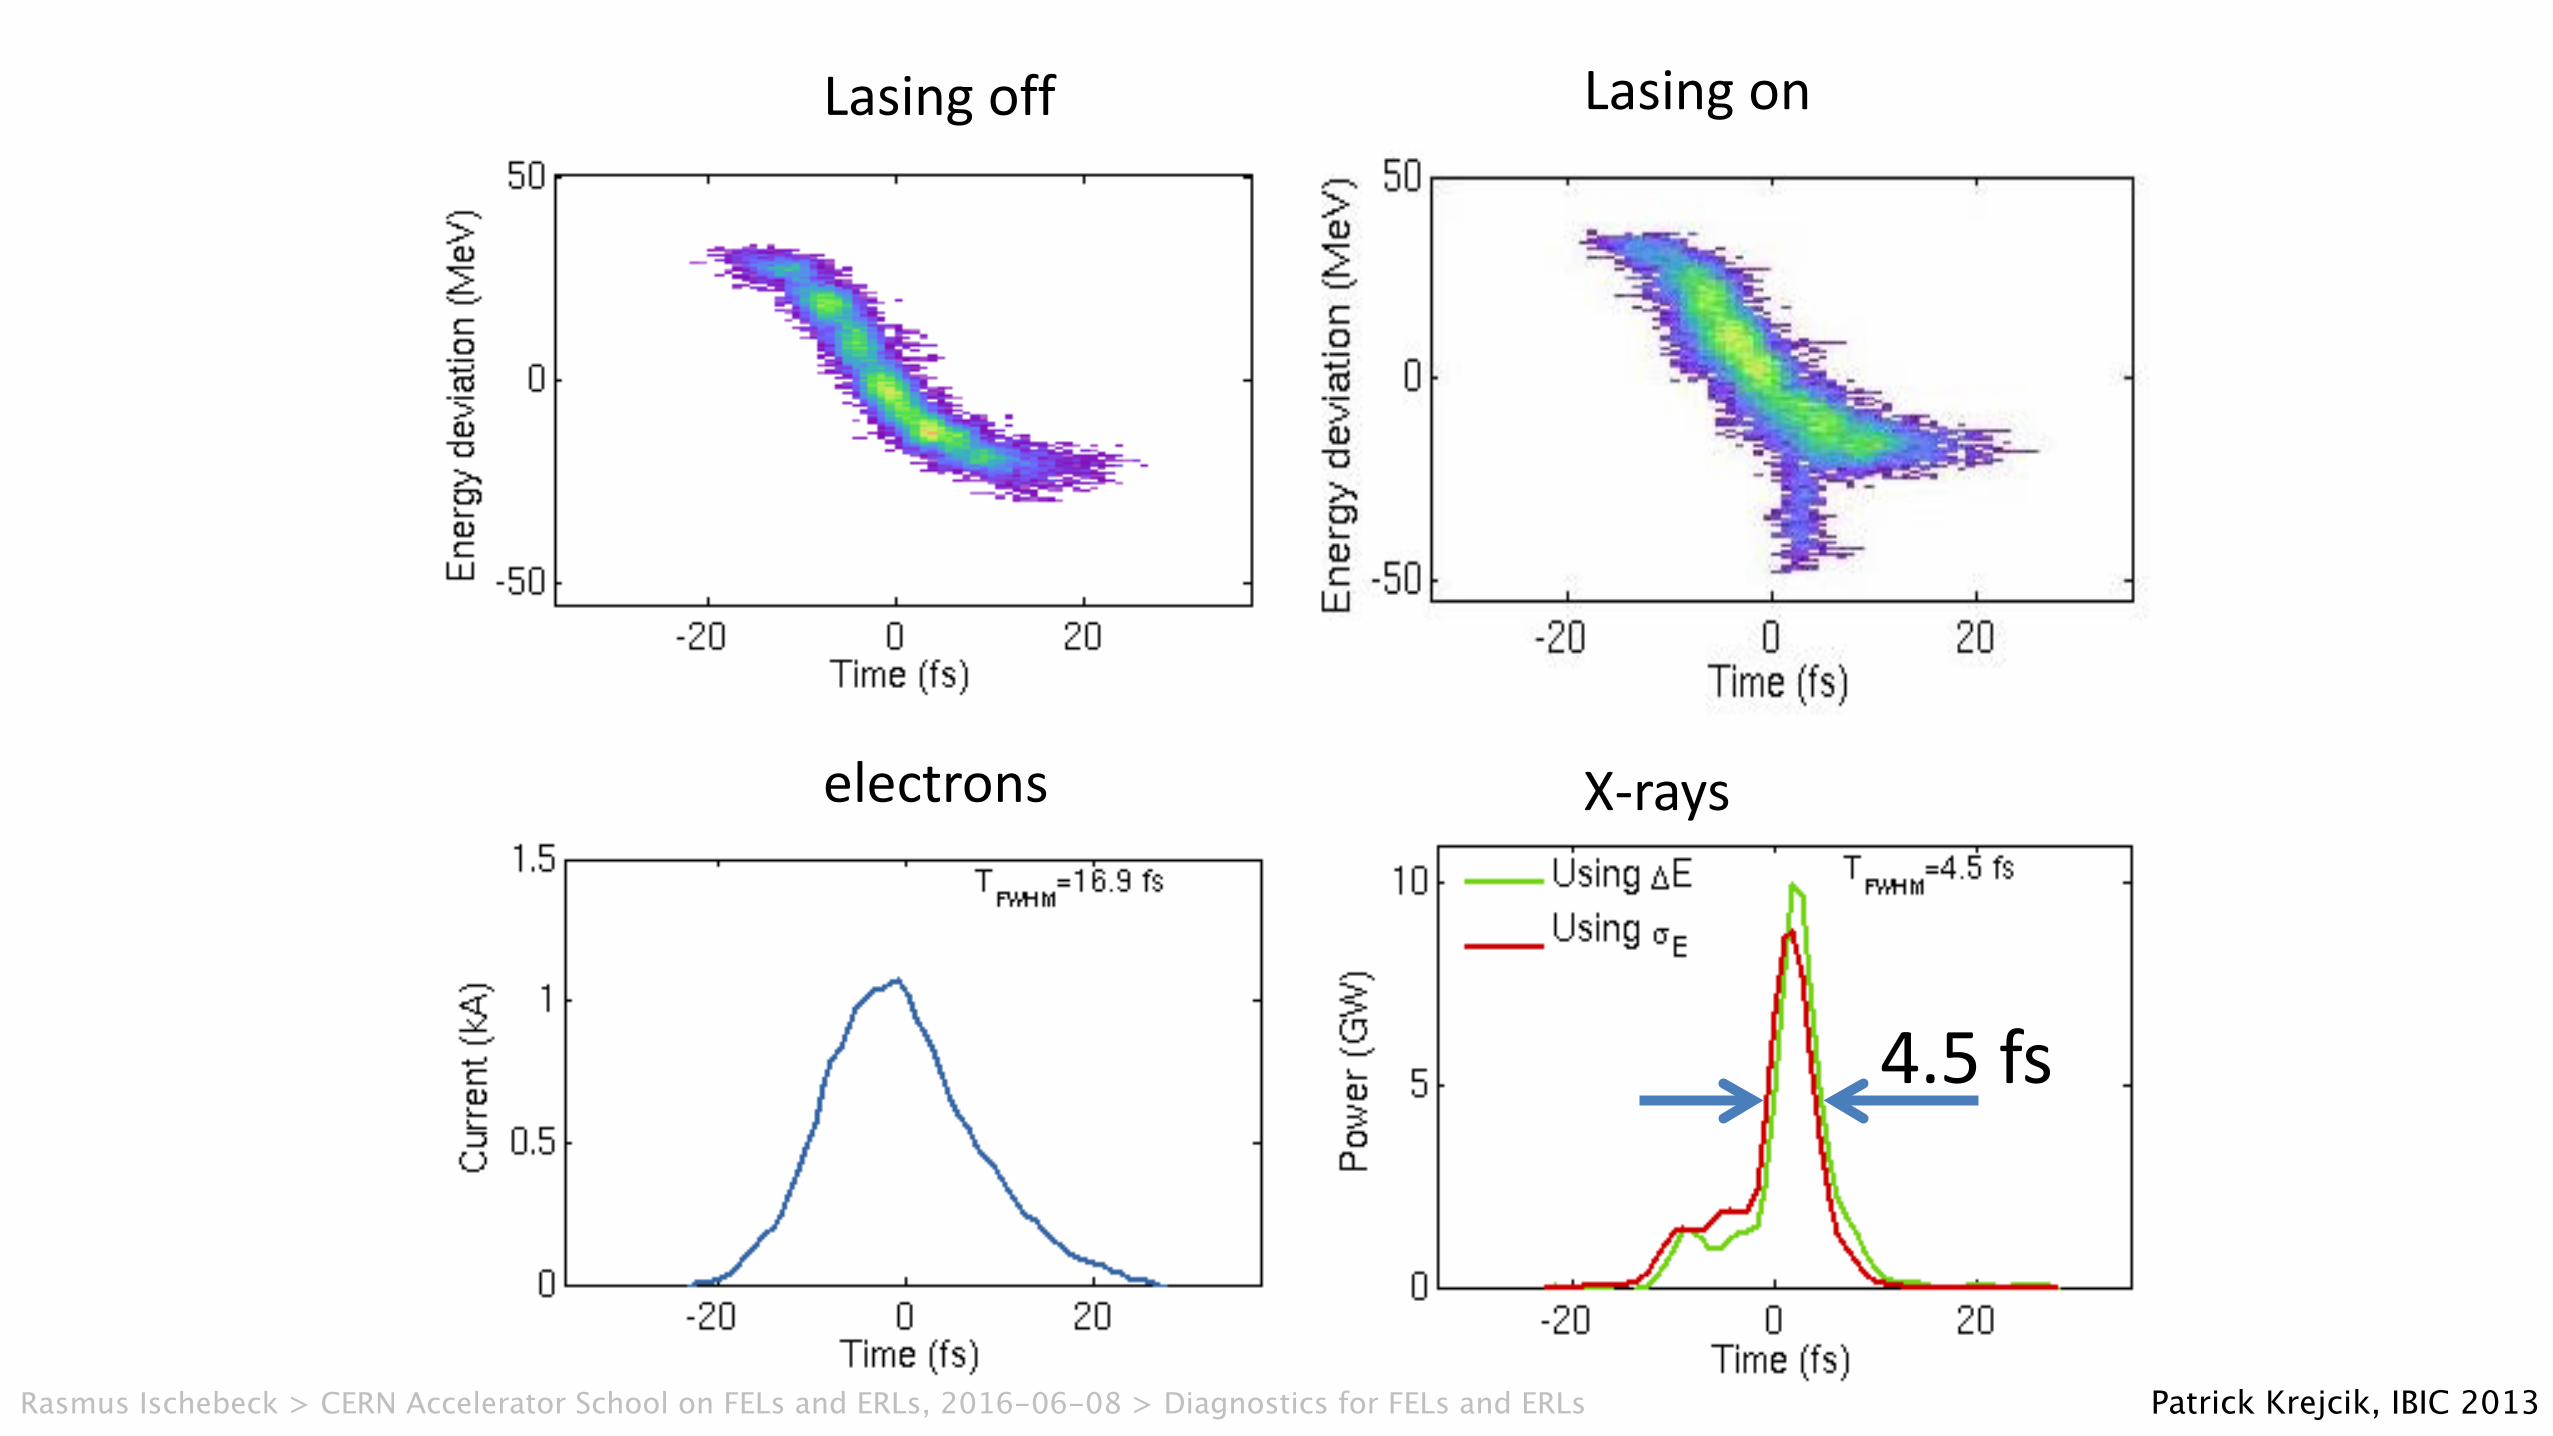
20pC, 1keV short bunch setup Lasing off Lasing on
X-rays
4.5 fs
electrons
Patrick Krejcik, IBIC 2013Rasmus Ischebeck > CERN Accelerator School on FELs and ERLs, 2016-06-08 > Diagnostics for FELs and ERLs
Rasmus IschebeckRasmus Ischebeck > CERN Accelerator School on FELs and ERLs, 2016-06-08 > Diagnostics for FELs and ERLs
• IntegralMeasurements
• TransverseDiagnostics
• Time-ResolvedDiagnostics
Diagnostics at FELs
15WikimediaCommons,PatrickKrejcik,SLACRasmus Ischebeck > CERN Accelerator School on FELs and ERLs, 2016-06-08 > Diagnostics for FELs and ERLs
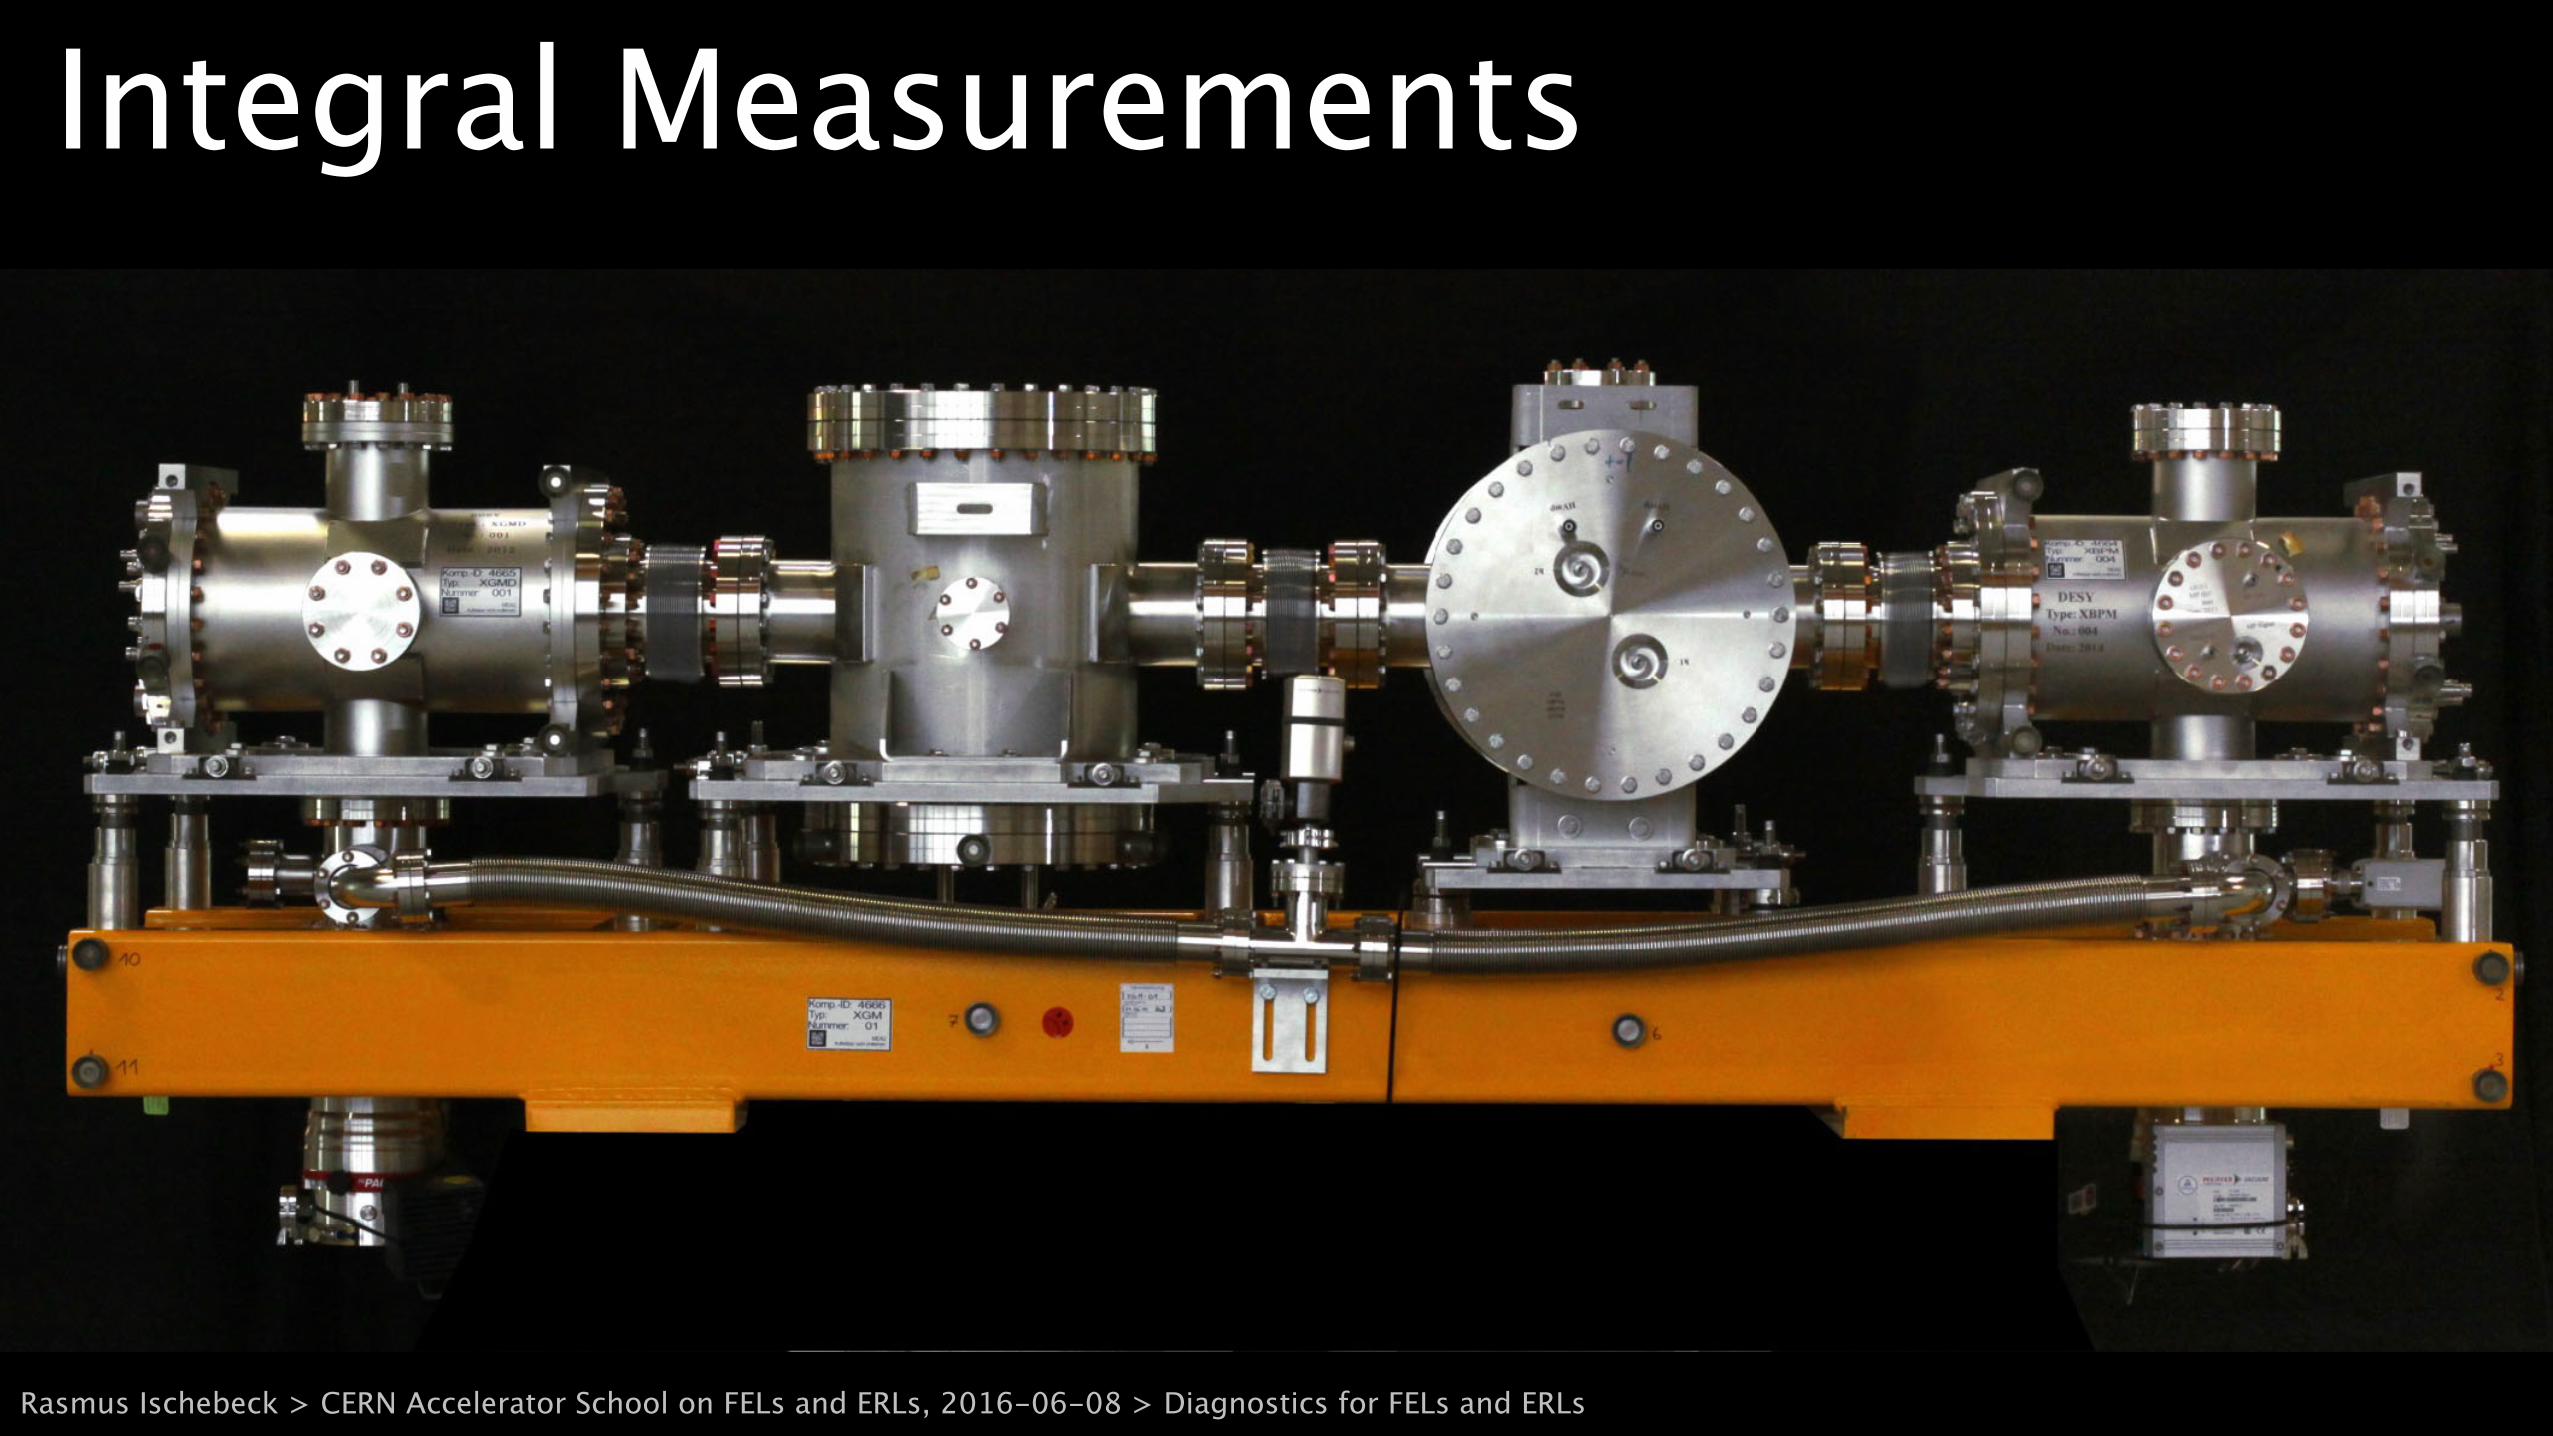
Integral Measurements
Rasmus Ischebeck > CERN Accelerator School on FELs and ERLs, 2016-06-08 > Diagnostics for FELs and ERLs
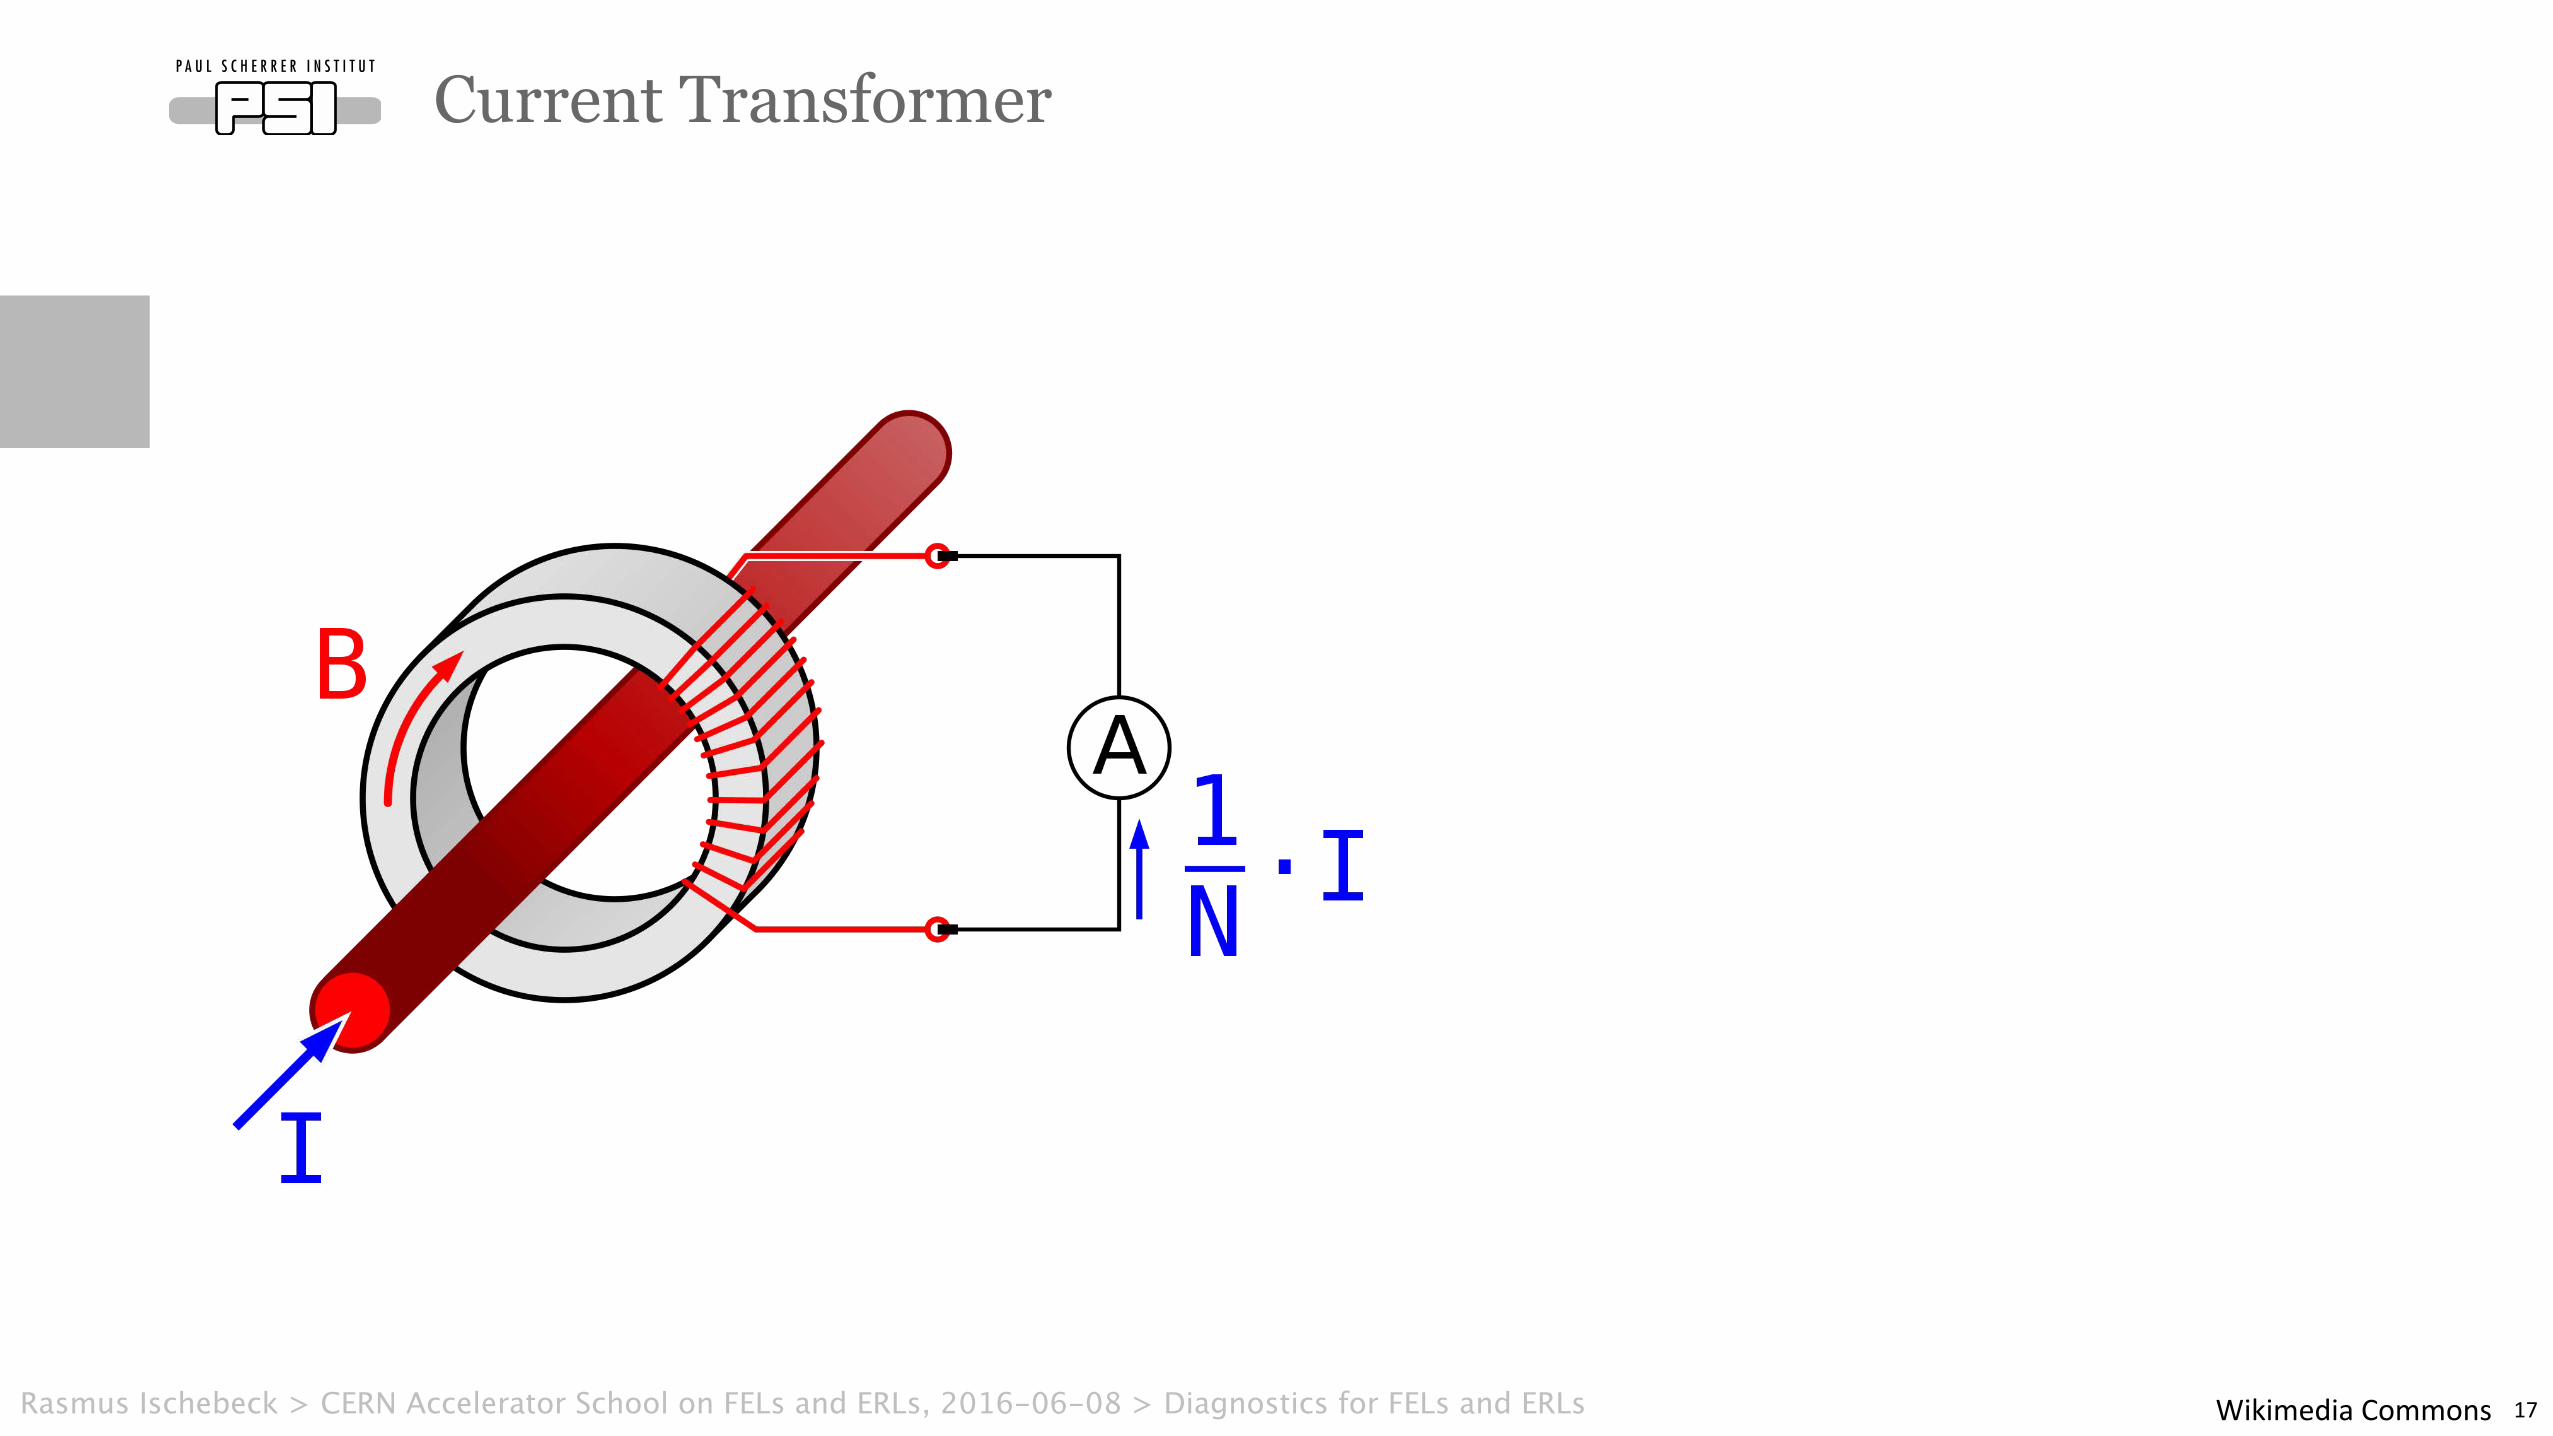
Current Transformer
17WikimediaCommonsRasmus Ischebeck > CERN Accelerator School on FELs and ERLs, 2016-06-08 > Diagnostics for FELs and ERLs
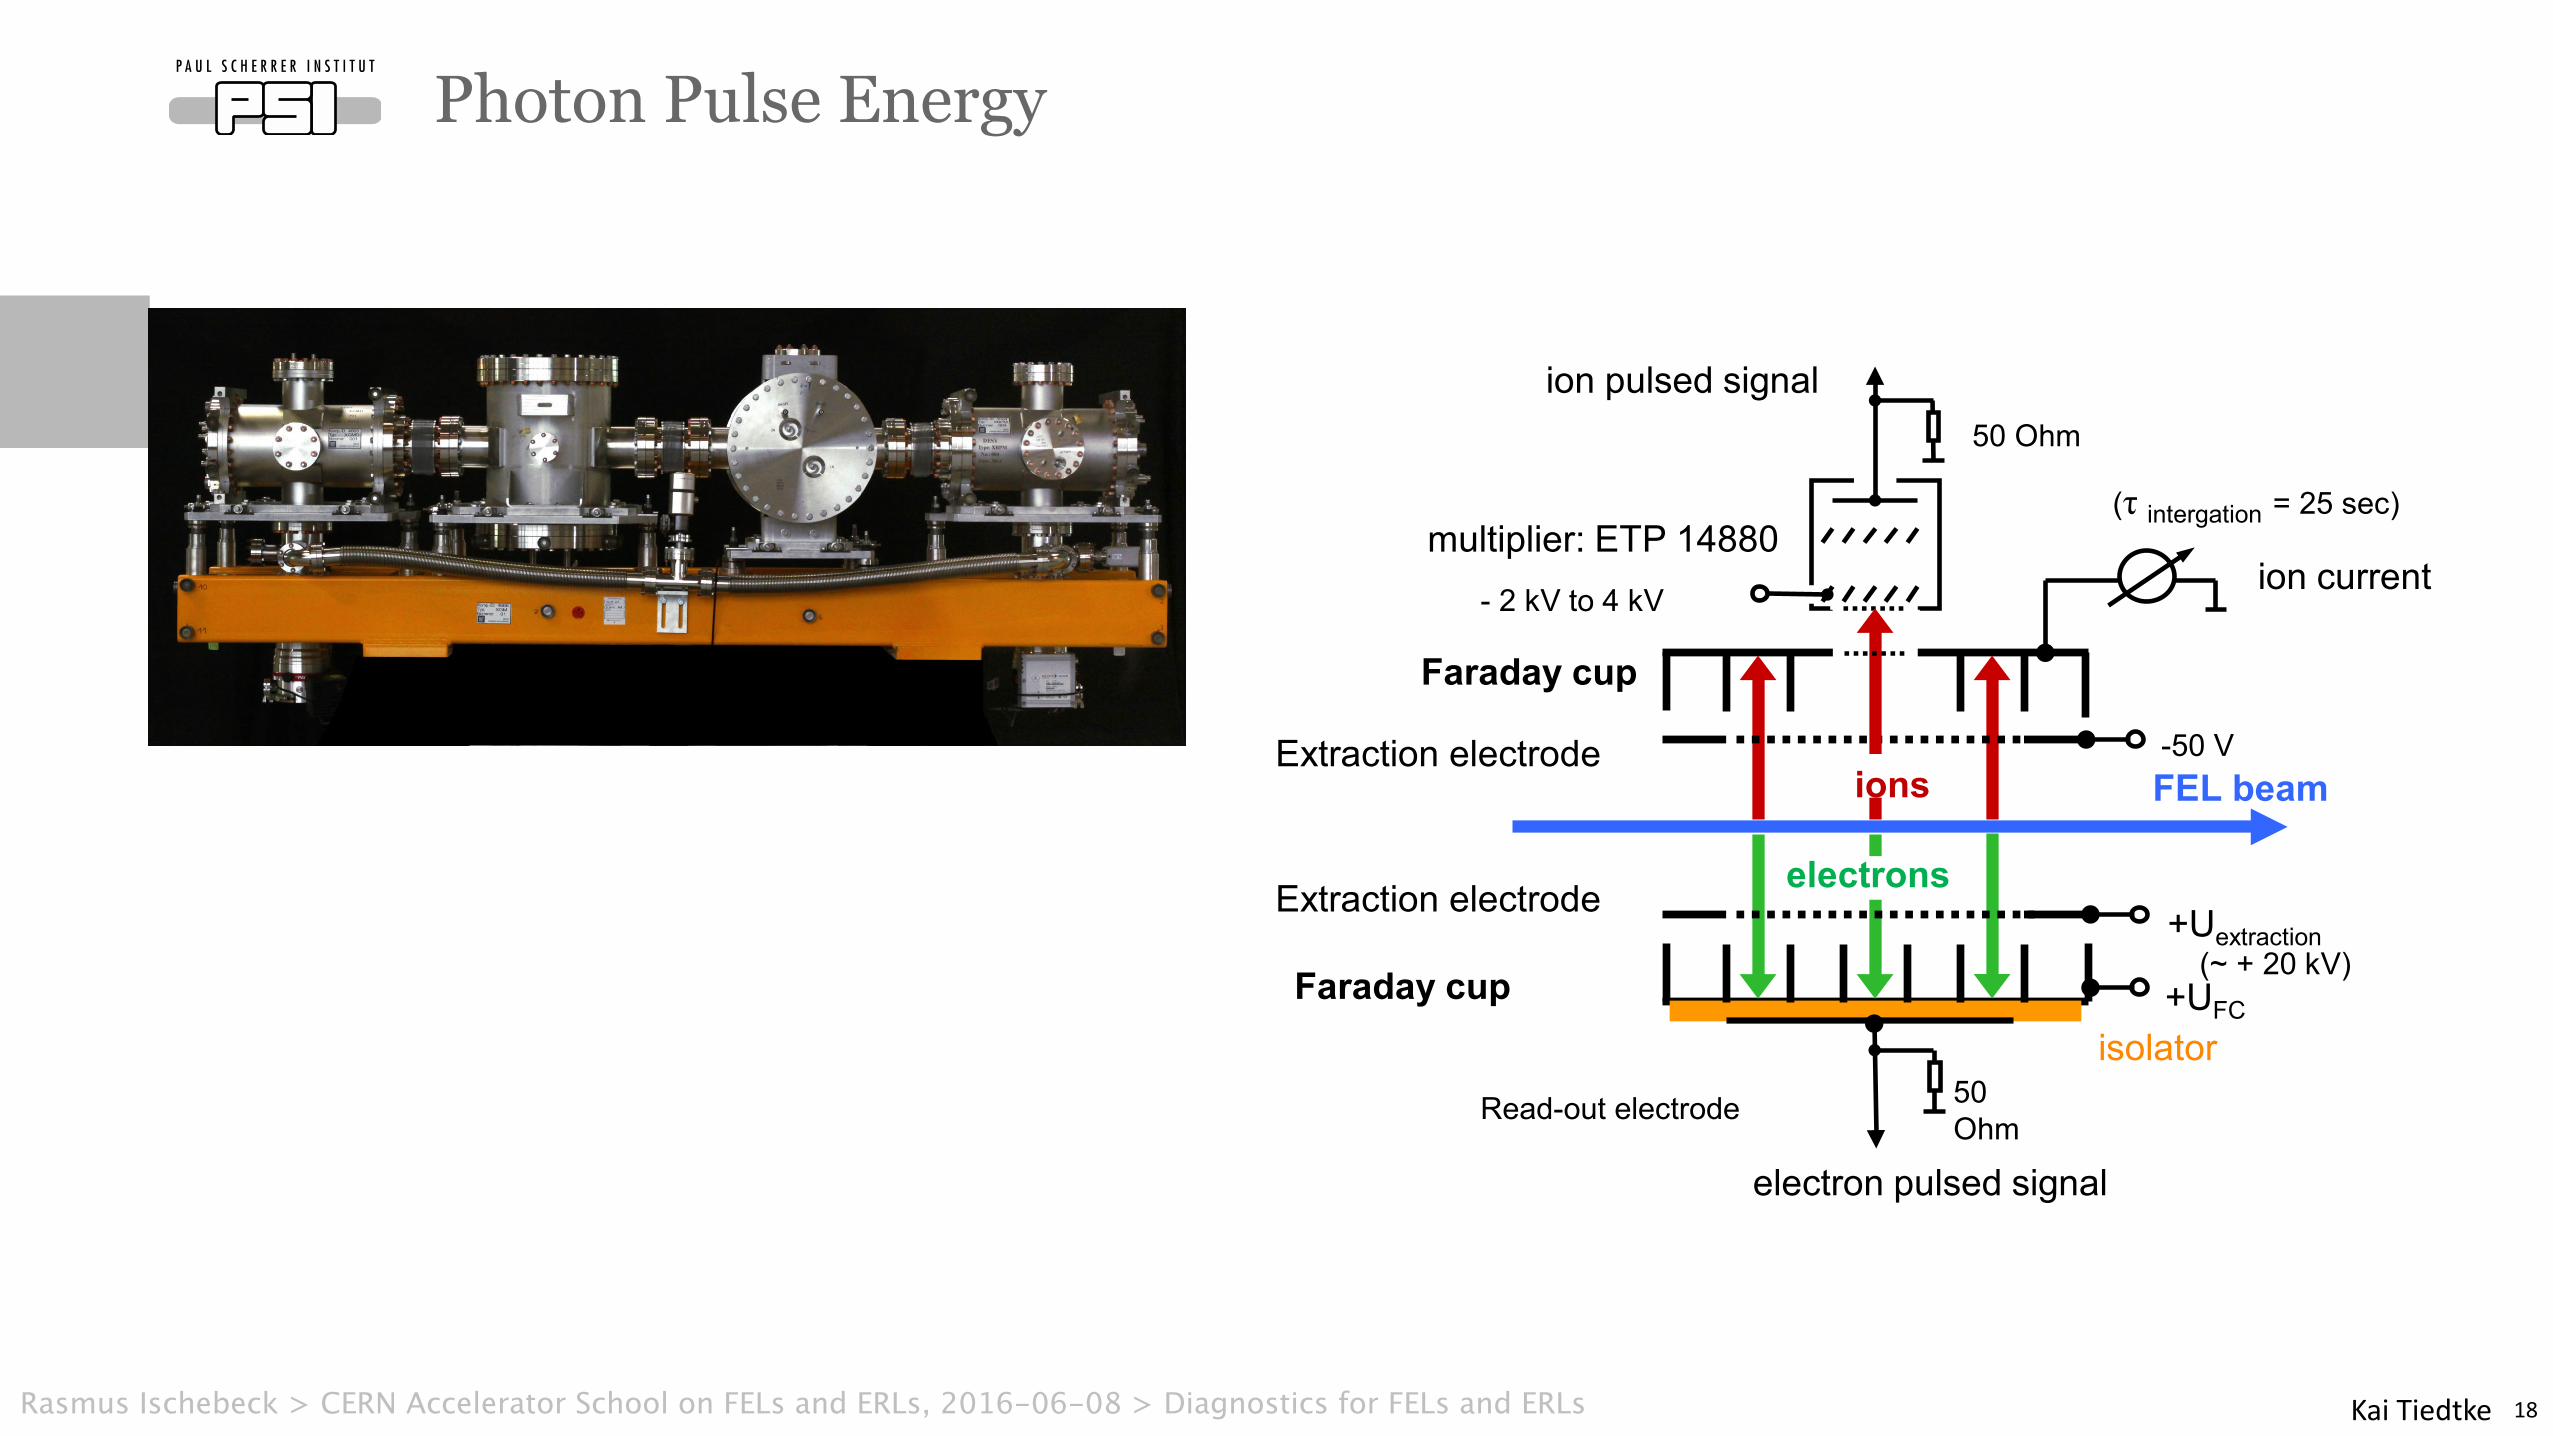
Photon Pulse Energy
18
Faraday cup
multiplier: ETP 14880
FEL beam
electron pulsed signal
ion current
ion pulsed signal
-50 V
+Uextraction
isolator
50 Ohm
- 2 kV to 4 kV
Extraction electrode
Read-out electrode
(τ intergation = 25 sec)
ions
electrons
50
Ohm
Faraday cup
Extraction electrode
+UFC
(~ + 20 kV)
KaiTiedtkeRasmus Ischebeck > CERN Accelerator School on FELs and ERLs, 2016-06-08 > Diagnostics for FELs and ERLs
INSTRUMENTATION FOR MACHINE PROTECTION ATFERMI@ELETTRA
L. Frohlich , A. I. Bogani, K. Casarin, G. Cautero, G. Gaio, D. Giuressi, A. Gubertini,∗
R. H. Menk, E. Quai, G. Scalamera, A. Vascotto, Sincrotrone Trieste, Basovizza, ItalyL. Catani, INFN, Rome, Italy
D. Di Giovenal
Abstract
FERMI@Elettra is a linac-driven free-electron laser cur-rently under commissioning at Sincrotrone Trieste, Italy.In order to protect the facility’s permanent undulator mag-nets from radiation-induced demagnetization, beam lossesand radiation doses are monitored closely by an active ma-chine protection system. The paper focuses on the designand performance of its main diagnostic subsystems: Beamloss position monitors based on the detection of Cherenkovlight in quartz fibers with multi-pixel photon counters, con-ventional ionization chambers with a new frontend elec-tronics package, and solid-state RADFET dosimeters pro-viding an online measurement of the absorbed dose in theundulator magnets.
INTRODUCTION
FERMI@Elettra is a fourth generation light source cur-rently under commissioning at Sincrotrone Trieste. As il-lustrated in Fig. 1, the main components of the acceleratorare a photocathode RF gun, 16 accelerating S-band sec-tions, an X-band structure for phase space linearization,two magnetic chicanes for bunch compression, and twoseparate undulator sections with 7 and 10 undulators, re-spectively. The linac design foresees the extraction of elec-tron bunches with a maximum charge of 1 nC at a rate of50 Hz and the acceleration to a final energy of 1.2 GeV [1].
The maximum power carried by the beam amounts toabout 60 W. While this hardly poses a direct threat to beam-line components, considerable amounts of radiation can bereleased when a part of the electron beam strikes the vac-uum chamber. Elevated radiation doses are especially un-desirable in the undulator sections where they can lead toa partial demagnetization of the permanent magnets with adetrimental effect on the free-electron laser process.
To avoid beam-induced damage, Fermi is protected byan active machine protection system that inhibits the ex-traction of charge in the photoinjector when necessary [2].Several diagnostic systems have been developed specifi-cally with the focus on machine protection. In the follow-ing, we give a brief overview of these systems and makesome remarks on the operational experience gathered sofar.
Photo-injector BC1L1 L2 L3
X
L0 LH
BC2 L4
Undulators
FEL1
FEL2
Figure 1: Overview of the FERMI@Elettra accelerator.Accelerating S-band structures are shown in yellow, maindipole magnets in blue, collimators in dark brown, undula-tors in red/green.
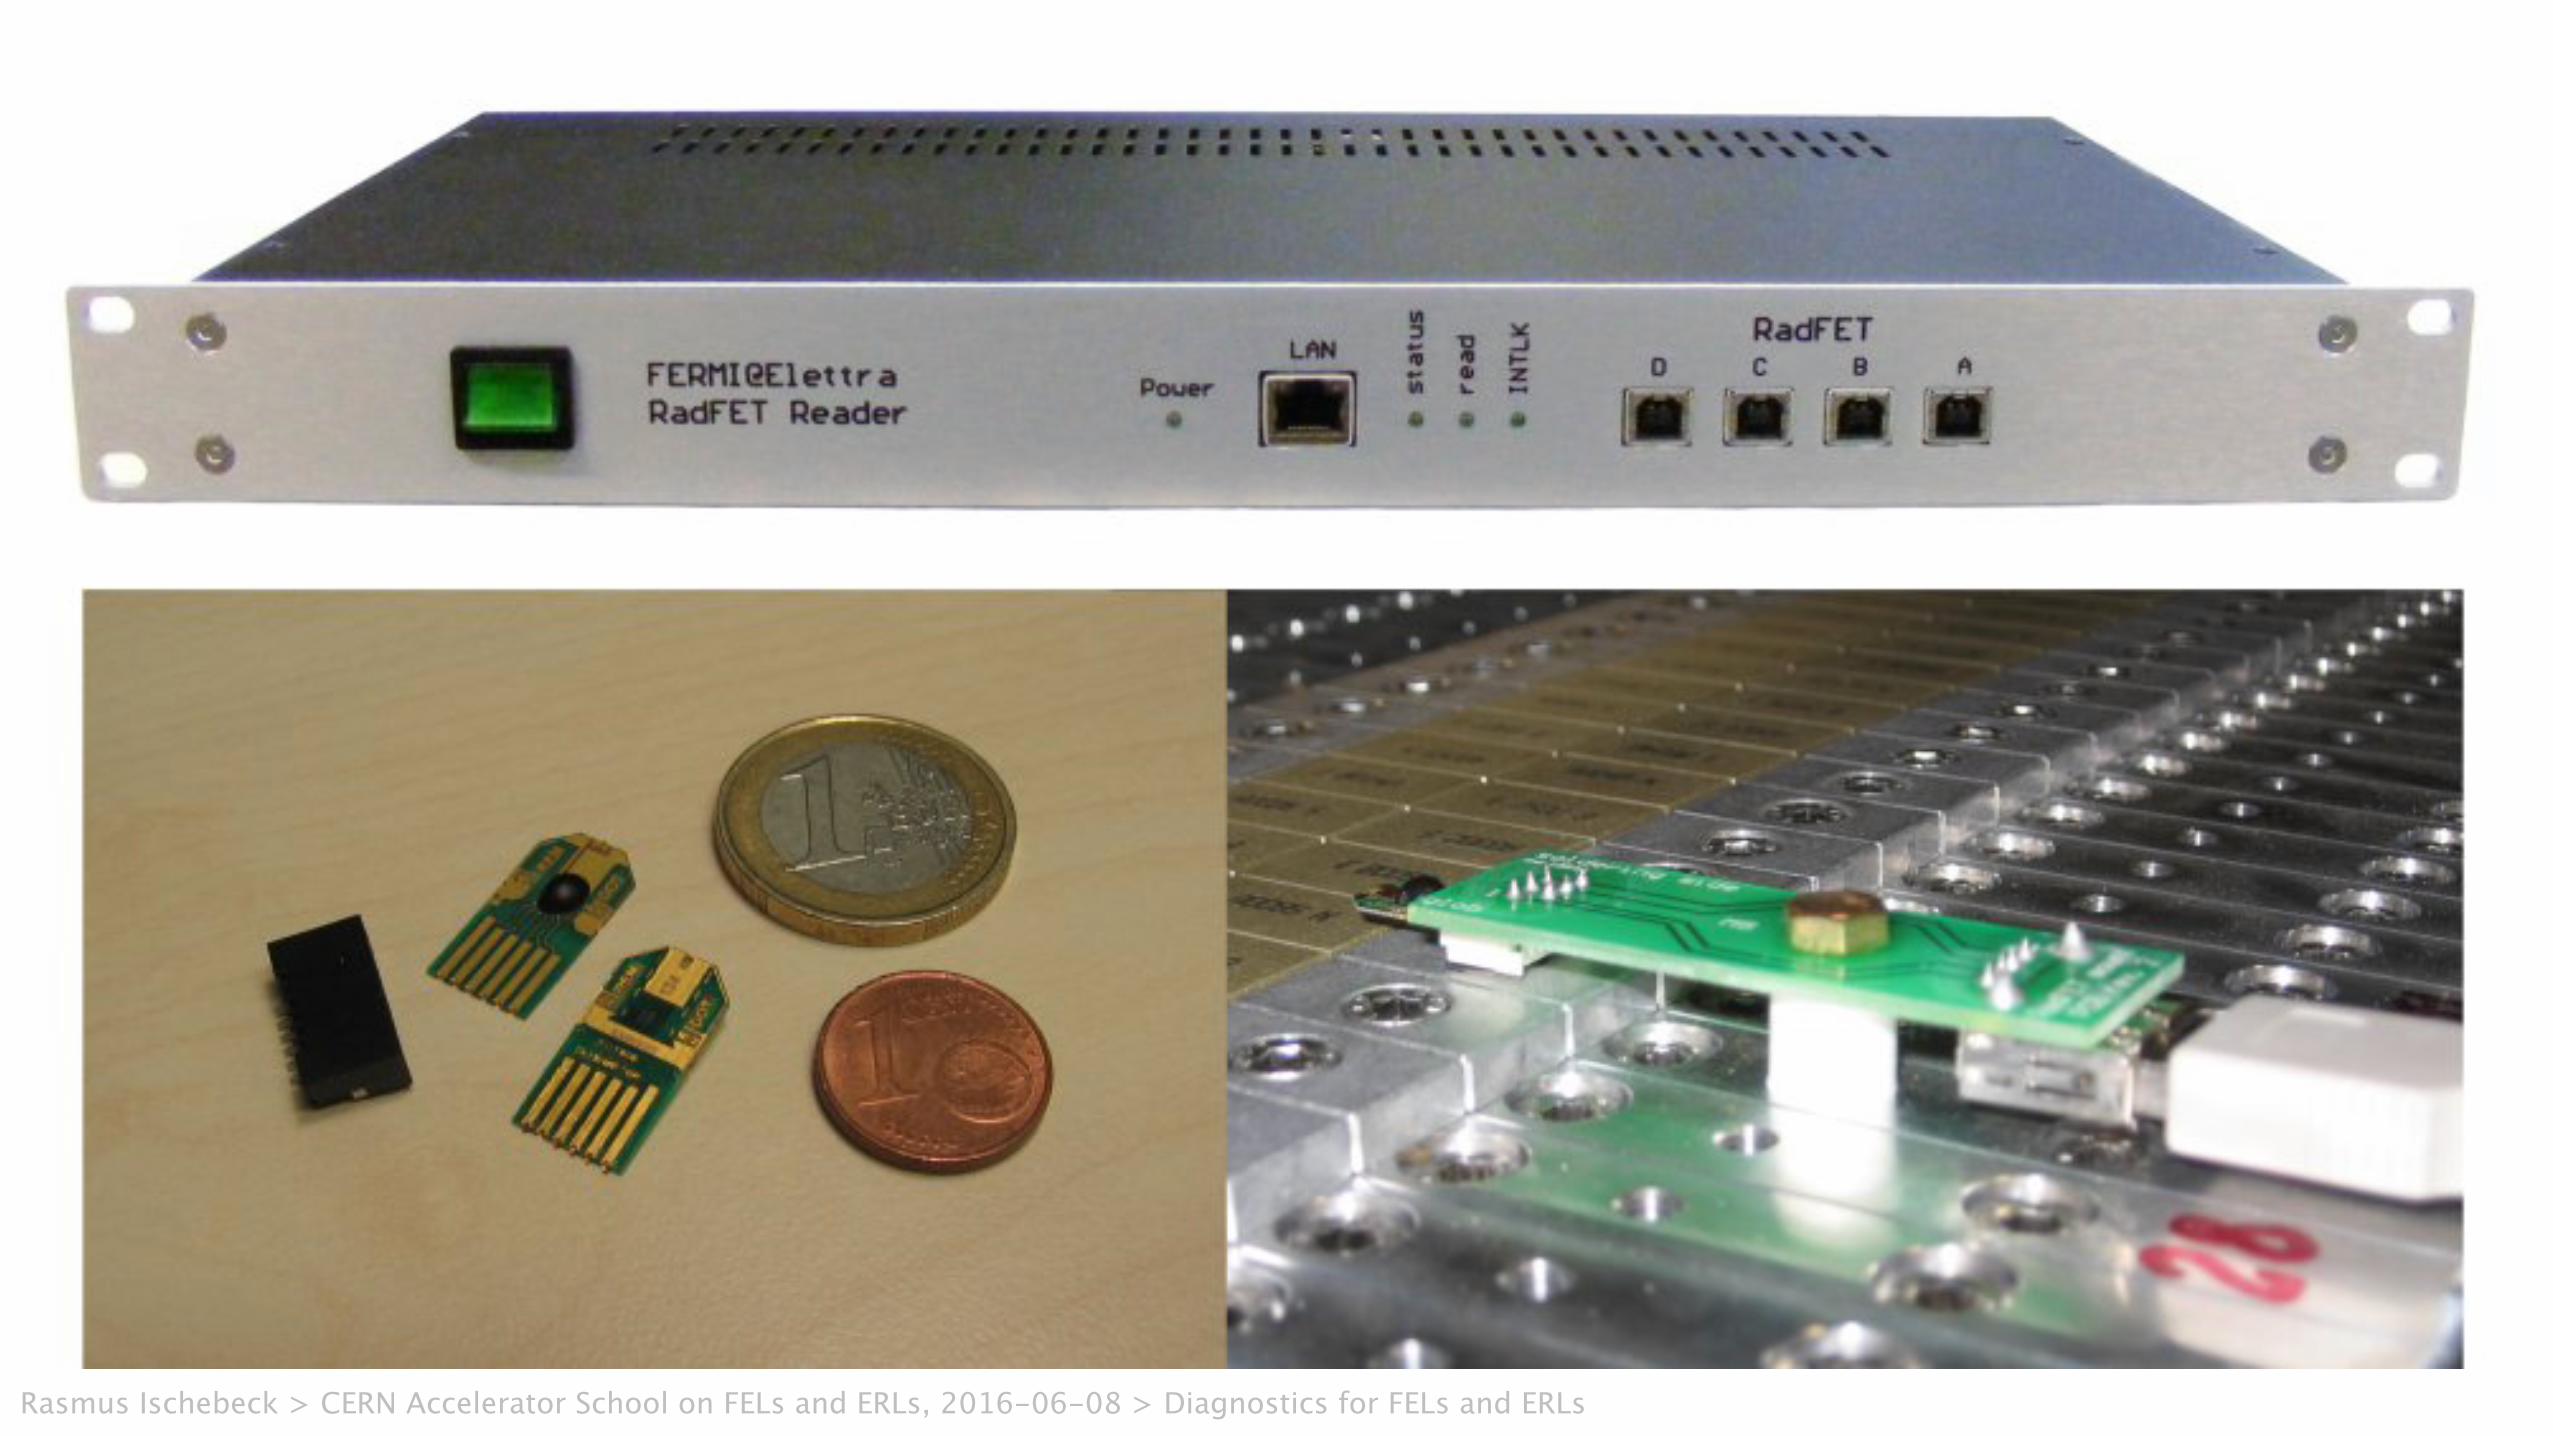
Figure 2: Photos of the RADFET dosimetry system. Top:Reader unit. Left: Single RADFET dosimeters. Right:Dosimeter installed on undulator support.
RADFET DOSIMETERS
The dose deposition in the sensitive undulator magnets ismonitored by four compact integrating MOSFET dosime-ters per undulator. These RADFETs (see e.g. [3]) of thetype RFT-300-CC10G1 are produced by REM Oxford Ltd.,have an oxide thickness of 300 nm, and allow the measure-ment of doses up to about 10 kGy without the applicationof a bias voltage during irradiation.
The dosimeters are mounted on the undulator supportstructure with the help of a small printed circuit boardas depicted in Fig. 2. They are read out by a cus-tom microprocessor-controlled reader unit that periodicallydrives the RADFETs with a constant current of 490 μA.The voltage needed to drive this current is digitized witha 24-bit ADC. Each unit has four channels and communi-cates via an ethernet interface.
At the moment, the dosimeters have a purely diagnosticfunction and no direct connection to the machine protec-tion system is foreseen. However, the reader is equipped
e, INFN-Roma, Rome, Italy
TUOA04 Proceedings of DIPAC2011, Hamburg, Germany
286Cop
yrig
htc �
2011
byth
ere
spec
tive
auth
ors—
ccC
reat
ive
Com
mon
sAttr
ibut
ion
3.0
(CC
BY3.
0)
04 Beam Loss Detection
Rasmus Ischebeck > CERN Accelerator School on FELs and ERLs, 2016-06-08 > Diagnostics for FELs and ERLs

Rasmus Ischebeck
Transverse Diagnostics
Rasmus Ischebeck > CERN Accelerator School on FELs and ERLs, 2016-06-08 > Diagnostics for FELs and ERLs
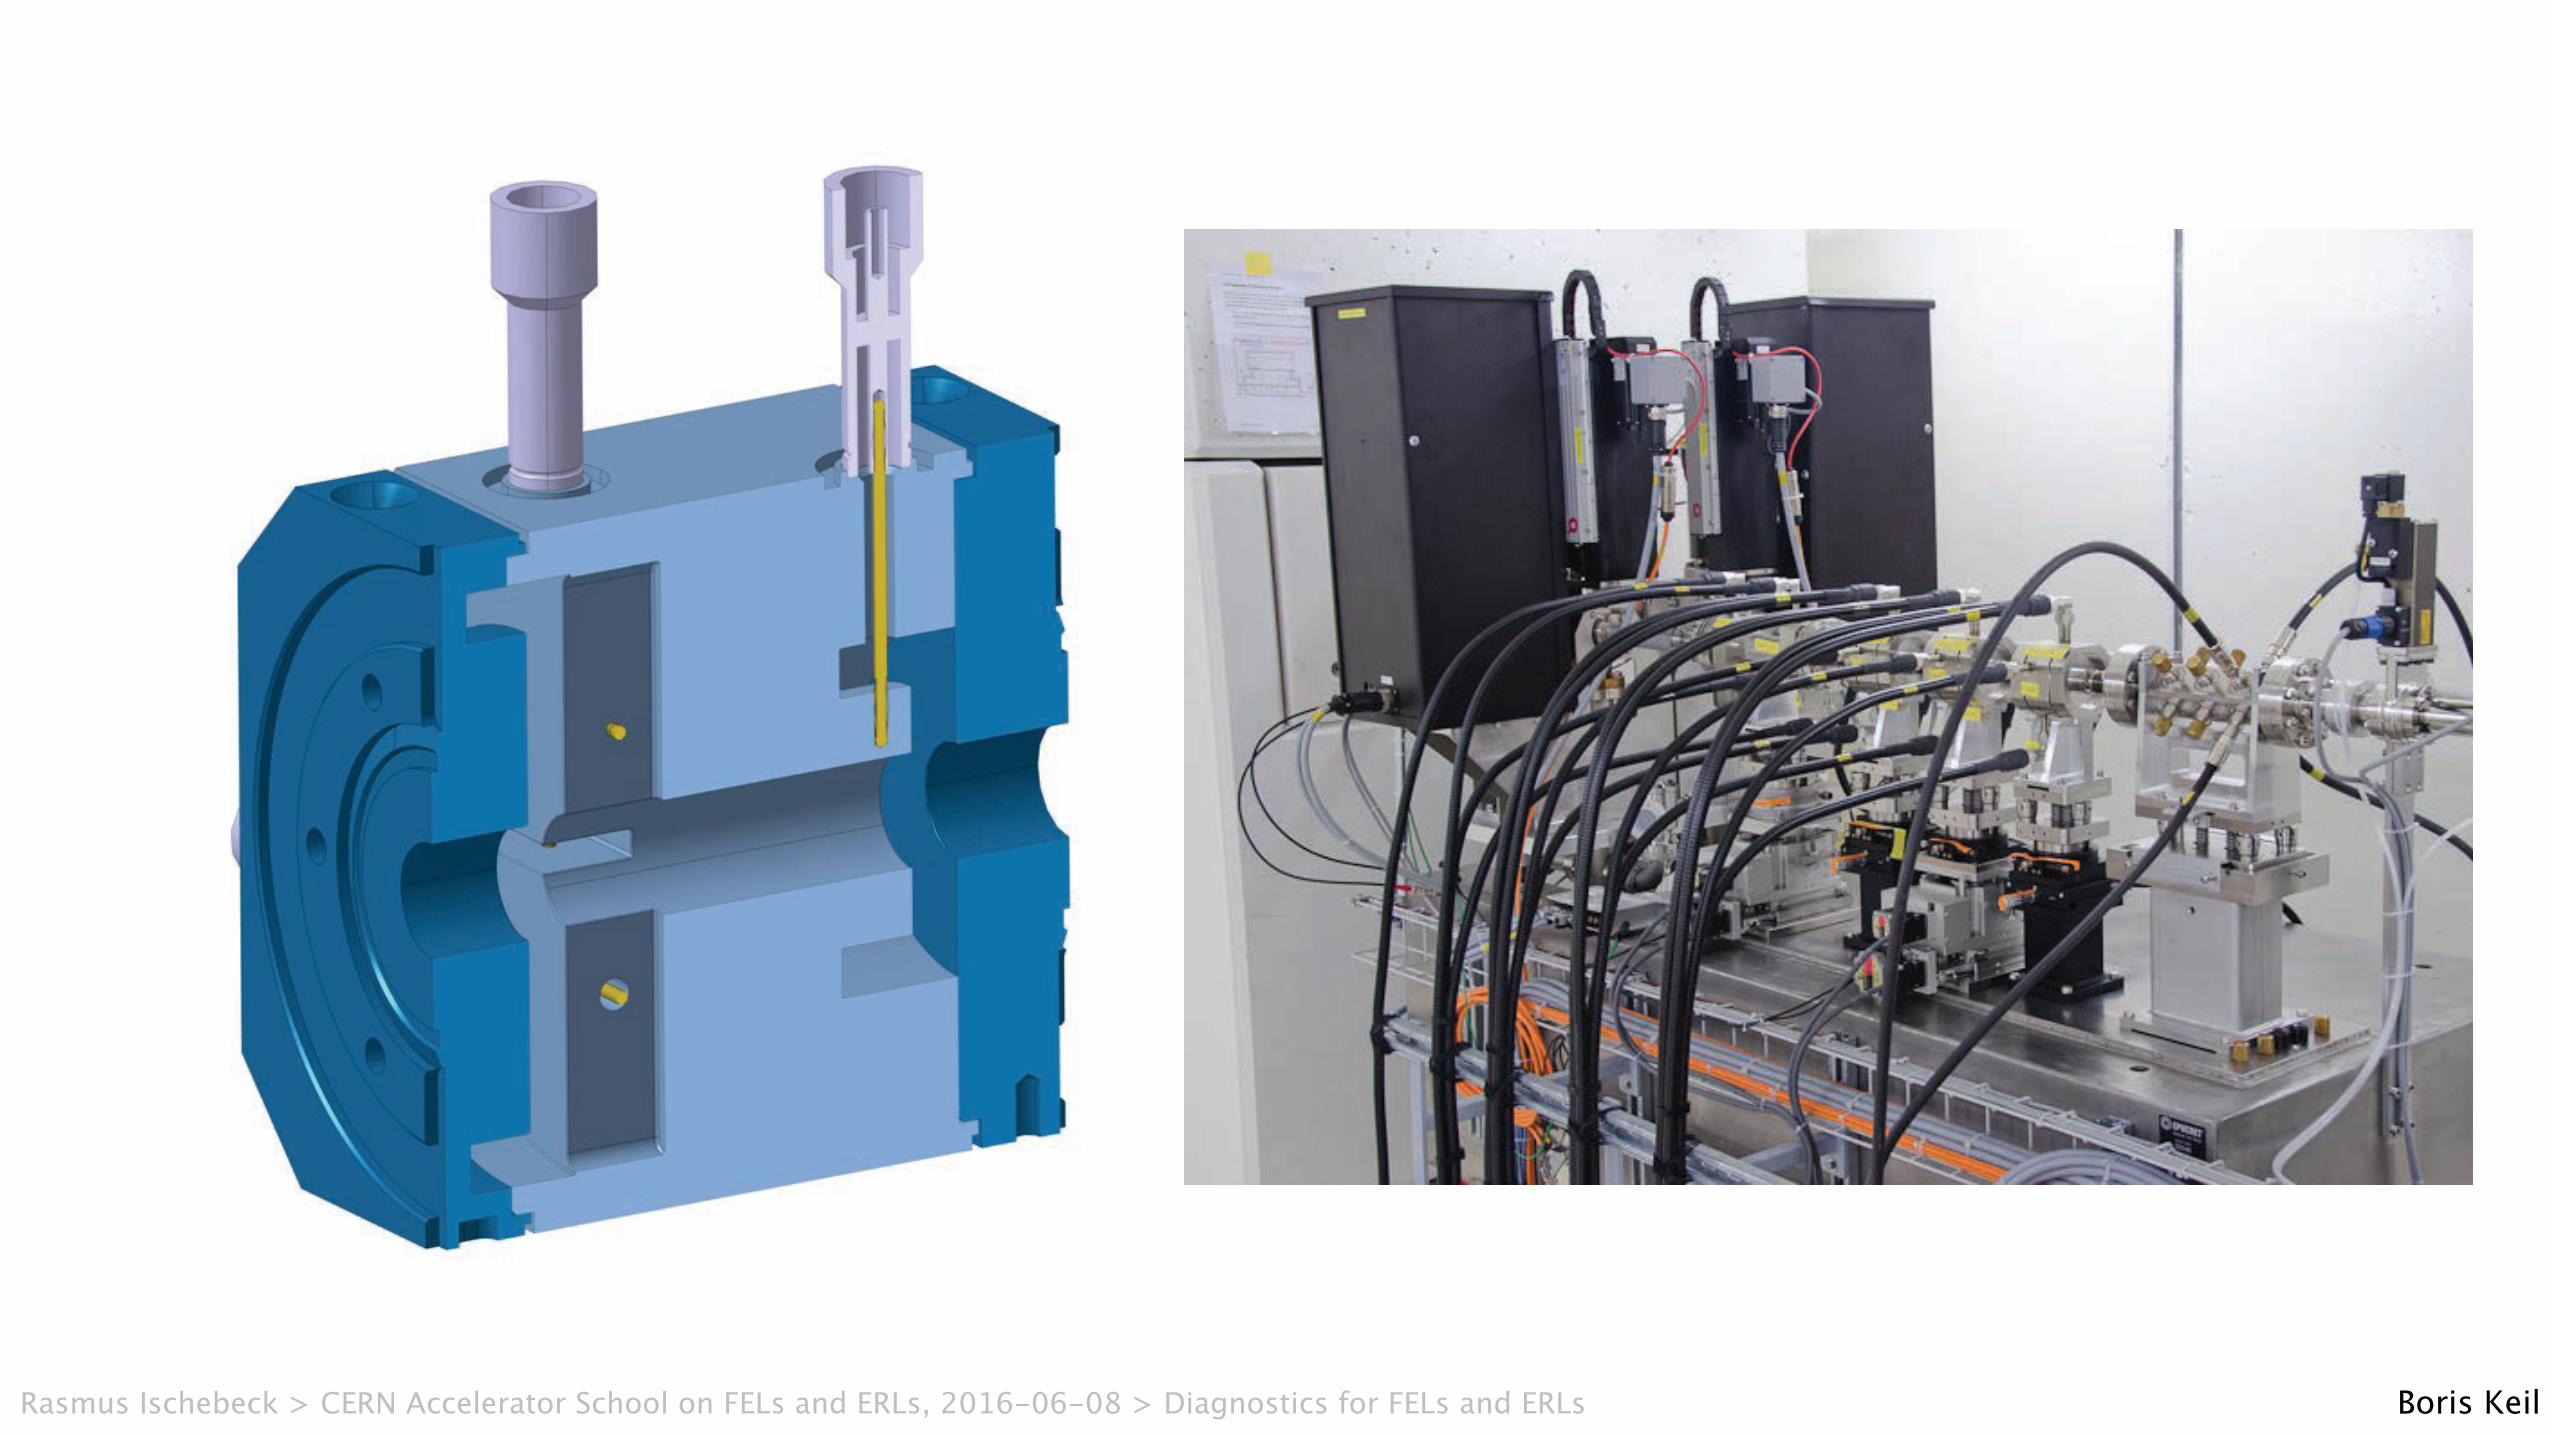
Boris KeilRasmus Ischebeck > CERN Accelerator School on FELs and ERLs, 2016-06-08 > Diagnostics for FELs and ERLs
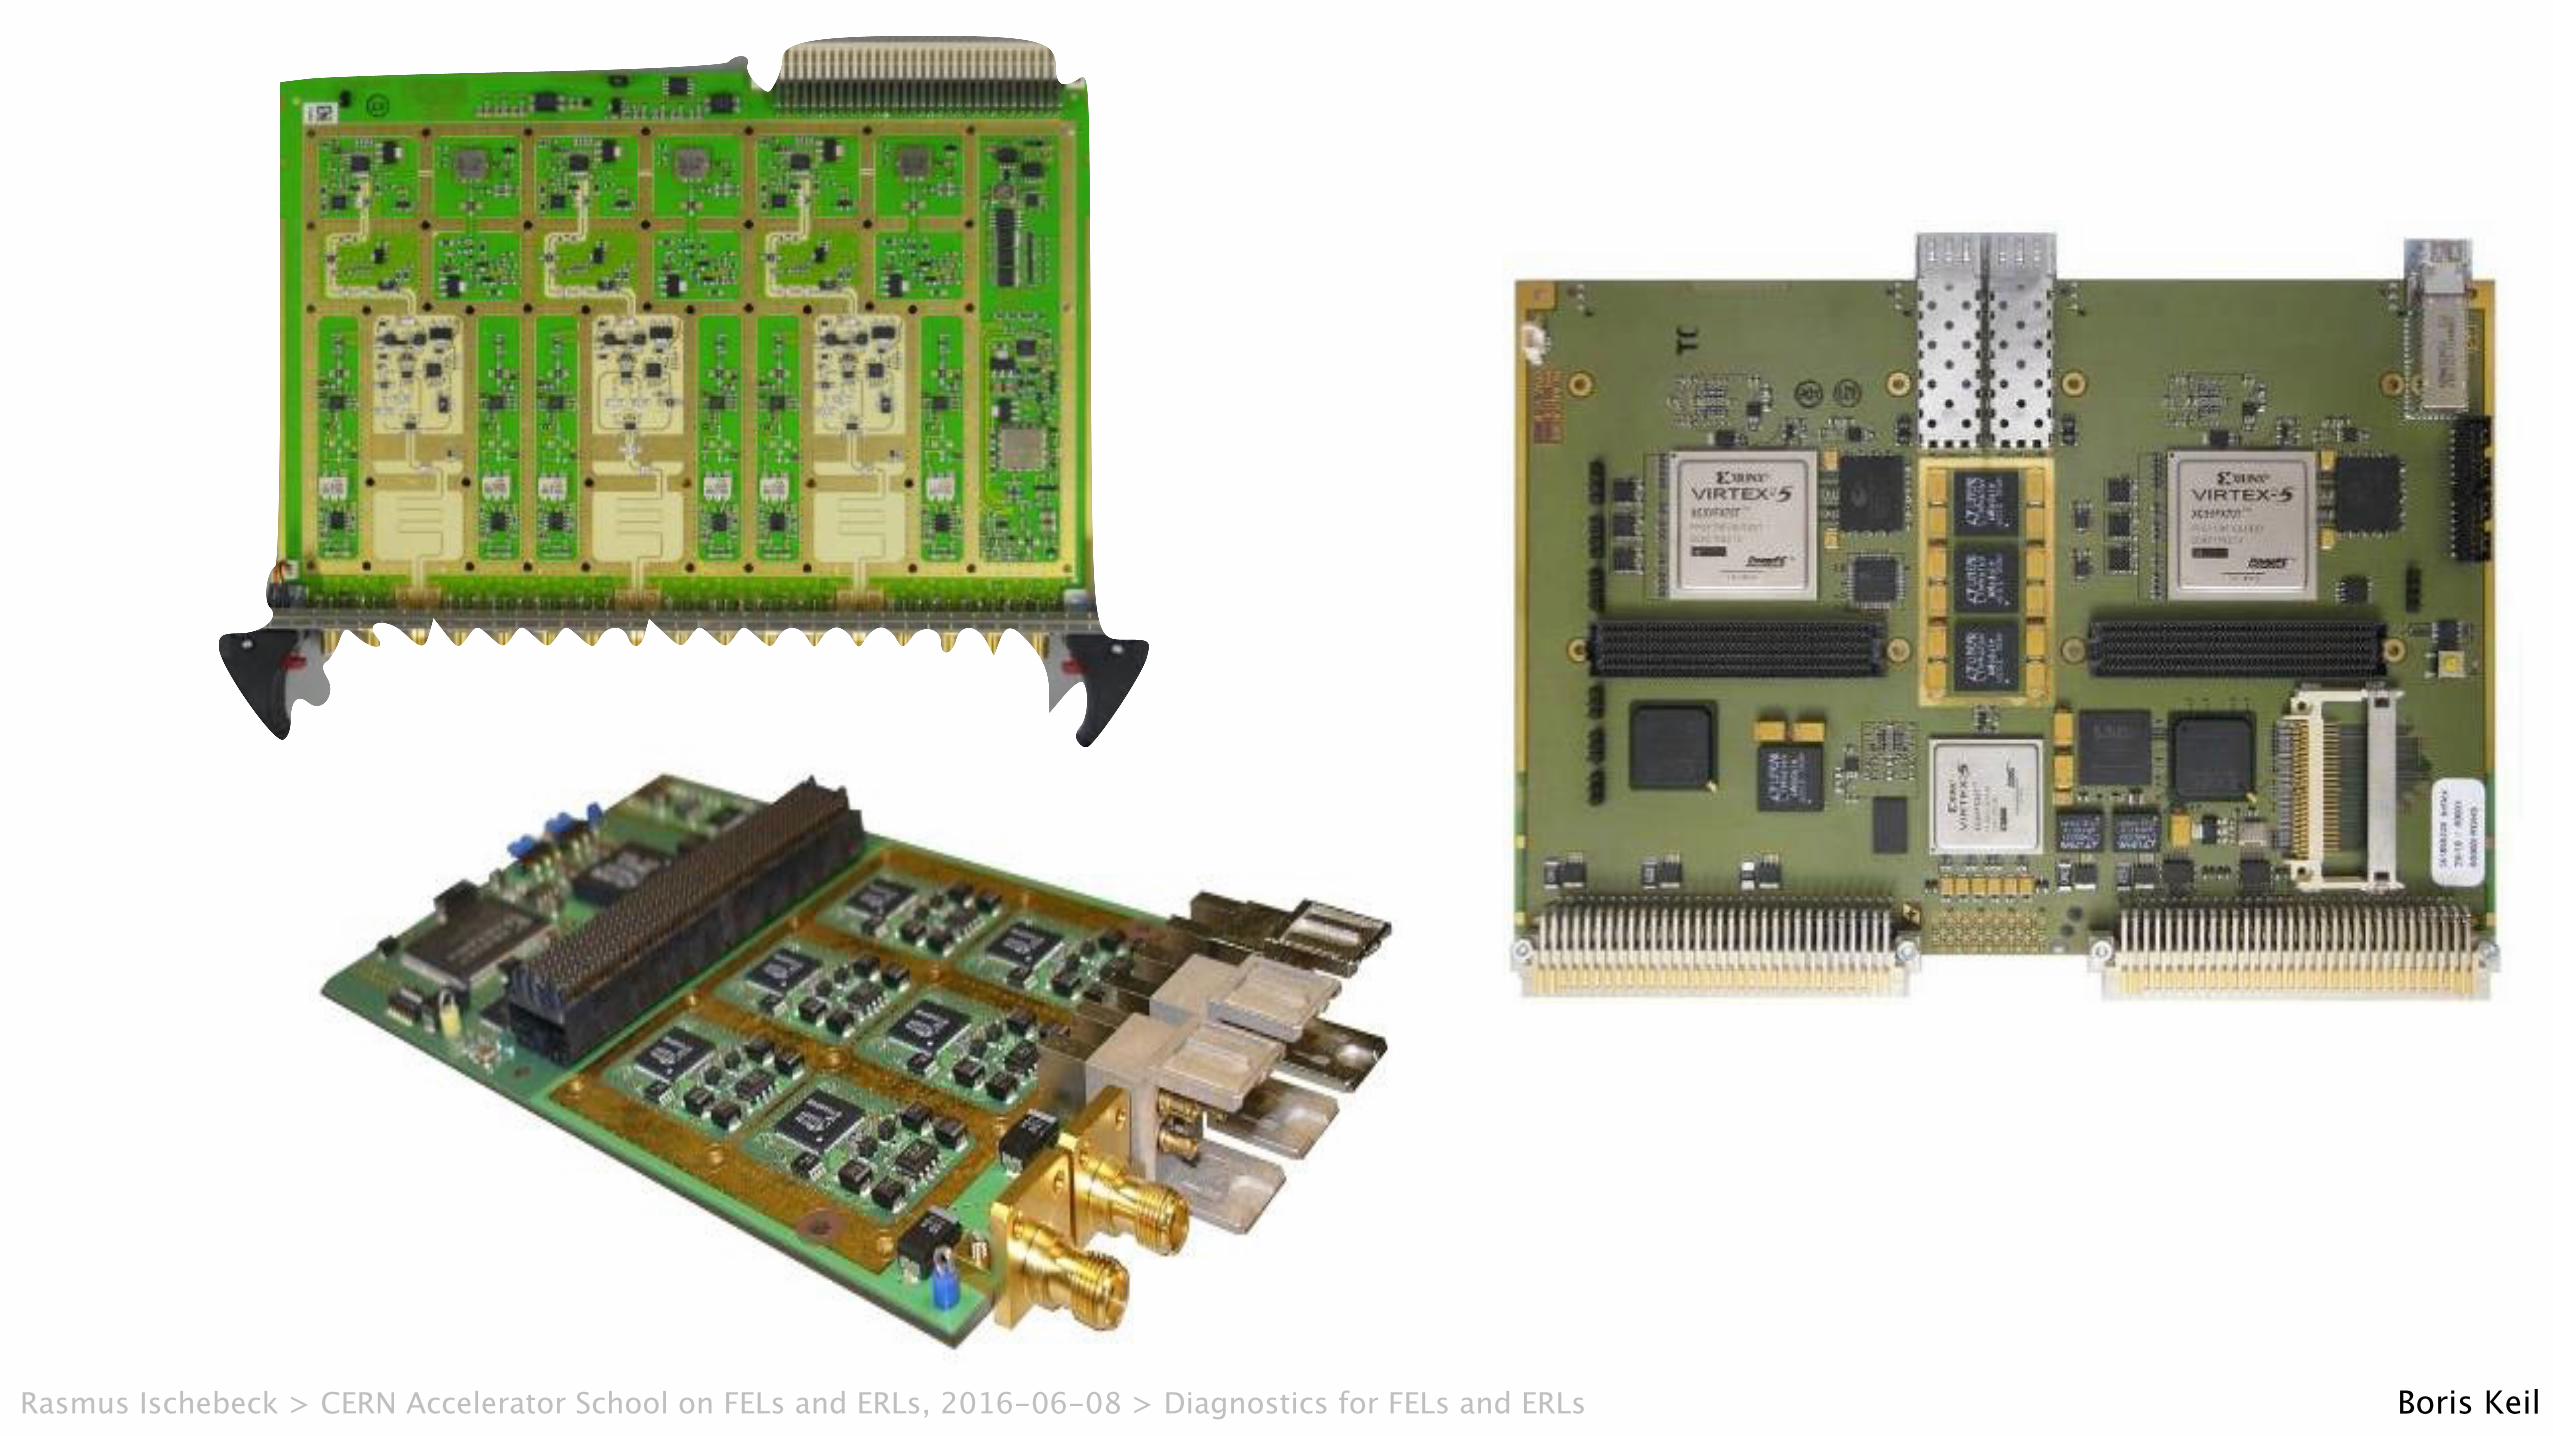
Boris KeilRasmus Ischebeck > CERN Accelerator School on FELs and ERLs, 2016-06-08 > Diagnostics for FELs and ERLs
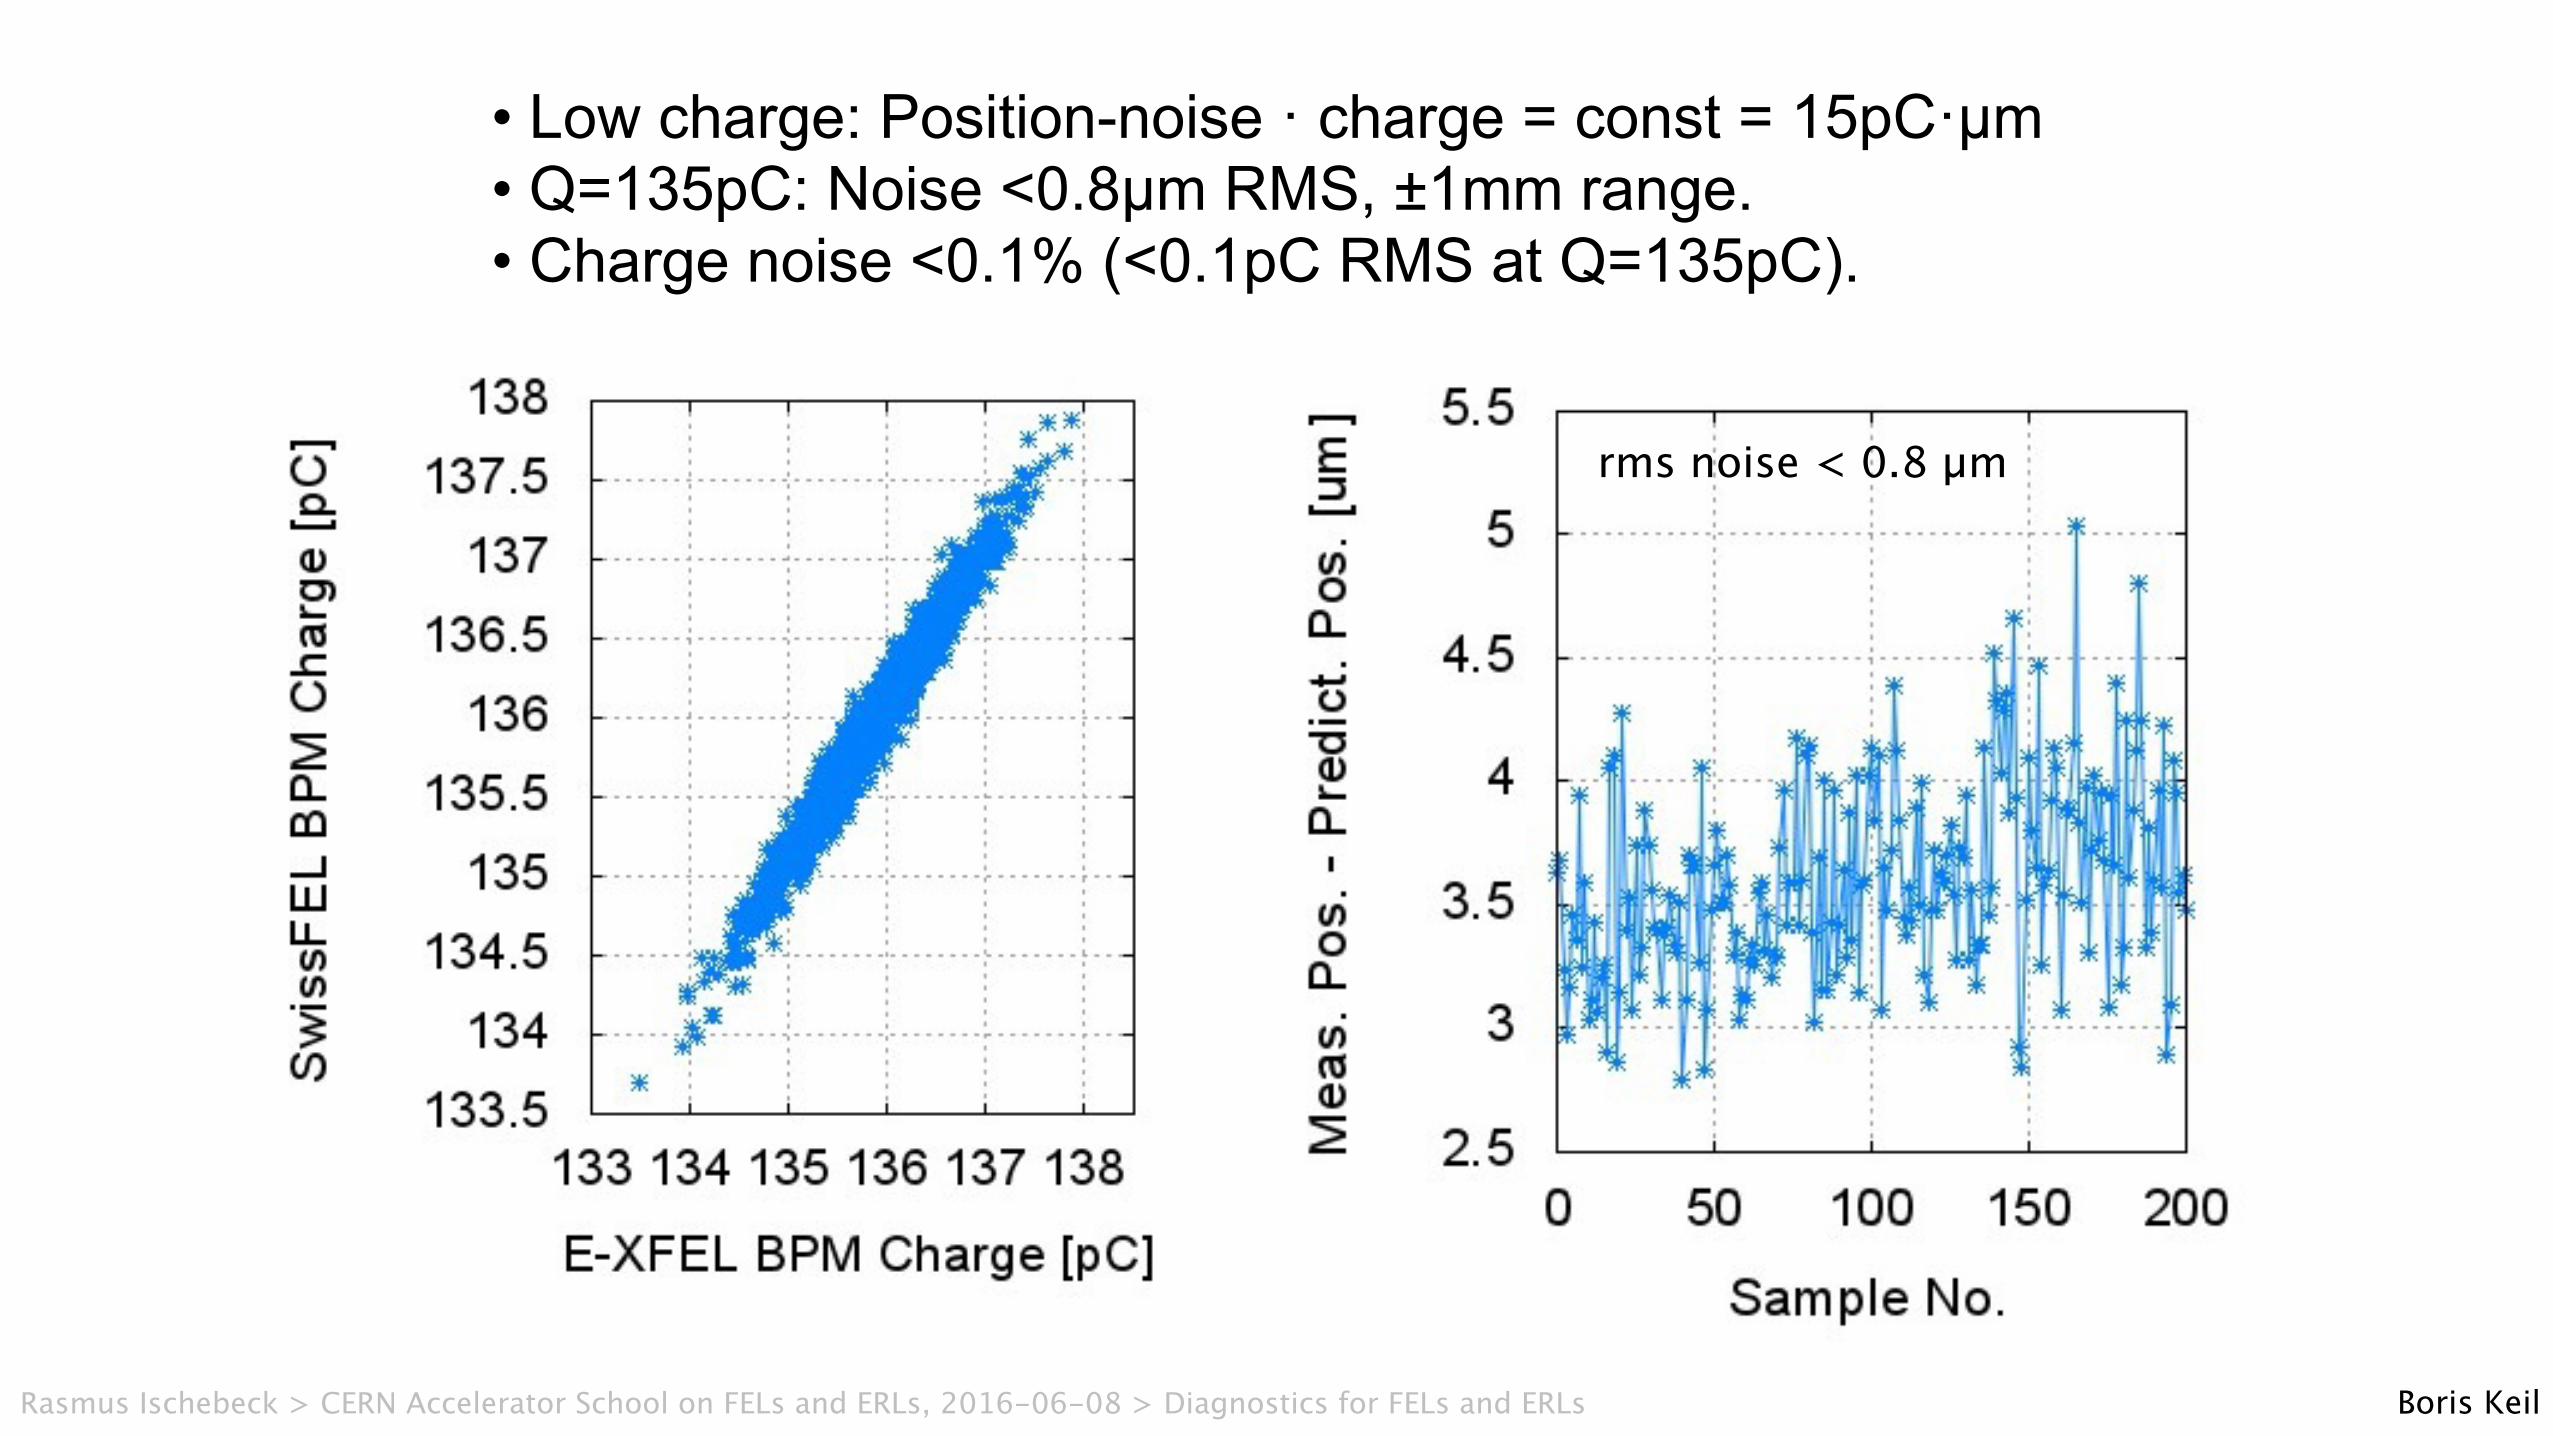
• Low charge: Position-noise · charge = const = 15pC·µm • Q=135pC: Noise <0.8µm RMS, ±1mm range. • Charge noise <0.1% (<0.1pC RMS at Q=135pC).
rms noise < 0.8 µm
Boris KeilRasmus Ischebeck > CERN Accelerator School on FELs and ERLs, 2016-06-08 > Diagnostics for FELs and ERLs
Rasmus Ischebeck > CERN Accelerator School on FELs and ERLs, 2016-06-08 > Diagnostics for FELs and ERLs
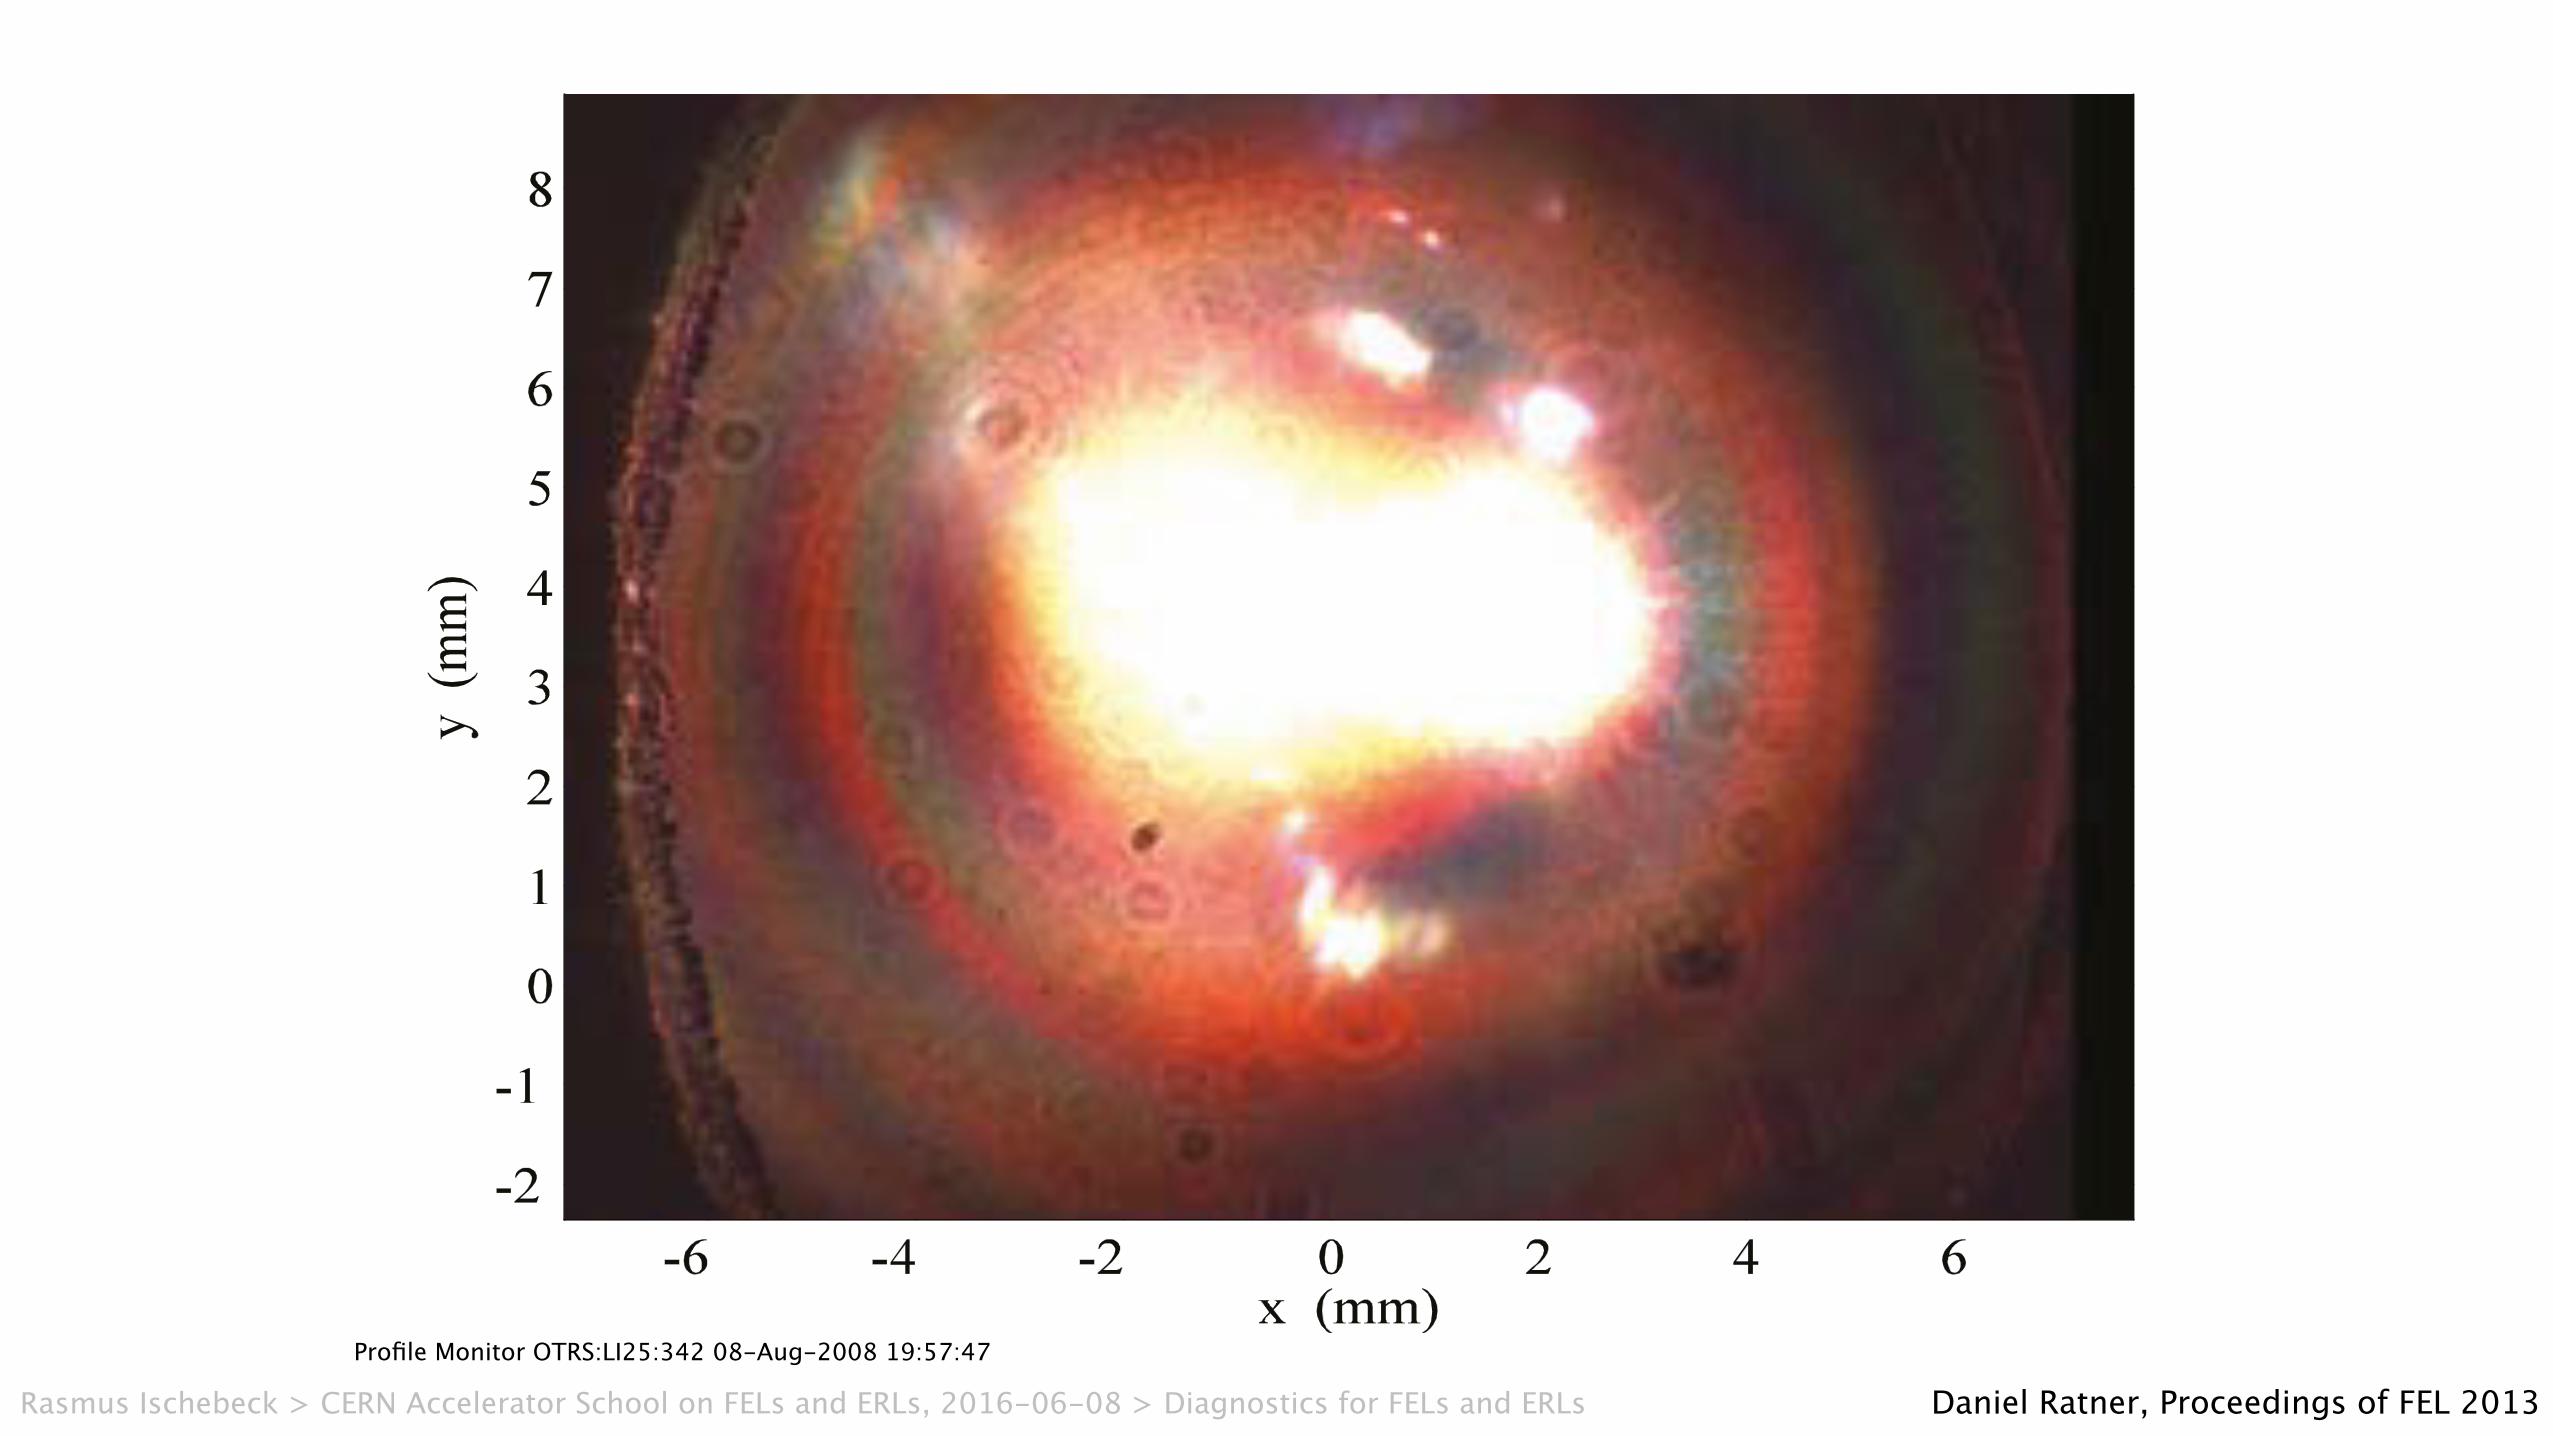
Daniel Ratner, FEL 2013, New York, USAProfile Monitor OTRS:LI25:342 08-Aug-2008 19:57:47
Profile Monitor OTRS:LI25:342 08-Aug-2008 19:57:47
Daniel Ratner, Proceedings of FEL 2013Rasmus Ischebeck > CERN Accelerator School on FELs and ERLs, 2016-06-08 > Diagnostics for FELs and ERLs
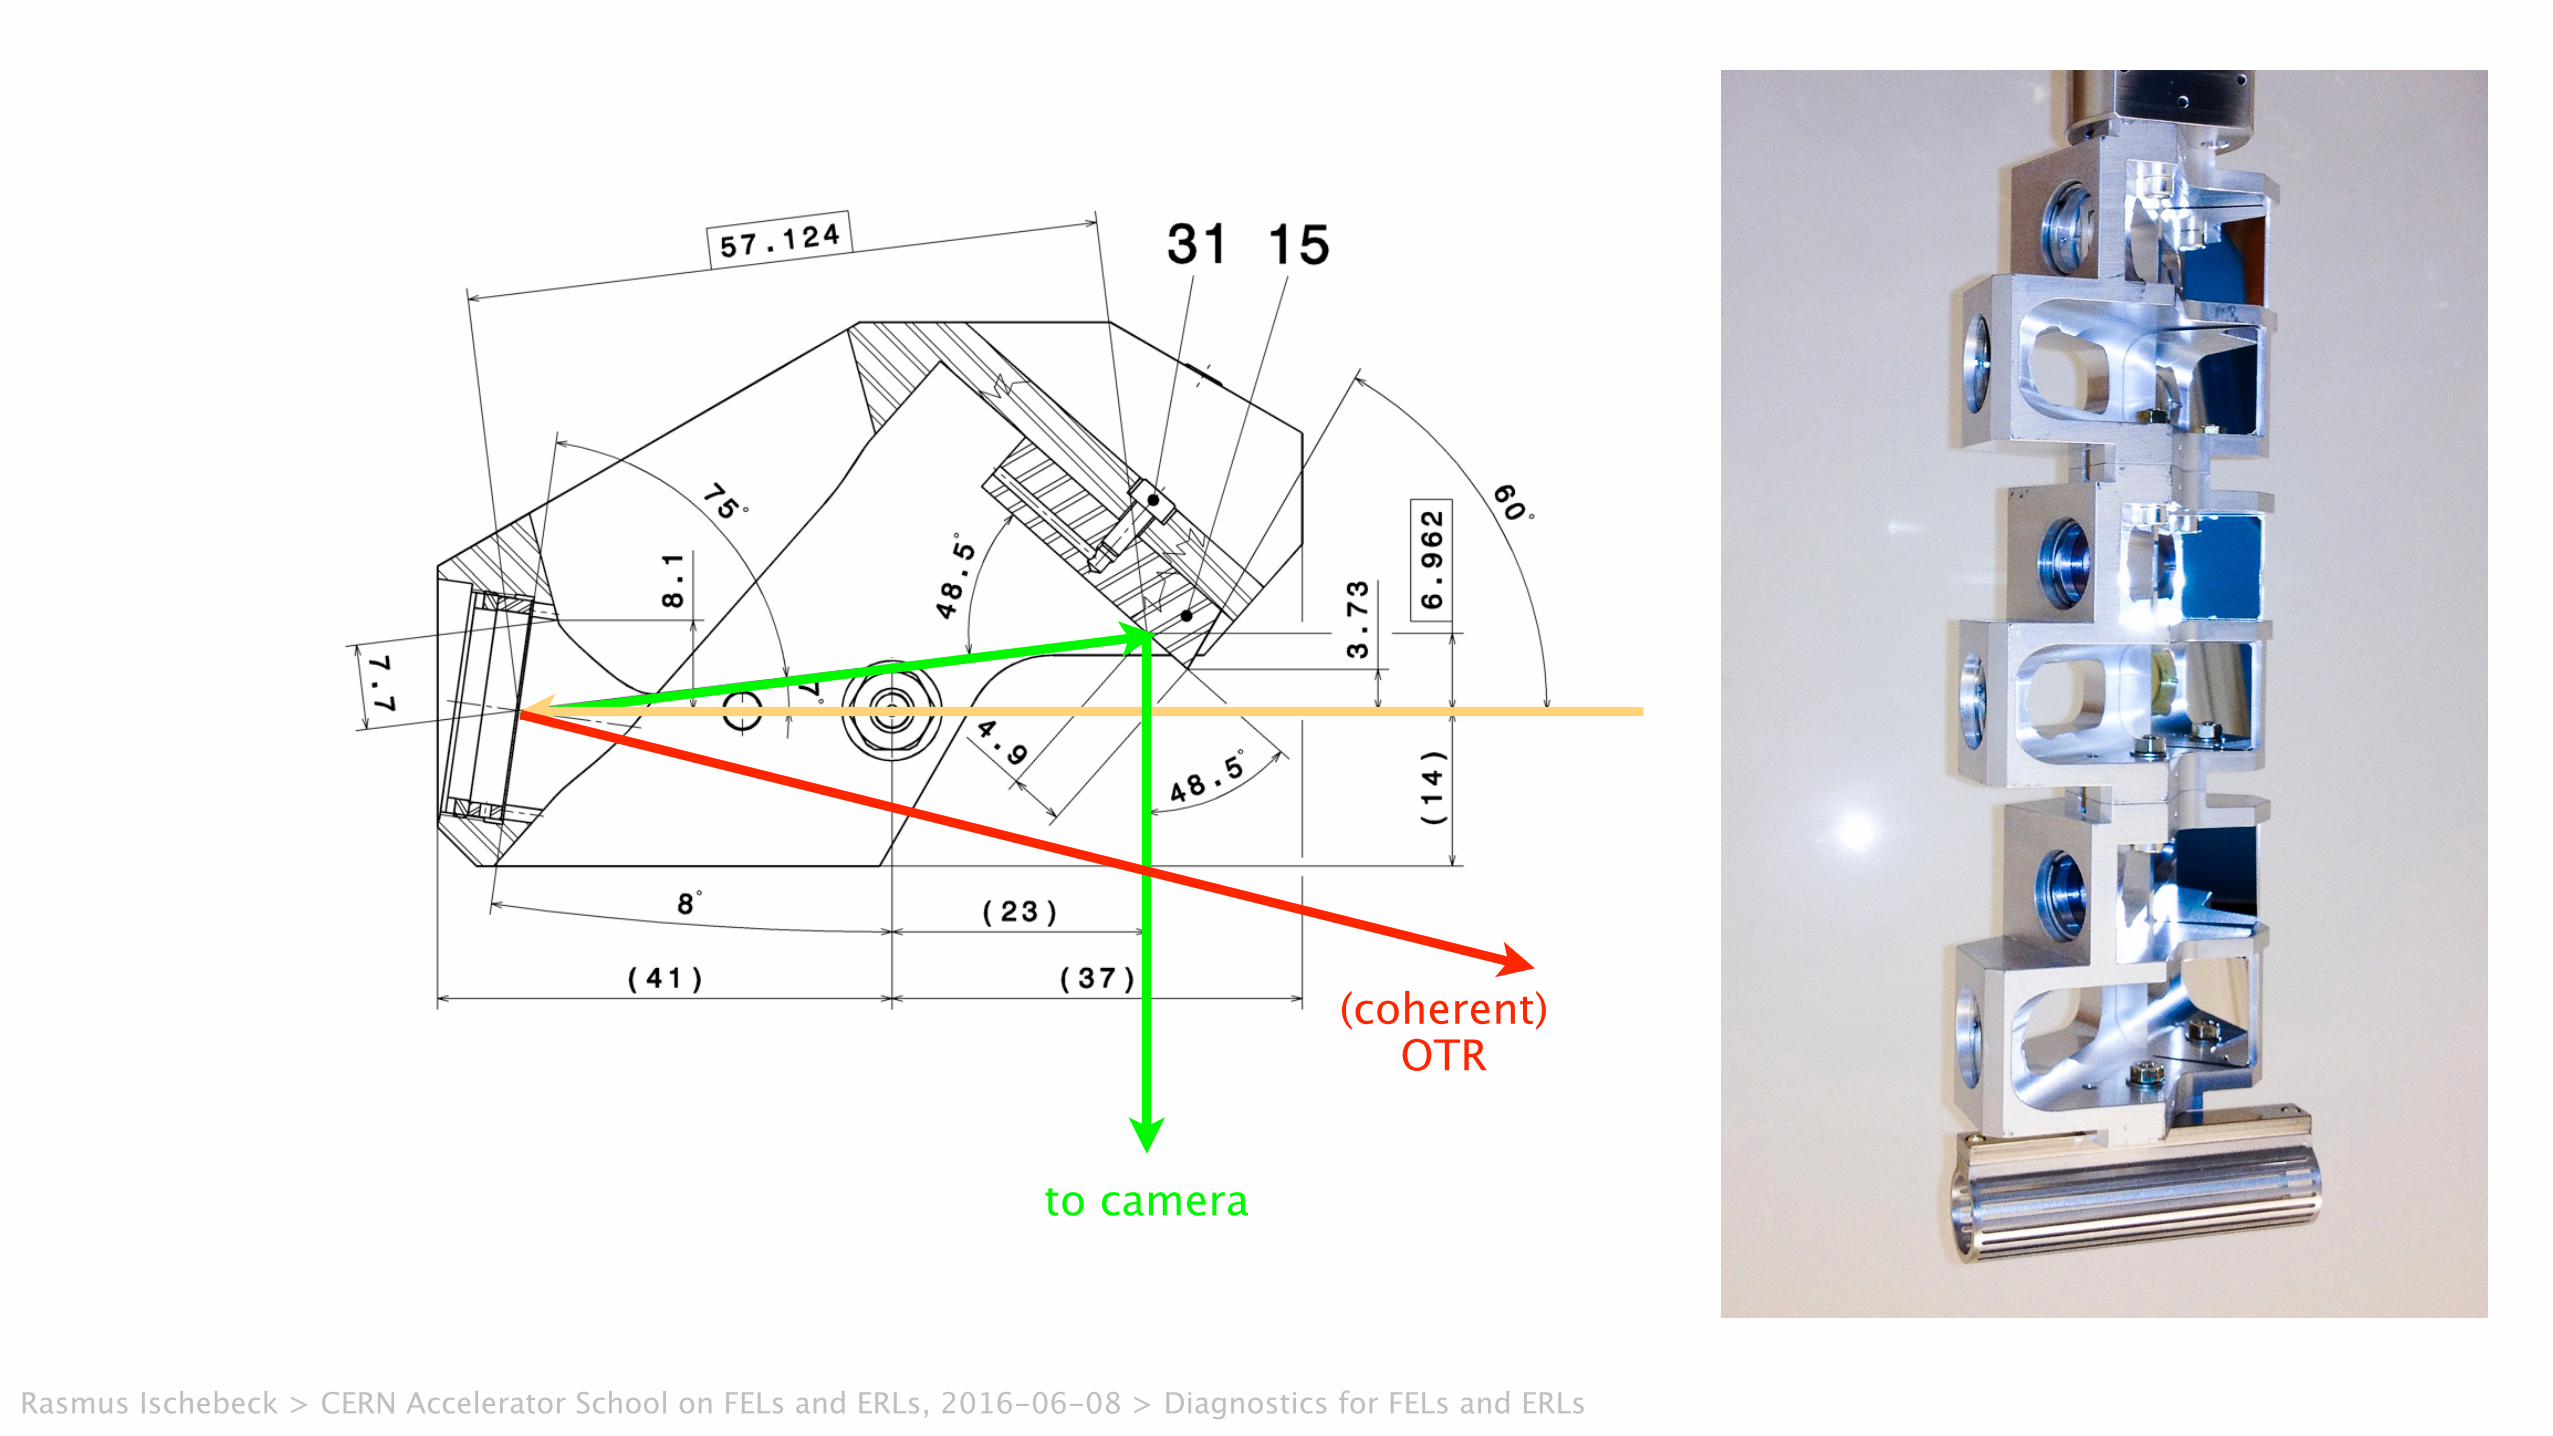
to camera
(coherent) OTR
Rasmus Ischebeck > CERN Accelerator School on FELs and ERLs, 2016-06-08 > Diagnostics for FELs and ERLs
observation angle - / degrees-80 -60 -40 -20 0 20 40 60 80
imag
e si
ze / 7
m
0
5
10
15
20
25
30
35
40
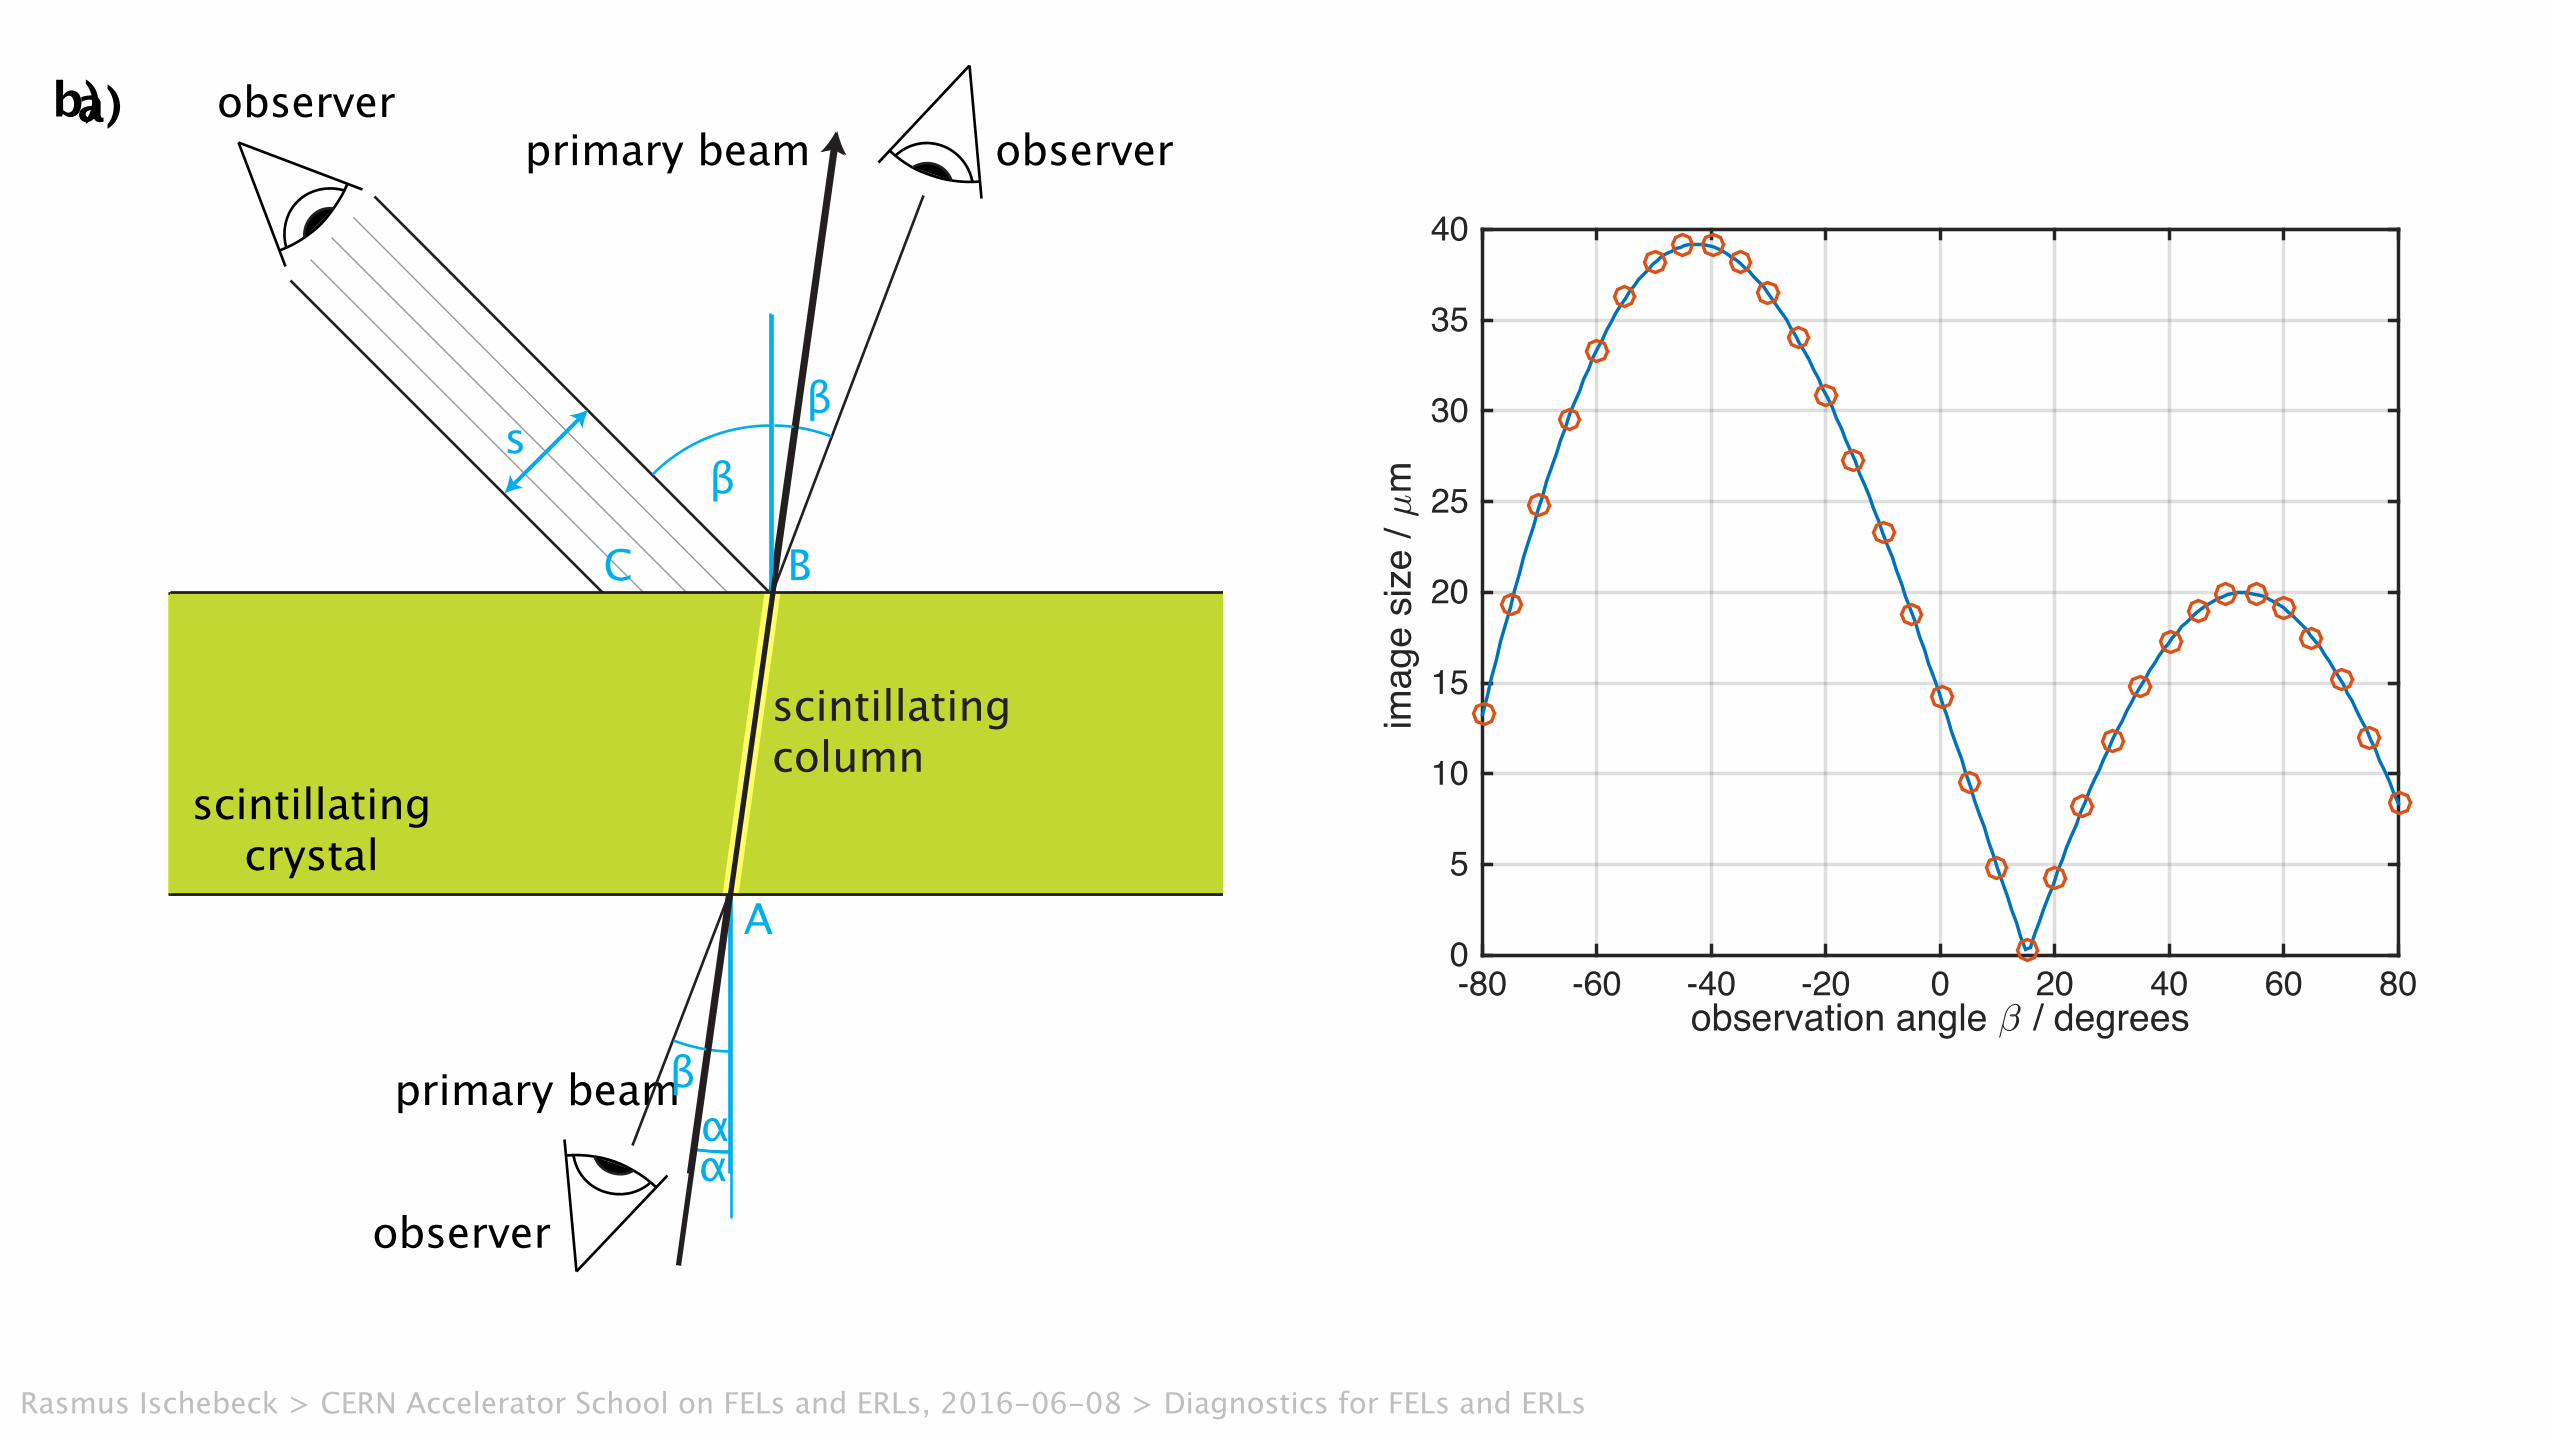
virtual image
primary beam
scintillatingcrystal
observer
s
ℓ
sʼ
d
β
βʼ
α
A
BC
b)primary beam
β
β
α
scintillatingcrystal
observer
observer
scintillatingcolumn
a)
Rasmus Ischebeck > CERN Accelerator School on FELs and ERLs, 2016-06-08 > Diagnostics for FELs and ERLs
Injector / Transverse Phase Space
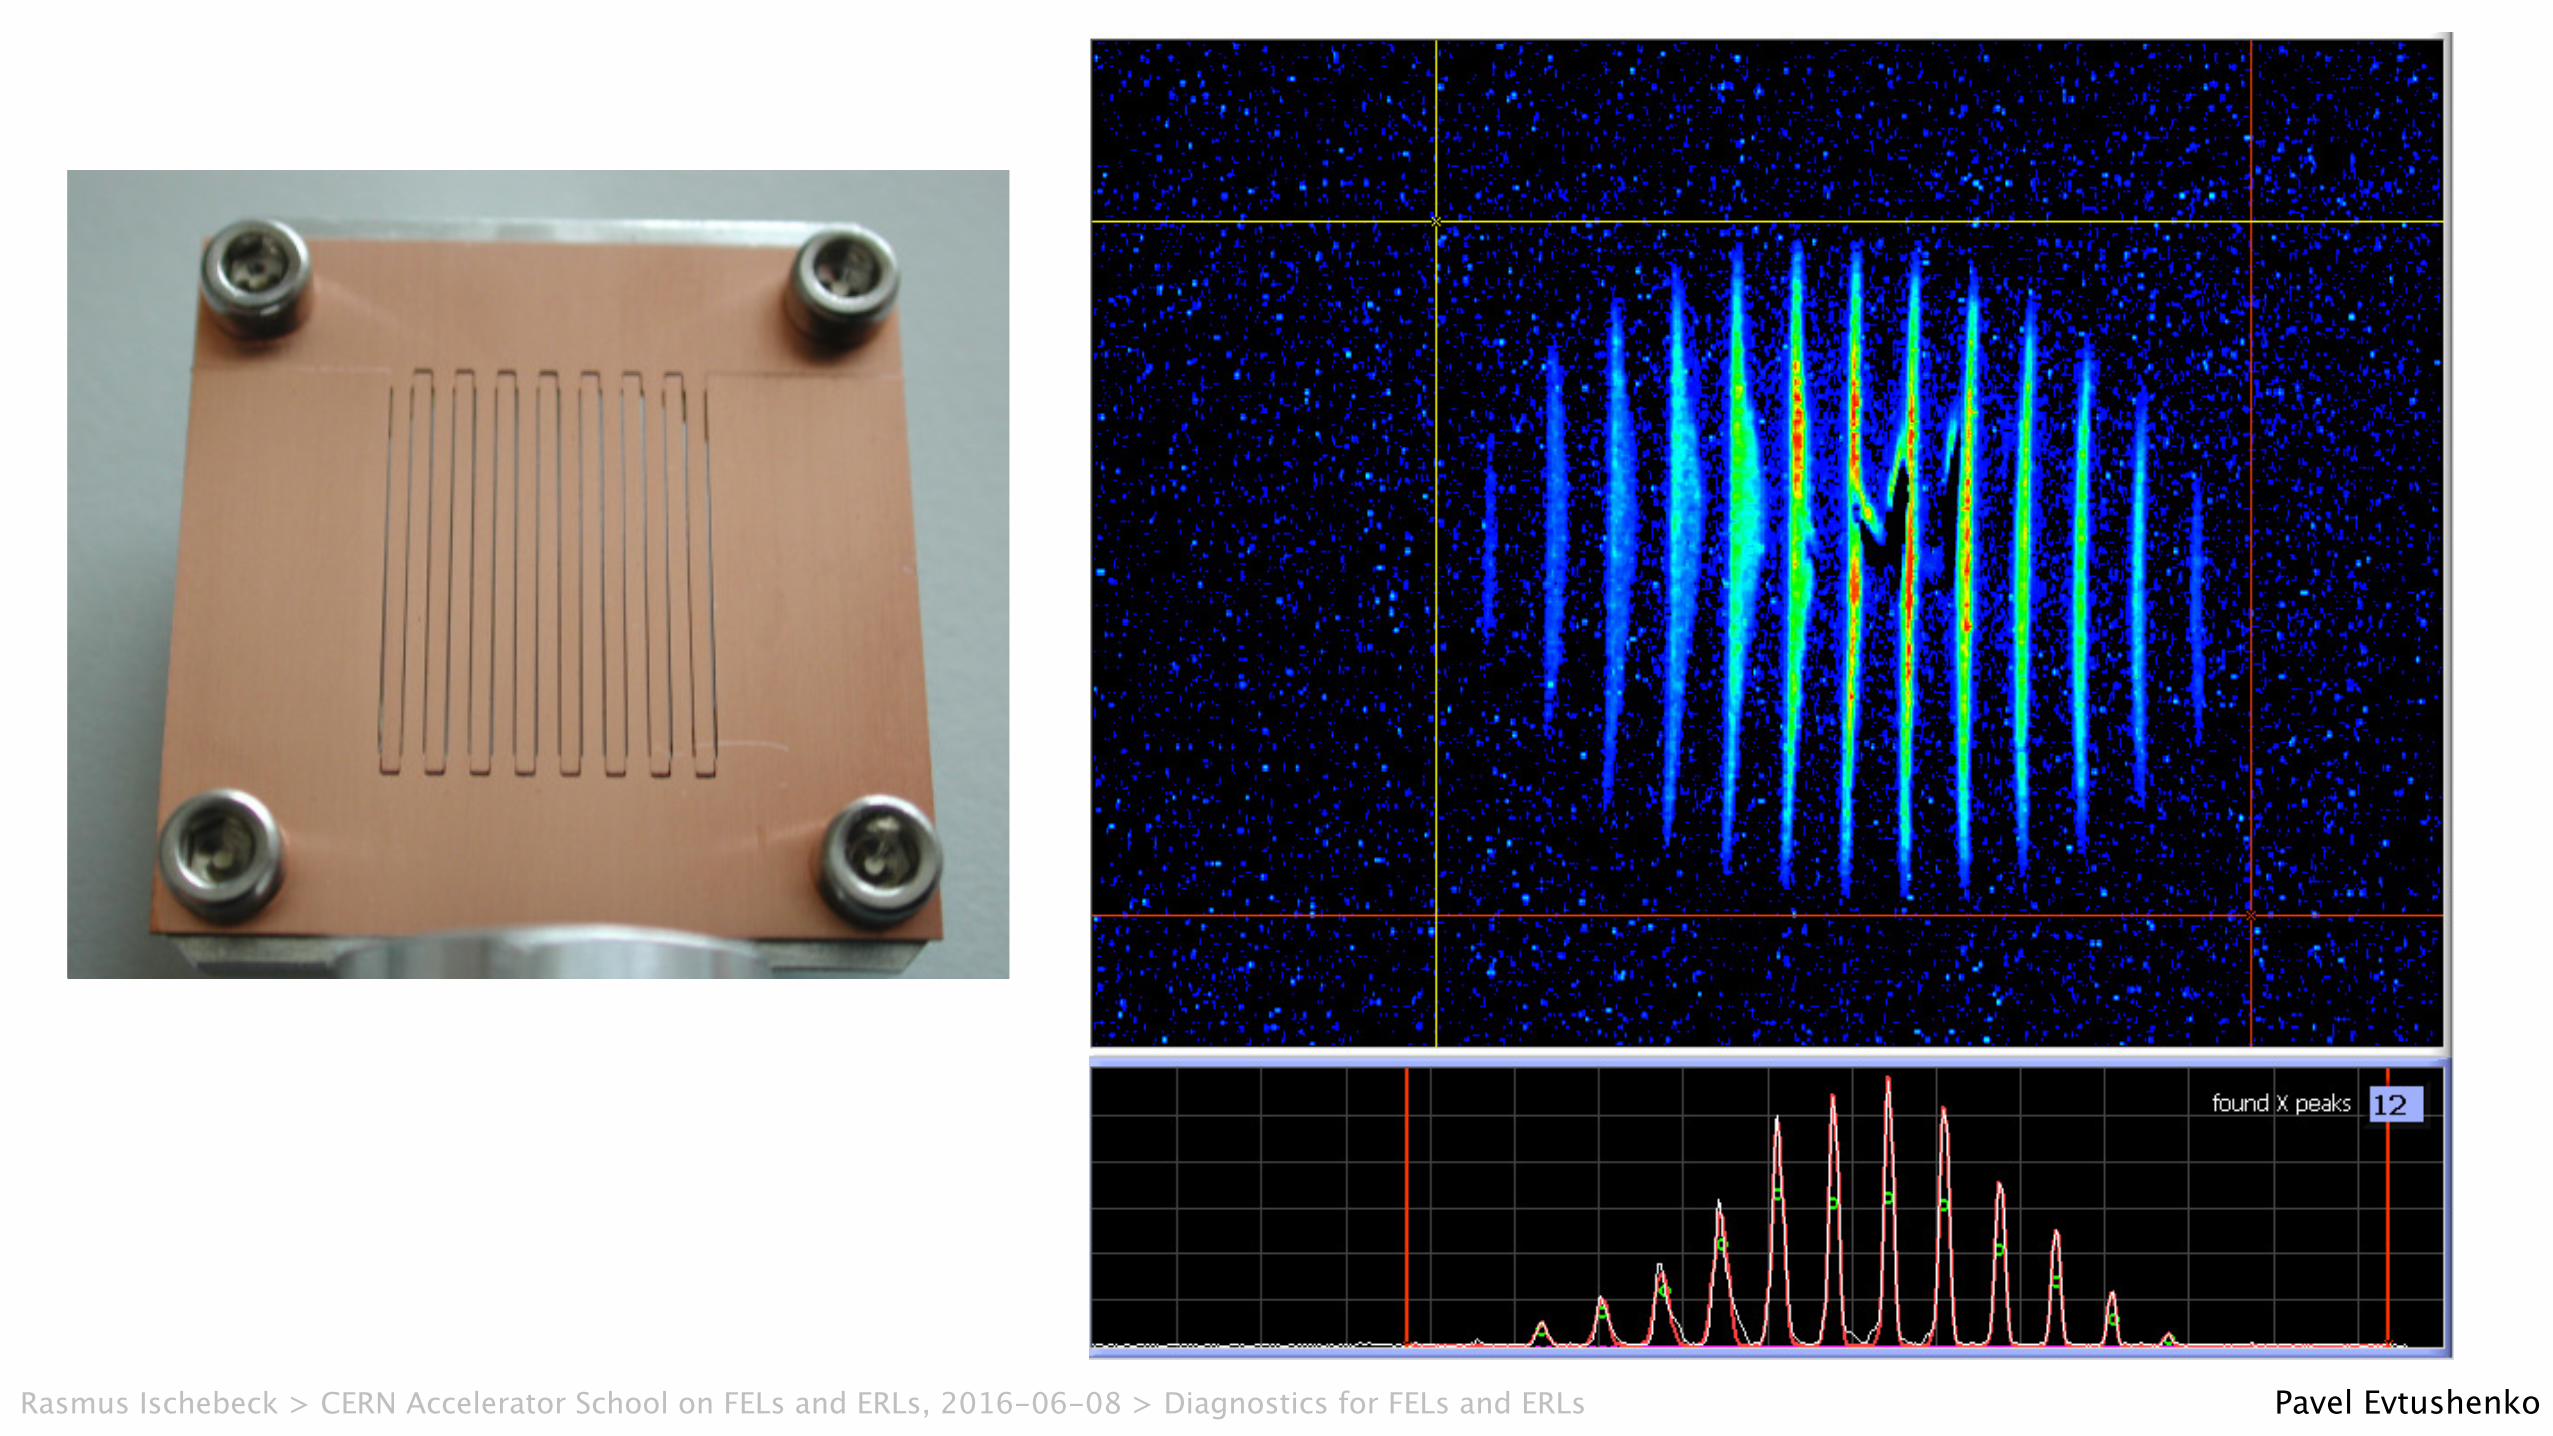
The multislit or a single slit scanning through the beam (or a beam scanning acrossthe slit) does the job very well (pulsed beam only).
! well established technique! works for space charge dominated beam! beam profile is measured with YAG! measures not only the emittance but the Twiss parameters as well! enough information to reconstruct the phase space! has been implemented as on-line diagnostics! works with diagnostics mode only (low duty cycle, average current)
Multi-slit emittance measurements
! mask is used to cut a small beamlet(s)! every beamlet is emittance dominated
Beam profile measurements! intensity of beamlets (A)! width (w)! Displacement (d)
Pavel EvtushenkoRasmus Ischebeck > CERN Accelerator School on FELs and ERLs, 2016-06-08 > Diagnostics for FELs and ERLs
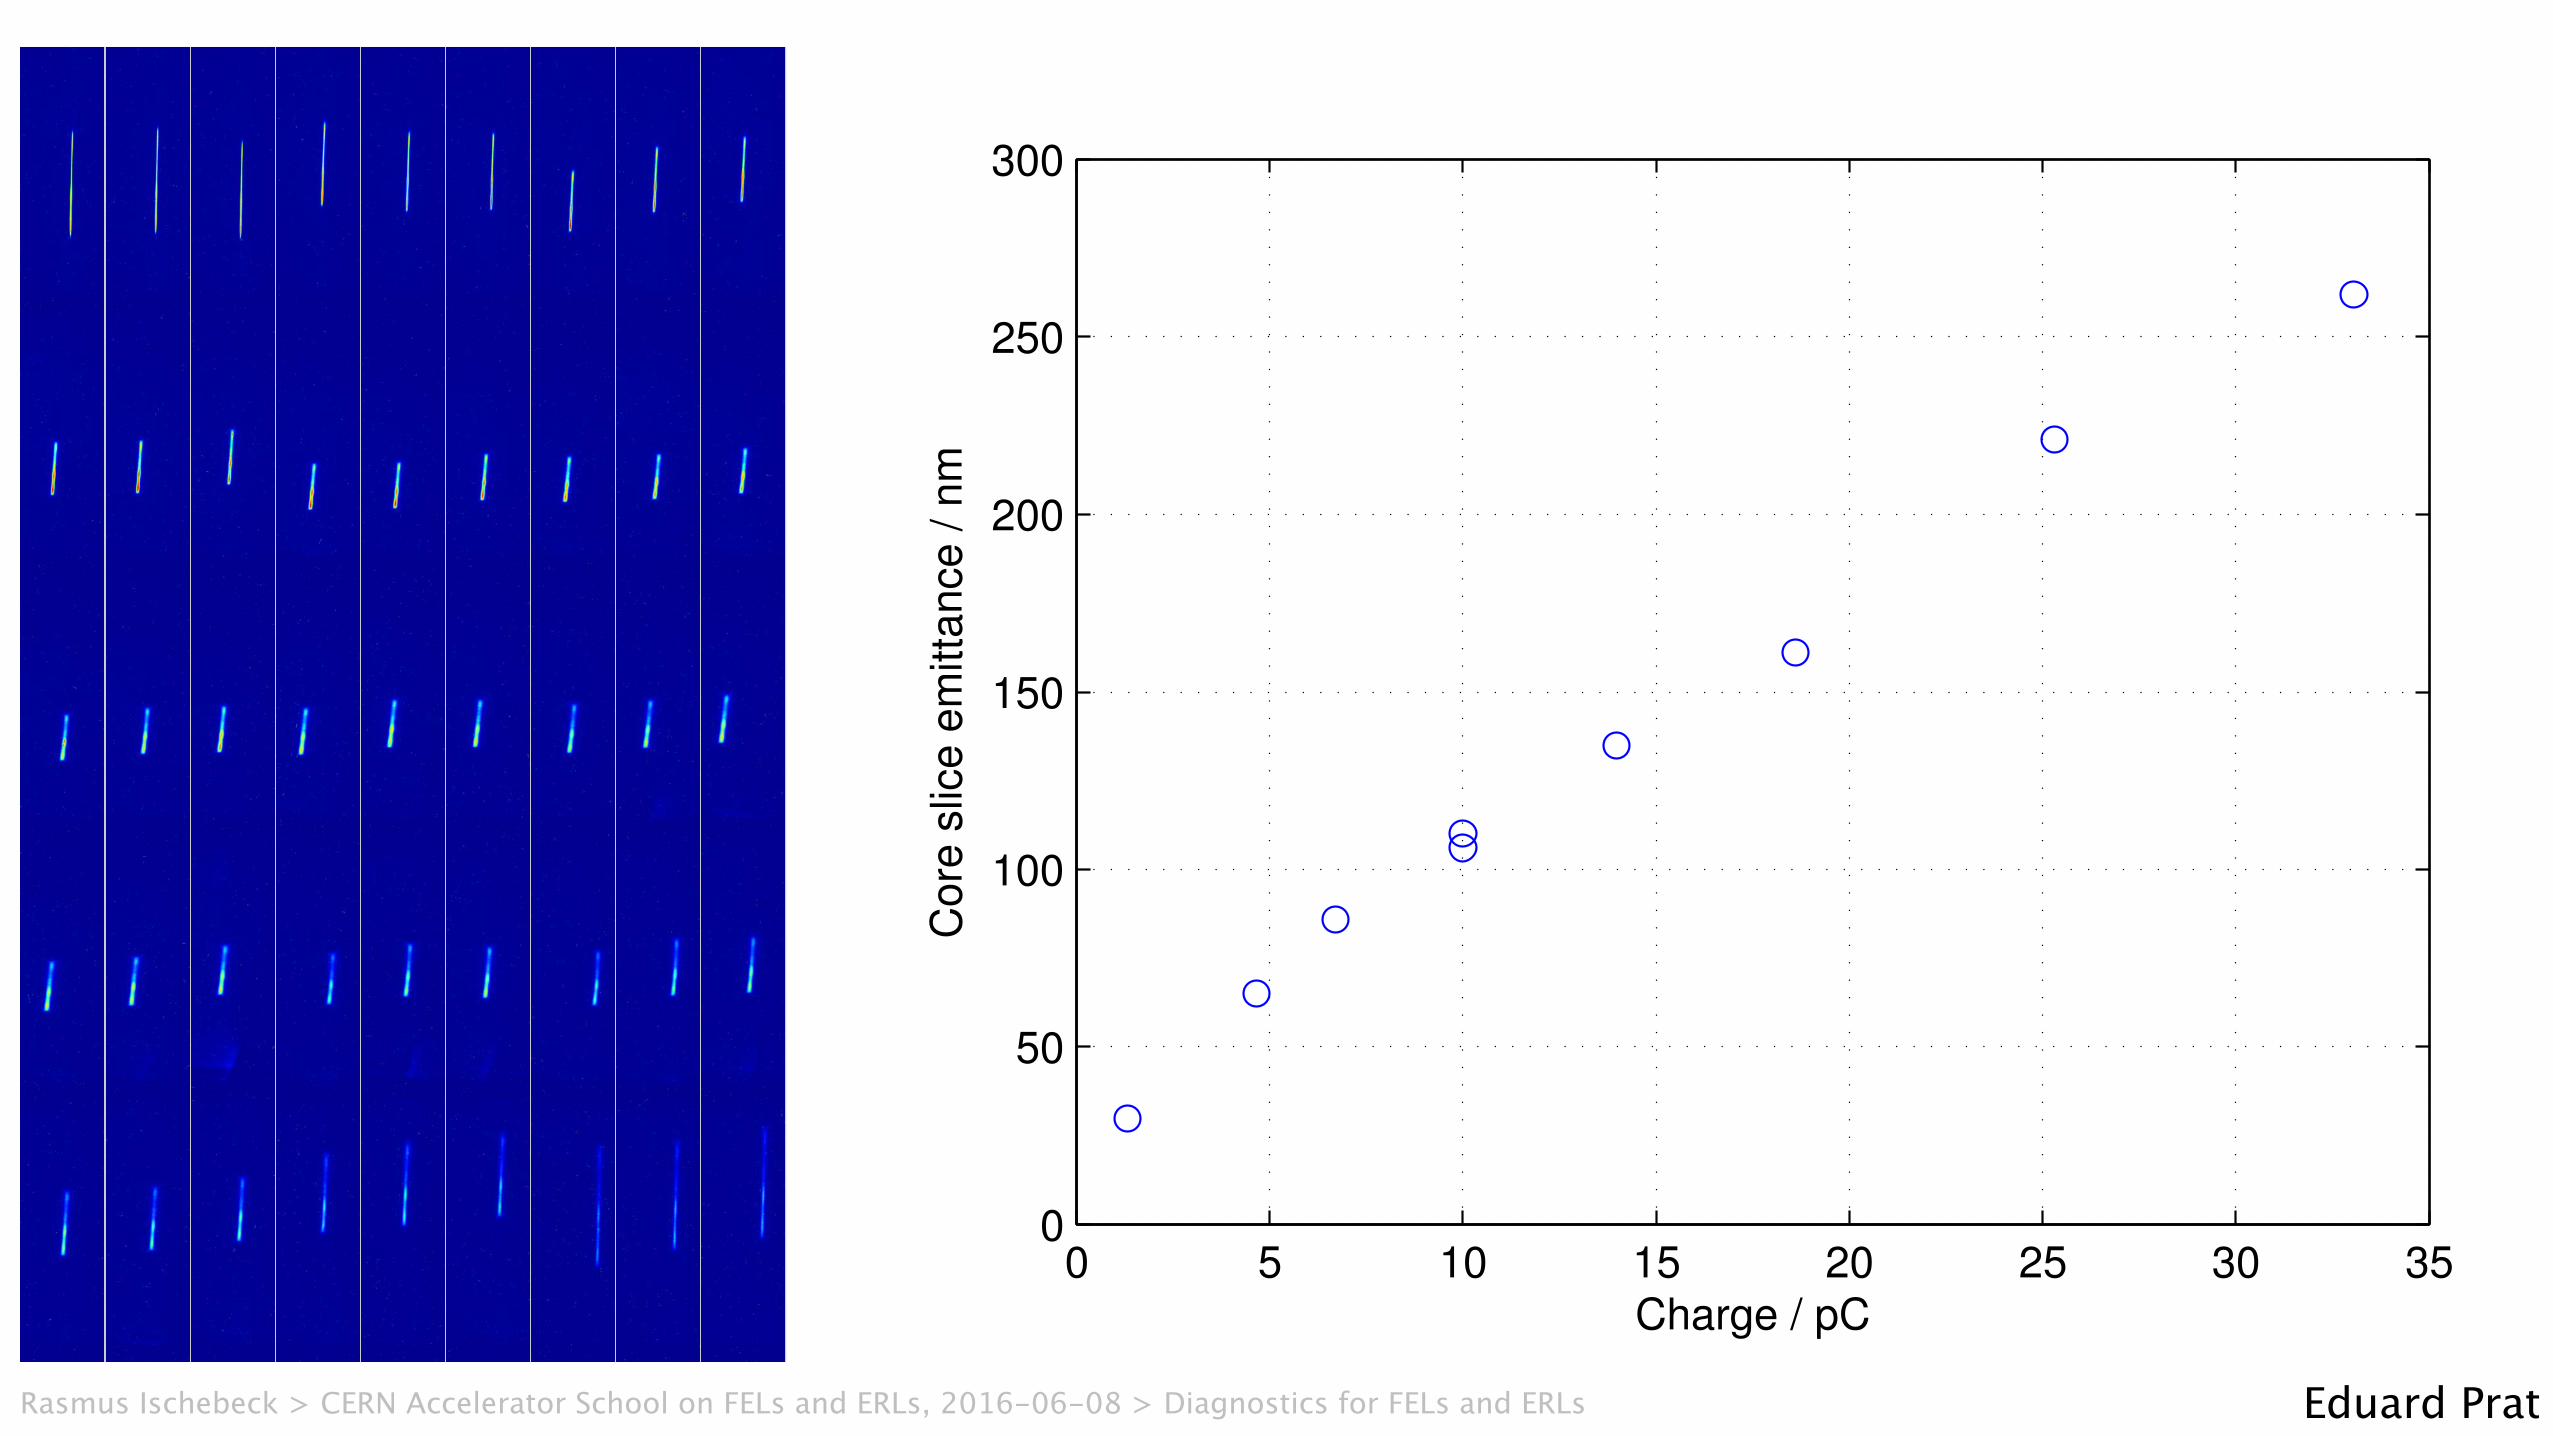
0 5 10 15 20 25 30 350
50
100
150
200
250
300
Charge / pC
Core
slic
e e
mitt
ance
/ n
m
Eduard PratRasmus Ischebeck > CERN Accelerator School on FELs and ERLs, 2016-06-08 > Diagnostics for FELs and ERLs
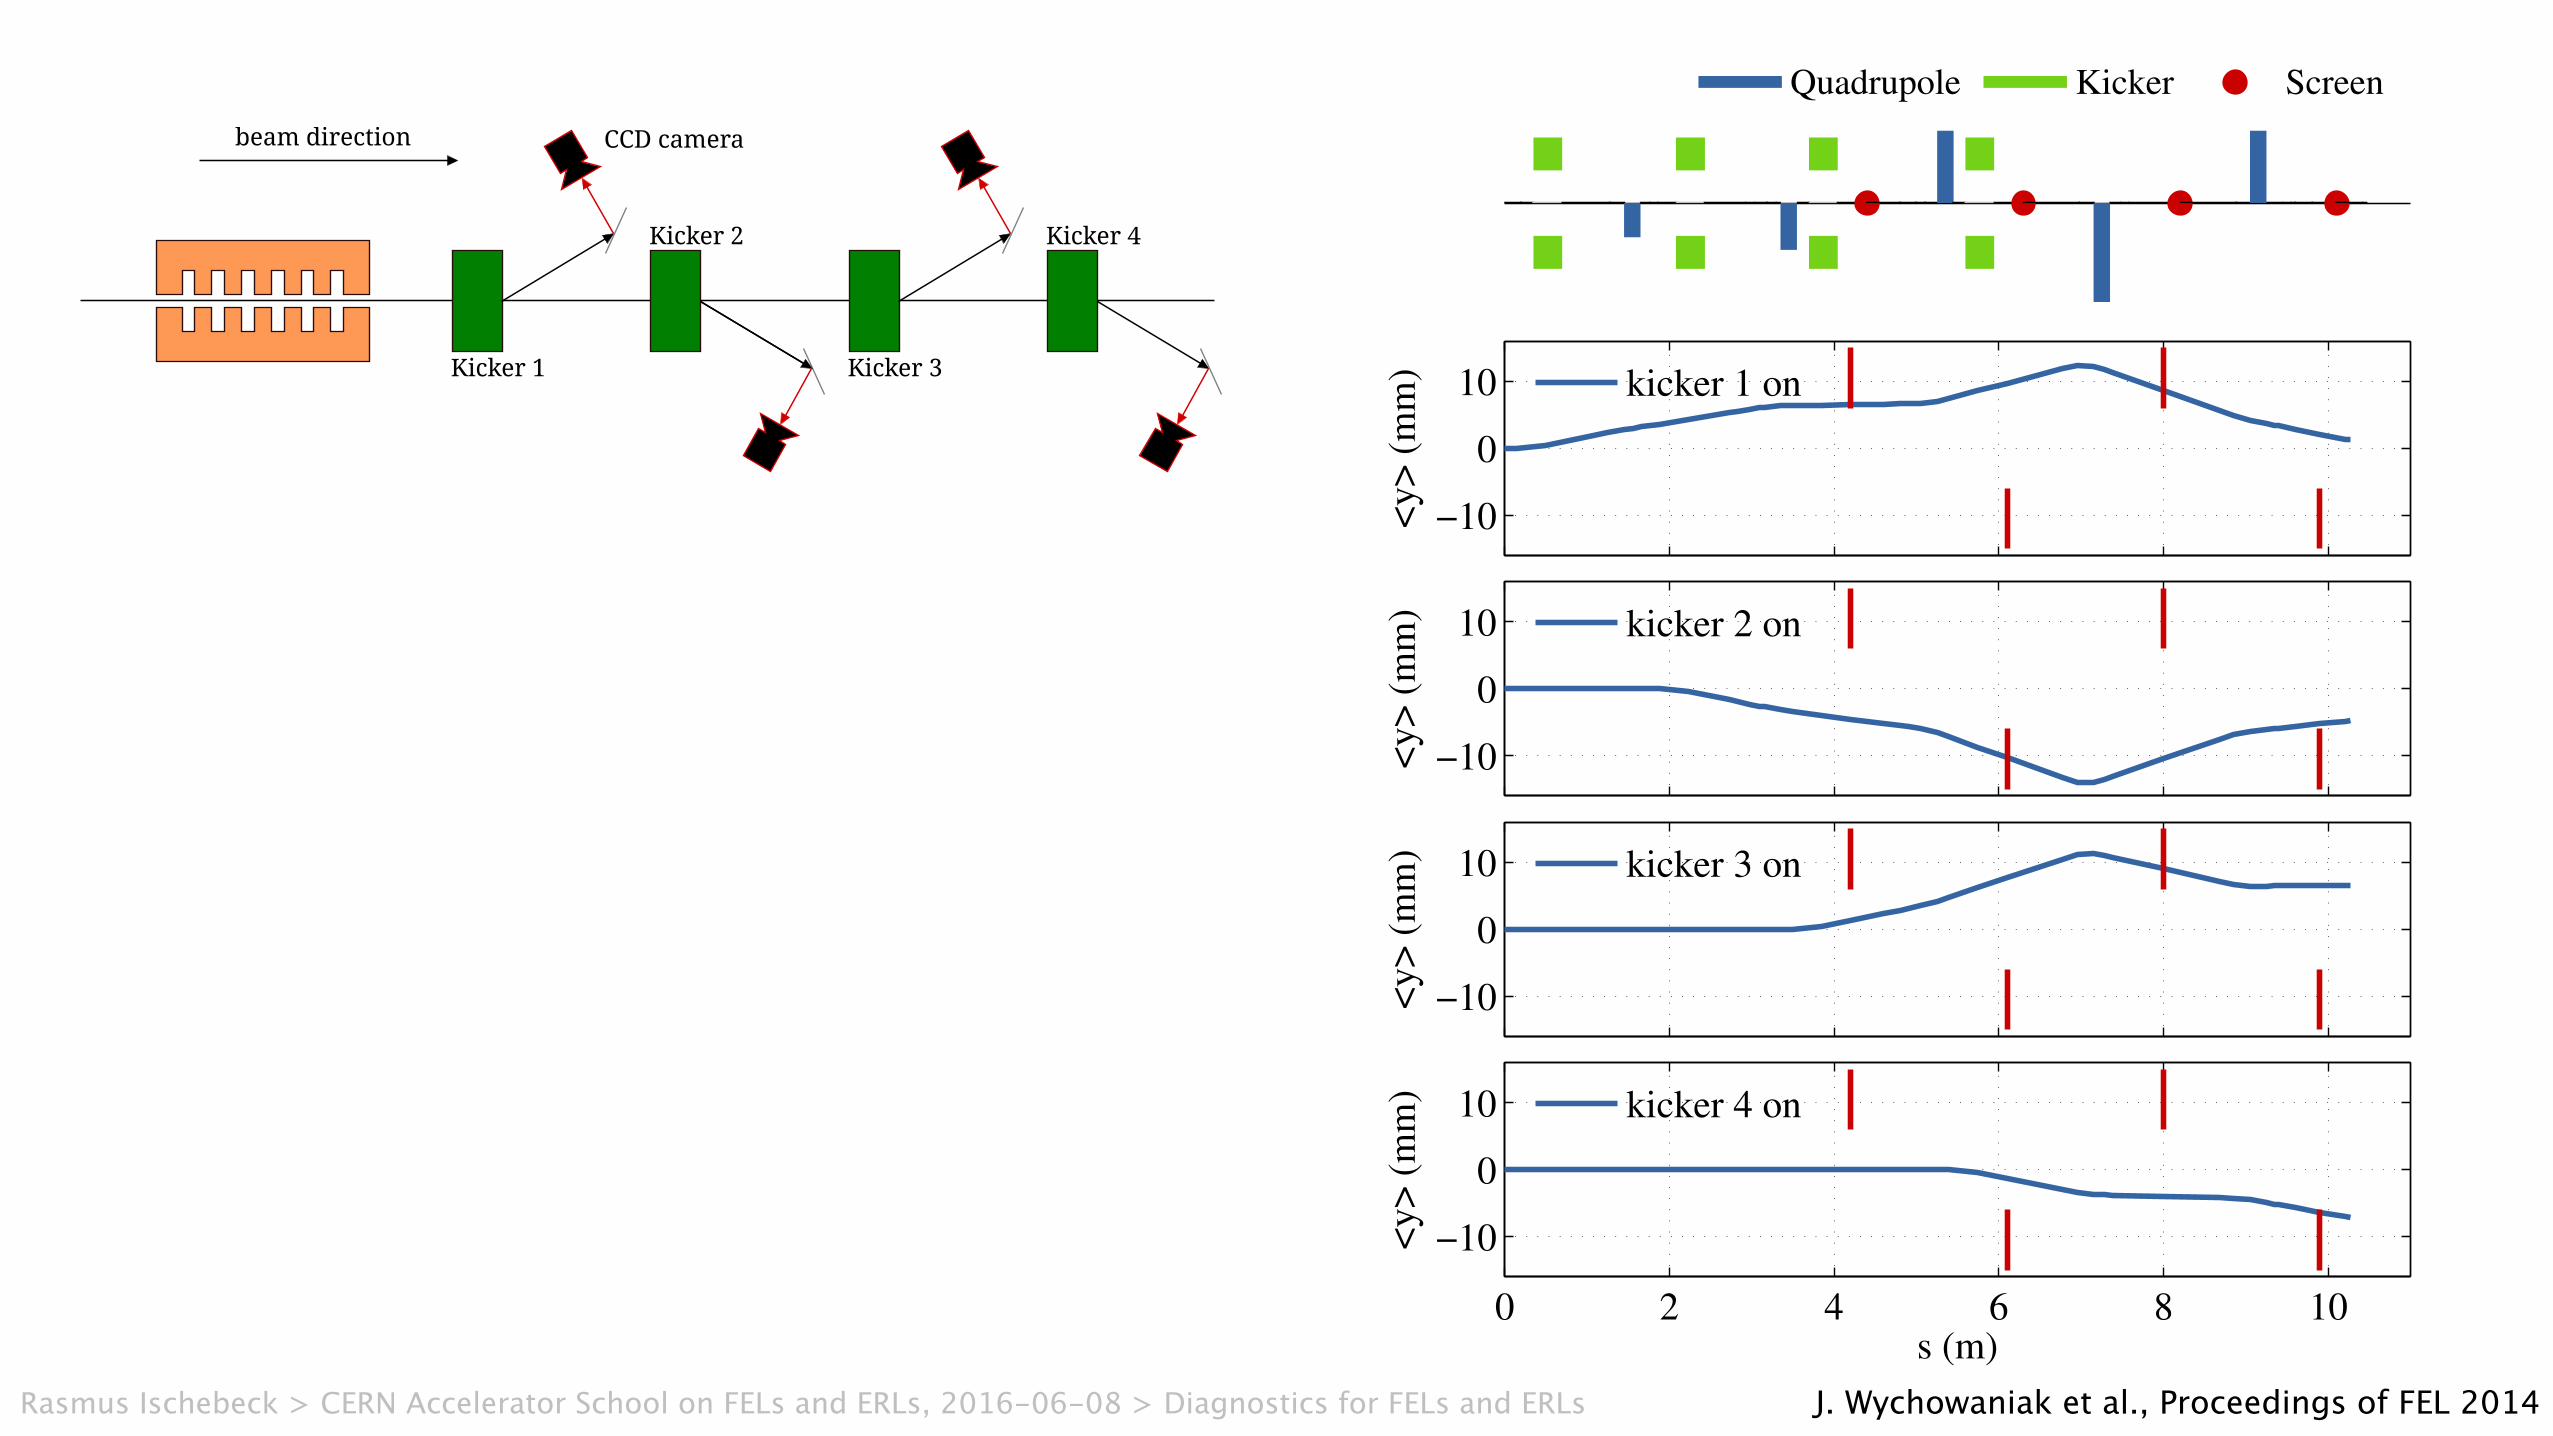
−10
0
10
<y>
(m
m)
kicker 1 on
−10
0
10
<y>
(m
m)
kicker 2 on
−10
0
10
<y>
(m
m)
kicker 3 on
0 2 4 6 8 10
−10
0
10
<y>
(m
m)
s (m)
kicker 4 on
Quadrupole Kicker Screen
THP075 Proceedings of FEL2014, Basel, Switzerland
ISBN 978-3-95450-133-5
910Cop
yrig
ht©
2014
CC
-BY-
3.0
and
byth
ere
spec
tive
auth
ors
FEL Technology and Hardware: Electron Diagnostics, Timing, Synchronization and Controls
J. Wychowaniak et al., Proceedings of FEL 2014
DESIGN OF TDS-BASED MULTI-SCREEN ELECTRON BEAMDIAGNOSTICS FOR THE EUROPEAN XFEL
J. Wychowaniak∗
DMCS, Technical University of Łódź, Łódź, PolandCh. Gerth, M. Yan
Deutsches Elektronen-Synchrotron DESY, Hamburg, Germany
Abstract
Dedicated longitudinal electron beam diagnostics is essen-tial for successful operation of modern free-electron lasers.Demand for diagnostic data includes the longitudinal bunchprofile, bunch length and slice emittance of the electronbunches. Experimental setups based on transverse deflect-ing structures (TDS) are excellent candidates for this purpose.At the Free-Electron Laser in Hamburg (FLASH), such alongitudinal bunch profile monitor utilizing a TDS, a fastkicker magnet and an off-axis imaging screen, has been putinto operation. It enables the measurement of a single bunchout of a bunch train without affecting the remaining bunches.At the European X-ray Free-Electron Laser (XFEL) multi-screen stations in combination with TDS are planned to beinstalled. In order to allow for flexible measurements of lon-gitudinal bunch profile and slice emittance, a configurabletiming and trigger distribution to the fast kicker magnets andscreen stations is required. In this paper, we discuss variousoperation patterns and the corresponding realization basedon MTCA.4 technology.
INTRODUCTIONThe performance of a hard X-ray free-electron laser (FEL),
such as the European XFEL, depends critically on the trans-verse emittance of the electron beam [1]. Hence, it is impor-tant to generate electron beams with lowest possible emit-tance [2, 3] and efficiently preserve the emittance throughacceleration and longitudinal bunch compression. Measure-ment and control of the transverse emittance is crucial for theoptimisation and operation of the FEL as the beam emittancemay be degraded due to non-linear effects, e.g. emission ofcoherent synchrotron radiation (CSR) or micro-bunchinginstabilities [4].
As the FEL amplification process takes place locallywithin longitudinal bunch slices, measurements of time-resolved properties, i.e. slice emittance, rather than time-averaged properties, i.e. projected emittance, are of interest.Excellent candidates for the measurement of the slice emit-tance with single-bunch resolution are transverse deflectingstructures (TDS) [4, 5]. The electron bunch is streaked intransverse direction by the TDS and imaged with an imagingscreen. The slice emittance can then be measured in theplane perpendicular to the streak direction by changing thephase advance between the TDS and the imaging screen.This can be achieved by either changing quadrupole currents
between the TDS and imaging screen (quad-scan method)or by employing several screens (multi-screen method) [6].A disadvantage of this direct time-domain method is that theemittance of the diagnosed bunch is drastically degraded dueto the scatter process in the imaging screen and the bunchcannot be used for FEL operation.
CONCEPTUAL LAYOUT OF THE SLICEEMITTANCE MONITOR SETUP
The super-conducting accelerator of the European XFELwill operated with RF macro pulses of up to 650 µs at a repe-tition rate of 10 Hz. Each RF macro pulse can be filled with atrain of up to almost 3000 bunches at a maximum repetitionrate of 4.5 MHz. This offers the possibility of using severalbunches of each bunch train for on-line measurements. Ageneric layout of a slice emittance monitor, employing aTDS followed by four fast kicker magnets and four screenstations equipped with off-axis screens, is depicted in Fig. 1.Four electron bunches out of the bunch train are streakedby the TDS and then deflected by the fast kicker magnetsonto the off-axis screens without disturbing FEL operationof the remaining bunches in the bunch train. A longitudinalbunch profile monitor, comprising one kicker magnet andone off-axis screen, has been commissioned successfully atthe Free-Electron Laser in Hamburg (FLASH) [7].
beam direction CCD camera
Kicker 1
Kicker 2
Kicker 3
Kicker 4
Figure 1: Generic layout of a slice emittance monitor.
At the European XFEL, installation of slice emittancemonitors is foreseen at three different locations (see Fig. 2):in the injector and after the second and third bunch compres-sor chicane. Each TDS is followed by a matching sectionand a FODO lattice in which four screen stations are incorpo-rated [8]. The screen stations will be equipped with off-axisscintillation screens made of 200 µm thick LYSO:Ce [9].The scintillation screens will be installed at an angle of 0◦
with respect to the beam axis and imaged under 45◦ by aCCD camera in Scheimpflug arrangement. Micro-bunchinginstabilities can lead to the emission of coherent optical tran-sition radiation (COTR) at the boundary of vacuum and thescintillator [10]. The imaging angle has been chosen to sup-
Proceedings of FEL2014, Basel, Switzerland THP075
FEL Technology and Hardware: Electron Diagnostics, Timing, Synchronization and Controls
ISBN 978-3-95450-133-5
909 Cop
yrig
ht©
2014
CC
-BY-
3.0
and
byth
ere
spec
tive
auth
ors
Rasmus Ischebeck > CERN Accelerator School on FELs and ERLs, 2016-06-08 > Diagnostics for FELs and ERLs
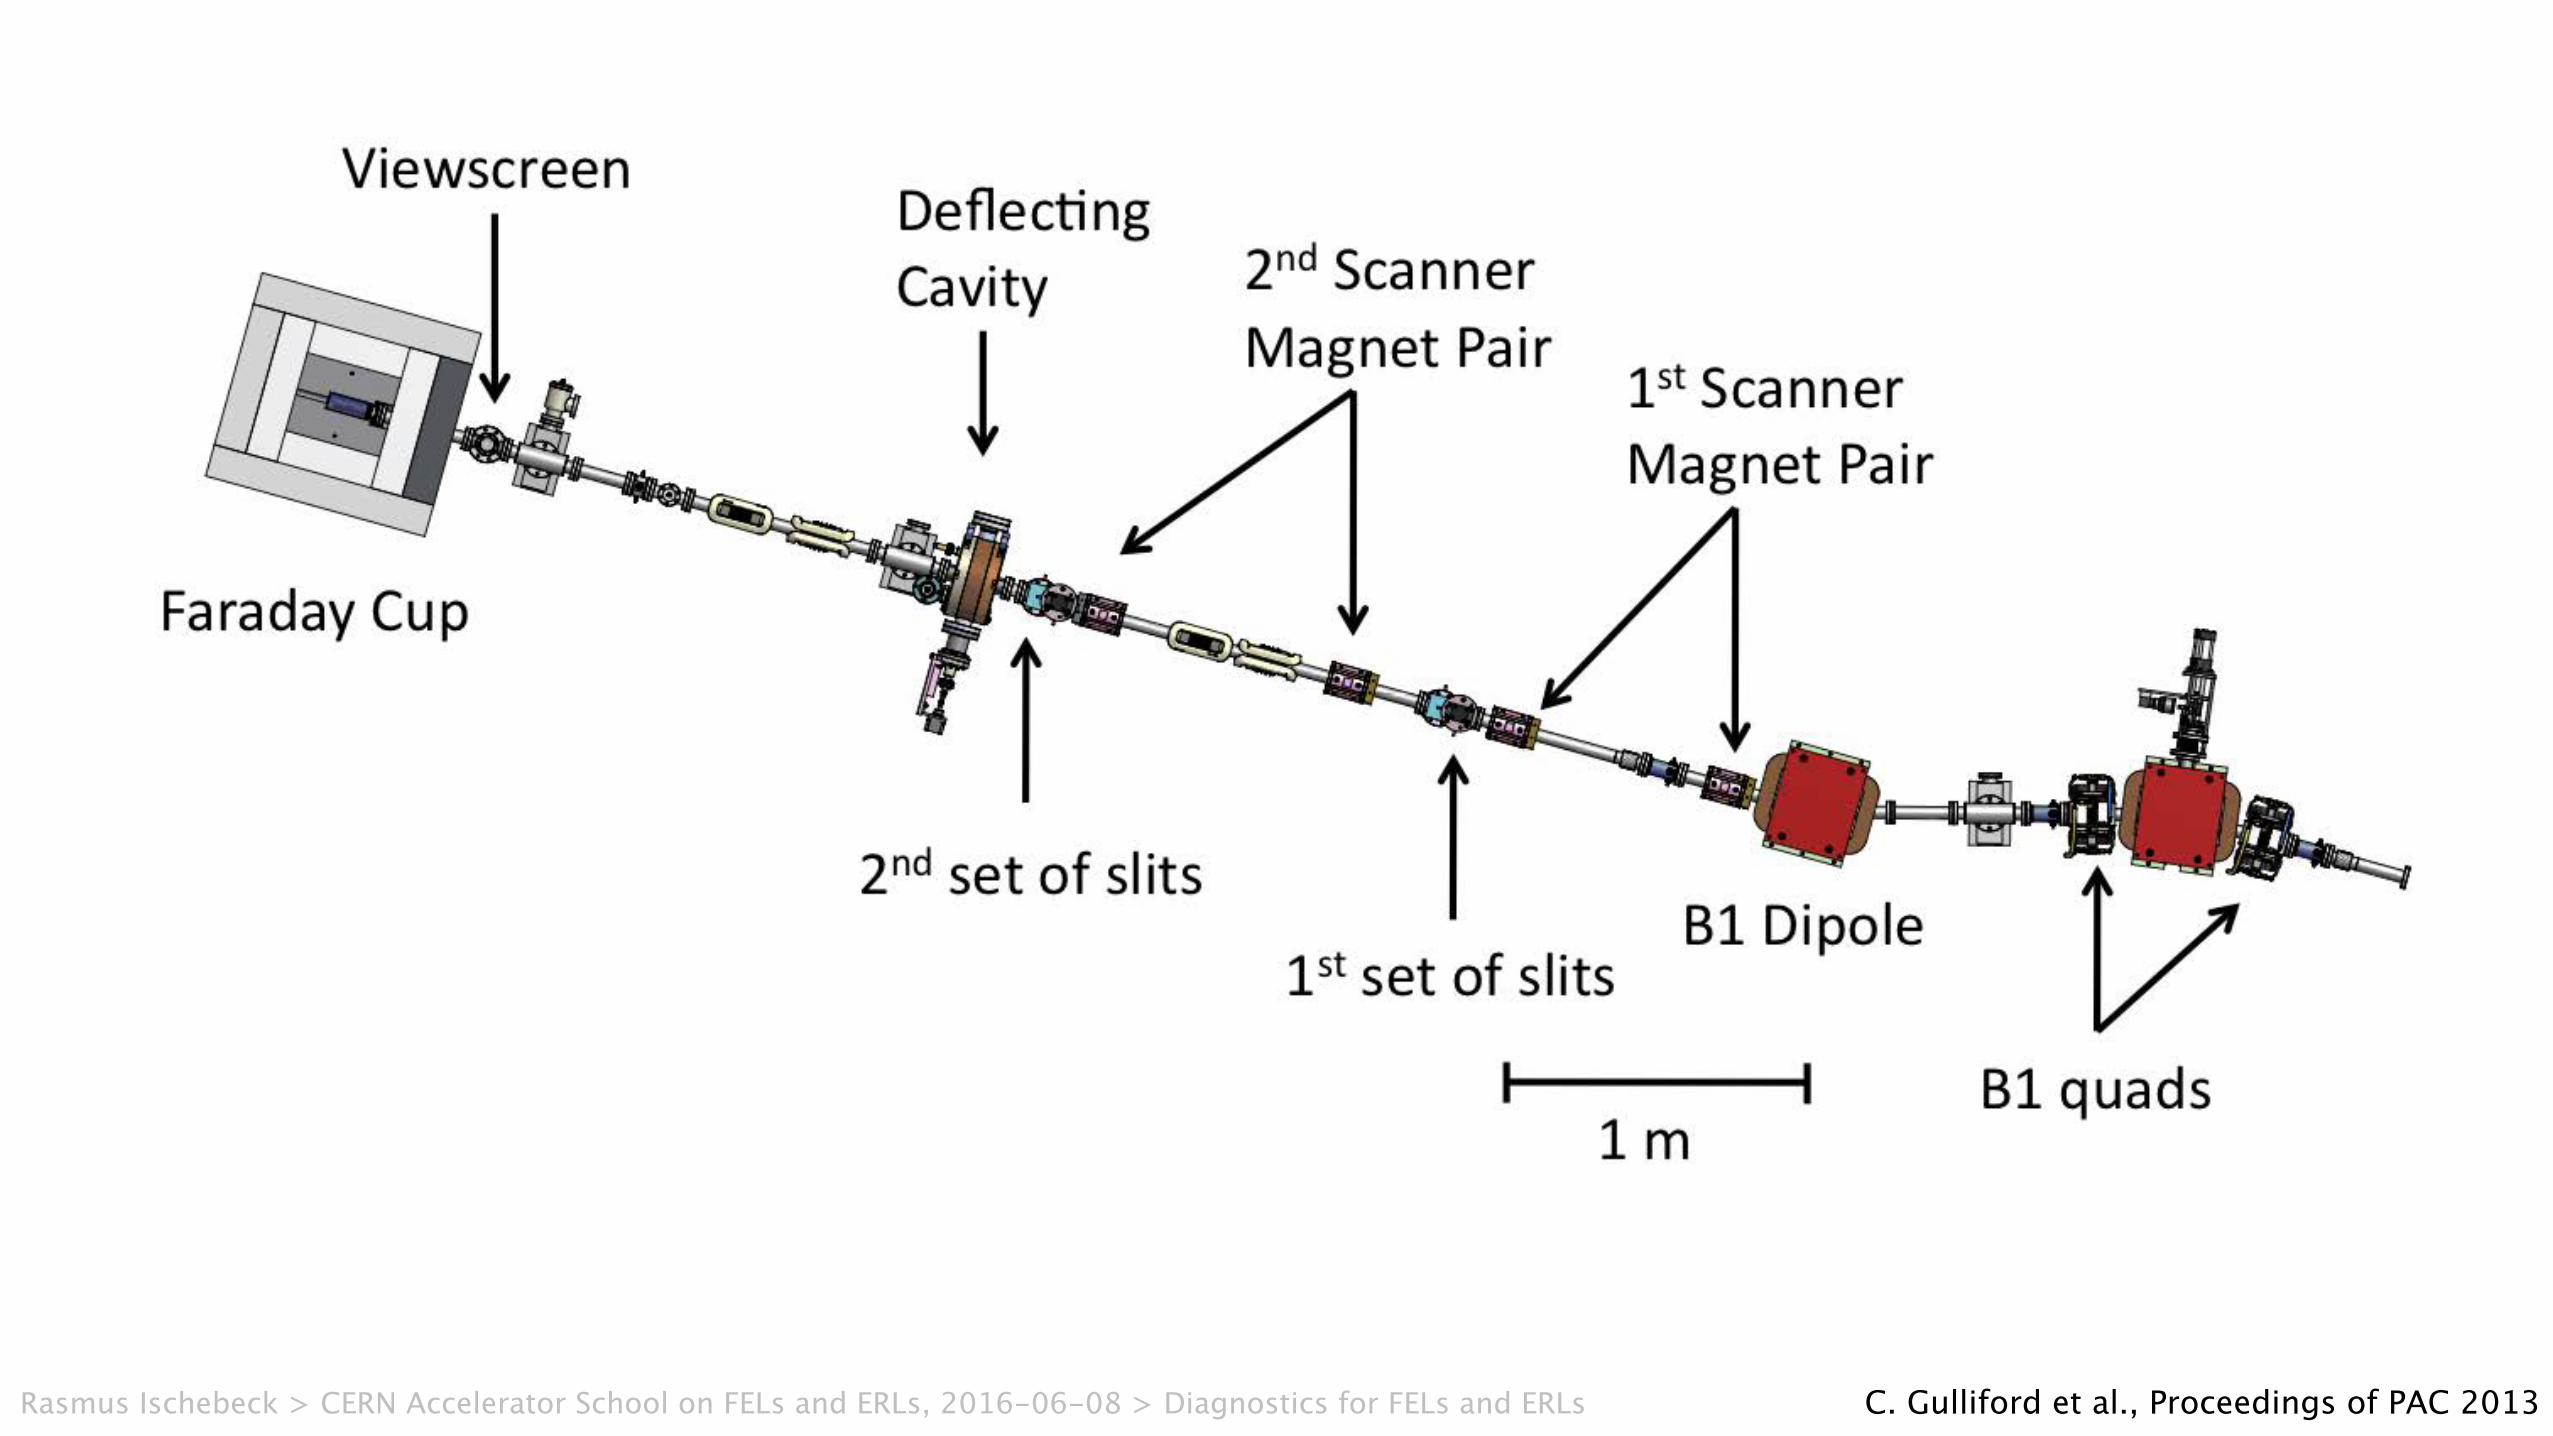
Figure 1: Top view of the B1 injector merger section showing the emittance measurement system.
with 8 ps rms length. Two settings, for 19 pC and 77 pC perbunch respectively, were derived from one optimization so-lution for 50 pC bunch charge, as this particular optics set-ting kept the beam sizes reasonably small through the entireinjector. The final settings were loaded into the injector andthe measured projected emittance was minimized by scan-ning both solenoid currents and adjusting the intensity cutoff value in the measured transverse laser profile.
MEASUREMENTSData sets for 19 pC per bunch and 77 pC per bunch, cor-
responding to 25 mA and 100 mA average current whenoperating with the full 1.3 GHz repetition rate, were taken.Each data set consists of a measurement of the projectedhorizontal and vertical phase spaces, the time-resolved hor-izontal phase space, and the energy spread distribution. Alldata was taken at the end of the merger section exceptthe energy spread data, which was measured near the en-trance to the merger. From the projected phase spaces, thehorizontal and vertical emittances as a function of beamfraction were computed. Similarly, from the time-resolvedphase space data, the slice emittance was computed as afunction of beam fraction, as well as the current profilealong the bunch.
Tables 2 and 3 give the measured and simulated pro-jected horizontal and vertical emittances for 19 (77) pC perbunch, respectively. The measured 19 (77) pC/bunch hori-zontal and vertical projected 100% emittances agreed withthe GPT model to within 6 (5) % and 25 (8) %, respec-tively. Similarly, the measured horizontal and vertical 90%emittances agreed with GPT to within 21 (16) % and 27(16) %, respectively. We point out that the measured hor-izontal and vertical 100%, 90%, and core emittances obeythe expected scaling law ✏
n
/ pq. Also of note is the fact
the horizontal core emittance for 77 pC meets the injectordesign specification for an ERL. In the vertical plane, boththe 90% and core emittance meet this specification.
In order to satisfy the injector design requirements, itwas important to verify that the emittance values were mea-
Table 4: Simulated and Measured RMS Energy Spread asa Function of Bunch Charge
Data Type GPT Simulation Measurement19 pC/bunch, A4 0.16% 0.14± 0.01%19 pC/bunch, B1 0.12% N/A77 pC/bunch, A4 0.27% 0.26± 0.01%77 pC/bunch, B1 0.21% N/A
sured with an acceptable bunch length (�t
3 ps). The rmsbunch length was computed from the instantaneous cur-rent of each bunch measured with the time-resolved mergerEMS. The rms bunch lengths for the 19 (77) pC per bunchsettings were measured to be 2.1±0.1 (3.0±0.2) ps, respec-tively, while GPT gave bunch lengths of 2.2 (3.1) ps, re-spectively. The agreement between measurement and GPTwas within 5% in both cases.
The last quantity measured was the rms energy spread.To do so, the beam was sent through the A4 straight section,followed by a single dipole and viewscreen in the C2 sec-tion. Table 4 shows the simulated and measured rms energyspread in the straight section, as well as simulated values inthe B1 merger. While the energy spread was not directly inthe merger section, the agreement found between measure-ment and simulation for emittance and bunch length lead usto conclude that the values measured in the straight sectionat least provide an upper bound on the energy spread in themerger, following the same trend found in the simulationdata.
CONCLUSION AND DISCUSSIONThe projected and time-resolved phase spaces at the end
of the Cornell ERL injector merger have been measuredand simulated using the space charge code GPT for 19 pCand 77 pC bunch charges. In addition, the energy spreadwas measured in the straight section of the machine. Over-all, we found excellent agreement between measurementand simulation. For both bunch charges, the agreement be-
Proceedings of PAC2013, Pasadena, CA USA WEOAA4
02 Light Sources
T02 - Electron Sources and Injectors
ISBN 978-3-95450-138-0
707 Cop
yrig
htc �
2013
CC
-BY-
3.0
and
byth
ere
spec
tive
auth
ors
C. Gulliford et al., Proceedings of PAC 2013Rasmus Ischebeck > CERN Accelerator School on FELs and ERLs, 2016-06-08 > Diagnostics for FELs and ERLs
Rasmus Ischebeck
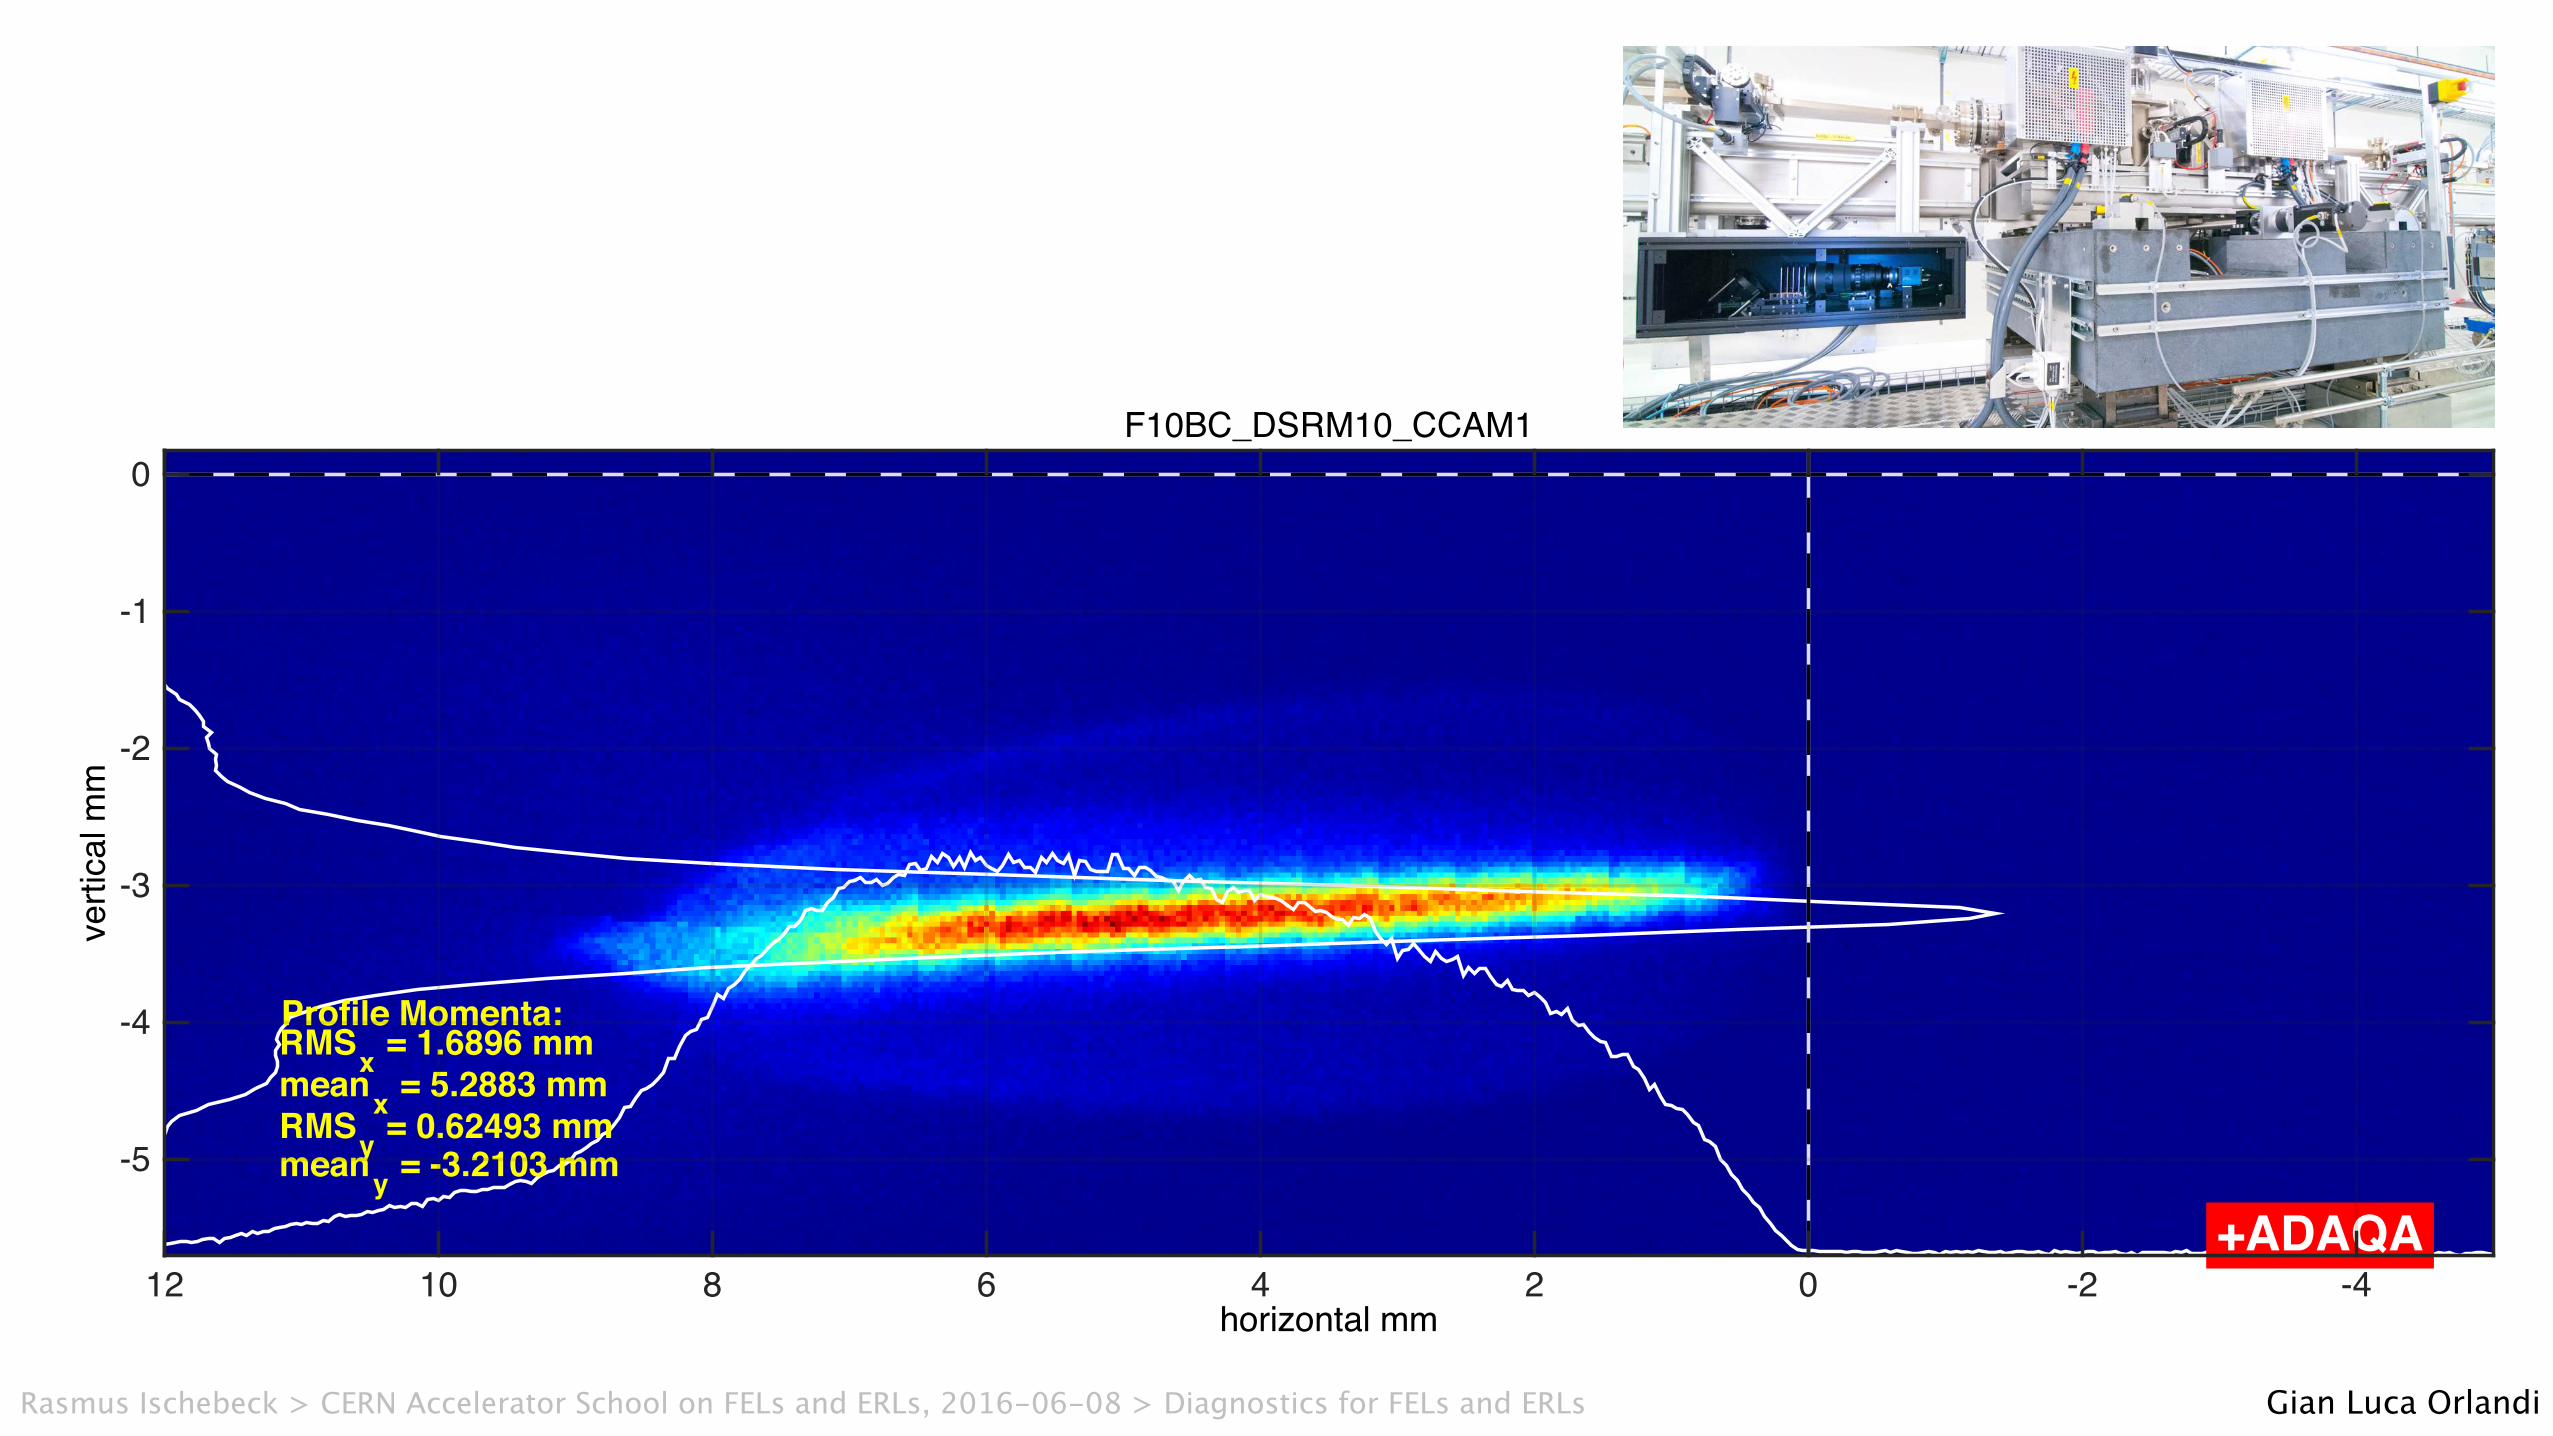
F10BC_DSRM10_CCAM1
Profile Momenta:RMSx = 1.6896 mmmeanx = 5.2883 mmRMSy = 0.62493 mmmeany = -3.2103 mm
+ADAQAhorizontal mm
-4-2024681012
verti
cal m
m
-5
-4
-3
-2
-1
0
Gian Luca OrlandiRasmus Ischebeck > CERN Accelerator School on FELs and ERLs, 2016-06-08 > Diagnostics for FELs and ERLs
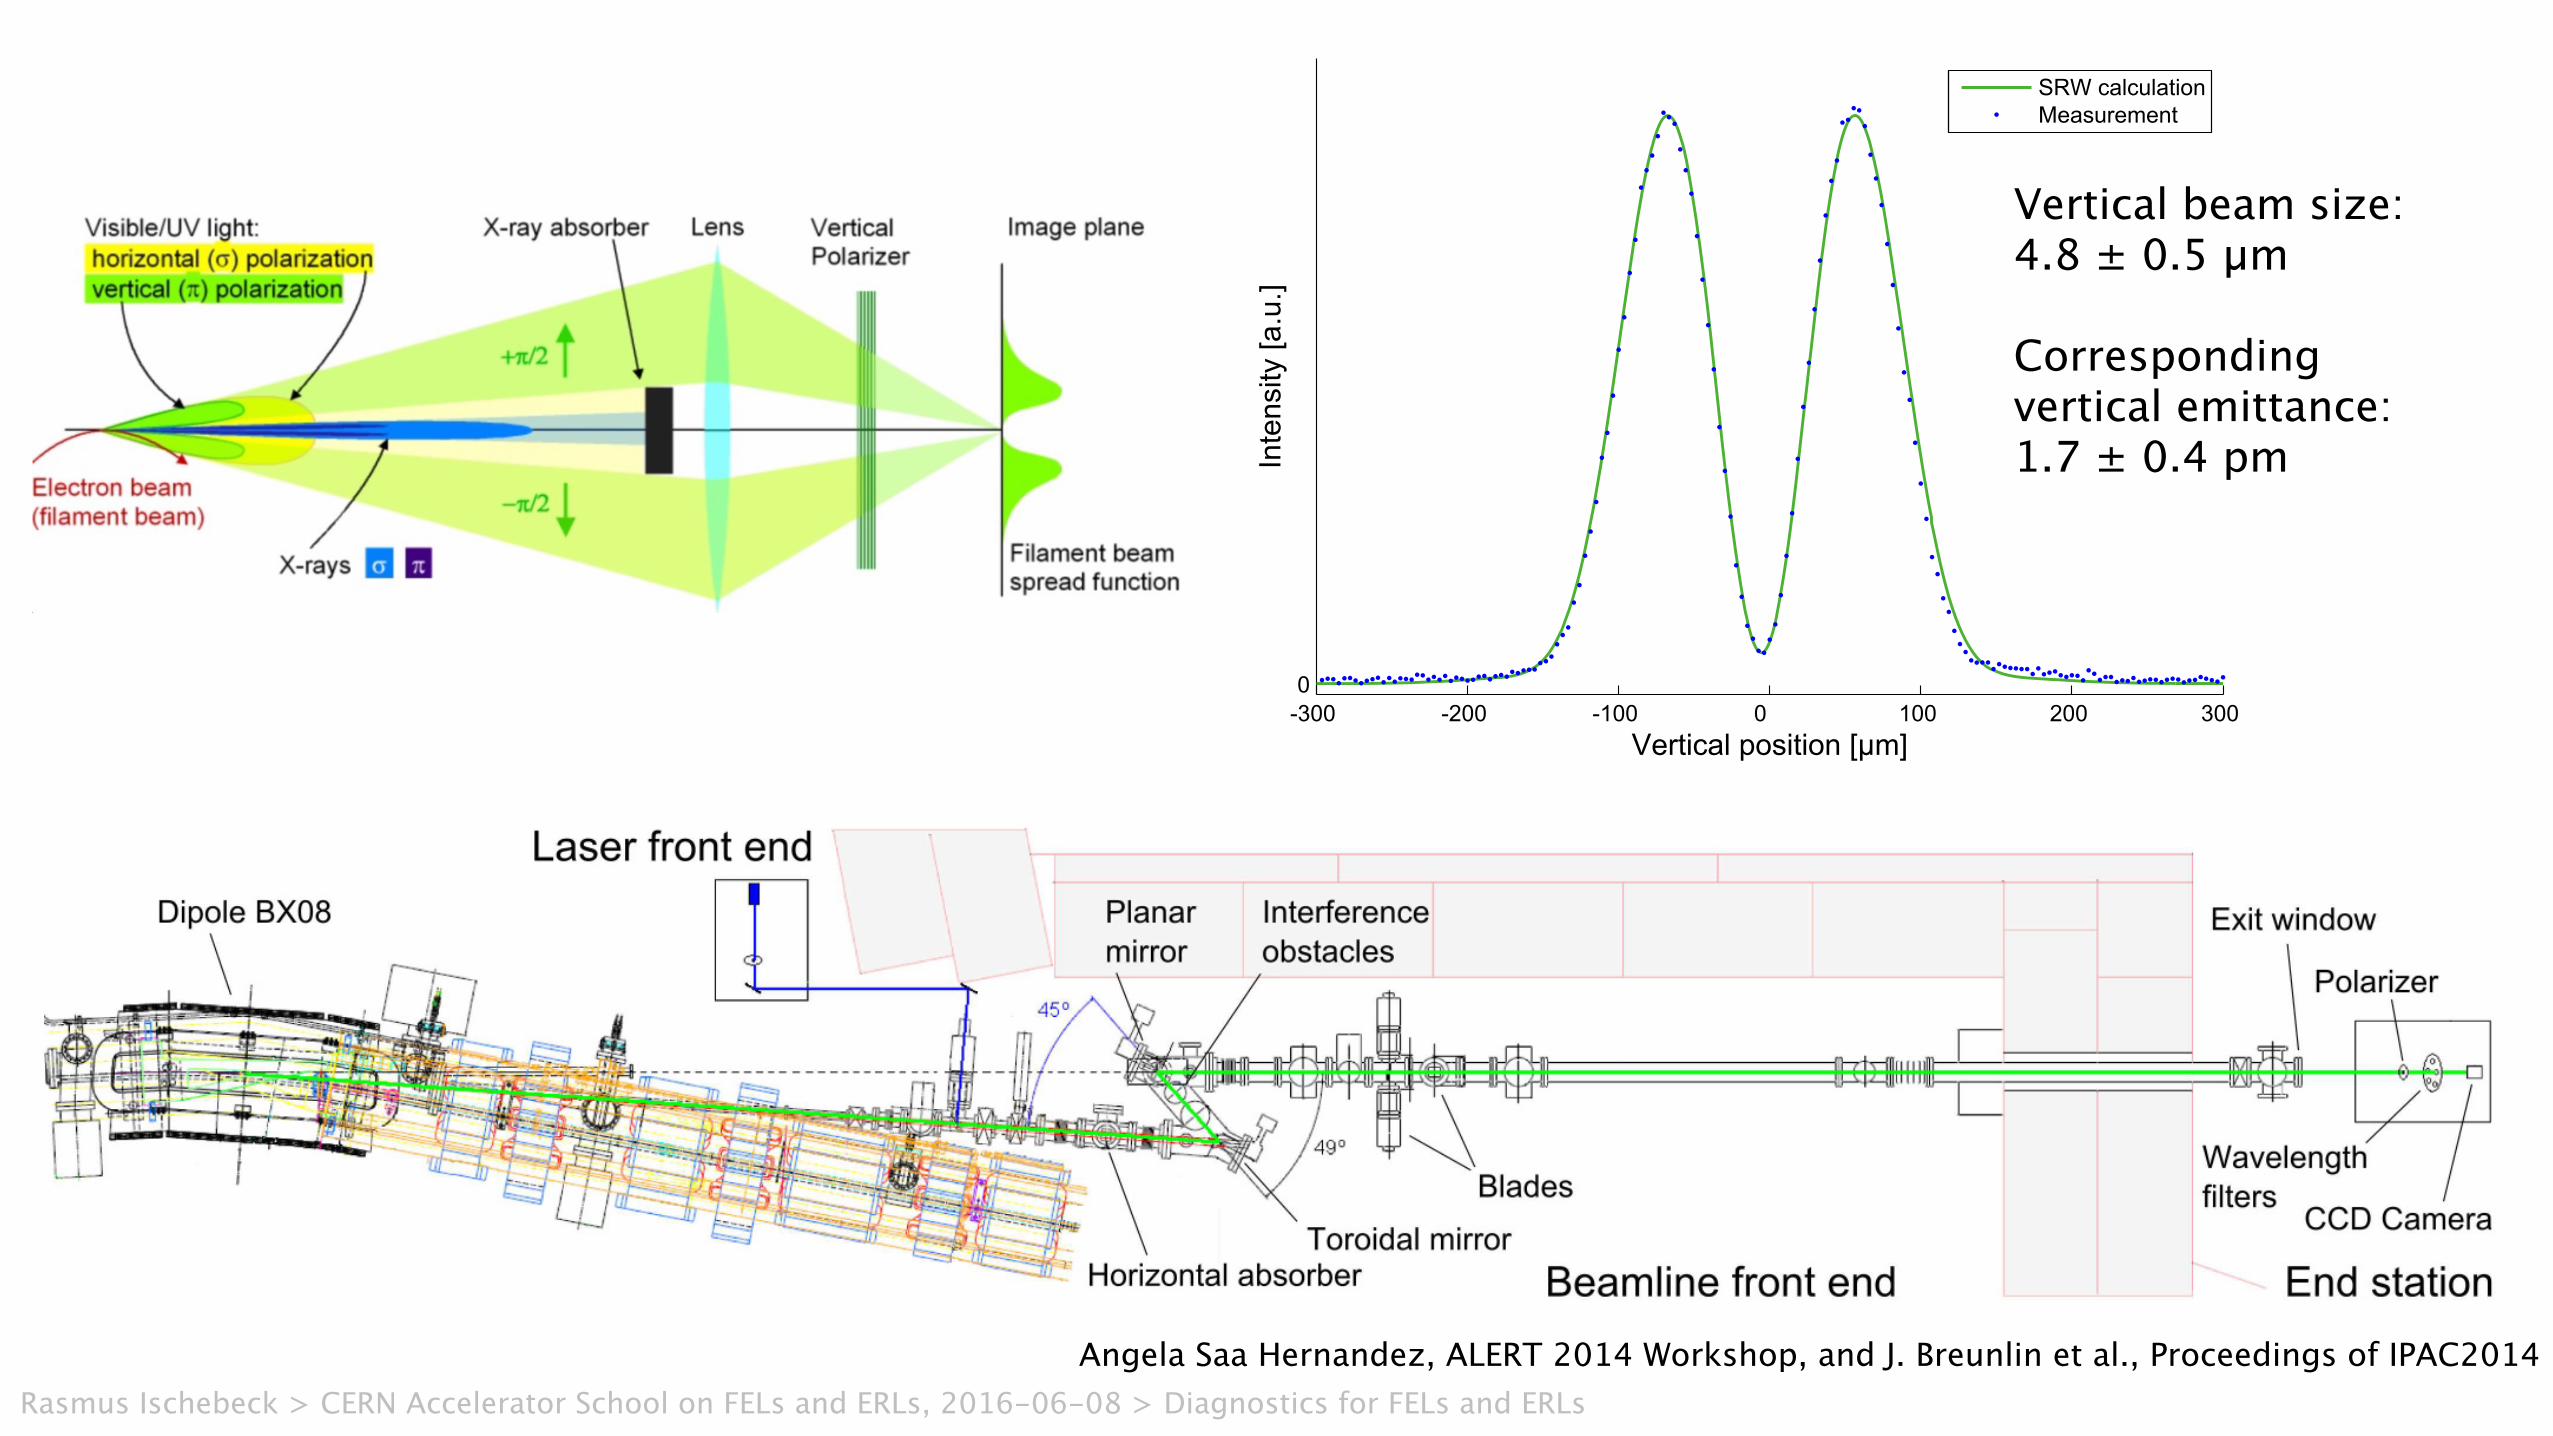
Figure 2: Layout of the new SLS diagnostic beamline (X08DA). Schematic of the end station.
a pivoted support that provides two rotational degrees offreedom for angular adjustment of the mirror. A planarmirror, also mounted on a gimbal mount, directs the SRto the CCD camera which is located outside the radiationshielding for better accessibility. The optical path lengthfrom the toroidal mirror to the image plane is 7.460 m. Thisresults in a optical magnification of the beamline of −1.450.
Table 1: Toroidal Mirror Specifications
Material SiliconSize 76 mm x 76 mmSurface quality (p-v) λ/30 (λ = 632.8 nm)Large radius 6592 mmSmall radius 5627 mmIncident angle 22.5◦ (0.3927 rad)Focal length (h/v) 3045 mmOptical magnification −1.450
For alignment purpose the beamline is equipped withlasers, situated at the laser front end on an optical table in-side the SLS tunnel. The laser beams are guided througha pinhole and a window into the SR beamline. Via an in-coupling mirror the laser beam is aligned coaxially to (butnot simultaneously with) the SR and is guided over the opti-cal elements to the camera for detection.
WORKING PRINCIPLEWhen imaging π-polarized light the CCD camera detects
the characteristic destructive interference pattern causedby the 180◦ phase difference of the two SR lobes. The in-tensity ratio between the valley in the mid plane and thepeaks, the valley-to-peak ratio, depends on the source heighti.e. the vertical electron beam size σy . We used SRW, theSynchrotron Radiation Workshop code [9, 10], which treatsthe phenomena of SR emission, propagation and focusingstrictly within the framework of classical electrodynamicsand wave optics, in order to derive the exact dependence ofthe valley-to-peak ratio and the vertical beam size. The codecalculates the Fourier transform of the retarded potentialsof the emitting relativistic electron. The fields are propa-gated along the beamline by applying the integral theoremof Helmholtz and Kirchhoff to this Fourier transform at eachoptical element.
The interferometric method of the beam size monitor isimplemented when introducing one of the interference ob-stacles in the vicinity of the toroidal mirror into the path ofthe SR. The interferometric method does not rely solely onthe characteristic phase difference in π-polarized light and,therefore, can also be applied using σ-polarized light whichresults in a variety of complementary methods. The theoret-ical calculation and analysis of the interference pattern andthe deduction of the vertical electron beam size is done inthe same manner as for π-polarized imaging.
In addition to the vertical beam size the horizontal beamsize, being of the order of 60 µm, can be deduced from aGaussian fit and SRW based calculations.
MIRROR ALIGNMENTThe correct positioning and alignment of the toroidal
mirror is crucial for its imaging performance [2]. The instal-lation of the toroidal mirror onto the gimbal mount insidethe z-chamber was done with great care and assisted by thePSI alignment group. Two degrees of freedom, a tilt aboutthe horizontal (Tx ) and the vertical (Ty ) mirror axis (but nota rotation about the surface normal (R)) , can be controlledremotely. See Figure 3 for a definition of the mirror axes.
Dy
R
Tx
Dx
Ty
Figure 3: Sketch of a toroidal mirror. In our setup the rota-tions about the tilt axes Tx and Ty can be controlled remotely.A misalignment in rotation about the surface normal (R) oralong the translations (Dx and Dy ) must be excluded duringmirror installation.
This allows an on line alignment using either a laser, cou-pled into the diagnostic beamline or SR. For the planar-convex lens formerly installed, the interference pattern from
Proceedings of IPAC2014, Dresden, Germany THPME169
06 Instrumentation, Controls, Feedback & Operational AspectsT03 Beam Diagnostics and Instrumentation
ISBN 978-3-95450-132-83663 C
opyr
ight
©20
14C
C-B
Y-3.
0an
dby
the
resp
ectiv
eau
thor
s
STATUS OF THE NEW BEAM SIZE MONITOR AT SLS∗
J. Breunlin†, Å. Andersson, MAX IV Laboratory, Lund, SwedenÁ. Saá Hernández, M. Rohrer, V. Schlott, A. Streun, PSI, Villigen, Switzerland
N. Milas, LNLS, Campinas, Brazil
Abstract
The Swiss Light Source (SLS) campaign on vertical emit-tance minimization and measurement required a beam sizemonitor with the ability to verify a sub-pm·rad vertical emit-tance. This corresponds to a beam height of less than 4 µm.Within the TIARA Work Package ’SLS Vertical EmittanceTuning’ a new beam size monitor was designed and built.The monitor is based on the imaging of the π-polarized syn-chrotron radiation (SR) in the visible and UV spectral ranges.Besides imaging, the monitor provides interferometric meth-ods using vertically or horizontally polarized SR. With thesecomplementary methods the consistency of beam size mea-surements is verified. An intermediate configuration of themonitor beamline using a lens as the focusing element hasbeen commissioned in 2013. With this setup a vertical beamsize of 4.8 ± 0.5 µm, corresponding to a vertical emittanceof 1.7 ± 0.4 pm·rad has been measured. During 2014 themonitor was commissioned in its final configuration witha toroidal mirror. The use of reflective optics allows widerbandwidth imaging and, thus, higher intensity.
INTRODUCTIONIn 2008 a beam size monitor was built at SLS for the deter-
mination of the vertical beam emittance. This monitor usesthe so-called π-polarization method [1] to determine thevertical beam size from vertically polarized (π-polarized)vis-UV synchrotron radiation (SR) imaged onto a CCD cam-era.
During an emittance minimization campaign supportedby the TIARA work package 6 [2] a vertical beam sizeof 3.6 ± 0.6 µm, corresponding to a vertical emittance of0.9 ± 0.4 pm, was measured using this beam size monitor,reaching its resolution limit [3]. The campaign includedthe design and construction of an improved second monitor.Besides the π-polarization method the new beam size mon-itor at SLS was designed to provide another measurementmethod: the creation of interference from either verticallyor horizontally polarized (σ-polarized) SR with a horizontalobstacle. The vertical beam size is then deduced from thedetected interference pattern. The availability of these com-plementary methods on the new beam size monitor enablesthe cross-checking of measurement results. A techniquefor beam size measurements using interference was alreadyused at KEK with a double slit setup and σ-polarized SR [4].
The commissioning of the new monitor started in thebeginning of 2013. A lens was used as the focusing ele-∗ Work partially funded by the European Commission under the
FP7-INFRASTRUCTURES-2010-1/INFRA-2010-2.2.11 project TIARA(CNI-PP). Grant agreement no 261905† [email protected]
ment in this so-called intermediate configuration [5–7]. Indedicated low emittance machine shifts at the SLS a verti-cal beam size of 4.8 ± 0.5 µm was measured utilizing bothavailable methods [8], see Figure 1.
-300 -200 -100 0 100 200 3000
Vertical position [µm]
Inte
nsity
[a.u
.]
SRW calculationMeasurement
Figure 1: Vertical profile of π-polarized synchrotron radi-ation, imaged with the intermediate configuration using alens (blue dots). SRW calculated profile for a vertical beamsize of σy = 4.81 µm (green line).
The final monitor setup relies on a toroidal mirror as thefocusing element. The preference of a toroidal mirror overa lens is due to the advantage of reflective optics to have awavelength independent focal length. This enables a simplerchange of the imaging wavelength in practice. Furthermore,the wavelength independence of the image plane allows usto use a wider wavelength band (10 nm FWHM instead of1 nm) than with refractive optics and therefore nearly a factor10 in light intensity. Due to a delay in manufacturing ofthis mirror the commissioning of the beamline in its finalconfiguration started in January 2014. In this paper we willreport on challenges during the commissioning and presentfirst images of SR taken with the toroidal mirror.
BEAMLINE DESIGNThe beamline is designed to image the SR emitted by
the electron beam in a bending magnet by a toroidal mirroronto the detector of a CCD camera. See Figure 2 for thebeamline layout. A detailed description of the beamline isgiven in [6, 7].
The toroidal mirror is the first mirror in the z-chamber at5.146 m of optical path length from the source point in thecentral bending magnet. See Table 1 for specifications ofthe mirror. The toroidal mirror is held by a gimbal mount,
THPME169 Proceedings of IPAC2014, Dresden, Germany
ISBN 978-3-95450-132-83662C
opyr
ight
©20
14C
C-B
Y-3.
0an
dby
the
resp
ectiv
eau
thor
s
06 Instrumentation, Controls, Feedback & Operational AspectsT03 Beam Diagnostics and Instrumentation
Vertical beam size: 4.8 ± 0.5 µm
Correspondingvertical emittance:1.7 ± 0.4 pm
Angela Saa Hernandez, ALERT 2014 Workshop, and J. Breunlin et al., Proceedings of IPAC2014Rasmus Ischebeck > CERN Accelerator School on FELs and ERLs, 2016-06-08 > Diagnostics for FELs and ERLs

Rasmus Ischebeck
Time-Resolved Instrumentation
Wikimedia CommonsRasmus Ischebeck > CERN Accelerator School on FELs and ERLs, 2016-06-08 > Diagnostics for FELs and ERLs
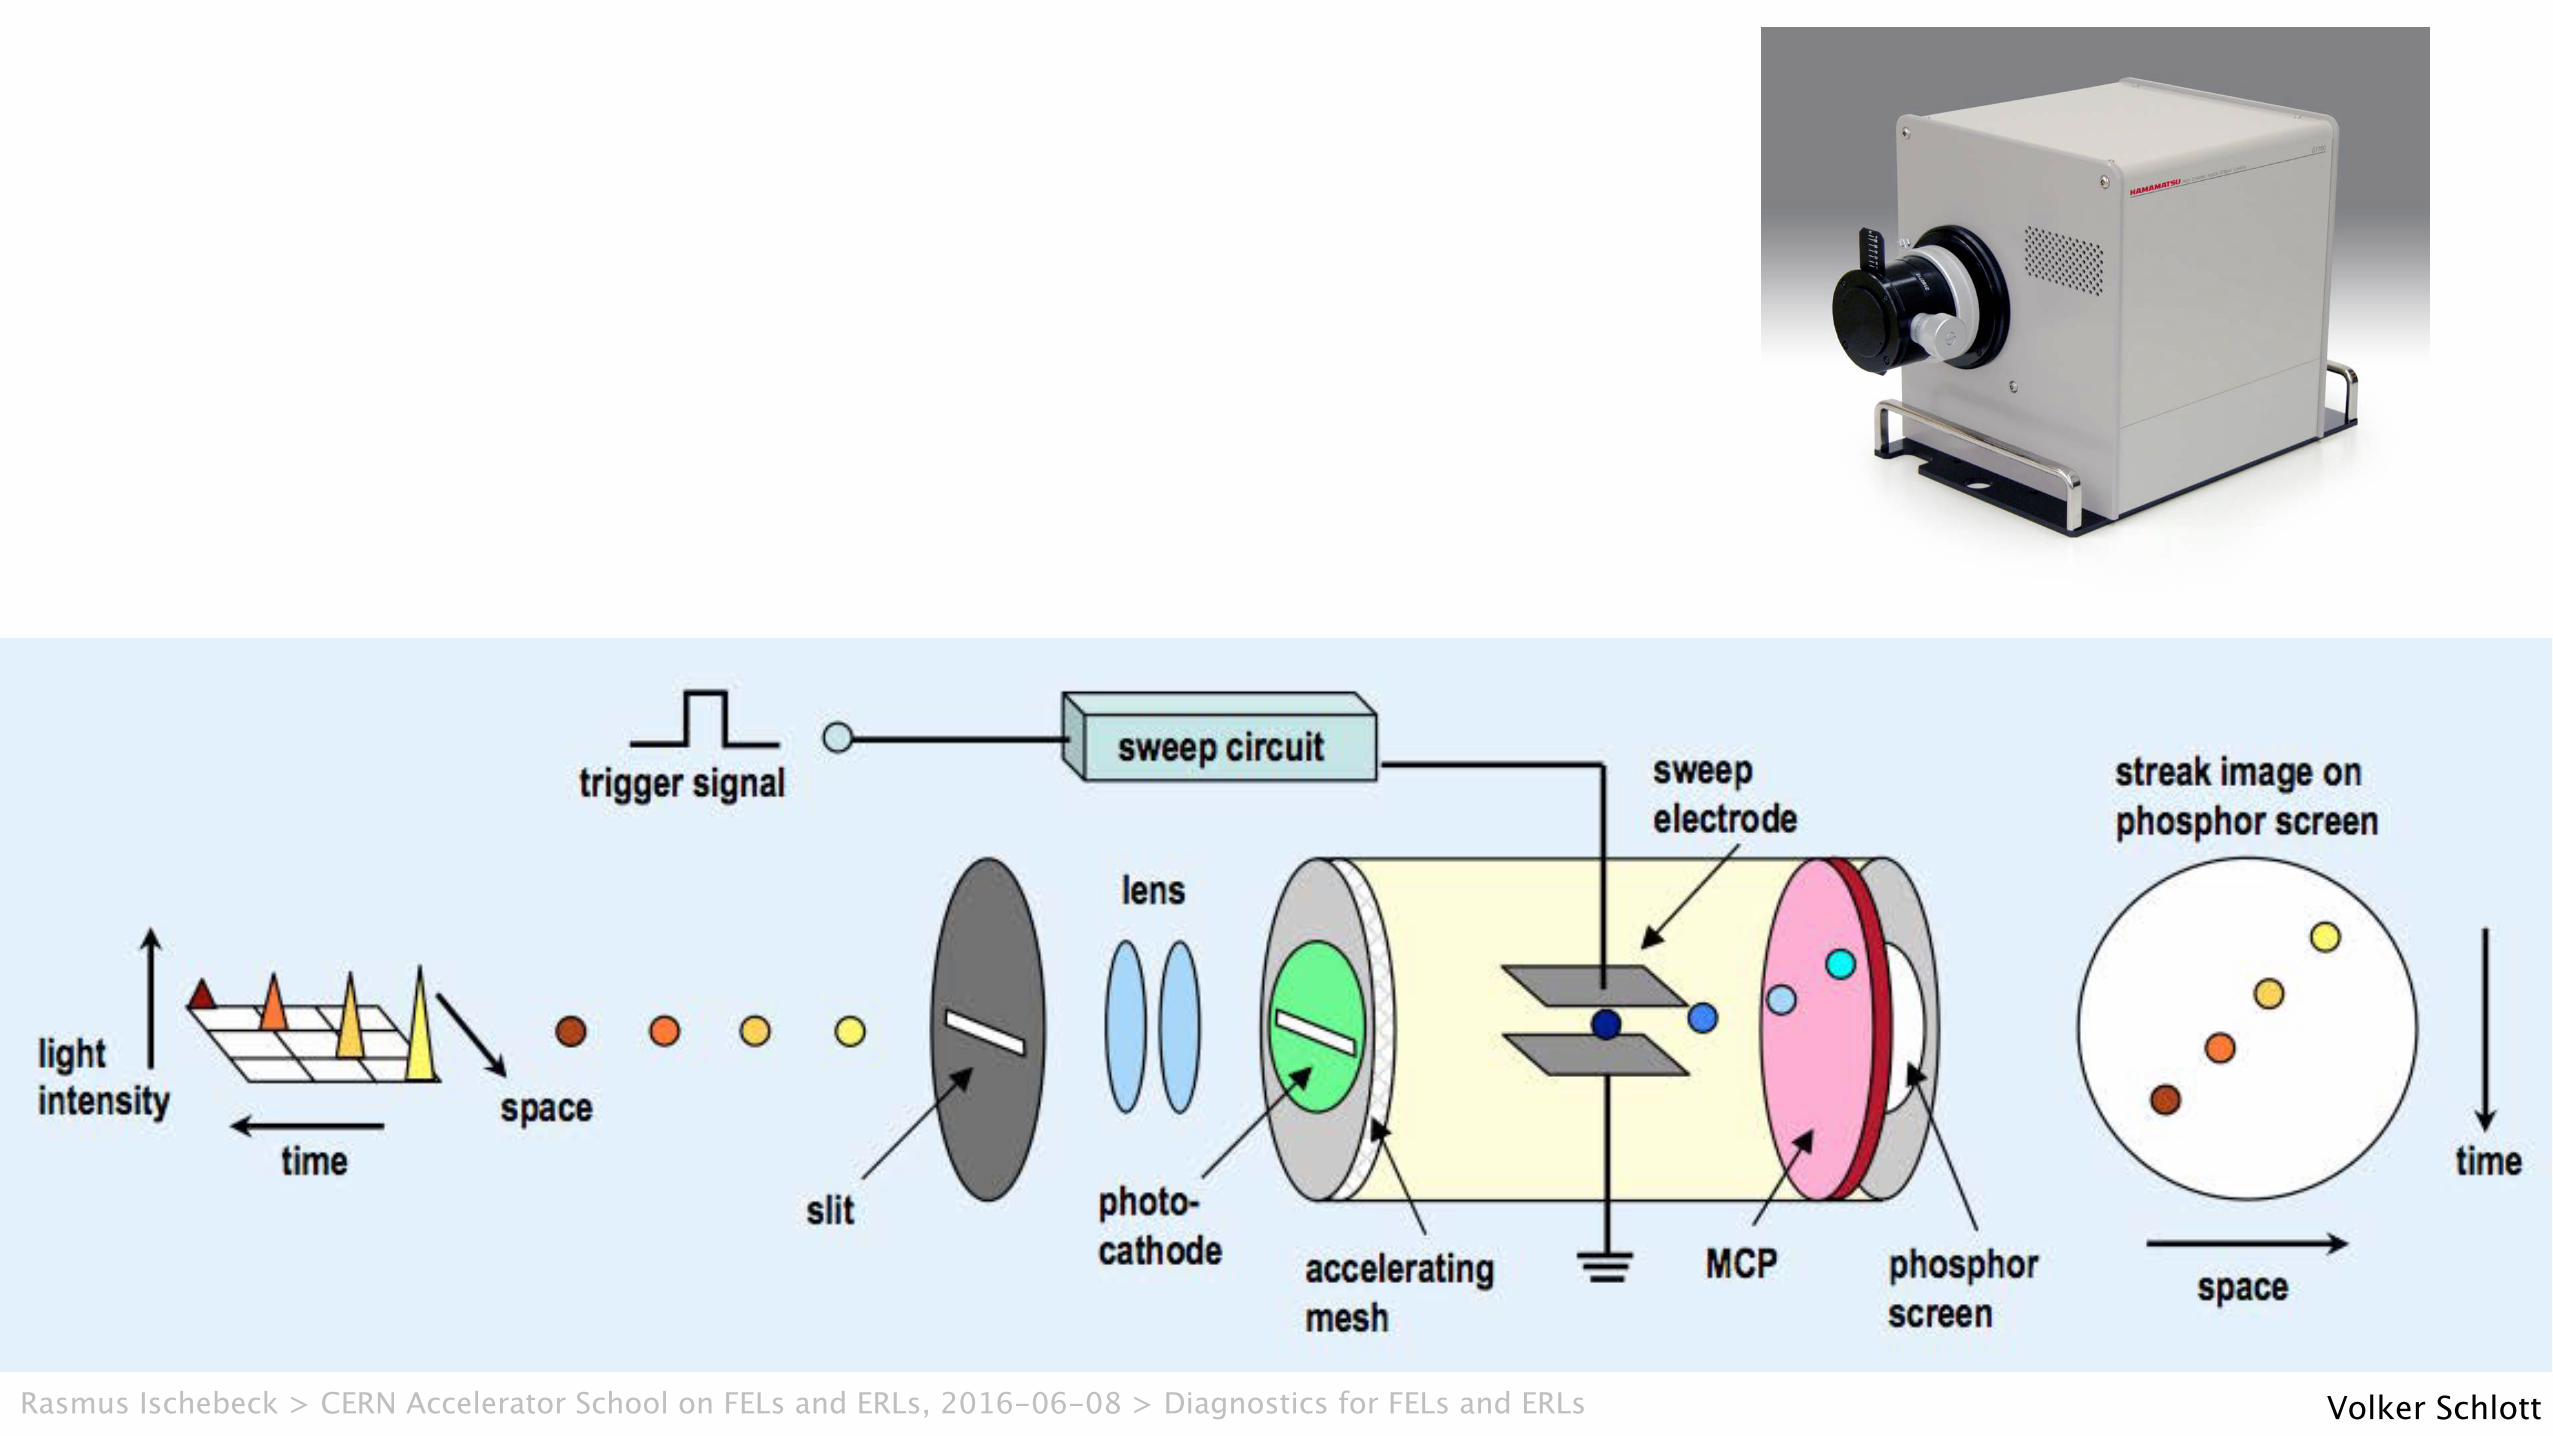
Volker SchlottRasmus Ischebeck > CERN Accelerator School on FELs and ERLs, 2016-06-08 > Diagnostics for FELs and ERLs
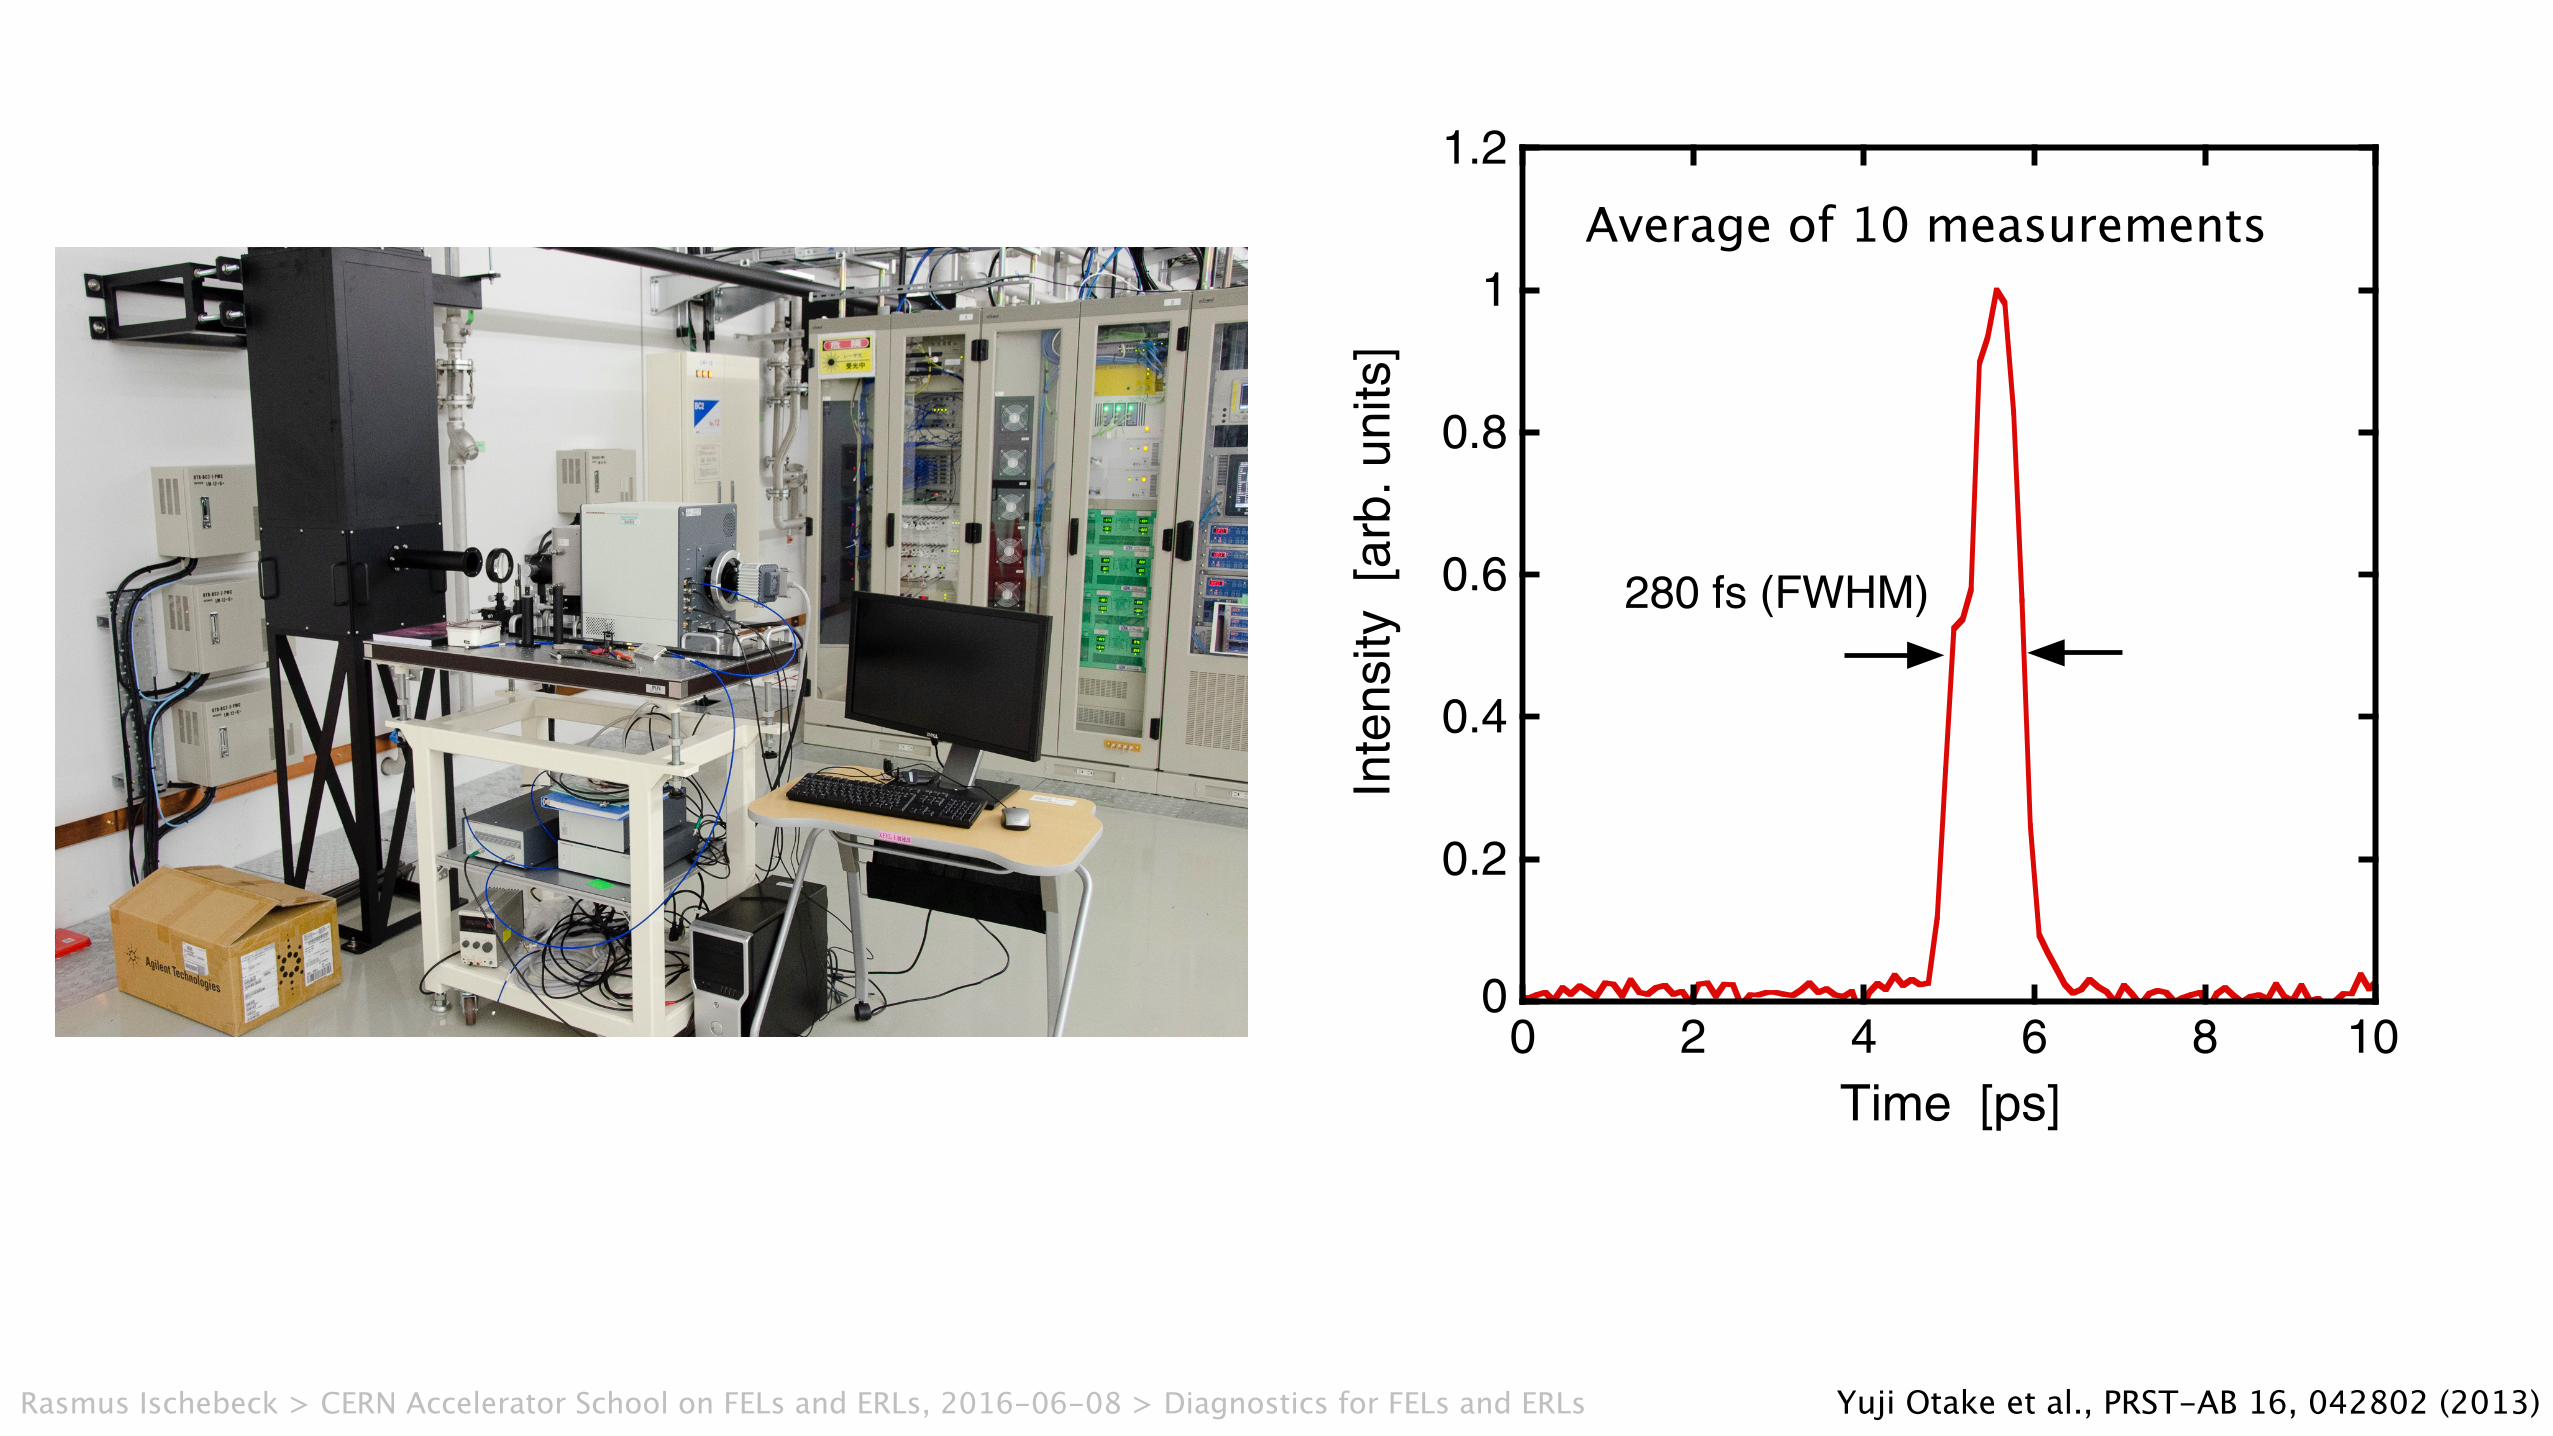
bunch length of below 300 fs. Hence, we employed theRFDEF to diagnose a 30 fs electron bunch of SACLA. Thebunch-length measurement system, as shown in Fig. 26,comprises a C-band rf deflector (RFDEF), a beam driftspace, and a high spatial resolution SCM, as mentioned inthe previous section. This RFDEF operated at 5712 MHz isdriven by a high-power rf source including a 50 MW pulseklystron.
The operating principle of the RFDEF is as follows. TheRFDEF is a backward traveling-wave structure at theoperation rf mode of HEM11. When the electron beam isinjected into the structure at an rf zero-cross phase, theRFDEF pitches the beam bunch around its center to projectan image of a longitudinal bunch structure on the screen ofthe above-mentioned SCM. The relation between the de-flection voltage, Vy, and the projected bunch length on thescreen, ly, is given by
Vy ¼lyLd
cpz
eka!z; (7)
where Ld is the drift length between the RFDEF longitu-dinal center and the surface of the SCM screen, ka is thewave number of the RFDEF, !z is the bunch length,and pz is the longitudinal momentum of the electronbunch. Vy must be 40 MV in the case of Ld ¼ 5 m
to obtain a bunch-length measurement sensitivity of200fs=mm on the screen of the SCM with a spatial reso-lution of less than 2:5 "m.To realize this measurement system, a special backward
traveling-wave accelerating structure with theHEM11-ð5=6Þ# transverse mode at 5712 MHz was devel-oped, as shown in Fig. 27. This accelerating structure hasracetrack-shape rf coupling irises to prevent rotation of thedeflection plane of the HEM11mode. The main parametersof this backward traveling-wave accelerating structure aretabulated in Table II, and the dispersion relations of the Xand Y modes in a fabrication model of the acceleratingstructure are depicted in Fig. 28. In the figure, the X and Ymodes are sufficiently separated by the iris. Furthermore,even though the ð5=6Þ# mode is employed, a group veloc-ity, vg, of about 0:02c in the accelerating structure isachieved. These rf characteristics guarantee stable high-power rf operation of the accelerating structure.
TABLE II. Rf specifications of the RFDEF.
Total deflecting voltage Vy 40 MVrf deflecting phase $a 0 degreeFractional bunch length for
x-ray oscillation!z 200 fs
Beam energy at the deflector pzc 1.45 GeVResonant frequency fa 5712 MHzType of structure CZResonant mode HEM11Phase shift per cell %D 5#=6 radGroup velocity vg=c $2:16 %Filling time Tf 0.27 "sUnloaded Q Qa 11500Transverse shunt impedance zy 13.9 M!=mLength of structure L 1:7% 2 m
0 2 4 6 8 10
Inte
nsity
[ar
b. u
nits
]
Time [ps]
280 fs (FWHM)
0
0.2
0.4
0.6
0.8
1
1.2
FIG. 25. Observed bunch-shape taken with the streak camerausing the OTR. The bunch wave form is reconstructed bystacking ten single-shot wave forms while adjusting each peakvalue timing. The bunch length is about 300 fs in FWHM.
FIG. 26. Bunch-length measurement system using the RFDEFto observe a pulse width of less than 500 fs.
FIG. 27. HEM-11-ð5=6Þ#-mode backward-traveling-wave ac-celerating structure with racetrack-shape rf coupling irises toprevent X- and Y-mode mixing.
BEAM MONITOR SYSTEM FOR AN X-RAY FREE . . . Phys. Rev. ST Accel. Beams 16, 042802 (2013)
042802-11
Yuji Otake et al., PRST-AB 16, 042802 (2013)
Average of 10 measurements
Rasmus Ischebeck > CERN Accelerator School on FELs and ERLs, 2016-06-08 > Diagnostics for FELs and ERLs

Rasmus Ischebeck: Electro-Optic Sampling of the Electron bunch in the Sub-Picosecond Pulse Source
posit
ion
/ ps
no signal head of bunch tail of bunch
-10
-5
0
5
10
-10
-5
0
5
10
-10
-5
0
5
10
-10
-5
0
5
10
-10
-5
0
5
10
-10
-5
0
5
10
S po
lariz
atio
nP
pola
rizat
ion
First resultsSignal on the Camera
posi
tion
/ ps
Adrian Cavalieri et al., PRL 94, 114801 (2005)Rasmus Ischebeck > CERN Accelerator School on FELs and ERLs, 2016-06-08 > Diagnostics for FELs and ERLs

Bernd Steffen, AFS Inc.
fs laser opticalstretcher
CCD gratings0 sc
EOP A
Rasmus Ischebeck > CERN Accelerator School on FELs and ERLs, 2016-06-08 > Diagnostics for FELs and ERLs
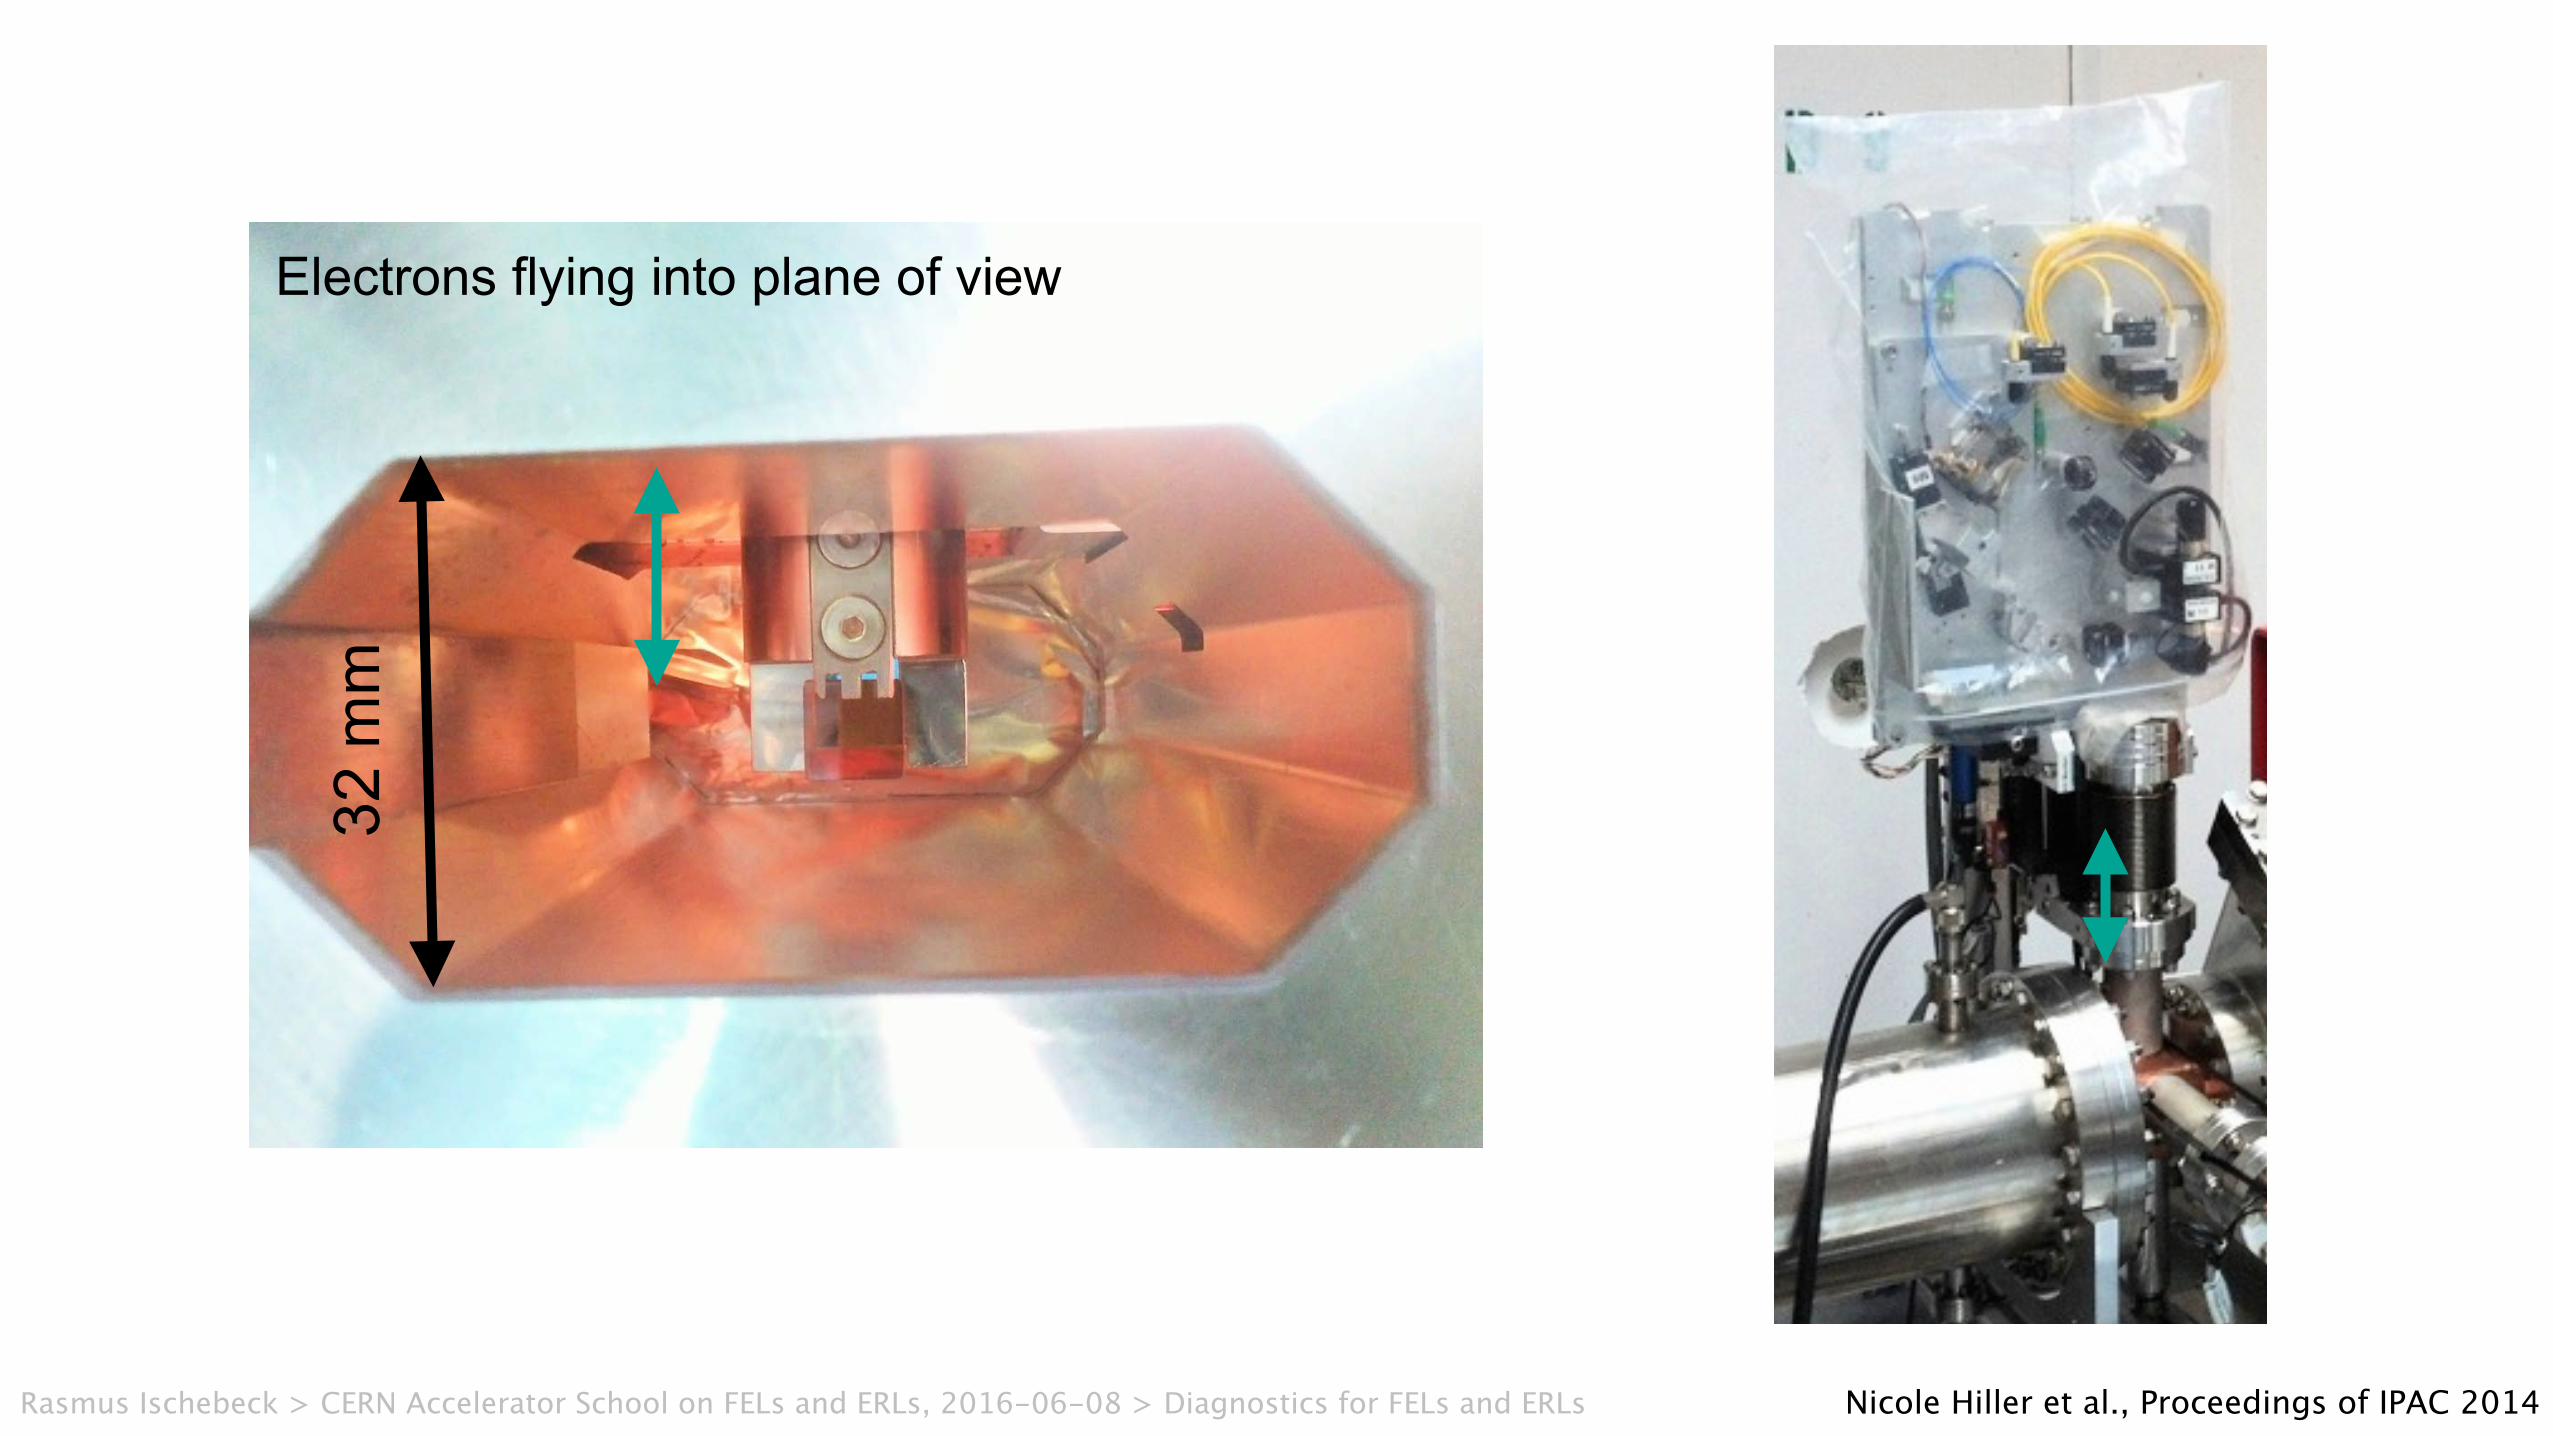
Electrons flying into plane of view32
mm
Nicole Hiller et al., Proceedings of IPAC 2014Rasmus Ischebeck > CERN Accelerator School on FELs and ERLs, 2016-06-08 > Diagnostics for FELs and ERLs
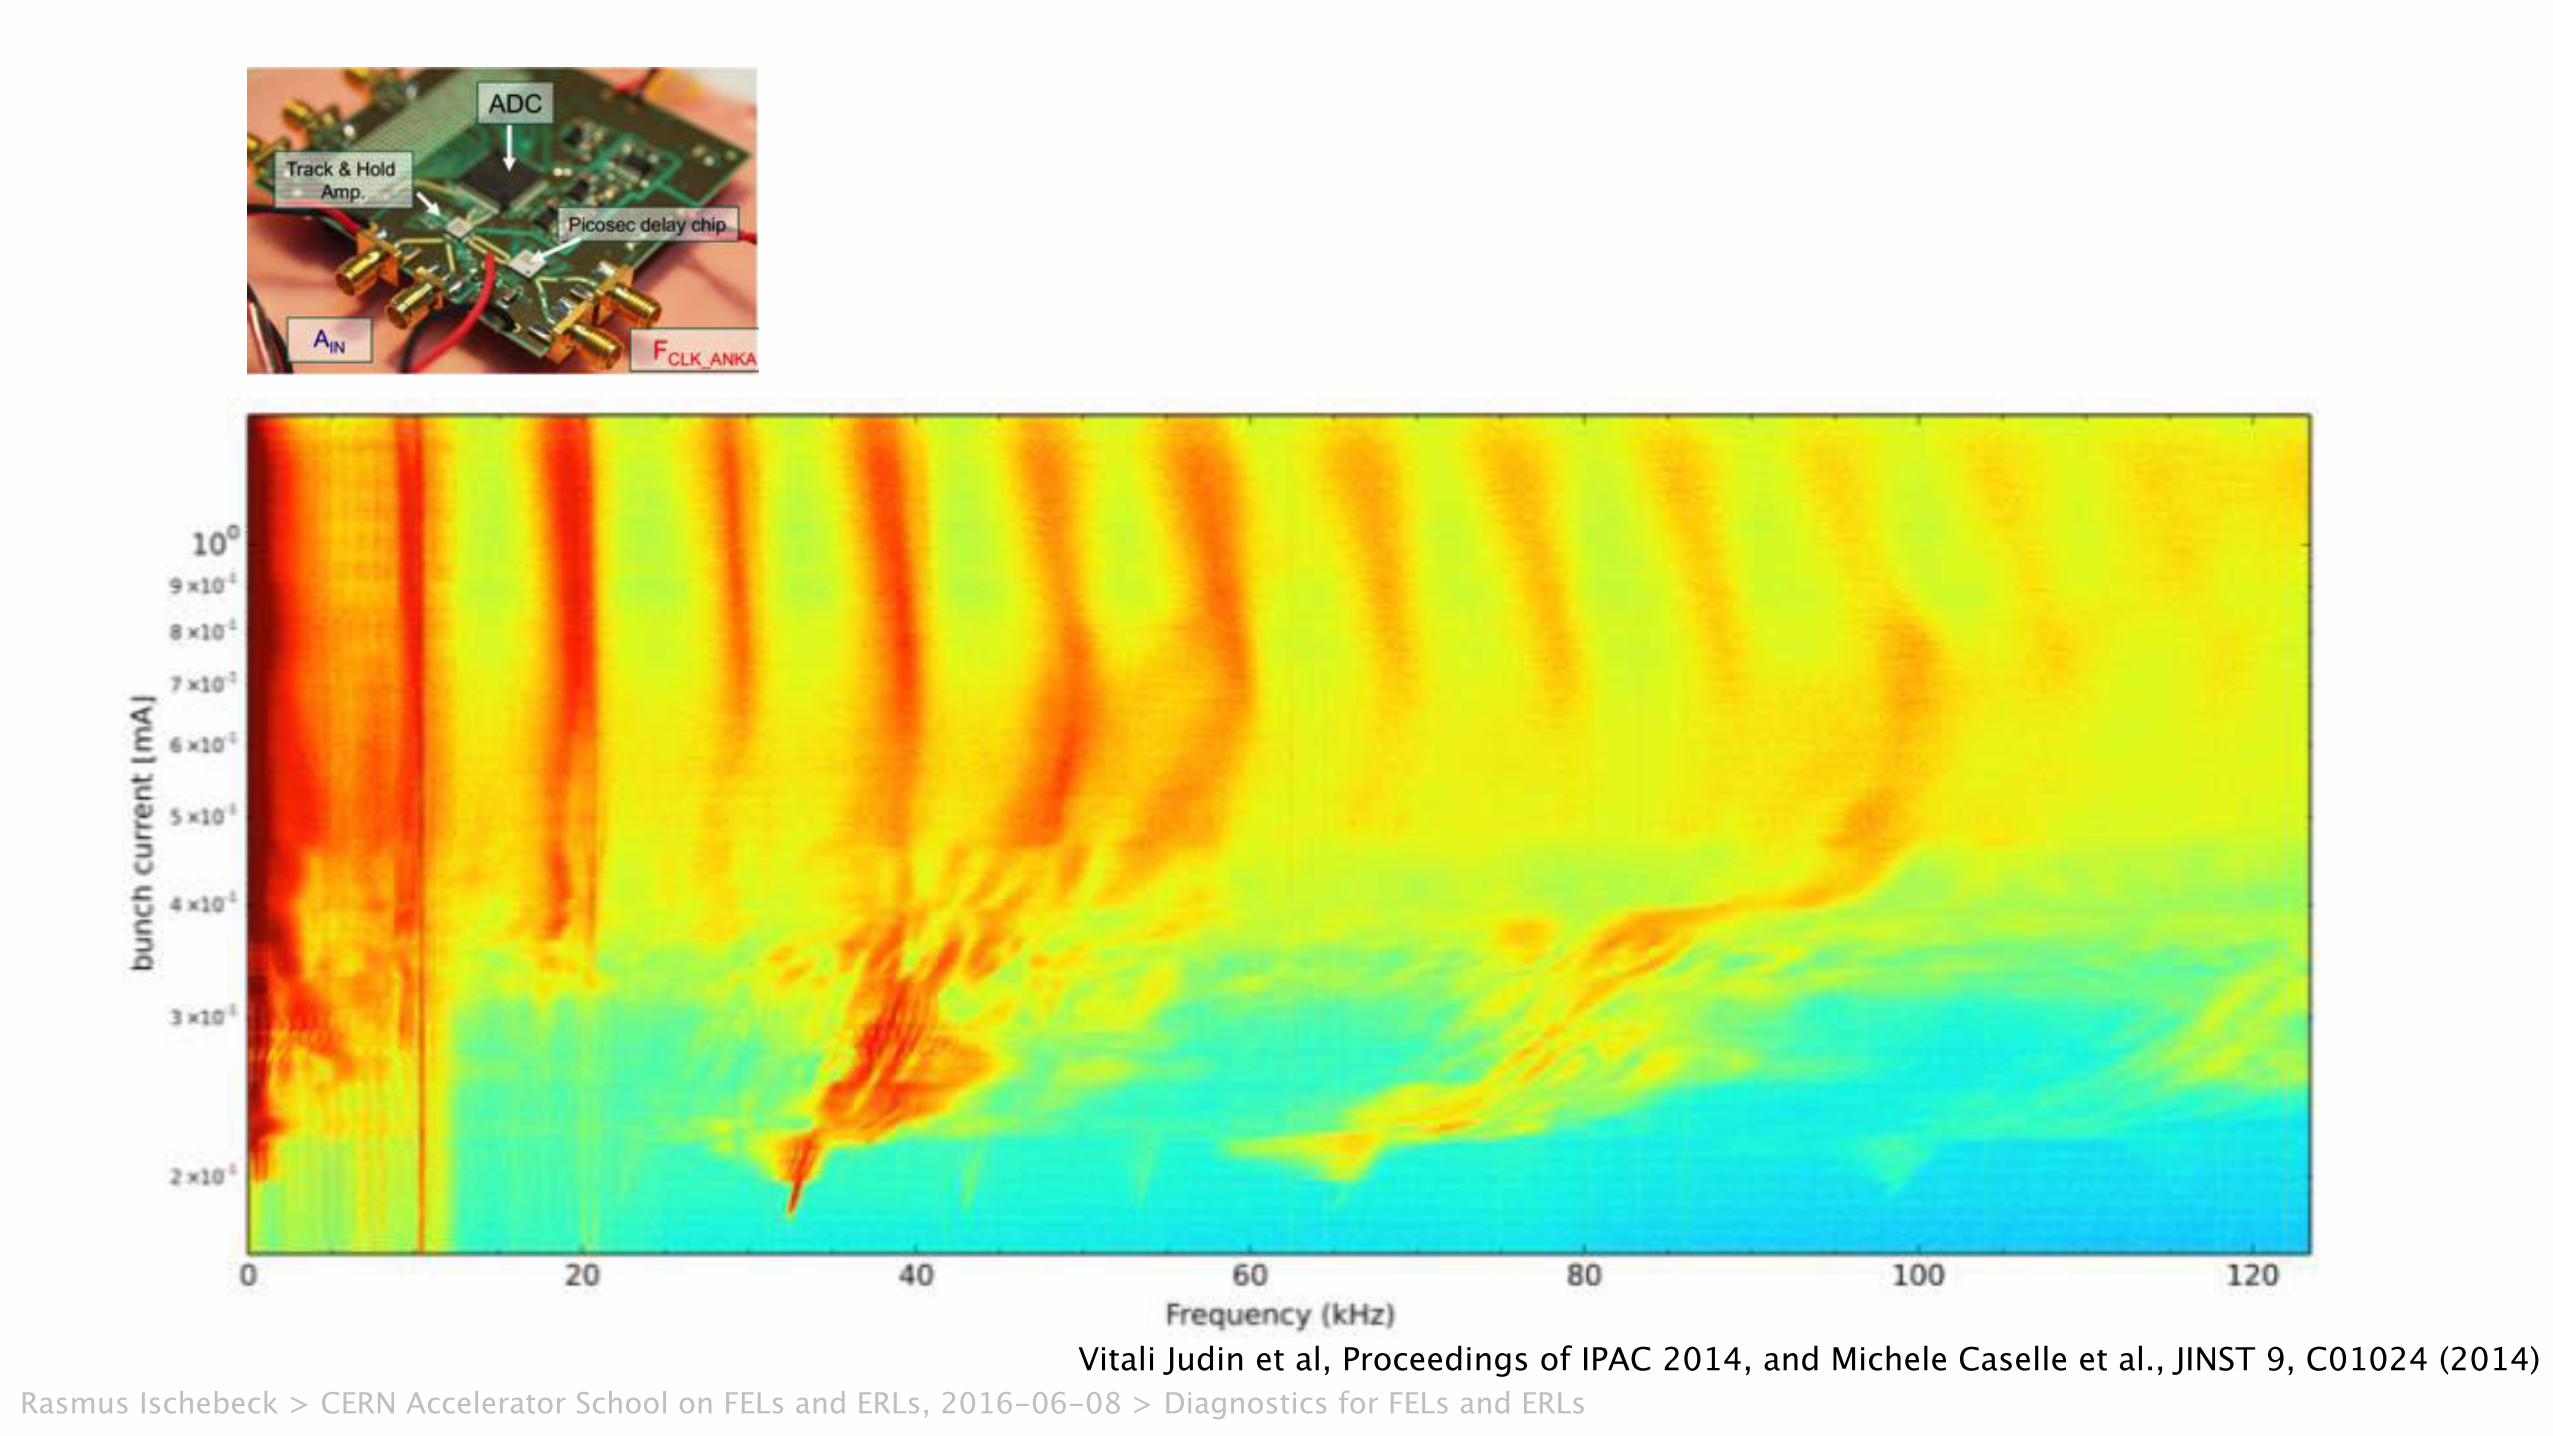
Vitali Judin et al, Proceedings of IPAC 2014, and Michele Caselle et al., JINST 9, C01024 (2014)Rasmus Ischebeck > CERN Accelerator School on FELs and ERLs, 2016-06-08 > Diagnostics for FELs and ERLs
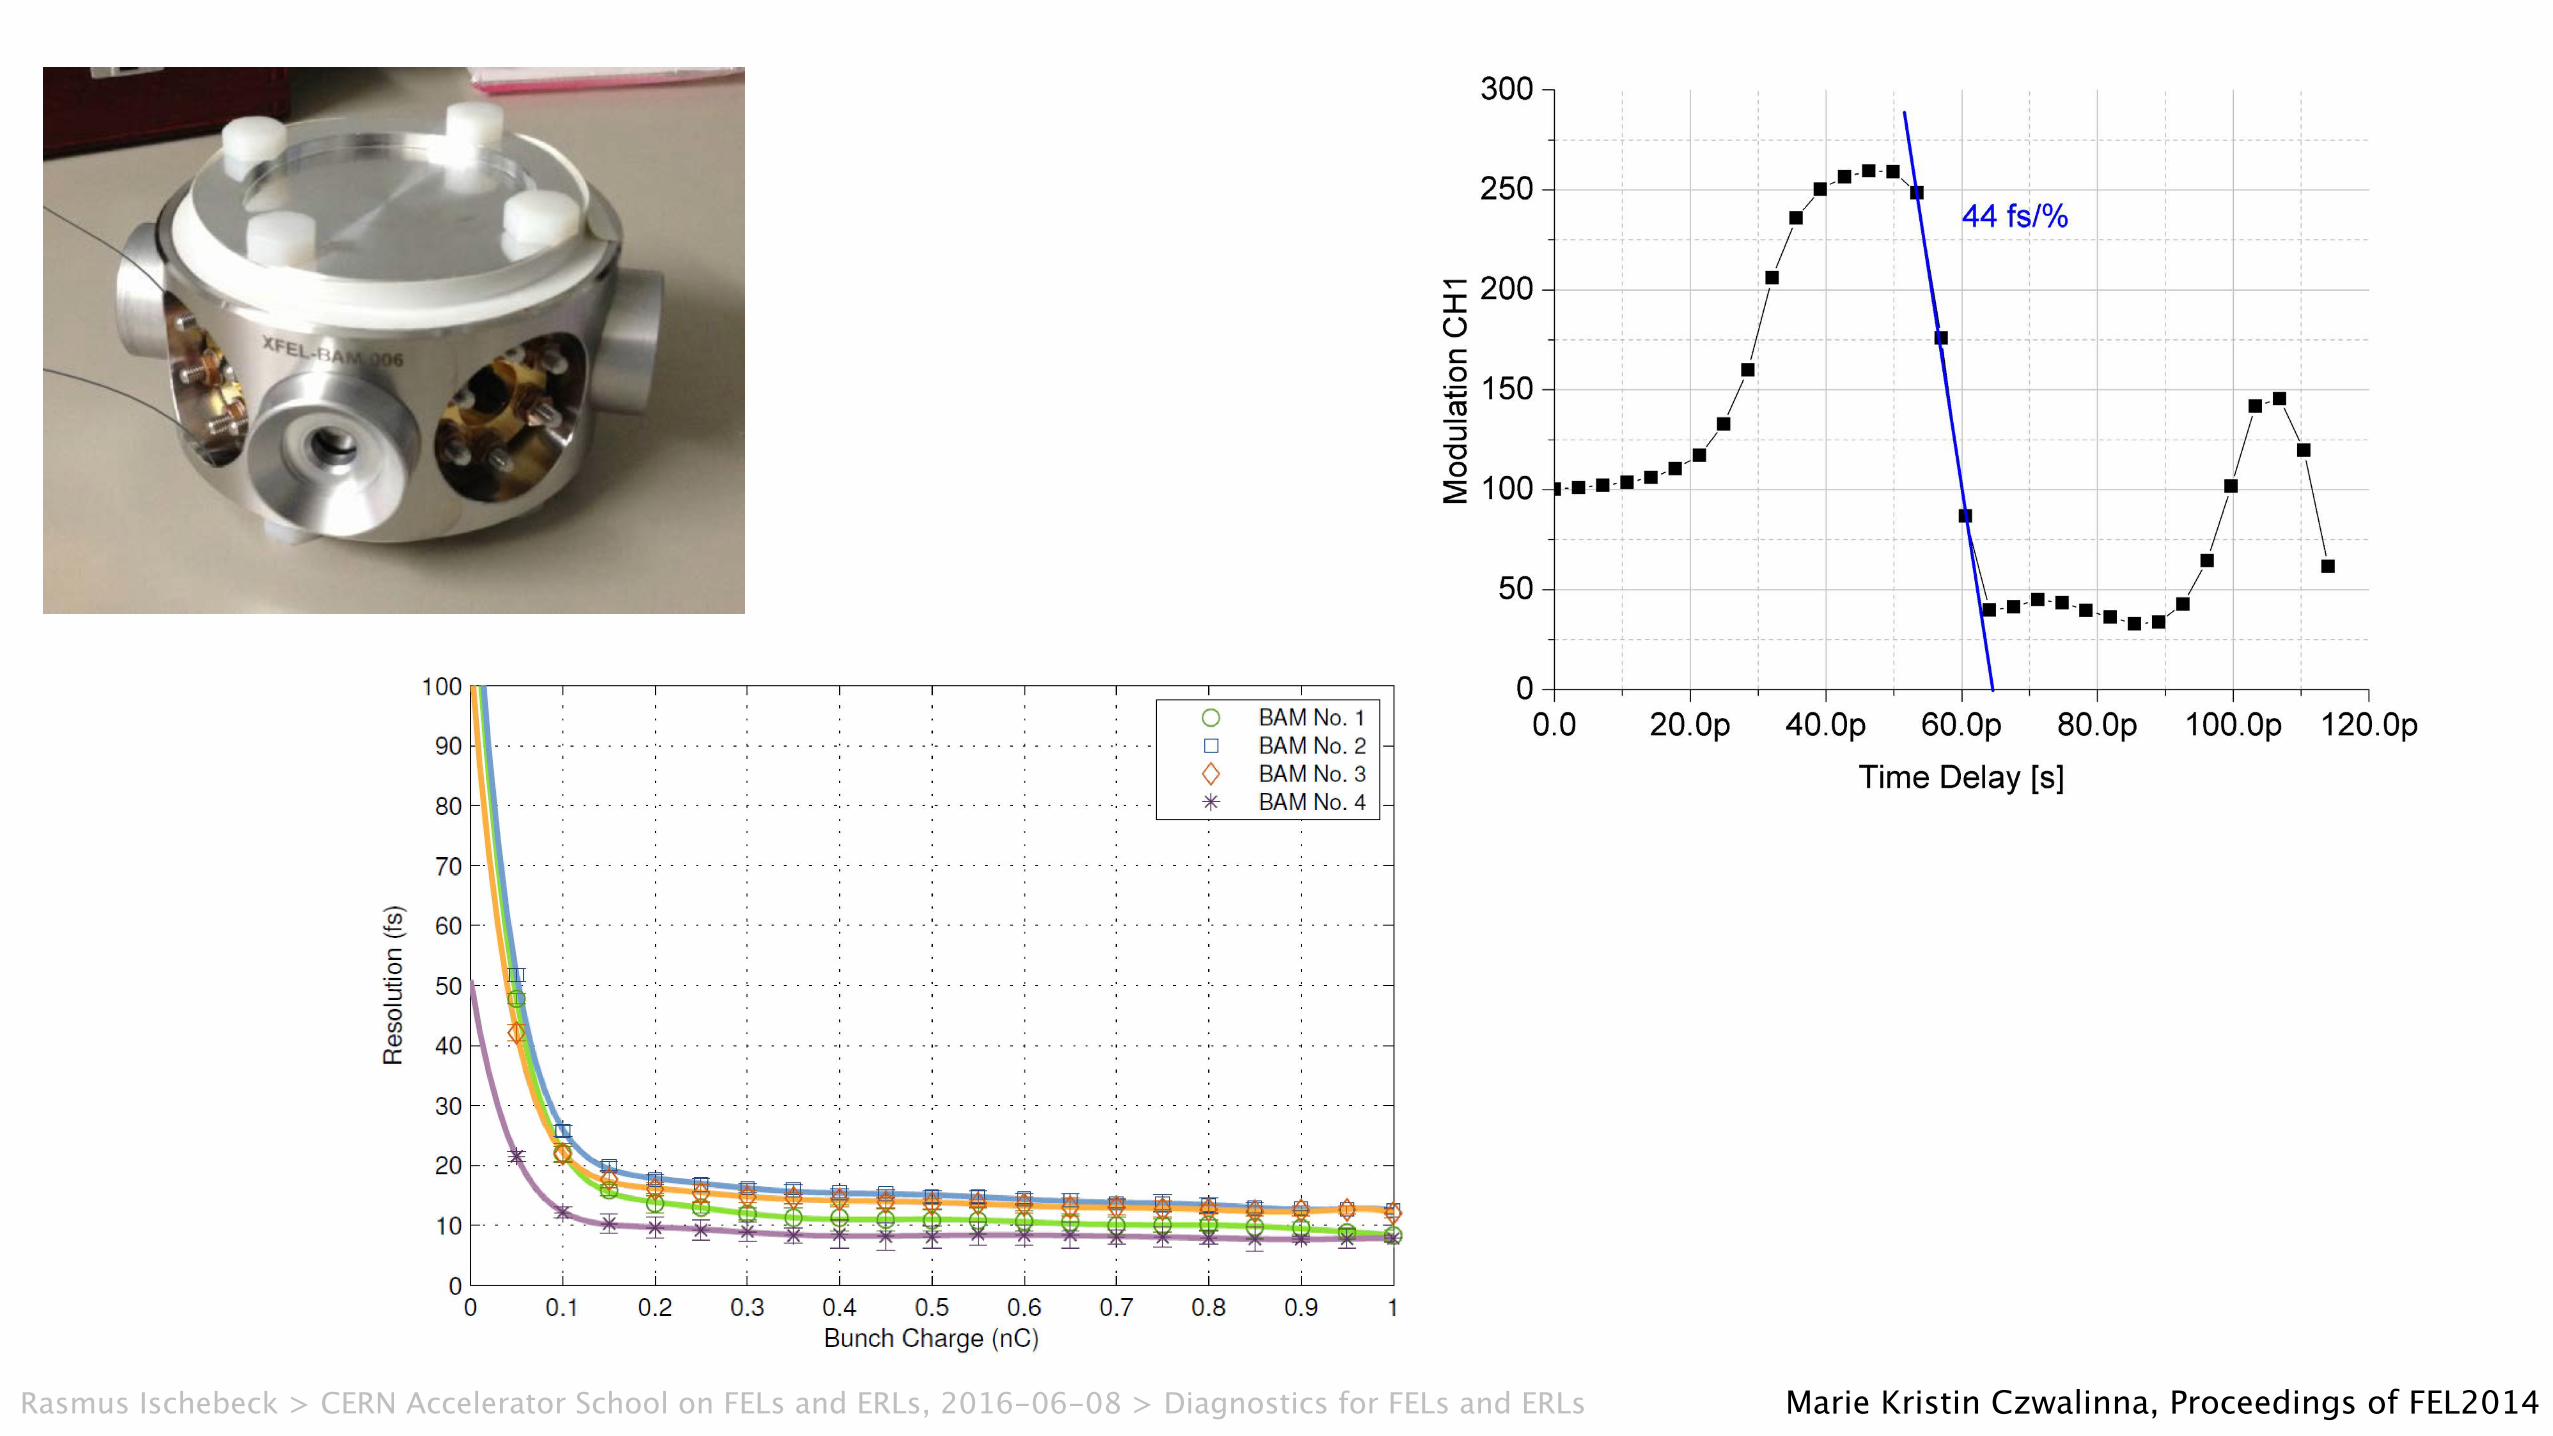
Marie Kristin Czwalinna, Proceedings of FEL2014Rasmus Ischebeck > CERN Accelerator School on FELs and ERLs, 2016-06-08 > Diagnostics for FELs and ERLs
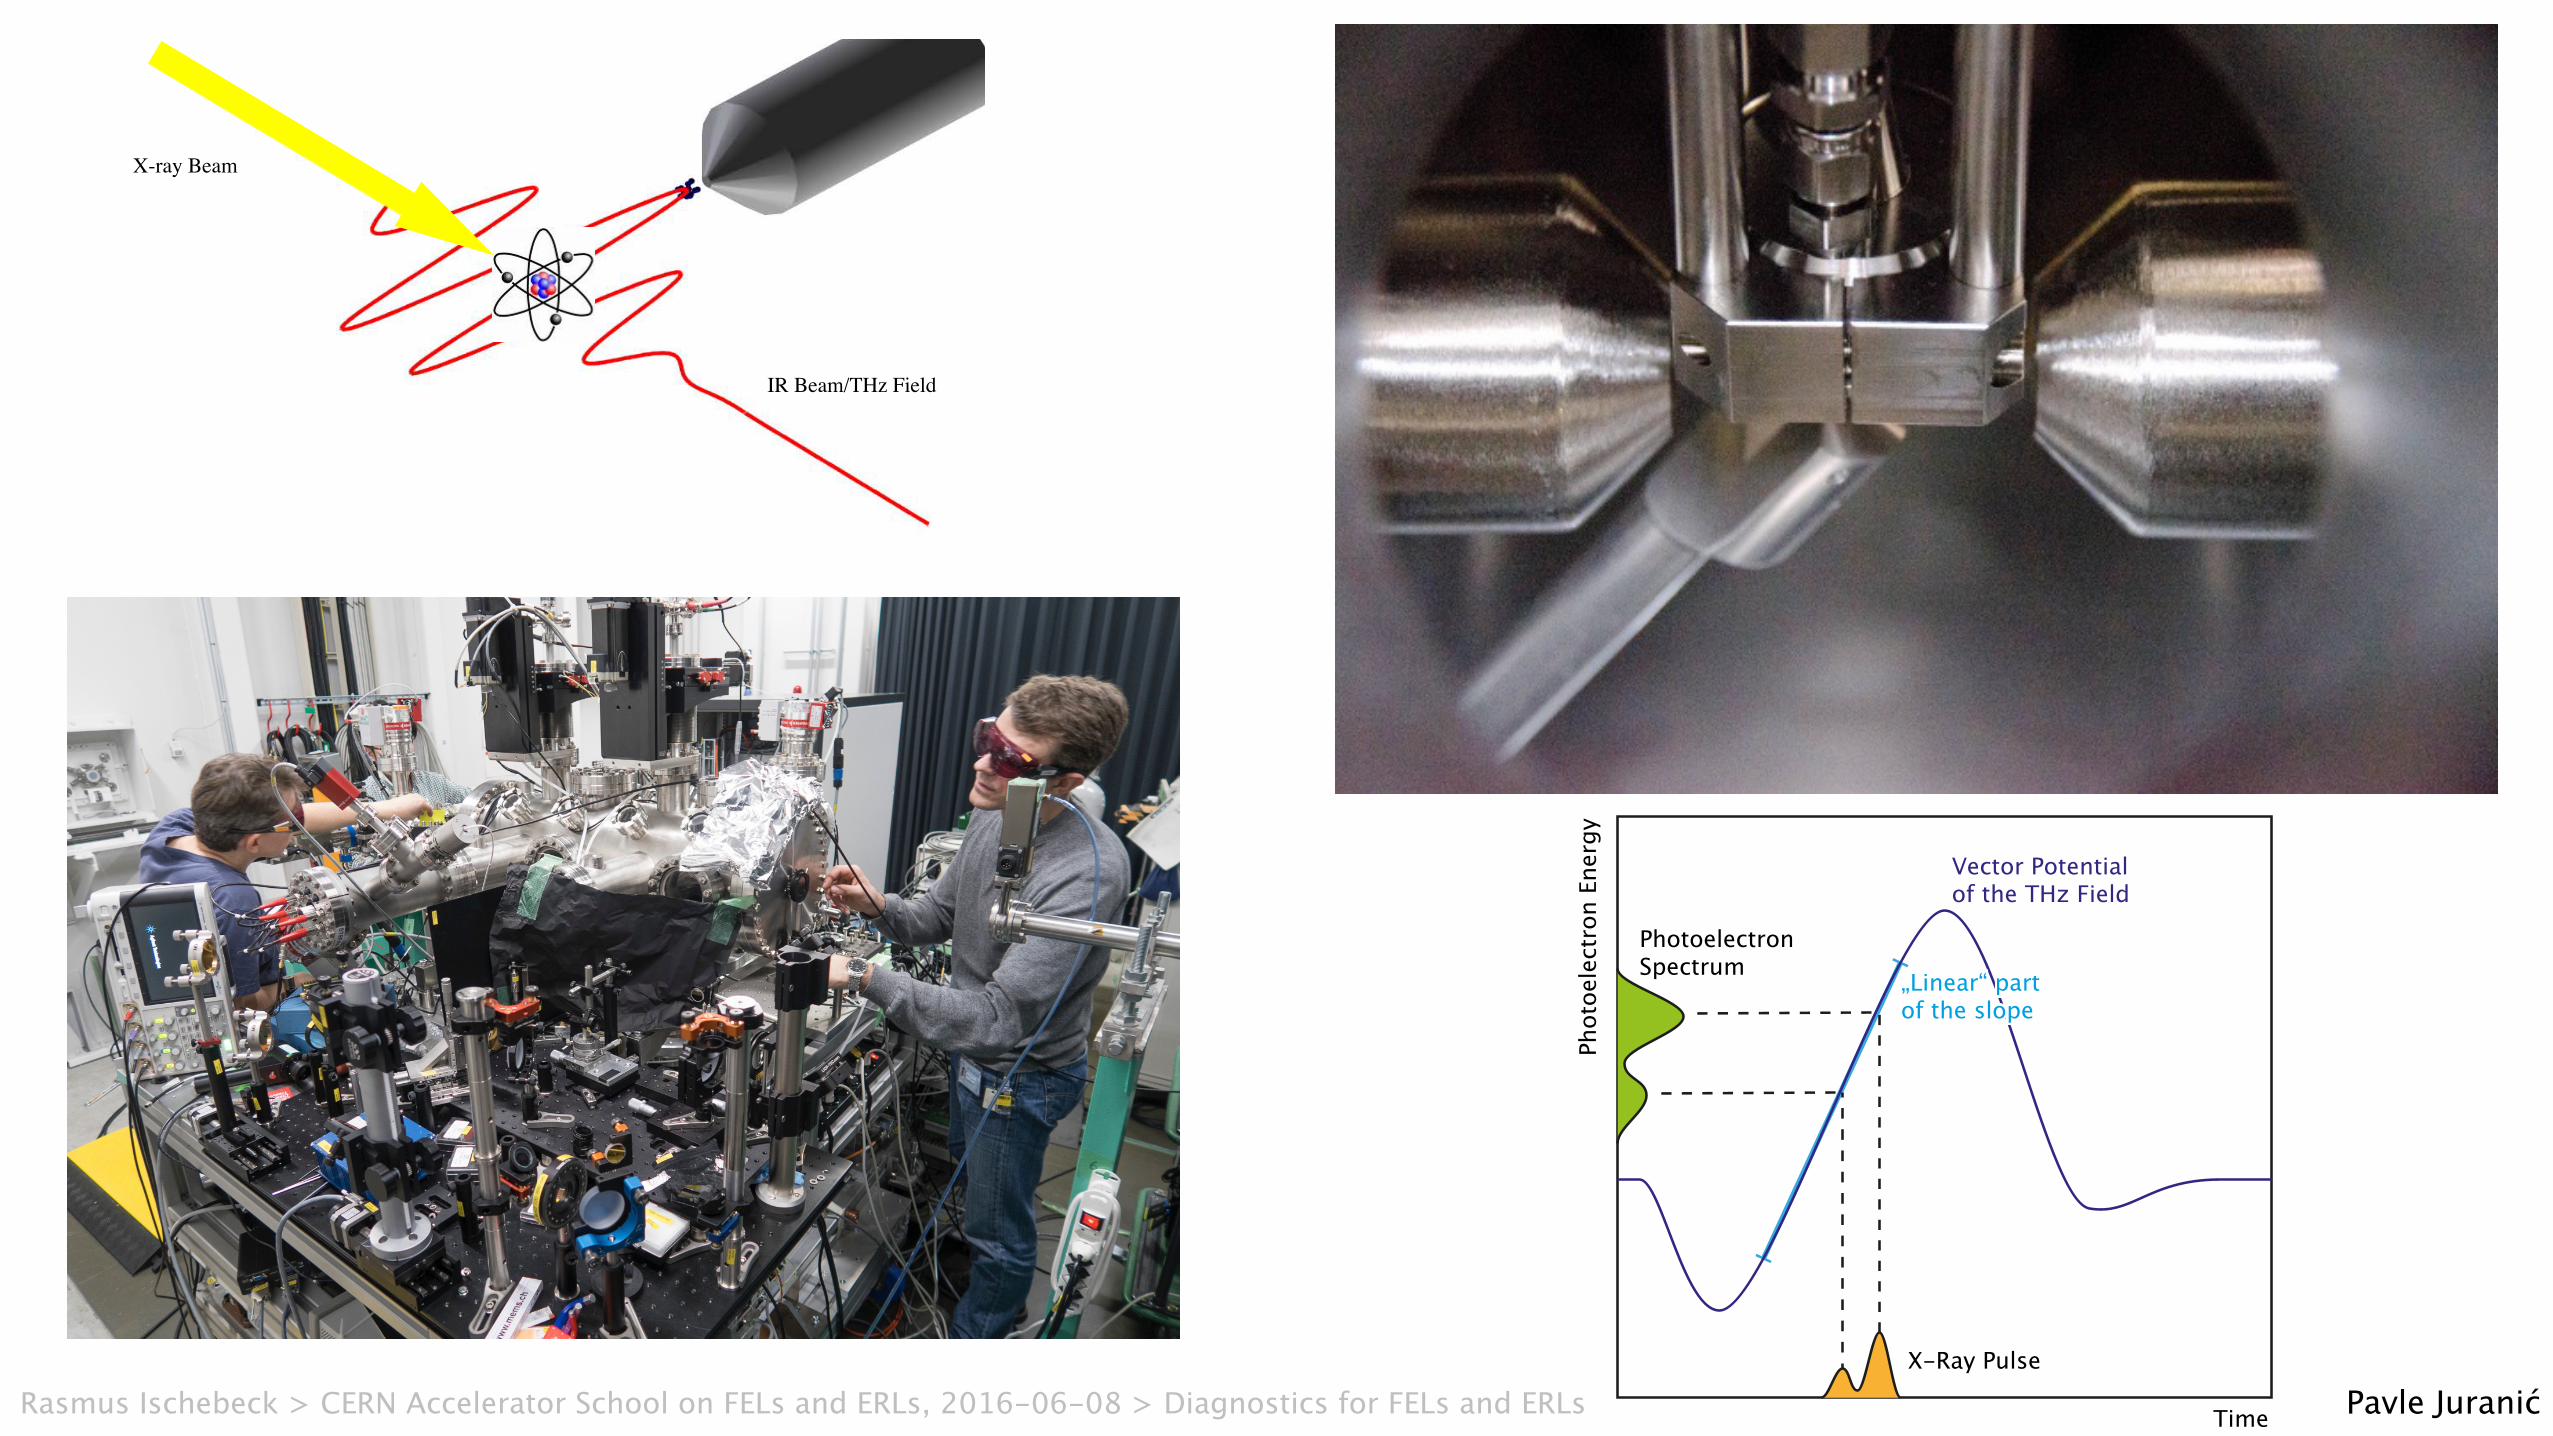
IR Beam/THz Field
X-ray Beam
Pavle JuranićTime
Photoele
ctron E
nergy
X-Ray Pulse
Photoelectron
Spectrum
Vector Potential
of the THz Field
„Linear“ part
of the slope
„Linear“ part
of the slope
Rasmus Ischebeck > CERN Accelerator School on FELs and ERLs, 2016-06-08 > Diagnostics for FELs and ERLs

provide only indirect evidence, as they are working on the generatingelectron bunch instead of the X-ray pulse itself. To date, no directexperimental determination of the temporal structure of few-femto-second SASE X-ray pulses has yet been feasible, due to their X-raynature, ultrashort duration and the inherent jitter in their arrivaltime. This situation is also substantially different in comparisonto earlier measurements on longer X-ray pulses22,24 or FEL pulseswith lower photon energies25.
NIR streaking spectroscopy of FEL pulsesTo directly measure the FEL pulse duration we rely on the methodof near-infrared (NIR) streaking spectroscopy26,27, a well-establishedtechnique for temporal characterization of attosecond pulses in theXUV spectral region28. In this approach, an NIR laser field that iscoarsely synchronized to the X-ray pulse is spatially overlappedwith the X-ray beam in a dilute gas target. Here, Ne gas atoms areionized by the FEL and the generated photoelectrons are detectedwith a magnetic bottle electron spectrometer29 (MBES). With anFEL photon energy of Eγ ≈ 1,791 eV and a binding energy ofEB ≈ 870 eV for the 1s electron shell in Ne, the kinetic energy ofthe photoelectrons in the absence of the NIR laser is distributedaround a mean value of ∼921 eV. Thus, each photoelectron canbe modelled as a free wave packet, and the temporal structure ofthe complete photoelectron burst is a replica of the incoming FELpulse30. An in-depth description of the experimental set-up isgiven in the Methods, and more details are provided in theSupplementary Methods.
Figure 1 presents the experimental set-up and illustrates thebasic principle of streaking. Photoelectron spectra generated inthe presence of an external optical laser field are called‘dressed’ spectra. These dressed photoelectron spectra exhibitspecific characteristics that depend (among other parameters)strongly on the duration of the cycle period of the dressing laserfield tperiod, with respect to the duration of the FEL pulses, τX-ray,to be measured.
In general, one can discern two distinct cases of dressedphotoelectron spectra, defined by the ratio of the dressing fieldperiod to the duration of the X-ray pulses that generate the photo-electrons (cf. ref. 31). For periods of the dressing field shorter thanthe X-ray pulse duration (tperiod/τX-ray < 1), measurements belong tothe ‘sideband regime’, which is characterized by the appearance ofnew photolines, symmetrically distributed on both sides of the orig-inal undressed line and spaced by an energy that corresponds to theoptical frequency of the applied dressing field (see, for example, refs22, 32 and 33). In this case the photoelectron spectra are sensitive tothe contributions of more than one optical period and accordinglydepend on the cycle-averaged intensity envelope of thedressing laser.
When the duration of the X-ray pulses is shorter than the periodof the dressing field (tperiod/τX-ray > 1), the photoelectron spectra aredressed in the so-called ‘streaking regime’. Because the X-ray pulseonly extends over a part of the period of the dressing field, thephotoelectrons generated at different delays between the FEL andthe NIR pulse experience a redistribution in energy that dependson the magnitude of the electric field at the instant of their gener-ation. In this way, the electron spectra are significantly changed intheir final energy spread and central energy with respect to theunstreaked photoelectron burst (Fig. 1, left). In our conditions,the overall shift Δɛ of the central energy of the photoelectron spec-trum at an extremum of the streaking vector potential can beapproximated using the classical formula26,34
Δε(tb) ≈ −pcAIR(tb) (1)
where pc is the momentum corresponding to the central energy ɛc ofthe unstreaked photoelectrons via pc =
!!!!2εc
√(in atomic units, a.u.:
h− = e =me =1
4πε0= 1). AIR(tb) is the vector potential of the streaking
field at the moment of birth of the electron wave packet (tb) and isrelated to the electric field by EIR(t) = −dAIR(t)/dt.
970
930
890
−8
−4
0
4
8
Delay (fs)
Photoelectron energy (e
V)
X-ray pulse
Infrared pulse
MBES
Ne
Vacuum chamber AMO
970
930
890
Figure 1 | Experimental set-up and measurement principle at the LCLS. Experimental set-up in the AMO hutch at the LCLS. The X-ray laser and NIRstreaking laser are coupled into the vacuum chamber and are co-linearly focused onto a Ne gas target. The generated photoelectrons are thenenergy-resolved with a magnetic bottle electron spectrometer. The inset on the left depicts two distinctive cases of temporal overlap of the FEL with respectto the streaking field, one at the zero-crossing and one at a maximum of the NIR vector potential. The respective photoelectron spectra are also shown.More details are given in the text.
NATURE PHOTONICS DOI: 10.1038/NPHOTON.2014.278 ARTICLES
NATURE PHOTONICS | VOL 8 | DECEMBER 2014 | www.nature.com/naturephotonics 951
© 2014 Macmillan Publishers Limited. All rights reserved
Wolfram Helml, Nature Photonics 8 (2014)Rasmus Ischebeck > CERN Accelerator School on FELs and ERLs, 2016-06-08 > Diagnostics for FELs and ERLs

Rasmus Ischebeck
Spectral Techniques
St. Jakobi organ, Hamburg, Wikimedia CommonsRasmus Ischebeck > CERN Accelerator School on FELs and ERLs, 2016-06-08 > Diagnostics for FELs and ERLs
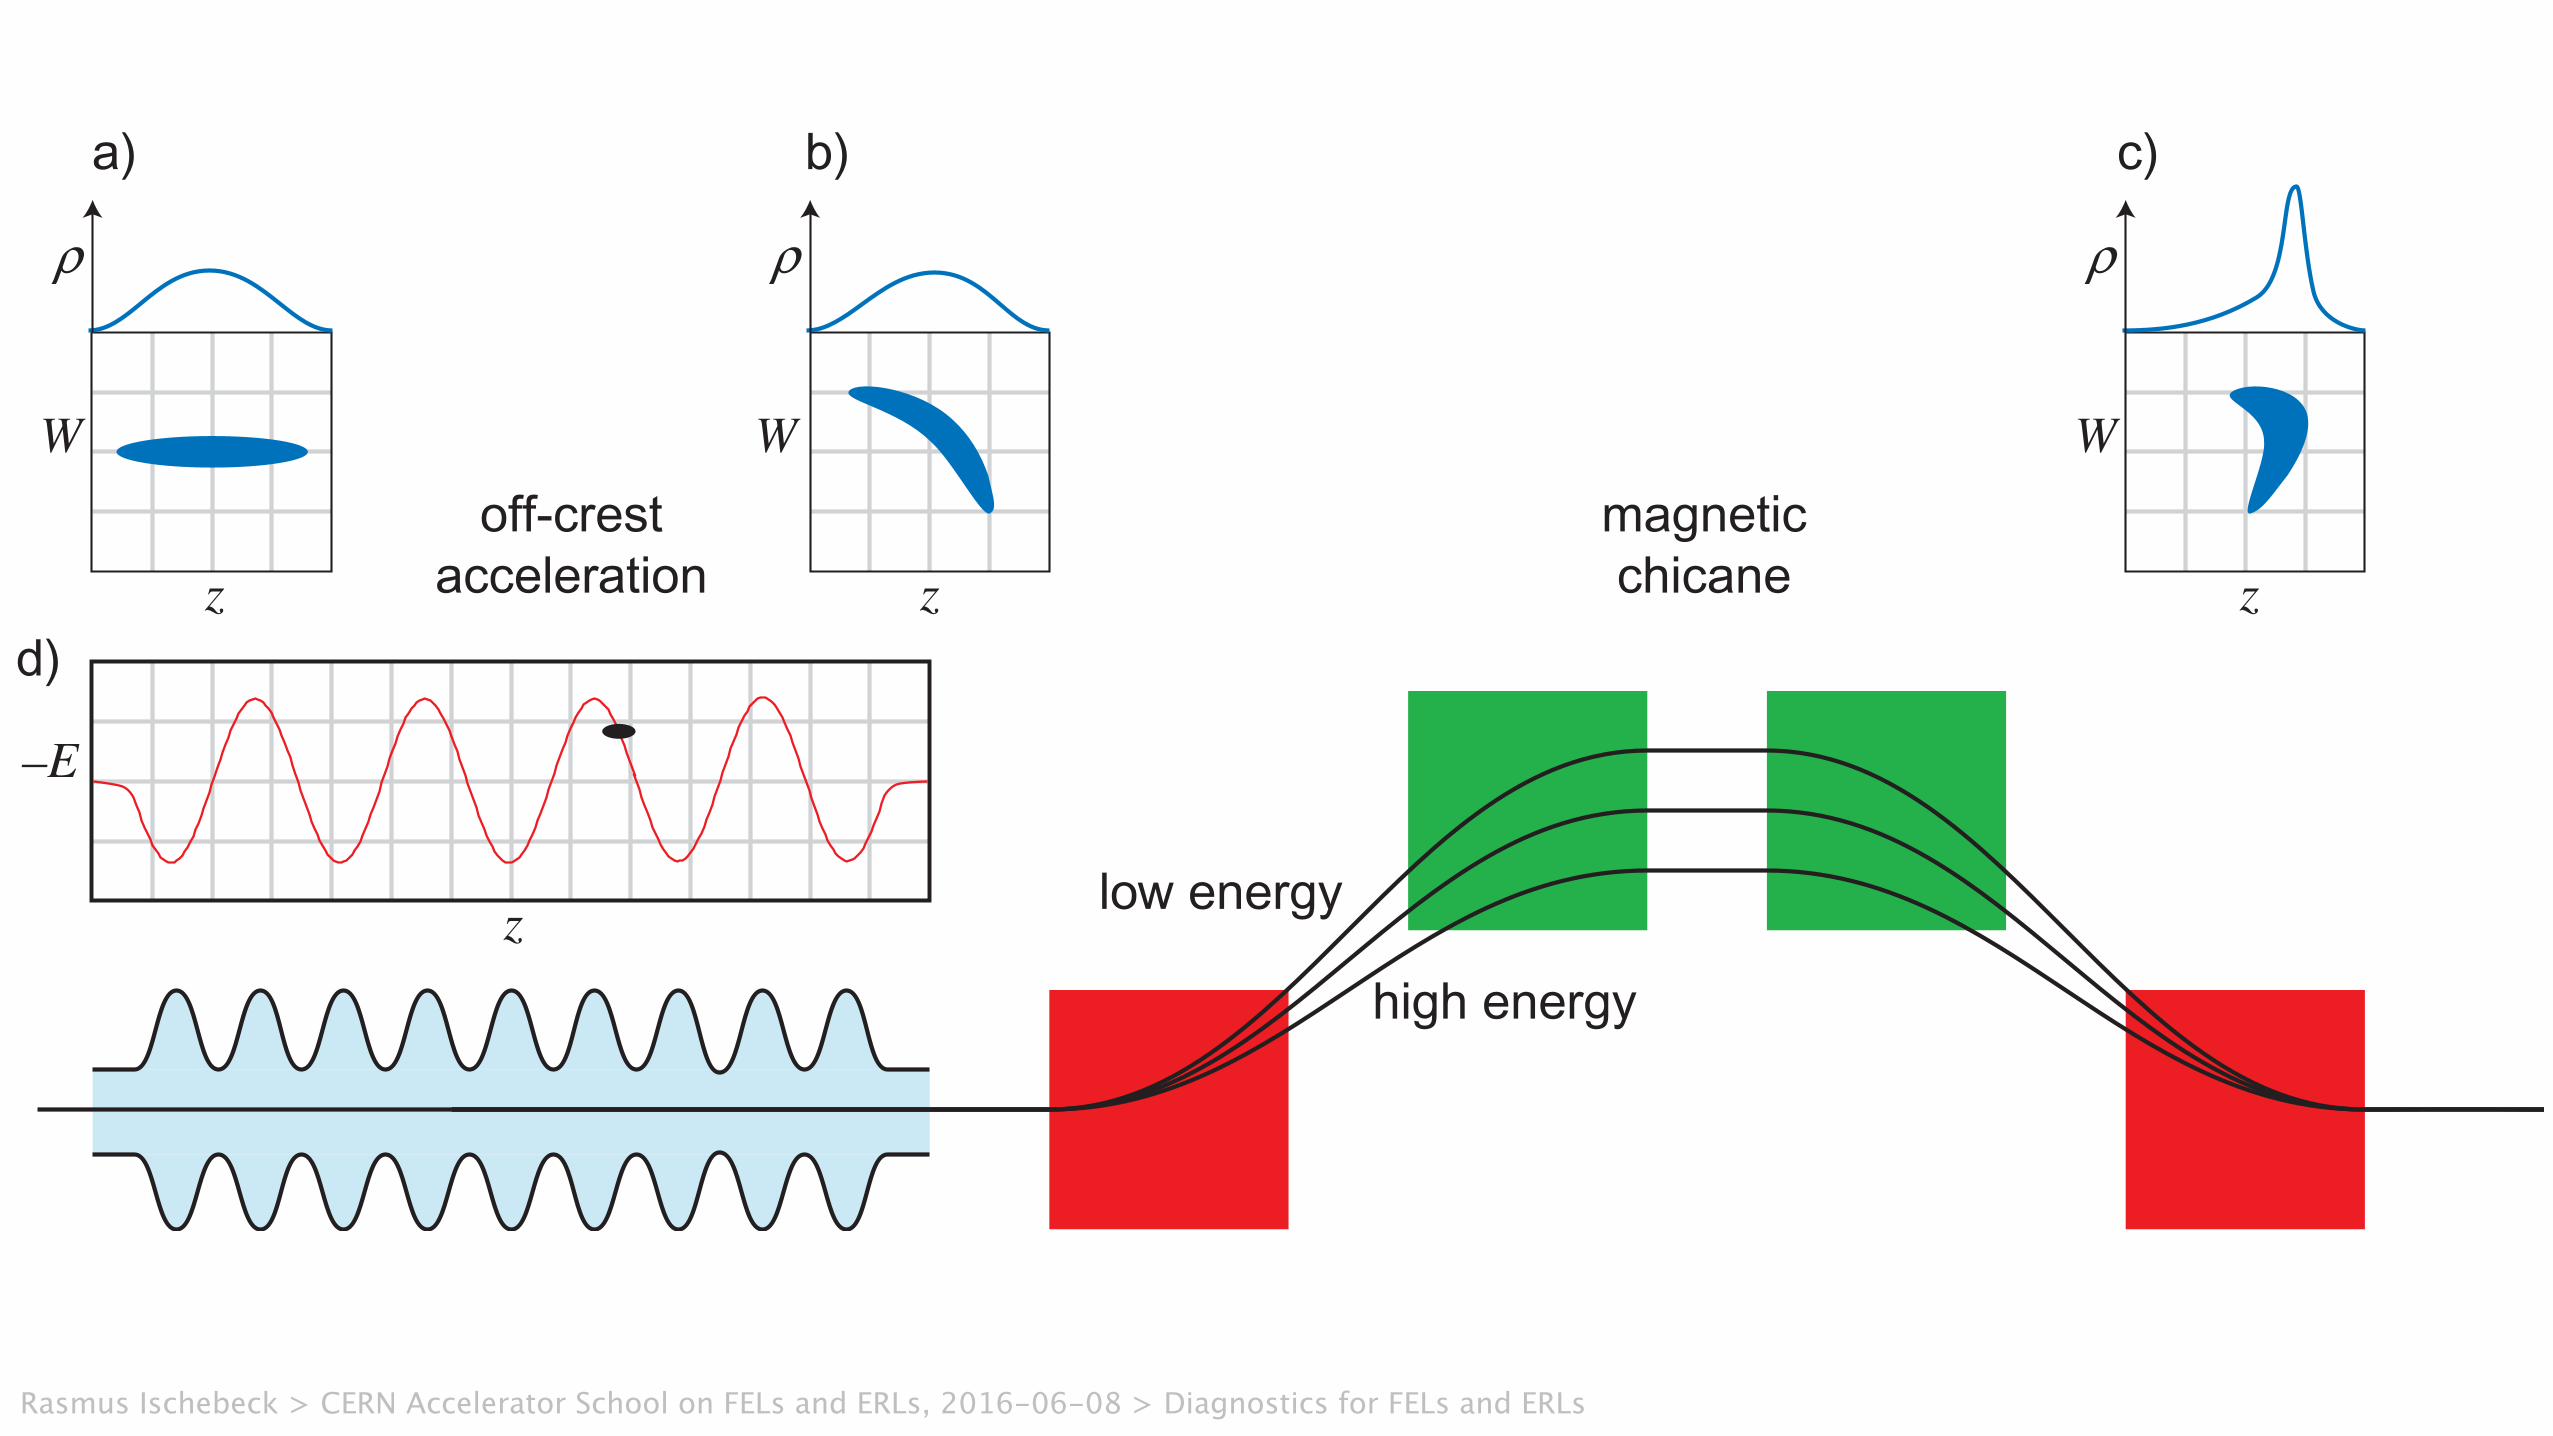
off-crestacceleration
magneticchicanez
W
z
W
z
W
z
�–E
ρ ρ ρ
high energy
low energy
a) b) c)
d)
Rasmus Ischebeck > CERN Accelerator School on FELs and ERLs, 2016-06-08 > Diagnostics for FELs and ERLs

Franziska Frei, Proceedings of FEL2014
spectr
al pow
er
[W/H
z]
-20
10
-15
10
-10
10
11
1012
1013
1014
1015
10
3000 300 30 3 0.3
frequency [Hz]
wavelength [µm]
0.7fs rms @10pC3fs rms @10pC25fs rms @200pC75fs rms @200pC
2fs rms @10pC3fs rms @10pC25fs rms @200pC75fs rms @200pC
250fs rms @10pC300fs rms @200pC500fs rms @200pC
Rasmus Ischebeck > CERN Accelerator School on FELs and ERLs, 2016-06-08 > Diagnostics for FELs and ERLs
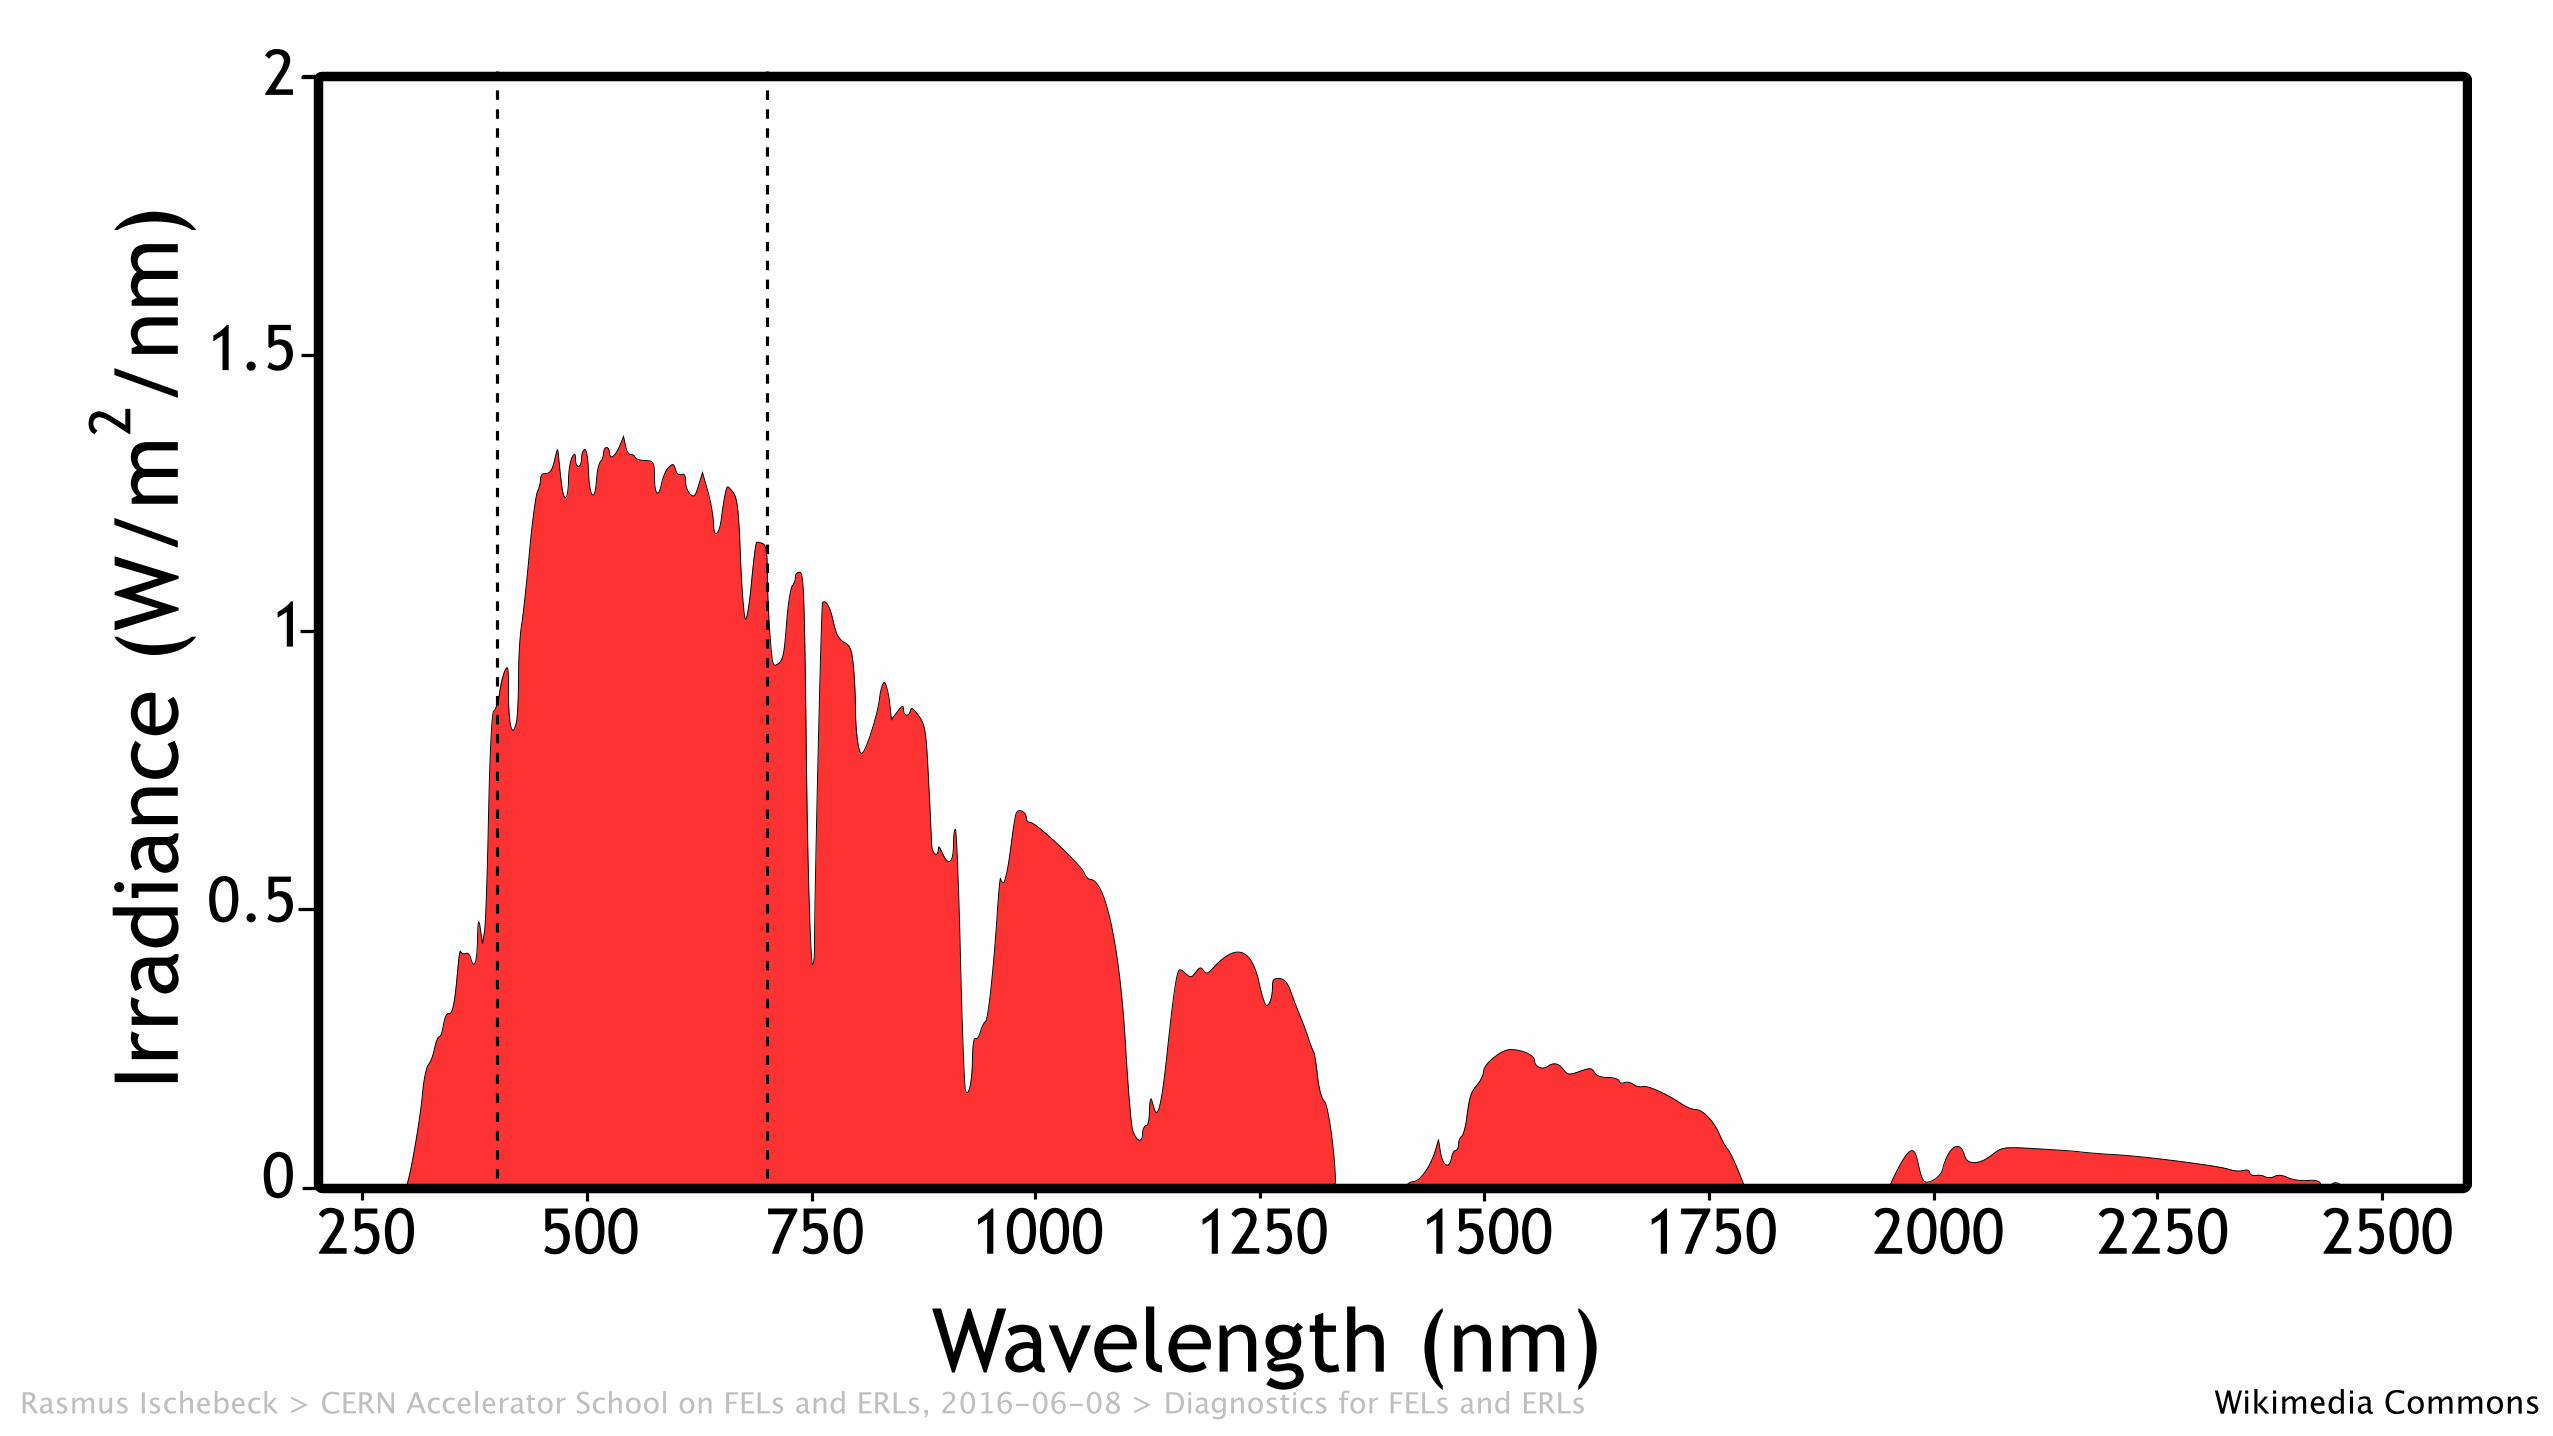
250 500 750 1000 1250 1500 1750 2000 2250 2500
Wavelength (nm)
0
0.5
1
1.5
2Ir
radi
ance
(W
/m2 /n
m)
Wikimedia CommonsRasmus Ischebeck > CERN Accelerator School on FELs and ERLs, 2016-06-08 > Diagnostics for FELs and ERLs
Rasmus Ischebeck
17
Relative Bunch Length Monitor
Pyroelectric detector good from 100GHz to light(response is not flat)
Si window transmits from mm-wave to ~1 micron.
Can also use mm-wave diodes for BC1 (< 1 THz)
Joe FrischRasmus Ischebeck > CERN Accelerator School on FELs and ERLs, 2016-06-08 > Diagnostics for FELs and ERLs
16
Relative Bunch Length Monitor● Need shot to shot non-invasive bunch length
monitor.
● Diffraction aperture and broadband (pyroelectric) detector.
Joe FrischRasmus Ischebeck > CERN Accelerator School on FELs and ERLs, 2016-06-08 > Diagnostics for FELs and ERLs
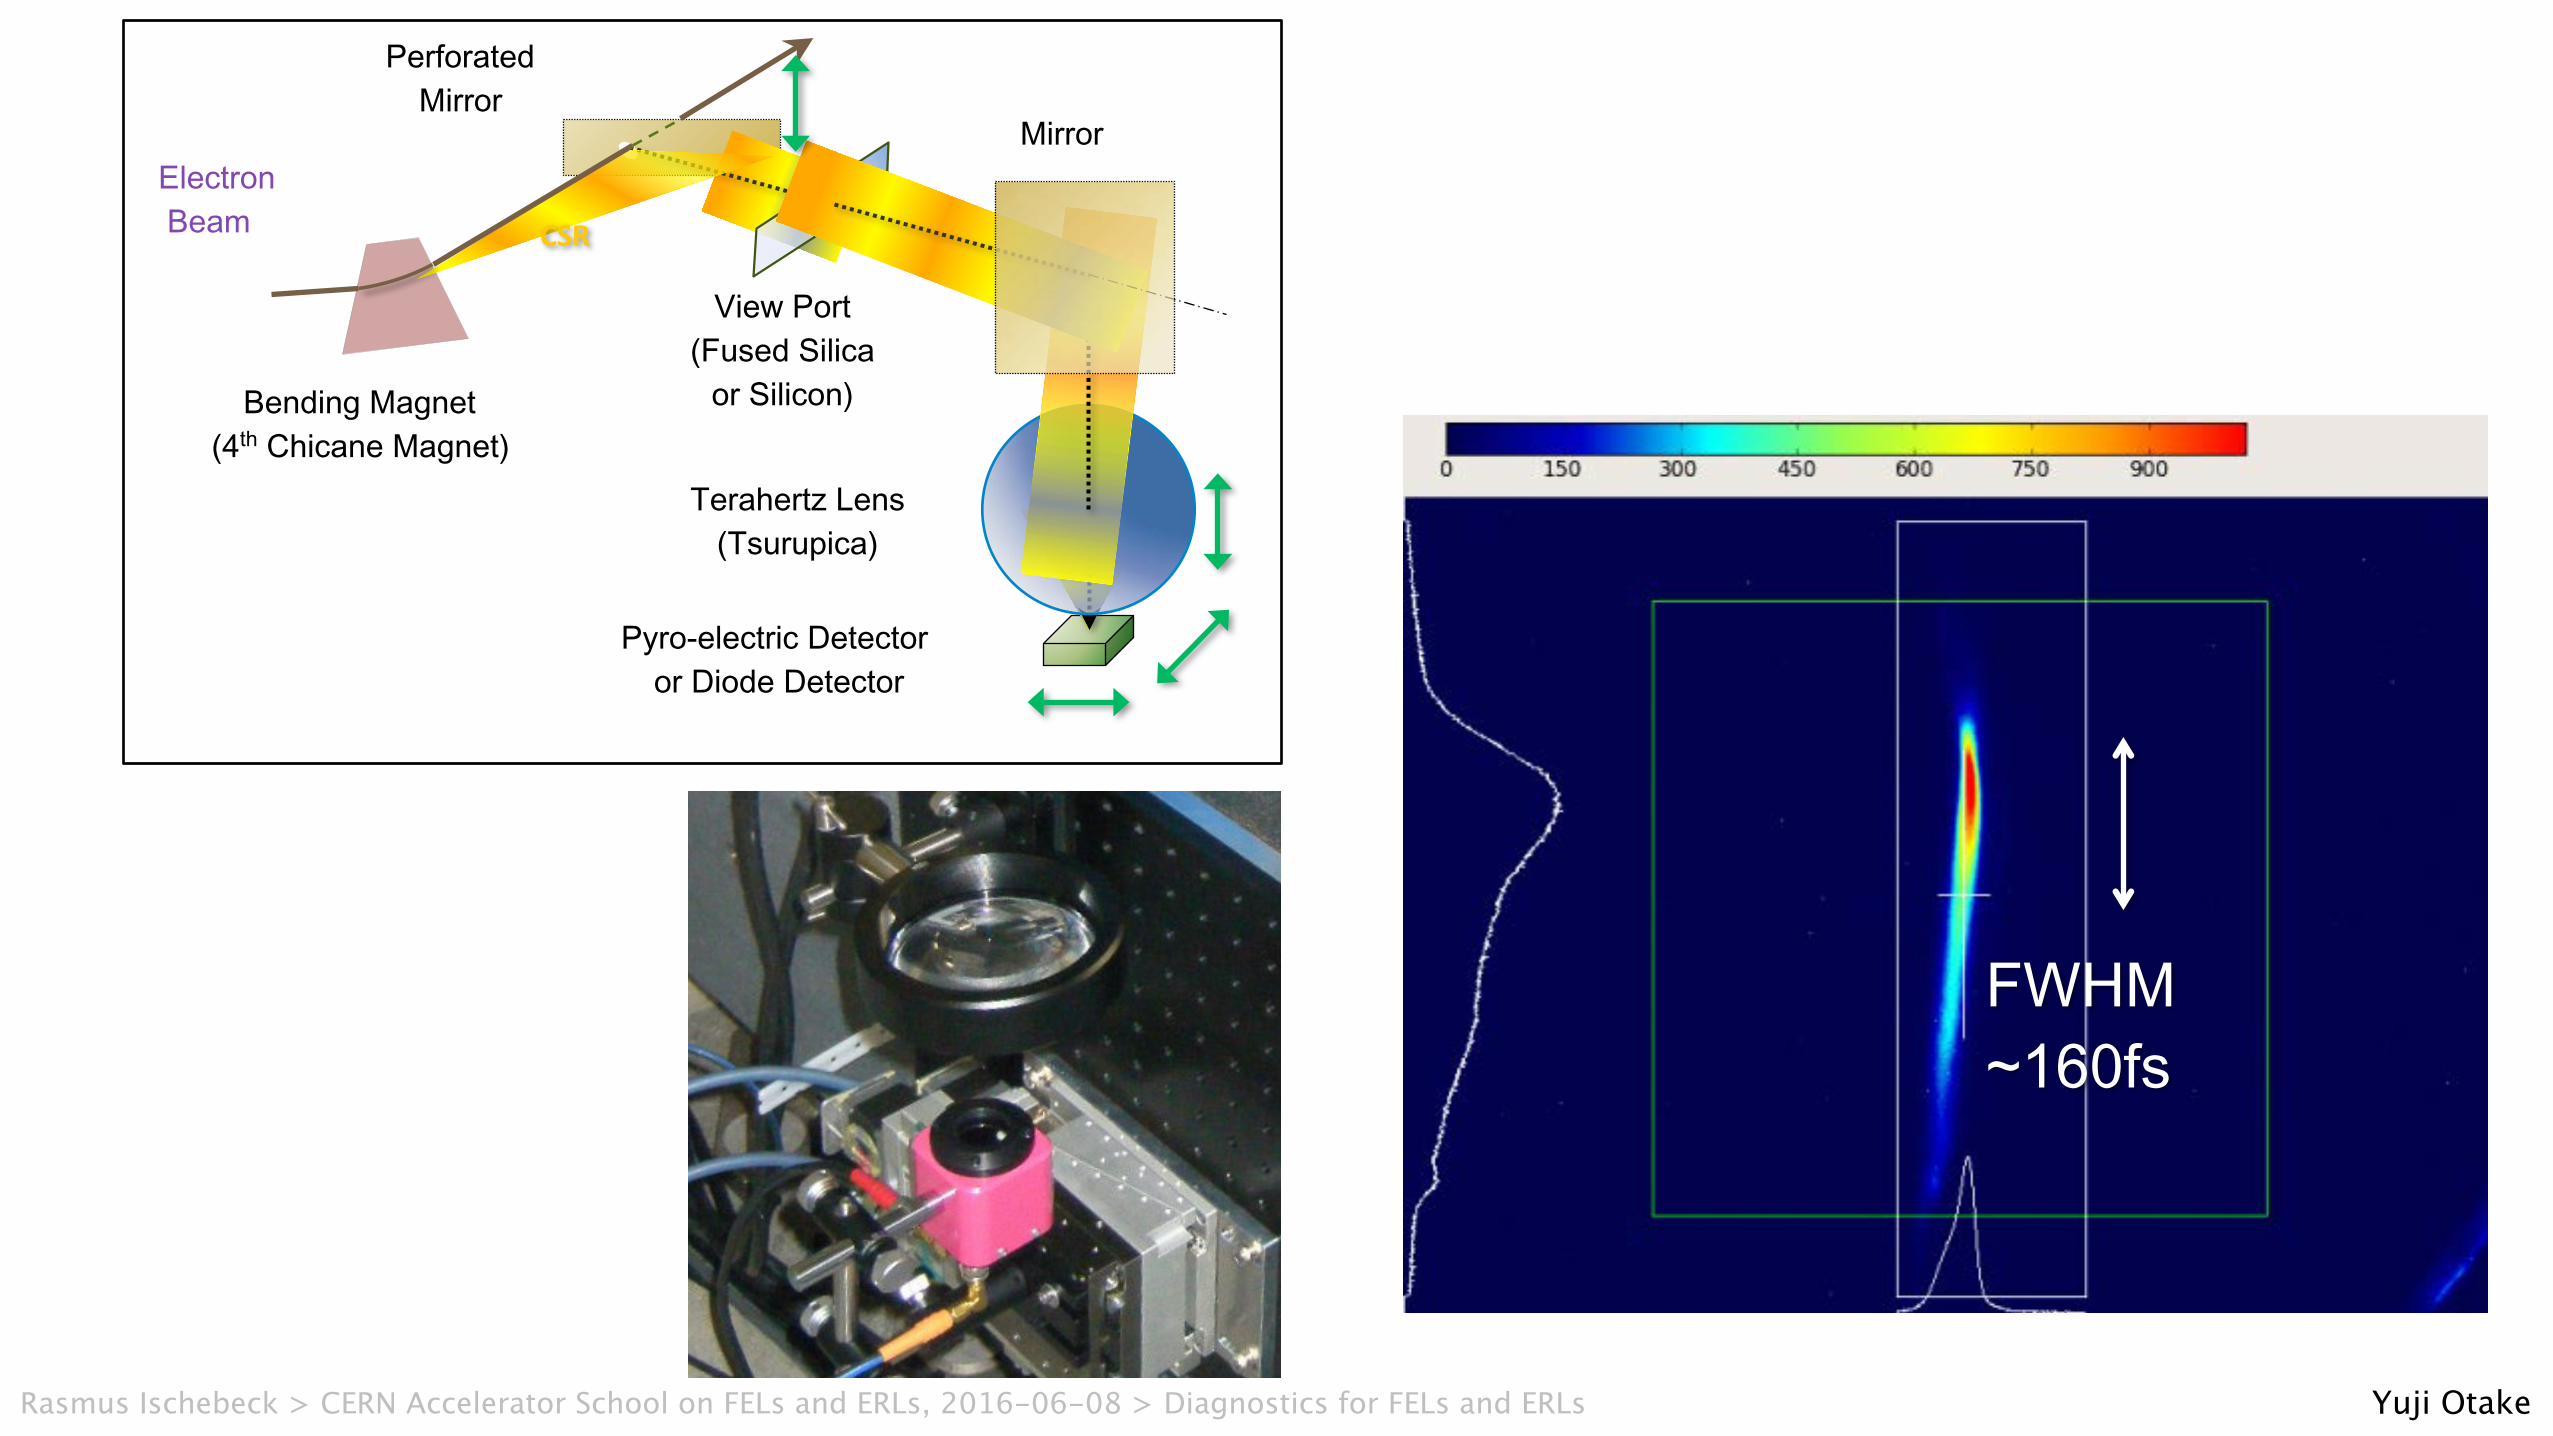
FWHM ~160fs
Yuji Otake
Bending Magnet(4th Chicane Magnet)
Electron Beam
Perforated Mirror
CSR
View Port(Fused Silica
or Silicon)
Mirror
Terahertz Lens(Tsurupica)
Pyro-electric Detector or Diode Detector
Rasmus Ischebeck > CERN Accelerator School on FELs and ERLs, 2016-06-08 > Diagnostics for FELs and ERLs
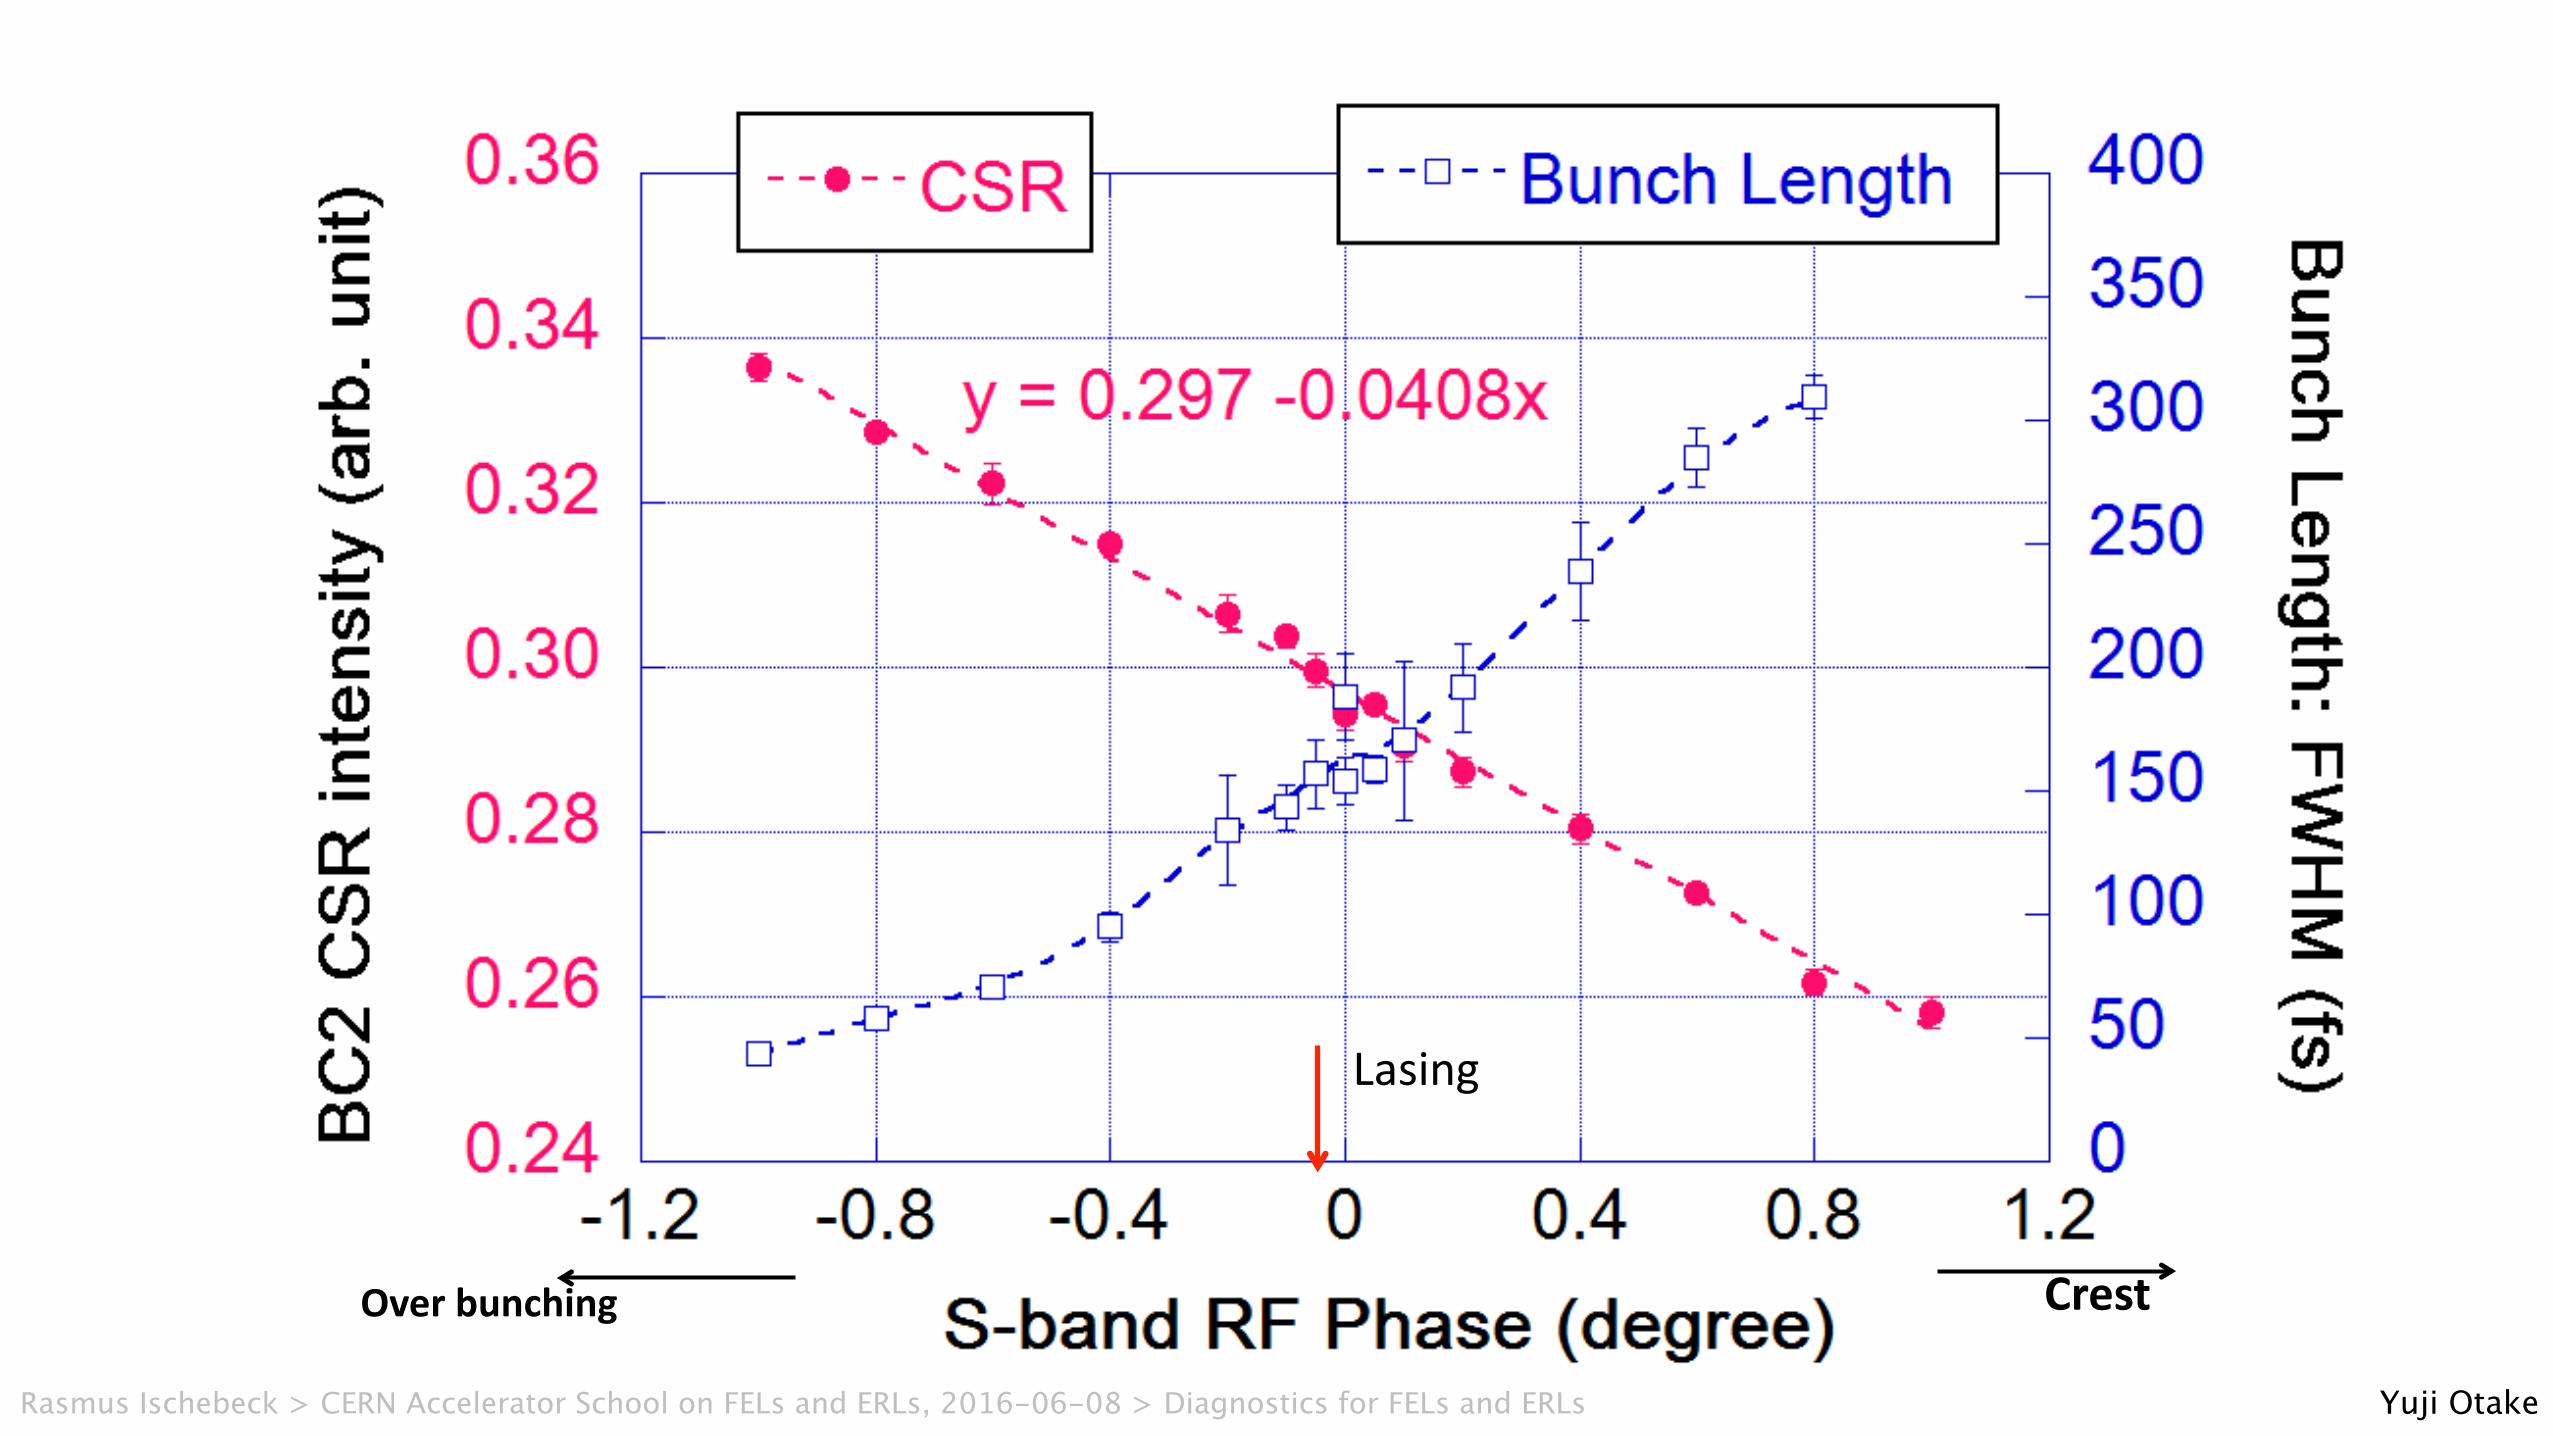
Lasing
CrestOverbunching
Yuji OtakeRasmus Ischebeck > CERN Accelerator School on FELs and ERLs, 2016-06-08 > Diagnostics for FELs and ERLs
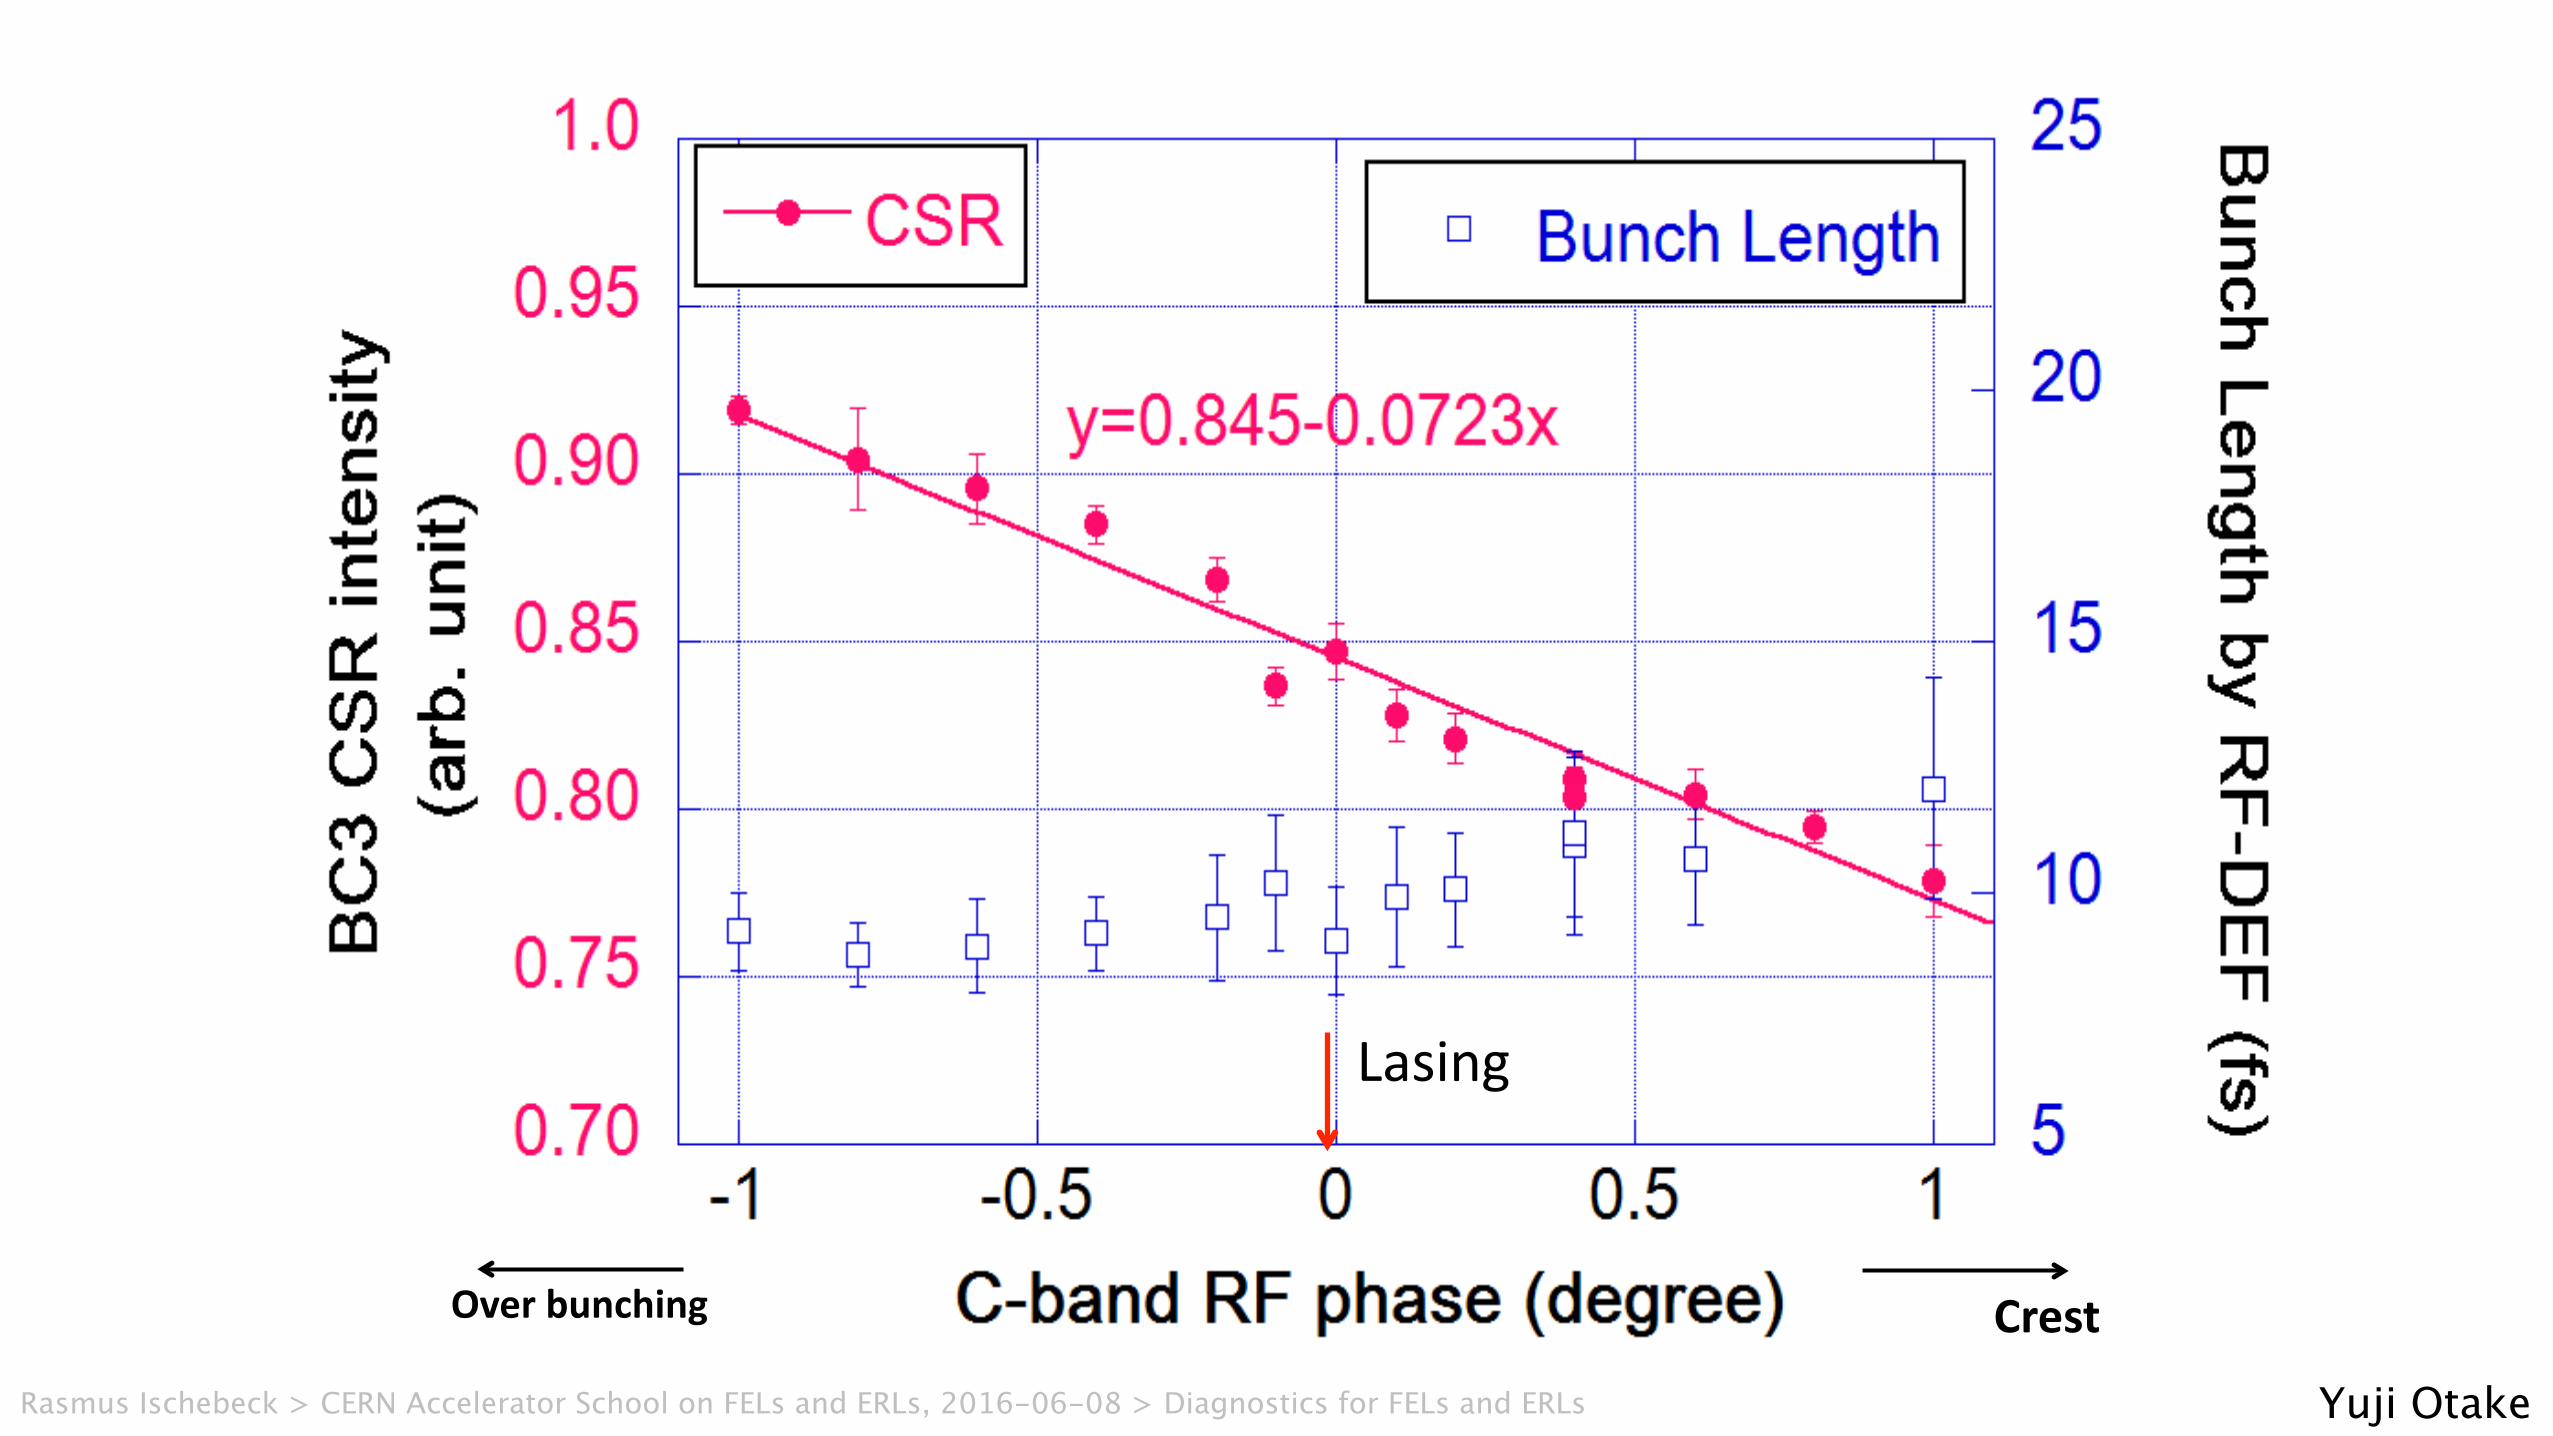
Lasing
CrestOverbunching
Yuji OtakeRasmus Ischebeck > CERN Accelerator School on FELs and ERLs, 2016-06-08 > Diagnostics for FELs and ERLs
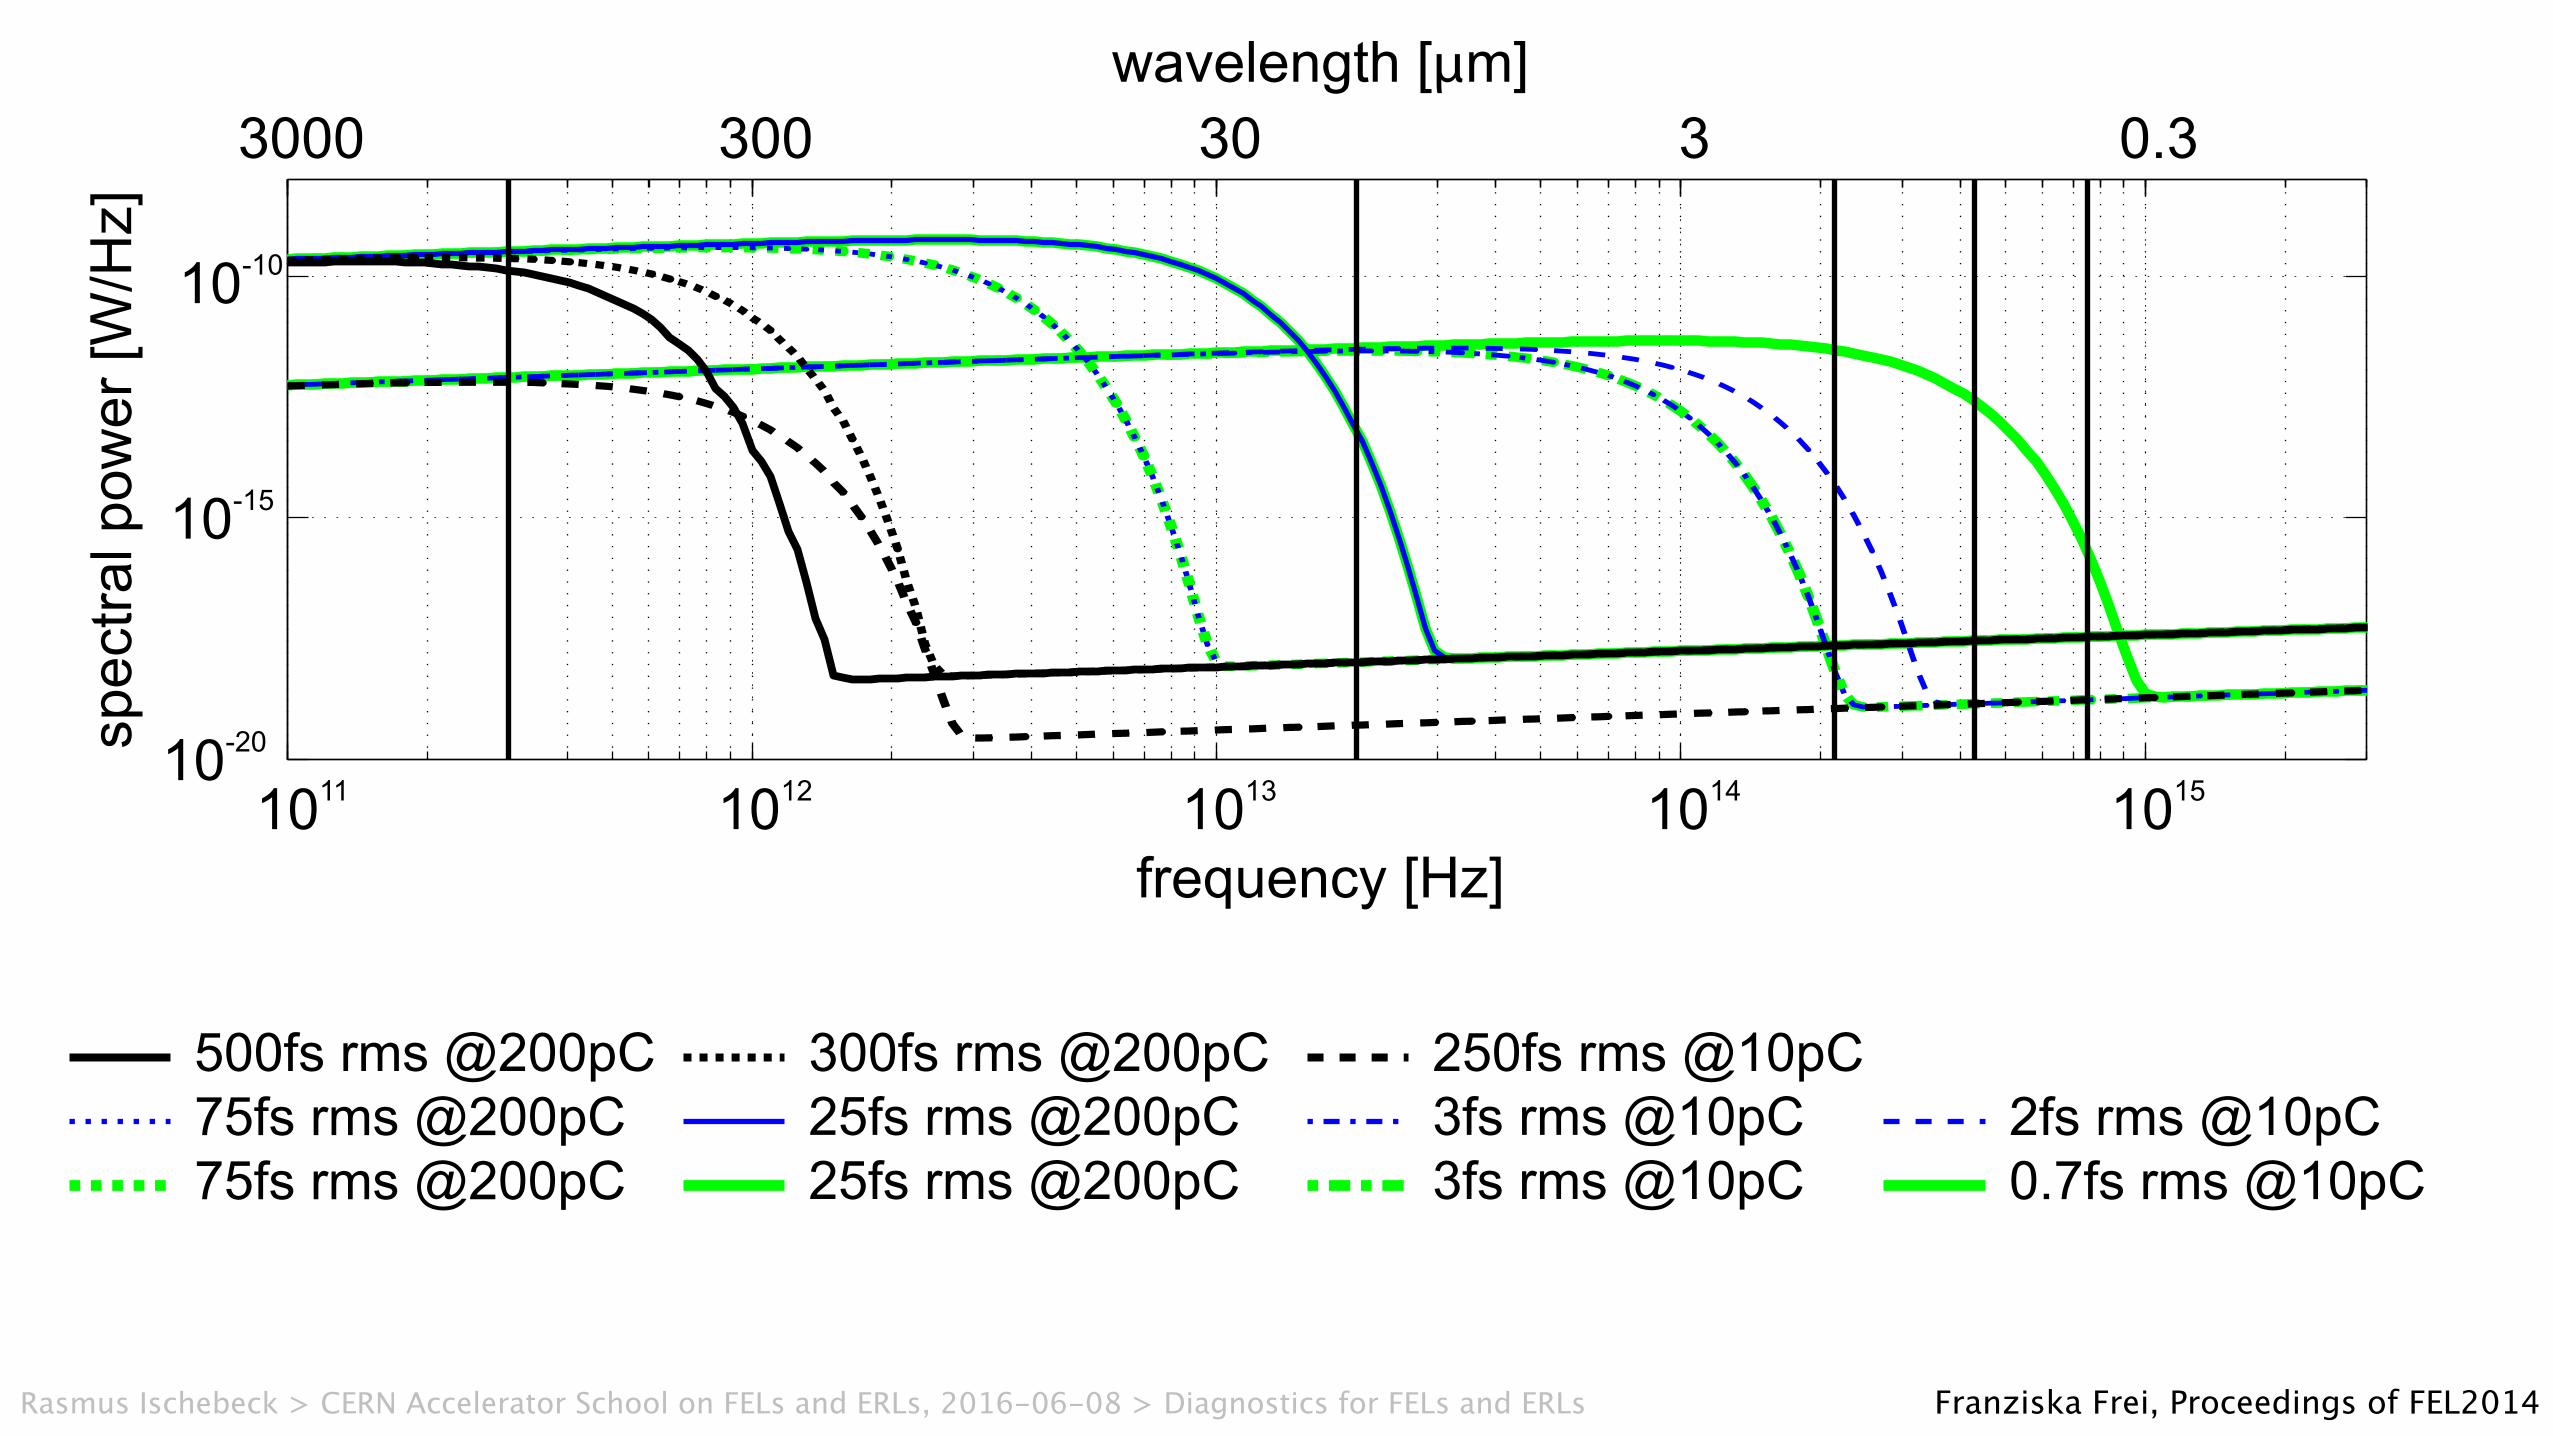
Franziska Frei, Proceedings of FEL2014
spectr
al pow
er
[W/H
z]
-20
10
-15
10
-10
10
11
1012
1013
1014
1015
10
3000 300 30 3 0.3
frequency [Hz]
wavelength [µm]
0.7fs rms @10pC3fs rms @10pC25fs rms @200pC75fs rms @200pC
2fs rms @10pC3fs rms @10pC25fs rms @200pC75fs rms @200pC
250fs rms @10pC300fs rms @200pC500fs rms @200pC
Rasmus Ischebeck > CERN Accelerator School on FELs and ERLs, 2016-06-08 > Diagnostics for FELs and ERLs
Rasmus Ischebeck
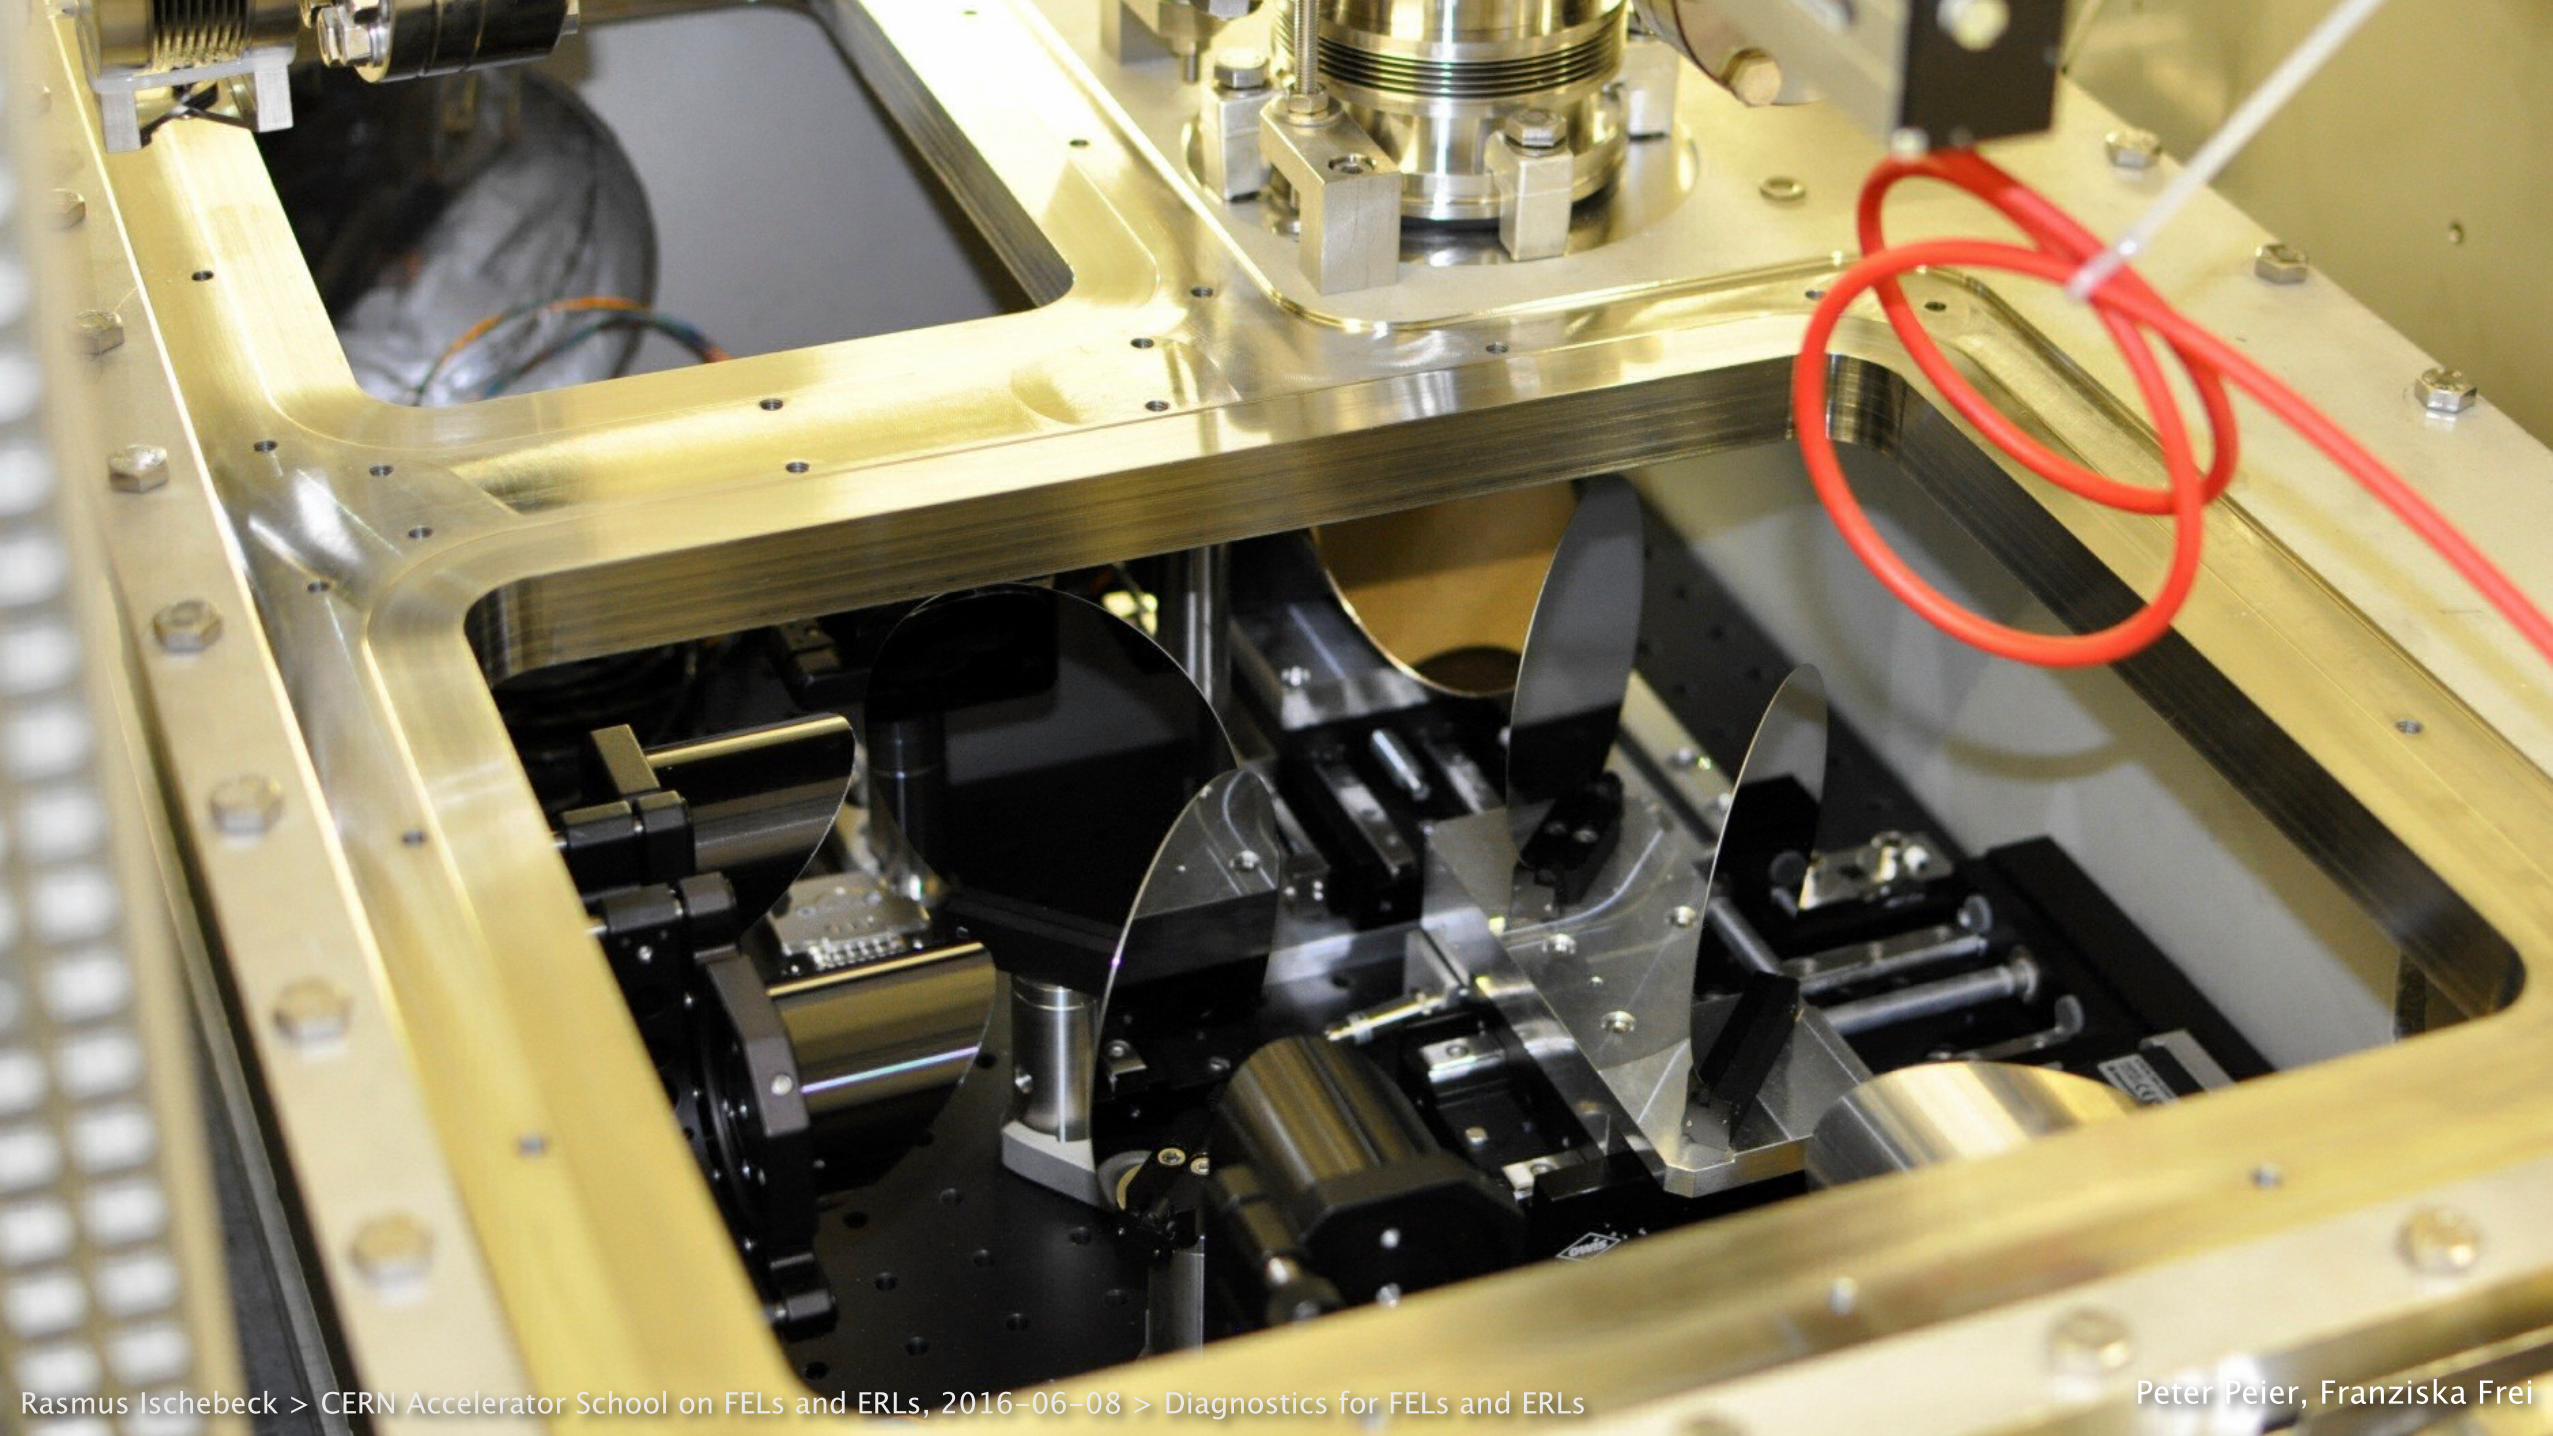
Technical Realization of Prototype in SITF: CSR Port
11.03.13PSI, Seite 7
Peter Peier, Franziska FreiRasmus Ischebeck > CERN Accelerator School on FELs and ERLs, 2016-06-08 > Diagnostics for FELs and ERLs
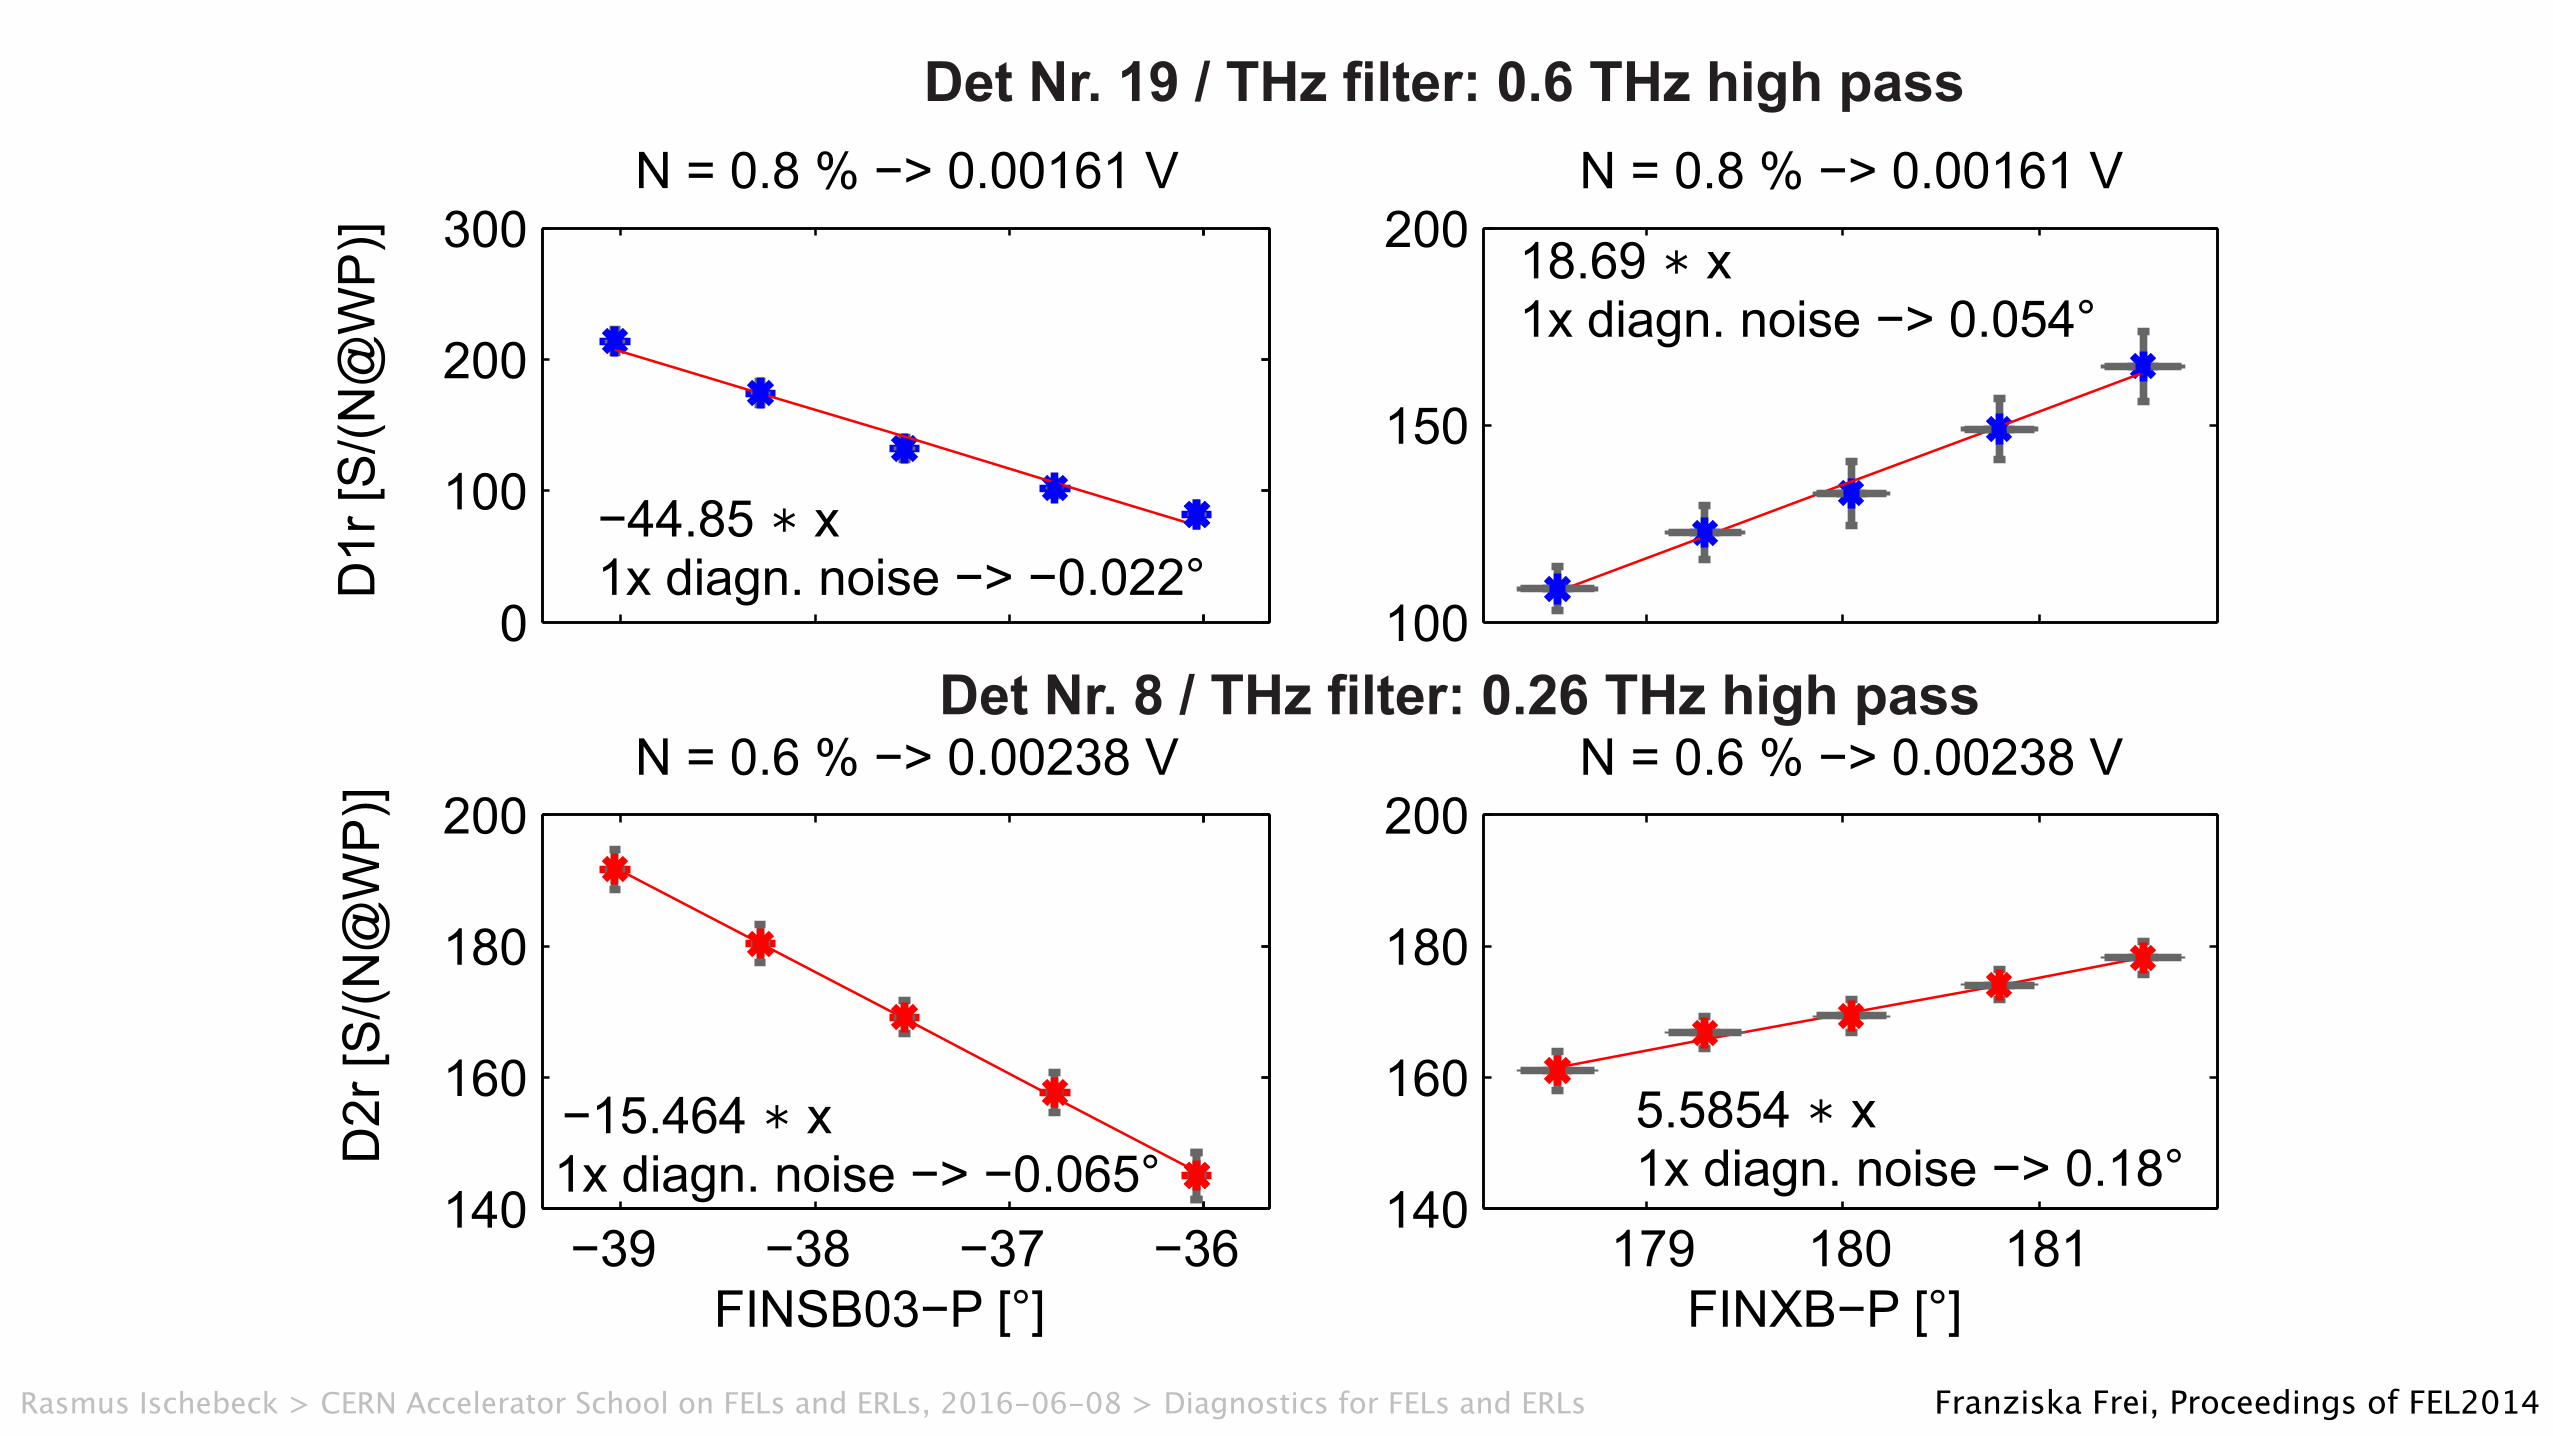
D1r
[]
S/(
N@
WP
)D
2r
[]
S/(
N@
WP
)
Det Nr. 19 / THz filter: 0.6 THz high pass
Det Nr. 8 / THz filter: 0.26 THz high pass
0
100
200
300
−44.85 x∗
1x diagn. noise −> −0.022°
N = 0.8 % −> 0.00161 V
140
160
180
200
−15.464 x∗
1x diagn. noise −> −0.065°
N = 0.6 % −> 0.00238 V
100
150
20018.69 x∗
1x diagn. noise −> 0.054°
N = 0.8 % −> 0.00161 V
140
160
180
200
5.5854 x∗
1x diagn. noise −> 0.18°
N = 0.6 % −> 0.00238 V
179 180 181FINXB−P [ ]°
−39 −38 −37 −36FINSB03−P [ ]°
Franziska Frei, Proceedings of FEL2014Rasmus Ischebeck > CERN Accelerator School on FELs and ERLs, 2016-06-08 > Diagnostics for FELs and ERLs
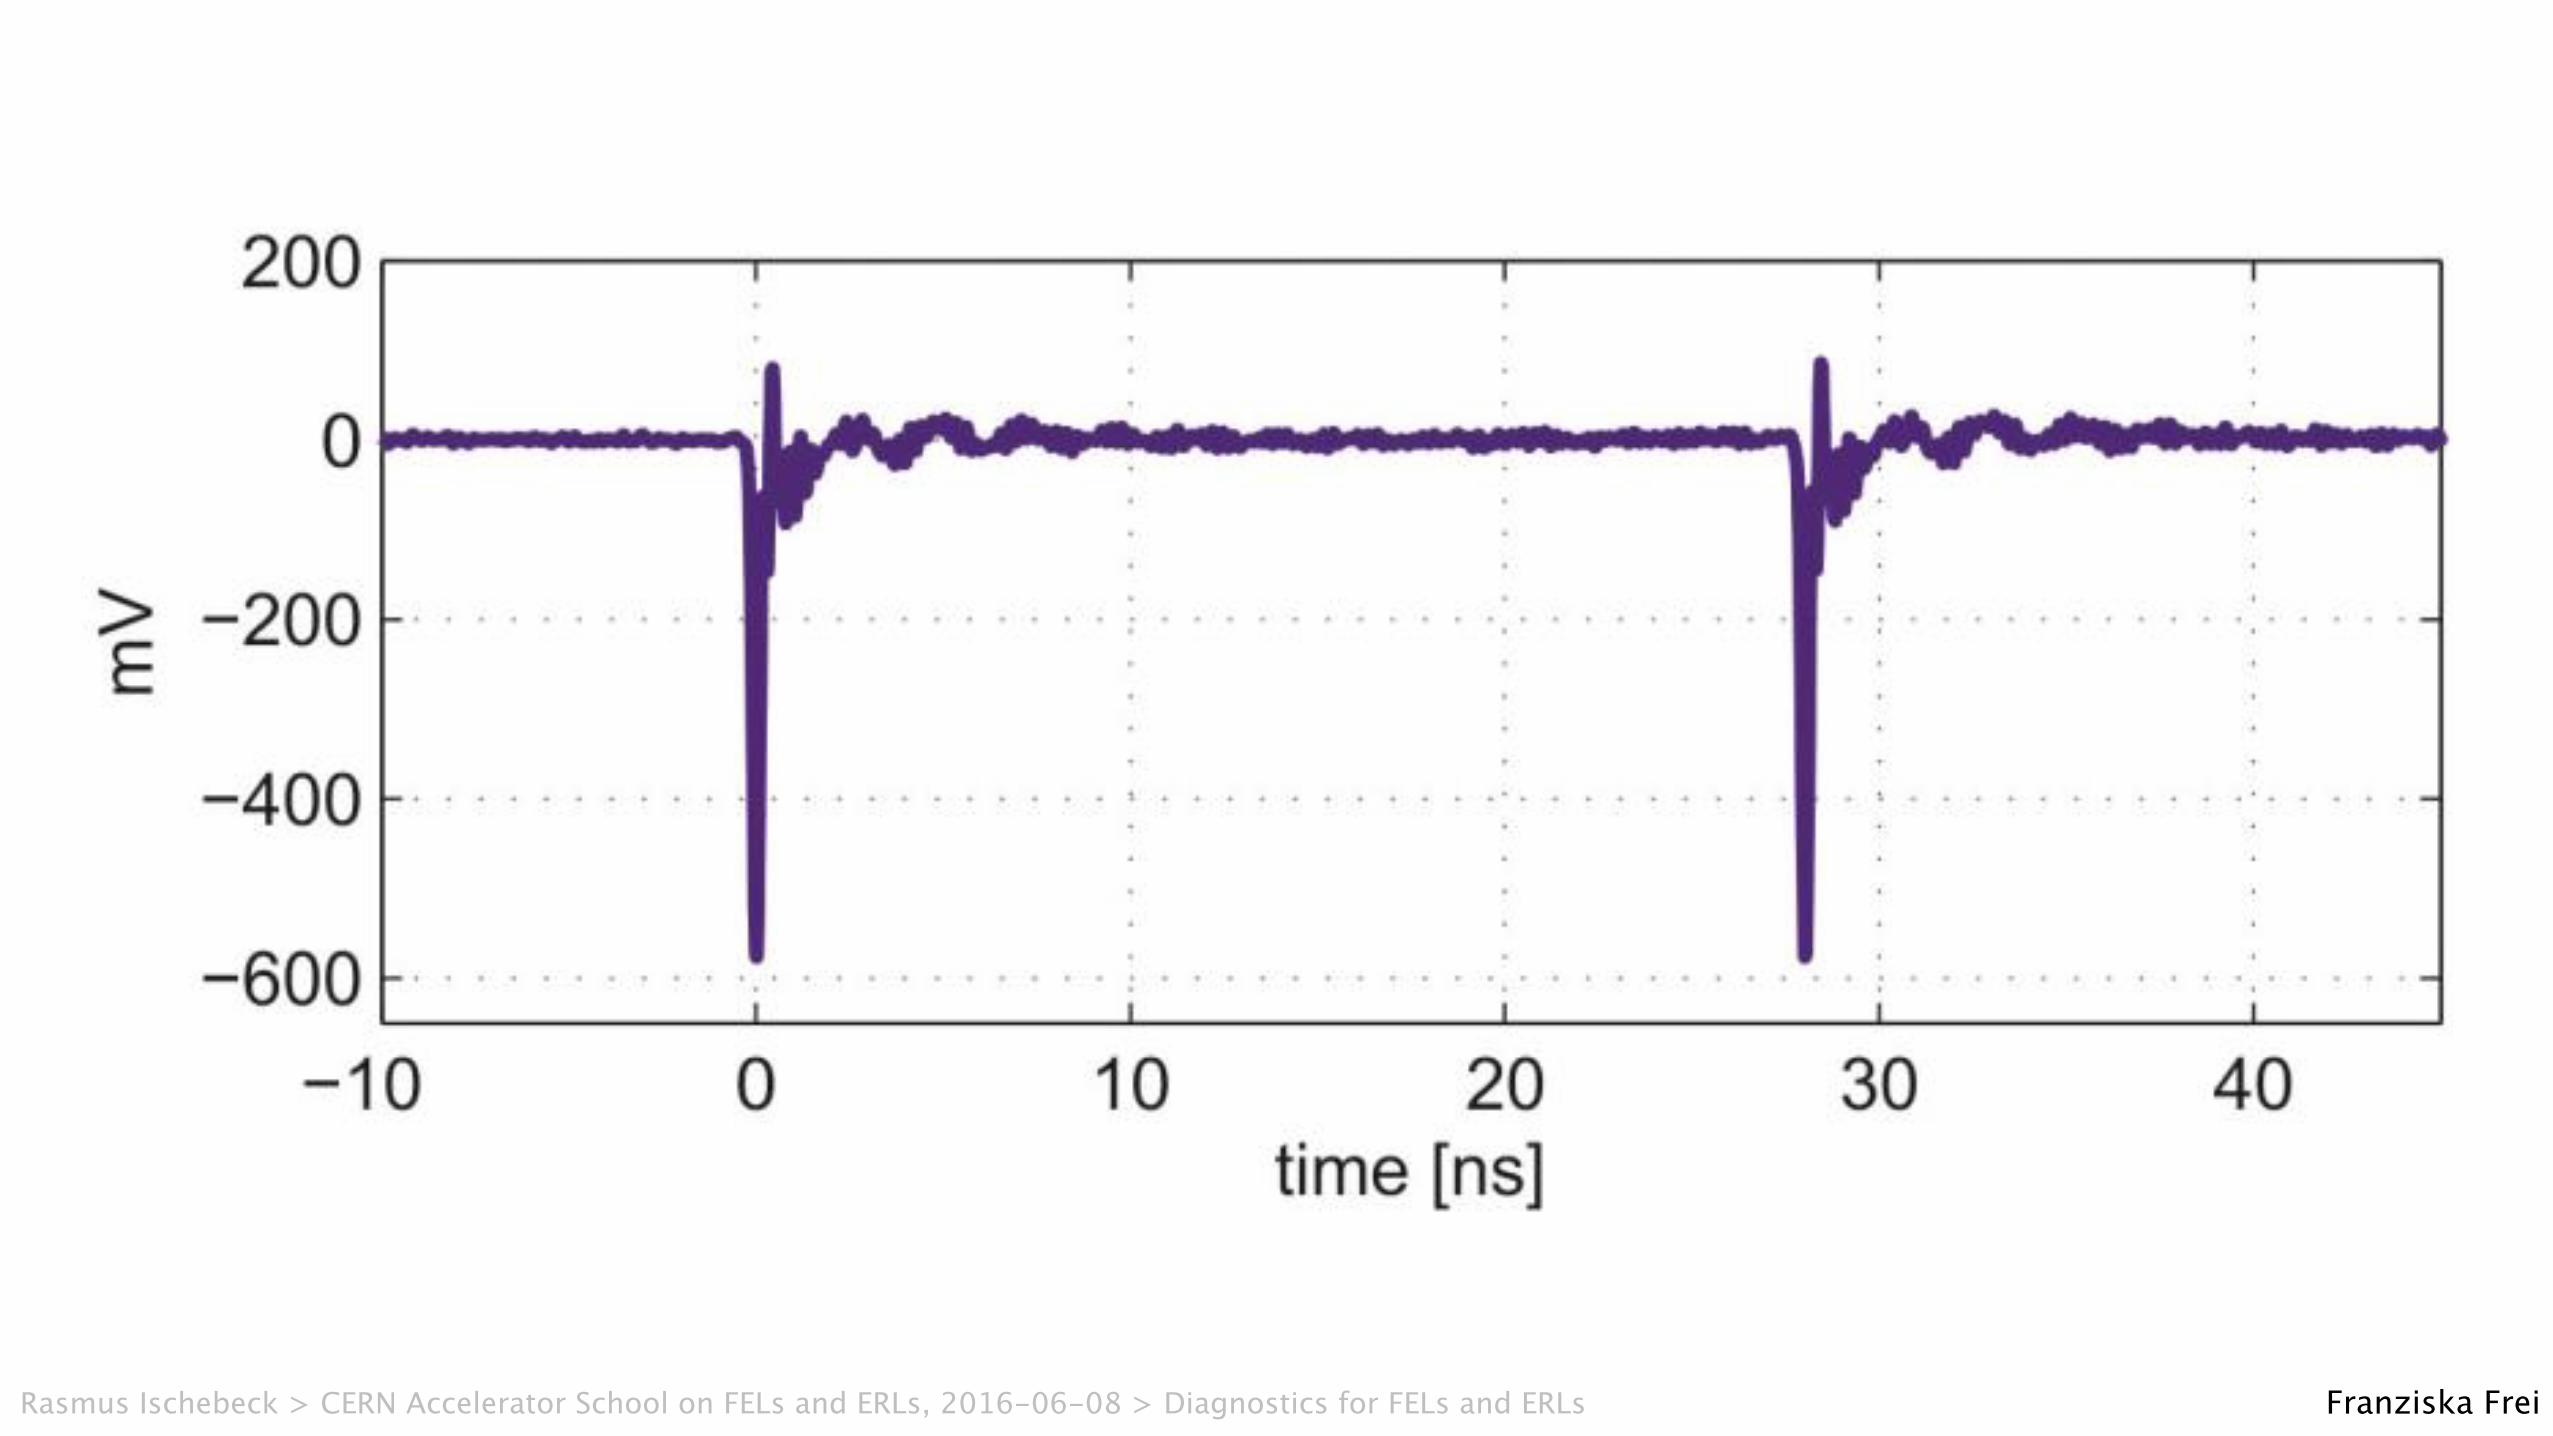
Detector Signals – semiconductor detectors
Purpose: bunch compression monitor Location: BCM after BC1 Front-end: E-XFEL button BPM RFFE 12 bit ADC (500MS/s), 1 ch/detector Digitization of S&H output EVR + IOC per location
18. März 2015 PSI, Seite 2
Fast MCT: Location: CDR port after BC2 Front-end: RFFE with some adaptation Digitization of S&H output 12 bit ADC, 1ch/detector EVR + IOC per location
Slow MCT:
Location: BCM after BC2 Front-end: Commercial 12 or 16 bit ADC (tbd) Integration of digitized signal EVR + IOC per location
Schottky Diodes MCT
Fast MCT raw signal
Franziska FreiRasmus Ischebeck > CERN Accelerator School on FELs and ERLs, 2016-06-08 > Diagnostics for FELs and ERLs
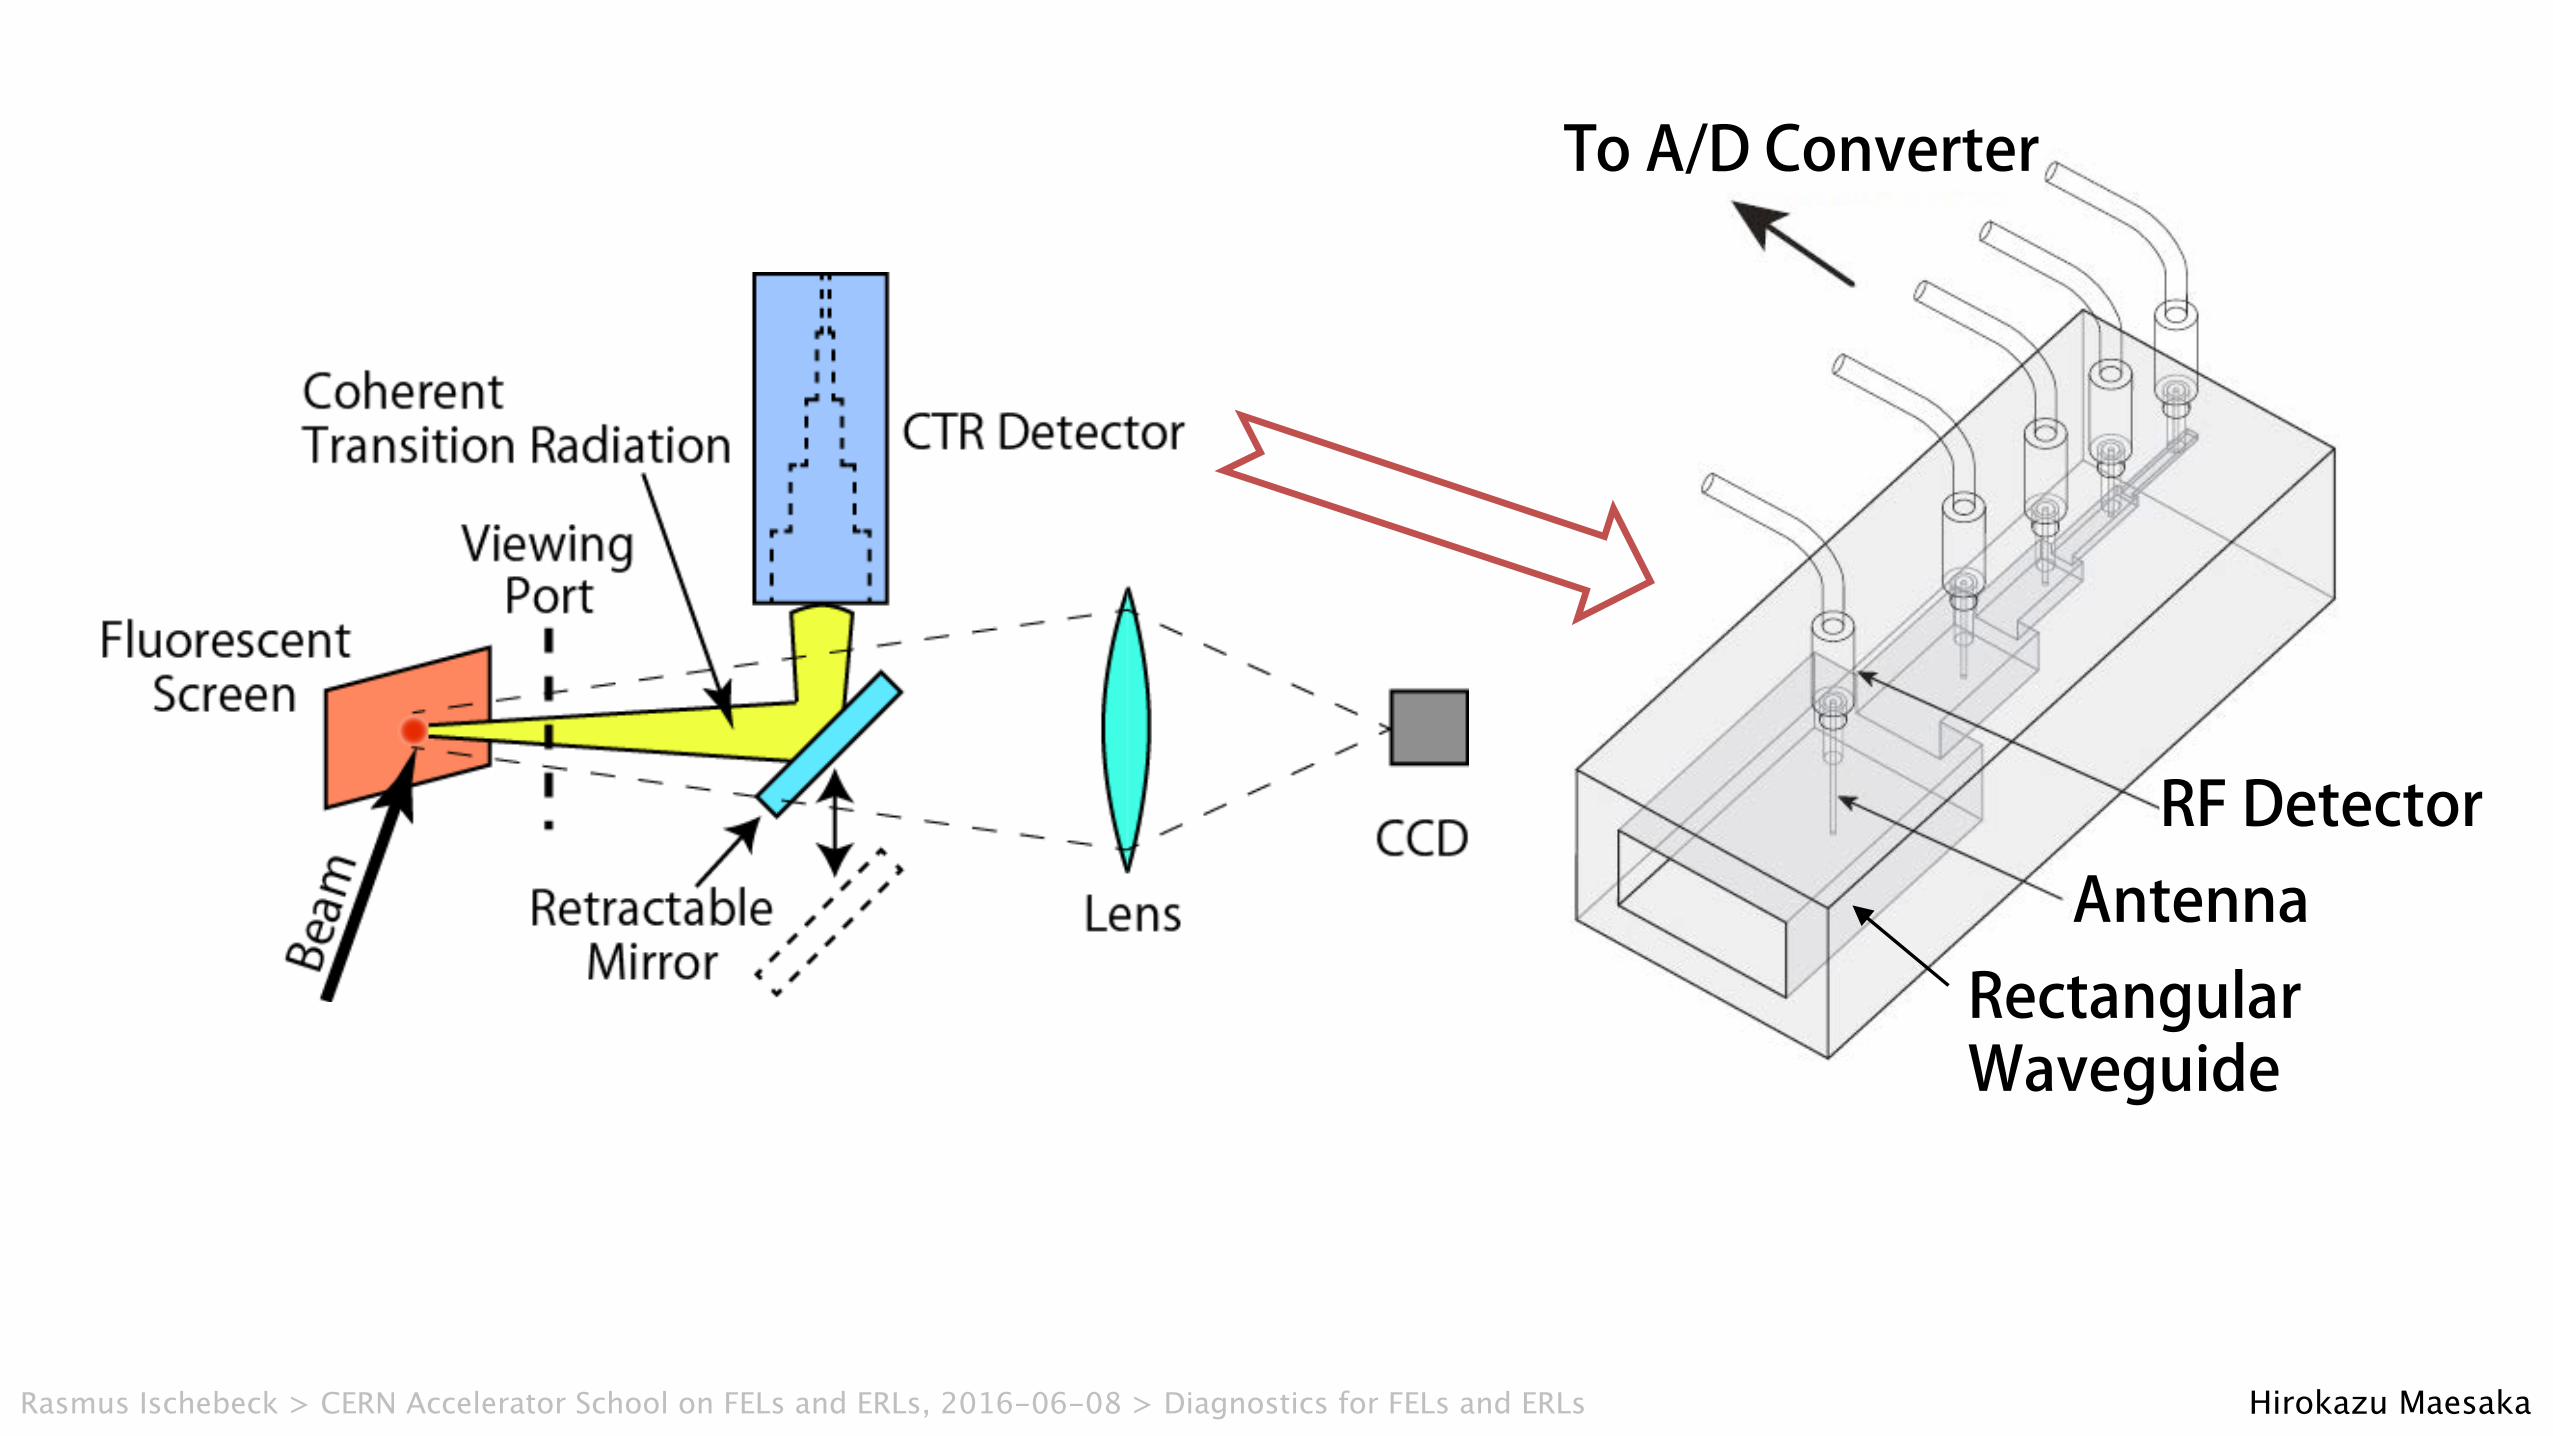
Antenna RF Detector
To A/D Converter
Rectangular Waveguide
CTR Monitor
• Coherent transition radiation from a fluorescent screen is detected.
• By using a cut off of a rectangular waveguide, this works as a single-shot spectrometer.
• In the injector part, about 10 GHz rf signal is obtained. – Bunch length ~ 100 ps
Oct. 1st, 2012 27
Hirokazu MaesakaRasmus Ischebeck > CERN Accelerator School on FELs and ERLs, 2016-06-08 > Diagnostics for FELs and ERLs
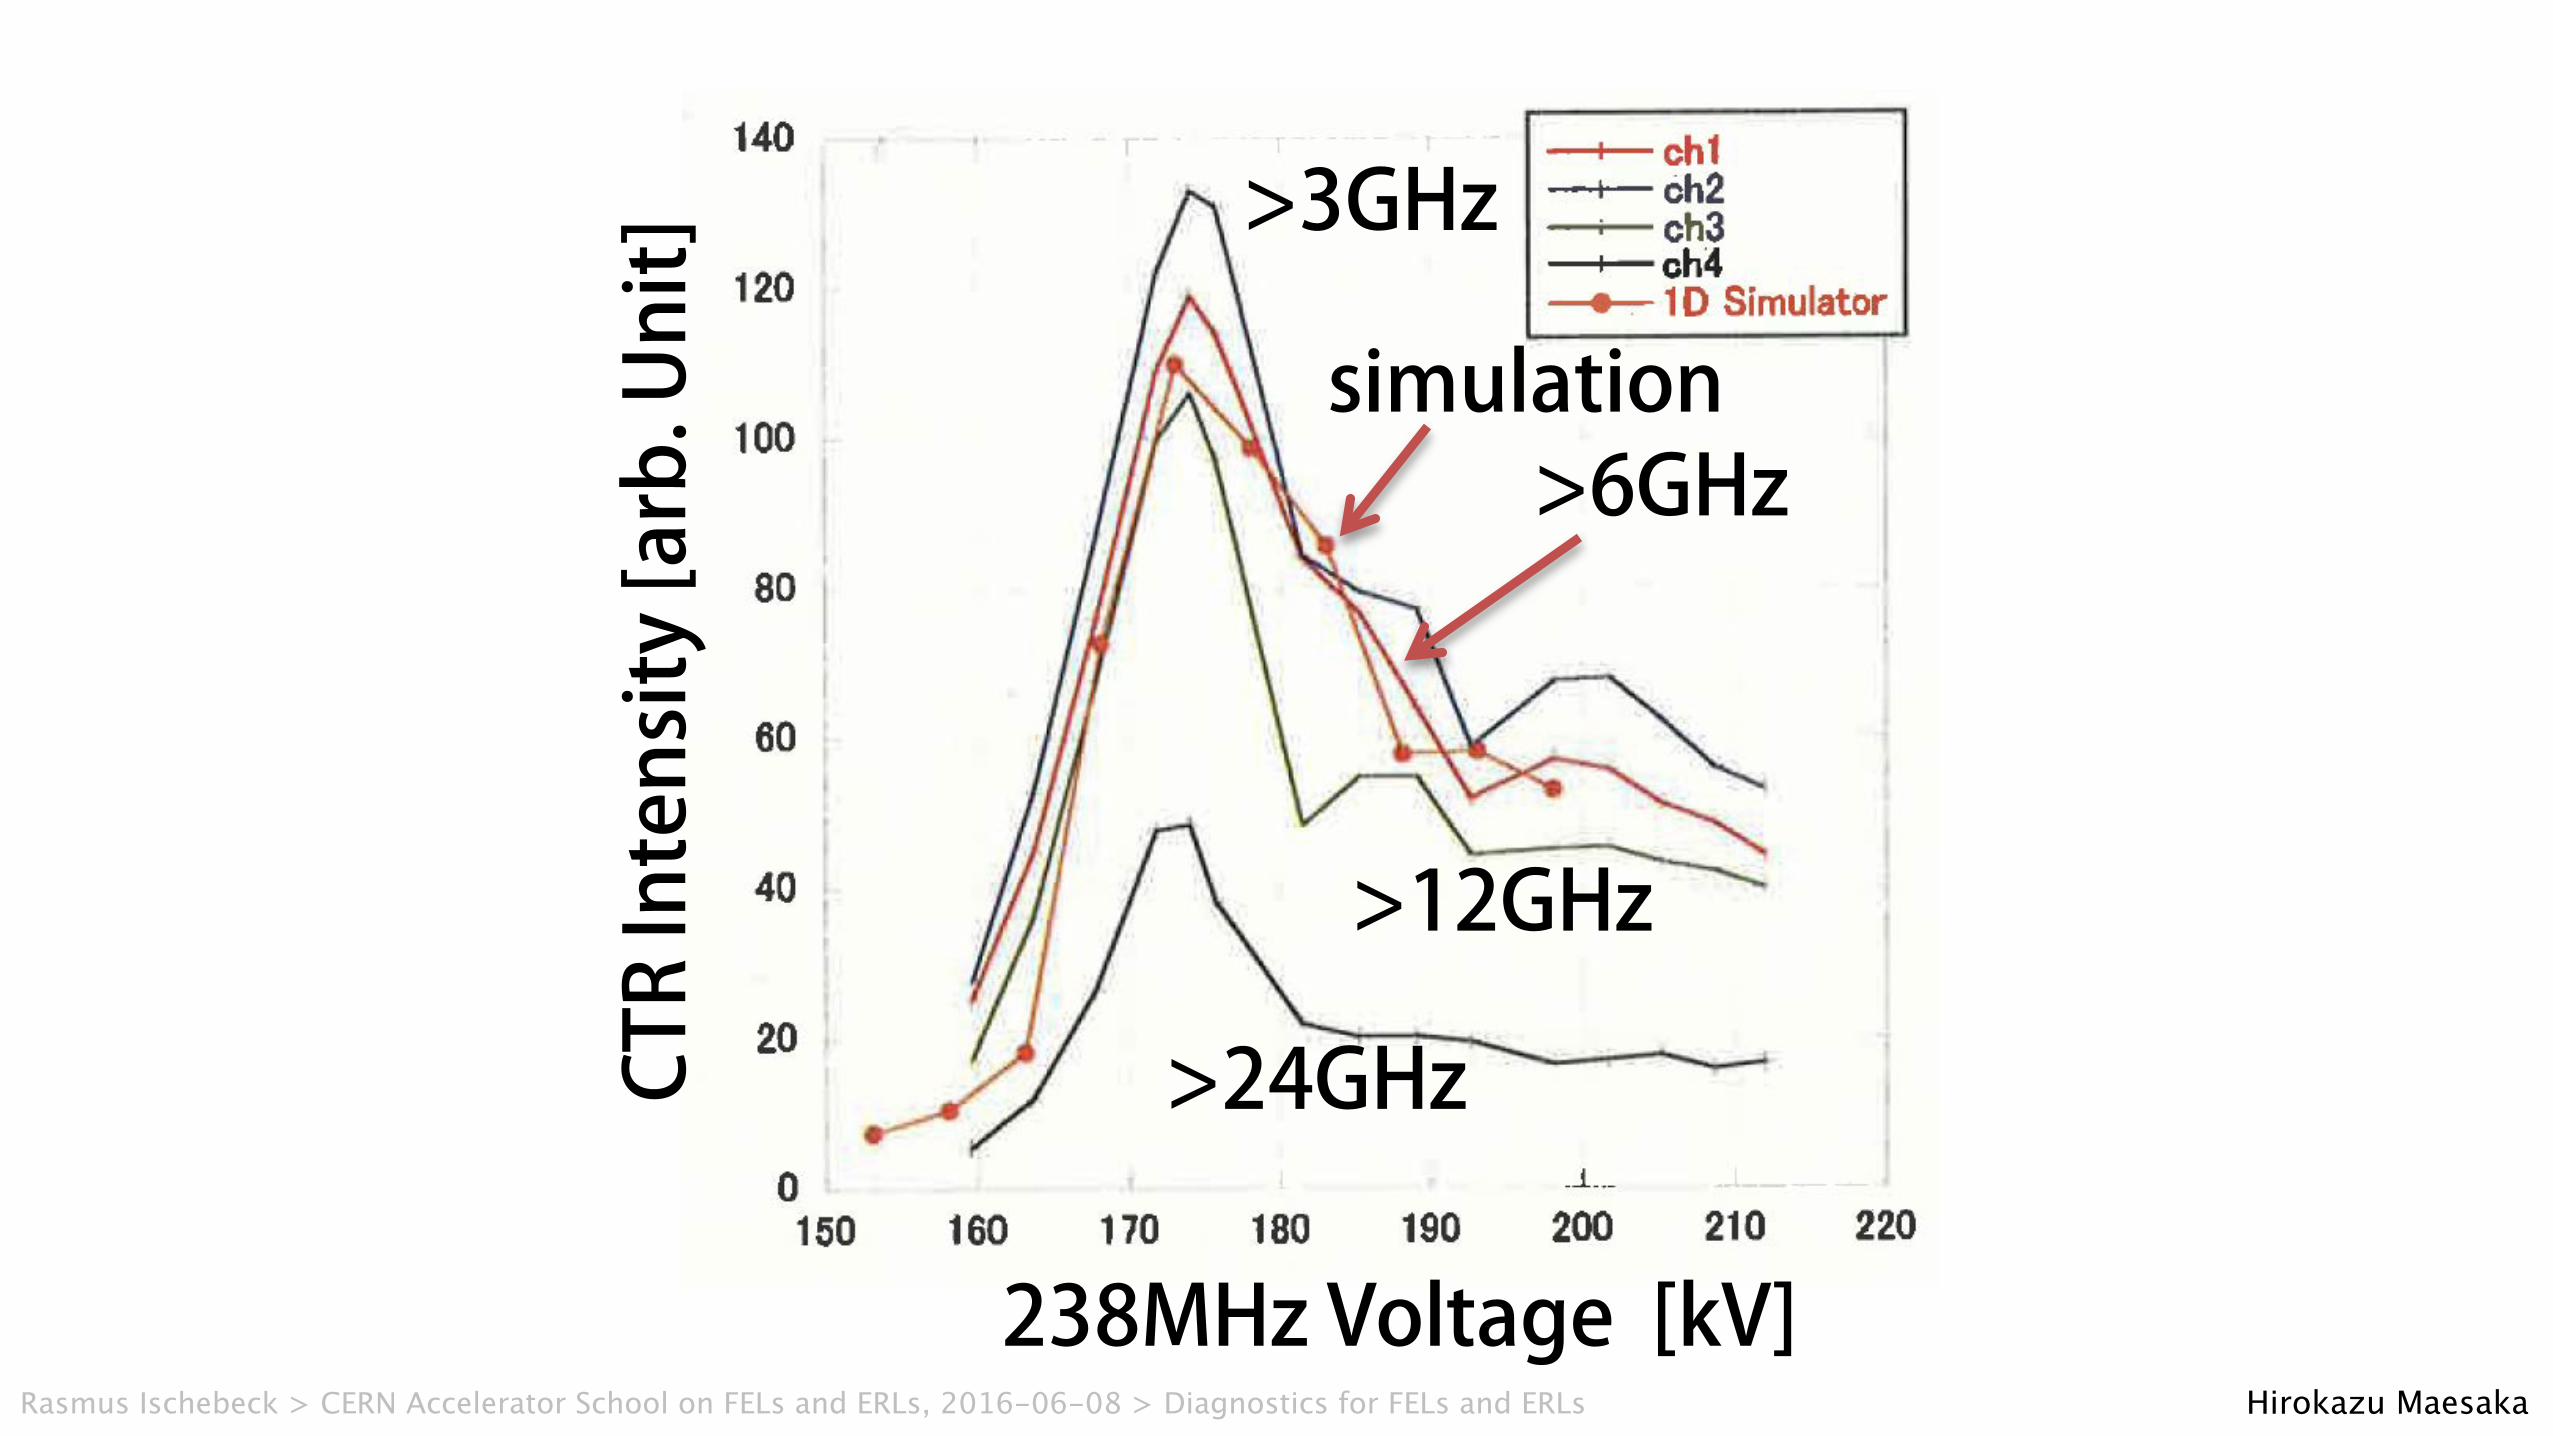
CTR Monitor Data
• The signal strength has a correlation with the bunch length. – Consistent with 1D simulation – Amplitude and phase of the sub-harmonic cavities can be determined
Oct. 1st, 2012 28
>3GHz
>6GHz
>12GHz
>24GHz
238MHz Voltage [kV]
simulation
CTR Intensity [arb. Unit]
Accelerating voltages of 238MHz sub-harmonic buncher cavity was scanned. (476 MHz booster was turned off.)
Hirokazu MaesakaRasmus Ischebeck > CERN Accelerator School on FELs and ERLs, 2016-06-08 > Diagnostics for FELs and ERLs
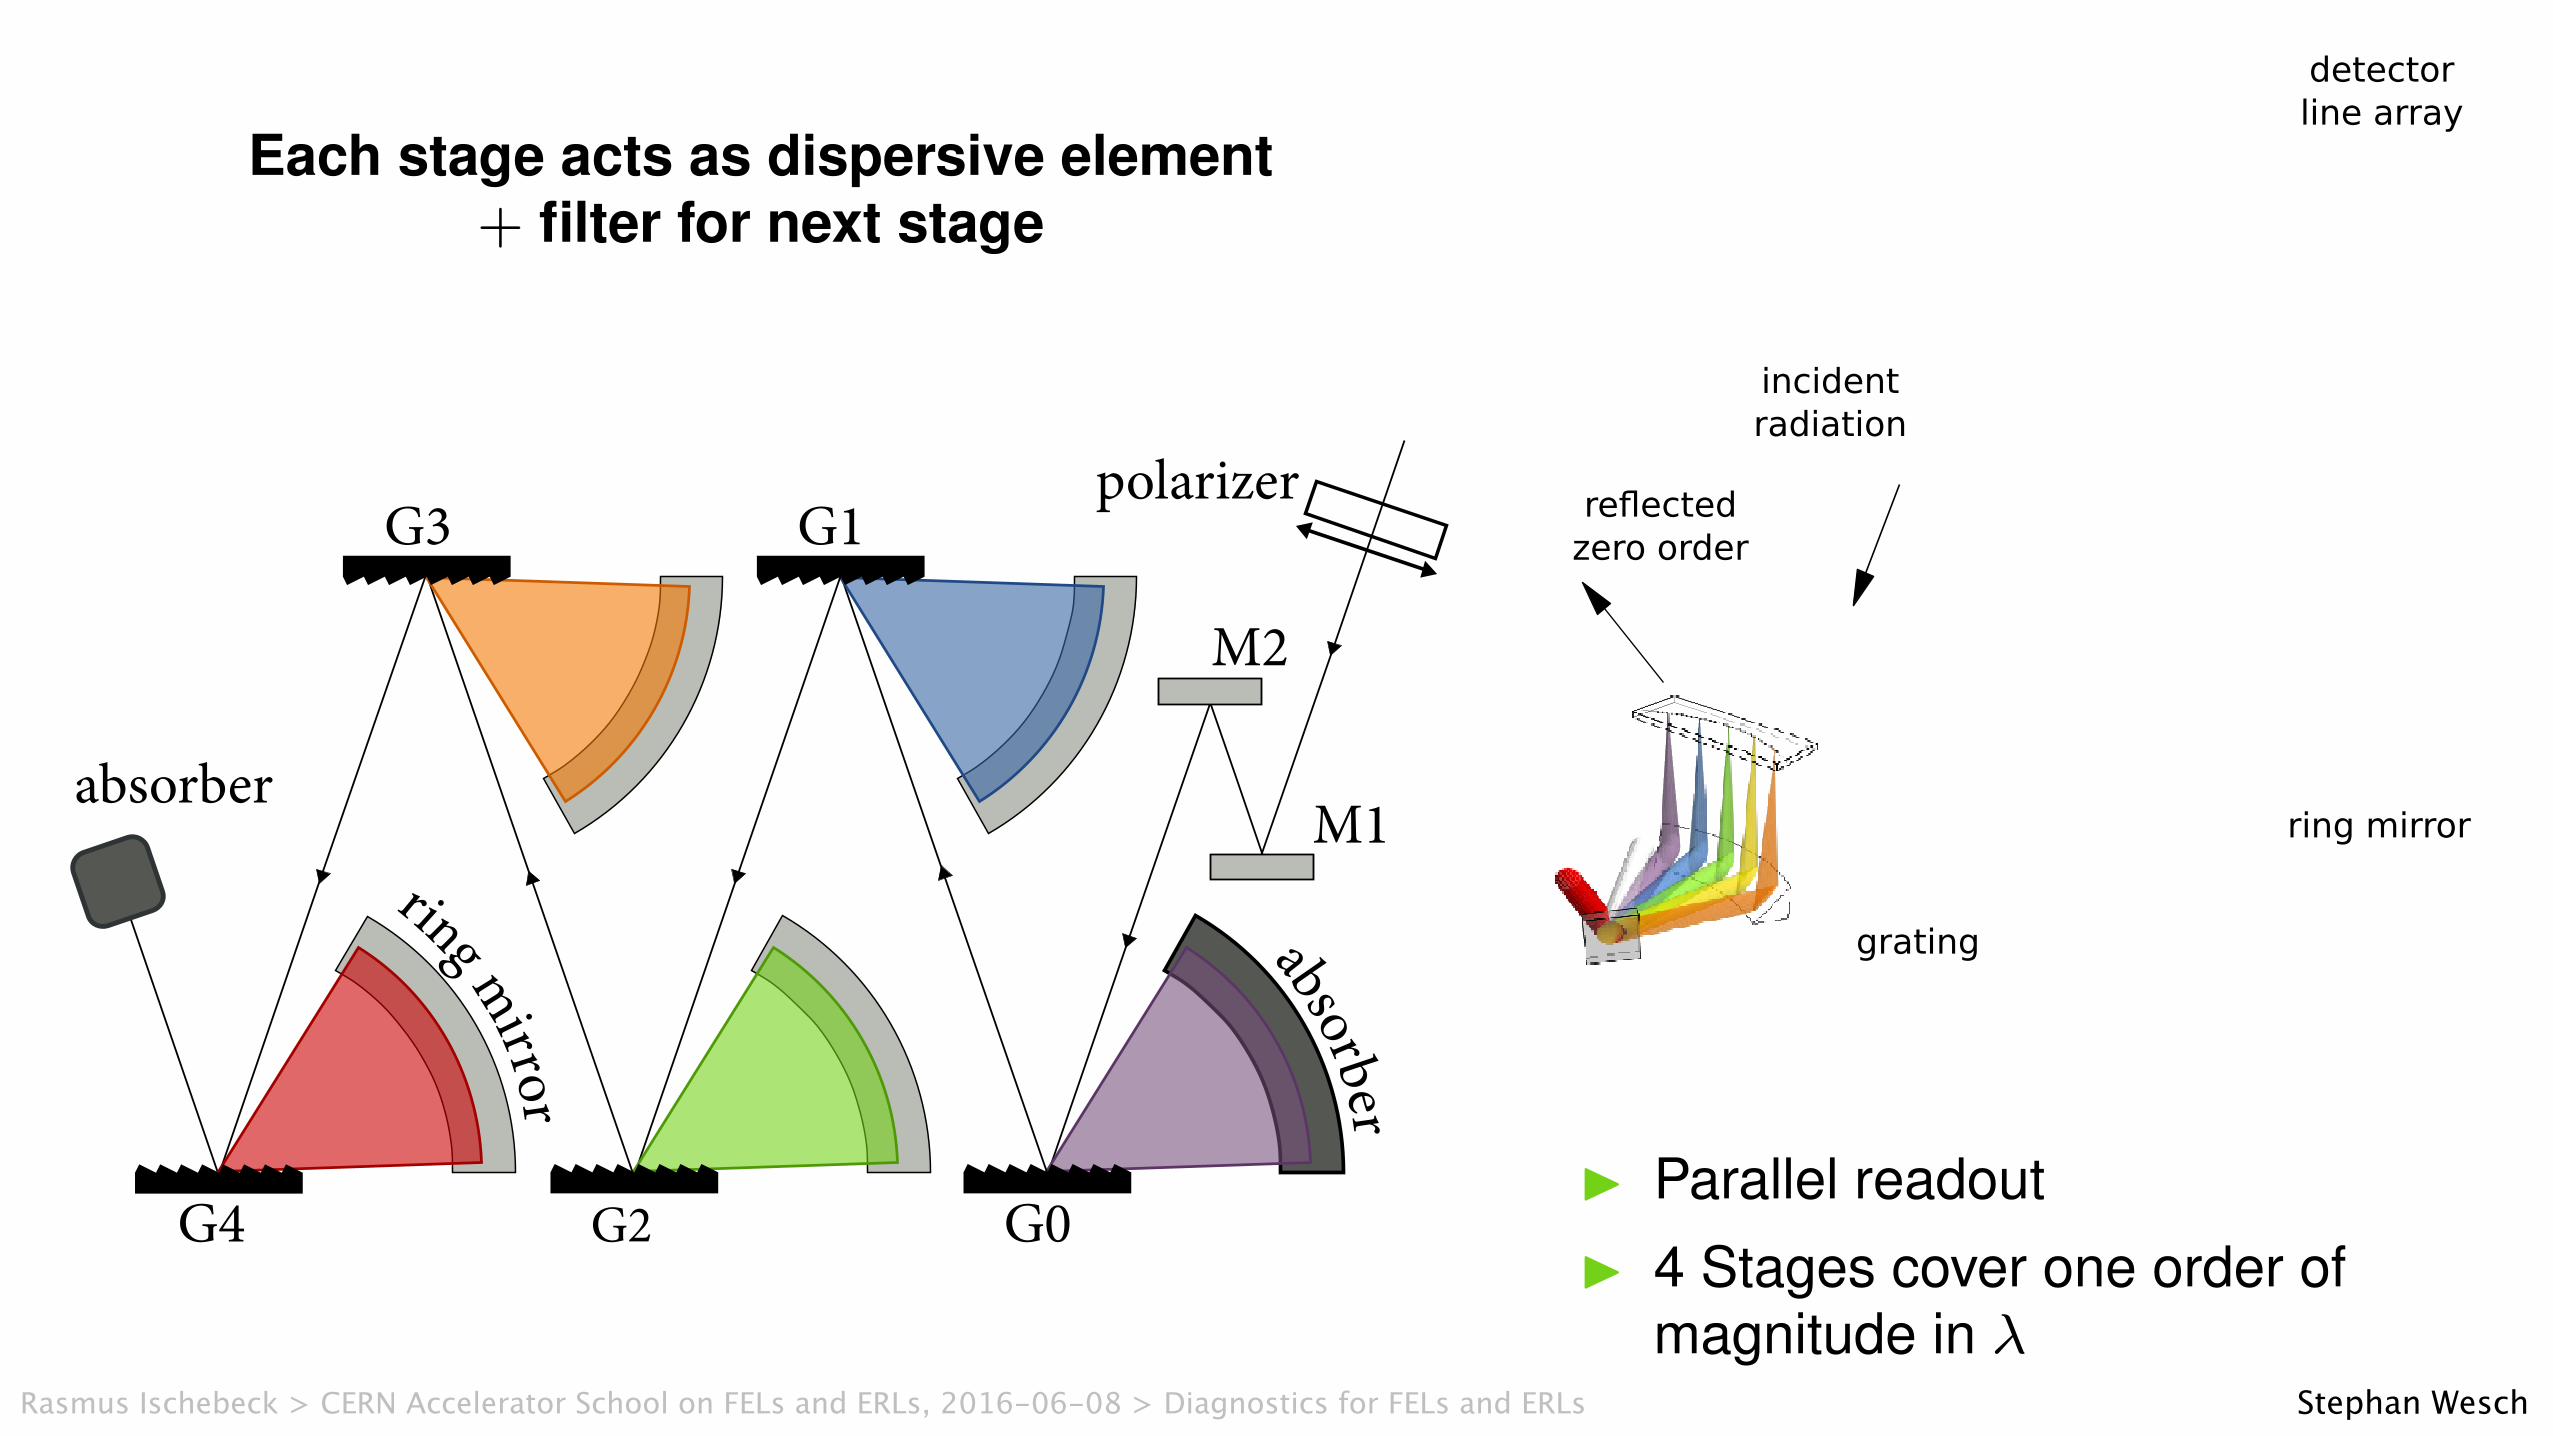
Design of CRISP4: Multi-staged Gratings
Each stage acts as dispersive element+ filter for next stage
�������
����������
���������������
�� ������������
����������������
I Parallel readoutI 4 Stages cover one order of
magnitude in �
S. Wesch (DESY) THz Bunch Profile Monitoring BIW 2012, Newport News 5 / 20
Stephan WeschRasmus Ischebeck > CERN Accelerator School on FELs and ERLs, 2016-06-08 > Diagnostics for FELs and ERLs
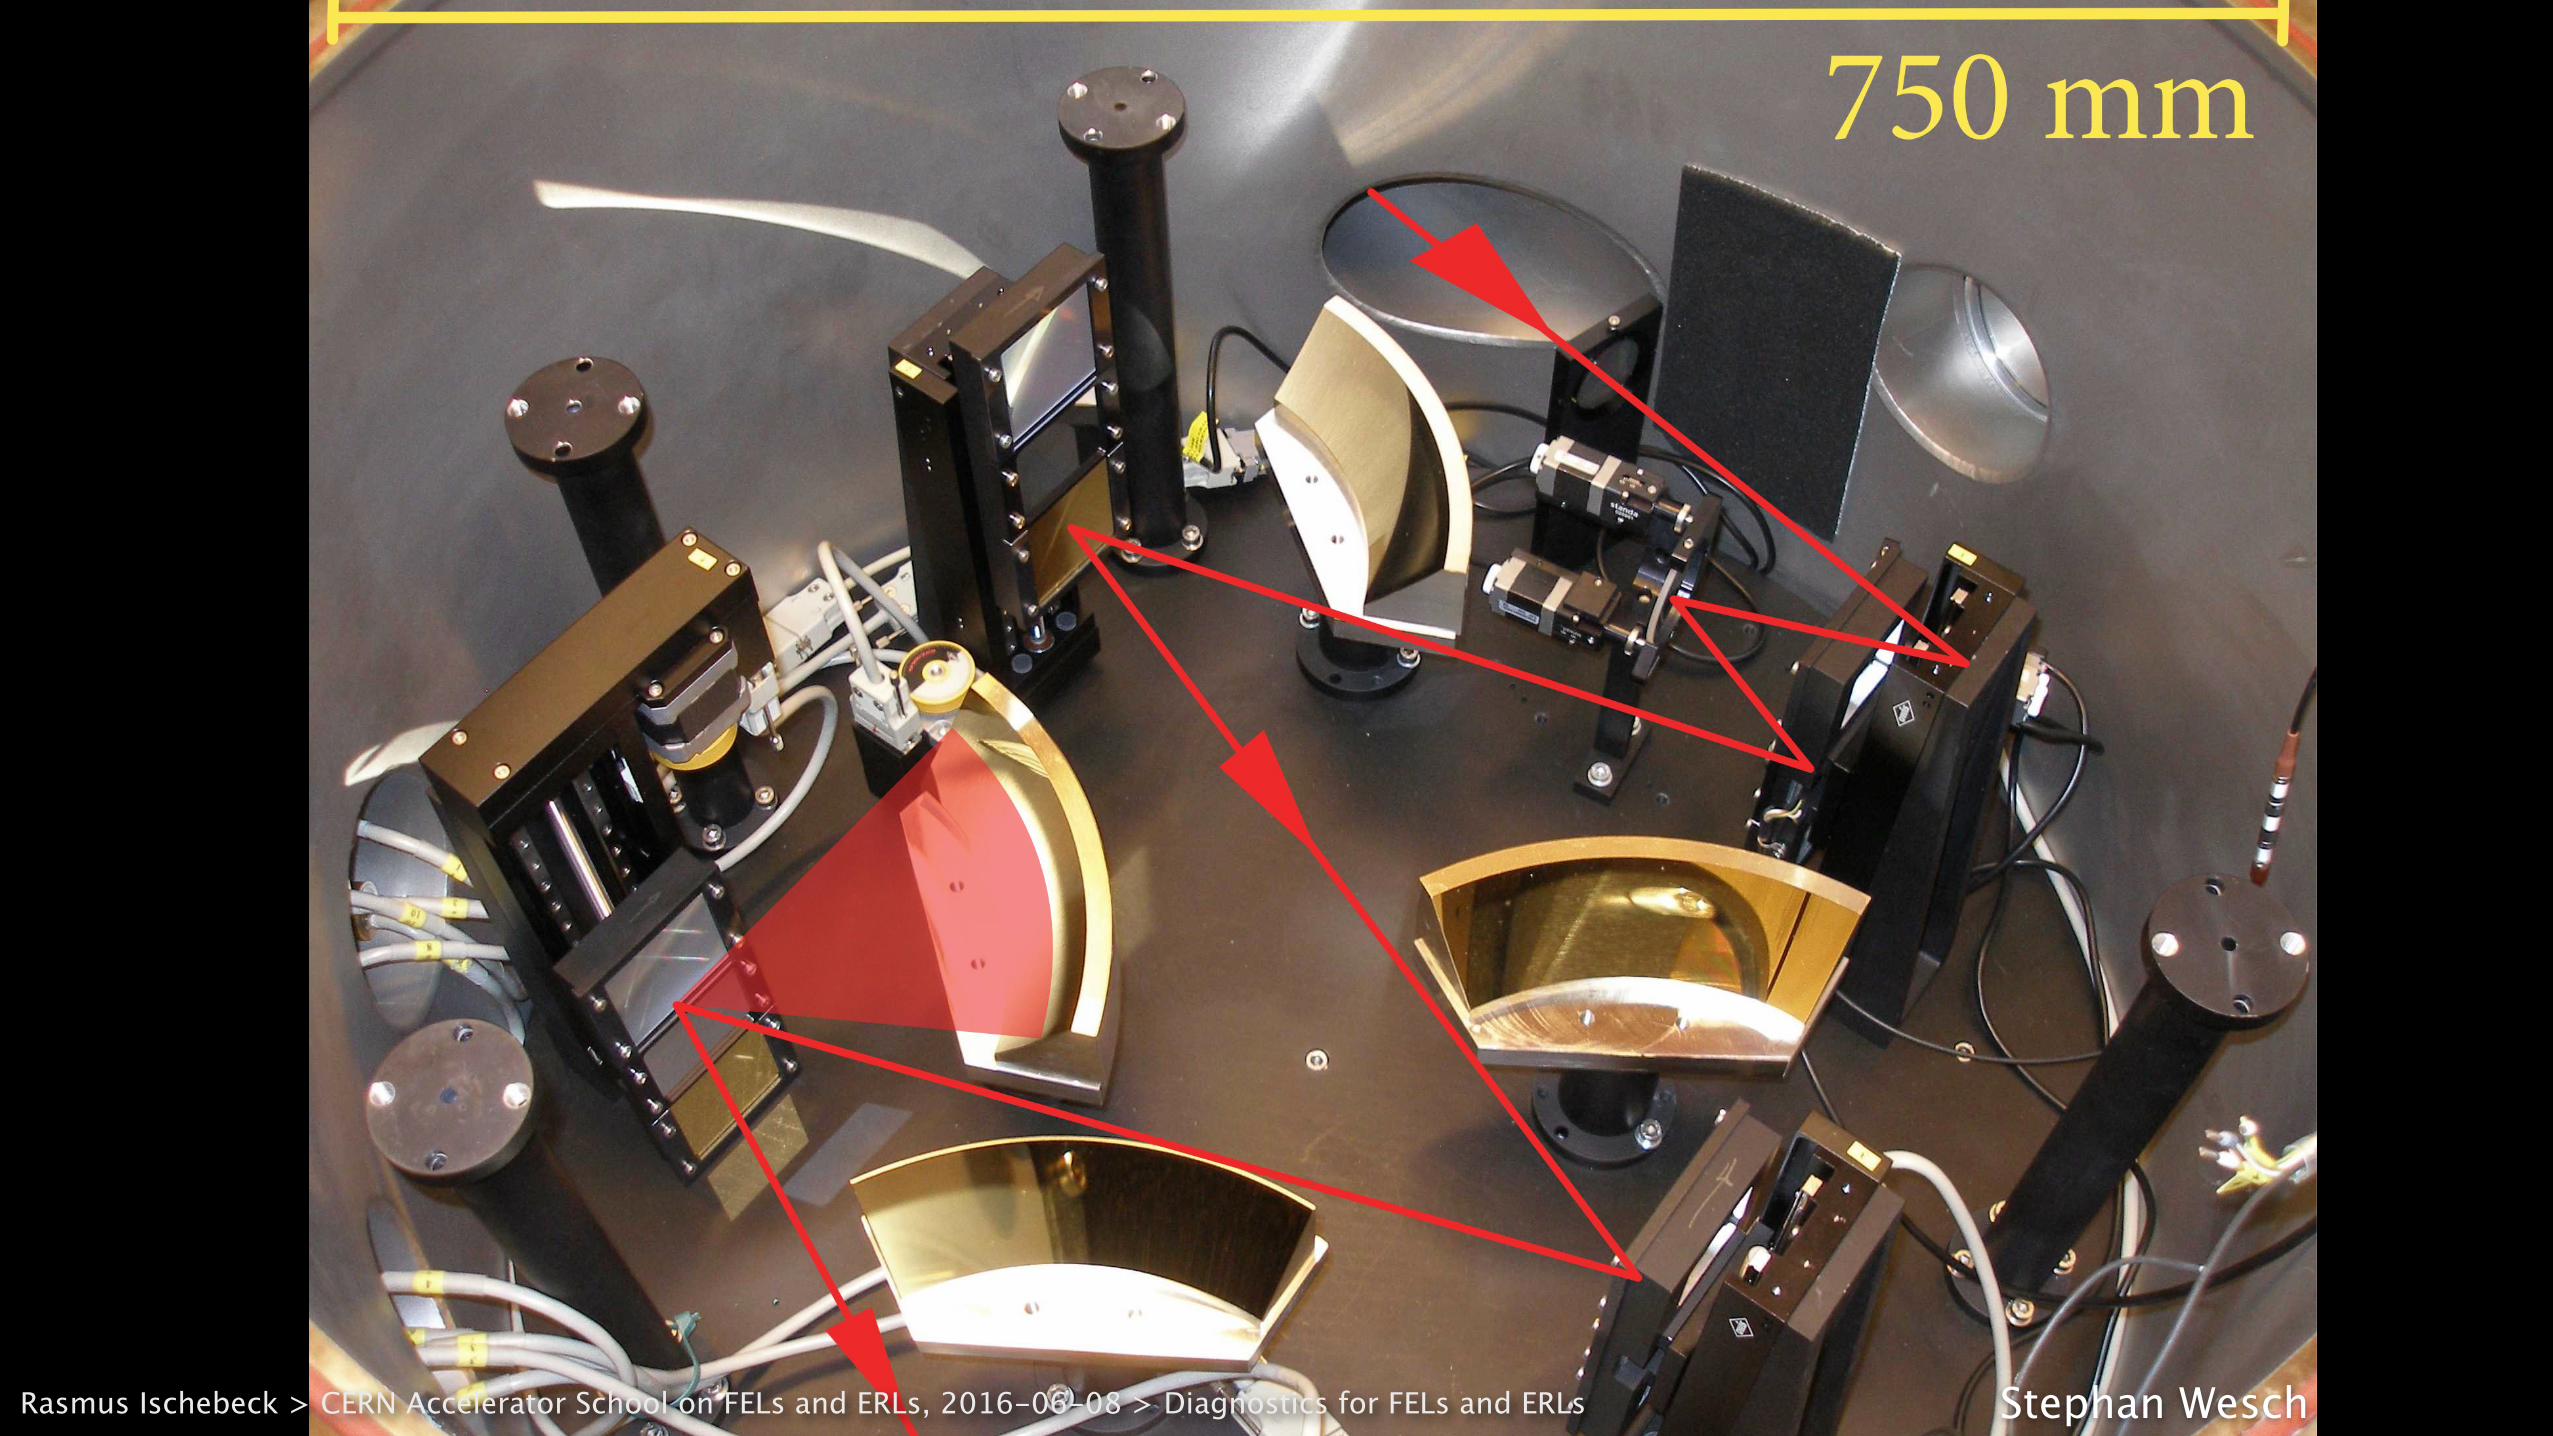
CRISP4: Setup
SpecificationsI Engineered version
I 2 Grating sets! �
Short
= 5 � 44 µm! �
Long
= 45 � 435 µm
I Mirror set! set aligment
I Ring mirror! line focus
I Inside vacuum vessel! avoid IR absorption
S. Wesch (DESY) THz Bunch Profile Monitoring BIW 2012, Newport News 6 / 20
Stephan WeschRasmus Ischebeck > CERN Accelerator School on FELs and ERLs, 2016-06-08 > Diagnostics for FELs and ERLs
SetupCRISP4
Courtesy of S.Wesch
• Five consecutive gratings as prefilter and dispersivedevices
• Wavelength coverage from 5.5 to 440µm with two setsof gratings
• Set one: 5.5 to 44µm
• Set two: 44 to 440µm
• One order of magnitude in � for four gratings• Parallel readout of 120 channels for one set of
gratings
E.Hass (University of Hamburg) 16 / 23
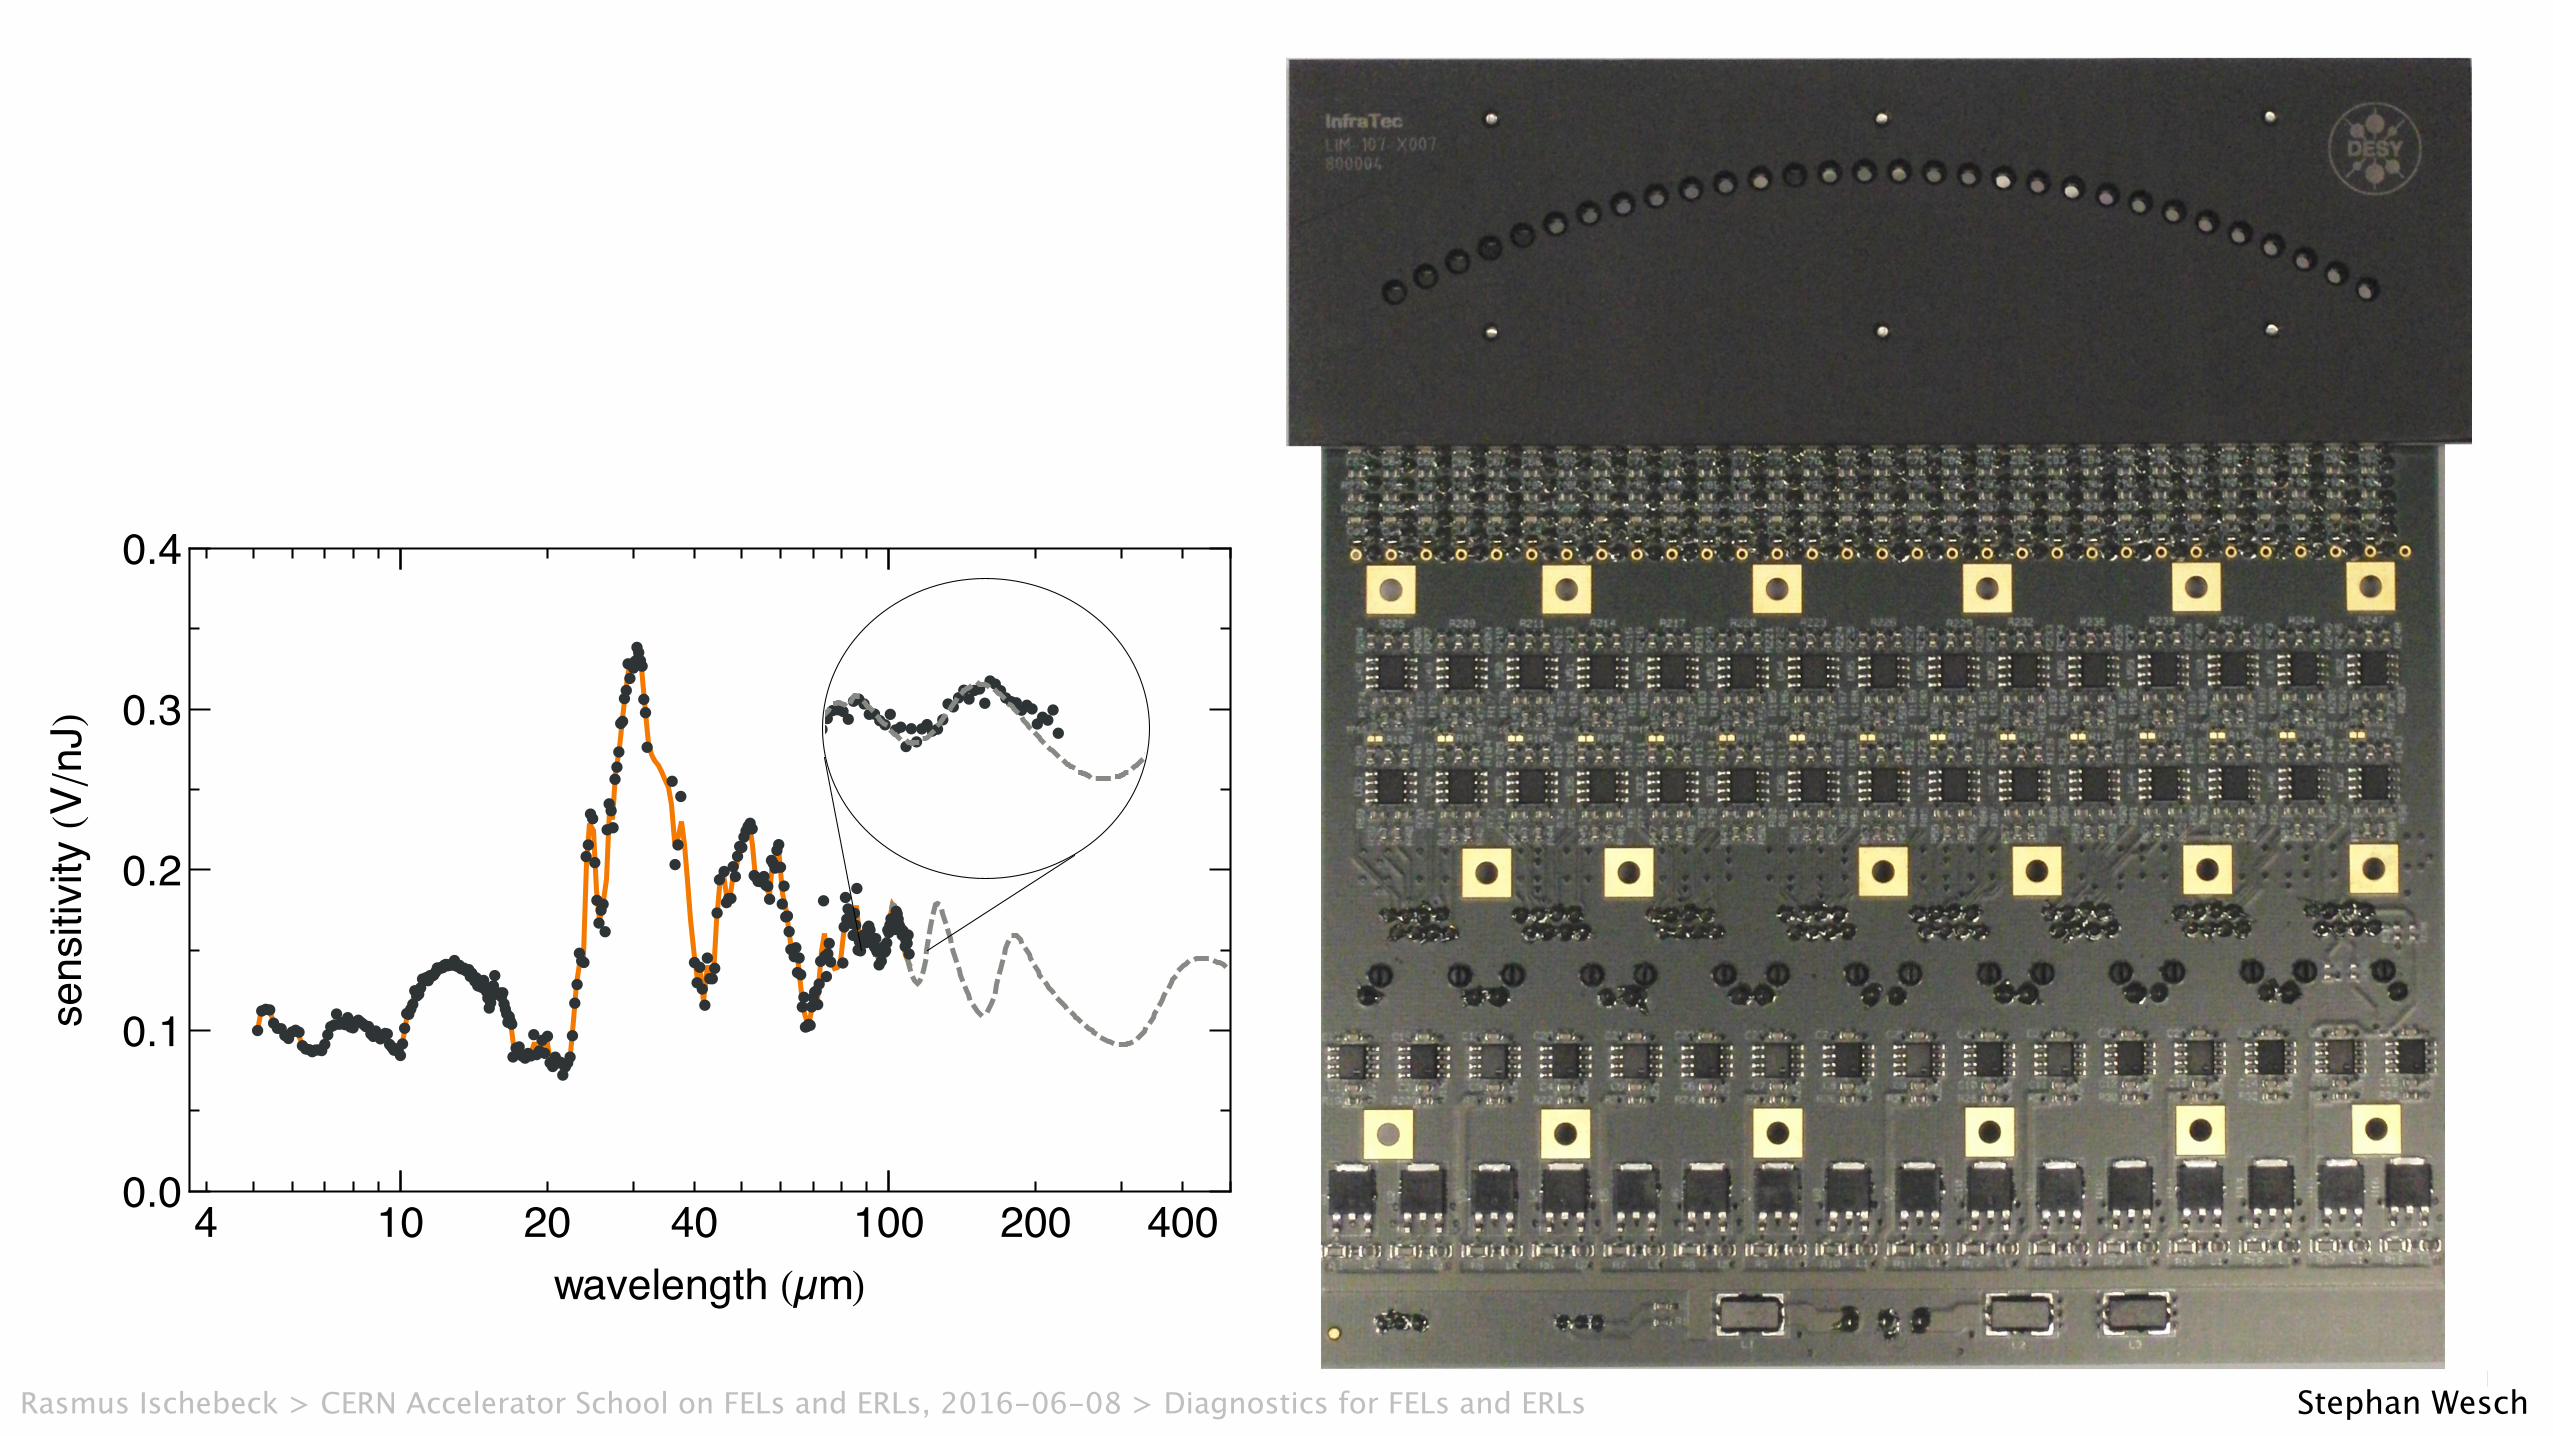
CRISP4: Pyroelectric Detectors
I BroadbandI Complex spectral sensitivityI Calibrated @ FELIX
4 10 20 40 100 200 4000.0
0.1
0.2
0.3
0.4
wavelength HµmL
sensitivityHVên
JL
I Custom-made pyro line detectorI 120 channels in totalI Integrated amplifier boardI Fast readout with 9 MHz sampling
S. Wesch (DESY) THz Bunch Profile Monitoring BIW 2012, Newport News 7 / 20
Stephan WeschRasmus Ischebeck > CERN Accelerator School on FELs and ERLs, 2016-06-08 > Diagnostics for FELs and ERLs
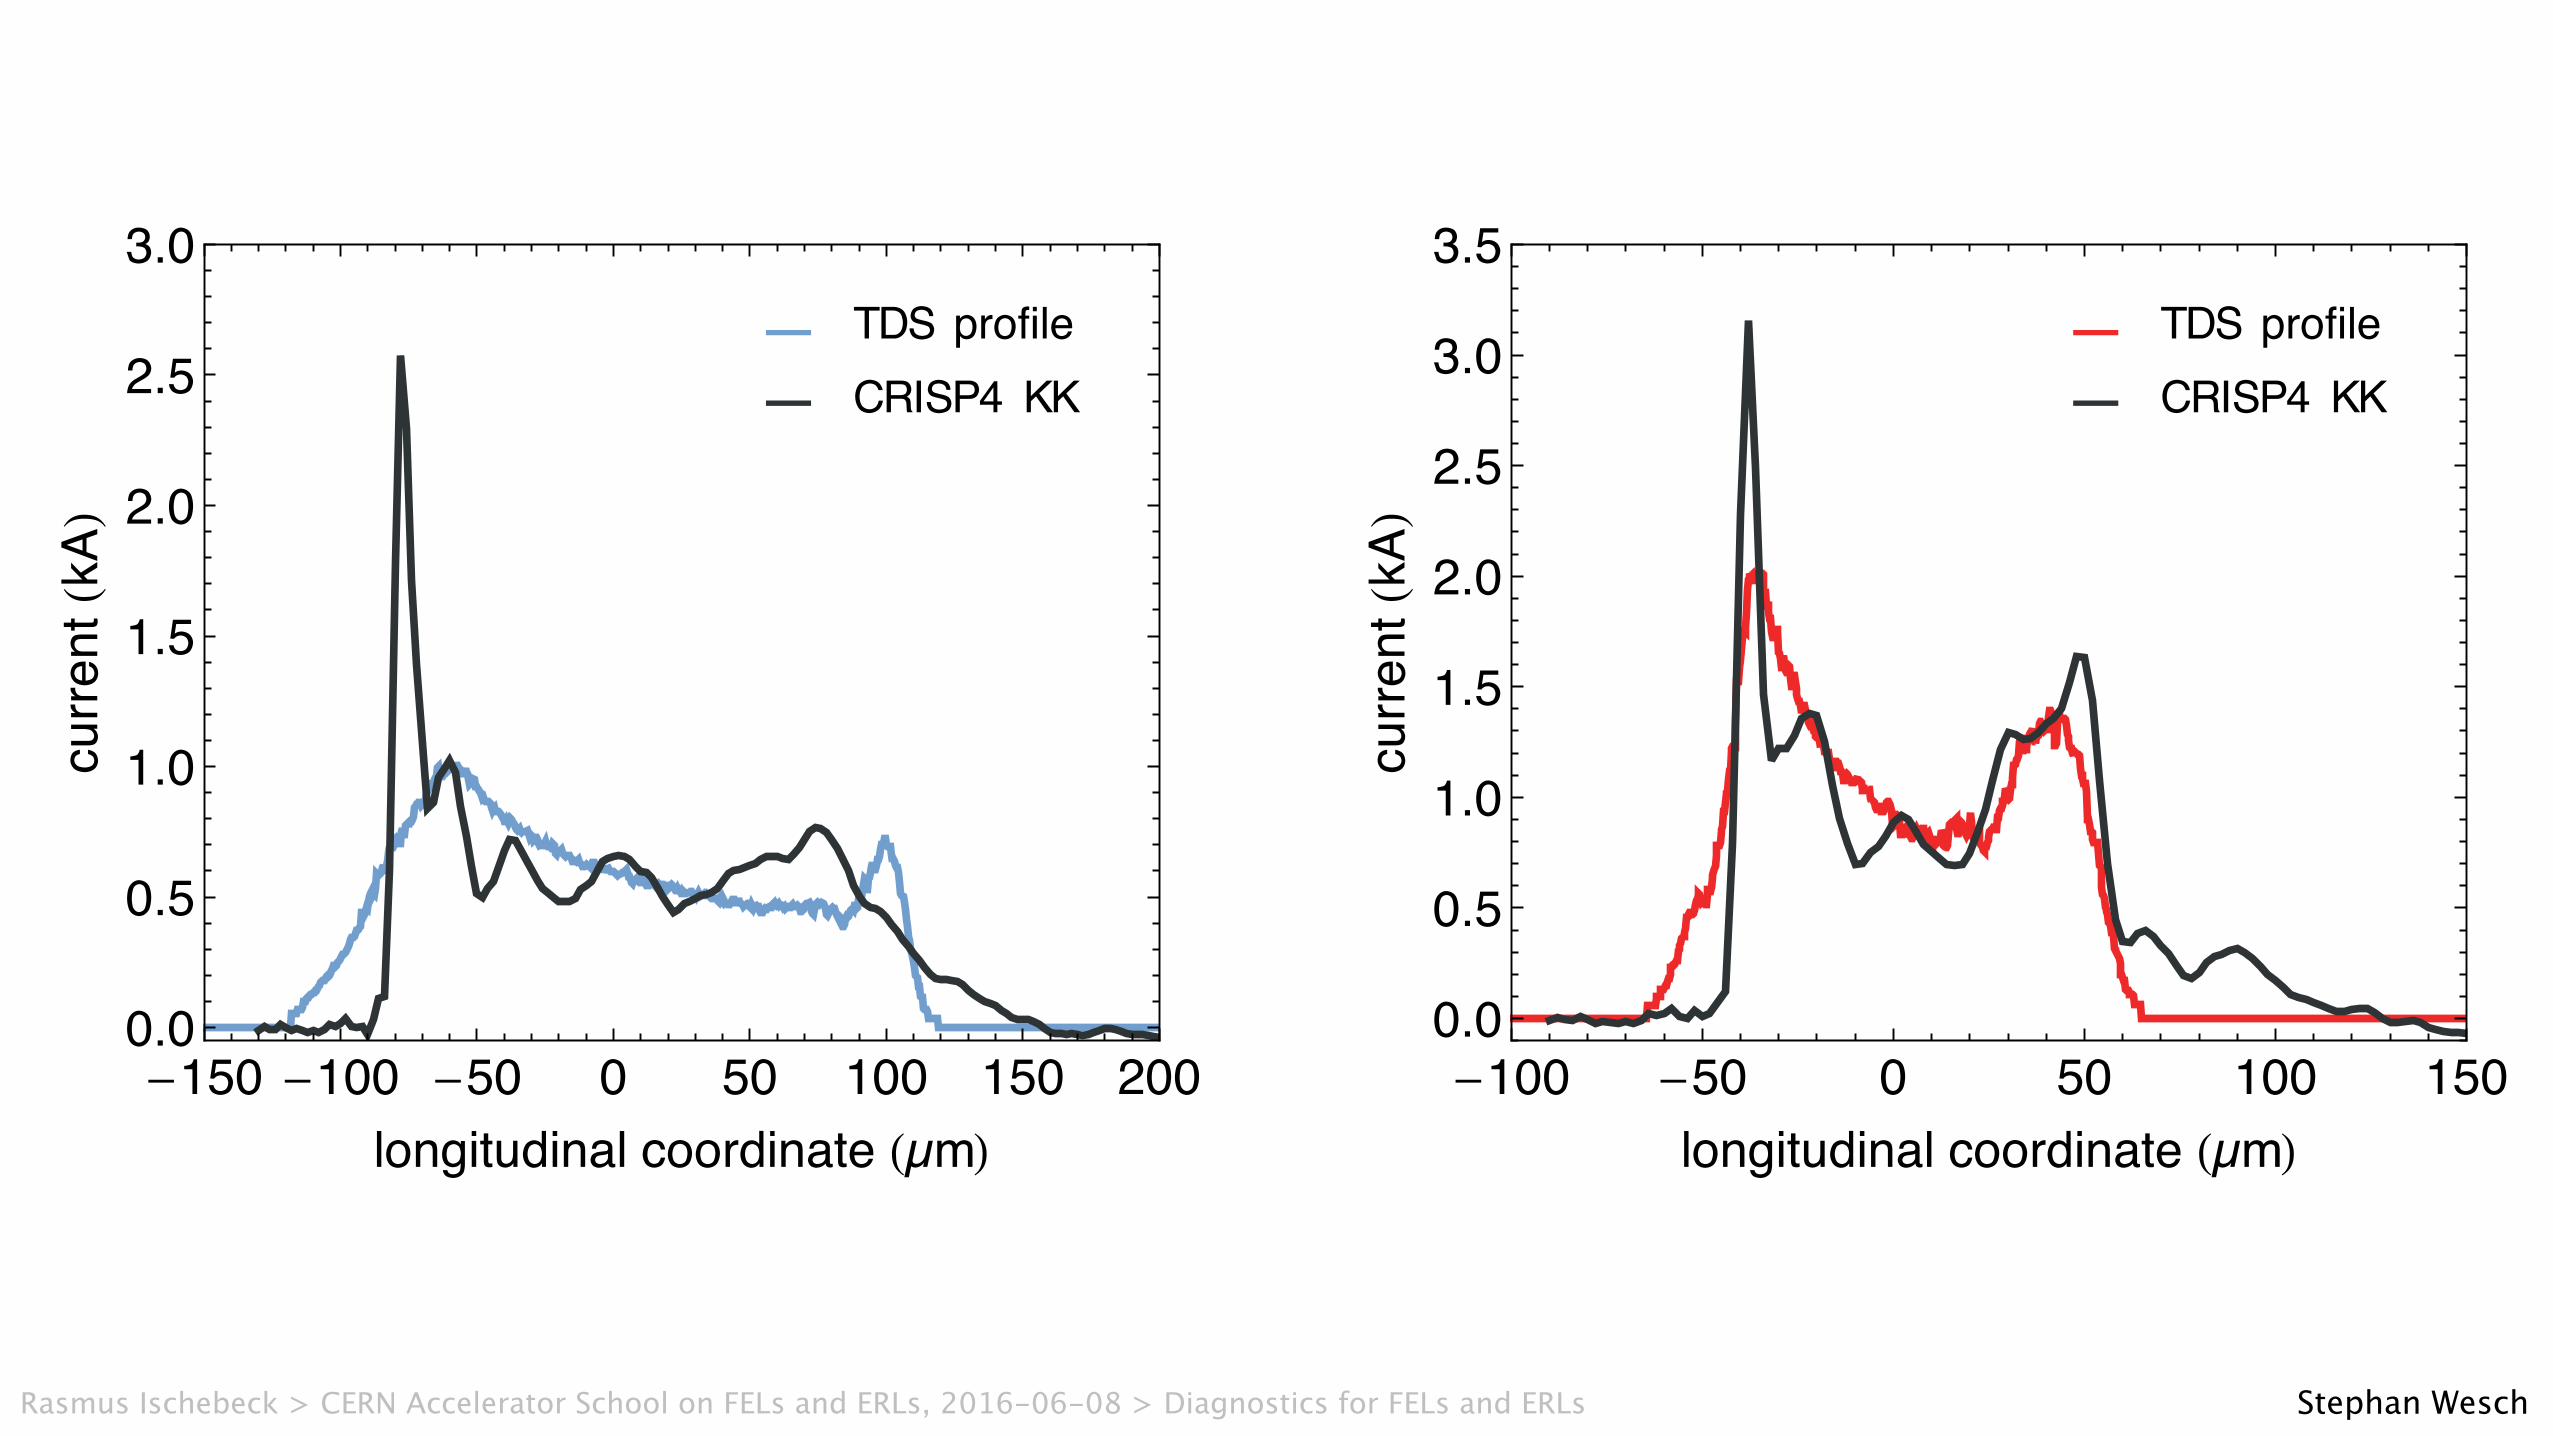
Profile: TDS - CRISP4 Comparison
I Long wavelengths extrapolation Fit with F
l
(�) = exp
⇥�A��2 � B��1
⇤
I Short wavelengths cut at minimal CRISP4 range F
l
(� < 5µm) = 0
-150 -100 -50 0 50 100 150 2000.0
0.5
1.0
1.5
2.0
2.5
3.0
longitudinal coordinate HµmL
currentHkAL
— TDS profile— CRISP4 KK
-100 -50 0 50 100 1500.0
0.5
1.0
1.5
2.0
2.5
3.0
3.5
longitudinal coordinate HµmL
currentHkAL
— TDS profile— CRISP4 KK
I Average currents agreeI Total bunch lengths agree
I More pronounced trailing spikeI Short wavelengths!I Large local energy spread!
S. Wesch (DESY) THz Bunch Profile Monitoring BIW 2012, Newport News 15 / 20
Stephan WeschRasmus Ischebeck > CERN Accelerator School on FELs and ERLs, 2016-06-08 > Diagnostics for FELs and ERLs
Rasmus Ischebeck > Diagnostics for FELs and ERLs> Thank you for slides, graphics, photos, movies and plots provided by:
> Simona Bettoni> Bolko Beutner> Michele Caselle> I. Chaikovska> Pavel Evtushenko> Franziska Frei> A. Freyberger> Joe Frisch> Wolfram Helml> Nicole Hiller> Vitali Judin> Pavle Juranić> Patrick Krejcik> Waldemar Kopek> Hirokazu Maesaka> Yuji Otake> Volker Schlott> Stephan Wesch> ACST GmbH> AFS Inc.> BBC> Wikimedia Commons
> Slides available at: http://www.ischebeck.net© 2016 Paul Scherrer Institut
P A U L S C H E R R E R I N S T I T U T


![Mastering Pool [G. Fels]](https://img.dokumen.tips/doc/110x75/5695d24c1a28ab9b0299df2f/mastering-pool-g-fels.jpg)