Embed Size (px)
Citation preview
1
OCEAN FREIGHT MARKET UPDATE
DHL Global Forwarding, Freight
July 2019
Publication Date 28th June 2019
Dominique von Orelli – Global Head, Ocean Freight
PUBLIC

2 2
Contents
TOPICS OF THE MONTH US – China Trade Dispute Hits China Exports to US
HIGH LEVEL DEVELOPMENT
MARKET OUTLOOK Freight Rates and Volume Development
ECONOMIC OUTLOOK & DEMAND DEVELOPMENT
CAPACITY DEVELOPMENT
CARRIERS
REGULATIONS
? DID YOU KNOW? New IFRS 16 Lease Accounting Standard, Effective 1 Jan 2109
PUBLIC
DHL Global Forwarding | OFR Market Update | July 2019

3 3
US import from China dips while Vietnam surges
The Sino – US trade dispute has hit container volumes from China to the United States and, compared to the same period last year, numbers for the first five months of 2019 show a 6.5% reduction in Chinese exports to US ports. Although China remained by far the largest origin of US containerised imports, its share has reduced from 46% in 2018 to 42% this year. Overall US container imports during the period still grew by 2.8%, as most other cargo origin countries recorded volume increases. Vietnam recorded the largest increase at 30.7%. Its total exports to the US increased from 431,890 TEU to 564,420 TEU and the country emerges as the main beneficiary of the Sino – US trade dispute. Transpacific carriers have reacted on the increased volumes from Vietnam, adding two new direct calls at Northern Vietnam’s Haiphong port (HICT) this year to complement twelve existing calls at Southern Vietnam’s port of Cai Mep.
Source: Alphaliner based on analysis derived from PIERS data
Topic of the Month 1/2 US - China Trade Dispute Hits China Exports to US
DHL Global Forwarding | OFR Market Update | July 2019
US containerised imports: Jan – May 2018 vs 2019
Total containerised inbound cargo in TEU Millions

4 4
Topic of the Month 2/2 US-China Trade Dispute - Development
Jan 2018 : Tariffs imposed on imports of solar panels & washing machines
Mar 2018 : Tariffs imposed on imports of steel & aluminium
Jul 2018 : Tariffs imposed $34 Bn of Chinese imports
Aug 2018 : Tariffs imposed $ 16 Bn of Chinese imports
Sep 2018 : 10% tariffs imposed $ 200 Bn of Chinese imports
Monthly container cargo from China to US in TEU
Dec 2018 : Volumes surged ahead of the 25% tariffs expected to be imposed $ 200
Bn of Chinese imports from Jan which was eventually posponed
May 2019 : Tariffs on $ 200 Bn of Chinese imports increased from
10% to 25%
Jun 2019 : US threatens tariffs on $ 300 Bn
of Chinese imports if no deal is reached at the
G20 meeting on 28-29 June
DHL Global Forwarding | OFR Market Update | July 2019
Source: Alphaliner based on analysis derived from PIERS data

5 5
High Level Market Development – Supply and Demand
ECONOMIC OUTLOOK GDP GROWTH BY REGION1)
PUBLIC
1) real GDP, Global Insight, Copyright © IHS, Q2 2019 . All rights reserved. 2) Demand growth = Port-to-Port Container Traffic growth. Supply growth = Fleet Growth. Source: Drewry Maritime Research. 3) Drewry, in USD/40ft container, including BAF & THC both ends, 42 individual routes, excluding intra-Asia routes. 4) Shanghai Shipping Exchange, in USD/20ft container & USD/40ft ctnr for US routes, 15 routes from Shanghai. 5) Bunker Index, in USD/metric ton, Bunker Index MGO (BIX MGO) = avg. Global Bunker Price for marine gasoil (MGO) port prices; (BIX 380= avg. Global Bunker Price for all 380 centistoke (cSt) port prices; both index published on the Bunker Index website. 6) DHL Global Trade Barometer Jun19, index value represents weighted average of current growth and upcoming two months of trade, a value at 50 is considered neutral, expanding above 50, and shrinking below 50.
BUNKER PRICE INDEX5) WORLD CONTAINER INDEX (WCI)3) SHANGHAI CONTAINERIZED FREIGHT INDEX (SCFI)4)
DHL TRADE BAROMETER6)
0
3,000
500
1,500
1,000
2,500
2,000
Q2 Q1 ’18
Q3 Q4 Q1 ’19
Q2 Q3
500
900
700
600
400
1,100
1,000
800
1,200
Q1 ’18
Q2 Q1 ’19
Q3 Q4 Q2 Q3
400
0
200
600
800
1,000
Q2 Q1 ’18
Q3 Q4 Q1 ’19
Q2 Q3 Q4
30
35
40
45
50
55
60
65
70
75
Q2 Q1 ’17
Q2 Q4 Q3 Q4 Q1 ’18
Q3 Q1 ’19
Q2
Ocean
Global
Actual
Forecast
Actual
Forecast
SUPPLY/DEMAND GROWTH (ANNUALIZED), IN % 2)
Supply Growth %
Demand Growth
%
0%
1%
2%
3%
4%
5%
6%
7%
2017 2018 2019F 2020F 2021F 2022F
SUPPLY/DEMAND GROWTH (ANNUALIZED), IN % 2)
DHL Global Forwarding | OFR Market Update | July 2019
Jun19 index
predicts Jun-
Aug19 trade
development
BIX 380
BIX MGO
2019F 2020F 2021F 2022F 2023F CAGR
(2020-23)
EURO 1.4% 1.3% 1.5% 1.6% 1.6% 1.6%
MEA 2.1% 2.9% 3.0% 3.2% 3.4% 3.2%
AMER 2.4% 2.1% 1.8% 1.6% 1.6% 1.7%
ASPA 4.5% 4.5% 4.5% 4.6% 4.6% 4.5%
DGF World 2.9% 2.8% 2.8% 2.8% 2.8% 2.8%
Carriers will start bunkering
IMO 2020 compliant fuel as of
Q4 ’19. Implications on
bunker & BAF prices not
known yet.
6 6
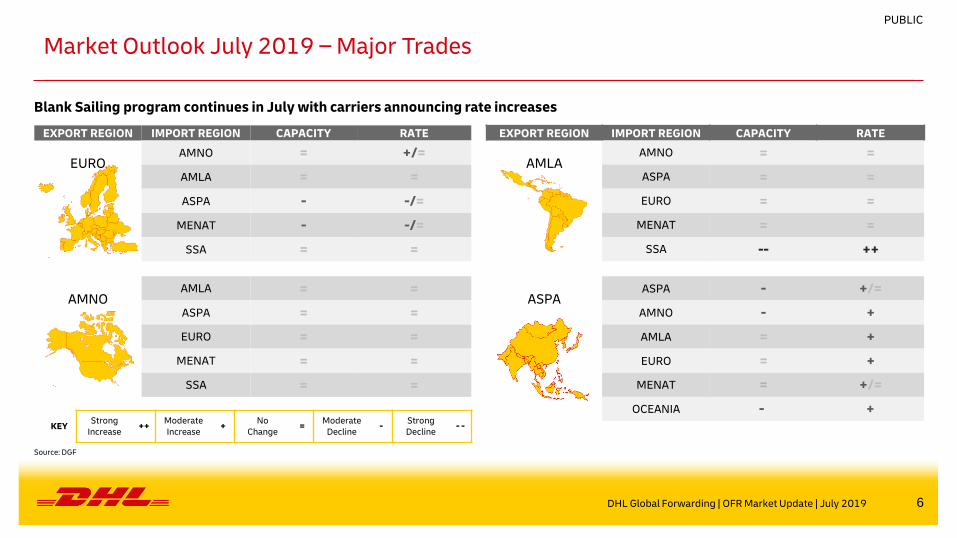
Market Outlook July 2019 – Major Trades
Blank Sailing program continues in July with carriers announcing rate increases
KEY Strong
Increase ++
Moderate Increase
+ No
Change =
Moderate Decline
- Strong Decline
- -
EXPORT REGION IMPORT REGION CAPACITY RATE
EURO AMNO = +/=
AMLA = =
ASPA - -/=
MENAT - -/=
SSA = =
AMNO AMLA = =
ASPA = =
EURO = =
MENAT = =
SSA = =
EXPORT REGION IMPORT REGION CAPACITY RATE
AMLA AMNO = =
ASPA = =
EURO = =
MENAT = =
SSA -- ++
ASPA ASPA - +/=
AMNO - +
AMLA = +
EURO = +
MENAT = +/=
OCEANIA - +
DHL Global Forwarding | OFR Market Update | July 2019
Source: DGF
PUBLIC
7 7
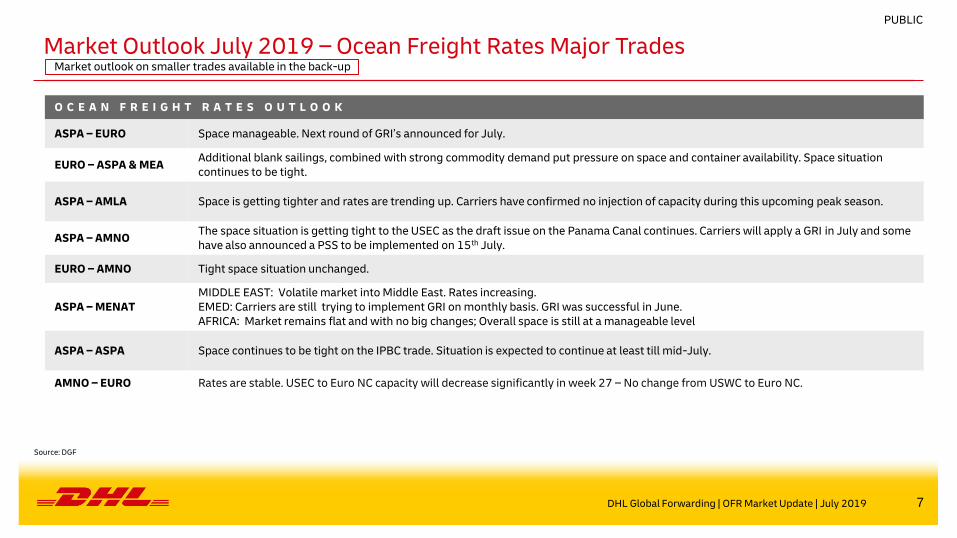
Market Outlook July 2019 – Ocean Freight Rates Major Trades Market outlook on smaller trades available in the back-up
O C E A N F R E I G H T R A T E S O U T L O O K
ASPA – EURO Space manageable. Next round of GRI’s announced for July.
EURO – ASPA & MEA Additional blank sailings, combined with strong commodity demand put pressure on space and container availability. Space situation continues to be tight.
ASPA – AMLA Space is getting tighter and rates are trending up. Carriers have confirmed no injection of capacity during this upcoming peak season.
ASPA – AMNO The space situation is getting tight to the USEC as the draft issue on the Panama Canal continues. Carriers will apply a GRI in July and some have also announced a PSS to be implemented on 15th July.
EURO – AMNO Tight space situation unchanged.
ASPA – MENAT MIDDLE EAST: Volatile market into Middle East. Rates increasing. EMED: Carriers are still trying to implement GRI on monthly basis. GRI was successful in June. AFRICA: Market remains flat and with no big changes; Overall space is still at a manageable level
ASPA – ASPA Space continues to be tight on the IPBC trade. Situation is expected to continue at least till mid-July.
AMNO – EURO Rates are stable. USEC to Euro NC capacity will decrease significantly in week 27 – No change from USWC to Euro NC.
DHL Global Forwarding | OFR Market Update | July 2019
Source: DGF
PUBLIC

8 8
Market Outlook – Volume Outlook in Main Trade Lanes, 2019 Estimate & 2020/23 Growth Forecast in %
N O R T H
A M E R I C A I n c l .
M E X I C O
4.3 mTEU +2.2%
2.3 mTEU +1.5%
1.7 mTEU +3.4%
0.4 mTEU +4.4%
N O R T H
A M E R I C A I n c l .
M E X I C O
L A T I N
A M E R I C A
E U R O P E
I n c l . M E D
14.6 mTEU +3.8%
7.3 mTEU +2.2%
7.6 mTEU +3.0%
18.5 mTEU +3.4%
1.7 mTEU +4.0%
4.4 mTEU +4.8%
2019e, in mTEU 2020e-2023e CAGR, in %
F A R E A S T
I N T R A A S I A
excl. Oceania
40.7 mTEU +3.8%
2.0 mTEU
+3.9%
1.5 mTEU
+3.0%
L A T I N
A M E R I C A
G L O B A L C O N T A I N E R T R A D E 2 0 1 9 e 1 5 1 . 2 m T E U + 3 . 9 % C A G R 2 0 2 0 e - 2 0 2 3 e
Mid-term growth is mainly driven by Asian tradelanes.
Source: Seabury Jun19 update
DHL Global Forwarding | OFR Market Update | July 2019
PUBLIC

9 9
Economic Outlook & Demand Development Deceleration in international trade and manufacturing is leading the 2019 slowdown
Source: IHS Markit, IHS Purchasing Manager Index Manufacturing, a PMI at 50 is considered neutral, expanding above 50, and business shrinking below 50.
DHL Global Forwarding | OFR Market Update | July 2019
PUBLIC
EURO Political uncertainties in Europe, with worsened political fragmentation of the European parliament and a deeply divided UK public which will make achieving any consensus on Brexit even more difficult, thus raisin the likelihood of a non-deal Brexit , are adding to caution, resulting in 1.4% growth during 2019.
AMNO The US had a strong start into 2019, but the robust first quarter growth is expected to be temporary. Nevertheless, the forecast for North America improved from 2.4% to 2.6%
ASPA Asia Pacific region is expected to grow at 4.5% in 2019, 0.2pp lower than in previous forecast. US trade restrictions, deleveraging, and excess capacity are slowing China’s growth, but government stimulus provides some offsetting support.
EMERGING MARKETS
Middle East & Africa economic outlook is revised down from 2.2% to 1.8% in 2019, with economic contraction in Turkey and muted oil GDP in Saudi Arabia and UAE. 2019 Latin American GDP outlook is disappointing at 1.5% (-0.4pp from previous forecast), growth in Brazil and Mexico is only slightly above 1%, while Argentinian GDP is shrinking.
DEMAND DEVELOPMENT
IHS Markit PMIs eased to their weakest levels in three years. The survey data are indicative of worldwide GDP growth slowing significantly. Manufacturing again lead the slowdown, reflecting a substantial inventory correction after excessive accumulation in late 2018 & early 2019. Falling export orders, down for a ninth successive month in May, contributed the factory malaise.
10 10
Capacity Development 1/2
C A P A C I T Y
Several extra loaders are being deployed on the transpacific route, as carriers seek to take advantage of sailing withdrawals by their rivals in early June and capitalize on an expected cargo rush by shippers who are aiming to pre-empt a new round of tariffs that may be imposed on Chinese imports to the US. Maersk has deployed the 4,822 TEU MAESK GATESHEAD on a trip to the US East Coast on 24 May. MSC also deployed the 1,162 TEU newbuilding SPIRIT OF CHENNAI on a positioning trip to the USEC on 16 June. Cosco has deployed the 4,360 TEU NAVIOS FELICITAS on 8 June and a second extra loader is planned in late June. CMA CGM will also send an extra loader to the USEC on 6 July.
MSC is to deploy the first of two 23,000+ TEU vessels of its eleven-strong ‘megamax 24’ newbuilding program on the North Europe – Far East ‘AE-10/Silk’ service offered within the framework of the 2M Vessel Sharing Agreement of Maersk and MSC. The MSC GÜLSÜN is to join the ‘AE-10/Silk’ service on 8 July and MSC MINA will follow on 29 July. Both series of MSC’s ships are fitted with SOx scrubbers and they will share the honor of being the largest containerships in the world. The new MSC jumbo vessels will take the place of existing ships in the MSC and Maersk network that are to be temporarily phased out to be retrofitted with SOx scrubbers.
Hapag-Lloyd, CMA CGM and COSCO Shipping will be the first carriers to include direct calls at the new greenfield port of Posorja, near Guayaquil. Posorja will be added to the rotation of Europe – NCSA – WCSA service operated by the three shipping lines under the respective brandings ‘Eurosal XL’, ‘SWX’ and ‘EWX’. The ‘new’ port will be served in both directions at the expense of the current northbound call at Buenaventura. The new call will provide the three carriers with direct North Europe – Ecuador connections. The revised rotation is planned as of August. The Posaja export call will allow in particular to cater for Ecuador banana shipments to Europe that are currently covered through transhipments on feeder services due to Guayaquil draft constraints.
The ‘Megamax’ container vessel MONACO MAERSK in 1 June left the port of Tanjung Pelepas, Malaysia, with a cargo load that marks a new world record. Carrying 19,284 TEU, Maersk Line and its second-generation EEE-2 class vessels have thus re-claimed a record that was set in 2018 by the MUMBAI MAERSK, and which stood until earlier this year, when its was beaten by Ocean Network Express. The new record holder, MONACO EXPRESS, has a nominal capacity of 20,568 TEU and she is deployed on the North Europe – Far East ‘AE-5/Albatross’ service offered within the context of the 2M Vessel Sharing Agreement of Maersk and MSC.
The idle containership fleet has continued its downward trend at the end of May, after rising briefly two weeks earlier, with heavy demand for replacement ships for those going for scrubber retrofit work. The latest Alphaliner fleet survey as at 10 June 2019 shows 123 idle units for 351,325 TEU, representing 1.5% of the total fleet. The strong vessel demand is expected to last for the next few months. but the outlook remains cloudy as carriers may be forced to cancel more transpacific sailings when the US-China trade war starts taking its toll.
DHL Global Forwarding | OFR Market Update | July 2019
Source: Alphaliner, Dynaliners, carriers
PUBLIC
11 11
R E G U L A T I O N S
India: Import of “Solid plastic waste/Plastic scrap” restricted The Ministry of Environment, Forest and Climate Change has amended the Hazardous and Other Wastes (Management & Transboundary Movement) Rules, 2016 vide notification G.S.R. G.S. R. XX (E), dated 1 March 2019 through which “Solid plastic waste” (B3010- Polymethyl methacrylate) has been prohibited from import into the country including in Special Economic Zones (SEZ) and by Export Oriented Unites (EOU).
Regulations
Source: Alphaliner, carriers
DHL Global Forwarding | OFR Market Update | July 2019
PUBLIC
Source: DHL, carriers
12 12
C A R R I E R S
Hapag-Lloyd has announced its plan to redeem the EUR 280 M 6.75% senior note due 2022 on 24 June 2019 at a fixed redemption price of 103.375%. The redemption will be funded by the company’s cash reserves together with EUR 100 M from a drawdown of a ‘Credit Default Swap’ (CDS) based credit facility. Hapag-Lloyd said that the repayment ahead of the notes’ maturity is part of its deleveraging efforts to optimize its capital structure and reduce the cost of its debt. According to Hapag-Lloyd’s financial statements at the end of March 2019, its total financial debt stood at $ 7.8 Bn which included $ 1.1 Bn of additional lease liabilities due to the application of new IFRS 16 lease accounting rules.
MSC has formally signed an agreement to acquire a 49% stake in Italian niche carrier Linea Messina on 13 June. The transaction remains subject to the approval of the Italian anti-trust authorities and of the Western Ligurian Sea Port Authority, which jointly manages the ports of Genoa, Savona and Vado Ligure. Messina currently operates eleven ships for 26,373 TEU, including seven conro units with a combined container capacity of 20,440 TEU. The fresh deal may pave the was for joint MSC-Messina liner services in the Med, Africa, Red Sea and Middle East trades, where Messina currently operates.
Carriers
Source: Alphaliner, carriers
DHL Global Forwarding | OFR Market Update | July 2019
PUBLIC
Source: Alphaliner, Dynaliners, carriers

13 13
New rule has increased total debt of main container lines by 50%
The new IFRS 16 lease accounting rule has been applied on 1 Jan ’19. It requires long-term leases for vessels, equipment, and other assets to be capitalized, whereas operating leases could previously be kept off the balance sheet. All of the nine main container carriers that have published their Q1 ’19 financial statements reported significant increases in their debt obligations. Their aggregated financial debt rose by 50% to USD 84bn at the end of Mar19 compared to their Dec18 financial statements. CMA CGM reported the largest jump in its total debt, with an increase of 117% from USD 9.2bn to USD 19.9bn. The initial application of IFRS 16 on 1 Jan ’19 accounted for USD 6.8bn of the rise, while the acquisition of CEVA Logistics added a further USD 2.8bn.
Source: Alphaliner, carriers
Did you know? New IFRS 16 Lease Accounting Standard, Effective 1 Jan 2109
DHL Global Forwarding | OFR Market Update | July 2019

14 14
B A C K - U P
PUBLIC
15 15
Source: DGF
Market Outlook July 2019 – Ocean Freight Rates Additional Trades (1/2)
O C E A N F R E I G H T R A T E S O U T L O O K
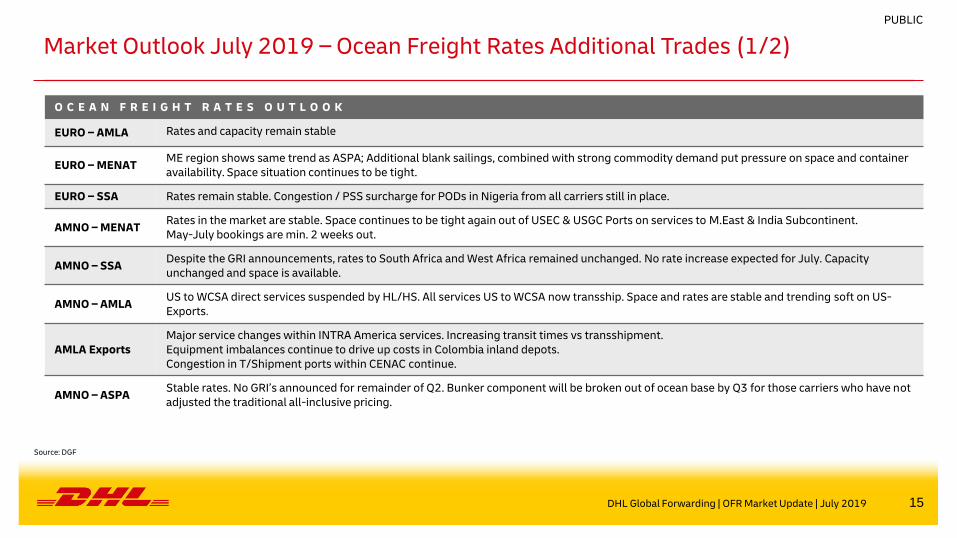
EURO – AMLA Rates and capacity remain stable
EURO – MENAT ME region shows same trend as ASPA; Additional blank sailings, combined with strong commodity demand put pressure on space and container availability. Space situation continues to be tight.
EURO – SSA Rates remain stable. Congestion / PSS surcharge for PODs in Nigeria from all carriers still in place.
AMNO – MENAT Rates in the market are stable. Space continues to be tight again out of USEC & USGC Ports on services to M.East & India Subcontinent. May-July bookings are min. 2 weeks out.
AMNO – SSA Despite the GRI announcements, rates to South Africa and West Africa remained unchanged. No rate increase expected for July. Capacity unchanged and space is available.
AMNO – AMLA US to WCSA direct services suspended by HL/HS. All services US to WCSA now transship. Space and rates are stable and trending soft on US-Exports.
AMLA Exports Major service changes within INTRA America services. Increasing transit times vs transshipment. Equipment imbalances continue to drive up costs in Colombia inland depots. Congestion in T/Shipment ports within CENAC continue.
AMNO – ASPA Stable rates. No GRI’s announced for remainder of Q2. Bunker component will be broken out of ocean base by Q3 for those carriers who have not adjusted the traditional all-inclusive pricing.
DHL Global Forwarding | OFR Market Update | July 2019
PUBLIC
16 16
Market Outlook July 2019 – Ocean Freight Rates Additional Trades (2/2)
O C E A N F R E I G H T R A T E S O U T L O O K
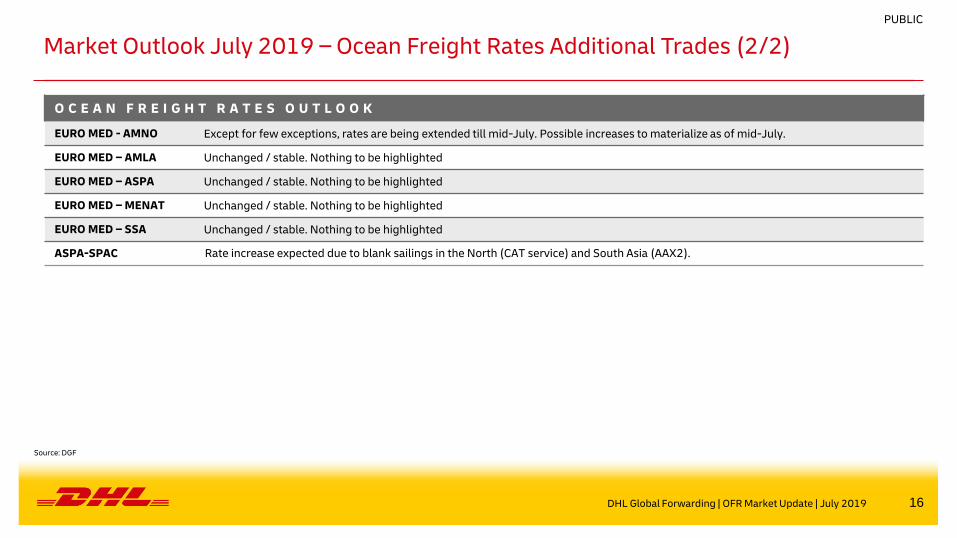
EURO MED - AMNO Except for few exceptions, rates are being extended till mid-July. Possible increases to materialize as of mid-July.
EURO MED – AMLA Unchanged / stable. Nothing to be highlighted
EURO MED – ASPA Unchanged / stable. Nothing to be highlighted
EURO MED – MENAT Unchanged / stable. Nothing to be highlighted
EURO MED – SSA Unchanged / stable. Nothing to be highlighted
ASPA-SPAC Rate increase expected due to blank sailings in the North (CAT service) and South Asia (AAX2).
DHL Global Forwarding | OFR Market Update | July 2019
Source: DGF
PUBLIC

17 17
Carrier Mergers, Acquisitions and Alliances
M E R G E R S A N D A Q U I S I T I O N S
China
Shipping Cosco OOCL Evergreen APL
CMA
CGM Hapag
Lloyd
United
Arab
Shipping
Hyundai
Merchant
Marine
Hamburg
Süd Maersk
Line MSC K Line MOL NYK
Yang
Ming
CHINA COSCO SHIPPING
OOCL EVER
GREEN CMA CGM
APL HAPAG-LLOYD
HYUNDAI
MERCHANT
MARINE
MAERSK LINE
Hamburg Süd MSC
OCEAN NETWORK
EXPRESS (ONE) YANG
MING
A L L I A N C E S
F O R M E R A L L I A N C E S P R E S E N T A L L I A N C E S
2M MAERSK LINE
MSC OCEAN 3
CMA CGM
CHINA SHIPPING
UNITED ARAB
SHIPPING COMPANY
2M
MAERSK LINE
MSC
HMM (strategic
cooperation until May
2020)
OCEAN
ALLIANCE
OOCL
CMA CGM
CHINA COSCO SHIPPING
EVERGREEN
G6
HAPAG-LLOYD
MOL
NYK
APL
HYUNDAI
MERCHANT
MARINE
OOCL
CKYHE
COSCO
EVERGREEN
HANJIN
SHPPING
K-LINE
YANG MING THE ALLIANCE
HAPAG-LLOYD
ONE
YANG MING
*Source: Carriers
PUBLIC
DHL Global Forwarding | OFR Market Update | July 2019
18 18
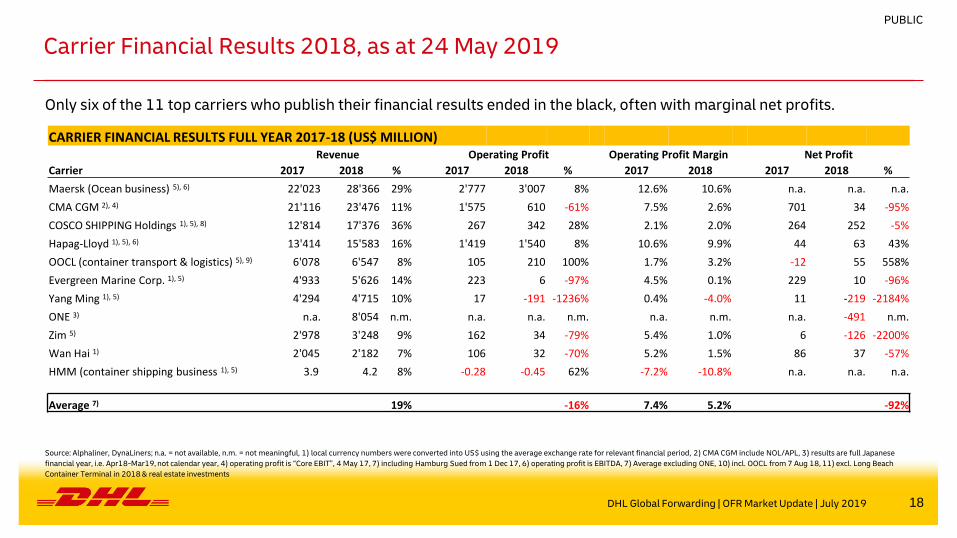
Carrier Financial Results 2018, as at 24 May 2019
DHL Global Forwarding | OFR Market Update | July 2019
Source: Alphaliner, DynaLiners; n.a. = not available, n.m. = not meaningful, 1) local currency numbers were converted into US$ using the average exchange rate for relevant financial period, 2) CMA CGM include NOL/APL, 3) results are full Japanese
financial year, i.e. Apr18-Mar19, not calendar year, 4) operating profit is “Core EBIT”, 4 May 17, 7) including Hamburg Sued from 1 Dec 17, 6) operating profit is EBITDA, 7) Average excluding ONE, 10) incl. OOCL from 7 Aug 18, 11) excl. Long Beach
Container Terminal in 2018 & real estate investments
PUBLIC
CARRIER FINANCIAL RESULTS FULL YEAR 2017-18 (US$ MILLION) Revenue Operating Profit Operating Profit Margin Net Profit
Carrier 2017 2018 % 2017 2018 % 2017 2018 2017 2018 %
Maersk (Ocean business) 5), 6) 22'023 28'366 29% 2'777 3'007 8% 12.6% 10.6% n.a. n.a. n.a.
CMA CGM 2), 4) 21'116 23'476 11% 1'575 610 -61% 7.5% 2.6% 701 34 -95%
COSCO SHIPPING Holdings 1), 5), 8) 12'814 17'376 36% 267 342 28% 2.1% 2.0% 264 252 -5%
Hapag-Lloyd 1), 5), 6) 13'414 15'583 16% 1'419 1'540 8% 10.6% 9.9% 44 63 43%
OOCL (container transport & logistics) 5), 9) 6'078 6'547 8% 105 210 100% 1.7% 3.2% -12 55 558%
Evergreen Marine Corp. 1), 5) 4'933 5'626 14% 223 6 -97% 4.5% 0.1% 229 10 -96%
Yang Ming 1), 5) 4'294 4'715 10% 17 -191 -1236% 0.4% -4.0% 11 -219 -2184%
ONE 3) n.a. 8'054 n.m. n.a. n.a. n.m. n.a. n.m. n.a. -491 n.m.
Zim 5) 2'978 3'248 9% 162 34 -79% 5.4% 1.0% 6 -126 -2200%
Wan Hai 1) 2'045 2'182 7% 106 32 -70% 5.2% 1.5% 86 37 -57%
HMM (container shipping business 1), 5) 3.9 4.2 8% -0.28 -0.45 62% -7.2% -10.8% n.a. n.a. n.a.
Average 7) 89'700.1 107'124.3 19% 6'650.2 5'589.2 -16% 7.4% 5.2% 1'328.8 105.1 -92%
Only six of the 11 top carriers who publish their financial results ended in the black, often with marginal net profits.

19 19
Acronyms and Explanations
AMLA - Latin America OCRS - Operational Cost Recovery surcharge
AMNO - North America OOCL - Orient Overseas Container Line
AR - Argentina OWS - Overweight Surcharge
ASPA - AsiaPacific PH - Philippines
BR - Brazil PNW - Pacific North West
CAGR - Compound Annual Growth Rate Ppt. - Percentage points
CENAC - Central Amercia and Caribbean PSW - Pacific South West
CNC - CNC Line (Cheng Lie Navigation Co. Ltd.) SAEC - South America East Coast
DG - Dangerous Goods SAWC - South America West Coast
DWT - Dead Weight Tonnage SOLAS - Safety of Life at Sea
EB - Eastbound SPRC - South People’s Republic of China – South China
ECSA - East Coast South America (synonym for SAEC) SSA - Sub-Saharan Africa
EGLV - Evergreen Marine Corp SSL - Steam Ship Line
EURO - Europe T - Thousands
GRI - General Rate Increase TEU - Twenty foot equivalent unit (20‘ container)
HMM - Hyundai TSA - Trans Pacific Stabilization Agreement
HL - Hapag-Lloyd USGC - US Gulf Coast
HSUD - Hamburg Süd US FMC - US Federal Maritime Commission
HWS - Heavy Weight Surcharge USEC - US East Coast
IA - Intra Asia USWC - US West Coast
IPBC - India Pakistan Bangladesh Ceylon (= Sri Lanka) VGM - Verified Gross Mass
IPI - Inland Point Intermodal VLCS - Very Large Container Ship
ISC - Indian Sub Continent (synonym for IPBC) VSA - Vessel Sharing Agreement
MENAT - Middle East and North Africa WB - Westbound
ML - Maersk Line WCSA - West Coast South America (synonym for SAWC)
mn - Millions WHL - Wan Hai
MoM - Month-on-Month YML - Yang Ming Line
NOO - Non-operating (vessel) owners YoY - Year-on-Year
YTD - Year-to-Date
DHL Global Forwarding | OFR Market Update | July 2019
PUBLIC