Embed Size (px)
Citation preview

Development of Test System for
Distribution System Reliability Analysis,
Integration of Electric Vehicles into the
Distribution System
Master’s Thesis in the Master’s Electric Power Engineering
PRAMOD BANGALORE
Department of Energy and Environment
Division of Electric Power Engineering
CHALMERS UNIVERSITY OF TECHNOLOGY
Göteborg, Sweden 2011
Masters Thesis


Development of Test System for Distribution System
Reliability Analysis, Integration of Electric Vehicle into
the Distribution System
Master’s Thesis in the Master’s Electric Power Engineering
PRAMOD BANGALORE
Department of Energy and Environment
Division of Electric Power Engineering
CHALMERS UNIVERSITY OF TECHNOLOGY
Göteborg, Sweden 2011

CHALMERS, Energy and Environment, Master’s Thesis
Development of Test System for Distribution System Reliability Analysis, Integration
of Electric Vehicles into the Distribution System
Master’s Thesis in the Master’s Electric Power Engineering
PRAMOD BANGALORE
© PRAMOD BANGALORE, 2011
Master’s Thesis
ISSN 1652-8557
Department of Energy and Environment
Division of Electric Power Engineering
Chalmers University of Technology
SE-412 96 Göteborg
Sweden
Telephone: + 46 (0)31-772 1000

CHALMERS, Energy and Environment, Master’s Thesis 1
Development of Test System for Distribution System Reliability Analysis, Integration
of Electric Vehicles into the Distribution System
Master’s Thesis in the Master’s Electric Power Engineering
PRAMOD BANGALORE
Department of Energy and Environment
Division of Electric Power Engineering
Chalmers University of Technology
ABSTRACT
This master thesis project aims to work in parallel with an IEEE Task Force on
Distribution System Reliability – development of test systems (DRTS). Over the years
the electric power system has seen an exponential growth in terms of size and
technology. A similar growth and development has taken place in the terms of
probabilistic applications used to analyze the power systems. An extensive literature
survey has been done as a part of the work to analyze the existing widely used test
systems; IEEE RTS and RBTS. Conclusions have been drawn towards how these test
systems might be updated or modified to be sufficient with respect to the modern
power systems “Smart Grid”.
The thesis has been divided into two main parts. The first part focuses on review of
publications, which use test systems for probabilistic applications. In the second part
Bus-2 distribution system of RBTS has been considered and extensions to the same
have been proposed for integration of EVs to the system. The main contribution of
work is the proposed extension of the test RBTS test system with integration of EVs.

CHALMERS, Energy and Environment, Master’s Thesis 2
CHALMERS, Energy and Environment, Master’s Thesis 3
Contents
ABSTRACT 1
CONTENTS 3
ACKNOWLEDGMENTS 5
DEFINITIONS 7
ABBREVIATIONS 8
1 CHAPTER ONE 9
1.1 Introduction 9
1.2 Background of the Project 9
1.3 Scope and Aim of Project 10
1.4 Methodology Adopted for the Project 10
1.5 Introduction to Electric Vehicles 10
1.6 Basics of EVs 11
1.7 Vehicle 2 Grid Model for Electric Vehicles 12
1.8 Outline of Thesis 13
2 CHAPTER TWO 17
2.1 Introduction 17
2.2 RTS & RBTS Test System 17
2.3 Approach for Literature Survey 19
2.4 Literature Survey 20
2.5 Conclusion 23
2.6 Bibliography 23
3 RELIABILITY THEORY AND NEPLAN SOFTWARE 43
3.1 Reliability Theory 43
3.2 Introduction to NEPLAN 44
3.3 Application of NEPLAN 45
3.4 Base Case Study 46
3.5 Study considering common mode outages 46
3.6 Study considering station originated outages 47
3.7 Conclusion 48
4 CHAPTER FOUR 49
CHALMERS, Energy and Environment, Master’s Thesis 4
4.1 Introduction to the Distribution Test System 49
4.2 Bus 2 Distribution Test System 49
4.3 Extension to Bus 2 Distribution Test System 51
4.3.1 Classification of Loads 51
4.3.2 Geography of Distribution Test System 52
4.3.3 Number of EVs in the Distribution Test System 53
4.3.4 Number of EVs in the Distribution Test System: Case 1 (30% EV
penetration) 54
4.3.5 Number of EVs in the Distribution Test System: Case 2 54
4.3.6 Load Curve and Cost Data 55
4.4 Electric Vehicles Case Study 57
4.5 Charging of Vehicles 58
5 CHAPTER FIVE 59
5.1 EV Integration within RBTS Bus-2 Distribution System 59
5.2 Modelling of Electric Vehicles 64
5.3 Load Profile Considering Electric Vehicle Integration 65
5.4 Vehicle to Grid 66
5.5 Results of Application 71
5.6 Conclusion and Summary of Results 77
6 CHAPTER FIVE 79
6.1 Proposed Extensions to the Test System 79
6.2 Conclusion and Future Work 80
7 REFERENCES 81

CHALMERS, Energy and Environment, Master’s Thesis 5
Acknowledgments
I would like to express my deepest appreciation to Dr. Lina Bertling, my supervisor
and examiner, for all her support, advices and encouragements.
I would also like to gratefully acknowledge my teachers Dr. Tuan Le, Dr. Miguel
Ortega Vazquez for sharing their opinions with me and giving me valuable comments
on my work. I would like to thank David Steen for giving me valuable inputs and
guiding me when I needed some guidance.
I express my deepest appreciation towards Johan Setreus and Carl Johan
Wallnerström from KTH, for their valuable support in learning the software
NEPLAN.
I would like to express my deepest gratitude towards Francois Besnard, who has
helped me all throughout the project and encouraged me every time I needed some
and also made working in the project fun. I will never forget the goods times we had
discussing the project over a nice dinner.
Last but not the least I would like to thank all my friends who were always open for a
healthy discussion about the project and made working on the thesis interesting and
fun.
Pramod Bangalore,
Chalmers University of Technology,
Gothenburg,
April, 2011

CHALMERS, Energy and Environment, Master’s Thesis 6

CHALMERS, Energy and Environment, Master’s Thesis 7
Definitions
SAIDI: System Average Interruption Duration Index [min/yr]
SAIDI= ��������������� ������������
������������������
SAIFI: System Average Interruption Frequency Index [1/yr]
SAIFI=��������������������� �����
���������������������
CAIDI: Customer Average Interruption Duration Index [h]
CAIDI= ���������������� ������������
��������������������� �����
ASAI: Average Service Availability Index [%]
ASAI= ������������������������
����������������

CHALMERS, Energy and Environment, Master’s Thesis 8
ABBREVIATIONS
AC OPF – AC Optimal Power Flow
BEV – Battery Electric Vehicle
EDS – Electrical Distribution System
ENS – Energy Not Supplied
EPS – Electrical Power System
EV – Electric Vehicle
G4V – Grid for Vehicle
HVDC – High Voltage Direct Current
ICT – Information & Control Technology
IEEE RTS – IEEE Reliability Test System
PHEV – Plug in Hybrid Electric Vehicle
RBTS – Roy Billinton Test System
SOC – State Of Charge
TSO – Transmission System Operator
V2G – Vehicle to Grid
VSC – Voltage Source Converter

CHALMERS, Energy and Environment, Master’s Thesis 9
1 Chapter One
1.1 Introduction
Reliability in general can be understood as the ability of a component or a system as a
whole to perform the designated task under defined conditions for a specific period of
time. The concept of reliability applied to power systems generally means maintaining
the continuity of supply to the customers.
Electric power systems have developed over the years and one of the main focuses
has been reliability assessment. Various concepts like redundancy in supply, regular
maintenance of the equipment have resulted in high reliability in the power systems.
However, improvement of reliability comes at a cost and it can be said that reliability
of a system and the investment cost go hand in hand.
Test systems are fictitious systems, which are used as a bench mark tool for various
kinds of studies. These systems are made to resemble an actual system but at the same
time are sufficiently general so as to be able to cater different needs for different
studies. In case of reliability, IEEE RTS and RBTS are two widely used test systems
for electric power system analysis.
1.2 Background of the Project
This master thesis project aims to work in parallel with an IEEE Task Force on
Distribution System Reliability – development of test systems (DRTS) . The Task
Force is within the Power System Analysis Computing and Economics Committee
(PSACEC), the Reliability, Risk, and Probability Applications (RRPA) Subcommittee
within the IEEE Power & Energy Society (PES). This group has an annual meeting in
July during the general meeting when the TF group meets.
A presentation about the proposed work was made in Minneapolis during the
conference in July 2010. Various ideas were expressed by the participants of the
meeting and the same have been summarized as follow:
• There was an overall consensus that test systems should be flexible and
sufficiently general.
• It was suggested that the most important feature that could be included in the test
system is wind power generation.
• It was suggested that in case of extending RBTS with models of wind power
generation, the input data should be given together with identified techniques of
reliability calculation.
• It was pointed out that there may be a problem with the present RTS system with
respect to AC OPF studies. The solution does not converge for congestion study
with N-1 contingency with thermal limitations.
• It was suggested that very specific system (for e.g.: particular configuration of
HVDC) should not be included in the test system to keep it more general and user
friendly.
• It was requested to include the load trends and load modeling at the distribution
system level, while developing the test system.
CHALMERS, Energy and Environment, Master’s Thesis 10
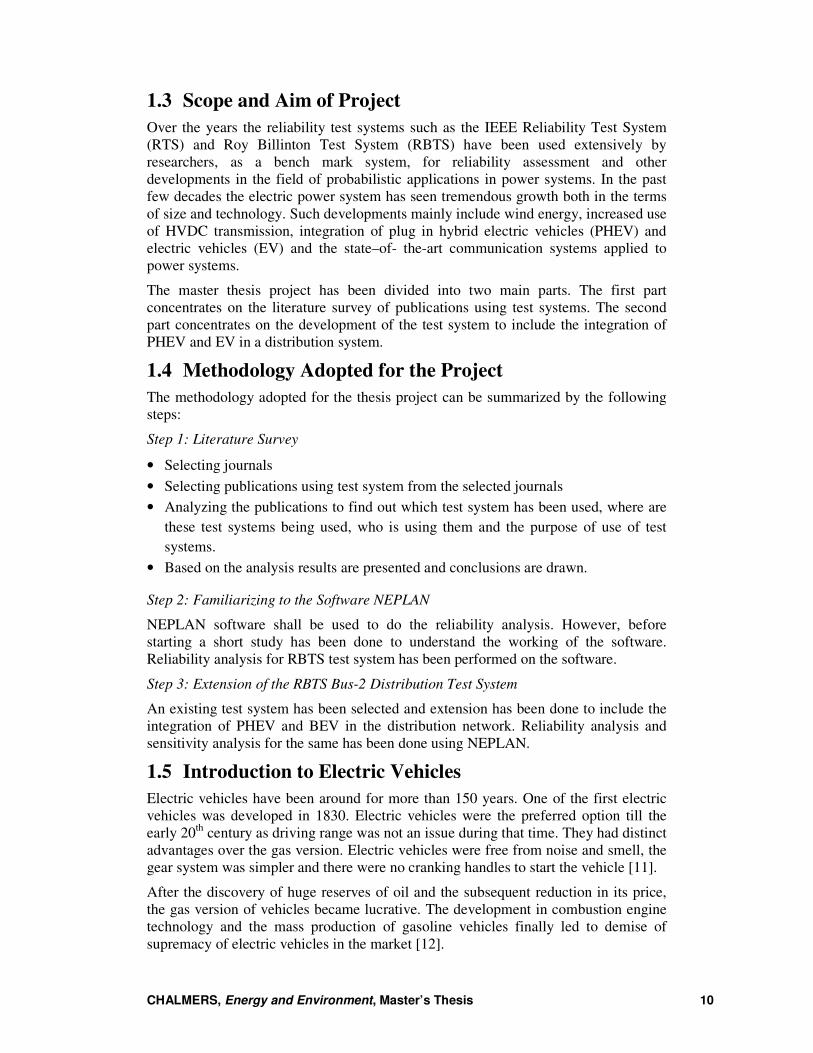
1.3 Scope and Aim of Project
Over the years the reliability test systems such as the IEEE Reliability Test System
(RTS) and Roy Billinton Test System (RBTS) have been used extensively by
researchers, as a bench mark system, for reliability assessment and other
developments in the field of probabilistic applications in power systems. In the past
few decades the electric power system has seen tremendous growth both in the terms
of size and technology. Such developments mainly include wind energy, increased use
of HVDC transmission, integration of plug in hybrid electric vehicles (PHEV) and
electric vehicles (EV) and the state–of- the-art communication systems applied to
power systems.
The master thesis project has been divided into two main parts. The first part
concentrates on the literature survey of publications using test systems. The second
part concentrates on the development of the test system to include the integration of
PHEV and EV in a distribution system.
1.4 Methodology Adopted for the Project
The methodology adopted for the thesis project can be summarized by the following
steps:
Step 1: Literature Survey
• Selecting journals
• Selecting publications using test system from the selected journals
• Analyzing the publications to find out which test system has been used, where are
these test systems being used, who is using them and the purpose of use of test
systems.
• Based on the analysis results are presented and conclusions are drawn.
Step 2: Familiarizing to the Software NEPLAN
NEPLAN software shall be used to do the reliability analysis. However, before
starting a short study has been done to understand the working of the software.
Reliability analysis for RBTS test system has been performed on the software.
Step 3: Extension of the RBTS Bus-2 Distribution Test System
An existing test system has been selected and extension has been done to include the
integration of PHEV and BEV in the distribution network. Reliability analysis and
sensitivity analysis for the same has been done using NEPLAN.
1.5 Introduction to Electric Vehicles
Electric vehicles have been around for more than 150 years. One of the first electric
vehicles was developed in 1830. Electric vehicles were the preferred option till the
early 20th
century as driving range was not an issue during that time. They had distinct
advantages over the gas version. Electric vehicles were free from noise and smell, the
gear system was simpler and there were no cranking handles to start the vehicle [11].
After the discovery of huge reserves of oil and the subsequent reduction in its price,
the gas version of vehicles became lucrative. The development in combustion engine
technology and the mass production of gasoline vehicles finally led to demise of
supremacy of electric vehicles in the market [12].

CHALMERS, Energy and Environment, Master’s Thesis 11
In recent years, the growing concerns about global warming have generated a renewed
interest in fuel efficient and less polluting vehicles. A legislative and regulatory
reform was passed in United States in 1990 which started the process of resurrection
of electric vehicles [18]. Though this effort was not long lasting but due to recent
developments in technology electric vehicles are being considered seriously again.
A range of electric vehicles are available today. Two main types of electric vehicles
are plug in hybrid electric vehicle (PHEV) and battery electric vehicle (BEV). As the
name suggest the hybrid electric vehicle is a combination of internal combustion
engine (ICE) and an electric motor. Based on the configuration of the vehicle the role
of ICE and electric motor may be different. However, generally the electric motor is
used more within the cities where the vehicle starts and stops more often. Whereas the
gasoline engine is used for longer drives giving the same range for the vehicle.
Battery electric vehicles derive the complete power from the stored energy of the
batteries. These vehicles are completely emission free. Various models are available
in the market today. Tesla motors introduced an electric car named “Tesla roadster”,
which has a range of 350 kilometres and a top speed of 210 kmph [19].
Electric vehicles present an excellent source of energy storage. For maximizing the
utilization of renewable sources of energy such as wind and solar power, integration
of electric vehicles might be very necessary. The vehicle to grid (V2G) concept of
electric vehicles allows the supply of power from the vehicle to grid. With V2G
electric vehicles could be used to provide ancillary service like up and down
regulation. The advantage of electric vehicles over conventional power plants used for
regulation is that electric vehicles have an extremely fast response time and can act as
a load or a generator depending on the requirement thereby giving both up regulation
and down regulation [12].
However, there are still a lot of challenges to accomplish a full scale integration of
electric vehicles. A robust network to support large number of electric vehicles, a
competitive market structure, affordability and range of these vehicles are some of the
most important issues being addressed recently.
The power system infrastructure in Europe and America are aging. A lot of research
has been carried out to study the impact of large scale integration of electric vehicles
into the existing power system [13][14]. One of the major issues is the imminent
overload on the distribution transformers and cables due to charging of many electric
vehicles at the same time. Strategies like coordinated charging to reduce this
overloading have been suggested by researchers [15][16].
1.6 Basics of EVs
There are two main configurations of PHEVs, series and parallel configurations. As
seen from the below Figures the series hybrid vehicle has an internal combustion
engine which can charge the battery. Under normal condition the engine is not used
very often but can be started during long journeys to maintain the SOC of the
batteries.
Parallel hybrid configuration has an ICE connected to the wheel drive through special
gears. The electric motor is used for frequent start and stop of the vehicle and the
engine is engaged when the speed increases above a specified value. The motor
supplies energy back to the battery during braking of the vehicle.

CHALMERS, Energy and Environment, Master’s Thesis 12
Figure 1.1 Series and Parallel Hybrid vehicles [11]
The battery electric vehicles do not have an internal combustion engine. The energy
from the socket is stored in the batteries and used to drive the electric motor. Energy
is given back to the batteries during braking operation of the vehicle through
regeneration.
Figure 1.2 Battery electric vehicle [11]
1.7 Vehicle 2 Grid Model for Electric Vehicles
Vehicle to Grid systems (V2G) are equipped with bi-directional power flow
capabilities. This will enable the vehicles connected to the sockets at home and at
commercials buildings to supply electricity from the car batteries [12].
The concept is still under research and a lot of changes in the electric power system
infrastructure are needed to accomplish the same. An intermediate entity called the
aggregator might be required to accomplish V2G power supply. The aggregator will
be responsible for a fleet of electric vehicles. The charging and discharging of the
Engine
Battery
Controller
Motor
Series
Hybrid
Charger
Socket
Motor
Battery
Controller
Engine
Charger
Socket
Parallel
Hybrid
Motor
Battery
Controller
Charger
Socket
Battery Electric
Vehicle

CHALMERS, Energy and Environment, Master’s Thesis 13
vehicles can be accomplished by internet or mobile communication. To the TSO the
aggregator will be a well regulated load and as a controllable generation [17].
Figure 1.3 V2G concept [17]
It is difficult to predict how much support each electric vehicle will be able to provide
when the direction of supply is from vehicle to grid. The support from electric vehicle
will depend on the state of charge of battery, which depends how much the vehicle
has travelled and how much charge is left in the batteries. Moreover, the customers
might also impose a limit on the amount minimum charge to be left in the batteries.
Considering a large fleet of vehicles a prediction can be made with accepTable
accuracy. As opposed to a conventional power plant the electric vehicle supply is
much more reliable. This can be said as failure of one electric vehicle would not make
any major difference in the capacity of the entire fleet. For this study the capacity for
a time frame is considered to be constant.
1.8 Outline of Thesis
In Chapter 2 the literature survey has been presented, which investigates how the test
systems have been used and some conclusions are drawn about how the extension of
the test system might be required.
In Chapter 3 short theory about reliability is provided and introduction to the software
NEPLAN is given. Reliability analysis on a sample system has been done and the
results have been presented.
In Chapter 4 Bus 2 distribution test system has been defined and extensions to the
same are presented with respect to integration of electric vehicles in to the system.
In Chapter 5 a sample study has been performed on the extended test system and the
results of the same have been presented
In Chapter 6 the proposed extensions to the test system have been enlisted and
conclusion of the work has been presented.

CHALMERS, Energy and Environment, Master’s Thesis 14

CHALMERS, Energy and Environment, Master’s Thesis 15
PART-1 LITERATURE SURVEY

CHALMERS, Energy and Environment, Master’s Thesis 16

CHALMERS, Energy and Environment, Master’s Thesis 17
2 Chapter Two
Literature Survey
2.1 Introduction
Over the years reliability test systems such as the IEEE Reliability Test System (RTS)
and Roy Billinton Test System (RBTS) have been used extensively by researchers, as
a bench mark system, for reliability assessment and other developments in the field of
probabilistic applications in power systems. In the past few decades the electric power
system has seen tremendous growth both in the terms of size and technology. Such
developments mainly include wind energy, increased use of HVDC transmission,
integration of plug in hybrid electric vehicles (PHEV) and electric vehicles (EV) and
the state–of- the-art communication systems applied to power systems.
There is a large technology development in the electric power system which could be
related to the traditional areas of electric power generation, transmission and
consumption.
In the generation sector, the most significant changes are the introduction of
distributed generation and more specifically, the introduction of intermittent
generation from renewable energy sources.
Lately, the users of electricity become more active, which can act as both the
consumers as well as the producers of electricity. This is often expressed as the new
concept of prosumer. This could, e.g. involve the connection of electrical vehicles to
the grid with the future vision that the electrical vehicles can both draw and inject
(support) power from the grid. At the customer side, smart meters give the customers
new possibilities to make decisions on their use of electricity. The introduction of the
prosumers also result in that the distribution system needs to handle bi-directional
power flow and the distribution system needs to be made more advanced, and rather
similar to the transmission systems.
In the transmission area, the technology development has led to the new features with
increasing use of HVDC transmission. HVDC transmissions can be used as a DC grid
(e.g., for large off-shore wind farm applications) or embedded in the existing AC
interconnected systems (e.g., Sweden will introduce multi-terminals voltage source
converters VSC-HVDC in its high voltage transmission system to increase transfer
capability and controllability of the system.
These different developments and changes in the electric power system, together with
the increased use of information and communication technology (ICT), automatic
control methods, etc., are reflected in the concept of Smart Grid.
As a part of the thesis a comprehensive literature survey was done looking at
publications using the mentioned test systems and also other test systems. This
section presents the results of the survey and tries to analyse the same.
2.2 RTS & RBTS Test System
In this Section, the two most commonly used test systems (i.e. the IEEE RTS and the
RBTS) are briefly described. They have been mainly used for reliability analysis and
probabilistic applications to electric power systems.

CHALMERS, Energy and Environment, Master’s Thesis 18
A. IEEE RTS
The first IEEE-RTS introduced in 1979 consists of 24 buses and 32 generator units.
The system is divided into two parts. The northern part has a voltage level of 230 kV
and the southern part has the voltage level of 138 kV. The total installed capacity of
generation units is 3405 MW and the total peak load of 2850 MW. The southern part
is a power deficit area while the northern part is a power surplus area. Figure. 2.1
shows the original single line diagram of the IEEE-RTS (1979).
Figure 2.1 IEEE RTS 24 bus test system [162]
RTS has been used for various kinds of studies. In recent times integration of wind
power to the system has been the most studied topic in the generation sector. RTS has
been used in many cases for this kind of study. One limitation of RTS is that no data
regarding distribution system has been provided within the existing test system.
Hence, many studies on distribution system reliability analysis have been done using
self-developed test system or actual distribution system connected to the RTS.

B. RBTS
RBTS was developed at University of Saskatchewan for educational purposes and
research [24]. RBTS includes 6 buses and 11 generator units. The transmission
voltage is 230 kV and the total installed capacity is 240 MW with a system peak load
of 185 MW. Figure. 2.2 shows the single line diagram of RBTS. RBTS is a smaller
test system as compared to RTS. However,
defined for the existing RBTS. This makes it very convenient for applications on
distribution system reliability analysis and similar studies. RBTS has also been used
for a variety of similar studies as RTS. The area of research where it has been used the
most is introducing and testing new techniques for probabilistic applications. Another
advantage of RBTS is that it is very easy to modify the test system due to its size.
Figure
2.3 Approach for Literature Survey
The approach for the performed literature study can be summarized as
1. Selecting journals
2. Identifying publications using test systems:
a) Publications using IEEE RTS or RBTS
RBTS was developed at University of Saskatchewan for educational purposes and
research [24]. RBTS includes 6 buses and 11 generator units. The transmission
voltage is 230 kV and the total installed capacity is 240 MW with a system peak load
shows the single line diagram of RBTS. RBTS is a smaller
test system as compared to RTS. However, data for a distribution system
RBTS. This makes it very convenient for applications on
ty analysis and similar studies. RBTS has also been used
for a variety of similar studies as RTS. The area of research where it has been used the
most is introducing and testing new techniques for probabilistic applications. Another
at it is very easy to modify the test system due to its size.
Figure 2.2 6 bus RBTS test system [24]
Approach for Literature Survey
The approach for the performed literature study can be summarized as follows:
2. Identifying publications using test systems:
a) Publications using IEEE RTS or RBTS
RBTS was developed at University of Saskatchewan for educational purposes and
research [24]. RBTS includes 6 buses and 11 generator units. The transmission
voltage is 230 kV and the total installed capacity is 240 MW with a system peak load
shows the single line diagram of RBTS. RBTS is a smaller
distribution system has been
RBTS. This makes it very convenient for applications on
ty analysis and similar studies. RBTS has also been used
for a variety of similar studies as RTS. The area of research where it has been used the
most is introducing and testing new techniques for probabilistic applications. Another
at it is very easy to modify the test system due to its size.
follows:

CHALMERS, Energy and Environment, Master’s Thesis 20
b) Publications using other test systems for reliability analysis of electric power
systems.
3. Various questions to be investigated:
a) Which test systems have been used?
b) Who has used these test systems?
c) Where have the test systems been used?
d) What is the purpose of using these test systems?
2.4 Literature Survey
A. Selecting Journals
In the first step, the following journals were selected for the study:
• IEEE Transactions on Energy Conversion (Transaction from 2010 to 1986)
• IEEE Transactions on Power Delivery (Transaction from 2010 to 1986)
• IEEE Transactions on Power Systems (Transaction from 2010 to 1986)
• IEEE Transactions on Smart Grid (new transaction, introduced in 2010)
• IEEE Transactions on Sustainable Energy (new transaction, introduced in 2010)
B. Selecting Publications
A total of 240 publications, as listed in Appendix A, were selected from the journal
papers listed above. The publications selected used the RTS, the RBTS or other
test systems for reliability studies. Under this Appendix, the publications can be
found in different categories according to aspects of reliability analyses.
C. Investigating Questions
Fig. 2.3 shows ‘Which’ test systems have been used. It can be seen from the Figure
that that more than half of the selected journal papers used the RTS or the RBTS for
analysis. Moreover, the RTS was used with 36% of the cases. In many of these
publications, modifications have been made to the RTS to fit the purpose of the study.
Figure 2.3 General trend of usage of test systems
RTS
36%
RBTS
15%
Other
49%

Fig. 2.4 presents results grouping the journal papers according to the affiliation of the
authors. It is interesting to observe that the RTS system is not only used by the
academic world (around 80% of the studies), the industry has also made used of the
test systems in their studies (around 20% of the studies).
Figure 2.4 The use of the RTS and the RBTS by Academics and Industry
Fig. 2.5 shows results from analyzing where the different studies using the test
systems have been made. It can be seen that Canada and USA are the places where the
RTS and the RBTS have been used the most. Due to the origin of the RBTS from
Canada, this is expected. A main result is that the test systems have been widely used
worldwide.
Figure
Investigation has been made of the purpose of the use of the different test systems.
Fig. 2.6 and Fig. 2.7 shows the result investigating the purpose of the studies m
using the RTS respectively the RBTS. The
sections depending of different aspects of reliability analyses as follows:
A. Reliability analysis and Planning, Generation
B. Reliability analysis and Planning, Transmissio
RTS Industry
20%
South America
9%
presents results grouping the journal papers according to the affiliation of the
authors. It is interesting to observe that the RTS system is not only used by the
academic world (around 80% of the studies), the industry has also made used of the
ems in their studies (around 20% of the studies).
The use of the RTS and the RBTS by Academics and Industry
shows results from analyzing where the different studies using the test
ms have been made. It can be seen that Canada and USA are the places where the
RTS and the RBTS have been used the most. Due to the origin of the RBTS from
main result is that the test systems have been widely used
Figure 2.5 Usage of RTS & RBTS worldwide
Investigation has been made of the purpose of the use of the different test systems.
shows the result investigating the purpose of the studies m
using the RTS respectively the RBTS. The Figures have been divided into five
sections depending of different aspects of reliability analyses as follows:
Reliability analysis and Planning, Generation
Reliability analysis and Planning, Transmission
RTS Academic
63%RTS Industry
20%
RBTS
Academic
16%
RBTS Industry
1%
Europe
6%
USA
20%
Canada
49%
Asia
15%
Others
1%
presents results grouping the journal papers according to the affiliation of the
authors. It is interesting to observe that the RTS system is not only used by the
academic world (around 80% of the studies), the industry has also made used of the
shows results from analyzing where the different studies using the test
ms have been made. It can be seen that Canada and USA are the places where the
RTS and the RBTS have been used the most. Due to the origin of the RBTS from
main result is that the test systems have been widely used
Investigation has been made of the purpose of the use of the different test systems.
shows the result investigating the purpose of the studies made
s have been divided into five

CHALMERS, Energy and Environment, Master’s Thesis 22
C. Power System Economics and Optimization
D. Reliability analysis and Planning, Distribution
E. New techniques for reliability analysis
Figure 2.6 The RTS used for different type of reliability studies
Figure 2.7 The RBTS used for different type of reliability studies
It can be seen from the Figure 2.6 and Fig. 2.7 that the test systems have been used for
a variety of studies. Figure 2.6 shows that in just about half of the studies the RTS was
used for analyzing the introduction of new techniques for reliability analysis. Fig. 2.7
shows that almost 80% of the studies have focused on reliability analysis with focus
on distribution systems or introduction of new techniques. Another conclusion is that
economic studies have been made more using the RTS than the RBTS system. In
summary both the RTS and the RBTS have been used to analysis a wide range of
questions related to reliability analysis.
A
18%
B
13%
C
16%
D
1%
E
52%
A
14%B
3%
C
5%
D
39%
E
39%

CHALMERS, Energy and Environment, Master’s Thesis 23
2.5 Conclusion
This section has presented first results from an IEEE TF on test systems, investigating
further developments for reliability analysis of the future smart electric power
systems. A bibliography study has been made identifying 240 journal papers using
test systems for reliability analysis which have been further analyzed. Of these,
around 50% of the studies were made using the test systems RTS or RBTS. The study
shows that these two test systems have been used worldwide and by both the industry
and the academia, although almost 80% of the studies presented came from the
academia. The RBTS system is more adopted for distribution system studies. Both of
the systems have been used of around 50% to investigate reliability questions for
distribution systems or introduction of new techniques. For analysis of economic
questions, the RTS system has been more widely used than the RTS. In summary,
this survey indicates the success of using the RTS and the RBTS for reliability
analysis. For further work, it will be investigated how these test systems could be
adopted to investigate the features for the new developments of the electric power
systems, e.g. connection of large scale wind power or plug in electric cars to the grid.
This work will be continued within the IEEE TF on Test System.
The results from this study will be presented in a panel meeting at IEEE PES General
Meeting to be held in July, 2011.
2.6 Bibliography
Table 2.1 List of publications from IEEE Transactions
Transaction References
IEEE Transactions on Power Systems
[1] to [19], [24] to [41], [43] to [53], [55]
to [63], [71] to [90], [94] to [101], [110]
to [121], [152] to [234]
IEEE Transactions on Power Delivery
[20] to [23], [42], [54], [64] to [70], [91]
to [93], [102] to [109], [122] to [151],
[235] to [240]
A. Reliability analysis and Planning, Generation
[1] R. Billinton, Yi Gao and Rajesh Karki, ‘Application of a Joint Deterministic-
Probabilistic Criterion to Wind Integrated Bulk Power System Planning’. IEEE
Transactions on Power Systems, Vol. 25, No. 3, August 2010.
[2] Rajesh Karki, Po Hu and Roy Billinton, ‘Reliability Evaluation Considering Wind
and Hydro Power Coordination’. IEEE Transactions on Power Systems, Vol. 25,
No. 2, May 2010.
[3] Y.M. Atwa, E.F. El-Saadany and Anne-Claire Guise, ‘Supply Adequacy
Assessment of Distribution System Including Wind-Based DG During Different
Modes of Operation’. IEEE Transactions on Power Systems, Vol. 25, No. 1,
February 2010.
[4] Dange Huang and Roy Billinton, ‘Effects of Wind Power on Bulk System
Adequacy Evaluation Using the Well-Being Analysis Framework’. IEEE
Transactions on Power Systems, Vol. 24, No. 3, August 2009.

CHALMERS, Energy and Environment, Master’s Thesis 24
[5] Roy Billinton, Yi Gao, Rajesh Karki, ‘Composite System Adequacy Assessment
Incorporating Large-Scale Wind Energy Conversion Systems Considering Wind
Speed Correlation’. IEEE Transactions on Power Systems, Vol. 24, No. 3, August
2009.
[6] In-Su Bae and Jin-O Kim, ‘Reliability Evaluation of Distributed Generation Based
on Operation Mode’. IEEE Transactions on Power Systems, Vol. 22, No. 2, May
2007.
[7] Nader Samaan and Chanan Singh, ‘Adequacy Assessment of Power System
Generation Using a Modified Simple Genetic Algorithm’. IEEE Transactions on
Power Systems, Vol. 17, No.4, November 2002.
[8] E.N. Dialynas, D . J. Papakammenos, N C Koskolos, 'Integration of nonutility
generating facilities into the reliability assessment of composite generation and
transmission power systems '. IEEE Transactions on Power Systems, Vol. 12,
No.1, February 1997.
[9] Roy Billinton, Mahmud Fotuhi-Firuzabad, 'Generating System Operating Health
Analysis Considering Stand-by Units, Interruptible Load and Postponable
Outages'. IEEE Transactions on Power Systems, Vol. 9, No.3, August 1994.
[10] Roy Billinton, Mahmud Fotuhi-Firuzabad, 'A Basic Framework For
Generating System Operating Health Analysis'. IEEE Transactions on Power
Systems, Vol. 9, No.3, August 1994.
[11] C. Singh, N. Gubbala, 'Reliability Evaluation Of Interconnected Power
Systems Including Jointly Owned Generators'. IEEE Transactions on Power
Systems, Vol. 9, No.1, February 1994.
[12] Roy Billinton, Francis Gbeddy, 'Effects Of Utility Generators On Composite
System Adequacy Evaluation'. IEEE Transactions on Power Systems, Vol. 8, No.3,
August 1993.
[13] J.O. Kim,C. Singh, 'A frequency and duration approach for generation
reliability evaluation using the method of stages'. IEEE Transactions on Power
Systems, Vol. 8, No.1, February 1993.
[14] R Billinton, W Li, 'A Monte Carlo method for multi-area generation system
reliability assessment'. IEEE Transactions on Power Systems, Vol. 7, No.4,
November 1992.
[15] R. Billinton, L. Gan, 'Use Of Monte Carlo Simulation In Teaching Generating
Capacity Adequacy Assessment'. IEEE Transactions on Power Systems, Vol. 6,
No.4, November 1991.
[16] S. Fockens, A.J.M. van Wijk, W.C. Turkenburg, C Singh, 'A Concise Method
For Calculating Expected Unserved Energy In Generating System Reliability
Analysis'. IEEE Transactions on Power Systems, Vol. 6, No.3, August 1991.
[17] M. M. Alavi-Sereshki, Chanan Singh, 'A Generalized Continuous Distribution
Approach For Generating Capacity Reliability Evaluation And Its Applications'.
IEEE Transactions on Power Systems, Vol. 6, No.1, February 1991.
[18] Chanan Singh, Quan Clien, 'An Efficient Method for Generating Capacity
Reliability Evaluation Including the Effect of Planned Outages'. IEEE Transactions
on Power Systems, Vol. 4, No.4, November 1989.
[19] R.N.Allan, J .Roman, 'Reliability Assessment Of Generation Systems
Containing Multiple Hydro Plant Using Simulation Techniques'. IEEE
Transactions on Power Systems, Vol. 4, No.3, August 1989.
[20] Stavros A. Papathanassiou and Michael P. Papadopoulos, 'Harmonic Analysis
in a Power System with Wind Generation'. IEEE Transactions on Power Delivery,
Vol. 21, No.4, October 2006.

CHALMERS, Energy and Environment, Master’s Thesis 25
[21] Stavros A. Papathanassiou and Fritz Santjer, 'Power-Quality Measurements in
an Autonomous Island Grid With High Wind enetration'. IEEE Transactions on
Power Delivery, Vol. 21, No.1, January 2006.
[22] Fabrice Demailly, Olivier Ninet and André Even, 'Numerical Tools and
Models for Monte Carlo Studies of the Influence on Embedded Generation on
Voltage Limits in LV Grids'. IEEE Transactions on Power Delivery, Vol. 20, No.3,
July 2005.
[23] Nima Amjady, Davood Farrokhzad, Mohammad Modarres, 'Hybrid Demand
Model for Load Estimation and Short Term Load Forecasting in Distribution
Electric Systems'. IEEE Transactions on Power Delivery, Vol. 15, No.2, April
2000.
[24] John G. Vlachogiannis, ‘Probabilistic Constrained Load Flow Considering
Integration of Wind Power Generation and Electric Vehicles’. IEEE Transactions
on Power Systems, Vol. 24, No. 4, November 2009.
[25] Carmen L.T. Borges, Roberto J. Pinto, ‘Small Hydro Power Plants Energy
Availability Modeling for Generation Reliability Evaluation’. IEEE Transactions
on Power Systems, Vol. 23, No. 3, August 2008.
[26] François Vallée, Jacques Lobry, and Olivier Deblecker, ‘System Reliability
Assessment Method for Wind Power Integration’. IEEE Transactions on Power
Systems, Vol. 23, No. 3, August 2008.
[27] François Vallée, Jacques Lobry, and Olivier Deblecker, ‘Impact of the Wind
Geographical Correlation Level for Reliability Studies’. . IEEE Transactions on
Power Systems, Vol. 23, No. 2, May 2008.
[28] Andréa P. Leite, Carmen L. T. Borges and Djalma M. Falcão, ‘Probabilistic
Wind Farms Generation Model for Reliability Studies Applied to Brazilian Sites’.
IEEE Transactions on Power Systems, Vol. 21, No. 4, November 2006.
[29] Panida Jirutitijaroen, Chanan Singh, ‘Reliability and Cost Tradeoff in
Multiarea Power System Generation Expansion Using Dynamic Programming and
Global Decomposition’. IEEE Transactions on Power Systems, Vol. 21, No. 3,
August 2006.
[30] Roy Billinton and Jingdong Ge, ‘A Comparison of Four-State Generating Unit
Reliability Models for Peaking Units’. IEEE Transactions on Power Systems, Vol.
19, No.2, May 2004.
[31] Nima Amjady, Davood Farrokhzad, Mohammad Modarres, ‘Optimal Reliable
Operation of Hydrothermal power Systems With Random Unit Outages’. IEEE
Transactions on Power Systems, Vol. 18, No.1, February 2003.
[32] Juan M. Rodríguez, José L. Fernández, Domingo Beato, Ramón Iturbe, Julio
Usaola, Pablo Ledesma and José R Wilhelmi, ‘Incidence on Power System
Dynamics of High Penetration of Fixed Speed and Doubly Fed Wind Energy
Systems: Study of the Spanish Case’. IEEE Transactions on Power Systems, Vol.
17, No.4, November 2002.
[33] H. A. M. Maghraby, M. H. Shwehdi and Ghassan K. Al-Bassam,
‘Probabilistic Assessment of Photovoltaic (PV) Generation Systems’. IEEE
Transactions on Power Systems, Vol. 17, No.1, February 2002.
[34] Luqing Ye, Shengtie Wang, Fengshan Bing, O. P. Malik and Yuming Zeng,
‘Control/Maintenance Strategy Fault Tolerant Mode and Reliability Analysis for
Hydro Power Stations’. IEEE Transactions on Power Systems, Vol. 16, No.3,
August 2001.

CHALMERS, Energy and Environment, Master’s Thesis 26
[35] R. Billinton, Hua Chen, Jiaqi Zhou, 'Individual Generating Station Reliability
Assessment'. IEEE Transactions on Power Systems, Vol. 14, No.4, November
1999.
[36] Carnino Gonziilez, Jesus Juan, 'Leveling Reliability in Systems with Large
Hydro Resources'. IEEE Transactions on Power Systems, Vol. 14, No.1, February
1999.
[37] R. Billinton, Mua Chen, 'Assessment of Risk-Based Capacity Benefit Factors
Associated With Wind Energy Conversion Systems'. IEEE Transactions on Power
Systems, Vol. 13, No.3, August 1998.
[38] Jeslis Juan Isabel Ortega, 'Reliability Analysis for Hydrothermal Generating
Systems Including the Effect of Maintenance Scheduling '. IEEE Transactions on
Power Systems, Vol. 12, No.4, November 1997.
[39] M. Papadopoulos, P. Malatestas, N. Hatziargyriou, 'Simulation and analysis of
small and medium size power systems containing wind turbines'. IEEE
Transactions on Power Systems, Vol. 6, No.4, November 1991.
[40] C. Singh, Y Kim, 'An Efficient Technique For Reliability Analysis Of Power
Systems Including Time Dependent Sources'. IEEE Transactions on Power
Systems, Vol.3, No.3, August 1988.
[41] A. D. Patton, J. H. Blackstone, N. J. Balu, 'Monte Carlo Simulation Approach
To The Reliability Modeling Of Generating Systems Recognizing Oper Ating
Considerations'. IEEE Transactions on Power Systems, Vol.3, No.3, August 1988.
[42] R. Naik and N. Mohan, Mark Rogers, Alec Bulawka, 'A Novel Grid Interface,
Optimized For Utility-Scale Applications Of Photovoltaic, Wind-Electric, And
Fuel-Cell Systems'. IEEE Transactions on Power Delivery, Vol. 10, No.4, October
1995.
B. Reliability analysis and Planning, Transmission
[43] Kory W. Hedman, Michael C. Ferris, Richard P. O’Neill, Emily Bartholomew
Fisher, Shmuel S. Oren, ‘Co-Optimization of Generation Unit Commitment and
Transmission Switching With N-1 Reliability’. IEEE Transactions on Power
Systems, Vol. 25, No. 2, May 2010.
[44] Maryam Ramezani, Chanan Singh, Mahmood-Reza Haghifam, ‘Role of
Clustering in the Probabilistic Evaluation of TTC in Power Systems Including
Wind Power Generation’. IEEE Transactions on Power Systems, Vol. 24, No. 2,
May 2009.
[45] Roy Billinton and Wijarn Wangdee, ‘Reliability-Based Transmission
Reinforcement Planning Associated With Large-Scale Wind Farms’. IEEE
Transactions on Power Systems, Vol. 22, No. 1, February 2007.
[46] Dimitrios J papakammenos, Evangelos N Dialynas, ’ Reliability and Cost
Assessment of Power Transmission Networks in the Competitive Electrical Energy
Market’. IEEE Transactions on Power Systems, Vol. 19, No.1, February 2004.
[47] Armando M. Leite da Silva, João Guilherme de Carvalho Costa, Luiz Antônio
da Fonseca Manso and George J. Anders, ‘Transmission Capacity: Availability,
Maximum Transfer and Reliability’. IEEE Transactions on Power Systems, Vol.
17, No.3, August 2002.
[48] Mahmud Fotuhi-Firuzabad, Roy Billinton, 'An energy based approach to
evaluate optimum interruptible load carrying capability in isolated and
interconnected systems including well-being constraints'. IEEE Transactions on
Power Systems, Vol. 12, No.4, November 1997.

CHALMERS, Energy and Environment, Master’s Thesis 27
[49] Mahmud Fotuhi-Firuzabad, Roy Billinton, S. Aboreshaid, 'Diagnosing The
Health Of Bulk Generation And HVDC Transmission Systems'. IEEE Transactions
on Power Systems, Vol. 12, No.4, November 1997.
[50] Eugene G. Preston, W. Mack Grady, Martin L. Baughman, 'A New Planning
Model For Assessing The Effects Of Transmission Capacity Constraints On The
Reliability Of Generation Supply For Large Nonequivalenced Electric Networks'.
IEEE Transactions on Power Systems, Vol. 12, No.3, August 1997.
[51] R-Billinton, A.Sankarakrishnan, 'Adequacy Assessment Of Composite Power
Systems With Hvdc Links Using Monte Carlo Simulation'. IEEE Transactions on
Power Systems, Vol. 9, No.3, August 1994.
[52] R. Billinton and J. Oteng-Adjei, 'Utilization Of Interrupted Energy Assessment
Rates In Generation And Transmission System Planning'. IEEE Transactions on
Power Systems, Vol. 6, No.3, August 1991.
[53] A.C.G.Melo, M.V.F.Pereira, A.M.Leite da Silva, 'Frequency And Duration
Calculations In Composite Generation And Transmission Reliability Evaluation'.
IEEE Transactions on Power Systems, Vol. 7, No.2, May 1992.
[54] Sherif Omar Faried, Roy Billinton and
Saleh Aboreshaid, 'Stochastic Evaluation of Voltage Sag and Unbalance in
Transmission Systems'. IEEE Transactions on Power Delivery, Vol. 20, No.4,
October 2005.
[55] Jaeseok Choi, Trungtinh Tran, A. (Rahim) A. El-Keib, Robert Thomas,
yungSeon Oh and Roy Billinton, ‘A Method for Transmission System Expansion
Planning Considering Probabilistic Reliability Criteria’. IEEE Transactions on
Power Systems, Vol. 20, No.3, August 2005.
[56] K. N. Shubhanga and Anil M. Kulkarni, ’Application of Structure Preserving
Energy Margin Sensitivity to Determine the Effectiveness of Shunt and Series
FACTS Devices’. IEEE Transactions on Power Systems, Vol. 17, No.3, August
2002.
[57] R. Billinton, M. Fotuhi-Firuzabad, S.O. Faried, 'Power system reliability
enhancement using a thyristor controlled series capacitor'. IEEE Transactions on
Power Systems, Vol. 14, No.1, February 1999.
[58] James A. Momoh, Yanchun Wang, Mahmoud Elfayoumy, Bill Mittelstadt, S.
K. Agarwal, R. Adapa, 'A Value-Based Reliability Enhancement Scheme for Bulk
Transmission System Planning'. IEEE Transactions on Power Systems, Vol. 13,
No.4, November 1998.
[59] Roy Billinton, Saleh Aboreshaid, Mahmud Fotuhi-Firuzabad, 'Well-Being
Analysis For HVDC Transmission Systems'. IEEE Transactions on Power
Systems, Vol. 12, No.2, May 1997.
[60] F.D. Galiana, K. Almeida, M. Toussaint, J. Griffin, D. Atanackovic, B.T. Ooi,
D.T. McGillis, 'Assessment And Control Of The Impact Of Facts Devices On
Power System Performance'. IEEE Transactions on Power Systems, Vol. 11, No.4,
November 1996.
[61] W. Li, Y. Mansour, J.K. Korczynski, B.J. Mills, 'Application Of Transmission
Reliability Assessment In Probabilistic Planning Of BC Hydro Vancouver South
Metro System'. IEEE Transactions on Power Systems, Vol. 10, No.2, May 1995.
[62] T.K.P. Medicherla, M. Chau, R.E. Zigmund, K. Chan, 'Transmission Station
Reliability Evaluation'. IEEE Transactions on Power Systems, Vol. 9, No.1,
February 1994.

CHALMERS, Energy and Environment, Master’s Thesis 28
[63] A. D. Patton, S. K. Sung, 'A Transmission Network Model for Multi- Area
Reliability Studies'. IEEE Transactions on Power Systems, Vol. 8, No.2, May
1993.
[64] J. F. Adami, P. M. Silveira, M. L. B. Martinez, R. C. Perez, and A. C.
Dallbello, 'New Approach to Improve High-Voltage Transmission Line
Reliability'. IEEE Transactions on Power Delivery, Vol. 24, No.3, July 2009.
[65] Wenyuan Li and Jerry Korczynski, 'A Reliability-Based Approach to
Transmission Maintenance Planning and Its Application in BC Hydro System'.
IEEE Transactions on Power Delivery, Vol. 19, No.1, January 2004.
[66] Sastry Kuruganty, 'Comparison Of Reliability Performance Of Group
Connected And Conventional HVDC Transmission Systems'. IEEE Transactions
on Power Delivery, Vol. 10, No.4, October 1995.
[67] E.N. Dialynas, NC Koskolos, 'reliability Modeling And Evaluation Of HVDC
Power Transmission Systems'. IEEE Transactions on Power Delivery, Vol. 9,
No.2, April 1994.
[68] Sastry Kuruganty, 'Effect Of HVDC Component Enhancement On The
Overall System Reliability Performance'. IEEE Transactions on Power Delivery,
Vol. 9, No.1, January 1994.
[69] lvars Vancers, F. John Hormozi, IEEE working group, 'A Summary Of North
American HVDC Converter Station
Reliability Specifications'. IEEE Transactions on Power Delivery, Vol. 8, No.3,
July 1993.
[70] Masahiro Ishikawa, Susumu Horiuchi, Syunichi Hirose, Takami Sakai, Tsuneo
Horiuchi, 'HVDC Transmission Control Equipment With High Reliability'. IEEE
Transactions on Power Delivery, Vol. 1, No.2, April 1986.
C. Power System Economics and Optimization
[71] Meysam Jaefari-Nokandi and Hasan Monsef, ’ Scheduling of Spinning
Reserve Considering Customer Choice on Reliability’. IEEE Transactions on
Power Systems, Vol. 24, No. 4, November 2009.
[72] Dimitris N. Simopoulos, Stavroula D. Kavatza, and Costas D. Vournas,
‘Reliability Constrained Unit Commitment Using Simulated Annealing’. IEEE
Transactions on Power Systems, Vol. 21, No. 4, November 2006.
[73] Yi Ding and Peng Wang, ‘Reliability and Price Risk Assessment of a
Restructured Power System With Hybrid Market Structure’. IEEE Transactions on
Power Systems, Vol. 21, No.1, February 2006.
[74] Peng Wang, M and Roy Billinton, ‘Reliability Assessment of a Restructured
Power System Considering the Reserve Agreements’. IEEE Transactions on Power
Systems, Vol. 19, No.2, May 2004.
[75] Roy Billinton, Rajesh Karki, 'Capacity Reserve Assessment Using System
Well-being Analysis'. IEEE Transactions on Power Systems, Vol. 14, No.2, May
1999.
[76] Roy Billinton, Mahmud Fotuhi-Firuzabad, Saleh Aboresbaid, 'Unit
commitment health analysis for interconnected systems'. IEEE Transactions on
Power Systems, Vol. 12, No.3, August 1997.
[77] Jnahman, S. Bulatovic, 'Power system operating cost and committed
generation capacity planning'. IEEE Transactions on Power Systems, Vol. 11,
No.4, November 1996.
[78] S. J. Wang, S. M. Shahidehpour, D. S. Kirschen, S. Mokhtari, G. D. Irisarri,
'Short-Term Generation Scheduling With Transmission And Environmental

CHALMERS, Energy and Environment, Master’s Thesis 29
Constraints Using An Augmented Lagrangian Relaxation'. IEEE Transactions on
Power Systems, Vol. 10, No.3, August 1995.
[79] R. Ghajar, R. Billinton, 'Evaluation of the marginal outage costs in
interconnected and composite power systems '. IEEE Transactions on Power
Systems, Vol. 10, No.2, May 1995.
[80] R. Billinton, R Ghajar, 'Evaluation Of The Marginal Outage Costs Of
Generating Systems For The Purposes Of Spot Pricing'. IEEE Transactions on
Power Systems, Vol. 9, No.1, February 1994.
[81] Li Wenyuan,R. Billinton, 'A Mininum Cost Assessment Method For
Composite Generation and Transmission System Expansion Planning'. IEEE
Transactions on Power Systems, Vol. 8, No.2, May 1993.
[82] Martin L. Baughman, Walter W. Lee., 'A Monte Carlo Model For Calculating
Spot Market Prices Of Electricity'. IEEE Transactions on Power Systems, Vol. 7,
No.2, May 1992.
[83] L. Goel, R. Billinton, 'A Procedure for Evaluating Interrupted Energy
Assessment Rates in an Overall Electric Power System'. IEEE Transactions on
Power Systems, Vol. 6, No.4, November 1991.
[84] K. Chu, R. Billinton, 'Probabilistic Generating Capacity Cost Of Service
Allocation'. IEEE Transactions on Power Systems, Vol. 4, No.3, August 1989.
[85] Lei Wu, Mohammad Shahidehpour, Tao Li, ‘Cost of Reliability Analysis
Based on Stochastic Unit Commitment’. IEEE Transactions on Power Systems,
Vol. 23, No. 3, August 2008.
[86] Camino González, Jesús Juan, José Mira, Francisco J. Prieto, and María J.
Sánchez, ‘Reliability Analysis for Systems With Large Hydro Resources in a
Deregulated Electric Power Market’. IEEE Transactions on Power Systems, Vol.
20, No.1, February 2005.
[87] Ignacio J. Ramírez-Rosado and José L. Bernal-Agustín, ‘Reliability and Costs
Optimization for Distribution Networks Expansion Using an Evolutionary
Algorithm’. IEEE Transactions on Power Systems, Vol. 16, No.1, February 2001.
[88] Victor Udo, Sudhir K. Agarwal, Ali Vojdani, M. I. Harlacher, 'Balancing Cost
and Reliability: A Quantitative Study at Atlantic Electric'. IEEE Transactions on
Power Systems, Vol. 12, No.3, August 1997.
[89] R. Tamaschke, G. Docwra and R. Stillman, 'Modelling Regional End User
Price/Cost Relationships In A Widespread Interconnected Power System'. IEEE
Transactions on Power Systems, Vol. 10, No.4, November 1995.
[90] Ernie G. Neudorf, David L. Kiguel, Gomaa A. Hamoud, Berardino Porretta,
William M. Stephenson, Morse, Richard, Weisenmiller &
Robert W. Sparks, Douglas M. Logan, RCG/Hagler Bailly, Boulder, Colorado
Murty P. Bhavaraju, Roy Billinton, David L. Garrison, 'Cost-Benefit Analysis Of
Power System Reliability: Two Utility Case Studies'. IEEE Transactions on Power
Systems, Vol. 10, No.3, August 1995.
[91] Jovica V. Milanovic´and Chandra P. Gupta, 'Probabilistic Assessment of
Financial Losses due to Interruptions and Voltage Sags—Part I: The Methodology'.
IEEE Transactions on Power Delivery, Vol. 21, No.2, April 2006.
[92] Jovica V. Milanovic´and Chandra P. Gupta, 'Probabilistic Assessment of
Financial Losses due to Interruptions and Voltage Sags—Part II: Practical
Implementation'. IEEE Transactions on Power Delivery, Vol. 21, No.2, April 2006.
[93] Whei-Min Lin, Tung-Sheng Zhan and Chin-Der Yang, 'Distribution System
Reliability Worth Analysis With the Customer Cost Model Based on RBF Neural
Network'. IEEE Transactions on Power Delivery, Vol. 18, No.3, July 2003.
CHALMERS, Energy and Environment, Master’s Thesis 30
D. Reliability Analysis and Planning, Distribution
[94] Yasser M. Atwa, Ehab F. El-Saadany, ’Reliability Evaluation for Distribution
System With Renewable Distributed Generation During Islanded Mode of
Operation’. IEEE Transactions on Power Systems, Vol. 24, No. 2, May 2009.
[95] In-Su Bae and Jin-O Kim, ‘Reliability Evaluation of Customers in a
Microgrid’. IEEE Transactions on Power Systems, Vol. 23, No. 3, August 2008.
[96] Jin-Man Sohn, Soon-Ryul Nam, and Jong-Keun Park, ‘Value-Based Radial
Distribution System Reliability Optimization’. IEEE Transactions on Power
Systems, Vol. 21, No.2, May 2006.
[97] Zhuding Wang, Farrokh Shokooh and Jun Qiu, ‘An Efficient Algorithm for
Assessing Reliability Indexes of General Distribution Systems’. IEEE Transactions
on Power Systems, Vol. 17, No.3, August 2002.
[98] Roy Billinton, Peng Wang, 'Distribution System Reliability Cost/Worth
Analysis Using Analytical and Sequential Simulation Techniques'. IEEE
Transactions on Power Systems, Vol. 13, No.4, November 1998.
[99] R.E. Brown, J.R. Ochoa, 'Distribution System Reliability: Default Data and
Model Validation'. IEEE Transactions on Power Systems, Vol. 13, No.2, May
1998.
[100] Sohrab Asgarpoor, Matthew J. Mathine , 'Reliability Evaluation of
Distribution Systems with Non-Exponential
Down Times'. IEEE Transactions on Power Systems, Vol. 12, No.2, May 1997.
[101] R N AUan, M G Da Siva, 'Evaluation Of Reliability Indices And Outage Costs
In Distribution Systems'. IEEE Transactions on Power Systems, Vol. 10, No.1,
February 1995.
[102] Xiao Xiangning, Tao Shun, Bi Tianshu and Xu Yonghai, , 'Study on
Distribution Reliability Considering Voltage Sags and AccepTable Indices'. IEEE
Transactions on Power Delivery, Vol. 22, No.2, April 2007.
[103] Weixing Li, Peng Wang, Zhimin Li and Yingchun Liu, 'Reliability Evaluation
of Complex Radial Distribution Systems Considering Restoration Sequence and
Network Constraints'. IEEE Transactions on Power Delivery, Vol. 19, No.2, April
2004.
[104] Peng Wang and Roy Billinton, 'Reliability Cost/Worth Assessment of
Distribution Systems Incorporating Time-Varying Weather Conditions and
Restoration Resources'. IEEE Transactions on Power Delivery, Vol. 17, No.1,
January 2002.
[105] Teng-Fa, Hong-Chan, 'Modeling Failure Data of Overhead Distribution
Systems'. IEEE Transactions on Power Delivery, Vol. 15, No.4, October 2000.
[106] Peng Wang, Roy Billinton, 'Time Sequential Distribution System Reliability
Worth Analysis Considering Time Varying Load and Cost Models'. IEEE
Transactions on Power Delivery, Vol. 14, No.3, July 1999.
[107] Roy Billinton, Satish Jonnavithula, 'Optimal Switching Device Placement in
Radial Distribution Systems'. IEEE Transactions on Power Delivery, Vol. 11,
No.3, July 1996.
[108] L. Goel, R. Billinton, 'Determination Of Rebliabillty Worth For Distribution
System Planning'. IEEE Transactions on Power Delivery, Vol. 9, No.3, July 1994.
[109] L. Goel, R. Billinton, 'Evaluation of Interrupted Energy Assessment Rates in
Distribution Systems'. IEEE Transactions on Power Delivery, Vol. 6, No.4,
October 1999.

CHALMERS, Energy and Environment, Master’s Thesis 31
[110] Kristien Clement-Nyns, Edwin Haesen, Johan Driesen, ‘The Impact of
Charging Plug-In Hybrid Electric Vehicles on a Residential Distribution Grid’.
IEEE Transactions on Power Systems, Vol. 25, No. 1, February 2010.
[111] Aleksandar Pregelj, Miroslav Begovic, Ajeet Rohatgi, ’ Recloser Allocation
for Improved Reliability of DG-Enhanced Distribution Networks’. IEEE
Transactions on Power Systems, Vol. 21, No. 3, August 2006.
[112] Dan Zhu, Robert P. Broadwater, Kwa-Sur Tam, Rich Seguin, and Haukur
Asgeirsson, ‘Impact of DG Placement on Reliability and Efficiency With Time-
Varying Loads’. IEEE Transactions on Power Systems, Vol. 21, No.1, February
2006.
[113] Lina Bertling, Ron Allan, and Roland Eriksson, ’A Reliability-Centered Asset
Maintenance Method for Assessing the Impact of Maintenance in Power
Distribution Systems’. IEEE Transactions on Power Systems, Vol. 20, No.1,
February 2005.
[114] Fangxing Li, ‘Distributed Processing of Reliability Index Assessment and
Reliability-Based Network Reconfiguration in Power Distribution Systems’. IEEE
Transactions on Power Systems, Vol. 20, No.1, February 2005.
[115] Enrico Carpaneto and Gianfranco Chicco, ‘Evaluation of the Probability
Density Functions of Distribution System Reliability Indices With a Characteristic
Functions-Based Approach’. IEEE Transactions on Power Systems, Vol. 19, No.2,
May 2004.
[116] P M S Carvalho, L A F M Ferreira, ‘Urban Distribution Network Investment
Criteria for Reliability Adequacy’. IEEE Transactions on Power Systems, Vol. 19,
No.2, May 2004.
[117] Teng-Fa, Hong-Chan, ‘Composite Reliability Evaluation Model for different
Types of Distribution Systems’. IEEE Transactions on Power Systems, Vol. 18,
No.2, May 2003.
[118] Ignacio J. Ramirez-Rosado JoseL. Bernal-Agustin, 'Genetic Algorithms
Applied To The Design Of Large Power Distribution Systems'. IEEE Transactions
on Power Systems, Vol. 13, No.2, May 1998.
[119] C Y Teo, 'A Comprehensive Fault Diagnostic System Using Artificial
Intelligence For Sub-Transmission And Urban Distribution Networks'. IEEE
Transactions on Power Systems, Vol. 12, No.4, November 1997.
[120] IEEE Distribution Planning Working Group Report, 'Radial Distribution Test
Feeders'. IEEE Transactions on Power Systems, Vol. 6, No.3, August 1991.
[121] C. C. Fong, C . H. Grigg, 'Reliability Evaluation Of Sub-Transmission
Networks With Capacity And Energy-Limited Hydraulic Generation'. IEEE
Transactions on Power Systems, Vol. 4, No.3, August 1989.
[122] H. M. Khodr, J. Martínez-Crespo, M. A. Matos and J. Pereira, 'Distribution
Systems Reconfiguration Based on OPF Using Benders Decomposition'. IEEE
Transactions on Power Delivery, Vol. 24, No.4, October 2009.
[123] Neville R. Watson, Tasman L. Scott and Stephen J. J. Hirsch, 'Implications for
Distribution Networks of High Penetration of Compact Fluorescent Lamps'. IEEE
Transactions on Power Delivery, Vol. 24, No.3, July 2009.
[124] Pukar Mahat, Zhe Chen and Birgitte Bak-Jensen, 'A Hybrid Islanding
Detection Technique Using Average Rate of Voltage Change and Real Power
Shift'. IEEE Transactions on Power Delivery, Vol. 24, No.2, April 2009.
[125] Tomonobu Senjyu, Yoshitaka Miyazato,
Atsushi Yona, Naomitsu Urasaki and
Toshihisa Funabashi, 'Optimal Distribution Voltage Control and Coordination
CHALMERS, Energy and Environment, Master’s Thesis 32
With Distributed Generation'. IEEE Transactions on Power Delivery, Vol. 23,
No.2, April 2008.
[126] Sanjay Bahadoorsingh, Jovica V. Milanovic´,
Yan Zhang, C. P. Gupta and Jelena Dragovic, 'Minimization of Voltage Sag Costs
by Optimal Reconfiguration of Distribution Network Using Genetic Algorithms'.
IEEE Transactions on Power Delivery, Vol. 22, No.4, October 2007.
[127] T. X. Wang and S. S. Choi, 'Enhancement of Voltage Quality in Isolated
Power Systems'. IEEE Transactions on Power Delivery, Vol. 22, No.2, April 2007.
[128] Natthaphob Nimpitiwan, Gerald Thomas Heydt, Raja Ayyanar and Siddharth
Suryanarayanan, 'Fault Current Contribution From Synchronous Machine and
Inverter Based Distributed Generators'. IEEE Transactions on Power Delivery,
Vol. 22, No.1, January 2007.
[129] Yute Chen and Jeng Kuang Hwang, 'A Reliable Energy Information System
for Promoting Voluntary Energy Conservation Benefits'. IEEE Transactions on
Power Delivery, Vol. 21, No.1, January 2006.
[130] Debapriya Das, 'A Fuzzy Multiobjective Approach for Network
Reconfiguration of Distribution Systems'. IEEE Transactions on Power Delivery,
Vol. 21, No.1, January 2006.
[131] Nagaraj Balijepalli, Subrahmanyam S. Venkata,
Charles W. Richter, Richard D. Christie and Vito J. Longo, 'Distribution System
Reliability Assessment Due to Lightning Storms'. IEEE Transactions on Power
Delivery, Vol. 20, No.3, July 2005.
[132] Richard D. Christie, 'Statistical Classification of Major Event Days in
Distribution System Reliability'. IEEE Transactions on Power Delivery, Vol. 18,
No.4, October 2003.
[133] Jovan Nahman and Dragoslav Peric, 'Distribution System Performance
Evaluation Accounting for Data Uncertainty'. IEEE Transactions on Power
Delivery, Vol. 18, No.3, July 2003.
[134] Brian P. Lang and Anil Pahwa, 'Power Distribution System Reliability
Planning Using a Fuzzy Knowledge-Based Approach'. IEEE Transactions on
Power Delivery, Vol. 15, No.1, January 2003.
[135] Karen Nan Miu and Hsiao-Dong Chiang, 'Electric Distribution System Load
Capability: Problem Formulation, Solution Algorithm, and Numerical Results'.
IEEE Transactions on Power Delivery, Vol. 15, No.1, January 2003.
[136] R.A. Slavickas, R.T.H. Alden, M.A. El-Kady, 'Distribution Utility's Trade-Off
Decisions In Obtaining Sources of Electricity'. IEEE Transactions on Power
Delivery, Vol. 14, No.4, October 1999.
[137] D. Atanackovic, D.T. McGillis, F.D. Gdiana, 'Reliability Comparison Of
Substation Designs'. IEEE Transactions on Power Delivery, Vol. 14, No.3, July
1999.
[138] J.J. Meeuwsen and W.L. Kling, 'Substation reliability evaluation including
switching actions with redundant components'. IEEE Transactions on Power
Delivery, Vol. 12, No.4, October 1997.
R. E. Brown, S. Gupta, R. D. Christie, S. S. Venkata, R. Fletcher, 'Distribution
System Reliability Assessment: Momentary Interruptions
[139] and Storms'. IEEE Transactions on Power Delivery, Vol. 12, No.4, October
1997.
[140] Atish K. Ghosh, David L. Lubkeman, Robert H. Jones, 'Load Modeling For
Distribution Circuit State Estimation'. IEEE Transactions on Power Delivery, Vol.
12, No.2, April 1997.

CHALMERS, Energy and Environment, Master’s Thesis 33
[141] P. Jourda, E. Bourgade, R. N. Allan, 'Evaluating The Availability Of Electrical
Substations: A Dynamic Methodology'. IEEE Transactions on Power Delivery,
Vol. 11, No.4, October 1996.
[142] R. E. Brown, S. Gupta, R. D. Christie, S. S. Venkata, R. Fletcher, 'Distribution
System Reliability Assessment Using Hierarchical Markov Modeling'. IEEE
Transactions on Power Delivery, Vol. 11, No.4, October 1996.
[143] Rong-Liang, Chen Kim Allen, Roy Billinton, 'Value-Based Distribution
Reliability Assessment and Planning'. IEEE Transactions on Power Delivery, Vol.
10, No.1, January 1995.
[144] Y.C.Le, M. Etezadi-Amoli, 'An Improved Modeling Technique For
Distribution Feeders With Incomplete Information'. IEEE Transactions on Power
Delivery, Vol. 8, No.4, October 1993.
[145] R. Billinton, G. Lian, 'Station Reliability Evaluation Using A Monte Carlo
Approach'. IEEE Transactions on Power Delivery, Vol. 8, No.3, July 1993.
[146] James G.Tine, Dennis A. Walder, 'Improved Distribution System Reliability
At Northeast Utilities: A Case History'. IEEE Transactions on Power Delivery,
Vol. 8, No.2, April 1993.
[147] Cheryl Marinello Warren, 'The Effect Of Reducing Momentary Outages On
Distribution Reliability Indices'. IEEE Transactions on Power Delivery, Vol. 7,
No.3, July 1992.
[148] Sidney R. Gilligan, 'A Method For Estimating The Reliability Of Distribution
Circuits'. IEEE Transactions on Power Delivery, Vol. 7, No.2, April 1992.
[149] E . N . Dialynas, D . G . Yichos, 'probabilistic Assessment Of Service
Restoration In Power Systems'. IEEE Transactions on Power Delivery, Vol. 6,
No.4, October 1991.
[150] Saul Goldberg, William F. Horton, Virgil G. Rose , 'Analysis Of Feeder
Service Reliability Using Component Failure Rates'. IEEE Transactions on Power
Delivery, Vol. 2, No.4, October 1987.
[151] R. Billinton, R Goel, 'An Analytical Approach Td Evaluate Probability
Distributions Associated With The Reliability Indices Of Electric Distribution
Systems'. IEEE Transactions on Power Delivery, Vol. 1, No.3, July 1986.
E. New Techniques for Reliability Analysis
[152] J. M. S. Pinheiro, C. R. R. Dornellas. M. Th. Schilling. A. C. G. Melo J. C. O.
Mello, 'Probing The New IEEE Reliability Test System (RTS-96): HL-II
Assessment'. IEEE Transactions on Power Systems, Vol. 13, No.1, February 1998.
[153] Fabíola Ferreira Clement Véliz, Carmen Lucia Tancredo Borges, ‘A
Comparison of Load Models for Composite Reliability Evaluation by
Nonsequential Monte Carlo Simulation’. IEEE Transactions on Power Systems,
Vol. 25, No. 2, May 2010.
[154] Yong Liu and Chanan Singh, ‘Reliability Evaluation of Composite Power
Systems Using Markov Cut-Set Method’. IEEE Transactions on Power Systems,
Vol. 25, No. 2, May 2010.
[155] Hagkwen Kim, Chanan Singh, ‘Reliability Modeling and Simulation in Power
Systems With Aging Characteristics’. IEEE Transactions on Power Systems, Vol.
25, No. 1, February 2010.
[156] Armando M. Leite da Silva, Reinaldo A. G. Fernández, Chanan Singh,
‘Generating Capacity Reliability Evaluation Based on Monte Carlo Simulation and
Cross-Entropy Methods’. IEEE Transactions on Power Systems, Vol. 25, No. 1,
February 2010.
CHALMERS, Energy and Environment, Master’s Thesis 34
[157] Vladimiro Miranda, Fellow, Leonel de Magalhães Carvalho, Mauro Augusto
da Rosa, Armando M. Leite da Silva, Chanan Singh, ’ Improving Power System
Reliability Calculation Efficiency With EPSO Variants’. IEEE Transactions on
Power Systems, Vol. 24, No. 4, November 2009.
[158] Marcus Theodor Schilling, Julio Cesar Stacchini de Souza, Milton Brown Do
Coutto Filho, ‘Power System Probabilistic Reliability Assessment: Current
Procedures in Brazil’. IEEE Transactions on Power Systems, Vol. 23, No. 3,
August 2008.
[159] Roy Billinton, Dange Huang, ‘Effects of Load Forecast Uncertainty on Bulk
Electric System Reliability Evaluation’. IEEE Transactions on Power Systems,
Vol. 23, No. 2, May 2008.
[160] Panida Jirutitijaroen, Chanan Singh, ‘Comparison of Simulation Methods for
Power System Reliability Indexes and Their Distributions’. IEEE Transactions on
Power Systems, Vol. 23, No. 2, May 2008.
[161] Panida Jirutitijaroen, Chanan Singh, ‘Reliability Constrained Multi-Area
Adequacy Planning Using Stochastic Programming With Sample-Average
Approximations’. IEEE Transactions on Power Systems, Vol. 22, No. 4, November
2007.
[162] Armando M. Leite da Silva, Leonidas Chaves de Resende, Luiz Antônio da
Fonseca Manso, and Vladimiro Mirandaranda, ‘Composite Reliability Assessment
Based on Monte Carlo Simulation and Artificial Neural Networks’. IEEE
Transactions on Power Systems, Vol. 22, No. 3, August 2007.
[163] Jean-Michel Tesseron and Georges Testud, ‘A Gravity Scale for Detecting and
Analyzing Events Affecting Power System Reliability’. IEEE Transactions on
Power Systems, Vol. 22, No. 2, May 2007.
[164] Pedro M. S. Carvalho and Luís A. F. M. Ferreira, ‘Distribution Quality of
Service and Reliability Optimal Design: Individual Standards and Regulation
Effectiveness’. IEEE Transactions on Power Systems, Vol. 20, No.4, November
2005.
[165] Nima Amjady, ‘A Framework of Reliability Assessment With Consideration
Effect of Transient and Voltage Stabilities’. IEEE Transactions on Power Systems,
Vol. 19, No.2, May 2004.
[166] Mingbo Liu, S. K. Tso and Ying Cheng, ‘An Extended Nonlinear Primal-Dual
Interior-Point Algorithm for Reactive-Power Optimization of Large-Scale Power
Systems With Discrete Control Variables’. IEEE Transactions on Power Systems,
Vol. 17, No.4, November 2002.
[167] Peng Wang, Roy Billinton and Lalit Goel, ‘Unreliability Cost Assessment of
an Electric Power System Using Reliability Network Equivalent Approaches’.
IEEE Transactions on Power Systems, Vol. 17, No.3, August 2002.
[168] Zhaoxia Xie, G. Manimaran,Vijay Vittal, A. G. Phadke and Virgilio Centeno,
‘An Information Architecture for Future Power Systems and Its Reliability
Analysis’. IEEE Transactions on Power Systems, Vol. 17, No.3, August 2002.
[169] Jin-O. Kim and Chanan Singh, ‘Including Uncertainty in LOLE Calculation
Using Fuzzy Set Theory’. IEEE Transactions on Power Systems, Vol. 17, No.1,
February 2002.
[170] Kuang-Rong Shih and Shyh-Jier Huang, ‘Application of a Robust Algorithm
for Dynamic State Estimation of a Power System’. IEEE Transactions on Power
Systems, Vol. 17, No.1, February 2002.
[171] Carmen L. T. Borges, Djalma M. Falcão, João Carlos O. Mello, Albert C. G.
Melo, ’Composite Reliability Evaluation by Sequential Monte Carlo Simulation on

CHALMERS, Energy and Environment, Master’s Thesis 35
Parallel and Distributed Processing Environments’. IEEE Transactions on Power
Systems, Vol. 16, No.2, May 2001.
[172] Viktor A. Levi, Jovan M. Nahman and Dusko P. Nedic, ’ Security Modeling
for Power System Reliability Evaluation’. IEEE Transactions on Power Systems,
Vol. 16, No.1, February 2001.
[173] Hua Wan, James D. McCalley and Vijay Vittal, ‘Risk Based Voltage Security
Assessment’. IEEE Transactions on Power Systems, Vol. 15, No.4, November
2000.
[174] M. Fotuhi-Firuzabad and Roy Billinton, ‘Impact of Load Management on
Composite System Reliability Evaluation Short-Term Operating Benefits’. IEEE
Transactions on Power Systems, Vol. 15, No.2, May 2000.
[175] Armando M. Leite da Silva, Luiz A. da Fonscca Manso, JoPo C. de Oliveira
Mello and Roy Billinton, ‘Pseudo-Chronological Simulation for Composite
Reliability Analysis with Time Varying Loads’. IEEE Transactions on Power
Systems, Vol. 15, No.1, February 2000.
[176] Andrea M. Rei, Armando M. Lek da Silva, Jorge L. Jardim and Jog0 Carlos de
Oliveira Mello, ’Static and Dynamic Aspects in Bulk Power System Reliability
Evaluations’. IEEE Transactions on Power Systems, Vol. 15, No.1, February 2000.
[177] R. Rillinton and W. Zhang, ‘State Extension for Adequacy Evaluation of
Composite Power Systems- applications’. IEEE Transactions on Power Systems,
Vol. 15, No.1, February 2000.
[178] R. Billinton, M. Pandey, 'Reliability worth assessment in a developing country
- residential survey results'. IEEE Transactions on Power Systems, Vol. 14, No.4,
November 1999.
[179] James A. Momoh, Mahmoud Elfayoumy, William Mittelstadt, 'Value-based
reliability for short term operational planning'. IEEE Transactions on Power
Systems, Vol. 14, No.4, November 1999.
[180] James A. Momoh, Yuri V. Makarov, William Mittelstadt, 'A Framework of
Voltage stability Assessment in Power System Reliability Analysis'. IEEE
Transactions on Power Systems, Vol. 14, No.2, May 1999.
[181] Guo Yongji, Xi Yongjian, Xiao Kai, Yang Huiyi, 'Composite System
Reliability Evaluation based on Monte-Carlo Simulation Combined with Outages
Screening'. IEEE Transactions on Power Systems, Vol. 14, No.2, May 1999.
[182] Nima Amjady, Mehdi Ehsan, 'Evaluation of Power Systems Reliability by an
Artificial Neural Network'. IEEE Transactions on Power Systems, Vol. 14, No.1,
February 1999.
[183] H.A.M. Maghraby and R.N. Allan, 'Application of dc equivalents to the
reliability evaluation of composite power systems'. IEEE Transactions on Power
Systems, Vol. 14, No.1, February 1999.
[184] Sebastian Rios M., Victor Vidal P., David L. Kiguel, 'Bus-Based Reliability
Indices and Associated Costs in the Bulk Power System'. IEEE Transactions on
Power Systems, Vol. 13, No.3, August 1998.
[185] A G Bruce, 'Reliability analysis of electric utility SCADA systems'. IEEE
Transactions on Power Systems, Vol. 13, No.3, August 1998.
[186] M. E. Khan, 'Bulk load points reliability evaluation using a security based
model'. IEEE Transactions on Power Systems, Vol. 13, No.2, May 1998.
[187] G. Hamoud, 'Probabilistic Assessment Of Interconnection Assistance Between
Power Systems'. IEEE Transactions on Power Systems, Vol. 13, No.2, May 1998.

CHALMERS, Energy and Environment, Master’s Thesis 36
[188] W. Zhang and R. Billinton, 'Application of an Adequacy Equivalent Method in
Bulk Power System Reliability Evaluation'. IEEE Transactions on Power Systems,
Vol. 13, No.2, May 1998.
[189] M. Uehia, R. Ramadan, Z. El-Tawil, K. Tarhini, 'An integrated technico-
economical methodology for solving reactive power compensation problem '. IEEE
Transactions on Power Systems, Vol. 13, No.1, February 1998.
[190] J. Mitra, C. Singh, 'Capacity assistance distributions for arbitrarily conFigured
multi-area networks'. IEEE Transactions on Power Systems, Vol. 12, No.4,
November 1997.
[191] A. Jonnavithula, R. Billinton, 'Features that influence composite power system
reliability worth assessment'. IEEE Transactions on Power Systems, Vol. 12, No.4,
November 1997.
[192] H. Harsan, P. Pruvot, N. Hadjsaid, 'An efficient method for assessing security
on a daily basis [power systems]'. IEEE Transactions on Power Systems, Vol. 12,
No.4, November 1997.
[193] R. Billinton, L. Salvaderi, J.D. McCalley, H. Chao, Th. Seitz, R.N. Allan,
J.Odom, C. Fallon, 'Reliability Issues In Today's Electric Power Utility
Environment'. IEEE Transactions on Power Systems, Vol. 12, No.4, November
1997.
[194] S.N. Singh and S.C. Srivastava, 'Improved Voltage And Reactive Power
Distribution Factors For Outage Studies'. IEEE Transactions on Power Systems,
Vol. 12, No.3, August 1997.
[195] T.Nagao K.Tanaka K.Takenaka, 'Development of Static and Simulation
Programs for Voltage Stability Studies of Bulk Power System'. IEEE Transactions
on Power Systems, Vol. 12, No.1, February 1997.
[196] Satish Jonnavithula, Roy Billinton, 'Topological analysis in bulk power system
reliability evaluation '. IEEE Transactions on Power Systems, Vol. 12, No.1,
February 1997.
[197] C. Singh, J. Mitra, 'Composite System Reliability Evaluation using State
Space Pruning'. IEEE Transactions on Power Systems, Vol. 12, No.1, February
1997.
[198] A.C.G., Melo J.C.O. ,Mello S. Granville, 'The effects of voltage collapse
problems in the reliability evaluation of composite systems'. IEEE Transactions on
Power Systems, Vol. 12, No.1, February 1997.
[199] J. Mitra, C. Singh, 'Incorporating the DC Load Flow Model in the
Decomposition-Simulation Method of Multi-Area Reliability Evaluation'. IEEE
Transactions on Power Systems, Vol. 11, No.3, August 1996.
[200] A. Sankarakrishnan, R. Billinton, 'Effective Techniques For Reliability Worth
Assessment In Composite Power System Networks Using Monte Carlo
Simulation'. IEEE Transactions on Power Systems, Vol. 11, No.3, August 1996.
[201] J Tome Saraiva. Vladimiro Miranda, L.M.V.G. Pinto,
'Generation/transmission power system reliability evaluation by Monte-Carlo
simulation assuming a fuzzy load description'. IEEE Transactions on Power
Systems, Vol. 11, No.2, May 1996.
[202] A. Sankarakrishnan R. Billinton, 'Sequential Monte Carlo Simulation For
Composite Power System Reliability Analysis With Time Varying Loads'. IEEE
Transactions on Power Systems, Vol. 10, No.3, August 1995.
[203] Shams N. Siddiqi,Martin L. Baughman, 'Reliability Differentiated Pricing of
Spinning Reserve'. IEEE Transactions on Power Systems, Vol. 10, No.3, August
1995.

CHALMERS, Energy and Environment, Master’s Thesis 37
[204] L.Goel, C.K.Wong, G.S.We, 'An Educational Software Package for Reliability
Evaluation of Interconnected Power Systems'. IEEE Transactions on Power
Systems, Vol. 10, No.3, August 1995.
[205] P. Save, 'Substation Reliability - Practical Application and System Approach'.
IEEE Transactions on Power Systems, Vol. 10, No.1, February 1995.
[206] J.C.O.Mello, M.V.F. Pereira, A.M.Leite da Silva, 'Evaluation Of Reliability
Worth In Composite Systems Based On Pseudo-Sequential Monte Carlo
Simulation'. IEEE Transactions on Power Systems, Vol. 9, No.3, August 1994.
[207] N.D. Hatziargyriou, G.C. Contaxis, N.C. Sideris, 'A Decision Tree Method
For On-Line Steady State Security Assessment'. IEEE Transactions on Power
Systems, Vol. 9, No.2, May 1994.
[208] Roy Billinton, Guangbin Lian, 'Composite Power System Health Analysis
Using A Security Constrained Adequacy Evaluation Procedure'. IEEE Transactions
on Power Systems, Vol. 9, No.2, May 1994.
[209] Qin Zhou, Jennifer Davidson, A. A. Fouad, 'Application Of Artificial Neural
Networks In Power System Security And Vulnerability Assessment'. IEEE
Transactions on Power Systems, Vol. 9, No.1, February 1994.
[210] A.C.G.Melo, M.V.F.Pereira, A.M.Leite da Silva, 'A Conditional Probability
Approach To The Calculation Of Frequency And Duration Indices In Composite
Reuabilily Evaluation'. IEEE Transactions on Power Systems, Vol. 8, No.3, August
1993.
[211] L. Goel, R Billinton, 'Utilization of Interrupted Energy Assessment Rates to
Evaluate Reliability Worth in Electric Power Systems'. IEEE Transactions on
Power Systems, Vol. 8, No.3, August 1993.
[212] R Billinton, W Li, 'A system state transition sampling method for composite
system reliability evaluation'. IEEE Transactions on Power Systems, Vol. 8, No.3,
August 1993.
[213] A.M. Leite da Silva, J. Endrenyi, L. Wang, 'Integrated Treatment Of
Adequacy And Security In Bulk Power System Reliability Evaluations'. IEEE
Transactions on Power Systems, Vol. 8, No.1, February 1993.
[214] Zhong Deng, Chanan Singh, 'A New Approach To Reliability Evaluation Of
Interconnected Power Systems Including Planned Outages And Frequency
Calculations'. IEEE Transactions on Power Systems, Vol. 7, No.2, May 1992.
[215] R. Billinton, Sin Khan, 'A security based approach to composite power system
reliability evaluation'. IEEE Transactions on Power Systems, Vol. 7, No.1,
February 1992.
[216] M.E. Khan, R. Billinton, 'A hybrid model for quantifying different operating
states of composite power systems '. IEEE Transactions on Power Systems, Vol. 7,
No.1, February 1992.
[217] M.V.F.Pereira, L.M.V.G.Pinto, 'A New Computational Tool For Composite
Reuabiuty Evaluation'. IEEE Transactions on Power Systems, Vol. 7, No.1,
February 1992.
[218] Li Wenyuan, R.Billinton, 'Effect of bus load uncertainty and correlation in
composite system adequacy evaluation'. IEEE Transactions on Power Systems,
Vol. 6, No.4, November 1991.
[219] N. Chowdhury, R. Billinton, 'A Reliability Test System For Educational
Purposes - Spinning Reserve Studies in Isolated and Interconnected Systems'.
IEEE Transactions on Power Systems, Vol. 6, No.4, November 1991.

CHALMERS, Energy and Environment, Master’s Thesis 38
[220] R.Billinton, Li Wenyuan, 'A Novel Method For Incorporating Weather Effects
In Composite System Adequacy Evaluation'. IEEE Transactions on Power
Systems, Vol. 6, No.3, August 1991.
[221] E. Porretta., D.L Kiauel. G.A. ,Hamoud. E O. Neudorf, 'A comprehensive
approach for adequacy and security evaluation of bulk power systems'. IEEE
Transactions on Power Systems, Vol. 6, No.2, May 1991.
[222] J. oteng-Mjei, R. Billinton, 'Evaluation of interrupted energy assessment rates
in composite systems'. IEEE Transactions on Power Systems, Vol. 5, No.4,
November 1990.
[223] Chanan Singh, Quan Chen, 'Modeling of Energy Limited Units in the
Reliability Evaluation of Multi- Area Electrical Power Systems'. IEEE
Transactions on Power Systems, Vol. 5, No.4, November 1990.
[224] G. C. Oliveira, M. V. F. Pereira, S. H. F. Cunha, 'A Technique For Reducing
Computational Effort In Monte-Carlo Based Composite Reliability Evaluation'.
IEEE Transactions on Power Systems, Vol. 4, No.4, November 1989.
[225] A Report by IEEE Working Group on Measurement Indices, 'Bulk System
Reliability - Measurement And Indices'. IEEE Transactions on Power Systems,
Vol. 4, No.3, August 1989.
[226] Hossein Salehfar, A. D. Patton, 'Modeling And Evaluation Of The System
Reliability Effects Of Direct Load Control'. IEEE Transactions on Power Systems,
Vol. 4, No.3, August 1989.
[227] S . Kumar, R. Billinton, 'Adequacy Evaluation Of A Small Area In A Large
Composite Power Network'. IEEE Transactions on Power Systems, Vol. 4, No.2,
May 1989.
[228] C. K. Yin, M. Mazumdar, 'Reliability Computations For Interconnected
Generating Systems Via Large Deviation Approximation'. IEEE Transactions on
Power Systems, Vol. 4, No.1, February 1989.
[229] Chanan Sing, Quan Chen, 'Generation System Reliability Evaluation Using a
Cluster Based Load Model'. IEEE Transactions on Power Systems, Vol. 4, No.1,
February 1989.
[230] J. Qiu, S. M. Shahidehpour, Z. Schuss, 'Effect Of Small Random Perturbations
On Power Systems Dynamics And Its Reliability Evaluation'. IEEE Transactions
on Power Systems, Vol. 4, No.1, February 1989.
[231] Chanan Singh, Alex Lago-Gonzalez, 'Improved Algorithms For Multi-Area
Reliability Evaluation Using The Decomposition-Simulation Approach'. IEEE
Transactions on Power Systems, Vol. 4, No.1, February 1989.
[232] C. Singh, A.D. Pat ton, A. Lago-Gonzalez A.R. Vojdani, G. Gross F.F. Wu,
N.J. Balu, 'Operating Considerations In Reliability Modeling Of Interconnected
Systems - An Analytical Approach '. IEEE Transactions on Power Systems, Vol.3,
No.3, August 1988.
[233] O. Bertoldi, L. dalvaderi, S. Scalcino, 'Monte Carlo Approach In Planning
Studies: An Application To IEEE RTS'. IEEE Transactions on Power Systems,
Vol.3, No.3, August 1988.
[234] Sudhir Kumar, Roy Billinton, 'Adequacy Equivalents I N Composite Power
System Evaluation'. IEEE Transactions on Power Systems, Vol.3, No.3, August
1988.
[235] Kai Jiang and Chanan Singh, 'Reliability Modeling of All-Digital Protection
Systems Including Impact of Repair'. IEEE Transactions on Power Delivery, Vol
25, No.2, April 2010.

CHALMERS, Energy and Environment, Master’s Thesis 39
[236] Sayed-Mahdi, Ahad Kazemi, Mahmud Fotuhi-Firuzabad and Abdel-Aty Edris,
'Composite System Reliability Assessment Incorporating an Interline Power-Flow
Controller'. IEEE Transactions on Power Delivery, Vol 23, No.2, April 2008.
[237] Roy Billinton and Wijarn Wangdee, 'Predicting Bulk Electricity System
Reliability Performance Indices Using Sequential Monte Carlo Simulation'. IEEE
Transactions on Power Delivery, Vol 21, No.2, April 2006.
[238] Roy Billinton and Wijarn Wangdee, 'Delivery Point Reliability Indices of a
Bulk Electric System Using Sequential Monte Carlo Simulation'. IEEE
Transactions on Power Delivery, Vol 21, No.1, January 2006.
[239] Juha Haakan, Jukka Lassila, Tero Kaipia and Jarmo Partanen, 'Comparison of
Reliability Indices From the Perspective of Network Automation Devices'. IEEE
Transactions on Power Delivery, Vol 25, No.3, July 2010.
[240] S.N. Singh and S.C. Srivastava, 'Improved Voltage And Reactive Power
Distribution Factors For Outage Studies'. IEEE Transactions on Power Delivery,
Vol 12, No.3, July 1997.

CHALMERS, Energy and Environment, Master’s Thesis 40

CHALMERS, Energy and Environment, Master’s Thesis 41
PART-2 EXTENSIONS TO THE DISTRIBUTION TEST
SYSTEM

CHALMERS, Energy and Environment, Master’s Thesis 42

CHALMERS, Energy and Environment, Master’s Thesis 43
3 Reliability Theory and NEPLAN Software
3.1 Reliability Theory
Reliability of a system can be defined as the ability of the system to perform the
desired function. When applied to the electric power system, reliability is mainly
concerned with the ability of the system to supply the load demands. Reliability
evaluation of an electric power system can be divided into two main categories,
system adequacy evaluation and system security evaluation. System adequacy is
concerned with the evaluation of adequacy of resources to supply the demanded load,
whereas system security is concerned with the response of system to disturbances[30].
Electric power systems are complex and large systems. It is difficult to analyze the
entire system at once. For this reason the power system is generally divided into three
main hierarchy levels for reliability evaluation[30].
Figure 3.1 Hierarchy Levels defined for reliability evaluation [30]
HLI are concerned with the reliability evaluation of generation systems. The main
indices analyzed in this study are loss of load expectation (LOLE), loss of energy
expectation (LOEE), failure frequency and failure duration. In this study only the
generation systems are considered and the effect of transmission and distribution
systems on reliability are neglected.
HLII studies constitute of both the generation and the transmission systems. This
study can be used to assess the reliability of an existing system or a proposed system.
These studies give two main outputs, one related to each bus and the other for overall
system. The main indices considered here are failure frequency and failure duration.
Generation System
Transmission System
Distribution System
HL I
HL II
HL III

CHALMERS, Energy and Environment, Master’s Thesis 44
HLIII constitutes of the entire power system consisting of generation, transmission
and distribution. Due to the complexity of such a system, evaluation of the entire
system is not done. The reliability analysis of distribution system is done separately,
wherein the indices from HLII evaluation are inputs to the reliability evaluation of the
distribution system. The main indices to be considered in this evaluation are SAIFI,
SAIDI and CAIDI.
Reliability evaluation of a system can be classified into two broad categories,
deterministic and probabilistic. The electric power system is stochastic in nature and
hence the probabilistic evaluation of the system is preferred for objective analysis.
However, deterministic technique is computationally faster and requires less data.
Due to the advancement of technology and computational techniques, over the years,
probabilistic reliability evaluation has become possible and is being practiced widely.
3.2 Introduction to NEPLAN
NEPLAN is a software used for analysis of electric power systems by BCP group in
Switzerland. The main features of the software include optimal power flow, transient
stability, load flow, short circuit and reliability evaluation. NEPLAN can provide
reliability indices for individual load points and the overall system. The working of
the software can be summarized in the simple diagram of Figure 3.2.
Figure 3.2 Block diagram representing working of NEPLAN
The first step is to analyse the network data for load flow analysis and the data for
reliability evaluation. In the next step the software generates failure combinations.
The failure combinations can be either individual failure or simultaneous multiple
failures. The first order failures or individual failures consider a failure of only one
component in the system. The second order or multiple failures consider simultaneous
failure of two components in the system.
In the next step failure effect analysis is performed on each failure combination.
Processing of a failure combination produces a value for the contribution of that
combination to the reliability characteristics of the network, expressed as a
probability. For each load node, Figures are generated for the frequency and duration
of non-supply or undersupply. The contribution of this failure combination is added to
Processing Network Data
Generation of failure combinations
Failure effect analysis

CHALMERS, Energy and Environment, Master’s Thesis 45
the factors already identified, so that after processing all relevant failure
combinations, a detailed picture is obtained of the interruptions occurring at each load
node.
3.3 Application of NEPLAN
As a part of the thesis the software was proposed to be used. To understand the
working of the software a sample study has been done and results for various
scenarios have been presented here. RBTS system mentioned in Section 2.2 has been
used for the sample study. Figure 3.3 shows RBTS system designed in NEPLAN
software.
Figure 3.3 RBTS System modelled in NEPLAN[3]
The station configuration has been simplified to only one circuit breaker. The load
point indices have been calculated assuming a constant peak load. The study has been
performed step wise to see the effect of each input data on the overall system
reliability. This can be understood as a sensitivity analysis. For the base case study the

CHALMERS, Energy and Environment, Master’s Thesis 46
substation elements have been considered to be ideal. This means that no station
originated outage has been considered and also no common mode outages have been
considered.
3.4 Base Case Study
As mentioned earlier the base case study does not consider station originated and
common mode outages. Both load indices and the overall system indices can be
calculated using NEPLAN and the same have been presented in the following Tables.
Table 3.1 Load indices for base case
Load at
Failure
Frequency
[1/yr]
Duration
[h]
Probability
[min/yr]
Power not
supplied
[MW/yr]
Energy not
supplied
[MWh/yr]
Bus 2 0.47 1 28.19 9.397 9.397
Bus 3 0.066 1 3.955 5.604 5.604
Bus 4 0.355 1 21.301 14.201 14.201
Bus 5 0.002 5 0.685 0.046 0.228
Bus 6 1.002 9.989 600.68 20.046 200.228
We can observe from the above Figures that the load at bus 6 has the least reliability.
This can be attributed to the fact also that it is being supplied by only one
transmission line. If there is a fault on this transmission line all the load at bus 6 has to
be curtailed.
Table 3.2 System Indices for Base case
System Indices
SAIFI [1/yr] 0.379
SAIDI [min/yr] 130.964
CAIDI [h] 5.758
ASAI (%) 99.975
F [1/yr] 1.893
T [h] 5.759
Pr [min/yr] 654.134
P [MW/yr] 49.293
W [MWh/yr] 229.658
3.5 Study considering common mode outages
Common mode outages are those outages, which are related to each other. In this case
two transmission lines on the same tower are considered. It means that if one of the
line fails the other is also shutdown or both the lines fail together. As defined in [1]
two common mode outages have been considered in this study.

CHALMERS, Energy and Environment, Master’s Thesis 47
Table 3.3 Common mode data for circuits on a common right of way [1]
Line Common Length
(km)
Outage rate per
year
Outage duration
(hours)
1 75 0.15 16
6 75
2 250 0.5 16
7 250
Considering the above common outages the load indices and the system indices have
been calculated once again and presented in the Tables below.
Table 3.4 Load indices considering Common Mode outages
Load at
Failure
Frequency
[1/yr]
Duration
[h]
Probability
[min/yr]
Power not
supplied
[MW/yr]
Energy not
supplied
[MWh/yr]
Bus 2 0.47 1 28.19 9.397 9.397
Bus 3 0.216 1 12.955 18.35 5.604
Bus 4 0.855 1 51.301 34.201 14.201
Bus 5 0.002 5 0.685 0.046 0.228
Bus 6 1.002 9.989 600.68 20.046 200.228
We can observe from the above Figures that due to the common mode outages the
reliability for load on bus 4 has reduced compared to the base case.
3.6 Study considering station originated outages
For the previous cases the substation components were considered to be ideal.
However, this is an approximation which is rarely true. There is a major difference in
the reliability of the entire system when the station originated outages are considered.
The below Tables and Figures provide the reliability indices considering station
originated outages.
Table 3.5 Load Indices considering station originated outages
Load at
Failure
Frequency
[1/yr]
Duration
[h]
Probability
[min/yr]
Power not
supplied
[MW/yr]
Energy not
supplied
[MWh/yr]
Bus 2 2.217 1.893 251.834 44.345 83.945
Bus 3 0.775 3.556 165.322 65.686 234.206
Bus 4 0.562 1 33.738 22.249 22.492
Bus 5 0.223 9.924 133.019 4.468 4.468
Bus 6 1.662 9.995 996.468 33.231 332.156
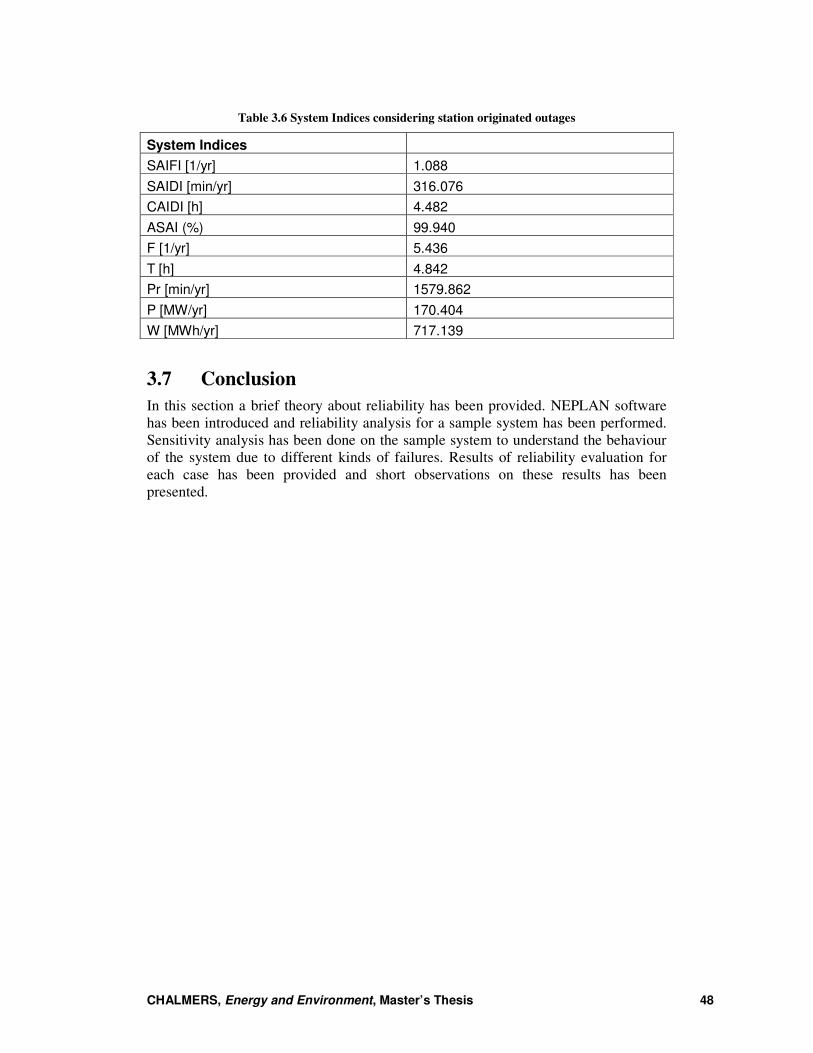
CHALMERS, Energy and Environment, Master’s Thesis 48
Table 3.6 System Indices considering station originated outages
System Indices
SAIFI [1/yr] 1.088
SAIDI [min/yr] 316.076
CAIDI [h] 4.482
ASAI (%) 99.940
F [1/yr] 5.436
T [h] 4.842
Pr [min/yr] 1579.862
P [MW/yr] 170.404
W [MWh/yr] 717.139
3.7 Conclusion
In this section a brief theory about reliability has been provided. NEPLAN software
has been introduced and reliability analysis for a sample system has been performed.
Sensitivity analysis has been done on the sample system to understand the behaviour
of the system due to different kinds of failures. Results of reliability evaluation for
each case has been provided and short observations on these results has been
presented.

CHALMERS, Energy and Environment, Master’s Thesis 49
4 Chapter Four
The Distribution Test System
4.1 Introduction to the Distribution Test System
Two distribution test systems have been defined within RBTS[10] . RBTS is a six bus
test system, within RBTS distribution system has been defined on Bus 2 and Bus 4.
These distribution systems are general and follow general utility principles. In this
section reliability analysis for both these distribution systems has been performed
using NEPLAN and the results have been presented.
4.2 Bus 2 Distribution Test System
The distribution system for Bus 2 is supplied by two 33/11 kV, 16 MVA transformers.
Further distribution of the supply is done from the 11 kV switchgear. The distribution
system has both high voltage and low voltage customers. The 0.415 kV low voltage
customers are supplied via 11/0.415 kV transformers and the 11 kV customers are
supplied directly. For the reliability analysis the 33 kV supply has been considered
100% reliable. Figure 4.1 shows the single line diagram for the distribution system.
Figure 4.1 RBTS Bus 2 distribution system [10]

CHALMERS, Energy and Environment, Master’s Thesis 50
There are in total 22 load points supplying various kinds of customers. The customers
have been divided in to four categories and they are residential, small users,
government/institutions and commercial. The transformers for customers being
supplied at 11 kV level are not considered for reliability evaluation as the metering for
these customers is done at 11 kV level.
Figure 4.2 Bus 2 Distribution System Model in NEPLAN
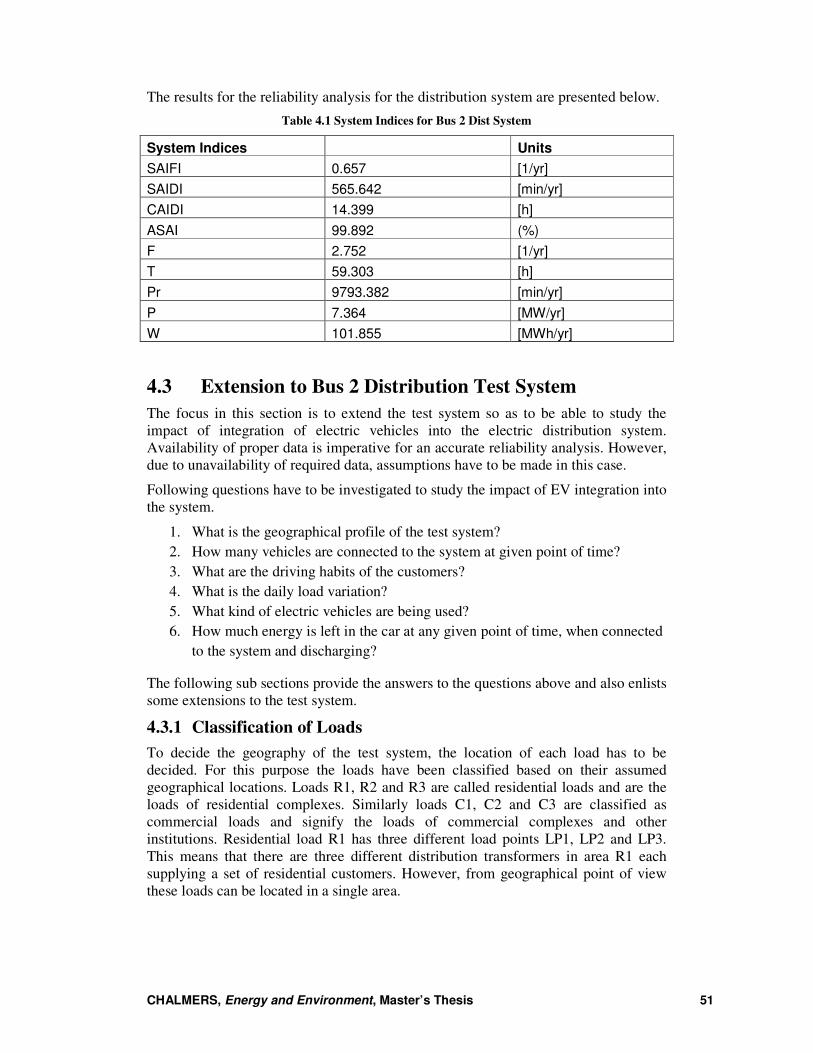
CHALMERS, Energy and Environment, Master’s Thesis 51
The results for the reliability analysis for the distribution system are presented below.
Table 4.1 System Indices for Bus 2 Dist System
System Indices Units
SAIFI 0.657 [1/yr]
SAIDI 565.642 [min/yr]
CAIDI 14.399 [h]
ASAI 99.892 (%)
F 2.752 [1/yr]
T 59.303 [h]
Pr 9793.382 [min/yr]
P 7.364 [MW/yr]
W 101.855 [MWh/yr]
4.3 Extension to Bus 2 Distribution Test System
The focus in this section is to extend the test system so as to be able to study the
impact of integration of electric vehicles into the electric distribution system.
Availability of proper data is imperative for an accurate reliability analysis. However,
due to unavailability of required data, assumptions have to be made in this case.
Following questions have to be investigated to study the impact of EV integration into
the system.
1. What is the geographical profile of the test system?
2. How many vehicles are connected to the system at given point of time?
3. What are the driving habits of the customers?
4. What is the daily load variation?
5. What kind of electric vehicles are being used?
6. How much energy is left in the car at any given point of time, when connected
to the system and discharging?
The following sub sections provide the answers to the questions above and also enlists
some extensions to the test system.
4.3.1 Classification of Loads
To decide the geography of the test system, the location of each load has to be
decided. For this purpose the loads have been classified based on their assumed
geographical locations. Loads R1, R2 and R3 are called residential loads and are the
loads of residential complexes. Similarly loads C1, C2 and C3 are classified as
commercial loads and signify the loads of commercial complexes and other
institutions. Residential load R1 has three different load points LP1, LP2 and LP3.
This means that there are three different distribution transformers in area R1 each
supplying a set of residential customers. However, from geographical point of view
these loads can be located in a single area.

CHALMERS, Energy and Environment, Master’s Thesis 52
Table 4.2 Classification of loads in the DTS
Load
Point
Area
Designation Type of Customer
Dist.
Transformer
Rating
[KVA]
Peak
Load
(MW)
Number of
customers
LP1
R1
Residential 1200 0.866 210
LP2 Residential 1200 0.866 210
LP3 Residential 1200 0.866 210
LP4
C1
Govt/Inst 1200 0.9167 1
LP5 Govt/Inst 1200 0.9167 1
LP6 Commercial 1000 0.75 10
LP7 Commercial 1000 0.75 10
LP8 Small User -- 1.628 1
LP9 Small User -- 1.872 1
LP10
R2
Residential 1200 0.866 210
LP11 Residential 1200 0.866 210
LP12 Residential 1000 0.729 200
LP13
C2
Govt/Inst 1200 0.916 1
LP14 Govt/Inst 1200 0.916 1
LP15 Commercial 1000 0.75 10
LP16 Commercial 1000 0.75 10
LP17
R3
Residential 1000 0.729 200
LP18 Residential 1000 0.729 200
LP19 Residential 1000 0.729 200
LP20
C3
Govt/Inst 1200 0.916 1
LP21 Govt/Inst 1200 0.916 1
LP22 Commercial 1000 0.75 10
4.3.2 Geography of Distribution Test System
Based on the grouping of the loads in the test system a simple geography for the same
has been presented in Figure 4.3. Each area has a set of customers as defined in Table
4.2.
The following assumptions are made regarding EVs:
• The residential customers travel to the commercial complexes and the govt/inst
area for work during the weekdays and use the shortest path from home to work.

• During night all electric vehicles in the residential complex are connected to the
system and during the day all vehicles travel to the commercial complexes where
they are connected to the plug in points available.
• The number of EVs and their
section.
Figure 4.3 Geography for the selected electrical distribution system
4.3.3 Number of EVs in the Distribution Test System
The environment conservation agenda is pushing countries towards shifting to green
technology all throughout the world. Many countries have set ambitious targets
towards use of EVs in the coming years.
countries in this regard.
Figure 4.4 Sales target set by different countries for sale of EVs
During night all electric vehicles in the residential complex are connected to the
system and during the day all vehicles travel to the commercial complexes where
they are connected to the plug in points available.
The number of EVs and their travelling distances are specified in the following sub
Geography for the selected electrical distribution system
Number of EVs in the Distribution Test System
The environment conservation agenda is pushing countries towards shifting to green
technology all throughout the world. Many countries have set ambitious targets
towards use of EVs in the coming years. Figure 4.4 shows the targets set by different
Sales target set by different countries for sale of EVs [17]
During night all electric vehicles in the residential complex are connected to the
system and during the day all vehicles travel to the commercial complexes where
travelling distances are specified in the following sub
The environment conservation agenda is pushing countries towards shifting to green
technology all throughout the world. Many countries have set ambitious targets
.4 shows the targets set by different

CHALMERS, Energy and Environment, Master’s Thesis 54
The number of vehicles that are considered in the test system depends on what
scenario is being studied. There can be many cases ranging from 10% penetration to a
100% penetration of EVs. In this thesis two such cases have been considered:
• Case 1: 30% Penetration of EVs
• Case 2: 100 % Penetration of EVs
4.3.4 Number of EVs in the Distribution Test System: Case 1 (30%
EV penetration)
In this case 30% penetration of EVs has been considered. This means that 30% of the
total consumers use an electric vehicle.
There are in total 630 customers in residential areas R1 & R2 and 600 customers in
residential area R3. Considering 30% of the total customers have EVs there are total
210 EVs in areas R1 & R2 and 200 EVs in R3. The travelling distance of these EVs
and the number of EVs travelling from one destination to the other have been shown
in Table 4.3.
Table 4.3 Assumed driving distance between two locations (Case 1)
Route Distance (km) Number of vehicles
travelling
Total Number of
Vehicles
R1 to C1 19 70 210 R1 to C2 20 70
R1 to C3 38 70
R2 to C1 10 70 210 R2 to C2 17 70
R2 to C3 17 70
R3 to C1 19 60 200 R3 to C2 38 60
R3 to C3 20 80
4.3.5 Number of EVs in the Distribution Test System: Case 2
In this case 100% penetration of EVs has been considered. This means that 100% of
the total consumers use an electric vehicle.
There are in total 630 customers in residential areas R1 & R2 and 600 customers in
residential area R3. Considering 100% of the total customers have EVs there are total
630 EVs in areas R1 & R2 and 600 EVs in R3. Table 4.4 shows the travelling distance
of these EVs and the number of EVs travelling from one destination to the .

CHALMERS, Energy and Environment, Master’s Thesis 55
Table 4.4 Assumed number of vehicles and travelling distance (Case 2)
Route Distance (km) Number of vehicles
travelling
Total Number of
Vehicles
R1 to C1 19 210 630 R1 to C2 20 210
R1 to C3 38 210
R2 to C1 10 210 630 R2 to C2 17 210
R2 to C3 17 210
R3 to C1 19 200 600 R3 to C2 38 200
R3 to C3 20 200
4.3.6 Load Curve and Cost Data
For all kind of customers the requirement of power varies on hourly basis over each
day of the week. This variation depends on various factors like location, psychology
of the customers, economic status etc. Here two major classifications have been made
for deciding the load curve, residential and non residential customers. Loads
designated R1, R2 and R3 are considered residential loads and C1, C2 and C3 are
considered non-residential loads. Figure 4.5 shows the daily load curve for residential
and non-residential customers on a weekday. The load curve shows the variation of
load as a percentage of peak load over a period of 24 hours. Based on the load curve
the load variation over a period of 24 hrs for residential customer R1 is presented in
Table 4.5 as an example.
Figure 4.5 Daily Load Curve without Electric Vehicles [28]
0 5 10 15 200
0.1
0.2
0.3
0.4
0.5
0.6
0.7
0.8
0.9
1
Time [Hrs]
Lo
ad
in P
erc
en
tag
e o
f P
ea
k L
oa
d
Residential
Non Residential
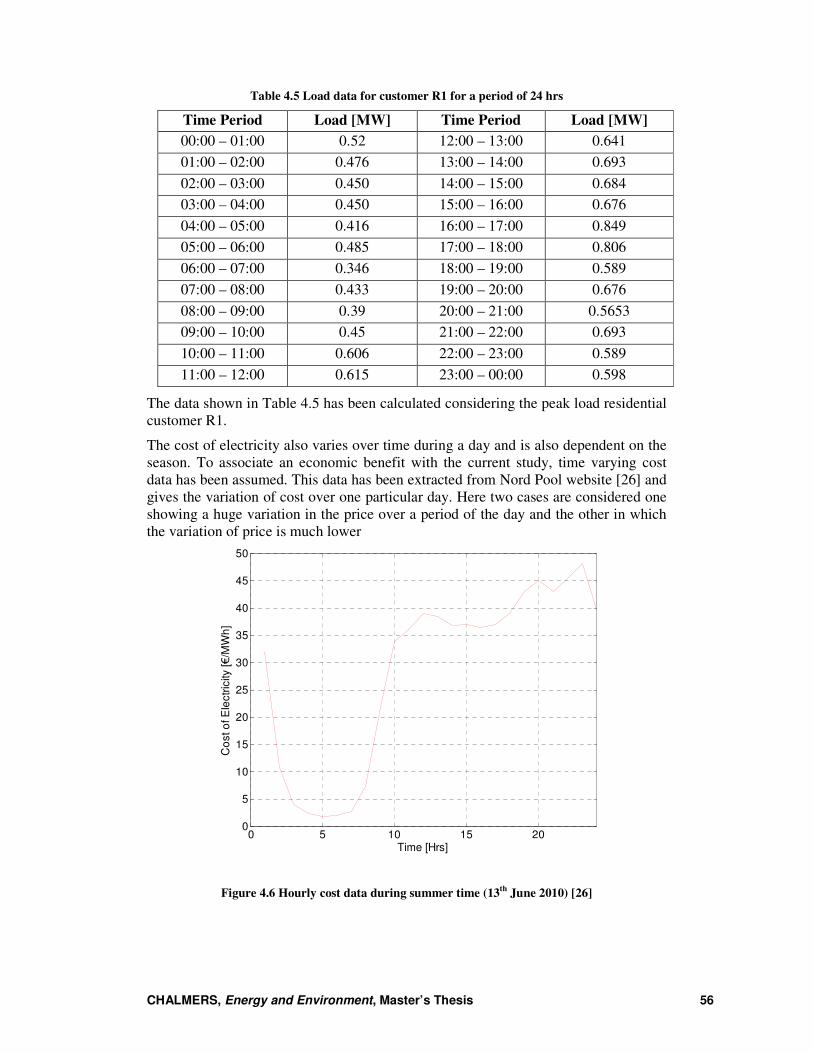
CHALMERS, Energy and Environment, Master’s Thesis 56
Table 4.5 Load data for customer R1 for a period of 24 hrs
Time Period Load [MW] Time Period Load [MW]
00:00 – 01:00 0.52
0.5959
12:00 – 13:00 0.641
01:00 – 02:00 0.476 13:00 – 14:00 0.693
02:00 – 03:00 0.450 14:00 – 15:00 0.684
03:00 – 04:00 0.450 15:00 – 16:00 0.676
04:00 – 05:00 0.416 16:00 – 17:00 0.849
05:00 – 06:00 0.485 17:00 – 18:00 0.806
06:00 – 07:00 0.346 18:00 – 19:00 0.589
07:00 – 08:00 0.433 19:00 – 20:00 0.676
08:00 – 09:00 0.39 20:00 – 21:00 0.5653
09:00 – 10:00 0.45 21:00 – 22:00 0.693
10:00 – 11:00 0.606 22:00 – 23:00 0.589
11:00 – 12:00 0.615 23:00 – 00:00 0.598
The data shown in Table 4.5 has been calculated considering the peak load residential
customer R1.
The cost of electricity also varies over time during a day and is also dependent on the
season. To associate an economic benefit with the current study, time varying cost
data has been assumed. This data has been extracted from Nord Pool website [26] and
gives the variation of cost over one particular day. Here two cases are considered one
showing a huge variation in the price over a period of the day and the other in which
the variation of price is much lower
Figure 4.6 Hourly cost data during summer time (13th
June 2010) [26]
0 5 10 15 200
5
10
15
20
25
30
35
40
45
50
Time [Hrs]
Co
st o
f E
lectr
icity
[€
/MW
h]

CHALMERS, Energy and Environment, Master’s Thesis 57
Figure 4.7 Hourly cost data during winter time (4th
Jan 2010) [26]
4.4 Electric Vehicles Case Study
Various different types of PHEVs and EVs are available in the market today. With
increasing demand new variations of electric vehicles with different range and
performance will be available in coming times. For purpose of study three different
kind of vehicles have been considered as mentioned in Table 4.6. This data has been
taken from website of “Grid 4 Vehicles” project. The objective of G4V is to develop
an analytical method to evaluate the impact of a large scale introduction of EV and
PHEV on the grid infrastructure and a visionary “road map” for the year 2020 and
beyond, taking into account all stakeholders and generating fast and openly available
results. Chalmers is a part of this project, which is run in collaboration with other
universities and industries from all over Europe.
Table 4.6 Details of Electric Vehicles
Type of Car Battery Capacity
(kWh)
Energy
Consumption
(kWh/km) [29]
Composition in
Market
(%)
BEV 35 0.20 37
City-BEV 16 0.12 10
PHEV90 18 0.20 53
For the purpose of simplification, here only one size of battery is assumed for all
kinds of vehicles. This can be achieved by considering the average size of battery for
all the vehicles. In this case the average battery size is 24.1 kWh. Here the simple
0 5 10 15 2038.5
39
39.5
40
40.5
41
41.5
Time [Hrs]
Co
st o
f E
lectr
icity
[€
/MW
h]

CHALMERS, Energy and Environment, Master’s Thesis 58
average calculation has been done and not weighted average as per market
composition.
The energy consumption by an EV depends on the driving cycle. The starts and stops
and also on the ups and downs in the road. However this kind of data will vary due to
various reasons like geography, traffic rules etc. In this case an average value of
energy consumption is considered which is 0.17 kWh/km.
4.5 Charging of Vehicles
Electric vehicles can be charged by conduction, induction or by using battery
swapping stations [29]. However, the investment needed to achieve each of these
charging methods is very different.
Conductive charging is by far the simplest method of charging the electric vehicles. It
means simply connecting the electric vehicles to the plug in points available in the
system. From an investment point of view this may be the cheapest method as the
existing lines can be used for the purpose of charging.
Inductive charging on the other hand does not need any physical connection to the
grid. Charging can be possible just by parking the vehicle in the parking lot equipped
with the facility of inductive charging. However, at present the efficiency of such a
charging technique is very poor and new installations are required, which calls in for
extra investments.
Battery swapping stations are a quick way of charging the vehicle. These are stations
where the batteries of the vehicle will be swapped with fully charged batteries.
However, to accomplish this method, standardization in battery types across all
manufacturers is imperative.
As in this case we are studying the impact of electric vehicles on the electric
distribution system, only the conductive charging is considered.
Time needed by the vehicle to charge depends on the size of the vehicle, type of
charger used and the type of batteries. Various manufacturers have variety of
solutions and consequently different battery charging times. The data for charging
times has been considered from G4V project results [29].
Table 4.7 Details for battery charging
Type of Charging
Kms/hr of
charging at Max
Power
Maximum
Power during
Charging
[kW/h]
Approximate
Charge Time to full
capacity
[Hrs]
Slow Charging 21 3.7 6
Fast Charging 64 11.0 2

CHALMERS, Energy and Environment, Master’s Thesis 59
5 Chapter Five
Application of the Extended Test System
5.1 EV Integration within RBTS Bus-2 Distribution
System
Electric vehicles could be considered as new type of loads, which will be added to the
electrical distribution system in future. The transformers in the electrical distribution
system have not been rated to cater to this new load. For this reason it has to be taken
care that the transformers are not overloaded due to the charging of vehicles. In
present case coordinated charging has been considered based on the calculated spare
capacity available in the distribution transformer. Coordinated charging can be
achieved by central control by aggregator, who sends signals to the connected electric
vehicles to start or stop charging. Table 4.2 shows the spare capacity available in the
transformer based on the rating and load profile.
Figure 5.1 Load profile of load point and spare capacity available in transformer (1200 kVA)
As has been stated earlier, it is assumed that the vehicles will be charged at the
residential complex during the night time. This charging will be coordinated based on
the spare capacity available in the transformer shown in Figure 5.1. As defined in
Table 4.7 two cases of charging have to be considered, fast charging and slow
charging.
0 5 10 15 20100
200
300
400
500
600
700
800
900
1000
1100
1200
Time [Hrs]
Po
we
r [k
W]
Load Profile
Spare Capacity in Trafo

CHALMERS, Energy and Environment, Master’s Thesis 60
Figure 5.2 Number of vehicles that can be charged in the residential complex using Fast
Charging based on transformer spare capacity (1200 kVA)
Figure 5.3 Number of vehicles that can be charged in residential complex using Fast Charging
based on transformer spare capacity (1000 kVA)
0 5 10 15 200
10
20
30
40
50
60
70
80
Time [Hr]
Nu
mb
er
of C
ars
th
at ca
n b
e c
ha
rge
d
0 5 10 15 200
10
20
30
40
50
60
Time [Hrs]
Nu
mb
er
of C
ars
th
at ca
n b
e c
ha
rge
d

CHALMERS, Energy and Environment, Master’s Thesis 61
Figure 5.4 Number of vehicles that can be charged in the residential complex using Slow
Charging based on transformer spare capacity (1200 kVA)
Figure 5.5 Number of vehicles that can be charged in residential complex using Slow Charging
based on transformer spare capacity (1000 kVA)
0 5 10 15 200
50
100
150
200
250
Time [Hrs]
Nu
mb
er
of ca
rs th
at ca
n b
e c
ha
rge
d
0 5 10 15 200
20
40
60
80
100
120
140
160
180
Time [Hrs]
Nu
mb
er
of ca
rs th
at ca
n b
e c
ha
rge
d
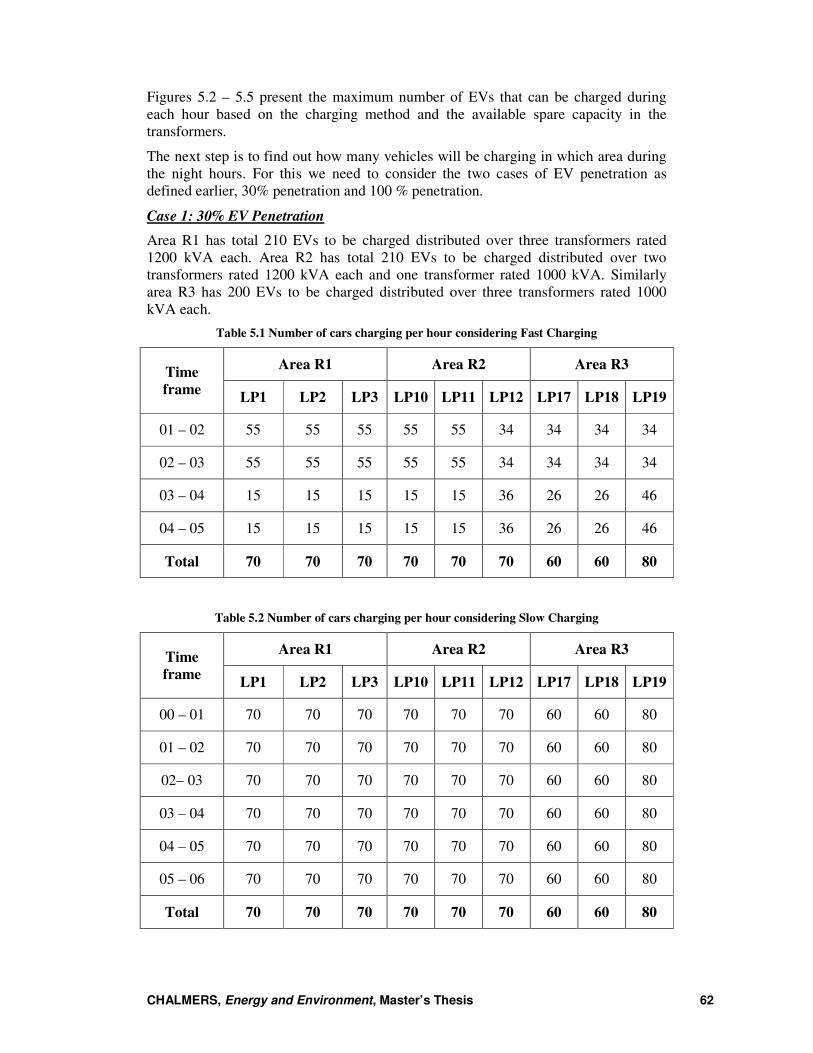
CHALMERS, Energy and Environment, Master’s Thesis 62
Figures 5.2 – 5.5 present the maximum number of EVs that can be charged during
each hour based on the charging method and the available spare capacity in the
transformers.
The next step is to find out how many vehicles will be charging in which area during
the night hours. For this we need to consider the two cases of EV penetration as
defined earlier, 30% penetration and 100 % penetration.
Case 1: 30% EV Penetration
Area R1 has total 210 EVs to be charged distributed over three transformers rated
1200 kVA each. Area R2 has total 210 EVs to be charged distributed over two
transformers rated 1200 kVA each and one transformer rated 1000 kVA. Similarly
area R3 has 200 EVs to be charged distributed over three transformers rated 1000
kVA each.
Table 5.1 Number of cars charging per hour considering Fast Charging
Time
frame
Area R1 Area R2 Area R3
LP1 LP2 LP3 LP10 LP11 LP12 LP17 LP18 LP19
01 – 02 55 55 55 55 55 34 34 34 34
02 – 03 55 55 55 55 55 34 34 34 34
03 – 04 15 15 15 15 15 36 26 26 46
04 – 05 15 15 15 15 15 36 26 26 46
Total 70 70 70 70 70 70 60 60 80
Table 5.2 Number of cars charging per hour considering Slow Charging
Time
frame
Area R1 Area R2 Area R3
LP1 LP2 LP3 LP10 LP11 LP12 LP17 LP18 LP19
00 – 01 70 70 70 70 70 70 60 60 80
01 – 02 70 70 70 70 70 70 60 60 80
02– 03 70 70 70 70 70 70 60 60 80
03 – 04 70 70 70 70 70 70 60 60 80
04 – 05 70 70 70 70 70 70 60 60 80
05 – 06 70 70 70 70 70 70 60 60 80
Total 70 70 70 70 70 70 60 60 80

CHALMERS, Energy and Environment, Master’s Thesis 63
Case 2: 100% EV Penetration
In this case area R1 and R2 have 630 EVs and area R3 has 600 EVs in total. The aim
is again to be able to charge all the EVs without overloading the distribution
transformer.
Table 5.3 Number of cars charging per hour considering Fast Charging
Time
frame
Area R1 Area R2 Area R3
LP1 LP2 LP3 LP10 LP11 LP12 LP17 LP18 LP19
22 – 23 55 55 55 55 55 30 30 30 30
23 – 00 55 55 55 55 55 30 30 30 30
00 – 01 60 60 60 60 60 40 40 40 40
01 – 02 60 60 60 60 60 40 40 40 40
02– 03 65 65 65 65 65 45 45 45 45
03 – 04 65 65 65 65 65 45 45 45 45
04 – 05 30 30 30 30 30 45 45 45 45
05 – 06 30 30 30 30 30 45 45 45 45
06 - 07 - - - - - 50 40 40 40
07 - 08 - - - - - 50 40 40 40
Total 210 210 210 210 210 210 200 200 200
Table 5.4 Number of cars charging per hour considering Slow Charging
Time
frame
Area R1 Area R2 Area R3
LP1 LP2 LP3 LP10 LP11 LP12 LP17 LP18 LP19
20 - 21 50 50 50 50 50 70 70 70 70
21 - 22 50 50 50 50 50 70 70 70 70
22 – 23 50 50 50 50 50 70 70 70 70
23 – 00 50 50 50 50 50 70 70 70 70
00 – 01 50 50 50 50 50 70 70 70 70

Time
frame
Area R1
LP1 LP2
01 – 02 50 50
02– 03 160 160
03 – 04 160 160
04 – 05 160 160
05 – 06 160 160
06 - 07 160 160
07 - 08 160 160
Total 210 210
In case of slow charging, the EVs have to start charging from 20:00 in the evening as
this type of charging takes six hours and all the EVs cannot be charged at the same
time due to limitation in the transformer capacity.
considered where less number of EVs are being charged during the early night hours
when the prices are still high and maximum number of EVs are charged during late
night hours when the price of electricity is low
Table 5.4.
5.2 Modelling of E
To carry out the study EVs have been modelled as a combination of load and a
generator as shown in Figure
Figure
The load in Figure 5.6 signifies the charging of electric vehicles and is calculated
based on the number of electric vehicles charging at any particular hour. The
generator part are the vehicles connected to the system, which are capable of
providing support to grid. In case of
provided will depend upon the state of charge of batteries. The reliability of
generators in this case has been considered to be 100%. This is a valid assumption as
failure of one vehicle will not have any major
vehicles.
Area R1 Area R2 Area R3
LP2 LP3 LP10 LP11 LP12 LP17 LP18
50 50 50 70 70 70
160 160 160 160 140 130 130
160 160 160 160 140 130 130
160 160 160 160 140 130 130
160 160 160 160 140 130 130
160 160 160 160 140 130 130
160 160 160 160 140 130 130
210 210 210 210 210 200 200
In case of slow charging, the EVs have to start charging from 20:00 in the evening as
this type of charging takes six hours and all the EVs cannot be charged at the same
time due to limitation in the transformer capacity. However, a case has been
considered where less number of EVs are being charged during the early night hours
when the prices are still high and maximum number of EVs are charged during late
night hours when the price of electricity is low, the sequence of charging is
Electric Vehicles
To carry out the study EVs have been modelled as a combination of load and a
Figure 5.6.
Figure 5.6 Modelling of Electric Vehicles
signifies the charging of electric vehicles and is calculated
based on the number of electric vehicles charging at any particular hour. The
generator part are the vehicles connected to the system, which are capable of
providing support to grid. In case of generator, the capacity support that can be
provided will depend upon the state of charge of batteries. The reliability of
generators in this case has been considered to be 100%. This is a valid assumption as
failure of one vehicle will not have any major impact on the capacity of the fleet of
Area R3
LP18 LP19
70 70
130 130
130 130
130 130
130 130
130 130
130 130
200 200
In case of slow charging, the EVs have to start charging from 20:00 in the evening as
this type of charging takes six hours and all the EVs cannot be charged at the same
However, a case has been
considered where less number of EVs are being charged during the early night hours
when the prices are still high and maximum number of EVs are charged during late
harging is shown in
To carry out the study EVs have been modelled as a combination of load and a
signifies the charging of electric vehicles and is calculated
based on the number of electric vehicles charging at any particular hour. The
generator part are the vehicles connected to the system, which are capable of
generator, the capacity support that can be
provided will depend upon the state of charge of batteries. The reliability of
generators in this case has been considered to be 100%. This is a valid assumption as
impact on the capacity of the fleet of

CHALMERS, Energy and Environment, Master’s Thesis 65
The load at each point has been calculated based on the number of EVs connected
during a particular hour. Table 5.5 shows the EV load connected to the residential
areas during the period of charging.
Table 5.5 Load of connected EVs sample calculation for load point LP1
Time frame
EV load in area R1 (LP1)
considering Fast
Charging (100 % EV
Penetration)
[kW]
EV load in area R1 (LP1)
considering Slow
Charging (100 % EV
Penetration)
[kW]
22 – 23 55 * 11 = 605 50 * 3.7 = 185
23 – 00 55 * 11 = 605 50 * 3.7 = 185
00 – 01 60 * 11 = 660 50 * 3.7 = 185
01 – 02 60 * 11 = 660 50 * 3.7 = 185
02 – 03 65 * 11 = 715 50 * 3.7 = 185
03 – 04 65 * 11 = 715 50 * 3.7 = 185
04 – 05 30 * 11 = 330 160 = 592
05 – 06 30 * 11 = 330 160 = 592
06 - 07 - 160 = 592
07 - 08 - 160 = 592
5.3 Load Profile Considering Electric Vehicle Integration
As depicted in Table 5.1 to 5.4 a specified number of vehicles will be charging during
the off peak, low cost period at the residential complexes. This will change the load
cycle for these areas. As stated earlier in Section 4.5, each vehicle will consume either
11 kW or 3.7 kW from the grid per hour while charging, depending on the type of
charging being used. Based on this data the new load curve has been presented in
Figure 5.7.

CHALMERS, Energy and Environment, Master’s Thesis 66
5.7 Load curve with and without EV integration for LP1 with 30% EV Penetration
It can be observed from the Figure 5.7 that the charging of EV is done in such a way
that the transformer is never overloaded. Based on this criterion load profile for each
load point has been calculated. There are two cases to be considered here, the first
without any V2G and one with V2G power flow. In the former case it is assumed that
the vehicles are connected to the grid during the day at the commercial complexes but
they neither charge nor discharge. In the latter case it is assumed that the EVs
connected at the commercial complexes give capacity support to the grid during the
day.
5.4 Vehicle to Grid
To calculate the capacity support that can be provided by a fleet of electric vehicles, it
is necessary to know the capacity available for supply in the batteries, when it is
connected to the system. To achieve this few assumptions have to be made.
The energy available in the EV at any given point of time depends on the following
factors:
1. How much has the vehicle travelled from the time when the battery was fully
charged?
2. What are the limiting requirements put by the consumer?
3. What are the specifications for the EV?
To answer the first question one has to look at the geography of the current test
system and the assumed driving habits of the customers. Tables 3.3.2 and 3.3.3 give
details of the number of vehicles coming to each commercial complex during the day
and the amount of distance they travel to reach there. The same Tables have been
presented here in a different way for easy reference.
0 5 10 15 20300
400
500
600
700
800
900
1000
1100
1200
Time in Hrs
Lo
ad
[kW
]
Load without EV charging
Load with EV charging

CHALMERS, Energy and Environment, Master’s Thesis 67
5.6 Vehicles coming to each commercial complex for Case 1
Commercial
Complex
Area R1 Area R2 Area R3
Number
of EVs
[n]
Distance
[km]
Number
of EVs
[n]
Distance
[km]
Number
of EVs
[n]
Distance
[km]
C1 70 19 70 10 60 19
C2 70 20 70 17 60 38
C3 70 38 70 17 80 20
5.7 Vehicles coming to each commercial complex for Case 2
Commercial
Complex
Area R1 Area R2 Area R3
Number
of EVs
[n]
Distance
[km]
Number
of EVs
[n]
Distance
[km]
Number
of EVs
[n]
Distance
[km]
C1 210 19 210 10 200 19
C2 210 20 210 17 200 38
C3 210 38 210 17 200 20
The following assumptions have been made:
1. The vehicles are charged for 2 hours during the night considering fast charging
or 6 hours considering slow charging.
2. Each vehicle has a travelling distance of maximum 128 km.
3. The total energy of the battery has been considered as 24.1 kWh.
4. The average energy consumption of EV is 0.17 kWh/km.
To calculate the energy left in the battery the following method has been used:
Energy Available in EV:
From the data available, it is known that the EV has been charged so that it can travel
a maximum of 128 km. The energy used in travelling 1 km is 0.17 kWh. Hence the
calculated maximum energy available in the EV can be calculated as follows:
Energy Available in EV before travel = Dmax * E1
Where,
Dmax = Maximum Distance that can be travelled
E1= Energy required to travel 1 km

CHALMERS, Energy and Environment, Master’s Thesis 68
Energy Available in EV after travel = Ebt – Eut
Where,
Ebt= Energy Available in EV before travel
Eut= Energy used by EV for travelling
Energy Used for Travelling:
The energy used in travelling can be calculated using the simple equation as follows:
Energy Used in Travelling = D * E1
Where,
D= Distance Travelled
Spare Energy Required:
The spare energy required in the EV depends on customer preference. In worst case
scenario the customer might not be willing to provide energy to the grid. However, an
assumption has been made here for the purpose of study as follows:
Spare Energy Required = 25% of maximum capacity + Enb
Where,
Enb= Energy required to travel back
Capacity Available For Supply:
The capacity available for supplying back to the grid can be calculated as follows:
Capacity Available =Eat – SpCap
Where,
Eat= Energy Available in EV after travel
SpCap = Spare Capacity required
Based on the assumptions and calculations above, Table 5.4.3 gives the energy that
will be available in the electric vehicles when connected at the commercial
complexes.
• Energy available in EV before travel – 21.76 kWh
• EVs travelling from R1 to C1 - distance of travel is 19 km
• Energy used in Travelling – 3.23 kWh
• Energy available after travel – 18.53 kWh
• Spare energy required – 8.67 kWh
• Capacity available for supply – 9.8 kWh

CHALMERS, Energy and Environment, Master’s Thesis 69
5.8 Energy available in EV for supply to grid for Case 1
Commercial
Complex
Area R1 Area R2 Area R3
Number
of EVs
[n]
Capacity
Available
in each
EV
[kWh]
Number
of EVs
[n]
Capacity
Available
in each
EV
[kWh]
Number
of EVs
[n]
Capacity
Available
in each
EV
[kWh]
C1 70 9.8 70 11.39 70 9.8
C2 70 9.6 70 10.2 70 6.6
C3 70 6.6 60 10.2 80 9.6
Based on Table 5.8 the total energy available in each commercial complex has been
estimated and presented in Table 5.9.
5.9 Total energy available from EVs in the commercial complexes for Case 1
Commercial
Complex
Total Energy Available
[kWh]
C1 2169
C2 1848
C3 1842
5.10 Energy available in EV for supply to grid for Case 2
Commercial
Complex
Area R1 Area R2 Area R3
Number
of EVs
[n]
Capacity
Available
in each
EV
[kWh]
Number
of EVs
[n]
Capacity
Available
in each
EV
[kWh]
Number
of EVs
[n]
Capacity
Available
in each
EV
[kWh]
C1 210 9.8 210 11.39 200 9.8
C2 210 9.6 210 10.2 200 6.6
C3 210 6.6 210 10.2 200 9.6

CHALMERS, Energy and Environment, Master’s Thesis 70
5.11 Total energy available from EVs in the commercial complexes for Case 2
Commercial
Complex
Total Energy Available
[kWh]
C1 6410
C2 5478
C3 5448
The aggregator will be responsible to use the energy available in EVs. In ideal
situation the energy will be used to supply back to the grid when the price is high
giving maximum benefit to the customers. In this study it is considered that the stored
energy available in the EV will be used during the day, when the price of electricity is
high. This would be the ideal situation for the use of energy from the EV. Table 5.12
and 5.13 show how the energy is distributed over these three hours.
Table 5.12 Distribution of energy available in EV over a period of three hours (Case 1)
Commercial
Complex
Energy Used
between 10:00 –
11:00
[kWh]
Energy Used
between 11:00 –
12:00
[kWh]
Energy Used
between 12:00 –
13:00
[kWh]
C1 763 763 763
C2 546 546 546
C3 531 531 531
Table 5.13 Distribution of energy available in EV over a period of six hours (Case 2)
Commercial
Complex
Energy
Used
between
10:00 –
11:00
[kWh]
Energy
Used
between
11:00 –
12:00
[kWh]
Energy
Used
between
12:00 –
13:00
[kWh]
Energy
Used
between
13:00 –
14:00
[kWh]
Energy
Used
between
14:00 –
15:00
[kWh]
Energy
Used
between
15:00 –
16:00
[kWh]
C1 1068 1068 1068 1068 1068 1068
C2 913 913 913 913 913 913
C3 908 908 908 908 908 908

CHALMERS, Energy and Environment, Master’s Thesis 71
The number of EVs are less in Case-1 compared to Case-2. For this reason the total
energy in Case-1 is distributed over a period of three hours, whereas for Case-2 it is
distributed over a period of six hours.
5.5 Results of Application
Various kinds of studies can be performed with the test system described above. In
this case analysis has been done to assess the effect of V2G supply on the ENS. Two
cases have been considered here, one with V2G supply and one without V2G supply
for individual complexes and the effect of V2G supply on the ENS of entire system
has been studied for case with fast charging and slow charging.
Case 1: 30 % EV penetration in to EDS
Figure 5.8 shows the ENS for the commercial complexes without any V2G supply.
Figure 5.9 shows the ENS for the commercial complexes with V2G supply. As can be
observed from these Figures the value of ENS is reduced in case of V2G supply.
Figure 5.8 ENS for Commercial Complexes (Case 1 without V2G Supply)
0 5 10 15 205
10
15
20
25
30
35
40Case 1 without V2G Supply
Time [Hrs]
En
erg
y N
ot S
up
plie
d [M
Wh
/yr]
Area C1
Area C2
Area C3

CHALMERS, Energy and Environment, Master’s Thesis 72
Figure 5.9 ENS for Commercial Complexes (Case 1 with V2G Supply)
Figure 5.10 shows the ENS for entire system with and without V2G supply, when the
case of fast charging is considered for 30% EV penetration into the EDS. Average
value for ENS for a load variation over one day is presented as below:
Average ENS without V2G = 108 MWh/yr
Average ENS with V2G = 105 MWh/yr
There is cost associated with this ENS. As mentioned in Figures 3.6 and 3.7 two cost
curves have been considered one showing the variation of cost in winter and the other
showing variation in summer over a period of one day.
Average Cost of ENS during summer period without V2G = 3280 Euros
Average Cost of ENS during summer period with V2G = 3178 Euros
Average Cost of ENS during winter period without V2G = 4306 Euros
Average Cost of ENS during winter period with V2G = 4200 Euros
0 5 10 15 205
10
15
20
25
30
35
40Case 1 with V2G Supply
Time [Hrs]
En
erg
y N
ot S
up
plie
d [M
Wh
/yr]
Area C1
Area C2
Area C3

CHALMERS, Energy and Environment, Master’s Thesis 73
Figure 5.10 ENS for Total System (Case 1 Fast Charging)
Figure 5.11 shows the ENS for entire system with and without V2G supply, when the
case of slow charging is considered with 30% of EV penetration into the EDS.
Average value for ENS for a load variation over one day is presented as below:
Average ENS without V2G = 109 MWh/yr
Average ENS with V2G = 106 MWh/yr
There is cost associated with this ENS. As mentioned in Figures 3.6 and 3.7 two cost
curves have been considered one showing the variation of cost in winter and the other
showing variation in summer over a period of one day.
Average Cost of ENS during summer period without V2G = 3329 Euros
Average Cost of ENS during summer period with V2G = 3327 Euros
Average Cost of ENS during winter period without V2G = 4326 Euros
Average Cost of ENS during winter period with V2G = 4220 Euros
0 5 10 15 2040
60
80
100
120
140
160Case 1 with Fast Charging
Time [Hrs]
En
erg
y N
ot S
up
plie
d [M
Wh
/yr]
Without V2G
With V2G
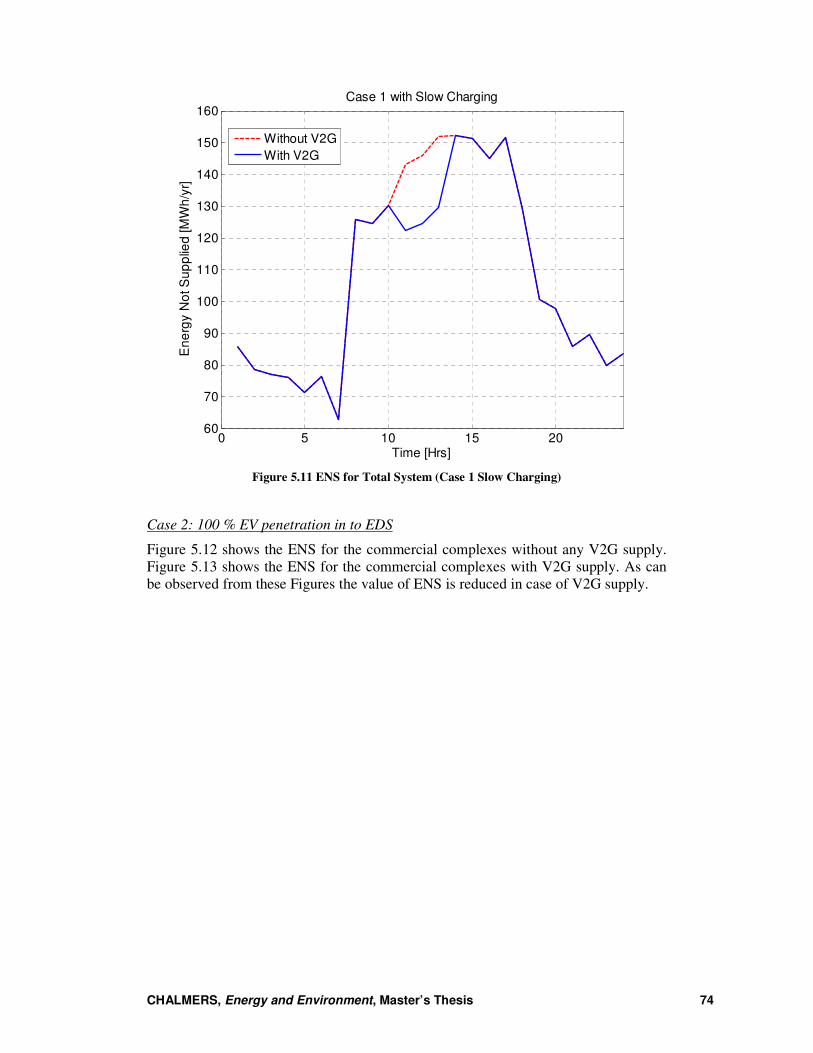
CHALMERS, Energy and Environment, Master’s Thesis 74
Figure 5.11 ENS for Total System (Case 1 Slow Charging)
Case 2: 100 % EV penetration in to EDS
Figure 5.12 shows the ENS for the commercial complexes without any V2G supply.
Figure 5.13 shows the ENS for the commercial complexes with V2G supply. As can
be observed from these Figures the value of ENS is reduced in case of V2G supply.
0 5 10 15 2060
70
80
90
100
110
120
130
140
150
160Case 1 with Slow Charging
Time [Hrs]
En
erg
y N
ot S
up
plie
d [M
Wh
/yr]
Without V2G
With V2G

CHALMERS, Energy and Environment, Master’s Thesis 75
Figure 5.12 ENS for Commercial Complexes (Case 2 without V2G Supply)
Figure 5.13 ENS for Commercial Complexes (Case 2 with V2G Supply)
0 5 10 15 205
10
15
20
25
30
35
40Case 2 without V2G Supply
Time [Hrs]
En
erg
y N
ot S
up
plie
d [M
Wh
/yr]
Area C1
Area C2
Area C3
0 5 10 15 205
10
15
20
25
30
35
40Case 2 with V2G Supply
Time [Hrs]
En
erg
y N
ot S
up
plie
d [M
Wh
/yr]
Area C1
Area C2
Area C3

CHALMERS, Energy and Environment, Master’s Thesis 76
Figure 5.14 shows the ENS for entire system with and without V2G supply, when the
case of fast charging is considered for 100% EV penetration into the EDS. Average
value for ENS for a load variation over one day is presented as below:
Average ENS without V2G = 120 MWh/yr
Average ENS with V2G = 114 MWh/yr
There is cost associated with this ENS. As mentioned in Figures 3.6 and 3.7 two cost
curves have been considered one showing the variation of cost in winter and the other
showing variation in summer over a period of one day.
Average Cost of ENS during summer period without V2G = 3508 Euros
Average Cost of ENS during summer period with V2G = 3307 Euros
Average Cost of ENS during winter period without V2G = 4768 Euros
Average Cost of ENS during winter period with V2G = 4554 Euros
Figure 5.14 ENS for Total System (Case 2 Fast Charging)
Figure 5.15 shows the ENS for entire system with and without V2G supply, when the
case of slow charging is considered for 100% EV penetration into the EDS. Average
value for ENS for a load variation over one day is presented as below:
Average ENS without V2G = 120 MWh/yr
Average ENS with V2G = 115 MWh/yr
There is cost associated with this ENS. As mentioned in Figures 3.6 and 3.7 two cost
curves have been considered one showing the variation of cost in winter and the other
showing variation in summer over a period of one day.
Average Cost of ENS during summer period without V2G = 3472 Euros
0 5 10 15 2080
90
100
110
120
130
140
150
160Case 2 with Fast Charging
Time [Hrs]
En
erg
y N
ot S
up
plie
d [M
Wh
/yr]
Without V2G
With V2G

CHALMERS, Energy and Environment, Master’s Thesis 77
Average Cost of ENS during summer period with V2G = 3270 Euros
Average Cost of ENS during winter period without V2G = 4780 Euros
Average Cost of ENS during winter period with V2G = 4565 Euros
Figure 5.15 ENS for Total System (Case 2 Slow Charging)
5.6 Conclusion and Summary of Results
The extended test system has been used here to perform a sample study. The study
focuses on finding out the variation in value of ENS for different conditions and the
cost associated with the same. The different cases considered are fast charging and
slow charging and two different cost one for summer and the other for winter are
considered. It has been assumed in this study that during the summer the cost of
electricity is low and the variation during the day is large and the winter costs are high
and the variation of cost is not large. These are two extreme cases considered to
analyze the effect of cost variation on the system.
Table 5.14 presents the summary of results. A variety of conclusions can be drawn
from the same. The potential saving in case of 30% EV penetration is not significant
even when the prices are high. This means that the investment in infrastructure for
V2G will have a long return period. However, a significant increase in the potential
saving is seen when the penetration of EVs has reached a full 100%.
0 5 10 15 2060
80
100
120
140
160
180Case 2 with Slow Charging
Time [Hrs]
En
erg
y N
ot S
up
plie
d [M
Wh
/yr]
Without V2G
With V2G

CHALMERS, Energy and Environment, Master’s Thesis 78
Table 5.14 Summary of results for the conducted study on the extended RBTS Test System
Study Case
Av. ENS
w/o V2G
[MWh/yr]
Av. ENS
with V2G
[MWh/yr]
Av. Cost of
ENS
Summer w/o
V2G
[Euros]
Av. Cost of
ENS Summer
with V2G
[Euros]
Potential
Saving
[Euros]
Av. Cost of
ENS
Winter w/o
V2G
[Euros]
Av. Cost of
ENS Winter
with V2G
[Euros]
Potential
Saving
[Euros]
Case 1
Fast
Charging 108 105 3280 3178 2 4306 4200 106
Slow
Charging 109 106 3329 3327 2 4326 4220 106
Case 2
Fast
Charging 120 114 3508 3307 201 4768 4554 214
Slow
Charging 120 115 3472 3270 202 4780 4565 215

CHALMERS, Energy and Environment, Master’s Thesis 79
6 Chapter Five
6.1 Proposed Extensions to the Test System
Chapters 3 and 4 describe the proposed extensions to the distribution test system.
These extensions and the assumptions considered therein are presented here as a
summary.
A. Extensions to RBTS:
1. Geography for the test system has been proposed. A simple geography is assumed
with flat land profile. Distances between different complexes have been defined.
The geography of the test system has been presented in Figure 4.3.
2. Grouping of loads as per geographic location has been done. The loads have been
grouped into different categories. The main categories are residential loads and
commercial loads. There are three groups of residential loads R1, R2 and R3 and
three groups of commercial loads C1, C2 and C3. Each group of loads has different
load points as defined in Table 4.2. The rating of distribution transformers has been
given for each load point and provided in Table 4.2. Two cost curves have been
provided with cost variation over a period of one day. One of the cost curve is for
cost of electricity during the winter season and the other is during summer season.
3. Load curve for both the residential and the commercial complexes has been
defined over a period of 24 hours.
4. Different types of EVs have been defined and an average battery size has been
provided. Based on this average battery size the two charging scenarios have been
defined. Fast charging and slow charging. The power drawn and the time taken for
the batter to attain full charge have been provided. Number of EVs within the test
system has been defined. Two cases have been considered with 30% EV
penetration and 100% EV penetration. The first case considers that 30% of the total
customers have some kind of electric vehicle and the second case considers that all
the customers have electric vehicles.
B. Assumptions done for sample study to Extended RBTS test system:
1. Coordinated charging of EVs has been considered and the philosophy for such
charging is defined. The number of EVs charging in each hour for 30% and 100%
penetration case for both fast and slow charging has been provided.
2. A simple model for electric vehicles has been presented. An assumption is made
that the reliability of a fleet of vehicles is 100%, as the failure of one vehicle will
not affect the capacity of entire fleet of vehicles.
3. Depending on the driving habits of customers the energy available in EVs for
supply to grid, when parked at the commercial complexes has been calculated.
4. It is assumed that the capacity support provided by EVs is distributed evenly over a
period of three hours for 30% penetration case and a period of six hours for 100%
penetration case. This can vary depending on the philosophy adopted by the user.
Relevant data for such a variation has been provided.

CHALMERS, Energy and Environment, Master’s Thesis 80
6.2 Conclusion and Future Work
Huge impetus is being given to electric vehicles as it presents a carbon free form of
transportation. In such a scenario analyzing the effect of integration of huge
number of electric vehicles in to the grid is of prime importance. An effort has
been made to define a simple electrical distribution test system with integration of
EVs. The existing electrical distribution test system within RBTS has been adopted
for the study and extensions made to the same. The system has been kept simple
and flexible so as to give opportunity to make changes easily for different kinds of
studies.
Various kinds of studies can be performed with the test system. However, a sample
reliability study has been performed on the extended test system and the results of
the same have been presented in the report.
A future work in this direction could be to integrate distributed wind power
generation in the test system. This would enable one to see the usefulness of EVs
as energy storage devices.

CHALMERS, Energy and Environment, Master’s Thesis 81
7 References
[1] A report prepared by the Reliability Test System Task Force of the Application of
Probability Methods Subcommittee, “IEEE Reliability Test System”, IEEE
Transactions on Power Apparatus and Systems, Vol. PAS-98, No.6
[2] R. Billinton, S. Kumar, N. Chowdhury, K. Chu, K. Debnath, L. Goel, E. Khan, P.
Kos, G. Nourbakhsh, J. Oteng-Adjei , “A Reliability Test System For Educational
Purposes - Basic Data”, IEEE Transactions on Power Systems, Vol. 4, No. 3,
August 1989.
[3] A report prepared by the Reliability Test System Task Force of the Application of
Probability Methods Subcommittee, “IEEE Reliability Test System-1996”, IEEE
Transactions on Power Systems, Vol. 14, NO. 3, August 1999.
[4] R.N. Allan, R. Billinton, N.M.K. Abdel-Gawad, “The IEEE Reliability Test
System – Extensions To And Evaluation Of The Generating System”, A report
prepared by the Reliability Test System Task Force of the Application of
Probability Methods Subcommittee, “IEEE Reliability Test System-1996”, IEEE
Transactions on Power Systems, Vol. 14, NO. 3, August 1999.
[5] R. Billinton, S. Kumar, N. Chowdhury, K. Chu, K. Debnath, L. Goel, E.Khan, P.
Kos, G. Nourbaksh,, J. Oteng- Adjei, “ A Reliability Test System For Educational
Purposes – Basic Data”, IEEE Transactions on Power Systems, Vol. 4, No. 3,
August 1989.
[6] Khosrow Moslehi, and Ranjit Kumar, ‘A Reliability Perspective of the Smart
Grid’. IEEE Transactions on Smart Grid, Vol. 1, No. 1, June 2010
[7] R. Billinton, S. Kumar, N. Chowdhury, K. Chu, K. Debnath, L. Goel, E.Khan, P.
Kos, G. Nourbaksh,, J. Oteng- Adjei, “ A Reliability Test System For Educational
Purposes – Basic Data”, IEEE Transactions on Power Systems, Vol. 4, No. 3,
August 1989.
[8] R. Billinton, S. Kumar, N. Chowdhury, K. Chu, K. Debnath, L. Goel, E.Khan, P.
Kos, G. Nourbaksh,, J. Oteng- Adjei, “ A Reliability Test System For Educational
Purposes – Basic Results”, IEEE Transactions on Power Systems, Vol. 5, No. 1,
February 1990.
[9] Shima Mousavi Gargari, “ Reliability Assessment of Complex Power Systems and
the Use of NEPLAN Tool”, Master thesis written at the School of Electrical
Engineering, Royal Institute of Technology, KTH, 2005/2006
[10] R.N.Allan, R. Billinton, I. Sjarief, L.Goel, K.S.So ” A Reliability Test System
For Educational Purposes – Basic Distribution System Data and Results”
[11] Royal Academy of Engineering “ Electric Vehicles – Charged With Potential”.
Available at
http://www.raeng.org.uk/news/publications/list/reports/Electric_Vehicles.pdf
[12] Jayakrishnan R Pillai, “ Electric Vehicle Based Battery Storages For Large
Scale Wind Power Integration in Denmark”. A dissertation submitted to The
Faculty of Engineering, Science and Medicine, Aalborg University Dec-2010.
[13] Chris Farmer, Paul Hines, Jonathan Dowds, Seth Blumsack, “ Modeling the
Impact of Increasing PHEV Loads on the Distribution Infrastructure”.
Proceedings of the 43rd
Hawaii International Conference on System Sciences -
2010.
[14] Steven D. Jenkins, John R. Rossmaier, Mehdi Ferdowsi, “Utilization and
Effect of Plug-In Hybrid Electric Vehicles in the United States Power Grid”. IEEE
Vehicle Power and Propulsion Conference (VPPC), September 3-5, 2008, Harbin,
China.

CHALMERS, Energy and Environment, Master’s Thesis 82
[15] Eric Sortomme, Mohammad M. Hindi, S. D. James MacPherson, S. S.
Venkata, “Coordinated Charging of Plug-In Hybrid Electric Vehicles to Minimize
Distribution System Losses”. IEEE transactions on Smart Grid, Vol. 2, No. 1,
March 2011.
[16] Kristien Clement, Edwin Haesen, Johan Driesen, ” Coordinated Charging of
Multiple Plug-In Hybrid Electric Vehicles in Residential Distribution Grids”.
[17] W. Kempton, J Tomic, “ Vehicle-to-grid power fundamentals: Calculating
capacity and revenue”. Journal of Power Sources, Vol.144, no.1, pp-268-279, June
2005.
[18] A. N. Brooks (2002) Vehicle-to-Grid demonstration project: Grid regulation
ancillary service with a battery electric vehicle. Available:
http://www.udel.edu/V2G/docs/V2G-Demo-Brooks-02-R5.pdf
[19] Tesla motors website : teslamotors.com
[20] A report prepared by the Reliability Test System Task Force of the
Application of Probability Methods Subcommittee, “IEEE Reliability Test
System”, IEEE Transactions on Power Apparatus and Systems, Vol. PAS-98,
No.6
[21] R. Billinton, S. Kumar, N. Chowdhury, K. Chu, K. Debnath, L. Goel, E. Khan,
P. Kos, G. Nourbakhsh, J. Oteng-Adjei , “A Reliability Test System For
Educational Purposes - Basic Data”, IEEE Transactions on Power Systems, Vol.
4, No. 3, August 1989.
[22] A report prepared by the Reliability Test System Task Force of the
Application of Probability Methods Subcommittee, “IEEE Reliability Test
System-1996”, IEEE Transactions on Power Systems, Vol. 14, NO. 3, August
1999.
[23] R.N. Allan, R. Billinton, N.M.K. Abdel-Gawad, “The IEEE Reliability Test
System – Extensions To And Evaluation Of The Generating System”, A report
prepared by the Reliability Test System Task Force of the Application of
Probability Methods Subcommittee, “IEEE Reliability Test System-1996”, IEEE
Transactions on Power Systems, Vol. 14, NO. 3, August 1999.
[24] R. Billinton, S. Kumar, N. Chowdhury, K. Chu, K. Debnath, L. Goel, E.Khan,
P. Kos, G. Nourbaksh,, J. Oteng- Adjei, “ A Reliability Test System For
Educational Purposes – Basic Data”, IEEE Transactions on Power Systems, Vol.
4, No. 3, August 1989.
[25] Khosrow Moslehi, and Ranjit Kumar, ‘A Reliability Perspective of the Smart
Grid’. IEEE Transactions on Smart Grid, Vol. 1, No. 1, June 2010
[26] http://www.nordpoolspot.com/reports/systemprice/
[27] P. Denholm and W. Short, “An Evaluation of Utility System Impacts and
Benefits of Optimally Dispatched Plug-In Hybrid Electric Vehicles”. National
Renewable Energy Laboratory, Technical Report NREL/TP-620-40293, Revised
October 2006.
[28] Reigh Walling, G Bruce Shattuk, “Distribution Transformer Thermal
Behaviour And Aging in Local Delivery Distribution System”. Cired 19th
International Conference on Electricity Distribution, Vienna 21-24 May 2007.
[29] G4V Project, “Parameter Manual”. Available at:
http://g4v.eu/datas/Parameter_Manual_WP1_3_RWTH_101216.pdf