Embed Size (px)
Citation preview
Development of novel biomimetic affinity adsorbents for
plasmid DNA purification:
Preliminary results
Cátia Isabel Pereira Jorge
Thesis to obtain the Master of Science Degree in
Biotechnology
Supervisors: Professor Maria Ângela Cabral Garcia Taipa Meneses de Oliveira
Professor Duarte Miguel de França Teixeira dos Prazeres
Examination Committee
Chairperson: Professor Arsénio do Carmo Sales Mendes Fialho
Supervisor: Professor Maria Ângela Cabral Garcia Taipa Meneses de Oliveira
Member of the Committee: Professor Marília Clemente Velez Mateus
December 2014

ii

iii
Acknowledgements
First of all, I would like to acknowledge Professor Ângela Taipa for being my supervisor and
for accepting me in this Master‘s thesis, trusting in me to work on this topic and for all the support and
help that was given to me. I would also like to thank Professor Miguel Prazeres for letting me work at
MoBiol laboratory and for being my co-supervisor.
To my lab colleagues, thanks for all the support when I needed and for being there to help me.
Thank you for all the moments that we spent together. Sofia, Salomé, João Trabuco, Jorge, Pedro,
Luís Raiado and Maria thanks for all the help provided when I needed and for the constant support. I
would also like to thank my Master’s colleagues, Rita, Diana, Ana, Isabel and Liliana with whom I grew
up closer during this year. Sara A. Rosa and Raquel Santos, thanks for all the help provided in AKTA
and for being there when I had any doubts. I would also like to thank João Belchior for the help
provided in the beginning of my thesis and for teaching me most of the techniques that I would be
using. I have also to thank Filipa Gonçalves, who, during her Summer training period, helped and
assisted me during a part of my thesis work.
A big ‘thank you’ to Sara S. Rosa, Cláudia Alves and Sílvia Andrade for helping me go through
this year, for providing some discussions that helped in my work and for being there in the most
stressful times. I would also like to thank Rita Carneiro for her friendship and for listening to me when I
needed.
To my amazing friends, Andreia Pereira e Marina Machado: thank for all our conversations
and for your continuous support. Even though you were not here our conversations on the phone
helped me through a lot of stuff. Thank for being the best friends I could ask for and for being there for
me. I know that every time I need help I can talk to you.
At last, but not the least, I would like to thank my family, specially my mom. Mom, thank you
for all that you did for me and for listening every time I would ranted about something that was going
wrong. Without you I would have not made it.

iv

v
Abstract
The development of strategies to pDNA purification has become necessary for the progress of
gene therapy and DNA vaccine production processes due to the structural and chemical similarities
between pDNA and impurities present in cell extracts. Affinity chromatography plays a powerful role in
separation technology as this technique enables the purification of a biomolecule by interaction
between the target molecule and a specific ligand. A substantial number of attempts have been made
to develop affinity chromatographic matrices capable of specifically recognizing nucleic acid molecules
out of a mixture and, despite the progress made, there is room for the development of new adsorbents
with desirable properties for large-scale application. In this context, synthetic-mimic affinity ligands can
be a good alternative to generate such adsorbents. The reactivity of cyanuric chloride towards amines,
its structural rigidity and the formation of non-fissile bonds with the substituents, has been the basis for
its use as a scaffold for combinatorial synthesis and the generation of molecular diversity in synthetic
protein-mimic ligands with defined specificities and selectivities. Combinatorial solid-phase synthesis
allows the production of a large number of different compounds for random screening, in a time and
resource-effective manner. In this work, different types of chromatographic matrices were tested with
two promising ligands previously screened from a combinatorial library. It was possible to achieve
purification of pDNA with both Sepharose CL-6B and the CIM® monolithic disks derivatized with one
selected ligand. The best results were obtained under hydrophobic conditions using the CIM®
monolithic disks. The yield of pure pDNA obtained was around 91% with a purification factor of 3.78.
Keywords: plasmid purification, affinity chromatography, synthetic affinity ligands, biomimetic,
monoliths

vi
vii
Resumo
O desenvolvimento de estratégias para a purificação de pDNA tornou-se necessário para o
progresso na terapia génica e produção de vacinas de DNA devido às semelhanças entre o pDNA e
as impurezas presentes em extratos celulares. A cromatografia de afinidade desempenha um papel
importante nos processos de separação, sendo uma técnica que permite a purificação de
biomoléculas com base na interação específica entre a molécula-alvo e um ligando. Um número
elevado de estudos tem procurado desenvolver matrizes cromatográficas de afinidade capazes de
reconhecer especificamente ácidos nucleicos a partir de uma mistura e, apesar dos progressos
realizados, há espaço para o desenvolvimento de novos adsorventes com especificidade e/ou
selectividade melhoradas para aplicação em larga escala. Os ligandos sintéticos de afinidade
mímicos de proténas são uma boa alternativa para gerar novos adsorventes. A reactividade de
cloreto cianúrico em relação a aminas, a sua rigidez estrutural e a formação de ligações não-físseis
com os substituintes, levou ao seu uso como estrutura-base apropriada em síntese combinatorial e a
produção de ligandos sintéticos mímicos de proteínas, com especificidades e selectividades
definidas. O método predominantemente utilizado para gerar diversidade molecular é a síntese
combinatorial em fase sólida, pois permite a obtenção de um elevado número de compostos
diferentes para um rastreio aleatório, de um modo eficaz em termos de tempo e recursos. Neste
trabalho, testaram-se diferentes tipos de matrizes cromatográficas com dois ligandos promissores,
previamente selecionados de uma biblioteca combinatorial, e foi possível alcançar a purificação de
pDNA, tanto com Sepharose CL-6B como com discos monolíticos CIM® derivatizados com um ligando
seleccionado. O melhor resultado foi obtido em condições hidrofóbicas utilizando os discos
monolítocos CIM®. O rendimento obtido em DNA plasmídico puro foi de 91% com um factor de
purificação de 3.78.
Palavras-chave: purificação de plasmídeos, cromatografia de afinidade, ligandos sintéticos de
afinidade, biomiméticos, monólitos

Index
Acknowledgements ................................................................................................................................. iii
Abstract.....................................................................................................................................................v
Resumo .................................................................................................................................................. vii
Figure Index ............................................................................................................................................. 4
Table Index .............................................................................................................................................. 9
Abbreviations ......................................................................................................................................... 10
1. Introduction .................................................................................................................................... 11
1.1 Plasmid DNA ......................................................................................................................... 11
1.1.1 Gene therapy and DNA vaccines .................................................................................. 11
1.1.2 Plasmid Isoforms ........................................................................................................... 13
1.1.3 Cell Culture and Fermentation ....................................................................................... 13
1.1.4 Cell Lysis and Clarification ............................................................................................ 14
1.1.5 Purification by Chromatography .................................................................................... 16
1.1.5.1 Anion-Exchange Chromatography ............................................................................ 17
1.1.5.2 Hydrophobic Interaction Chromatography ................................................................. 17
1.1.5.3 Size-Exclusion Chromatography ............................................................................... 18
1.1.5.4 Affinity Chromatography ............................................................................................ 19
1.2 Affinity Ligands ...................................................................................................................... 21
1.2.1 Biological Ligands .......................................................................................................... 21
1.2.2 Synthetic Affinity Ligands .............................................................................................. 21
1.2.3 Biomimetic Ligands ....................................................................................................... 22
1.3 Monoliths as Chromatographic Matrices for Affinity Chromatography .................................. 24
1.3.1 GMA/EDMA Monoliths ................................................................................................... 24
1.3.1.1 CIM® Monolithic Columns .......................................................................................... 25
1.3.2 Agarose Monoliths ......................................................................................................... 26
1.3.3 Silica Monoliths .............................................................................................................. 26
1.3.4 Cryogels ......................................................................................................................... 27
1.3.5 Immobilization Methods for Affinity Monoliths ............................................................... 28
2
1.3.5.1 Covalent Immobilization Methods .............................................................................. 28
1.3.5.2 Non-covalent Immobilization Methods....................................................................... 31
2. Material and Methods .................................................................................................................... 32
2.1 Cell Culture ............................................................................................................................ 32
2.1.1 Pre-inoculum and inoculum ........................................................................................... 32
2.1.2 Cell lysis and Plasmid Primary Isolation ........................................................................ 33
2.2 Desalinization of a clarified E. coli lysate .............................................................................. 33
2.3 Synthesis of triazine-based adsorbents in Sepharose CL-6B ............................................... 34
2.3.1 Epoxy activation of Sepharose CL-6B ........................................................................... 34
2.3.2 Amination of previously epoxy-activated Sepharose CL-6B ......................................... 34
2.3.2.1 Determination of ammination extent in Sepharose beads ........................................ 34
2.3.3 Activation of aminated Sepharose with cyanuric chloride ............................................. 35
2.3.4 Nucleophilic substitution of the second chlorine atom of dichlorotriazinyl Sepharose (R1
substitution) ................................................................................................................................... 35
2.3.5 Nucleophilic substitution of the third chlorine atom of dichlorotriazinyl Sepharose (R2
substitution) ................................................................................................................................... 35
2.4 Chromatographic assays using ligands 5/6 and 6/5 in Sepharose CL-6B ............................ 35
2.5 Synthesis of triazine-based adsorbents in CIM® monolithic disks ......................................... 36
2.5.1 Epoxy activation of the monolithic disks ........................................................................ 36
2.5.2 Amination of previously epoxy-activated disks .............................................................. 36
2.5.3 Activation of aminated Sepharose with cyanuric chloride ............................................. 37
2.5.4 Nucleophilic substitution of the second chlorine atom of dichlorotriazinyl Sepharose (R1
substitution) ................................................................................................................................... 37
2.5.5 Nucleophilic substitution of the third chlorine atom of dichlorotriazinyl Sepharose (R2
substitution) ................................................................................................................................... 37
2.5.5.1 Optimization of the R2 substitution for the monolithic supports ................................ 37
2.6 Chromatographic assays using ligands 6/5 in CIM® monolithic disks ................................... 37
2.7 Agarose gel electrophoresis .................................................................................................. 38
2.8 HPLC analysis ....................................................................................................................... 38
2.9 Adsorption of Cutinase in the matrices tested ....................................................................... 39
3. Results and Discussion ................................................................................................................. 39
3
3.1 Cell growth ............................................................................................................................. 39
3.2 Preliminary assay using selected triazine-based ligands ...................................................... 40
3.3 Chromatographic assays with triazine-based ligands ........................................................... 41
3.4 Chromatographic assays in AKTA purifier system with ligand 6/5 synthesized in Sepharose
CL-6B 46
3.5 Optimization of ligand derivatization ...................................................................................... 53
3.6 Chromatographic assays with CIM®
monolithic disks ............................................................ 54
3.6.1 Assays performed with ligand 6/5 derivatized CIM®
disk under hydrophobic conditions
54
3.6.2 Assays performed with ligand 6/5 derivatized CIM® disk under hydrophilic conditions 64
3.7 Adsorption of Cutinase in ligand 6/5 derivatized matrices .................................................... 66
4. Conclusion ..................................................................................................................................... 67
5. Further work................................................................................................................................... 68
6. References .................................................................................................................................... 70
7. Appendix ........................................................................................................................................ 74
Appendix I - Plasmid pVAX1-LacZ (Invitrogen) information .............................................................. 74
Appendix II – Plasmid pCEP4 (Invitrogen) information ..................................................................... 75
Appendix III – Plasmid pVAX1TSAGFP information ......................................................................... 76
Appendix IV - NZYDNA Ladder III (NZYTech) .................................................................................. 76
Appendix V - Pure plasmid DNA standard curve for analysis by HIC in a HPLC system ................. 77

4
Figure Index
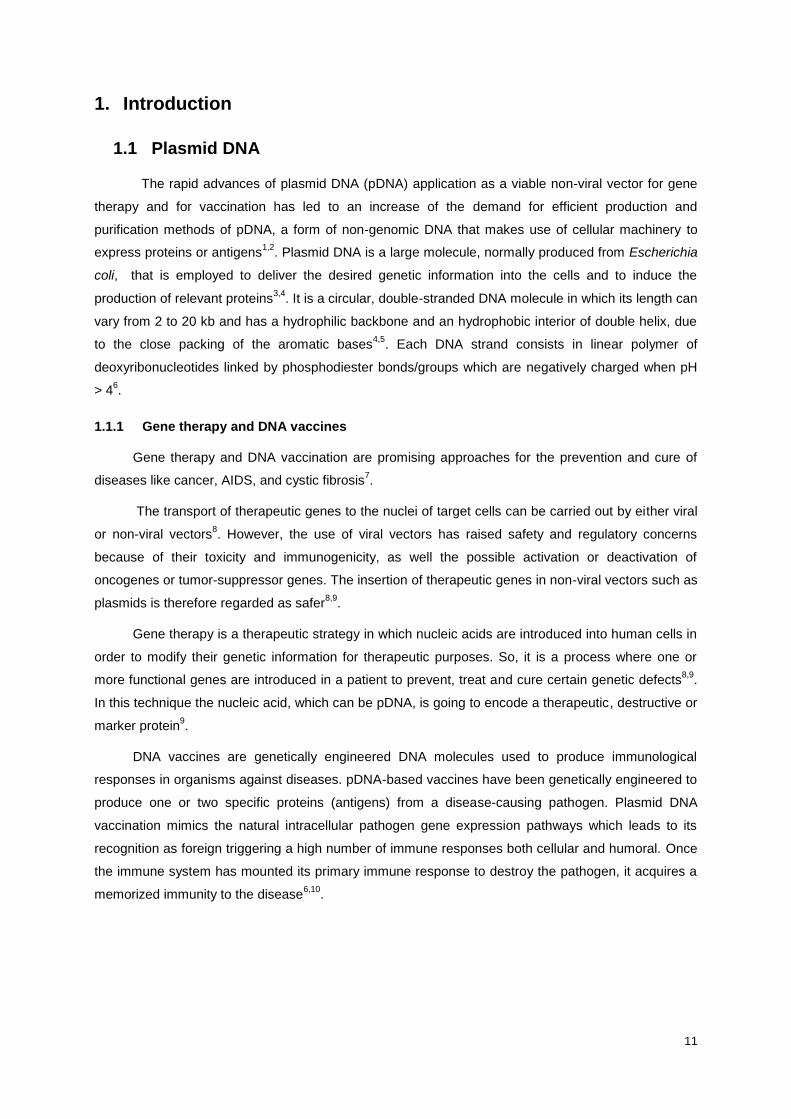
Figure 1 – Scheme demonstrating all the process from the disease until it gets to the patient. (Adapted
from Prazeres et al 1999)8 ..................................................................................................................... 12
Figure 2 – Schematic representation of DNA structure: (a) Linear fragment, closed loop and
supercoiled topologies; (b) Plasmid DNA supercoiling. (Adapted from Ferreira et al 2005)11
.............. 13
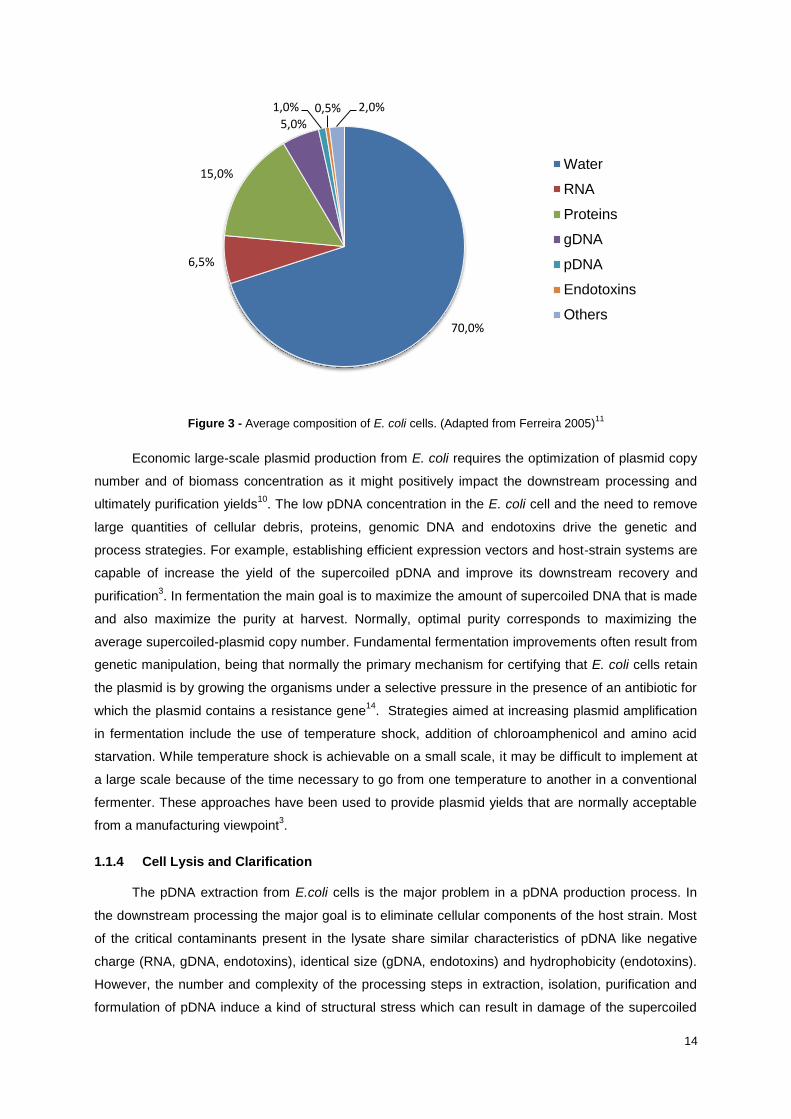
Figure 3 - Average composition of E. coli cells. (Adapted from Ferreira 2005)11
.................................. 14
Figure 4 - Process flow sheet for the large-scale purification of sc pDNA. (Adapted from Ferreira et al
2000)9 .................................................................................................................................................... 16
Figure 5 - The Hofmeister series with anions and cations arranged in terms of their water affinity and
according to their effects on the solubility of macromolecules in aqueous solutions. (Adapted from
Freitas et al 2009)19
............................................................................................................................... 18
Figure 6 - Principle of Affinity Chromatography. NRS - non-retained substance. (Adapted from Tetala
et al 2010)21
........................................................................................................................................... 19
Figure 7 - General procedures for applying and eluting solutes from affinity columns. (Adapted from
Mallik and Hage 2006)22
........................................................................................................................ 20
Figure 8 – a) structure of a triazine-based ligand and b) examples of amine substituents mimicking the
side chains of different amino acids. (Adapted from Sousa et al 2009)33
............................................. 23
Figure 9 - Formation of a copolymer of GMA with EDMA (Adapted from Mallik et al 2006)22
.............. 25
Figure 10 – Different chemistries available in the CIM® monolithic columns
36. ................................... 26
Figure 11 - Typical reaction used for the preparation of a cryogel based on the copolymerization of
acrylamide, allyl glycidyl ether and N,N’- methylene bis-acrylamide. (Adapted from Mallik and Hage
2006)22
................................................................................................................................................... 28
Figure 12 – Covalent immobilization of ligands on GMA/EDMA monoliths by the epoxy method
(Adapted from Mallik and Hage 2006)22
................................................................................................ 29
Figure 13 - Covalent immobilization by the a) Schiff base method and the b) glutaraldehyde method
(Adapted from Mallik and Hage 2006)22
................................................................................................ 30
Figure 14 - Covalent immobilization by the CNBr method (Adapted from Mallik and Hage 2006)22
.... 31
Figure 15 - Growth curve of E.coli cells with plasmid pVAX1-LacZ, C1-TSA and pCEP4 .................... 40
Figure 16 - Resulting agarose gel from the samples collected in the washthrough process of ligand 5/6
(2ml of agarose). M – NZYDNA ladder III; 1 to 10 – Collected fractions after injecting 100 µl of the
clarified lysate (containing pVAX1-LacZ plasmid) using 0.4M Ammonium Sulphate in 20mM Tris-HCl
pH 8.0 as equilibration buffer (washthrough fractions). ......................................................................... 42
5
Figure 17 - Resulting agarose gel from the samples collected in the washthrough process of ligand 5/6
(2ml of agarose) using 20mM Tris-HCl pH 8.0 as equilibration buffer. L – NZYDNA ladder III; S –
Loaded sample (100 μl clarified E. coli crude extract containing pVAX1-LacZ plasmid). ..................... 42
Figure 18 - Resulting agarose gel from the samples collected in the washthrough process of ligand 6/5
(2ml of agarose) using 0.4M Ammonium Sulphate in 20mM Tris-HCl pH 8.0 as equilibration buffer. L –
NZYDNA ladder III; S – Loaded sample (100 μl clarified E. coli crude extract containing pVAX1-LacZ
plasmid). The dragging marks in some lanes are due to the presence of ammonium sulphate. .......... 43
Figure 19 - Resulting agarose gel from the samples collected in the washthrough process of ligand 6/5
(2ml of agarose) using 20mM Tris-HCl pH 8.0 as equilibration buffer. L – NZYDNA ladder III; S –
Loaded sample (100 μl clarified E. coli crude extract containing pVAX1-LacZ plasmid). ..................... 44
Figure 20 - Resulting agarose gel from the samples collected in the washthrough process of ligand 6/5
(2ml of agarose) using 0.4M Ammonium Sulfate in 20mM Tris-HCl pH 8.0 as equilibration buffer. The
plasmids tested where pVAX1-LacZ (a), pCEP4 (b) and pVAX1TSAGFP (c). L – NZYDNA ladder III; S
– Loaded sample (100 μl clarified E. coli crude extract). The dragging marks in some lanes are due to
the presence of ammonium sulfate. ...................................................................................................... 44
Figure 21 - Resulting agarose gel from the samples collected in the washthrough process of ligand 6/5
(2ml of agarose) using 0.2 (a), 0.4 (b) and (c) 0.8M Sodium Citrate in 10mM Tris-HCl pH 8.0 as
equilibration buffer. L – NZYDNA ladder III; S – Loaded sample (100 μl clarified E. coli crude extract
containing pVAX1-LacZ plasmid). The dragging marks in some lanes are due to the presence of
ammonium sulfate. ................................................................................................................................ 45
Figure 22 - Chromatographic performance of ligand 6/5, in a 6 ml column in an AKTA purifier system.
Sample (100μl clarified E. coli crude extract containing pVAX1-LacZ plasmid) was loaded in
hydrophobic conditions. The run was performed at room temperature at 1ml/min. 0.4M Ammonium
Sulfate in 20mM Tris-HCl pH 8.0 was used as equilibration buffer and elution buffer. Agarose gel
corresponds to the chromatogram presented. L – NZYDNA ladder III; S – Loaded sample. The
numbers in brackets on top of each peak correspond to the lanes in the 1% agarose gel. a), b), c) and
d) correspond to replicates of the same experiment with run d) being performed in a 2 ml column .... 47
Figure 23 - Chromatographic performance of ligand 6/5, in a 6 ml column in an AKTA purifier system.
Sample (100μl clarified E. coli crude extract containing pVAX1-LacZ plasmid) was loaded in
hydrophilic conditions. The run was performed at room temperature at 1ml/min. 20mM Tris-HCl pH 8.0
was used as equilibration buffer and elution buffer. Agarose gel corresponds to the chromatogram
presented. L – NZYDNA ladder III; S – Loaded sample. The numbers in brackets on top of each peak
correspond to the lanes in the 1% agarose gel. .................................................................................... 48
Figure 24 - Chromatographic performance of ligand 6/5 an AKTA purifier system. Sample (100μl
clarified E. coli crude extract containing pVAX1-LacZ plasmid) was loaded in hydrophobic conditions.
The run was performed at room temperature at 1ml/min. 0.8M Ammonium Sulfate in 10mM Tris-HCl
pH 8.0 was used as equilibration buffer and elution buffer. Agarose gel corresponds to the
chromatogram presented. L – NZYDNA ladder III; S – Loaded sample. The numbers in brackets on
6
top of each peak correspond to the lanes in the 1% agarose gel. a) and b) correspond to replicates of
the same experiment with a) being performed in a 6 ml column and b) in a 2 ml column. ................... 49
Figure 25 - Chromatographic performance of ligand 6/5 in a 6 ml column in an AKTA purifier system.
Sample (100μl clarified E. coli crude extract containing pVAX1-LacZ plasmid) was loaded in
hydrophobic conditions. The run was performed at room temperature at 1ml/min. 1.5M Ammonium
Sulfate in 10mM Tris-HCl pH 8.0 was used as equilibration buffer and elution was performed with a
negative linear gradient until 10 mM Tris-HCl pH 8.0 (0M Ammonium Sulfate). Agarose gel
corresponds to the chromatogram presented. L – NZYDNA ladder III; S – Loaded sample. ............... 50
Figure 26 - Chromatographic performance of ligand 6/5 in a 6 ml column in an AKTA purifier system.
Sample (100μl clarified E. coli crude extract containing pVAX1-LacZ plasmid) was loaded in
hydrophobic conditions. The run was performed at room temperature at 1ml/min. 1.5M Ammonium
Sulfate in 10mM Tris-HCl pH 8.0 was used as equilibration buffer and elution was performed with a
negative linear gradient until 10 mM Tris-HCl pH 8.0 (0M Ammonium Sulfate). Agarose gel
corresponds to the chromatogram presented. L – NZYDNA ladder III; S – Loaded sample. a) and b)
correspond to duplicates of the same assay. ........................................................................................ 51
Figure 27 - Chromatographic performance of ligand 6/5 in a 6 ml column in an AKTA purifier system.
Sample (100μl clarified E. coli crude extract containing pVAX1-LacZ plasmid) was loaded in
hydrophobic conditions. The run was performed at room temperature at (a) 1ml/min and (b) 0.5ml/min.
0.8M Sodium Citrate in 10mM Tris-HCl pH 8.0 was used as equilibration buffer and elution buffer.
Agarose gel corresponds to the chromatogram presented. L – NZYDNA ladder III; S – Loaded sample.
The numbers in brackets on top of each peak correspond to the lanes in the 1% agarose gel. .......... 52
Figure 28 - Resulting agarose gel from the samples collected in the washthrough process of ligand 6/5
(2ml of agarose) using 0.4M Ammonium Sulfate in 20mM Tris-HCl pH 8.0 as equilibration buffer. The
same sample was loaded in different dilutions: 1:10 (a), 1:20 (b), 1:50 (c) and 1:100 (d). L – NZYDNA
ladder III; S – Loaded sample (100 μl clarified E. coli crude extract containing pVAX1-LacZ plasmid).
The dragging marks in some lanes are due to the presence of ammonium sulfate. ............................ 53
Figure 29 – Percentage of derivatization of agarose with ligand 6/5 in the different conditions tested for
R2 amine substitution. ........................................................................................................................... 54
Figure 30 – Optimization of the chromatographic performance of ligand 6/5 in CIM® monolithic disks
for pDNA purification. Sample (100μl clarified E. coli crude extract containing pVAX1-LacZ plasmid)
was loaded in hydrophobic conditions. The run was performed at room temperature. 0.4M Ammonium
Sulfate in 20mM Tris-HCl pH 8.0 was used as equilibration buffer and elution buffer. Agarose gel
corresponds to the chromatogram presented. L – NZYDNA ladder III; S – Loaded sample. The
numbers in brackets on top of each peak correspond to the lanes in the 1% agarose gel. ................. 56
Figure 31 - Chromatographic performance in a CIM® monolithic disk derivatized with ligand 6/5.
Sample (100μl clarified E. coli crude extract containing pVAX1-LacZ plasmid) was loaded in
hydrophobic conditions. The run was performed at room temperature at 1ml/min. 0.8M Ammonium
Sulfate in 10mM Tris-HCl pH 8.0 was used as equilibration buffer and elution buffer. Agarose gel

7
corresponds to the chromatogram presented. L – NZYDNA ladder III; S – Loaded sample. The
numbers in brackets on top of each peak correspond to the lanes in the 1% agarose gel. ................. 60
Figure 32 - Chromatographic performance in a CIM® monolithic disk derivatized with ligand 6/5.
Sample (100μl clarified E. coli crude extract containing pVAX1-LacZ plasmid) was loaded in
hydrophobic conditions. The run was performed at room temperature at 1ml/min. 0.8M Ammonium
Sulfate in 10mM Tris-HCl pH 8.0 was used as equilibration buffer and elution buffer. Agarose gel
corresponds to the chromatogram presented. L – NZYDNA ladder III; S – Loaded sample. The
numbers in brackets on top of each peak correspond to the lanes in the 1% agarose gel. ................. 61
Figure 33 - Chromatographic performance in a CIM® monolithic disk derivatized with ligand 6/5.
Sample (100μl clarified E. coli crude extract containing pVAX1-LacZ plasmid) was loaded in
hydrophobic conditions. The run was performed at room temperature at 1ml/min. 1.5M Ammonium
Sulfate in 20mM Tris-HCl pH 8.0 was used as equilibration buffer and elution buffer. Agarose gel
corresponds to the chromatogram presented. L – NZYDNA ladder III; S – Loaded sample. The
numbers in brackets on top of each peak correspond to the lanes in the 1% agarose gel. a) and b)
represent replicates of the same experiment. ....................................................................................... 61
Figure 34 - Chromatographic performance in a CIM® monolithic disk derivatized with ligand 6/5.
Sample (100μl clarified E. coli crude extract containing pVAX1-LacZ plasmid) was loaded in
hydrophobic conditions. The runs was performed at room temperature at 1ml/min. 0.4M Ammonium
Sulfate in 20mM Tris-HCl pH 8.0 was used as equilibration buffer and elution was performed with a
negative linear gradient until 20 mM Tris-HCl pH 8.0 (0M Ammonium Sulfate). Agarose gels
correspondent to the chromatograms presented. L – NZYDNA ladder III; S – Loaded sample. The
numbers in brackets on top of each peak correspond to the lanes in the 1% agarose gel. a)
corresponds to the chromatograms obtained in the experiments; b) and c) corresponds to the agarose
gels of each chromatographic run. ........................................................................................................ 63
Figure 35 - Chromatographic performance in a CIM® monolithic disk derivatized with ligand 6/5.
Sample (100μl clarified E. coli crude extract containing pVAX1-LacZ plasmid) was loaded in
hydrophilic conditions. The run was performed at room temperature at 1ml/min. 20mM Tris-HCl pH 8.0
was used as equilibration buffer and elution buffer. Agarose gel corresponds to the chromatogram
presented. L – NZYDNA ladder III; S – Loaded sample. The numbers in brackets on top of each peak
correspond to the lanes in the 1% agarose gel. a) and b) represent duplicates of the same assay. ... 64
Figure 36 - Chromatographic performance in a CIM® monolithic disk derivatized with ligand 6/5.
Sample (100μl clarified E. coli crude extract containing pVAX1-LacZ plasmid) was loaded in
hydrophilic conditions. The runs was performed at room temperature at 1ml/min. 20mM Tris-HCl pH
8.0 was used as equilibration buffer with a linear gradient with increasing of 1M NaCl during elution.
Agarose gels correspondent to the chromatograms presented. L – NZYDNA ladder III; S – Loaded
sample. The numbers in brackets on top of each peak correspond to the lanes in the 1% agarose gel.
............................................................................................................................................................... 65
8
Figure 37 - Percentage of cutinase binding and not binding to the different chromatographic matrices
non-derivatized and derivatized with ligand 6/5. A volume of 1 mL of a cutinase solution (1mg/mL) was
loaded in each column. .......................................................................................................................... 66
Figure A1 - Structure and features of pVAX1/lacZ plasmid. ................................................................. 74
Figure A2 - Structure and features of pCEP4 plasmid. ......................................................................... 75
Figure A3 - Structure and features of pVAX1TSAGFP plasmid. ........................................................... 76
Figure A4 - NZYDNA Ladder III electrophoresed in a 1% (w/v) electrophoresis grade agarose gel. ... 76
Figure A5 - Calibration curve obtained by HIC in a HPLC system. Using standard plasmid
concentrations. ...................................................................................................................................... 77

9
Table Index
Table 1 - Advantages and disadvantages of pDNA vaccine. (Adapted from Ghanem et al 2013) ....... 12
Table 2 - Concentration of free amine after the amination step and after derivatization with synthetic
amines in both R1 and R2 position: corresponding ligand concentration. ............................................ 41
10
Abbreviations
AC – Affinity chromatography
AEC – Anion-exchange chromatography
AU – Absorbance units
CIM® – Convective Interaction Media
E. coli – Escherichia coli
gDNA – Genomic DNA
GFP – Green fluorescent protein
HIC – Hydrophobic interaction chromatography
HPLC – High-performance liquid chromatography
LacZ – beta-galactosidase
LB - Luria Bertany
oc- open circular
OD – Optical density
pDNA – plasmid DNA
pI – Isoelectric point
qPCR – Real-time polymerase chain reaction
sc- supercoiled
SEC – Size exclusion chromatography
SEM – Scanning electron microscopy
TNBS - 2,4,6-trinitrobenzenesulfonic acid
11
1. Introduction
1.1 Plasmid DNA
The rapid advances of plasmid DNA (pDNA) application as a viable non-viral vector for gene
therapy and for vaccination has led to an increase of the demand for efficient production and
purification methods of pDNA, a form of non-genomic DNA that makes use of cellular machinery to
express proteins or antigens1,2
. Plasmid DNA is a large molecule, normally produced from Escherichia
coli, that is employed to deliver the desired genetic information into the cells and to induce the
production of relevant proteins3,4
. It is a circular, double-stranded DNA molecule in which its length can
vary from 2 to 20 kb and has a hydrophilic backbone and an hydrophobic interior of double helix, due
to the close packing of the aromatic bases4,5
. Each DNA strand consists in linear polymer of
deoxyribonucleotides linked by phosphodiester bonds/groups which are negatively charged when pH
> 46.
1.1.1 Gene therapy and DNA vaccines
Gene therapy and DNA vaccination are promising approaches for the prevention and cure of
diseases like cancer, AIDS, and cystic fibrosis7.
The transport of therapeutic genes to the nuclei of target cells can be carried out by either viral
or non-viral vectors8. However, the use of viral vectors has raised safety and regulatory concerns
because of their toxicity and immunogenicity, as well the possible activation or deactivation of
oncogenes or tumor-suppressor genes. The insertion of therapeutic genes in non-viral vectors such as
plasmids is therefore regarded as safer8,9
.
Gene therapy is a therapeutic strategy in which nucleic acids are introduced into human cells in
order to modify their genetic information for therapeutic purposes. So, it is a process where one or
more functional genes are introduced in a patient to prevent, treat and cure certain genetic defects8,9
.
In this technique the nucleic acid, which can be pDNA, is going to encode a therapeutic, destructive or
marker protein9.
DNA vaccines are genetically engineered DNA molecules used to produce immunological
responses in organisms against diseases. pDNA-based vaccines have been genetically engineered to
produce one or two specific proteins (antigens) from a disease-causing pathogen. Plasmid DNA
vaccination mimics the natural intracellular pathogen gene expression pathways which leads to its
recognition as foreign triggering a high number of immune responses both cellular and humoral. Once
the immune system has mounted its primary immune response to destroy the pathogen, it acquires a
memorized immunity to the disease6,10
.
12
Figure 1 – Scheme demonstrating all the process from the disease until it gets to the patient. (Adapted from Prazeres et al 1999)
8
The biggest advantage of using DNA vaccines is that there is stimulation of both the humoral
and cell-mediated components of the immune system while conventional protein vaccines only
stimulate the antibody response6. Plasmid DNA-based vaccines are considered very safe due to the
lack of genetic integration and to the absence of specific immune responses to the plasmid10
.
A summary of DNA vaccines advantages and disadvantages is shown in Table 1.
Table 1 - Advantages and disadvantages of pDNA vaccine. (Adapted from Ghanem et al 2013)6
Advantages Disadvantages
DNA is inexpensive when compared to isolated
proteins or organisms used for conventional
vaccines
Testing results have been favourable in small
animals, but less impressive in larger animals
(including humans)
DNA vaccines can result in longer lasting
production of the antigenic protein; thereby booster
shots are no longer required
DNA uptake to cells apparently decreases with
increased body size
Produces stronger immune responses than
conventional vaccines
Extended immunostimulation could lead to chronic
inflammation or autoantibody production
Stability of vaccine for storage and shipping Limited to protein immunogens (not useful for non-
protein based antigens such as bacterial
polysaccharides)
Subunit vaccination with no risk for infection Risk of affecting genes controlling cell growth
Ease of development and production -
13
1.1.2 Plasmid Isoforms
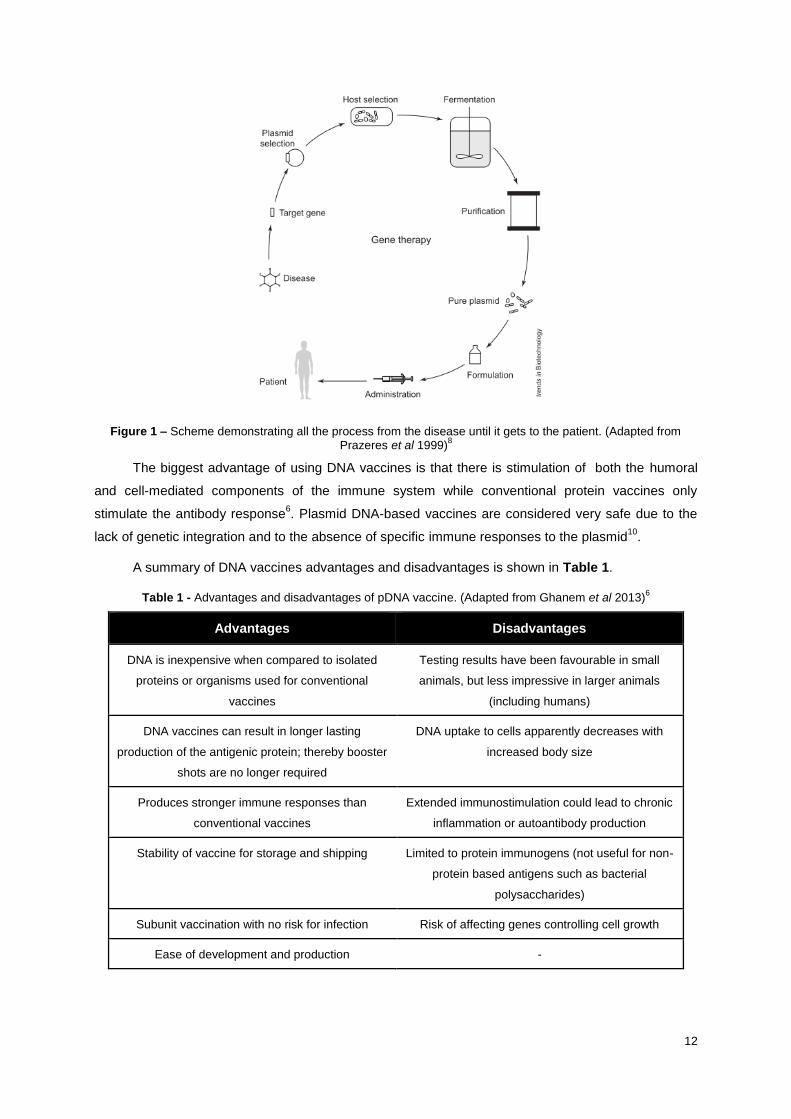
Plasmids are DNA molecules in which the two ends of the DNA strands are covalently linked,
forming a closed loop (Figure 2a). When the circular DNA molecule is under or over wound around
the molecule axis, superhelix structures are formed, namely a higher order structure called
supercoiled DNA (Figure 2b)11
.
Figure 2 – Schematic representation of DNA structure: (a) Linear fragment, closed loop and supercoiled
topologies; (b) Plasmid DNA supercoiling. (Adapted from Ferreira et al 2005)11
Plasmid DNA exists in three topological forms: supercoiled, open circular and linear12
. The
biosynthesis of pDNA by E. coli results in a highly enriched supercoiled DNA extract. This is
considered the most efficient isoform at transferring gene expression. Because of this it is important to
reduce the open circular, linear and even denatured pDNA isoforms through an efficient downstream
processing13
. All these isoforms, which are less effective as delivery vectors compared to sc pDNA,
are produced during cell growth in fermentation and can also arise from damage of supercoiled
pDNA3.
Supercoiled variants are likely to be “nicked” or linearized forming the other two isoforms8. The
open circular and linear forms result from enzymatic or shear-induced breakage of the sugar–
phosphate backbone. Linear results from a single-stranded break in the supercoiled pDNA5,14,15
.
1.1.3 Cell Culture and Fermentation
Plasmids are usually produced in a recombinant E. coli host by fermentation and represent
around 3% (w/w) of the E. coli extract6. Figure 3 illustrates the average composition of E. coli cells.
14
Figure 3 - Average composition of E. coli cells. (Adapted from Ferreira 2005)11
Economic large-scale plasmid production from E. coli requires the optimization of plasmid copy
number and of biomass concentration as it might positively impact the downstream processing and
ultimately purification yields10
. The low pDNA concentration in the E. coli cell and the need to remove
large quantities of cellular debris, proteins, genomic DNA and endotoxins drive the genetic and
process strategies. For example, establishing efficient expression vectors and host-strain systems are
capable of increase the yield of the supercoiled pDNA and improve its downstream recovery and
purification3. In fermentation the main goal is to maximize the amount of supercoiled DNA that is made
and also maximize the purity at harvest. Normally, optimal purity corresponds to maximizing the
average supercoiled-plasmid copy number. Fundamental fermentation improvements often result from
genetic manipulation, being that normally the primary mechanism for certifying that E. coli cells retain
the plasmid is by growing the organisms under a selective pressure in the presence of an antibiotic for
which the plasmid contains a resistance gene14
. Strategies aimed at increasing plasmid amplification
in fermentation include the use of temperature shock, addition of chloroamphenicol and amino acid
starvation. While temperature shock is achievable on a small scale, it may be difficult to implement at
a large scale because of the time necessary to go from one temperature to another in a conventional
fermenter. These approaches have been used to provide plasmid yields that are normally acceptable
from a manufacturing viewpoint3.
1.1.4 Cell Lysis and Clarification
The pDNA extraction from E.coli cells is the major problem in a pDNA production process. In
the downstream processing the major goal is to eliminate cellular components of the host strain. Most
of the critical contaminants present in the lysate share similar characteristics of pDNA like negative
charge (RNA, gDNA, endotoxins), identical size (gDNA, endotoxins) and hydrophobicity (endotoxins).
However, the number and complexity of the processing steps in extraction, isolation, purification and
formulation of pDNA induce a kind of structural stress which can result in damage of the supercoiled
70,0%
6,5%
15,0%
5,0%
1,0% 0,5% 2,0%
Water
RNA
Proteins
gDNA
pDNA
Endotoxins
Others
15
plasmid isoform molecules. The current purification processes for pDNA includes several unit
operations after the fermentation step. These contain cell harvest, lysis, cell debris/solid separation,
precipitation, adsorption, buffer exchange and polishing/clarification and concentration steps prior to
attaining suitable for therapeutic use6.
This process starts with the recovery of cells from the broth by a step of centrifugation or
microfiltration. The next step in the downstream processing of pDNA is cell lysis, tipically an alkaline
lysis, so that all the intracellular components, including plasmid DNA, RNA, gDNA, endotoxins and
proteins, are released. This process is critical to recover large amounts of intact supercoiled pDNA in
order to obtain high overall process yields9,16
. Cells are then ressuspended and concentrated in a
appropriated buffer containing agents that will disrupt ionic and/or hydrogen bonds between lipids and
proteins3,8
. This will promote the removal of divalent cations from cell wall, outer membrane and
plasma membranes, destabilizing their structure, thus facilitating the lysis and preventing plasmid
degradation8. Following the alkaline-lysis step, a precipitate is formed that contains cell debris,
denatured proteins and nucleic acids. This precipitate must be removed by using a solid–liquid unit
operation like a centrifugation on fixed-angle rotors, which is the most common operation at the
laboratory and preparative scales. However, this type of operation is not suitable for the large-scale
production of plasmid DNA due to the centrifugal acceleration of the liquid entering the centrifuge that
can cause shearing and, consequently, break the precipitated material and DNA molecules. Filtration
is therefore the best operation to use in large-scale production processes9. Evidently, the ideal cell
lysis step would allow for all of the supercoiled pDNA to be selectively removed from the cells while all
the other macromolecular impurities remained inside an intact cell14
.
After the lysis it is necessary to have clarification and concentration steps to remove host
proteins and some host nucleic acids (such as gDNA and RNA) to reduce further the volume of the
process stream and to increase the plasmid mass fraction before chromatography. A major concern in
the clarification is the removal of high molecular weight RNA. The presence of endogenous nucleases
in plasmid preparations at the end of the alkaline-lysis step can be advantageously used to remove
high molecular weight RNA. Although the clarification and concentration steps produce a cleaner and
smaller process stream, there is evidence that these operations can be bypassed, proceeding directly
to processing by chromatography with increases in process yield8,9
.
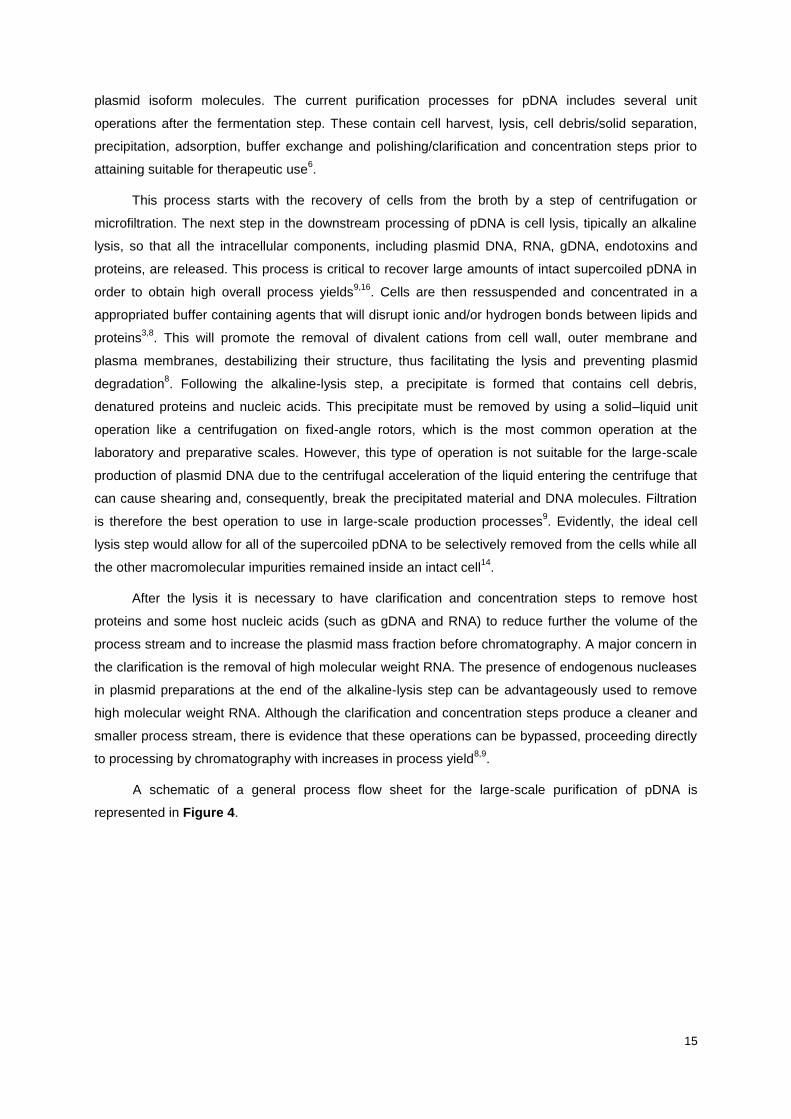
A schematic of a general process flow sheet for the large-scale purification of pDNA is
represented in Figure 4.
16
Figure 4 - Process flow sheet for the large-scale purification of sc pDNA. (Adapted from Ferreira et al 2000)9
1.1.5 Purification by Chromatography
Liquid chromatography is central in the manufacturing of therapeutic pDNA. The overall process
must deliver a pDNA product that meets quality specifications set or recommended by international
regulatory agencies such as the FDA (Food and Drug Administration) and EMA (European Medicines
Agency). Although attempts have been made to include the chromatography step after cell lysis, it is
generally included after the impurity load and the process volume have been reduced by clarification
and concentration operations as it was explained before. The goal of chromatography is then to
remove the cellular host components like RNA, proteins, gDNA fragments, endotoxins and non-
supercoiled pDNA variants, which are virtually impossible to remove by other unit operations5.
Normally chromatography is the method of choice for the large-scale purification of supercoiled pDNA
due to the size and chemical properties of the target nucleic acid molecules (charge and
hydrophobicity), the accessibility of the nucleotide bases to ligands, and the topological constraints
imposed by supercoiling that are exploited via the interaction of nucleic acids with solid supports, with
the objective of selectively isolating and purifying plasmid DNA from impurities9. Taking in account the
properties referred before different types of chromatographic methods, such as size-exclusion (SEC),

17
anion-exchange (AEC), hydrophobic interaction (HIC), affinity (AC), and others have been integrated
into several processes for the manufacture of therapeutic pDNA5.
1.1.5.1 Anion-Exchange Chromatography
Anion-Exchange Chromatography (AEC) is a commonly used method for capture and
purification of pDNA17
. The polyanionic structure of nucleic acids can be explored in this type of
chromatography because the overall charge of nucleic acids depends on the number of bases that
make up the molecules9,11
. The retention of nucleic acids is directly proportional to charge density and
is also affected by nucleotide sequence and conformation11
.
This technique is one of the most widely used for pDNA capture, purification and quantitation
specially because of its rapid separation, no solvent requirement, easy sanitisation with sodium
hydroxide and a wide selection of process-grade stationary phases5. The major limitation of AEC is the
low selectivity of the adsorbents towards pDNA leading to the co-elution of impurities, particularly
endotoxins and high molecular weight RNA11
.
The overall interaction between the pDNA and the stationary phase is based on the local
attraction generated by opposite charges. With this, the isoforms will have different retention time in an
increasing salt gradient. With the increase of salt concentration the DNA molecules elute in the order
of the chain length which is directly related to the number of charged phosphate groups. The
supercoiled pDNA has higher charge density than the less constrained open circular form leading to
stronger electrostatic attractions to the positively charged bound ligand. Consequently, the supercoiled
pDNA will elute later than the open circular pDNA6. Base sequence and composition are also known to
affect the elution pattern of nucleic acids18
.
When using AEC to separate pDNA, the clarified lysate should always be loaded at a
sufficiently high salt concentration (typically >0.5M NaCl) to avoid the adsorption of low charge density
impurities, such as low molecular weight RNA, oligonucleotides and proteins5. Also, the selectivity
towards pDNA-based vaccines or impurities is poor due to their non-specific binding to the anion-
exchange resin stationary phase. Consequently AEC is often used in series with other purification
techniques such as SEC or agarose gel electrophoresis6.
1.1.5.2 Hydrophobic Interaction Chromatography
Hydrophobic Interaction Chromatography (HIC) is a well-established bioseparation
technique19
. The purification of pDNA by HIC takes advantage of the higher hydrophobicity of single
stranded nucleic acids and endotoxins that interact strongly with HIC media than the double stranded
nucleic acids5,11
. These interactions are promoted mainly by van der Waals interactions19
. The pDNA
molecules, which have the hydrophobic bases packed and shielded inside the double helix, tend to
have a minimal hydrophobic interaction with the HIC media. Single stranded nucleic acid impurities
show a higher exposure of the hydrophobic bases, interacting strongly with hydrophobic ligands5. The
hydrophobicity of the amphiphilic endotoxins is attributed to the lipid A portion of the molecule19
.
18
Plasmid DNA can be purified with HIC by loading feed solutions at high concentration of an
adequate salt and as a result performing step or gradient elution with low salt to remove the bound
impurities19
.
In general, to obtain success in HIC chromatography two major elements have to be
considered: the stationary phase and the mobile phase. The stationary phases can vary in the type of
ligand (phenyl, methyl and others), the ligand chain length, ligand density and on the type of matrix or
support. The most widely used ligands for HIC are linear chain alkanes with or without a terminal
amino group20
. The characteristics of the mobile phase, such as type and concentration of the salt,
pH, temperature and additives are also important. The salt type chosen is determinant for the
separation success of HIC19,20
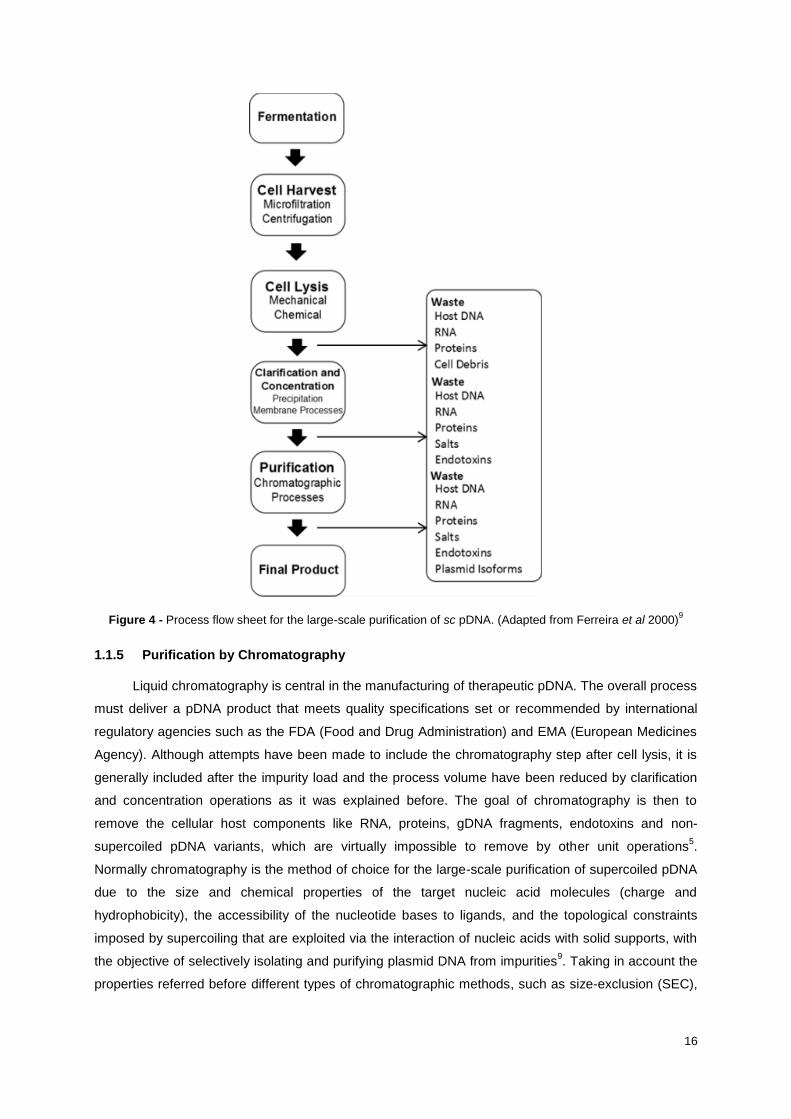
. The interactions between ions and water, and ions and
macromolecules were initially investigated by Hofmeister being that the Hofmeister series orders ions
from strongly hydrated to weakly hydrated, mainly on the basis of their surface charge density and
water affinity (Figure 5)19
. Salts such as sodium, potassium or ammonium sulphate are the most
effective to promote interactions due to the higher ‘salting-out’ effect20
. ‘Salting-out’ is a purification
method that utilizes the reduced solubility of certain molecules in a solution of very high ionic strength
and that can control precipitation by using the different effects of various salts and their respective
concentrations. The salts ability to induce selective precipitation is dependent on many interactions
with the water and solutes.
Figure 5 - The Hofmeister series with anions and cations arranged in terms of their water affinity and according to
their effects on the solubility of macromolecules in aqueous solutions. (Adapted from Freitas et al 2009)19
1.1.5.3 Size-Exclusion Chromatography
Size-exclusion chromatography (SEC) has been extensively used to purify pDNA5. SEC
fractionates and purifies plasmids on the basis of size and can be used alone or in sequence with
other steps, like AEC6,11
. This technique is ideal as a polishing step to remove residual contaminants
with simultaneous buffer exchange into an adequate formulation or storage buffer6.
The first experiments that used SEC for pDNA purification did not yield significant results due
to the lack of stationary phases adequate for the separation of nucleic acids with high molecular mass
and complex conformations. The introduction of other stationary phases changed this situation5. One
example is using Sephacryl S1000. This stationary phase works outstandingly well in the removal of
19
endotoxins, RNA and proteins and can be used as a single chromatographic step when purifying small
amounts of pDNA. This happens because Sephacryl S1000 is a simple, inexpensive and reproducible
matrix for pDNA purification5,9
.
In SEC the reduction of the plasmid hydrodynamic radius due to supercoiling is the basis for
the selective separation from different DNA molecules. Typically, gDNA is excluded eluting as the
peak leading edge, followed by the relaxed and then the supercoiled pDNA conformations. The
smaller molecules are easily separated from the leading DNA peak11
.
The main drawback is that SEC has a limited capacity (requires low volume streams with low
amounts of impurities) and selectivity for pDNA and therefore is not suitable as an initial pDNA
purification step11
. As so, SEC is commonly used in combination with other chromatographic
techniques as a final polishing step.
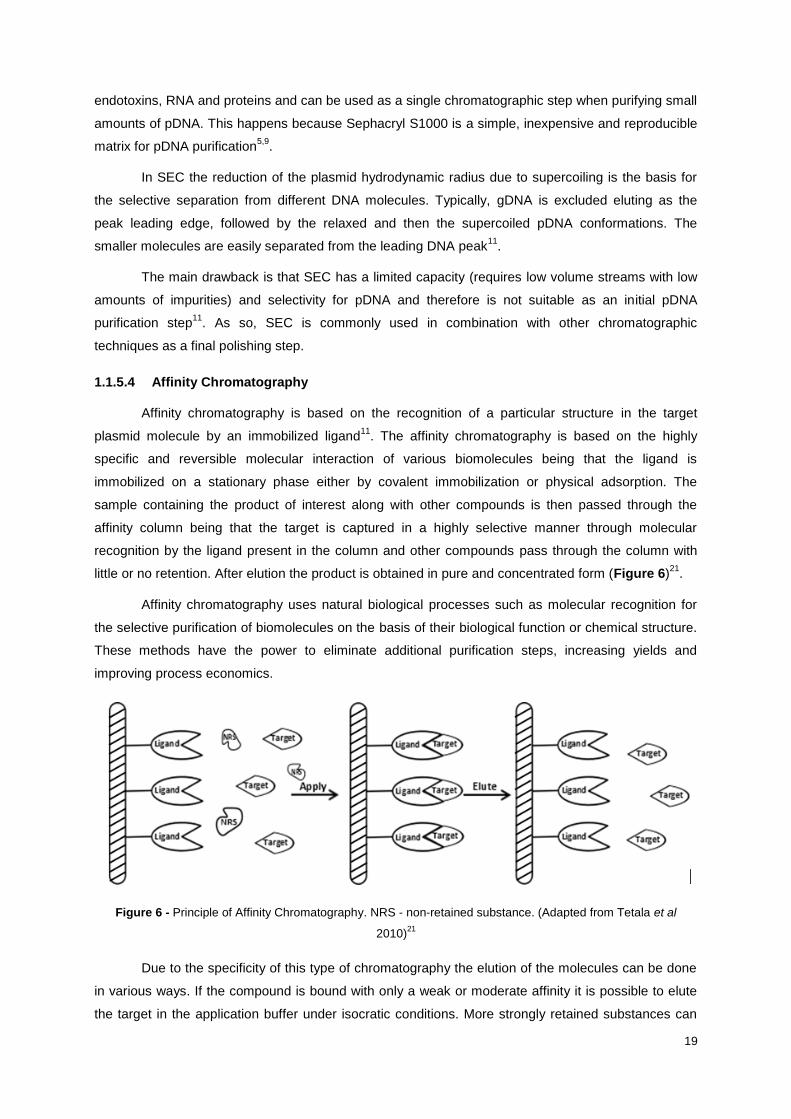
1.1.5.4 Affinity Chromatography
Affinity chromatography is based on the recognition of a particular structure in the target
plasmid molecule by an immobilized ligand11
. The affinity chromatography is based on the highly
specific and reversible molecular interaction of various biomolecules being that the ligand is
immobilized on a stationary phase either by covalent immobilization or physical adsorption. The
sample containing the product of interest along with other compounds is then passed through the
affinity column being that the target is captured in a highly selective manner through molecular
recognition by the ligand present in the column and other compounds pass through the column with
little or no retention. After elution the product is obtained in pure and concentrated form (Figure 6)21
.
Affinity chromatography uses natural biological processes such as molecular recognition for
the selective purification of biomolecules on the basis of their biological function or chemical structure.
These methods have the power to eliminate additional purification steps, increasing yields and
improving process economics.
Figure 6 - Principle of Affinity Chromatography. NRS - non-retained substance. (Adapted from Tetala et al
2010)21
Due to the specificity of this type of chromatography the elution of the molecules can be done
in various ways. If the compound is bound with only a weak or moderate affinity it is possible to elute
the target in the application buffer under isocratic conditions. More strongly retained substances can

20
be eluted by changing the mobile phase or column conditions. This approach is known as nonspecific
elution. A more selective elution technique known as biospecific elution can also be used. In this case
a competing agent is added so that can bind either the retained target or immobilized ligand. The
binding of this competing agent is used to prevent interactions of the target with the ligand which, in
turn, causes the target be released to the mobile phase and elute22
. These procedures are
schematically represented in Figure 7.
Figure 7 - General procedures for applying and eluting solutes from affinity columns. (Adapted from Mallik and
Hage 2006)22
The affinity ligand can consist of a wide variety of binding agents, like proteins, antibodies, etc,
and is immobilized within a column and used to selectively bind a given target or group of targets
within a sample. Because of the highly selective nature of many affinity ligands, it’s possible to isolate,
measure, or study specific targets even when they are present in complex biological samples. The
immobilized ligand is an important factor that determines the success of an affinity chromatographic
method and the type of ligand chosen can divide affinity chromatography into several categories23
.
One type of affinity chromatography that can be used for pDNA purification is the Immobilized
Metal Affinity Chromatography (IMAC). IMAC harnesses affinity interactions between metal ions
and target molecules, enabling high-efficiency separation of the target molecules from other
components present in a mixture. It has been reported that IMAC exhibited potential for removal of
21
denatured DNA and RNA from the alkaline cell lysate which bind to the IMAC column whereas the
pDNA is not retained5,6
.
Another type of affinity chromatography for pDNA purification is the Triple-helix Affinity
Chromatography (THAC). This technique is based on the formation of a triplex between an
oligonucleotide covalently linked to a chromatographic matrix, and a specific duplex sequence in the
target pDNA. The available oligonucleotides are covalently linked to the chromatographic matrix within
the stationary phase6.The best characterised triplex forms when a homopyrimidine oligonucleotide
strand binds to the major groove of a homopurine–homopyrimidine duplex DNA through the formation
of Hoogsteen hydrogen bonds between thymine (T) and adenine (A) to form TA- T triplexes, and
protonated cytosine (C+) specifically recognizing guanine (G) to form CG-C+ triplexes. These triple-
helices are only stable at acidic pH5,6
. The target DNA is then captured via an intermolecular triplex
formation with a biotinylated oligonucleotide and recovered as dsDNA when the phase is washed with
a mild alkaline buffer to destabilize the Hoogsteen H-bonds.
However, so far chromatographic operations based on affinity interactions between pDNA or
impurities with specific ligands have not been used extensively for pDNA purification5. One reason
may be the lack of effective affinity ligands with high selectivity, capacity and durability.
1.2 Affinity Ligands
Affinity technology exploits the natural specific recognition phenomena between two biological
entities forming a complex. These interactions are reversible non-covalent interactions. This
technology exploits not only the natural specific recognition phenomena but also the predictive and
rational character of the binding between the targets to purify and a complementary ligand24
. Though
most of the ligands have a natural origin, in the last decades (non-biological) ligands became viable
and safer alternatives to purify different biologic targets.
1.2.1 Biological Ligands
Most of the existing ligands, such as peptides, oligonucleotides, antibodies, and receptor
proteins are from natural sources that they aim to imitate25,26
. These ligands display high selectivity
and specificity, but suffer from high costs of production and purification, low binding capacities, limited
life cycles and low scale-up potential25,27
. Normally, these ligands require purification in due to the
possibility of contamination with host DNA and viruses. Conventional sterilization and cleaning-in-
place schedules, which are central to any production process for a biologic, cause degradation of the
immobilized ligand, leading to the shortening of the column life. They also can contaminate the final
product due to potentially toxic or immunogenic leachates. These factors have contributed to the
widespread perception that affinity chromatography based upon biological ligands has serious
drawbacks application in the large-scale purification of biopharmaceuticals25
.
1.2.2 Synthetic Affinity Ligands
Synthetic affinity ligands can circumvent the drawbacks of natural ligands by imparting
resistance to chemical and biochemical degradation and displaying ease and low cost of production27
.
22
These ligands have been well established over many decades of use and can be metal chelate and
thiophilic ligands, for example. Different synthetic affinity adsorbents are nowadays durable and
readily up-scaled25,26,28
. Additional advantages of synthetic ligands are the easy in situ sterilization at
large-scale production and the lower toxicity and immunogenicity.
The acceptance of synthetic ligands for use in large-scale chromatography led to the
development of ligands that combined the selectivity of natural ligands with the high capacity,
durability and cost-effectiveness of the synthetic systems. These ligands were designated as the
biomimetic ligands25
.
1.2.3 Biomimetic Ligands
The concept of ‘biomimetic ligands’ was introduced as an upgrade of textile dyes that were
designed to mimic the structure and binding of natural ligands24
. Some of the best known biomimetic
ligands are these textile dyes, such as Cibacron blue F3G-A, that where developed 30 years ago. A
big part of these ligands possess a triazine scaffold that is substituted with polyaromatic ring systems
solubilised with sulphonate or carboxylate functions and then decorated with electron withdrawing or
donating groups. Such triazine dyes are low-cost commodity chemicals that are easily synthesized
and immobilized onto solid phases generating high capacity adsorbents. The immobilized ligands
mimic the binding of natural anionic heterocyclic substrates such as nucleic acids, nucleotides,
coenzymes and vitamins to proteins. These ligands have a number of advantages over the use of
natural ligands making them commonly used in the research market to purify proteins like albumin,
nucleases, hydrolases, among others. However, there are some concerns over the selectivity, purity,
leakage and toxicity of the dyes limiting their use for the purification of pharmaceuticals. The need to
improve the selectivity, purity and reproducibility of these ligands led to rational molecular design
techniques25,26
.
The developments that occurred in computational technology, combinatorial synthesis and
high-throughput screening techniques allowed the extension of this concept to synthetic biomimetic
dyes and triazine non-dye ligands (de novo designed ligands), but also peptides and minimized
protein domains. The availability of crystallographic structures of proteins and complexes, together
with computer-based molecular modeling techniques, allowed the design of synthetic protein-mimic
affinity ligands. Such ligands display improved their characteristics over their natural counterparts due
to the inclusion of chemically defined and characterized groups which are easy to synthesize. They
have moderate to high specificity to the complementary targets, the which enables the use of mild
elution conditions, higher stability/resistance to sterilization and cleaning-in-place procedures,
providing higher yields of ligand utilization and lower costs and higher scalability of the processes24
.
Interactions between proteins and nucleic acids are crucial for the understanding of numerous
biological mechanisms and can be understood by atomic interactions between amino acids and
nucleotides29
. Affinity chromatography using amino acids as ligand molecules has already been used,
in the purification of plasmid DNA. Some studies using histidine, arginine and lysine as affinity ligands
were capable of purifying pDNA with sequence specificity30–32
. The atoms present in each nucleic acid
23
base allow the interaction with amino acid structures, due to the difference between nucleic acids and
between amino acids leading to a wide variety of combinations used to purify specific sequences.
Another important aspect is that some amino acids bind not only to one nucleic acid base, but to a
specific sequence, forming complexes. Not only the bases of the DNA influence binding, but also the
backbone itself can help in DNA-amino acid interactions having a stabilization effect29
.
These features of amino acid-DNA interactions can be advantageous to perform affinity
chromatography using amino acids. However the use of amino acids in this kind of process may be
expensive so the use of molecules that can mimic the properties of specific amino acids or peptides
can be of great advantage26
. As so, the use of amino acid/protein-mimic ligands might be a good
choice to purify pDNA.
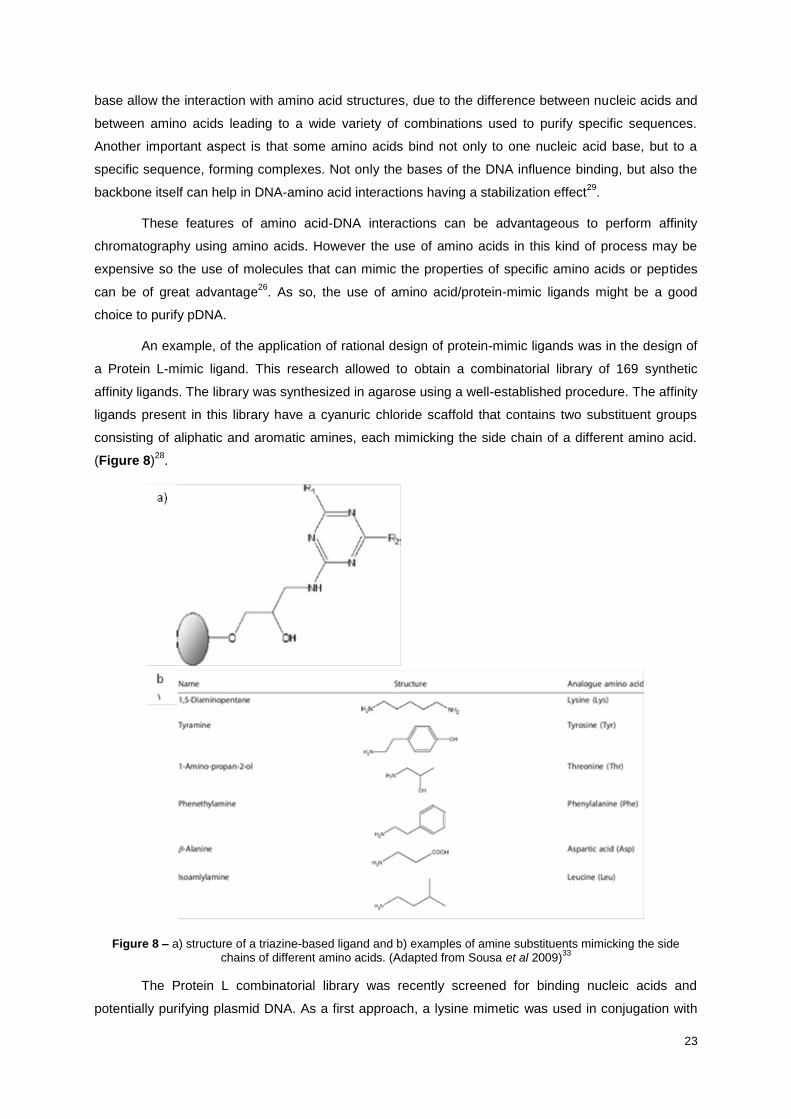
An example, of the application of rational design of protein-mimic ligands was in the design of
a Protein L-mimic ligand. This research allowed to obtain a combinatorial library of 169 synthetic
affinity ligands. The library was synthesized in agarose using a well-established procedure. The affinity
ligands present in this library have a cyanuric chloride scaffold that contains two substituent groups
consisting of aliphatic and aromatic amines, each mimicking the side chain of a different amino acid.
(Figure 8)28
.
Figure 8 – a) structure of a triazine-based ligand and b) examples of amine substituents mimicking the side chains of different amino acids. (Adapted from Sousa et al 2009)
33
The Protein L combinatorial library was recently screened for binding nucleic acids and
potentially purifying plasmid DNA. As a first approach, a lysine mimetic was used in conjugation with
24
the other amino substituents to test if it would improve the binding ability towards nucleic acids. It was
proven that the synthetic mimic of lysine (1,5-diaminopentane) exhibited the same behavior as the
natural amino acid. Besides the lysine mimic, various amino acid analogues exhibited high binding
capacity towards pDNA34
.
The preliminary screening results have shown that the synthetic affinity ligand library could be
used for molecular recognition of nucleotides and, particularly, pDNA. Four ligands were selected as
leads to be further assessed for the purification of plasmid DNA from E.coli crude extracts, in either
hydrophobic or hydrophilic conditions. In the present work, one of these ligands was used for pDNA
purification.
1.3 Monoliths as Chromatographic Matrices for Affinity
Chromatography
Monoliths are supports that consist of a single, continuous piece of a porous material that is
synthesized to form a homogeneous column and that are prepared in various dimensions with
agglomeration-type or fibrous microstructures21,22
. They are prepared from monomeric precursors,
which form a skeleton with interconnected pores upon polymerization in a solvent mixture35
. These
solvents are now known as porogens and the final pore structure of the monolith is highly dependent
on the porogens used during its formation. When these solvents are removed, what remains is a
series of interconnected pores that provide routes (channels) for solvent flow through the monolith22
.
The pores in monolithic materials are classified into two types: macropores (that have diameters larger
than 50 nm) and mesopores/micropores (pore diameters in the range of 2–50 nm).These materials
can be categorized into ‘‘organic’’ and ‘‘inorganic’’, depending on the materials they are made from 21
.
Monoliths can be made in various forms and prepared inside columns, capillaries, or microfluidic
devices. Their low back-pressures allows their use at high flow rates enabling fast separations and
short analysis times and also allow rapid mass transfer to occur, helping to decrease band broadening
and providing efficient separations in work with affinity ligands. Another advantage of monoliths is that
there are various reaction schemes that can be used for their modification which is valuable when
adapting monoliths for use with a wide range of affinity ligands. All these reasons led to the growing
interest in these chromatographic matrices22
.
A variety of monoliths that have been reported for use in affinity chromatography are described
with more detail in the following sections.
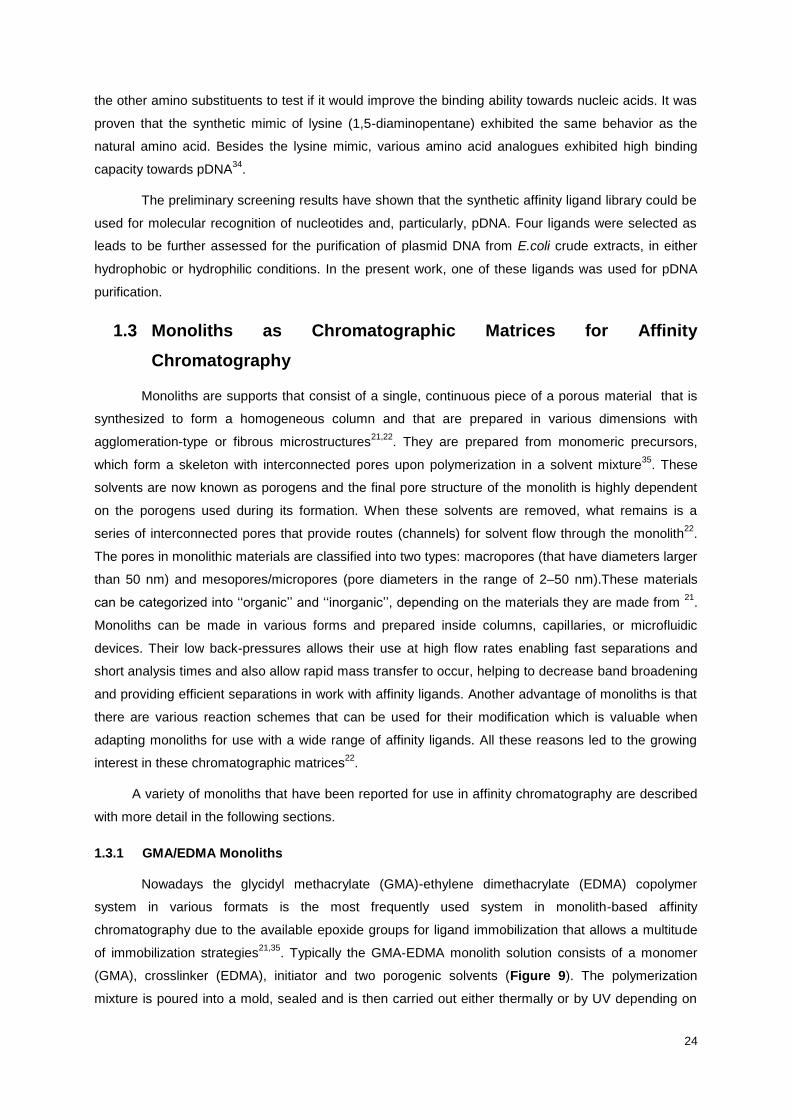
1.3.1 GMA/EDMA Monoliths
Nowadays the glycidyl methacrylate (GMA)-ethylene dimethacrylate (EDMA) copolymer
system in various formats is the most frequently used system in monolith-based affinity
chromatography due to the available epoxide groups for ligand immobilization that allows a multitude
of immobilization strategies21,35
. Typically the GMA-EDMA monolith solution consists of a monomer
(GMA), crosslinker (EDMA), initiator and two porogenic solvents (Figure 9). The polymerization
mixture is poured into a mold, sealed and is then carried out either thermally or by UV depending on
25
the initiator present in the mixture. After polymerization, the seals are removed and frits are inserted
on both ends of the monolithic columns to avoid any leakage of the monolith21
. The final monolith with
epoxide functionality can be used directly for ligand (with amino group) immobilization. The ligands
can be attached via different spacers or the epoxy groups can be converted into a diol form under
acidic conditions. This diol group can be used as a precursor for various ligand coupling methods 21,22
.
Figure 9 - Formation of a copolymer of GMA with EDMA (Adapted from Mallik et al 2006)22
One advantage of using a GMA/EDMA monolith with affinity ligands is the fact that the GMA
monomer contains epoxy groups that can be used directly for covalent immobilization or as precursors
for other coupling methods. Additionally, the diol groups that can be generated on this material tend to
give a support a low nonspecific binding for many biological agents. They are also relatively easy to
prepare and have the ability to be made with a variety of surface areas and pore sizes that can be
controlled by varying the composition of the porogen. Other factors that can be varied are the
monomer-to-crosslinker ratio, the amount of each reagent and porogen, and the polymerization time,
among other items that can be used to optimize the total amount of an affinity ligand that can be
placed onto such supports. On the other hand, GMA/EDMA monoliths do tend to have low surface
areas when compared to particulate silica supports or silica monoliths, limiting the total amount of
ligand that can be immobilized onto this material and which might hamper separation efficiency. This
can be circumvented by embedding of particles or nanoparticles into the monolithic support 22,35
.
1.3.1.1 CIM® Monolithic Columns
CIM® monolithic columns, produced by BIA Separations, are a single homogeneous piece with
highly interconnected porous that can be prepared in various dimensions. These continuous stationary
phases have a matrix composed of methacrylate polymers36
.
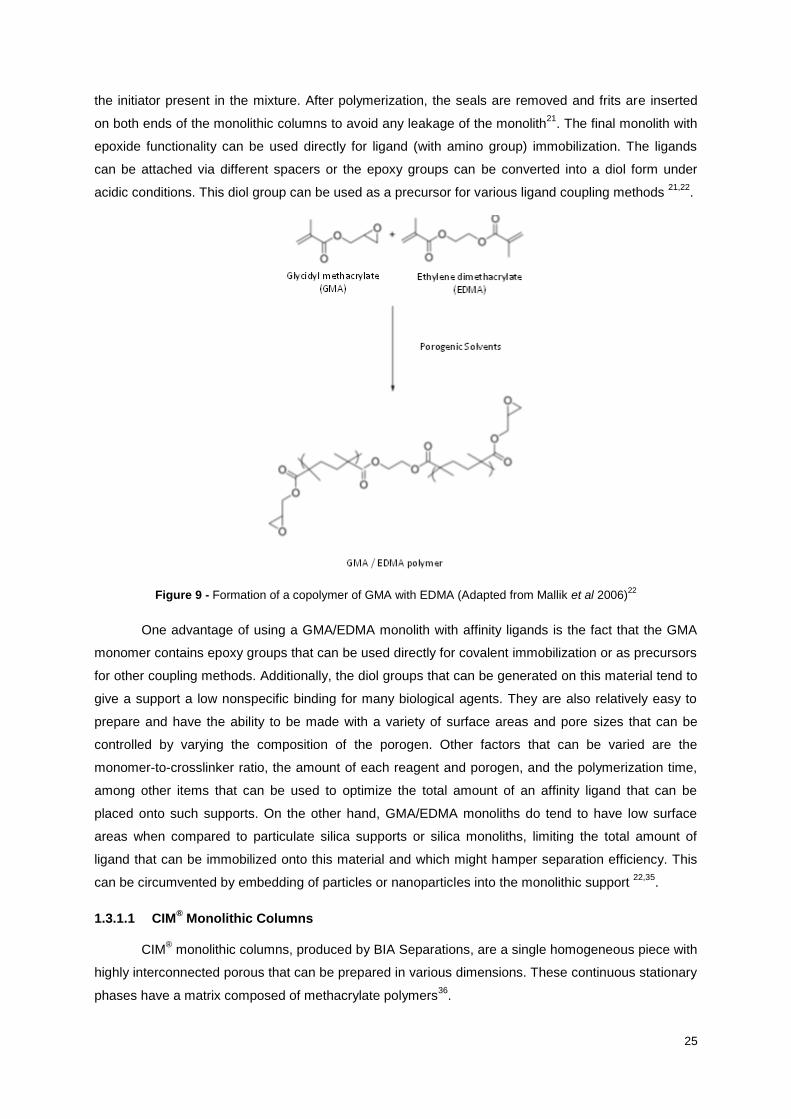
26
CIM®
monoliths are an innovative product but are already established to be a chromatographic
media useful for biomolecules purification at any scale. These monoliths have the advantage of
operating at flow rates up to 10 times when compared to particle based supports leading to the
decrease of the time and cost of the purification process. Another advantage is the pore size that can
be adjusted to accommodate large molecules like viruses and pDNA, ensuring high binding capacities.
Such monolithic columns are supplied in different chemistries that can be contained in a single column
if necessary36,37
. The different chemistries available are shown in Figure 10.
Figure 10 – Different chemistries available in the CIM® monolithic columns
36.
1.3.2 Agarose Monoliths
Agarose in a particulate form has been a popular support for affinity separations for several
decades, so monolith supports made of agarose have also been in use for affinity chromatography.
This type of monolith is prepared by casting an agarose emulsion to generate a monolith with large
pores, with 20–200 µm in diameter. The emulsion is formed by heating a suspension of agarose in
water at 95–100°C and then adding a mixture of cyclohexane and Tween 80 while shaking. This
mixture is then poured into glass columns or forms that are fit with a plug at the bottom and kept in a
water bath at 60°C following by the decrease of the temperature to 20°C, which causes the agarose to
gel into the desired shape. These materials can be activated and used in ligand immobilization by
employing the same reaction schemes that are used for agarose particles. The main difference is that
activation of the agarose and ligand immobilization is now performed by circulating the required
solutions through the monolith rather than performing these reactions in a suspension. These
materials have basically the same advantages of traditional agarose supports including their ability to
be used with many ligands, their low nonspecific binding, and their stability over a wide pH range.
However, the large pore diameters cause a relatively low mechanical strength of these materials22
.
1.3.3 Silica Monoliths
Silica monoliths are alternative materials for the polymeric monoliths and exist in two forms for
ligand immobilization: commercially available bare silica and sol–gel entrapment method. In the case
of bare silica there are no reactive functional groups available for ligand immobilization. So, diol
groups can be created on the surface using similar methods as those described for silica particles.
27
Therefore, modification of silanol groups on the surface of the monolithic silica skeleton by silylation
reagents, such as (3-aminopropyl)trimethoxysilane or (3- glycidyloxypropyl)trimethoxysilane, is crucial.
After this activation step, ligands can be immobilized on either diol activated silica or aminopropyl
silica21,35
.
The advantages of these materials include their good efficiencies, mechanical strength and
also their high surface areas, which can be important in affinity methods that require supports with
high ligand densities. Their main disadvantage is that they are difficult to prepare directly in the
laboratory due to their shrinkage after formation. They also have the same limitations as traditional
silica particles in terms of the pH range over which they can be used (typically pH 2–8) in order to
avoid their disintegration21,22,35
. In case of the sol–gel method, the ligand can be entrapped in the
monolith in a single step, keeping the ligand activity unaltered. However, the release of alcoholic
byproducts during polymerization can lead to the denaturation of the ligands. Also, this type of
monoliths generally have limited column diameter21,22
.
1.3.4 Cryogels
Cryogels are emerging as a new class of affinity monolithic stationary phases. They have an
unique property of being hydrophilic and having macropores in the range of 10–100 µm being
relatively large compared with the macropores of GMA-EDMA (1.5 µm) and of silica monoliths (2
µm)21
. The cryogel is prepared by polymerization reactions below –10°C and using monomers
dissolved in an aqueous phase. A mixture of acrylamide, allyl glycidyl ether, and N,N’-methylene bis-
(acrylamide) is normally used to make this polymer, with TEMED and ammonium persulfate being
used as initiators. When the mixture is cooled down to 0 to -12°C there is the formation of ice crystals
forming a porous template upon and around which the polymer is formed. After polymerization, these
ice crystals are allowed to thaw and the resulting water is removed from the monolith (Figure 11). In
this approach ice crystals act as the porogen, with the shape and size of these crystals determining
the shape and size of pores in the final polymer. The main application of these monoliths are in the
purification of blood cells 22
.
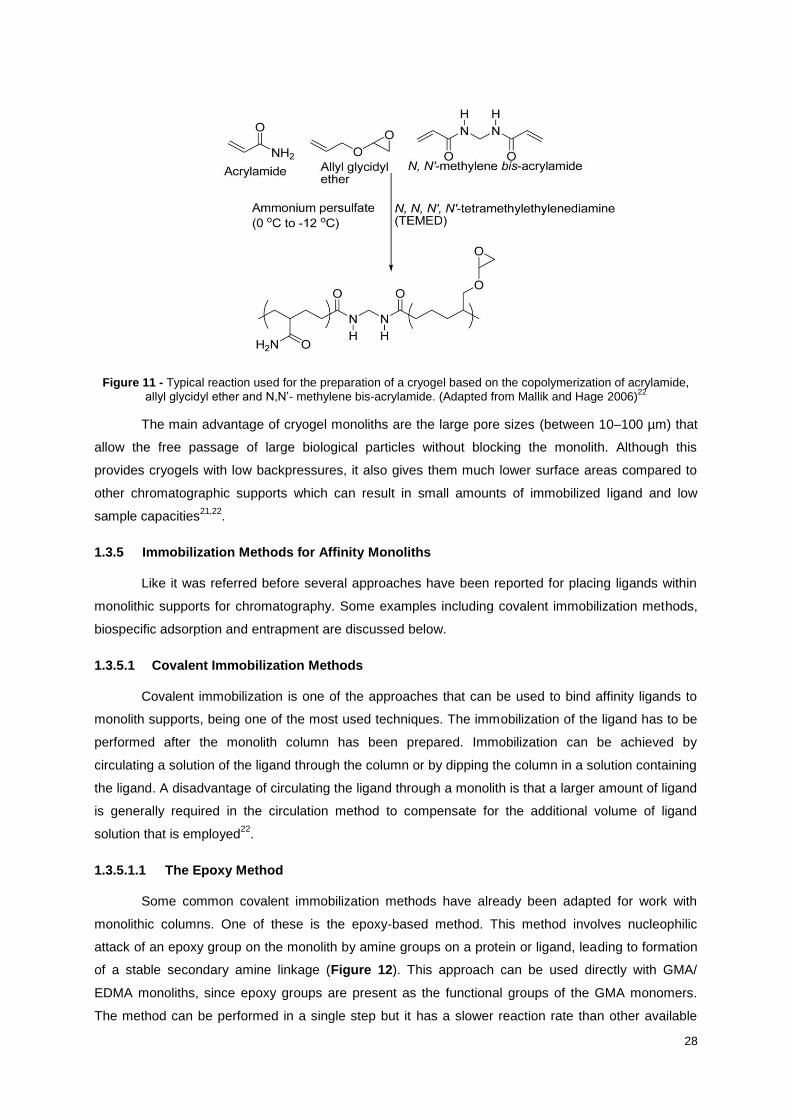
28
Figure 11 - Typical reaction used for the preparation of a cryogel based on the copolymerization of acrylamide,
allyl glycidyl ether and N,N’- methylene bis-acrylamide. (Adapted from Mallik and Hage 2006)22
The main advantage of cryogel monoliths are the large pore sizes (between 10–100 µm) that
allow the free passage of large biological particles without blocking the monolith. Although this
provides cryogels with low backpressures, it also gives them much lower surface areas compared to
other chromatographic supports which can result in small amounts of immobilized ligand and low
sample capacities21,22
.
1.3.5 Immobilization Methods for Affinity Monoliths
Like it was referred before several approaches have been reported for placing ligands within
monolithic supports for chromatography. Some examples including covalent immobilization methods,
biospecific adsorption and entrapment are discussed below.
1.3.5.1 Covalent Immobilization Methods
Covalent immobilization is one of the approaches that can be used to bind affinity ligands to
monolith supports, being one of the most used techniques. The immobilization of the ligand has to be
performed after the monolith column has been prepared. Immobilization can be achieved by
circulating a solution of the ligand through the column or by dipping the column in a solution containing
the ligand. A disadvantage of circulating the ligand through a monolith is that a larger amount of ligand
is generally required in the circulation method to compensate for the additional volume of ligand
solution that is employed22
.
1.3.5.1.1 The Epoxy Method
Some common covalent immobilization methods have already been adapted for work with
monolithic columns. One of these is the epoxy-based method. This method involves nucleophilic
attack of an epoxy group on the monolith by amine groups on a protein or ligand, leading to formation
of a stable secondary amine linkage (Figure 12). This approach can be used directly with GMA/
EDMA monoliths, since epoxy groups are present as the functional groups of the GMA monomers.
The method can be performed in a single step but it has a slower reaction rate than other available
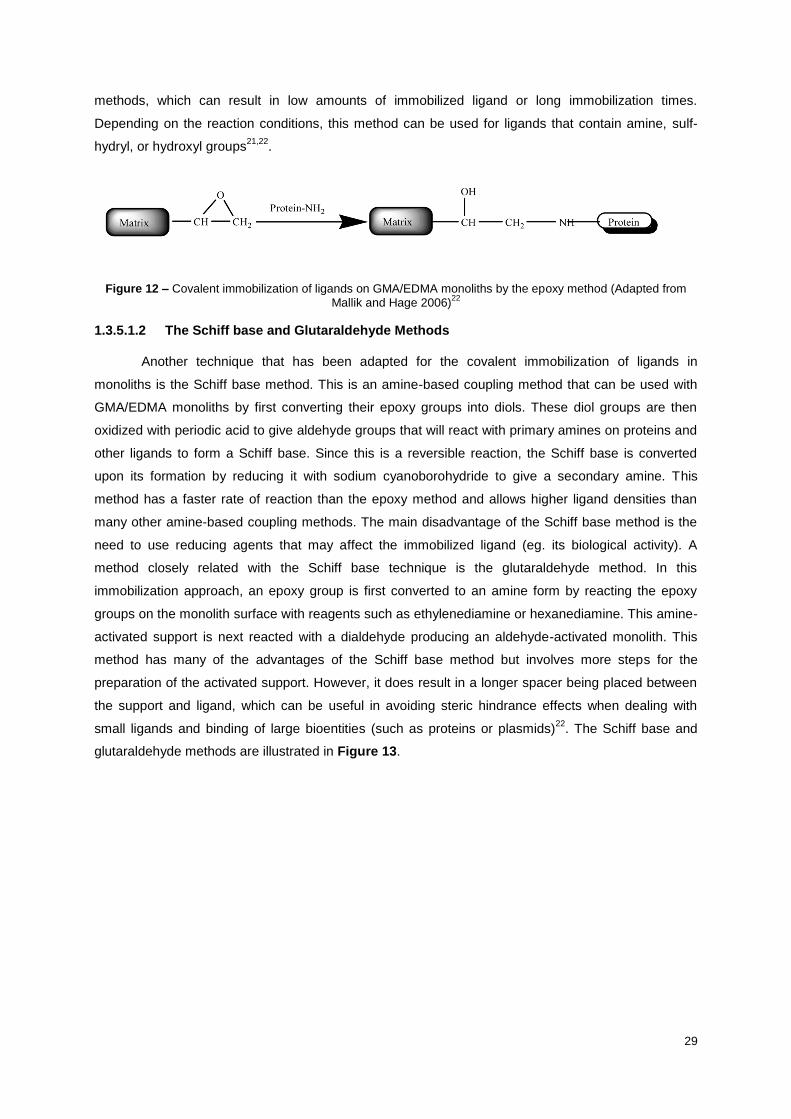
29
methods, which can result in low amounts of immobilized ligand or long immobilization times.
Depending on the reaction conditions, this method can be used for ligands that contain amine, sulf-
hydryl, or hydroxyl groups21,22
.
Figure 12 – Covalent immobilization of ligands on GMA/EDMA monoliths by the epoxy method (Adapted from
Mallik and Hage 2006)22
1.3.5.1.2 The Schiff base and Glutaraldehyde Methods
Another technique that has been adapted for the covalent immobilization of ligands in
monoliths is the Schiff base method. This is an amine-based coupling method that can be used with
GMA/EDMA monoliths by first converting their epoxy groups into diols. These diol groups are then
oxidized with periodic acid to give aldehyde groups that will react with primary amines on proteins and
other ligands to form a Schiff base. Since this is a reversible reaction, the Schiff base is converted
upon its formation by reducing it with sodium cyanoborohydride to give a secondary amine. This
method has a faster rate of reaction than the epoxy method and allows higher ligand densities than
many other amine-based coupling methods. The main disadvantage of the Schiff base method is the
need to use reducing agents that may affect the immobilized ligand (eg. its biological activity). A
method closely related with the Schiff base technique is the glutaraldehyde method. In this
immobilization approach, an epoxy group is first converted to an amine form by reacting the epoxy
groups on the monolith surface with reagents such as ethylenediamine or hexanediamine. This amine-
activated support is next reacted with a dialdehyde producing an aldehyde-activated monolith. This
method has many of the advantages of the Schiff base method but involves more steps for the
preparation of the activated support. However, it does result in a longer spacer being placed between
the support and ligand, which can be useful in avoiding steric hindrance effects when dealing with
small ligands and binding of large bioentities (such as proteins or plasmids)22
. The Schiff base and
glutaraldehyde methods are illustrated in Figure 13.

30
Figure 13 - Covalent immobilization by the a) Schiff base method and the b) glutaraldehyde method (Adapted
from Mallik and Hage 2006)22
1.3.5.1.3 Other Methods
An alternative technique for covalent immobilization of ligands onto monoliths is the
carbonyldiimidazole (CDI) method. This process begins by converting epoxy groups in the monolith
into diol groups. These diols are reacted with 1,1’-carbonyldiimidazole to produce imidazolyl
carbamate groups. This activated support is then used for ligand immobilization by a nucleophilic
substitution that can occur between the activated sites and primary amines of the ligand, resulting in a
stable amide linkage. This method is faster than the epoxy method and involves fewer steps than the
Schiff base or glutaraldehyde methods but gives rise to lower ligand densities than the Schiff base
technique22
.
Covalent immobilization of ligands on monoliths can also be achieved by the disuccinimidyl
carbonate (DSC) method, the hydrazide method and the cyanogen bromide (CNBr) method described
in the literature. The disuccinimidyl carbonate (DSC) method also begins by converting epoxy groups
on a monolith like GMA/EDMA into diol groups. These diol groups are next reacted with DSC to place
succinimidyl carbonate groups on the monoliths surface. The activated form of the monolith is then
reacted with a ligand such as a protein that contains primary amine groups to form a stable carbamate
linkage. This method is fast and has been reported to be complete within 10 hours, however the
stability of activated monolith is low, requiring that proper care be taken to avoid side reactions due to
hydrolysis22
.
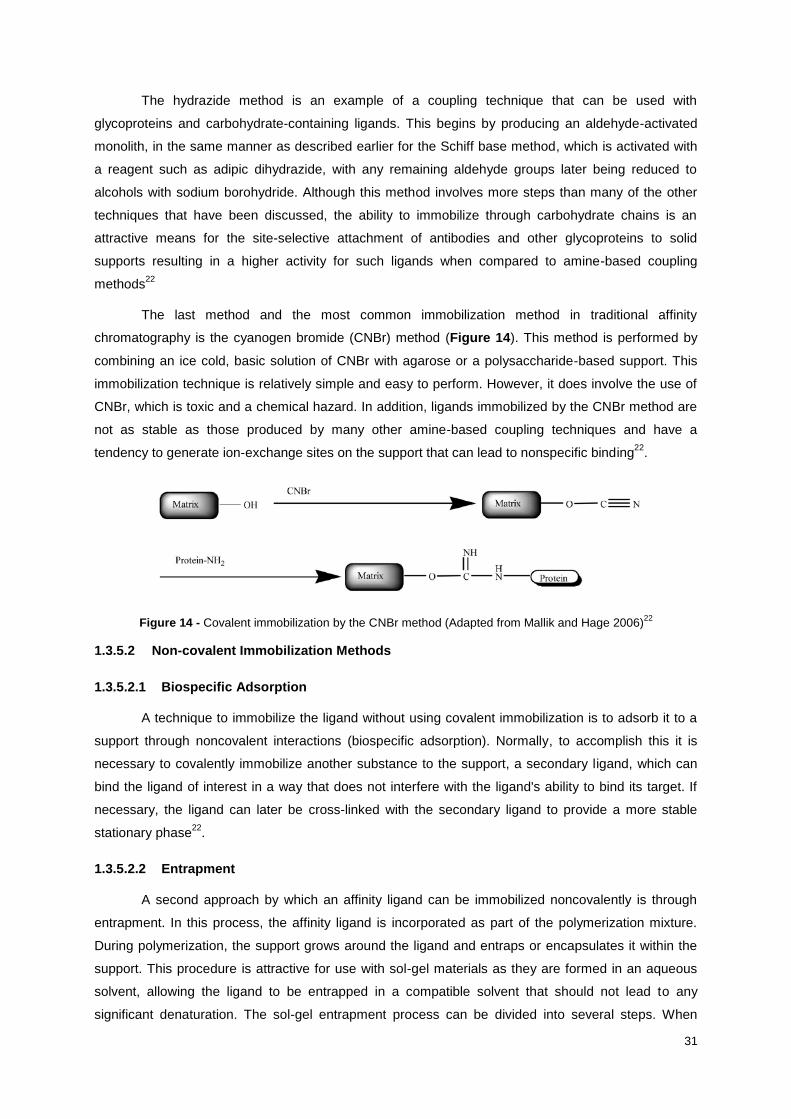
31
The hydrazide method is an example of a coupling technique that can be used with
glycoproteins and carbohydrate-containing ligands. This begins by producing an aldehyde-activated
monolith, in the same manner as described earlier for the Schiff base method, which is activated with
a reagent such as adipic dihydrazide, with any remaining aldehyde groups later being reduced to
alcohols with sodium borohydride. Although this method involves more steps than many of the other
techniques that have been discussed, the ability to immobilize through carbohydrate chains is an
attractive means for the site-selective attachment of antibodies and other glycoproteins to solid
supports resulting in a higher activity for such ligands when compared to amine-based coupling
methods22
The last method and the most common immobilization method in traditional affinity
chromatography is the cyanogen bromide (CNBr) method (Figure 14). This method is performed by
combining an ice cold, basic solution of CNBr with agarose or a polysaccharide-based support. This
immobilization technique is relatively simple and easy to perform. However, it does involve the use of
CNBr, which is toxic and a chemical hazard. In addition, ligands immobilized by the CNBr method are
not as stable as those produced by many other amine-based coupling techniques and have a
tendency to generate ion-exchange sites on the support that can lead to nonspecific binding22
.
Figure 14 - Covalent immobilization by the CNBr method (Adapted from Mallik and Hage 2006)22
1.3.5.2 Non-covalent Immobilization Methods
1.3.5.2.1 Biospecific Adsorption
A technique to immobilize the ligand without using covalent immobilization is to adsorb it to a
support through noncovalent interactions (biospecific adsorption). Normally, to accomplish this it is
necessary to covalently immobilize another substance to the support, a secondary ligand, which can
bind the ligand of interest in a way that does not interfere with the ligand's ability to bind its target. If
necessary, the ligand can later be cross-linked with the secondary ligand to provide a more stable
stationary phase22
.
1.3.5.2.2 Entrapment
A second approach by which an affinity ligand can be immobilized noncovalently is through
entrapment. In this process, the affinity ligand is incorporated as part of the polymerization mixture.
During polymerization, the support grows around the ligand and entraps or encapsulates it within the
support. This procedure is attractive for use with sol-gel materials as they are formed in an aqueous
solvent, allowing the ligand to be entrapped in a compatible solvent that should not lead to any
significant denaturation. The sol-gel entrapment process can be divided into several steps. When

32
working with silicates, the process involves hydrolysis of alkoxysilanes, followed by condensation of
hydrated silica to form siloxane bonds. Next, there is polycondensation of the additional silanol groups
to form cyclic oligomers. During the growing of the silica network the ligand gets entrapped. The main
advantage of this technique is that all recognition sites of the ligand will remain accessible and active if
appropriate conditions for sol-gel formation are selected. However, there are some difficulties
associated with controlling the pore size of the resulting support, the high degree of shrinkage of the
sol-gels, and the loss of protein activity that can occur if improper silanes are used for sol-gel
formation21,22
.
2. Material and Methods
2.1 Cell Culture
2.1.1 Pre-inoculum and inoculum
The plasmid pVAX1-LacZ, with 6050 bp, was used with Escherichia coli DH5α (Invitrogen) as
host cells. The cells where stored in autoclaved 20%(v/v) glycerol at -80°C. Then, to start the cell
culture, the pre-inoculum was grown in 100 ml shake flasks with 30 ml of LB (Luria Bertani from Sigma
Aldrich) and 30µL of 30µg/ml kanamycin. The growth was performed overnight at 37°C and 250 rpm in
an orbital shaker (AGITORB 200) until an optical density of at least 1(at 600nm) was obtained, so that
exponential growth was guaranteed upon cell collection. After this the inoculum was performed. The
first thing to do was to determine the volume of pre-inoculum necessary to start the inoculums with an
O.D. equal to 0.2 at 600 nm. To do this it was necessary to use Equation 1, where O.D.i and O.D.f
correspond respectively to the O.D. from the pre-inoculum (which is the initial O.D.) and the O.D.
required for the inoculum, which is 0.2; Vi a Vf are the volume of pre-inoculum necessary to start the
inoculum and the volume of inoculums, respectively.
𝑂𝐷𝑖 × 𝑉𝑖 = 𝑂𝐷𝑓 × 𝑉𝑓 (1)
The inoculum was grown in 2000 ml Erlenmeyers with 250 ml LB medium previously autoclaved
and 250 µL of 30µg/ml kanamycin. The cells were grown until an O.D. at 600 nm of around 3 was
obtained, which indicated that stationary phase was reached. The cells were then harvested by
centrifugation at 6000xg for 15 minutes, at 4°C, with a SLA 3000 rotor in a Sorvall RC6 centrifuge. The
supernatant was discarded and the pellet was then used for the alkaline lysis. If the alkaline lysis was
not performed right after the centrifugation the pellet was stored at 4°C for further processing7.
For comparative studies in the chromatographic assays, plasmids pCEP4 (Invitrogen) and
pVAX1TSAGFP, with 10410 and 5112 bp, respectively were also used. These plasmids had E. coli
DH5α as host cells and their growth was promoted in the same way as explained before with the
exception of the antibiotic used in pCEP4 that was ampicillin.
33
2.1.2 Cell lysis and Plasmid Primary Isolation
The recovered pellet was then suspended in a volume of P1 solution (50 mM glucose, 25 mM
Tris-HCl pH 8.0, 10 mM EDTA pH 8.0) determined by using Equation 2. To ressuspend the cells a
vortex was used. After this the total volume of solution was passed to two smaller centrifuge tubes (45
ml). In these tubes solution P2 (0.2 M NaOH, 1% (m/v) SDS) was added. The volume necessary of P2
was half the volume of solution P1. The addition of this solution was necessary to start the alkaline
lysis. This was followed by gentle homogenization and rest at room temperature for 10 min. To stop
the lysis solution P3 (5M potassium acetate, 6.8 M glacial acetic acid) was used in the same volume of
P2. This was followed by gentle homogenization and rest on ice for 10 min. The resulting suspension
was then centrifuged in a SS-34 rotor for 30 minutes at 20000xg and 4°C in a Sorvall RC6 centrifuge.
This centrifugation was performed to remove proteins, precipitated gDNA and cell debris. The
supernatant was recovered and centrifuged again in the same conditions. The lysate was then stored
at -20°C or the primary isolation was performed right after this step.
VP1 =O.D.×Inoculum Volume
60 (2)
The first step of the primary isolation was the addition of 99.6% (v/v) isopropanol to the
alkaline lysate. A volume corresponding to 70% of the lysate total volume was added7. The mixture
was then gently mixed and left at -20°C at least 2 hours. In this step all the nucleic acids present in the
lysate are precipitated to promote their recovery. The mixture was the centrifuged in the SS-34 rotor
using the same settings as in the cell lysis. The supernatant was discharged and the tubes with the
resulting pellet were inverted on the top of absorbent paper to remove the remaining isopropanol. After
this, 500 µL of Tris-HCl 20 mM pH 8.0 was added to each tube and the pellet was ressuspended.
The clarification of the lysate was then performed by adding 0.165g of ammonium sulphate
right before the injection in a column for the chromatographic assays7. This step was necessary to
remove traces of impurities left in the lysate such as proteins and high molecular weight RNA. The
mixture was homogenized and left on ice for 15 minutes followed by centrifugation for 30 minutes at
20000xg and at 4°C. The supernatant was then transferred to new eppendorf tubes and stored at -
20°C until future processing.
2.2 Desalinization of a clarified E. coli lysate
To promote the hydrophilic environment necessary for some binding assays it was necessary
to proceed to the desalinization of the clarified E. coli lysate. The protocol applied followed the
manufacturer’s instructions. Amicon Ultra-0.5 mL Centrifugal Filters for DNA purification and
concentration were used with a 3K filter in which molecules smaller than 3000 Da, like the salt
particles, are filtered and exit the main solution while the nucleic acids are retained.
Samples of 1 ml of clarified lysate were divided into two aliquots of 500μl and each one was
transferred to a 3K filter. The two eppendorfs were centrifuged (Eppendorf centrifuge 5417R) at room
temperature for 20 min at 14000xg. The content of the eppendorf was discarded and the volume of

34
sample contained in the filter was passed to a new eppendorf followed by the addition of 800μl of
20mM Tris-HCl pH 8.0.
2.3 Synthesis of triazine-based adsorbents in Sepharose CL-6B
The synthesis of triazine-based ligands was performed in Sepharose CL-6B using a well-
established described methodology38
.
2.3.1 Epoxy activation of Sepharose CL-6B
The epoxy activation was performed according to a method described previously39
. The first
step was to wash the Sepharose CL-6B on a sinter funnel with distilled water to remove the ethanol
solution used to store the gel. The gel was then suspended in 0.8 ml of 1M NaOH per gram of moist
gel and 0.1 ml of epichlorohydrin was added per gram of gel. The mixture was incubated overnight
with gentle agitation in an orbital agitator AGITORB 200 with a 170rpm agitation,at 30°C. The
activated gel was washed thoroughly with distilled water and used for the amination step.
2.3.2 Amination of previously epoxy-activated Sepharose CL-6B
The epoxy-activated agarose was aminated according to a protocol previously described28
.
The epoxy-activated gel was suspended in 1.5 ml of ammonia per gram of moist gel. The slurry was
incubated overnight with gentle agitation in an orbital agitator AGITORB 200, at 30°C. The aminated
gel was then washed with distilled water to remove the remaining ammonia. Washing was performed
until the pH decreased to the pH of distilled water and no ammonia odour could be detected. The
aminated support was either used immediatly for activation with cyanuric chloride or stored in 20%
(v/v) ethanol at 0-4°C.
2.3.2.1 Determination of primary amine groups in Sepharose beads
The density of the primary amine groups on the aminated gel was determined with a 2,4,6-
trinitrobenzenesulphonic acid (TNBS) based method40
. This method is based on the reaction of the
matrix with an excess of TNBS and the spectrophotometric analysis of the remaining TNBS by
reaction with glycine, after the removal of the solid phase. The first step is the addition of 4.5 ml of
0.1M sodium tetraborate (Na2B4O7) and 0.5 ml of 0.01 M TNBS to an amount of aminated gel
containing not more than 2-2.5 µmol of amino groups. A reference sample was also prepared but
without the gel. This mixture was incubated for 2 hours in an orbital agitator AGITORB 200, at 37°C.
After the incubation, the gel was centrifuged for 5 minutes at 2655xg and 0.5 ml of supernatant was
diluted with 2.5 ml of 0.1M Na2B4O7 and 0.25 ml of 0.03M glycine. For each sample, a blank was
prepared with 0.5 ml of supernatant, 2.5 ml of Na2B4O7 and 0.25 ml of water instead of glycine. The
mixture was left for 25 minutes at room temperature and in the end 5 ml of cold methanol was added.
The absorbance of each sample was then determined against its own blank at 340 nm. The
concentration of amino groups was determined from the difference between absorbances of each
sample and the reference sample and with a molar absorption coefficient ε (trinitophenyl derivative of
glycine) equal to 1.24x10⁴ M
-1.cm
-1.
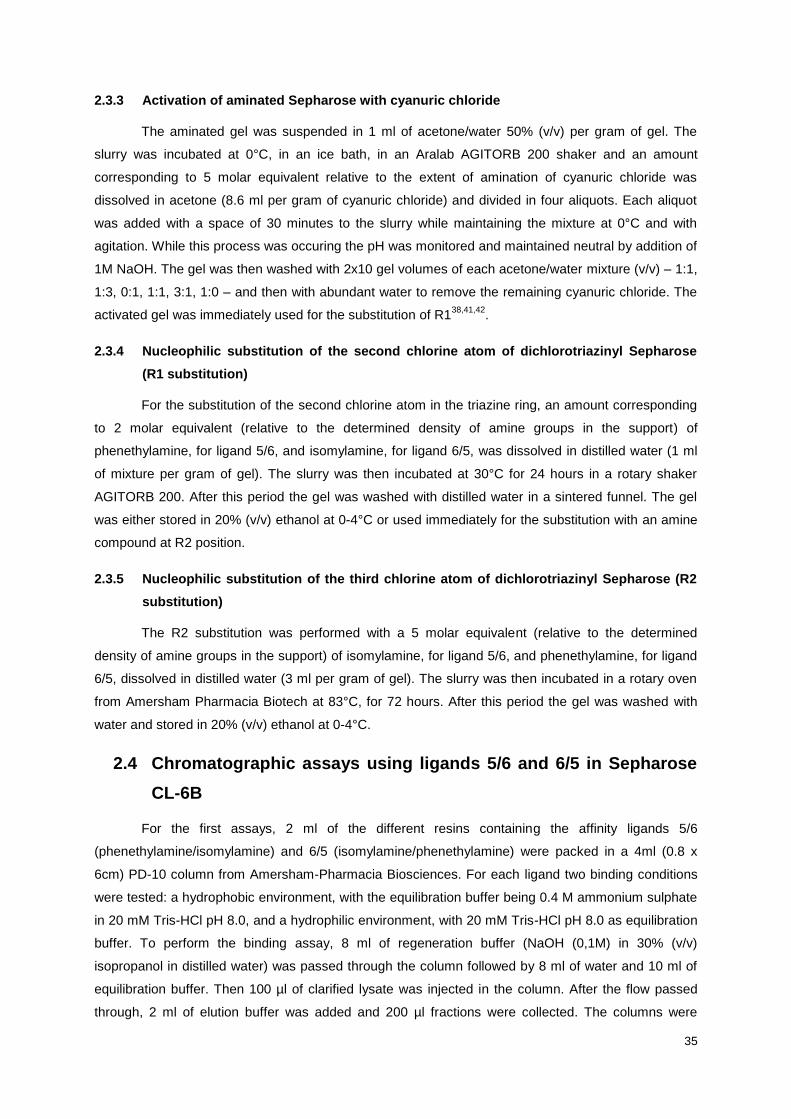
35
2.3.3 Activation of aminated Sepharose with cyanuric chloride
The aminated gel was suspended in 1 ml of acetone/water 50% (v/v) per gram of gel. The
slurry was incubated at 0°C, in an ice bath, in an Aralab AGITORB 200 shaker and an amount
corresponding to 5 molar equivalent relative to the extent of amination of cyanuric chloride was
dissolved in acetone (8.6 ml per gram of cyanuric chloride) and divided in four aliquots. Each aliquot
was added with a space of 30 minutes to the slurry while maintaining the mixture at 0°C and with
agitation. While this process was occuring the pH was monitored and maintained neutral by addition of
1M NaOH. The gel was then washed with 2x10 gel volumes of each acetone/water mixture (v/v) – 1:1,
1:3, 0:1, 1:1, 3:1, 1:0 – and then with abundant water to remove the remaining cyanuric chloride. The
activated gel was immediately used for the substitution of R138,41,42
.
2.3.4 Nucleophilic substitution of the second chlorine atom of dichlorotriazinyl Sepharose
(R1 substitution)
For the substitution of the second chlorine atom in the triazine ring, an amount corresponding
to 2 molar equivalent (relative to the determined density of amine groups in the support) of
phenethylamine, for ligand 5/6, and isomylamine, for ligand 6/5, was dissolved in distilled water (1 ml
of mixture per gram of gel). The slurry was then incubated at 30°C for 24 hours in a rotary shaker
AGITORB 200. After this period the gel was washed with distilled water in a sintered funnel. The gel
was either stored in 20% (v/v) ethanol at 0-4°C or used immediately for the substitution with an amine
compound at R2 position.
2.3.5 Nucleophilic substitution of the third chlorine atom of dichlorotriazinyl Sepharose (R2
substitution)
The R2 substitution was performed with a 5 molar equivalent (relative to the determined
density of amine groups in the support) of isomylamine, for ligand 5/6, and phenethylamine, for ligand
6/5, dissolved in distilled water (3 ml per gram of gel). The slurry was then incubated in a rotary oven
from Amersham Pharmacia Biotech at 83°C, for 72 hours. After this period the gel was washed with
water and stored in 20% (v/v) ethanol at 0-4°C.
2.4 Chromatographic assays using ligands 5/6 and 6/5 in Sepharose
CL-6B
For the first assays, 2 ml of the different resins containing the affinity ligands 5/6
(phenethylamine/isomylamine) and 6/5 (isomylamine/phenethylamine) were packed in a 4ml (0.8 x
6cm) PD-10 column from Amersham-Pharmacia Biosciences. For each ligand two binding conditions
were tested: a hydrophobic environment, with the equilibration buffer being 0.4 M ammonium sulphate
in 20 mM Tris-HCl pH 8.0, and a hydrophilic environment, with 20 mM Tris-HCl pH 8.0 as equilibration
buffer. To perform the binding assay, 8 ml of regeneration buffer (NaOH (0,1M) in 30% (v/v)
isopropanol in distilled water) was passed through the column followed by 8 ml of water and 10 ml of
equilibration buffer. Then 100 µl of clarified lysate was injected in the column. After the flow passed
through, 2 ml of elution buffer was added and 200 µl fractions were collected. The columns were

36
washed with water and stored in 20% (v/v) ethanol at 4°C. The samples were analyzed by agarose gel
electrophoresis.
The synthesized resin 6/5 was chosen for further testing and packed in a TRICORN 10/50 (GE
HEALTHCARE) column to test in the AKTA purifier.
The clarified lysate extracted from E.coli was injected in the columns to test the binding in
different conditions. To test these conditions different buffers were used.
The columns were firstly equilibrated with 5 CVs of equilibration buffer. The sample loop used
(100μl) was emptied by passing equilibration buffer in the amount of three times its volume. After
equilibration and sample injection, the bound material was eluted by a simple washthrough process,
where the elution buffer was the same as the equilibration buffer. The eluted and washthrough
fractions were collected using a Frac-920 fraction collector and analyzed by agarose gel
electrophoresis. Each fraction collected had a volume of 500 µL. Selected samples with purified
plasmid were further quantified by HPLC analysis. In some assays different salt gradients were tested
to elute the bound material.
2.5 Synthesis of triazine-based adsorbents in CIM® monolithic disk
The synthesis of triazine-based ligands was performed in CIM® EDA monolithic disks (BIA
Separations, Ljubljana, Slovenia) that contain free amino groups that are required for the ligands
immobilization using the protocol described before38,42
. Because the monolith is a solid support it was
important to use quantities of reagents during the procedure enough to cover the entire monolith to
avoid dried spots. The quantities of the reagents where increased but the proportions used were
maintained as in the protocol with the Sepharose CL-6B.
2.5.1 Epoxy activation of the CIM® monolithic disk
In the epoxy activation step the monolith was first washed with distilled water to remove the
ethanol solution used in storage. Then, the monolith was placed in a 20 ml capped vial whit 2.67 mL of
1M NaOH and 0.33 ml of epichlorohydrin. The mixture was incubated overnight with gentle agitation in
a rotary shaker, at 30°C. The monolithic disk was then washed thoroughly with distilled water and
used for the amination step.
2.5.2 Amination of previously epoxy-activated disk
The epoxy-activated monolith was aminated with 5 ml of ammonia. The mixture was incubated
overnight with gentle agitation in a rotary shaker at 30°C. The monolith was then washed with distilled
water to remove the remaining ammonia until the pH decreased to the pH of distilled water and no
ammonia odour could be detected. The aminated disk was either used in the moment for activation
with cyanuric chloride or stored in 20% (v/v) ethanol at 0-4°C.
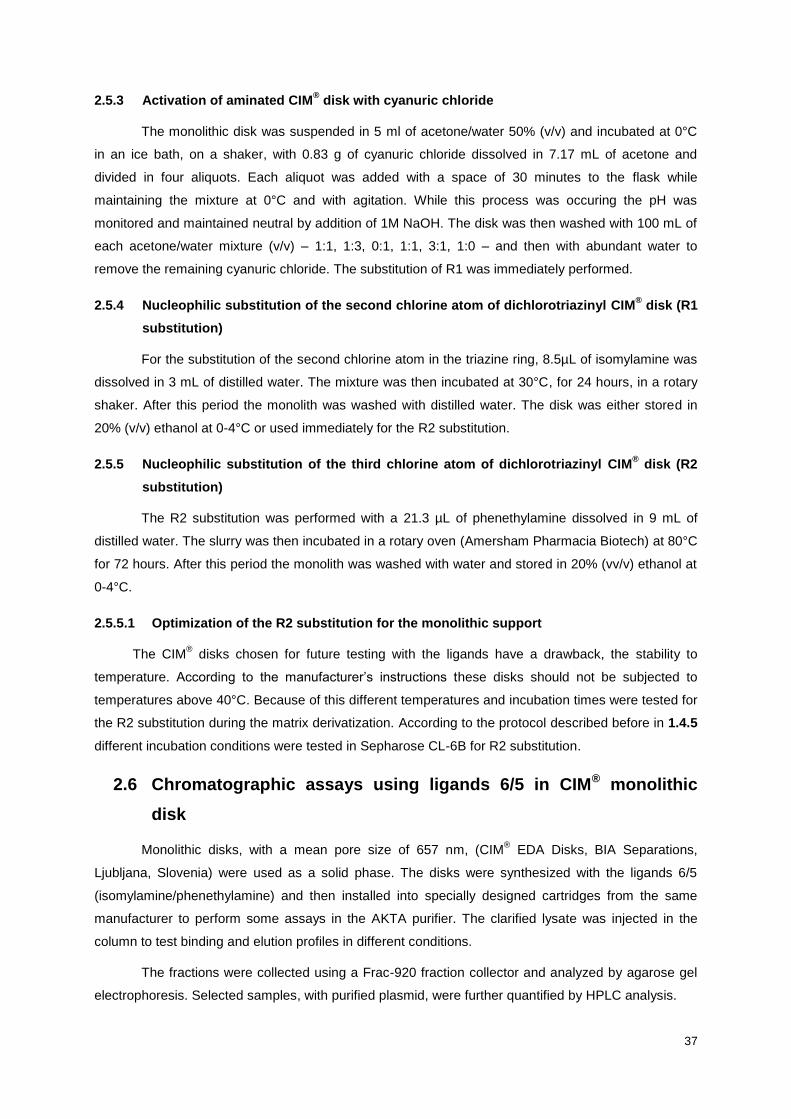
37
2.5.3 Activation of aminated CIM® disk with cyanuric chloride
The monolithic disk was suspended in 5 ml of acetone/water 50% (v/v) and incubated at 0°C
in an ice bath, on a shaker, with 0.83 g of cyanuric chloride dissolved in 7.17 mL of acetone and
divided in four aliquots. Each aliquot was added with a space of 30 minutes to the flask while
maintaining the mixture at 0°C and with agitation. While this process was occuring the pH was
monitored and maintained neutral by addition of 1M NaOH. The disk was then washed with 100 mL of
each acetone/water mixture (v/v) – 1:1, 1:3, 0:1, 1:1, 3:1, 1:0 – and then with abundant water to
remove the remaining cyanuric chloride. The substitution of R1 was immediately performed.
2.5.4 Nucleophilic substitution of the second chlorine atom of dichlorotriazinyl CIM® disk (R1
substitution)
For the substitution of the second chlorine atom in the triazine ring, 8.5µL of isomylamine was
dissolved in 3 mL of distilled water. The mixture was then incubated at 30°C, for 24 hours, in a rotary
shaker. After this period the monolith was washed with distilled water. The disk was either stored in
20% (v/v) ethanol at 0-4°C or used immediately for the R2 substitution.
2.5.5 Nucleophilic substitution of the third chlorine atom of dichlorotriazinyl CIM® disk (R2
substitution)
The R2 substitution was performed with a 21.3 µL of phenethylamine dissolved in 9 mL of
distilled water. The slurry was then incubated in a rotary oven (Amersham Pharmacia Biotech) at 80°C
for 72 hours. After this period the monolith was washed with water and stored in 20% (vv/v) ethanol at
0-4°C.
2.5.5.1 Optimization of the R2 substitution for the monolithic support
The CIM® disks chosen for future testing with the ligands have a drawback, the stability to
temperature. According to the manufacturer’s instructions these disks should not be subjected to
temperatures above 40°C. Because of this different temperatures and incubation times were tested for
the R2 substitution during the matrix derivatization. According to the protocol described before in 1.4.5
different incubation conditions were tested in Sepharose CL-6B for R2 substitution.
2.6 Chromatographic assays using ligands 6/5 in CIM® monolithic
disk
Monolithic disks, with a mean pore size of 657 nm, (CIM® EDA Disks, BIA Separations,
Ljubljana, Slovenia) were used as a solid phase. The disks were synthesized with the ligands 6/5
(isomylamine/phenethylamine) and then installed into specially designed cartridges from the same
manufacturer to perform some assays in the AKTA purifier. The clarified lysate was injected in the
column to test binding and elution profiles in different conditions.
The fractions were collected using a Frac-920 fraction collector and analyzed by agarose gel
electrophoresis. Selected samples, with purified plasmid, were further quantified by HPLC analysis.
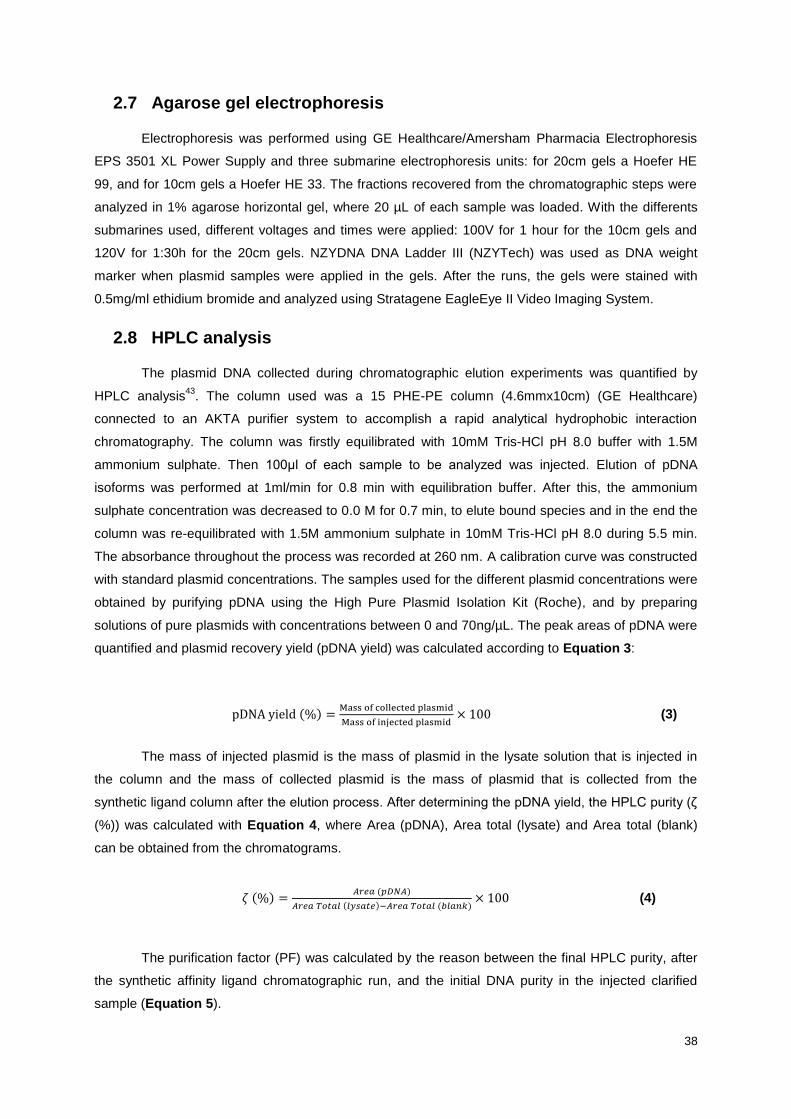
38
2.7 Agarose gel electrophoresis
Electrophoresis was performed using GE Healthcare/Amersham Pharmacia Electrophoresis
EPS 3501 XL Power Supply and three submarine electrophoresis units: for 20cm gels a Hoefer HE
99, and for 10cm gels a Hoefer HE 33. The fractions recovered from the chromatographic steps were
analyzed in 1% agarose horizontal gel, where 20 µL of each sample was loaded. With the differents
submarines used, different voltages and times were applied: 100V for 1 hour for the 10cm gels and
120V for 1:30h for the 20cm gels. NZYDNA DNA Ladder III (NZYTech) was used as DNA weight
marker when plasmid samples were applied in the gels. After the runs, the gels were stained with
0.5mg/ml ethidium bromide and analyzed using Stratagene EagleEye II Video Imaging System.
2.8 HPLC analysis
The plasmid DNA collected during chromatographic elution experiments was quantified by
HPLC analysis43
. The column used was a 15 PHE-PE column (4.6mmx10cm) (GE Healthcare)
connected to an AKTA purifier system to accomplish a rapid analytical hydrophobic interaction
chromatography. The column was firstly equilibrated with 10mM Tris-HCl pH 8.0 buffer with 1.5M
ammonium sulphate. Then 100μl of each sample to be analyzed was injected. Elution of pDNA
isoforms was performed at 1ml/min for 0.8 min with equilibration buffer. After this, the ammonium
sulphate concentration was decreased to 0.0 M for 0.7 min, to elute bound species and in the end the
column was re-equilibrated with 1.5M ammonium sulphate in 10mM Tris-HCl pH 8.0 during 5.5 min.
The absorbance throughout the process was recorded at 260 nm. A calibration curve was constructed
with standard plasmid concentrations. The samples used for the different plasmid concentrations were
obtained by purifying pDNA using the High Pure Plasmid Isolation Kit (Roche), and by preparing
solutions of pure plasmids with concentrations between 0 and 70ng/µL. The peak areas of pDNA were
quantified and plasmid recovery yield (pDNA yield) was calculated according to Equation 3:
pDNA yield (%) =Mass of collected plasmid
Mass of injected plasmid× 100 (3)
The mass of injected plasmid is the mass of plasmid in the lysate solution that is injected in
the column and the mass of collected plasmid is the mass of plasmid that is collected from the
synthetic ligand column after the elution process. After determining the pDNA yield, the HPLC purity (ζ
(%)) was calculated with Equation 4, where Area (pDNA), Area total (lysate) and Area total (blank)
can be obtained from the chromatograms.
𝜁 (%) =𝐴𝑟𝑒𝑎 (𝑝𝐷𝑁𝐴)
𝐴𝑟𝑒𝑎 𝑇𝑜𝑡𝑎𝑙 (𝑙𝑦𝑠𝑎𝑡𝑒)−𝐴𝑟𝑒𝑎 𝑇𝑜𝑡𝑎𝑙 (𝑏𝑙𝑎𝑛𝑘)× 100 (4)
The purification factor (PF) was calculated by the reason between the final HPLC purity, after
the synthetic affinity ligand chromatographic run, and the initial DNA purity in the injected clarified
sample (Equation 5).
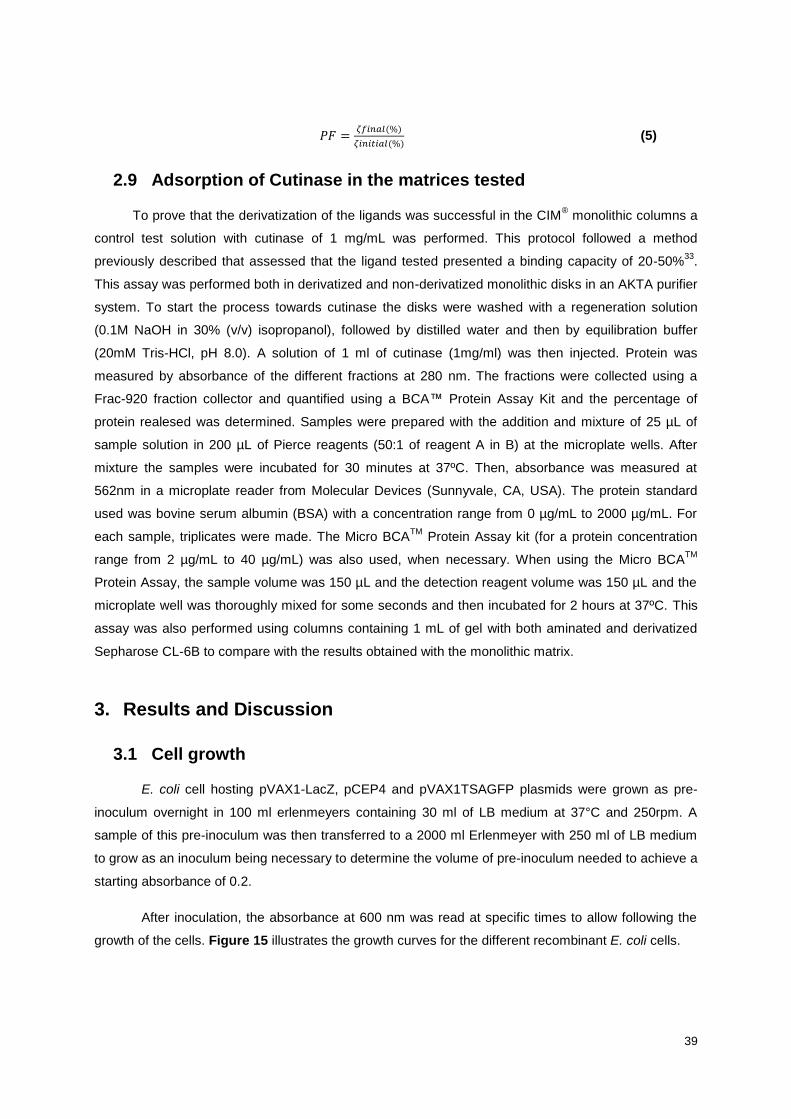
39
𝑃𝐹 =𝜁𝑓𝑖𝑛𝑎𝑙(%)
𝜁𝑖𝑛𝑖𝑡𝑖𝑎𝑙(%) (5)
2.9 Adsorption of Cutinase in the matrices tested
To prove that the derivatization of the ligands was successful in the CIM® monolithic columns a
control test solution with cutinase of 1 mg/mL was performed. This protocol followed a method
previously described that assessed that the ligand tested presented a binding capacity of 20-50%33
.
This assay was performed both in derivatized and non-derivatized monolithic disks in an AKTA purifier
system. To start the process towards cutinase the disks were washed with a regeneration solution
(0.1M NaOH in 30% (v/v) isopropanol), followed by distilled water and then by equilibration buffer
(20mM Tris-HCl, pH 8.0). A solution of 1 ml of cutinase (1mg/ml) was then injected. Protein was
measured by absorbance of the different fractions at 280 nm. The fractions were collected using a
Frac-920 fraction collector and quantified using a BCA™ Protein Assay Kit and the percentage of
protein realesed was determined. Samples were prepared with the addition and mixture of 25 µL of
sample solution in 200 µL of Pierce reagents (50:1 of reagent A in B) at the microplate wells. After
mixture the samples were incubated for 30 minutes at 37ºC. Then, absorbance was measured at
562nm in a microplate reader from Molecular Devices (Sunnyvale, CA, USA). The protein standard
used was bovine serum albumin (BSA) with a concentration range from 0 µg/mL to 2000 µg/mL. For
each sample, triplicates were made. The Micro BCATM
Protein Assay kit (for a protein concentration
range from 2 µg/mL to 40 µg/mL) was also used, when necessary. When using the Micro BCATM
Protein Assay, the sample volume was 150 µL and the detection reagent volume was 150 µL and the
microplate well was thoroughly mixed for some seconds and then incubated for 2 hours at 37ºC. This
assay was also performed using columns containing 1 mL of gel with both aminated and derivatized
Sepharose CL-6B to compare with the results obtained with the monolithic matrix.
3. Results and Discussion
3.1 Cell growth
E. coli cell hosting pVAX1-LacZ, pCEP4 and pVAX1TSAGFP plasmids were grown as pre-
inoculum overnight in 100 ml erlenmeyers containing 30 ml of LB medium at 37°C and 250rpm. A
sample of this pre-inoculum was then transferred to a 2000 ml Erlenmeyer with 250 ml of LB medium
to grow as an inoculum being necessary to determine the volume of pre-inoculum needed to achieve a
starting absorbance of 0.2.
After inoculation, the absorbance at 600 nm was read at specific times to allow following the
growth of the cells. Figure 15 illustrates the growth curves for the different recombinant E. coli cells.
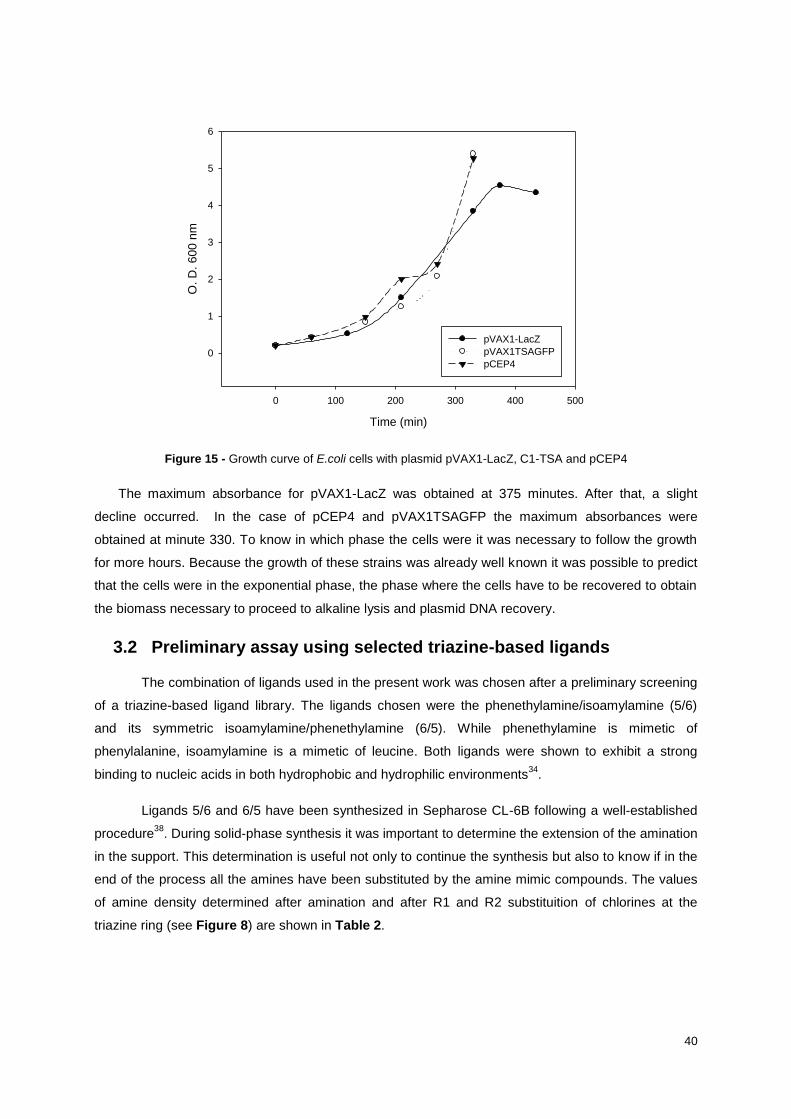
40
Time (min)
0 100 200 300 400 500
O. D
. 600 n
m
0
1
2
3
4
5
6
pVAX1-LacZ
pVAX1TSAGFP
pCEP4
Figure 15 - Growth curve of E.coli cells with plasmid pVAX1-LacZ, C1-TSA and pCEP4
The maximum absorbance for pVAX1-LacZ was obtained at 375 minutes. After that, a slight
decline occurred. In the case of pCEP4 and pVAX1TSAGFP the maximum absorbances were
obtained at minute 330. To know in which phase the cells were it was necessary to follow the growth
for more hours. Because the growth of these strains was already well known it was possible to predict
that the cells were in the exponential phase, the phase where the cells have to be recovered to obtain
the biomass necessary to proceed to alkaline lysis and plasmid DNA recovery.
3.2 Preliminary assay using selected triazine-based ligands
The combination of ligands used in the present work was chosen after a preliminary screening
of a triazine-based ligand library. The ligands chosen were the phenethylamine/isoamylamine (5/6)
and its symmetric isoamylamine/phenethylamine (6/5). While phenethylamine is mimetic of
phenylalanine, isoamylamine is a mimetic of leucine. Both ligands were shown to exhibit a strong
binding to nucleic acids in both hydrophobic and hydrophilic environments34
.
Ligands 5/6 and 6/5 have been synthesized in Sepharose CL-6B following a well-established
procedure38
. During solid-phase synthesis it was important to determine the extension of the amination
in the support. This determination is useful not only to continue the synthesis but also to know if in the
end of the process all the amines have been substituted by the amine mimic compounds. The values
of amine density determined after amination and after R1 and R2 substituition of chlorines at the
triazine ring (see Figure 8) are shown in Table 2.
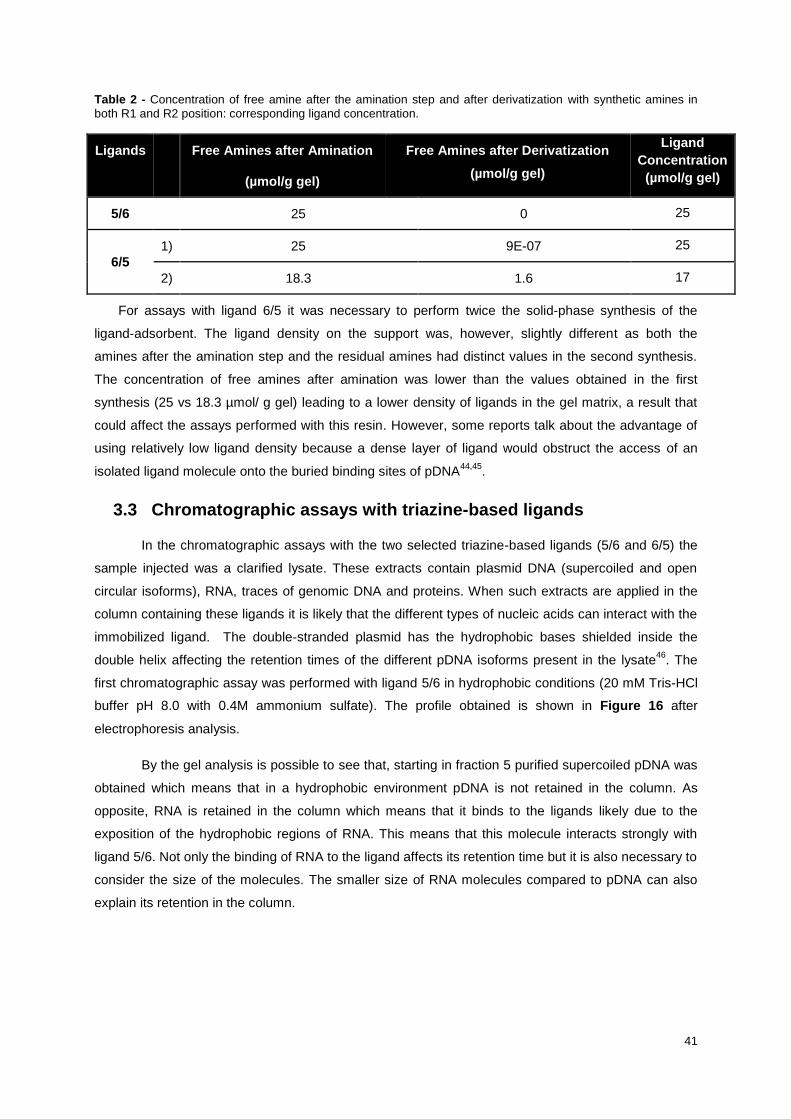
41
Table 2 - Concentration of free amine after the amination step and after derivatization with synthetic amines in
both R1 and R2 position: corresponding ligand concentration.
Ligands
Free Amines after Amination
(µmol/g gel)
Free Amines after Derivatization
(µmol/g gel)
Ligand
Concentration
(µmol/g gel)
5/6 25 0 25
6/5
1) 25 9E-07 25
2) 18.3 1.6 17
For assays with ligand 6/5 it was necessary to perform twice the solid-phase synthesis of the
ligand-adsorbent. The ligand density on the support was, however, slightly different as both the
amines after the amination step and the residual amines had distinct values in the second synthesis.
The concentration of free amines after amination was lower than the values obtained in the first
synthesis (25 vs 18.3 µmol/ g gel) leading to a lower density of ligands in the gel matrix, a result that
could affect the assays performed with this resin. However, some reports talk about the advantage of
using relatively low ligand density because a dense layer of ligand would obstruct the access of an
isolated ligand molecule onto the buried binding sites of pDNA44,45
.
3.3 Chromatographic assays with triazine-based ligands
In the chromatographic assays with the two selected triazine-based ligands (5/6 and 6/5) the
sample injected was a clarified lysate. These extracts contain plasmid DNA (supercoiled and open
circular isoforms), RNA, traces of genomic DNA and proteins. When such extracts are applied in the
column containing these ligands it is likely that the different types of nucleic acids can interact with the
immobilized ligand. The double-stranded plasmid has the hydrophobic bases shielded inside the
double helix affecting the retention times of the different pDNA isoforms present in the lysate46
. The
first chromatographic assay was performed with ligand 5/6 in hydrophobic conditions (20 mM Tris-HCl
buffer pH 8.0 with 0.4M ammonium sulfate). The profile obtained is shown in Figure 16 after
electrophoresis analysis.
By the gel analysis is possible to see that, starting in fraction 5 purified supercoiled pDNA was
obtained which means that in a hydrophobic environment pDNA is not retained in the column. As
opposite, RNA is retained in the column which means that it binds to the ligands likely due to the
exposition of the hydrophobic regions of RNA. This means that this molecule interacts strongly with
ligand 5/6. Not only the binding of RNA to the ligand affects its retention time but it is also necessary to
consider the size of the molecules. The smaller size of RNA molecules compared to pDNA can also
explain its retention in the column.
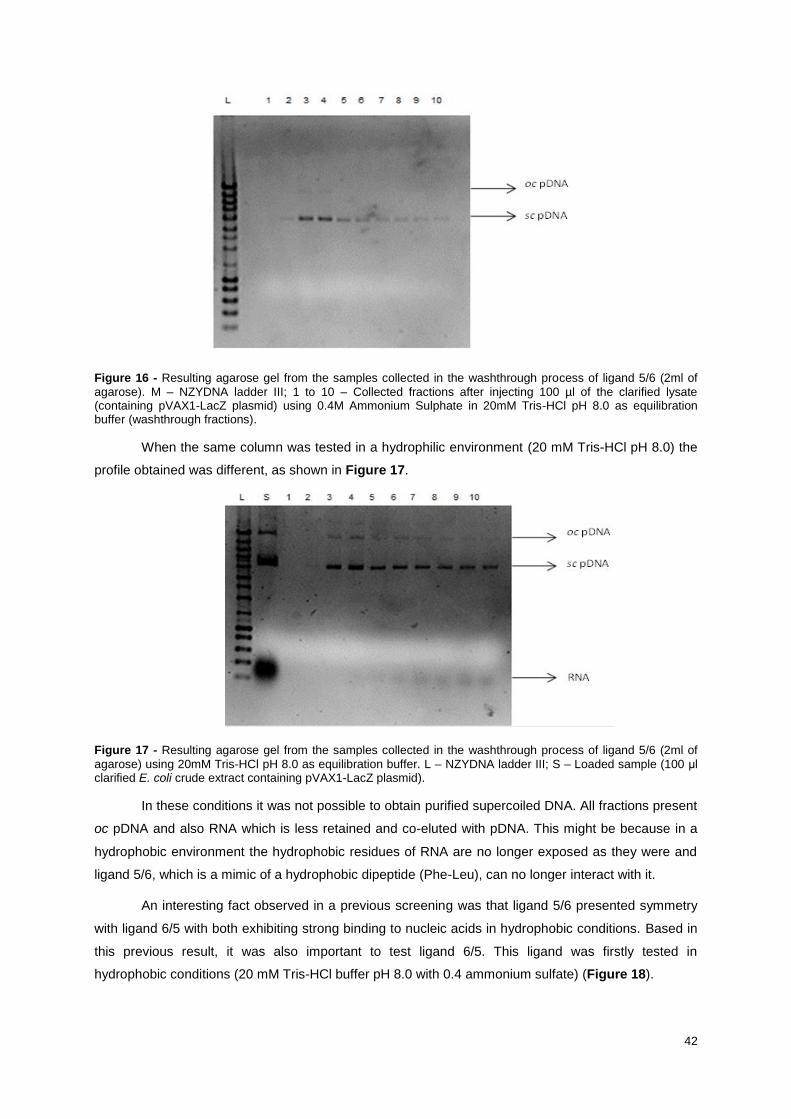
42
Figure 16 - Resulting agarose gel from the samples collected in the washthrough process of ligand 5/6 (2ml of
agarose). M – NZYDNA ladder III; 1 to 10 – Collected fractions after injecting 100 µl of the clarified lysate (containing pVAX1-LacZ plasmid) using 0.4M Ammonium Sulphate in 20mM Tris-HCl pH 8.0 as equilibration buffer (washthrough fractions).
When the same column was tested in a hydrophilic environment (20 mM Tris-HCl pH 8.0) the
profile obtained was different, as shown in Figure 17.
Figure 17 - Resulting agarose gel from the samples collected in the washthrough process of ligand 5/6 (2ml of
agarose) using 20mM Tris-HCl pH 8.0 as equilibration buffer. L – NZYDNA ladder III; S – Loaded sample (100 μl clarified E. coli crude extract containing pVAX1-LacZ plasmid).
In these conditions it was not possible to obtain purified supercoiled DNA. All fractions present
oc pDNA and also RNA which is less retained and co-eluted with pDNA. This might be because in a
hydrophobic environment the hydrophobic residues of RNA are no longer exposed as they were and
ligand 5/6, which is a mimic of a hydrophobic dipeptide (Phe-Leu), can no longer interact with it.
An interesting fact observed in a previous screening was that ligand 5/6 presented symmetry
with ligand 6/5 with both exhibiting strong binding to nucleic acids in hydrophobic conditions. Based in
this previous result, it was also important to test ligand 6/5. This ligand was firstly tested in
hydrophobic conditions (20 mM Tris-HCl buffer pH 8.0 with 0.4 ammonium sulfate) (Figure 18).
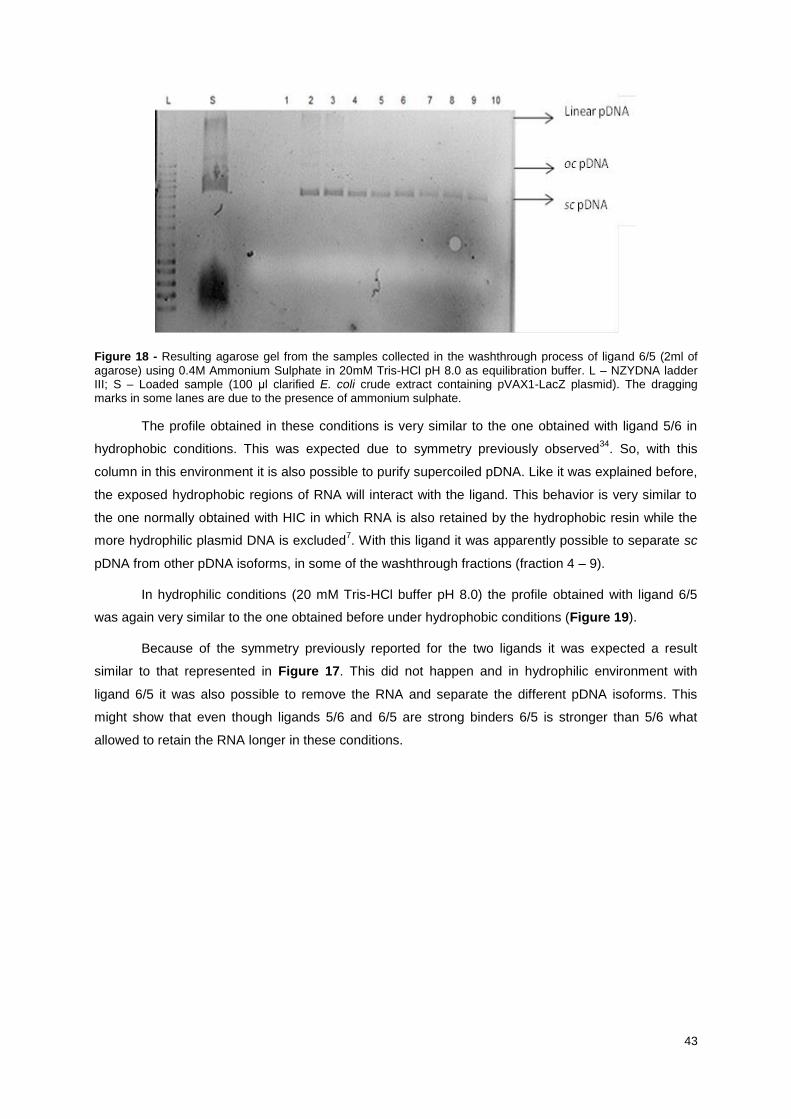
43
Figure 18 - Resulting agarose gel from the samples collected in the washthrough process of ligand 6/5 (2ml of
agarose) using 0.4M Ammonium Sulphate in 20mM Tris-HCl pH 8.0 as equilibration buffer. L – NZYDNA ladder III; S – Loaded sample (100 μl clarified E. coli crude extract containing pVAX1-LacZ plasmid). The dragging marks in some lanes are due to the presence of ammonium sulphate.
The profile obtained in these conditions is very similar to the one obtained with ligand 5/6 in
hydrophobic conditions. This was expected due to symmetry previously observed34
. So, with this
column in this environment it is also possible to purify supercoiled pDNA. Like it was explained before,
the exposed hydrophobic regions of RNA will interact with the ligand. This behavior is very similar to
the one normally obtained with HIC in which RNA is also retained by the hydrophobic resin while the
more hydrophilic plasmid DNA is excluded7. With this ligand it was apparently possible to separate sc
pDNA from other pDNA isoforms, in some of the washthrough fractions (fraction 4 – 9).
In hydrophilic conditions (20 mM Tris-HCl buffer pH 8.0) the profile obtained with ligand 6/5
was again very similar to the one obtained before under hydrophobic conditions (Figure 19).
Because of the symmetry previously reported for the two ligands it was expected a result
similar to that represented in Figure 17. This did not happen and in hydrophilic environment with
ligand 6/5 it was also possible to remove the RNA and separate the different pDNA isoforms. This
might show that even though ligands 5/6 and 6/5 are strong binders 6/5 is stronger than 5/6 what
allowed to retain the RNA longer in these conditions.
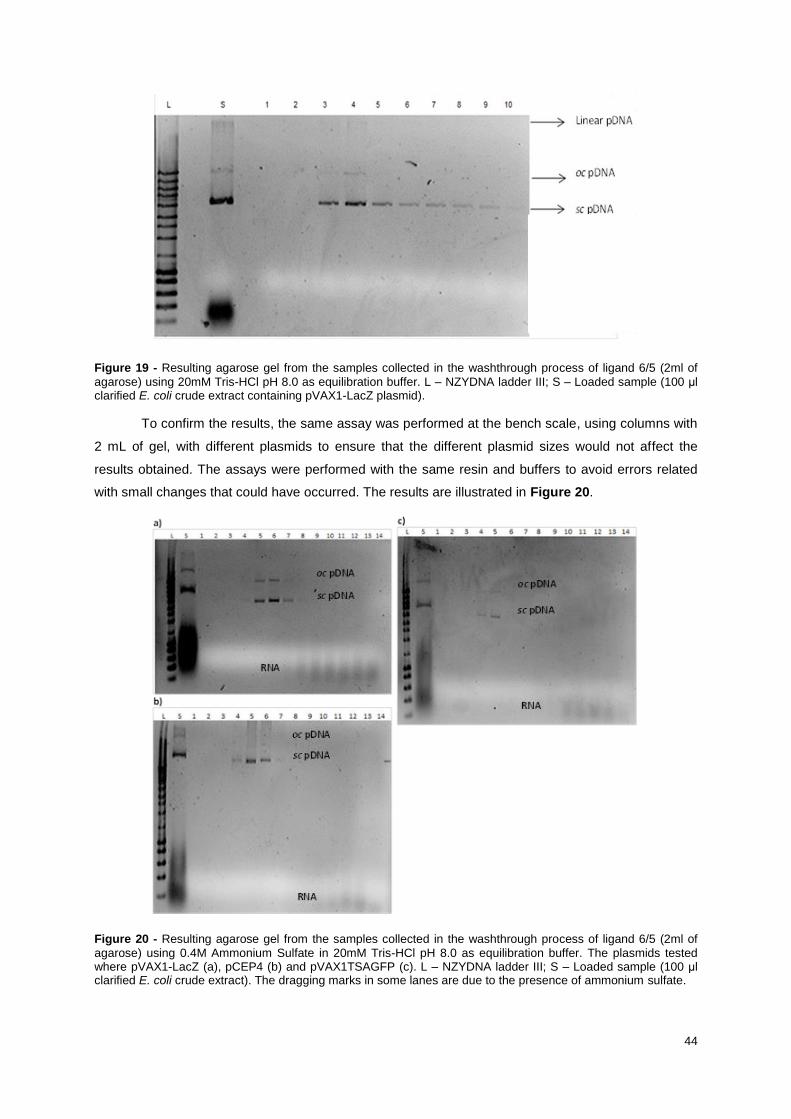
44
Figure 19 - Resulting agarose gel from the samples collected in the washthrough process of ligand 6/5 (2ml of
agarose) using 20mM Tris-HCl pH 8.0 as equilibration buffer. L – NZYDNA ladder III; S – Loaded sample (100 μl clarified E. coli crude extract containing pVAX1-LacZ plasmid).
To confirm the results, the same assay was performed at the bench scale, using columns with
2 mL of gel, with different plasmids to ensure that the different plasmid sizes would not affect the
results obtained. The assays were performed with the same resin and buffers to avoid errors related
with small changes that could have occurred. The results are illustrated in Figure 20.
Figure 20 - Resulting agarose gel from the samples collected in the washthrough process of ligand 6/5 (2ml of
agarose) using 0.4M Ammonium Sulfate in 20mM Tris-HCl pH 8.0 as equilibration buffer. The plasmids tested where pVAX1-LacZ (a), pCEP4 (b) and pVAX1TSAGFP (c). L – NZYDNA ladder III; S – Loaded sample (100 μl clarified E. coli crude extract). The dragging marks in some lanes are due to the presence of ammonium sulfate.
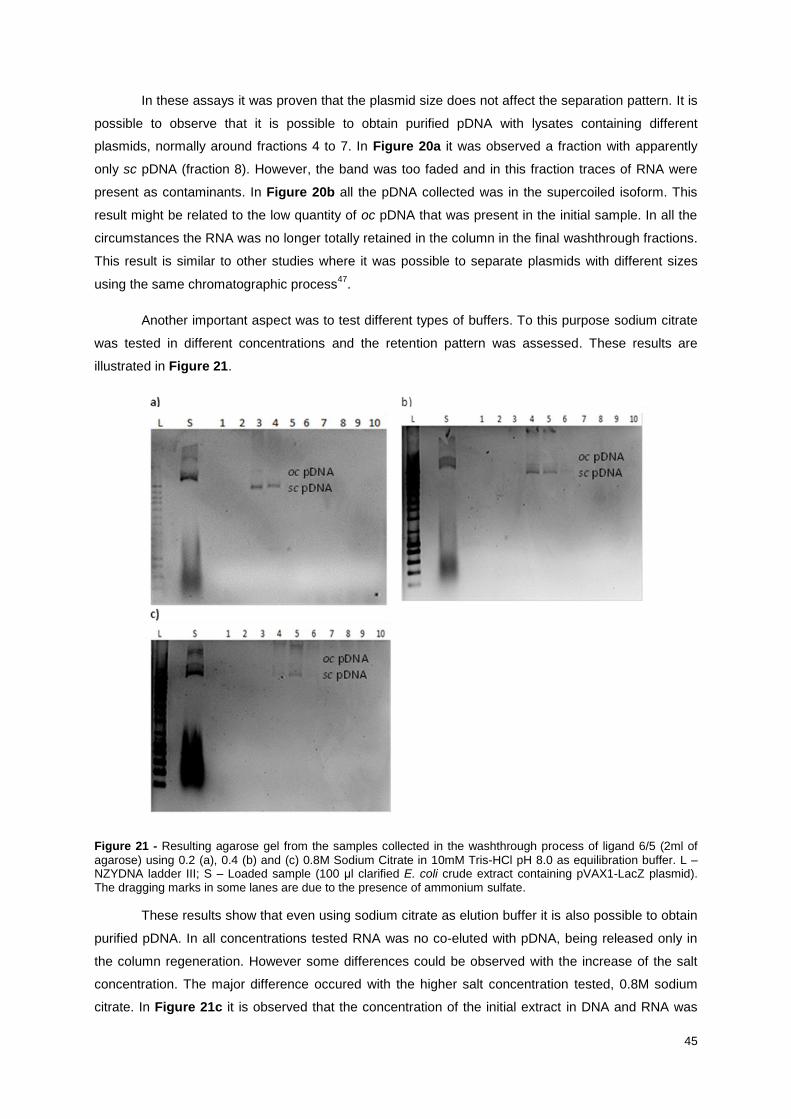
45
In these assays it was proven that the plasmid size does not affect the separation pattern. It is
possible to observe that it is possible to obtain purified pDNA with lysates containing different
plasmids, normally around fractions 4 to 7. In Figure 20a it was observed a fraction with apparently
only sc pDNA (fraction 8). However, the band was too faded and in this fraction traces of RNA were
present as contaminants. In Figure 20b all the pDNA collected was in the supercoiled isoform. This
result might be related to the low quantity of oc pDNA that was present in the initial sample. In all the
circumstances the RNA was no longer totally retained in the column in the final washthrough fractions.
This result is similar to other studies where it was possible to separate plasmids with different sizes
using the same chromatographic process47
.
Another important aspect was to test different types of buffers. To this purpose sodium citrate
was tested in different concentrations and the retention pattern was assessed. These results are
illustrated in Figure 21.
Figure 21 - Resulting agarose gel from the samples collected in the washthrough process of ligand 6/5 (2ml of
agarose) using 0.2 (a), 0.4 (b) and (c) 0.8M Sodium Citrate in 10mM Tris-HCl pH 8.0 as equilibration buffer. L – NZYDNA ladder III; S – Loaded sample (100 μl clarified E. coli crude extract containing pVAX1-LacZ plasmid). The dragging marks in some lanes are due to the presence of ammonium sulfate.
These results show that even using sodium citrate as elution buffer it is also possible to obtain
purified pDNA. In all concentrations tested RNA was no co-eluted with pDNA, being released only in
the column regeneration. However some differences could be observed with the increase of the salt
concentration. The major difference occured with the higher salt concentration tested, 0.8M sodium
citrate. In Figure 21c it is observed that the concentration of the initial extract in DNA and RNA was
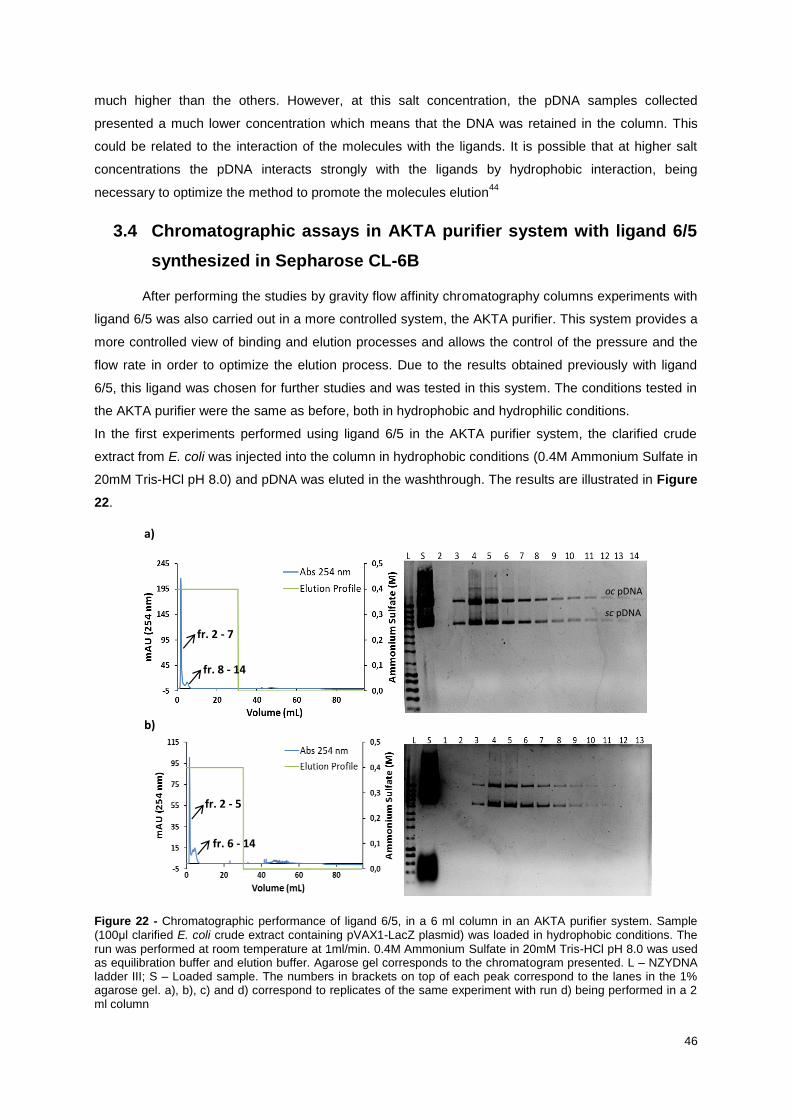
46
much higher than the others. However, at this salt concentration, the pDNA samples collected
presented a much lower concentration which means that the DNA was retained in the column. This
could be related to the interaction of the molecules with the ligands. It is possible that at higher salt
concentrations the pDNA interacts strongly with the ligands by hydrophobic interaction, being
necessary to optimize the method to promote the molecules elution44
3.4 Chromatographic assays in AKTA purifier system with ligand 6/5
synthesized in Sepharose CL-6B
After performing the studies by gravity flow affinity chromatography columns experiments with
ligand 6/5 was also carried out in a more controlled system, the AKTA purifier. This system provides a
more controlled view of binding and elution processes and allows the control of the pressure and the
flow rate in order to optimize the elution process. Due to the results obtained previously with ligand
6/5, this ligand was chosen for further studies and was tested in this system. The conditions tested in
the AKTA purifier were the same as before, both in hydrophobic and hydrophilic conditions.
In the first experiments performed using ligand 6/5 in the AKTA purifier system, the clarified crude
extract from E. coli was injected into the column in hydrophobic conditions (0.4M Ammonium Sulfate in
20mM Tris-HCl pH 8.0) and pDNA was eluted in the washthrough. The results are illustrated in Figure
22.
Figure 22 - Chromatographic performance of ligand 6/5, in a 6 ml column in an AKTA purifier system. Sample (100μl clarified E. coli crude extract containing pVAX1-LacZ plasmid) was loaded in hydrophobic conditions. The
run was performed at room temperature at 1ml/min. 0.4M Ammonium Sulfate in 20mM Tris-HCl pH 8.0 was used as equilibration buffer and elution buffer. Agarose gel corresponds to the chromatogram presented. L – NZYDNA ladder III; S – Loaded sample. The numbers in brackets on top of each peak correspond to the lanes in the 1% agarose gel. a), b), c) and d) correspond to replicates of the same experiment with run d) being performed in a 2 ml column
a)
b)
c)
d)
oc pDNA
sc pDNA
oc pDNA
sc pDNA
fr. 2 - 7
fr. 8 - 14
fr. 2 - 5
fr. 6 - 14
fr. 2 - 4
fr. 5 - 14
fr. 2 - 3
fr. 4 - 14
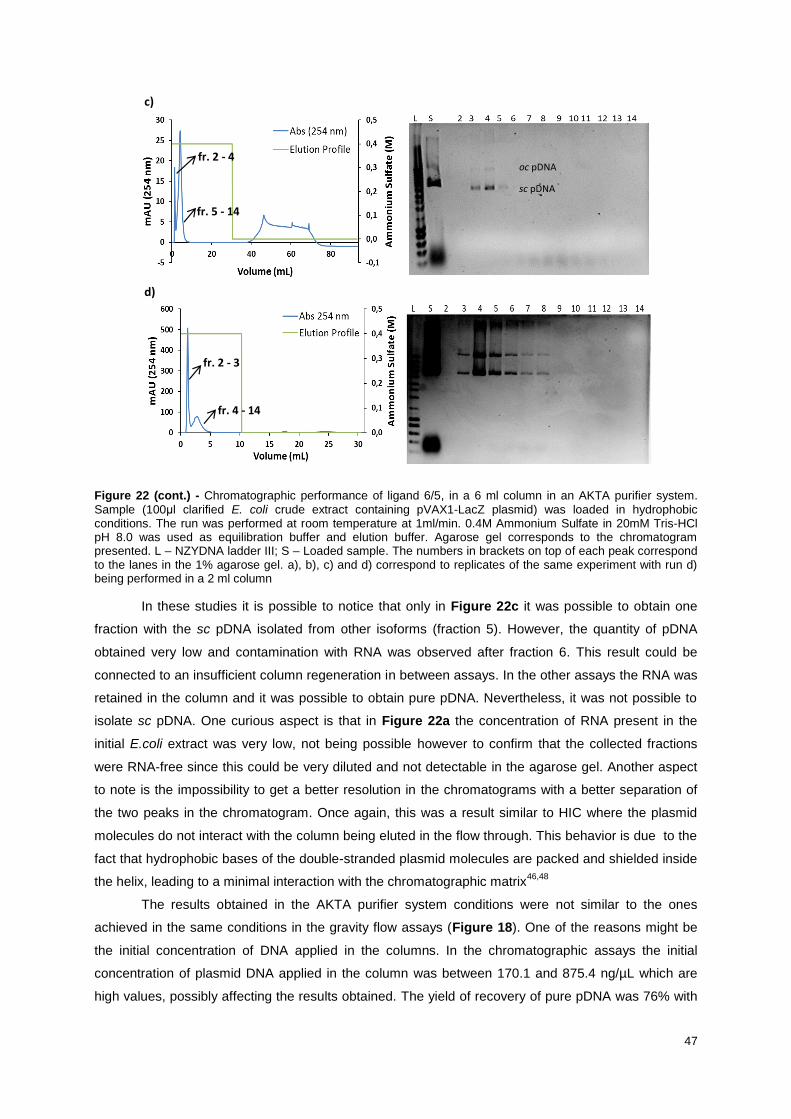
47
Figure 22 (cont.) - Chromatographic performance of ligand 6/5, in a 6 ml column in an AKTA purifier system.
Sample (100μl clarified E. coli crude extract containing pVAX1-LacZ plasmid) was loaded in hydrophobic conditions. The run was performed at room temperature at 1ml/min. 0.4M Ammonium Sulfate in 20mM Tris-HCl pH 8.0 was used as equilibration buffer and elution buffer. Agarose gel corresponds to the chromatogram presented. L – NZYDNA ladder III; S – Loaded sample. The numbers in brackets on top of each peak correspond to the lanes in the 1% agarose gel. a), b), c) and d) correspond to replicates of the same experiment with run d) being performed in a 2 ml column
In these studies it is possible to notice that only in Figure 22c it was possible to obtain one
fraction with the sc pDNA isolated from other isoforms (fraction 5). However, the quantity of pDNA
obtained very low and contamination with RNA was observed after fraction 6. This result could be
connected to an insufficient column regeneration in between assays. In the other assays the RNA was
retained in the column and it was possible to obtain pure pDNA. Nevertheless, it was not possible to
isolate sc pDNA. One curious aspect is that in Figure 22a the concentration of RNA present in the
initial E.coli extract was very low, not being possible however to confirm that the collected fractions
were RNA-free since this could be very diluted and not detectable in the agarose gel. Another aspect
to note is the impossibility to get a better resolution in the chromatograms with a better separation of
the two peaks in the chromatogram. Once again, this was a result similar to HIC where the plasmid
molecules do not interact with the column being eluted in the flow through. This behavior is due to the
fact that hydrophobic bases of the double-stranded plasmid molecules are packed and shielded inside
the helix, leading to a minimal interaction with the chromatographic matrix46,48
The results obtained in the AKTA purifier system conditions were not similar to the ones
achieved in the same conditions in the gravity flow assays (Figure 18). One of the reasons might be
the initial concentration of DNA applied in the columns. In the chromatographic assays the initial
concentration of plasmid DNA applied in the column was between 170.1 and 875.4 ng/µL which are
high values, possibly affecting the results obtained. The yield of recovery of pure pDNA was 76% with
a)
b)
c)
d)
oc pDNA
sc pDNA
oc pDNA
sc pDNA
fr. 2 - 7
fr. 8 - 14
fr. 2 - 5
fr. 6 - 14
fr. 2 - 4
fr. 5 - 14
fr. 2 - 3
fr. 4 - 14
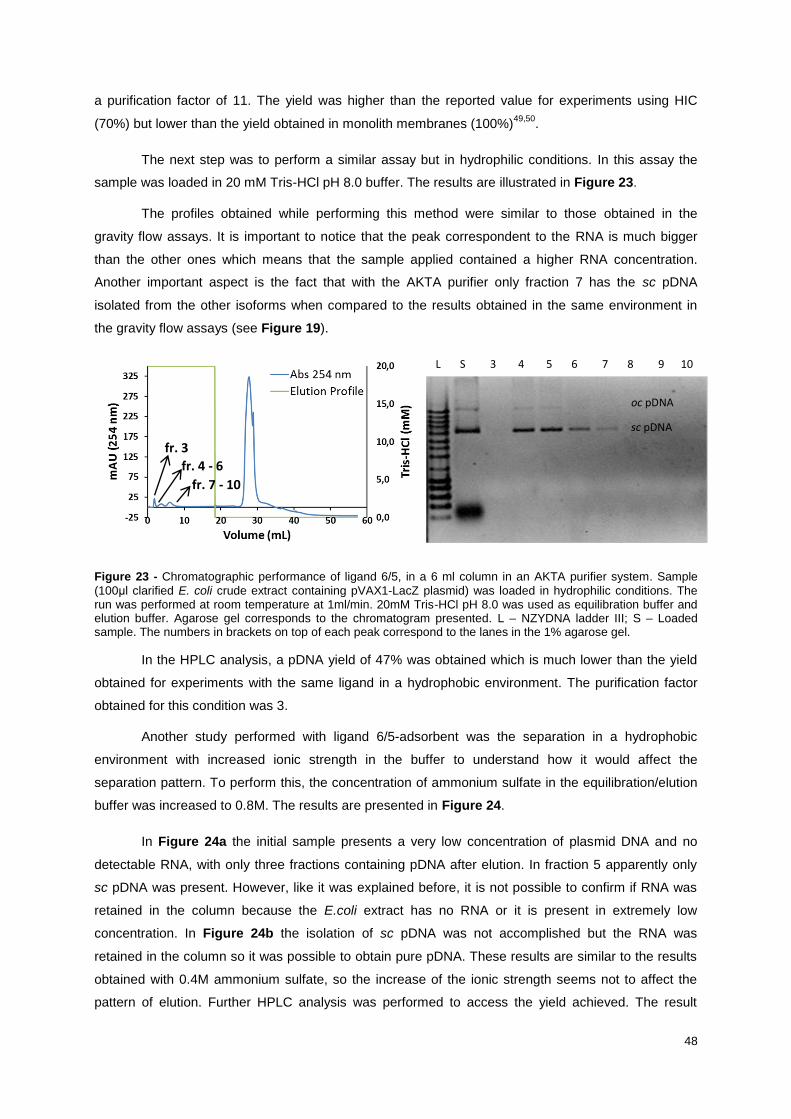
48
a purification factor of 11. The yield was higher than the reported value for experiments using HIC
(70%) but lower than the yield obtained in monolith membranes (100%)49,50
.
The next step was to perform a similar assay but in hydrophilic conditions. In this assay the
sample was loaded in 20 mM Tris-HCl pH 8.0 buffer. The results are illustrated in Figure 23.
The profiles obtained while performing this method were similar to those obtained in the
gravity flow assays. It is important to notice that the peak correspondent to the RNA is much bigger
than the other ones which means that the sample applied contained a higher RNA concentration.
Another important aspect is the fact that with the AKTA purifier only fraction 7 has the sc pDNA
isolated from the other isoforms when compared to the results obtained in the same environment in
the gravity flow assays (see Figure 19).
Figure 23 - Chromatographic performance of ligand 6/5, in a 6 ml column in an AKTA purifier system. Sample
(100μl clarified E. coli crude extract containing pVAX1-LacZ plasmid) was loaded in hydrophilic conditions. The run was performed at room temperature at 1ml/min. 20mM Tris-HCl pH 8.0 was used as equilibration buffer and elution buffer. Agarose gel corresponds to the chromatogram presented. L – NZYDNA ladder III; S – Loaded sample. The numbers in brackets on top of each peak correspond to the lanes in the 1% agarose gel.
In the HPLC analysis, a pDNA yield of 47% was obtained which is much lower than the yield
obtained for experiments with the same ligand in a hydrophobic environment. The purification factor
obtained for this condition was 3.
Another study performed with ligand 6/5-adsorbent was the separation in a hydrophobic
environment with increased ionic strength in the buffer to understand how it would affect the
separation pattern. To perform this, the concentration of ammonium sulfate in the equilibration/elution
buffer was increased to 0.8M. The results are presented in Figure 24.
In Figure 24a the initial sample presents a very low concentration of plasmid DNA and no
detectable RNA, with only three fractions containing pDNA after elution. In fraction 5 apparently only
sc pDNA was present. However, like it was explained before, it is not possible to confirm if RNA was
retained in the column because the E.coli extract has no RNA or it is present in extremely low
concentration. In Figure 24b the isolation of sc pDNA was not accomplished but the RNA was
retained in the column so it was possible to obtain pure pDNA. These results are similar to the results
obtained with 0.4M ammonium sulfate, so the increase of the ionic strength seems not to affect the
pattern of elution. Further HPLC analysis was performed to access the yield achieved. The result
oc pDNA
sc pDNA
L S 3 4 5 6 7 8 9 10
fr. 3
fr. 4 - 6
fr. 7 - 10

49
obtained was around 65% with a purification factor of 3. Both these values are lower than the results
obtained with 0.4M ammonium sulfate. This might explained by a stronger interaction of the nucleic
acids with the ligand, leading to a partial retention of plasmid molecules and a lower exclusion of
pDNA.
Figure 24 - Chromatographic performance of ligand 6/5 an AKTA purifier system. Sample (100μl clarified E. coli
crude extract containing pVAX1-LacZ plasmid) was loaded in hydrophobic conditions. The run was performed at room temperature at 1ml/min. 0.8M Ammonium Sulfate in 10mM Tris-HCl pH 8.0 was used as equilibration buffer and elution buffer. Agarose gel corresponds to the chromatogram presented. L – NZYDNA ladder III; S – Loaded sample. The numbers in brackets on top of each peak correspond to the lanes in the 1% agarose gel. a) and b) correspond to replicates of the same experiment with a) being performed in a 6 ml column and b) in a 2 ml column.
As so, after performing assays with an isocratic elution it was necessary to execute some
assays with a linear elution gradient to understand if it was possible to obtain sc pDNA with the
decrease of salt concentration. These assays were performed with a starting concentration of 1.5M
ammonium sulfate in 10mM of Tris-HCl pH 8.0 and ending elution with only 10mM Tris-HCl pH 8.0,
mimicking an environment similar to the one used in HIC 7 (Figure 25).
In the first run performed (Figure 25) the separation pattern was very different from all the
results obtained before. In the beginning of elution, where the salt concentration was higher, the oc
and sc pDNA were eluted. Still, with the decrease of salt concentration it was possible to elute more sc
pDNA. This happens because with the decreasing of the ionic strength the environment becomes
a)
b)
oc pDNA
sc pDNA
oc pDNA
sc pDNA
fr. 2 - 5
fr. 6 - 15
fr. 2 - 3
fr. 4 - 14
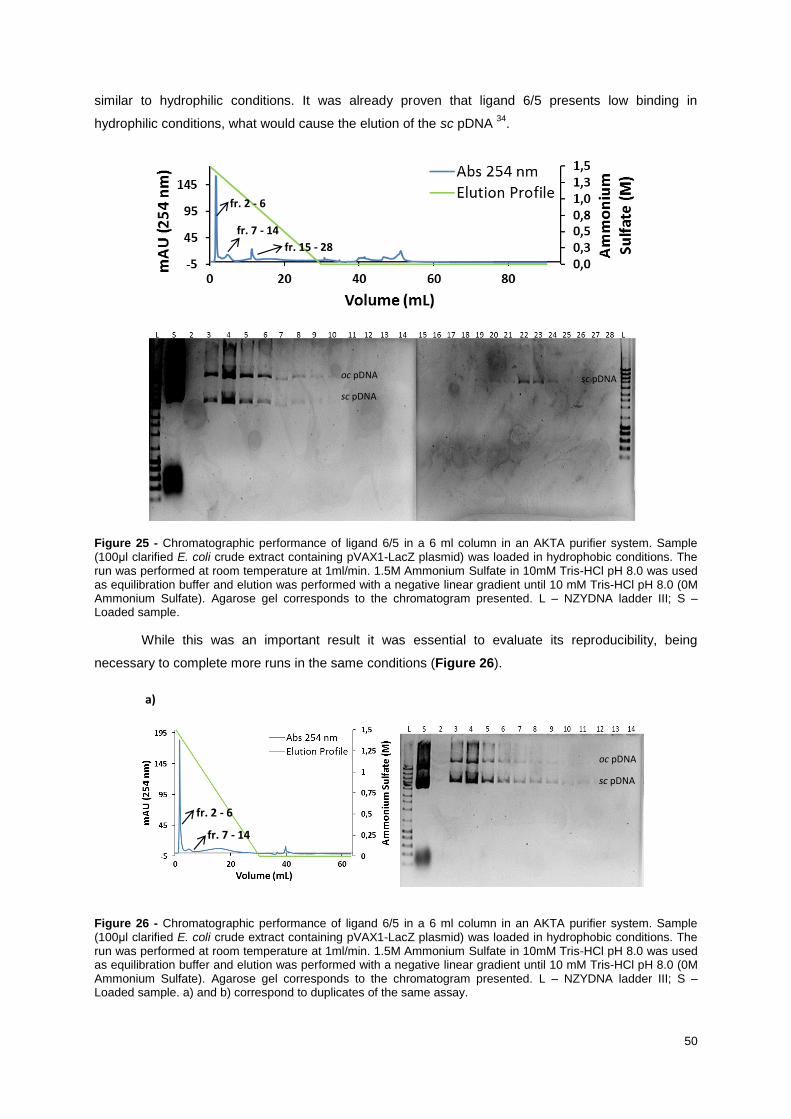
50
similar to hydrophilic conditions. It was already proven that ligand 6/5 presents low binding in
hydrophilic conditions, what would cause the elution of the sc pDNA 34
.
Figure 25 - Chromatographic performance of ligand 6/5 in a 6 ml column in an AKTA purifier system. Sample (100μl clarified E. coli crude extract containing pVAX1-LacZ plasmid) was loaded in hydrophobic conditions. The run was performed at room temperature at 1ml/min. 1.5M Ammonium Sulfate in 10mM Tris-HCl pH 8.0 was used as equilibration buffer and elution was performed with a negative linear gradient until 10 mM Tris-HCl pH 8.0 (0M Ammonium Sulfate). Agarose gel corresponds to the chromatogram presented. L – NZYDNA ladder III; S – Loaded sample.
While this was an important result it was essential to evaluate its reproducibility, being
necessary to complete more runs in the same conditions (Figure 26).
Figure 26 - Chromatographic performance of ligand 6/5 in a 6 ml column in an AKTA purifier system. Sample (100μl clarified E. coli crude extract containing pVAX1-LacZ plasmid) was loaded in hydrophobic conditions. The run was performed at room temperature at 1ml/min. 1.5M Ammonium Sulfate in 10mM Tris-HCl pH 8.0 was used as equilibration buffer and elution was performed with a negative linear gradient until 10 mM Tris-HCl pH 8.0 (0M Ammonium Sulfate). Agarose gel corresponds to the chromatogram presented. L – NZYDNA ladder III; S – Loaded sample. a) and b) correspond to duplicates of the same assay.
fr. 2 - 6
fr. 7 - 14
fr. 15 - 28
oc pDNA
sc pDNA
sc pDNA
a)
b)
oc pDNA
sc pDNA
fr. 2 - 6
fr. 7 - 14
oc pDNA
sc pDNA fr. 2 - 4
fr. 5 - 10
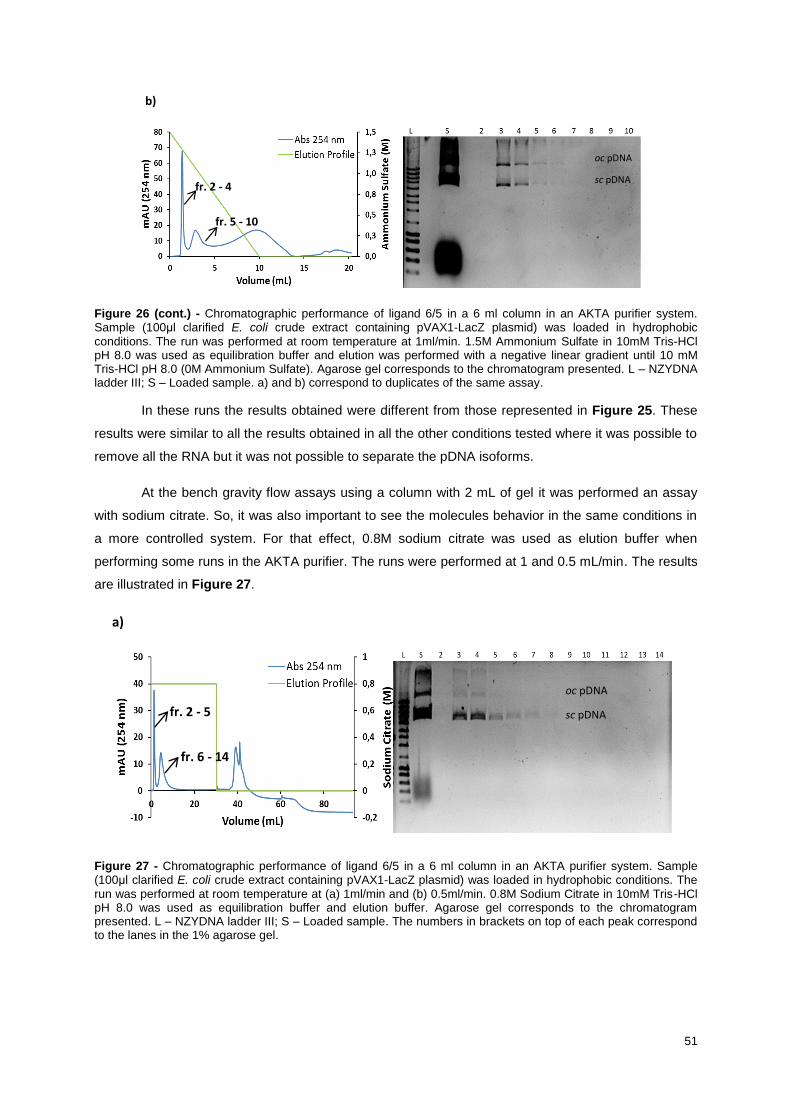
51
Figure 26 (cont.) - Chromatographic performance of ligand 6/5 in a 6 ml column in an AKTA purifier system. Sample (100μl clarified E. coli crude extract containing pVAX1-LacZ plasmid) was loaded in hydrophobic
conditions. The run was performed at room temperature at 1ml/min. 1.5M Ammonium Sulfate in 10mM Tris-HCl pH 8.0 was used as equilibration buffer and elution was performed with a negative linear gradient until 10 mM Tris-HCl pH 8.0 (0M Ammonium Sulfate). Agarose gel corresponds to the chromatogram presented. L – NZYDNA ladder III; S – Loaded sample. a) and b) correspond to duplicates of the same assay.
In these runs the results obtained were different from those represented in Figure 25. These
results were similar to all the results obtained in all the other conditions tested where it was possible to
remove all the RNA but it was not possible to separate the pDNA isoforms.
At the bench gravity flow assays using a column with 2 mL of gel it was performed an assay
with sodium citrate. So, it was also important to see the molecules behavior in the same conditions in
a more controlled system. For that effect, 0.8M sodium citrate was used as elution buffer when
performing some runs in the AKTA purifier. The runs were performed at 1 and 0.5 mL/min. The results
are illustrated in Figure 27.
Figure 27 - Chromatographic performance of ligand 6/5 in a 6 ml column in an AKTA purifier system. Sample (100μl clarified E. coli crude extract containing pVAX1-LacZ plasmid) was loaded in hydrophobic conditions. The
run was performed at room temperature at (a) 1ml/min and (b) 0.5ml/min. 0.8M Sodium Citrate in 10mM Tris-HCl pH 8.0 was used as equilibration buffer and elution buffer. Agarose gel corresponds to the chromatogram presented. L – NZYDNA ladder III; S – Loaded sample. The numbers in brackets on top of each peak correspond to the lanes in the 1% agarose gel.
a)
b)
oc pDNA
sc pDNA
fr. 2 - 6
fr. 7 - 14
oc pDNA
sc pDNA fr. 2 - 4
fr. 5 - 10
a)
b)
oc pDNA
sc pDNA
oc pDNA
sc pDNA
fr. 2 - 5
fr. 6 - 14
fr. 2 - 5
fr. 6 - 14
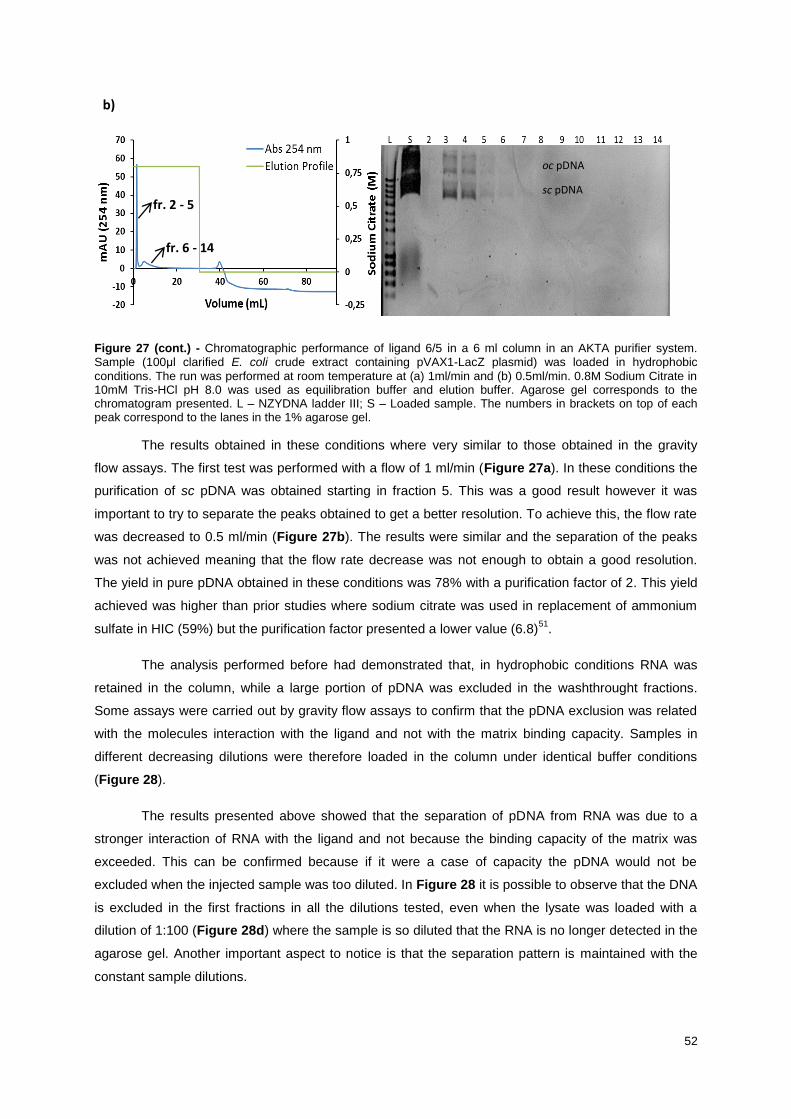
52
Figure 27 (cont.) - Chromatographic performance of ligand 6/5 in a 6 ml column in an AKTA purifier system. Sample (100μl clarified E. coli crude extract containing pVAX1-LacZ plasmid) was loaded in hydrophobic
conditions. The run was performed at room temperature at (a) 1ml/min and (b) 0.5ml/min. 0.8M Sodium Citrate in 10mM Tris-HCl pH 8.0 was used as equilibration buffer and elution buffer. Agarose gel corresponds to the chromatogram presented. L – NZYDNA ladder III; S – Loaded sample. The numbers in brackets on top of each peak correspond to the lanes in the 1% agarose gel.
The results obtained in these conditions where very similar to those obtained in the gravity
flow assays. The first test was performed with a flow of 1 ml/min (Figure 27a). In these conditions the
purification of sc pDNA was obtained starting in fraction 5. This was a good result however it was
important to try to separate the peaks obtained to get a better resolution. To achieve this, the flow rate
was decreased to 0.5 ml/min (Figure 27b). The results were similar and the separation of the peaks
was not achieved meaning that the flow rate decrease was not enough to obtain a good resolution.
The yield in pure pDNA obtained in these conditions was 78% with a purification factor of 2. This yield
achieved was higher than prior studies where sodium citrate was used in replacement of ammonium
sulfate in HIC (59%) but the purification factor presented a lower value (6.8)51
.
The analysis performed before had demonstrated that, in hydrophobic conditions RNA was
retained in the column, while a large portion of pDNA was excluded in the washthrought fractions.
Some assays were carried out by gravity flow assays to confirm that the pDNA exclusion was related
with the molecules interaction with the ligand and not with the matrix binding capacity. Samples in
different decreasing dilutions were therefore loaded in the column under identical buffer conditions
(Figure 28).
The results presented above showed that the separation of pDNA from RNA was due to a
stronger interaction of RNA with the ligand and not because the binding capacity of the matrix was
exceeded. This can be confirmed because if it were a case of capacity the pDNA would not be
excluded when the injected sample was too diluted. In Figure 28 it is possible to observe that the DNA
is excluded in the first fractions in all the dilutions tested, even when the lysate was loaded with a
dilution of 1:100 (Figure 28d) where the sample is so diluted that the RNA is no longer detected in the
agarose gel. Another important aspect to notice is that the separation pattern is maintained with the
constant sample dilutions.
a)
b)
oc pDNA
sc pDNA
oc pDNA
sc pDNA
fr. 2 - 5
fr. 6 - 14
fr. 2 - 5
fr. 6 - 14
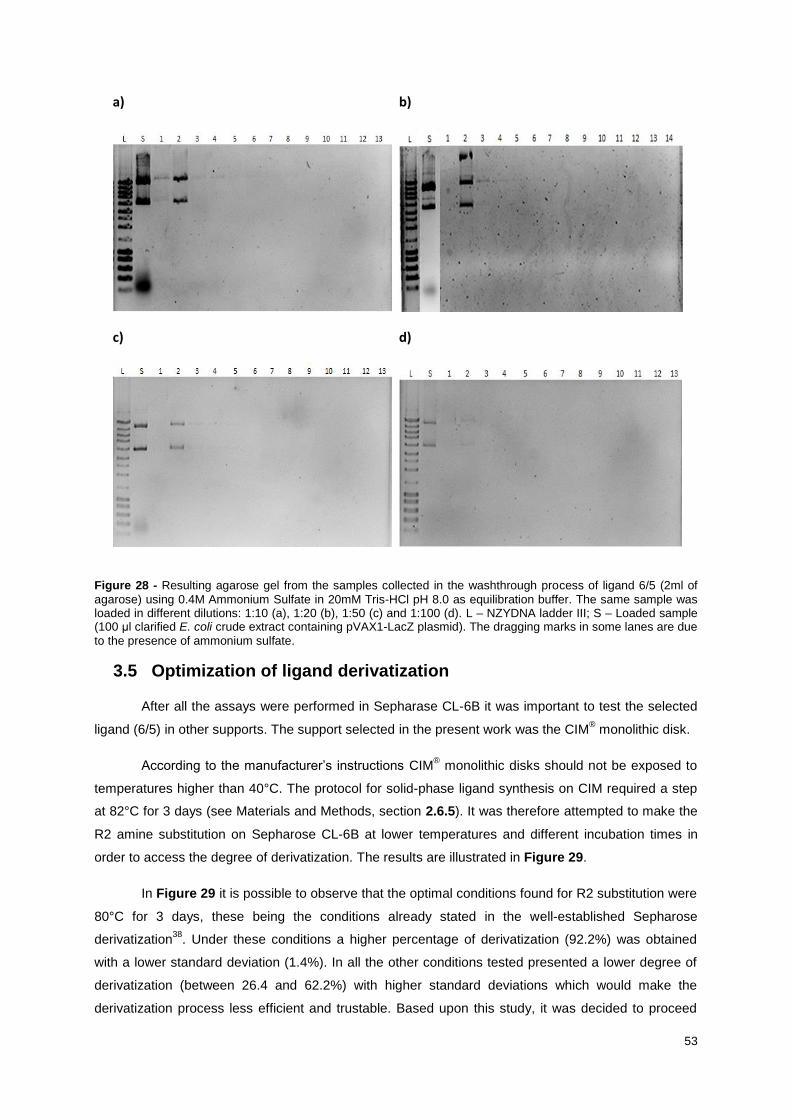
53
Figure 28 - Resulting agarose gel from the samples collected in the washthrough process of ligand 6/5 (2ml of
agarose) using 0.4M Ammonium Sulfate in 20mM Tris-HCl pH 8.0 as equilibration buffer. The same sample was loaded in different dilutions: 1:10 (a), 1:20 (b), 1:50 (c) and 1:100 (d). L – NZYDNA ladder III; S – Loaded sample (100 μl clarified E. coli crude extract containing pVAX1-LacZ plasmid). The dragging marks in some lanes are due
to the presence of ammonium sulfate.
3.5 Optimization of ligand derivatization
After all the assays were performed in Sepharase CL-6B it was important to test the selected
ligand (6/5) in other supports. The support selected in the present work was the CIM® monolithic disk.
According to the manufacturer’s instructions CIM® monolithic disks should not be exposed to
temperatures higher than 40°C. The protocol for solid-phase ligand synthesis on CIM required a step
at 82°C for 3 days (see Materials and Methods, section 2.6.5). It was therefore attempted to make the
R2 amine substitution on Sepharose CL-6B at lower temperatures and different incubation times in
order to access the degree of derivatization. The results are illustrated in Figure 29.
In Figure 29 it is possible to observe that the optimal conditions found for R2 substitution were
80°C for 3 days, these being the conditions already stated in the well-established Sepharose
derivatization38
. Under these conditions a higher percentage of derivatization (92.2%) was obtained
with a lower standard deviation (1.4%). In all the other conditions tested presented a lower degree of
derivatization (between 26.4 and 62.2%) with higher standard deviations which would make the
derivatization process less efficient and trustable. Based upon this study, it was decided to proceed
a) b)
c) d)

54
with the derivatization of CIM® disk at 80°C during 3 days (for R2 substitution). During the 3 days the
monolith was observed several times a day to ensure that there was no damage at the outside of the
disk. While this was accomplished it was not possible to know if there were changes internally and if
the ligands were really synthesized in the CIM® monolithic disk. For this it would have been necessary
to visualize the internal surface of the monolith (possibly using methods like SEM, for example37
).
Figure 29 – Percentage of derivatization of agarose with ligand 6/5 in the different conditions tested for R2 amine
substitution.
3.6 Chromatographic assays with CIM® monolithic disks
3.6.1 Assays performed with ligand 6/5 derivatized CIM®
disk under hydrophobic conditions
The first assays performed with the monoliths derivatized with ligand 6/5 aimed at the
optimization of the chromatographic run. Monolithic columns have been previously described as a
good option to achieve pDNA purification due to their high binding capacity, excellent mass transfer
properties and high number of accessible binding sites for large biomolecules. In addition, with
monolithic columns the target molecule can be eluted in a concentrated form with a reduced
degradation due to the short contact times with the chromatographic matrix52,53
. To optimize the
chromatographic procedure in ligand 6/5-derivatized CIM® monolith all the different steps of the
procedure were performed in different ranges of column volumes (CV) until an optimal process was
reached. In the equilibration and elution steps 20 mM Tris-HCl buffer pH 8.0 with 0.4M ammonium
sulfate was used. The results of these experiments are shown in Figure 30.
The first assay was performed with 20 CV of equilibration buffer, 5 CV of elution buffer, 5 CV
of regeneration buffer and 5 CV of water at a flow rate of 1 ml/min (Figure 30a). In the chromatogram
it is possible to observe that the volumes of elution, regeneration and cleaning of the column were not
Conditions Used
50ºC, 3 days 50ºC, 6 days 60ºC, 3 days 65ºC, 3 days 65ºC, 6 days 70ºC, 3 days 80ºC, 1 day 80ºC, 3 days
De
riva
tiza
tio
n P
erc
en
tag
e
0
20
40
60
80
100
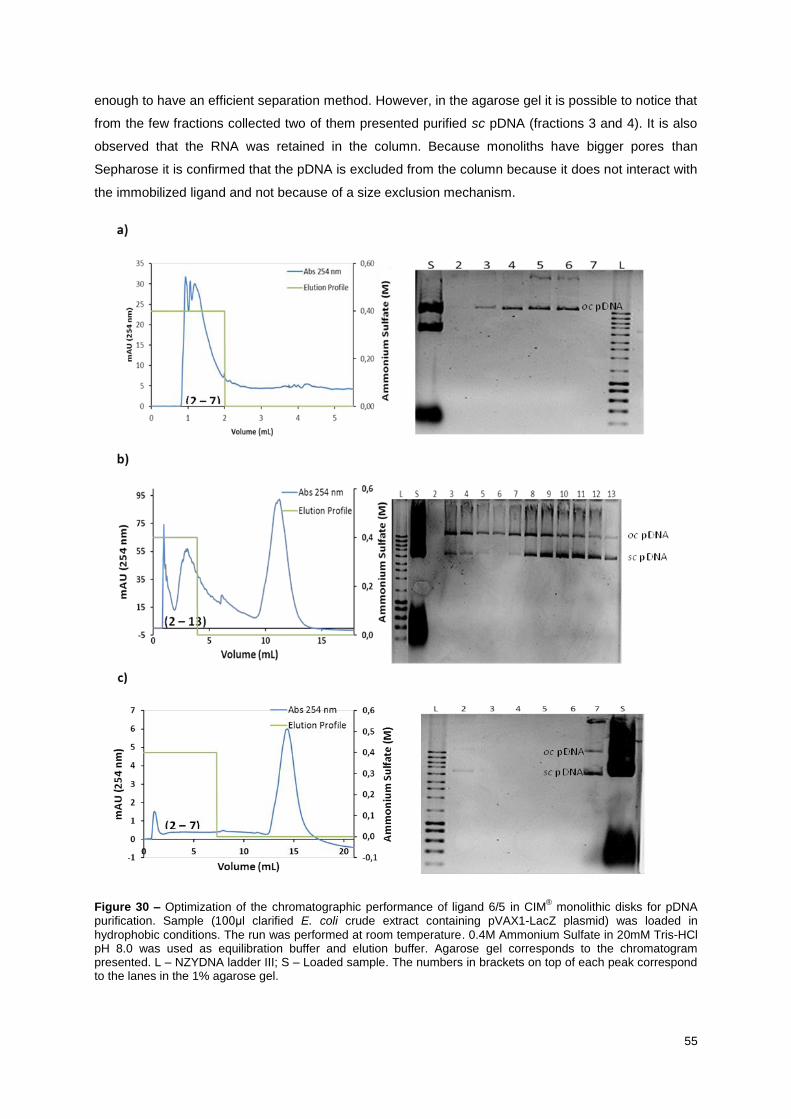
55
enough to have an efficient separation method. However, in the agarose gel it is possible to notice that
from the few fractions collected two of them presented purified sc pDNA (fractions 3 and 4). It is also
observed that the RNA was retained in the column. Because monoliths have bigger pores than
Sepharose it is confirmed that the pDNA is excluded from the column because it does not interact with
the immobilized ligand and not because of a size exclusion mechanism.
Figure 30 – Optimization of the chromatographic performance of ligand 6/5 in CIM® monolithic disks for pDNA
purification. Sample (100μl clarified E. coli crude extract containing pVAX1-LacZ plasmid) was loaded in
hydrophobic conditions. The run was performed at room temperature. 0.4M Ammonium Sulfate in 20mM Tris-HCl pH 8.0 was used as equilibration buffer and elution buffer. Agarose gel corresponds to the chromatogram presented. L – NZYDNA ladder III; S – Loaded sample. The numbers in brackets on top of each peak correspond to the lanes in the 1% agarose gel.
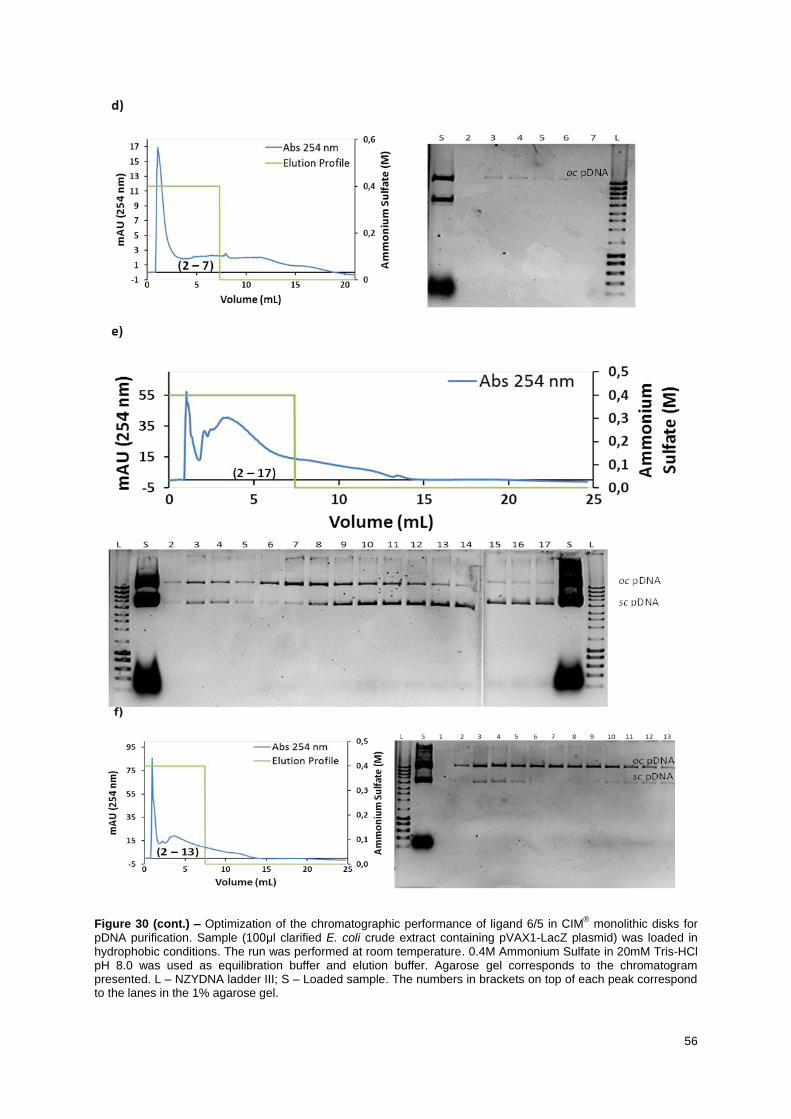
56
Figure 30 (cont.) – Optimization of the chromatographic performance of ligand 6/5 in CIM® monolithic disks for
pDNA purification. Sample (100μl clarified E. coli crude extract containing pVAX1-LacZ plasmid) was loaded in hydrophobic conditions. The run was performed at room temperature. 0.4M Ammonium Sulfate in 20mM Tris-HCl pH 8.0 was used as equilibration buffer and elution buffer. Agarose gel corresponds to the chromatogram presented. L – NZYDNA ladder III; S – Loaded sample. The numbers in brackets on top of each peak correspond to the lanes in the 1% agarose gel.
57
The second assay was performed with 30 CV of equilibration buffer, 10 CV of elution buffer,
10 CV of regeneration buffer and 30 CV of water to clean the column (Figure 30b). The
chromatogram obtained in these conditions presented worst resolution than in the first conditions
tested. Not only the resolution was poor but the elution was also too short and did not allow the
washthrough of unbound molecules. However, the agarose gel presented the same pattern as most of
the gels obtained with Sepharose. All the RNA was retained in the column but it was not possible to
isolate sc pDNA from other isoforms.
The elution was then increased to 20 CV maintaining the other steps as in experiment b).
(Figure 30c).The profile obtained in this assay was totally different from the previous ones. Two peaks
were obtained, the first one during elution and the second one during the cleaning of the column with
water. However, during this assay only fractions of the first peak were collected, and it was necessary
to repeat this assay to perform a complete analysis (see Figure 31). In the chromatogram it is
observed that only fraction 2 and 7 present DNA. In fraction 2 it was obtained only sc pDNA but in very
low concentration. Fraction 7 presented pDNA in the different isoforms. Once again the RNA was
retained in the column.
The following assay performed used conditions similar to those of HIC but using a
equilibration/elution buffer with lower ionic strenght7. In this assay the equilibration and the elution
were performed with 0.4M ammonium sulfate followed by 10 CV of 20 mM Tris-HCl pH 8.0 and 30 CV
of water (Figure 30d). In the chromatogram it can be observed that in the first peak eluted only oc
pDNA could be detected in the agarose gel and pDNA was present in very low quantity. Further
analysis by HPLC confirmed that the yield in pDNA was around 7%, a low result when compared to
other studies53–56
.
Based upon the physical and chemical composition of the monolithic columns it was expected
that the different flow rates used would not affect the separation selectivity, being flow-rate
independent53
. As so, the following assays were performed in the same conditions as before (Figure
30d) but with a flow rate of 2 ml/min (Figure 30e and 30f). In these assays two peaks of unbound
molecules were eluted in the beginning of the chromatographic separation. However, it is possible to
perceive that the elution step should be longer because when it ended there were still some molecules
being eluted. Nevertheless, in both assays it was possible to obtain purified pDNA with some RNA
being released in the end of elution. The chromatograms obtained in these conditions were similar to
the one in Figure 30d which demonstrates that the molecules separation is flow-independent as
expected.
After the optimization assays operational conditions were established as 30 CV of equilibration
buffer, 20 CV of elution buffer, 10 CV of regeneration buffer and 30 CV of water to clean the column
This method was performed a few more times to test its reproducibility. The results are shown in
Figure 31.
The first thing to observe in these assays are the chromatograms obtained (Figure 31a). It is
possible to understand that with different samples and in different days the chromatographic profile is
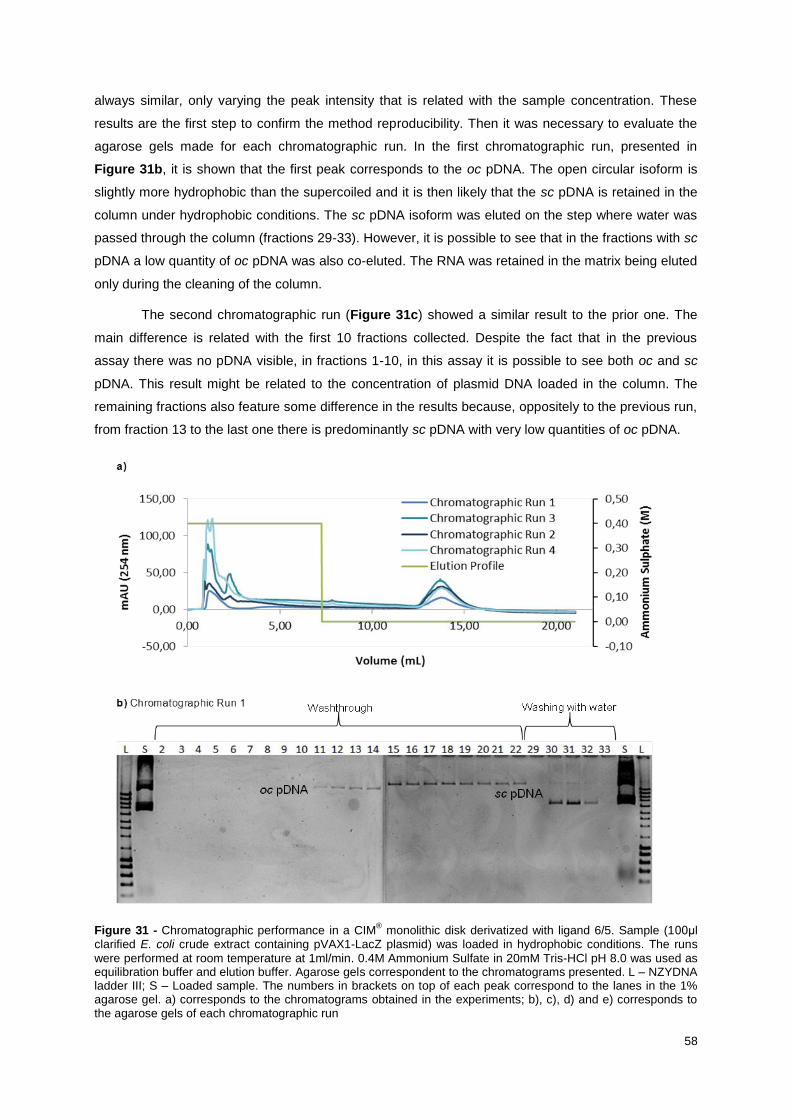
58
always similar, only varying the peak intensity that is related with the sample concentration. These
results are the first step to confirm the method reproducibility. Then it was necessary to evaluate the
agarose gels made for each chromatographic run. In the first chromatographic run, presented in
Figure 31b, it is shown that the first peak corresponds to the oc pDNA. The open circular isoform is
slightly more hydrophobic than the supercoiled and it is then likely that the sc pDNA is retained in the
column under hydrophobic conditions. The sc pDNA isoform was eluted on the step where water was
passed through the column (fractions 29-33). However, it is possible to see that in the fractions with sc
pDNA a low quantity of oc pDNA was also co-eluted. The RNA was retained in the matrix being eluted
only during the cleaning of the column.
The second chromatographic run (Figure 31c) showed a similar result to the prior one. The
main difference is related with the first 10 fractions collected. Despite the fact that in the previous
assay there was no pDNA visible, in fractions 1-10, in this assay it is possible to see both oc and sc
pDNA. This result might be related to the concentration of plasmid DNA loaded in the column. The
remaining fractions also feature some difference in the results because, oppositely to the previous run,
from fraction 13 to the last one there is predominantly sc pDNA with very low quantities of oc pDNA.
Figure 31 - Chromatographic performance in a CIM® monolithic disk derivatized with ligand 6/5. Sample (100μl
clarified E. coli crude extract containing pVAX1-LacZ plasmid) was loaded in hydrophobic conditions. The runs
were performed at room temperature at 1ml/min. 0.4M Ammonium Sulfate in 20mM Tris-HCl pH 8.0 was used as equilibration buffer and elution buffer. Agarose gels correspondent to the chromatograms presented. L – NZYDNA ladder III; S – Loaded sample. The numbers in brackets on top of each peak correspond to the lanes in the 1% agarose gel. a) corresponds to the chromatograms obtained in the experiments; b), c), d) and e) corresponds to the agarose gels of each chromatographic run

59
Figure 31 (cont.) - Chromatographic performance in a CIM® monolithic disk derivatized with ligand 6/5. Sample
(100μl clarified E. coli crude extract containing pVAX1-LacZ plasmid) was loaded in hydrophobic conditions. The runs were performed at room temperature at 1ml/min. 0.4M Ammonium Sulfate in 20mM Tris-HCl pH 8.0 was used as equilibration buffer and elution buffer. Agarose gels correspondent to the chromatograms presented. L – NZYDNA ladder III; S – Loaded sample. The numbers in brackets on top of each peak correspond to the lanes in the 1% agarose gel. a) corresponds to the chromatograms obtained in the experiments; b), c), d) and e) corresponds to the agarose gels of each chromatographic run.
In the third chromatographic run (Figure 31d) it was possible to obtain pure oc pDNA in the
first eleven fractions due to this isoform lower hydrophobicity. In the next fractions it was obtained pure
pDNA but always with the oc and sc pDNA present. This result is somewhat different from the
previous chromatographic runs. This may be related with the sample loaded in the column, in which
the third run presented a much higher concentration in DNA and RNA than the previously used
samples.
c) Chromatographic Run 2
d) Chromatographic Run 3
e) Chromatographic Run 4
Washthrough Washing with water
oc pDNA
sc pDNA
Washthrough Washing with water
oc pDNA
sc pDNA
sc pDNA
oc pDNA
oc pDNA
sc pDNA

60
The last chromatographic run performed (Figure 31e) shows a behavior similar to the third
one. The major difference is related with the first fractions collected, in which both isoforms are
excluded in the washthrough and water-eluted fractions. In this assay it was not possible to obtain
pDNA isoforms isolated from each other but, as shown in the previous results, it was possible to
remove all the RNA that remained retained in the monolith. While there were some differences in the
several assays performed under hydrophobic conditions they apparent to be related with the initial
extract loaded in the column. Similarly to what occurred in the Sepharose CL-6B assays, in a
hydrophobic environment the DNA is not retained in the column, so the ligand 6/5 do not bind to DNA,
while RNA is retained in the due to the higher exposition of hydrophobic regions in RNA34
. Further
HPLC quantitative analyses have shown that the yields in pDNA obtained were between 84 and
99.5% which is a good result when compared with other studies performed54,57
. The purification factor
obtained was around 4. When compared with the tests performed in the agarose matrix derivatized
with ligand 6/5 the main difference is the peak that shows up when water is passed through the
monolith. In this peak it is possible to elute remaining pDNA absorbed in the matrix, which leads to a
higher pDNA yield when using the CIM® monolithic disks (in agarose the pDNA yield was 76%).
To assess the effect of ammonium sulfate concentration in the binding profile, an experiment
was realized with an isocratic elution using 0.8M ammonium sulfate as equilibration and elution buffer.
The results are presented in Figure 32.
The chromatogram shows a similar profile to the ones obtained in the conditions represented
in Figure 31. However, when analyzing the agarose gel some important differences were observed.
The first peak eluted (fractions 2–20) contained mostly pDNA as in previous conditions. But, in the
fractions collected in the second peak eluted (fractions 30-33) RNA was present, affecting the purity of
the pDNA excluded. When compared to the results obtained with ligand 6/5 derivatized Sepharose
(see Figure 24) it is observed that in that matrix it was possible to obtain pure pDNA but with a slightly
lower yield. By HPLC analysis yields of 84% and 12% of pure and impure pDNA, respectively, were
obtained. Therefore, from these studies it was concluded that higher ionic strengths were not
favorable for the purification process in derivatized CIM® monoliths.
Figure 32 - Chromatographic performance in a CIM® monolithic disk derivatized with ligand 6/5. Sample (100μl
clarified E. coli crude extract containing pVAX1-LacZ plasmid) was loaded in hydrophobic conditions. The run was performed at room temperature at 1ml/min. 0.8M Ammonium Sulfate in 10mM Tris-HCl pH 8.0 was used as equilibration buffer and elution buffer. Agarose gel corresponds to the chromatogram presented. L – NZYDNA ladder III; S – Loaded sample. The numbers in brackets on top of each peak correspond to the lanes in the 1% agarose gel.
(30 – 33)
sc pDNA
oc pDNA
Washthrough Washing with water
(2 – 20)

61
Figure 32 (cont.) - Chromatographic performance in a CIM® monolithic disk derivatized with ligand 6/5. Sample
(100μl clarified E. coli crude extract containing pVAX1-LacZ plasmid) was loaded in hydrophobic conditions. The run was performed at room temperature at 1ml/min. 0.8M Ammonium Sulfate in 10mM Tris-HCl pH 8.0 was used as equilibration buffer and elution buffer. Agarose gel corresponds to the chromatogram presented. L – NZYDNA ladder III; S – Loaded sample. The numbers in brackets on top of each peak correspond to the lanes in the 1% agarose gel.
An experiment was also performed in hydrophobic conditions with an isocratic elution with
1.5M ammonium sulfate in 20 mM Tris-HCl buffer pH 8.0. The results are shown in Figure 33.
Figure 33 - Chromatographic performance in a CIM® monolithic disk derivatized with ligand 6/5. Sample (100μl
clarified E. coli crude extract containing pVAX1-LacZ plasmid) was loaded in hydrophobic conditions. The run was
performed at room temperature at 1ml/min. 1.5M Ammonium Sulfate in 20mM Tris-HCl pH 8.0 was used as equilibration buffer and elution buffer. Agarose gel corresponds to the chromatogram presented. L – NZYDNA ladder III; S – Loaded sample. The numbers in brackets on top of each peak correspond to the lanes in the 1% agarose gel. a) and b) represent replicates of the same experiment.
(30 – 33)
sc pDNA
oc pDNA
Washthrough Washing with water
(2 – 20)
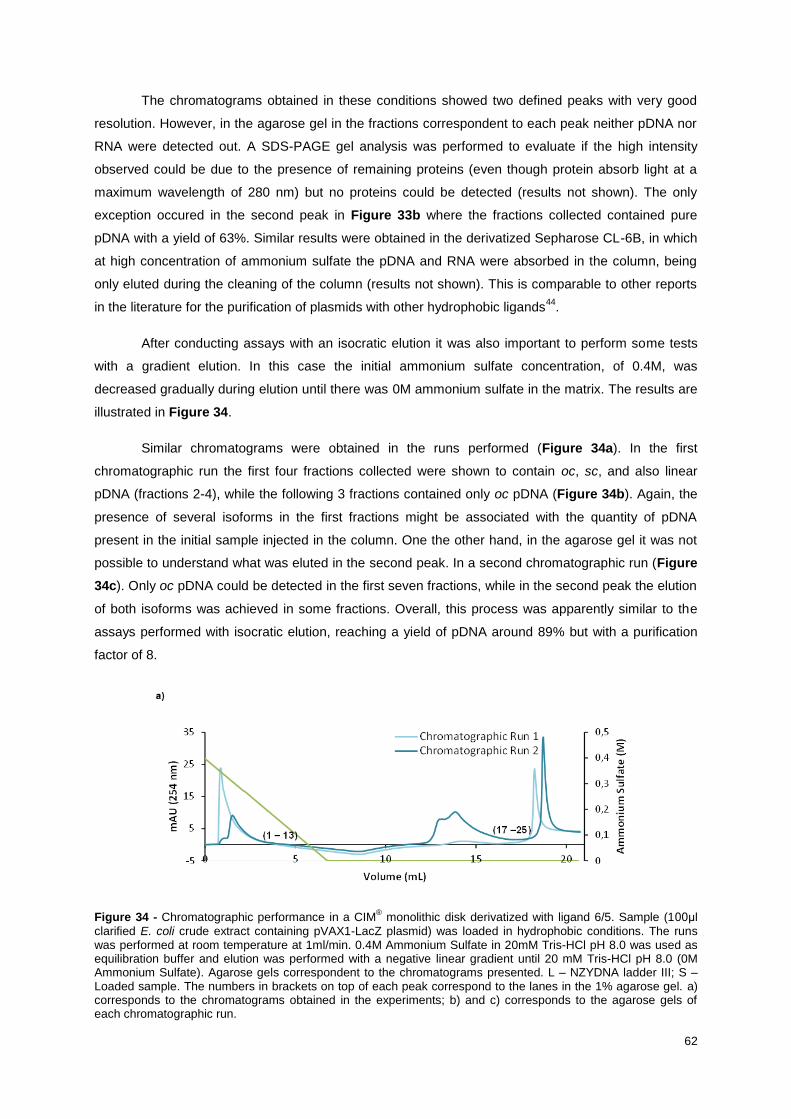
62
The chromatograms obtained in these conditions showed two defined peaks with very good
resolution. However, in the agarose gel in the fractions correspondent to each peak neither pDNA nor
RNA were detected out. A SDS-PAGE gel analysis was performed to evaluate if the high intensity
observed could be due to the presence of remaining proteins (even though protein absorb light at a
maximum wavelength of 280 nm) but no proteins could be detected (results not shown). The only
exception occured in the second peak in Figure 33b where the fractions collected contained pure
pDNA with a yield of 63%. Similar results were obtained in the derivatized Sepharose CL-6B, in which
at high concentration of ammonium sulfate the pDNA and RNA were absorbed in the column, being
only eluted during the cleaning of the column (results not shown). This is comparable to other reports
in the literature for the purification of plasmids with other hydrophobic ligands44
.
After conducting assays with an isocratic elution it was also important to perform some tests
with a gradient elution. In this case the initial ammonium sulfate concentration, of 0.4M, was
decreased gradually during elution until there was 0M ammonium sulfate in the matrix. The results are
illustrated in Figure 34.
Similar chromatograms were obtained in the runs performed (Figure 34a). In the first
chromatographic run the first four fractions collected were shown to contain oc, sc, and also linear
pDNA (fractions 2-4), while the following 3 fractions contained only oc pDNA (Figure 34b). Again, the
presence of several isoforms in the first fractions might be associated with the quantity of pDNA
present in the initial sample injected in the column. One the other hand, in the agarose gel it was not
possible to understand what was eluted in the second peak. In a second chromatographic run (Figure
34c). Only oc pDNA could be detected in the first seven fractions, while in the second peak the elution
of both isoforms was achieved in some fractions. Overall, this process was apparently similar to the
assays performed with isocratic elution, reaching a yield of pDNA around 89% but with a purification
factor of 8.
Figure 34 - Chromatographic performance in a CIM® monolithic disk derivatized with ligand 6/5. Sample (100μl
clarified E. coli crude extract containing pVAX1-LacZ plasmid) was loaded in hydrophobic conditions. The runs was performed at room temperature at 1ml/min. 0.4M Ammonium Sulfate in 20mM Tris-HCl pH 8.0 was used as equilibration buffer and elution was performed with a negative linear gradient until 20 mM Tris-HCl pH 8.0 (0M Ammonium Sulfate). Agarose gels correspondent to the chromatograms presented. L – NZYDNA ladder III; S – Loaded sample. The numbers in brackets on top of each peak correspond to the lanes in the 1% agarose gel. a) corresponds to the chromatograms obtained in the experiments; b) and c) corresponds to the agarose gels of each chromatographic run.
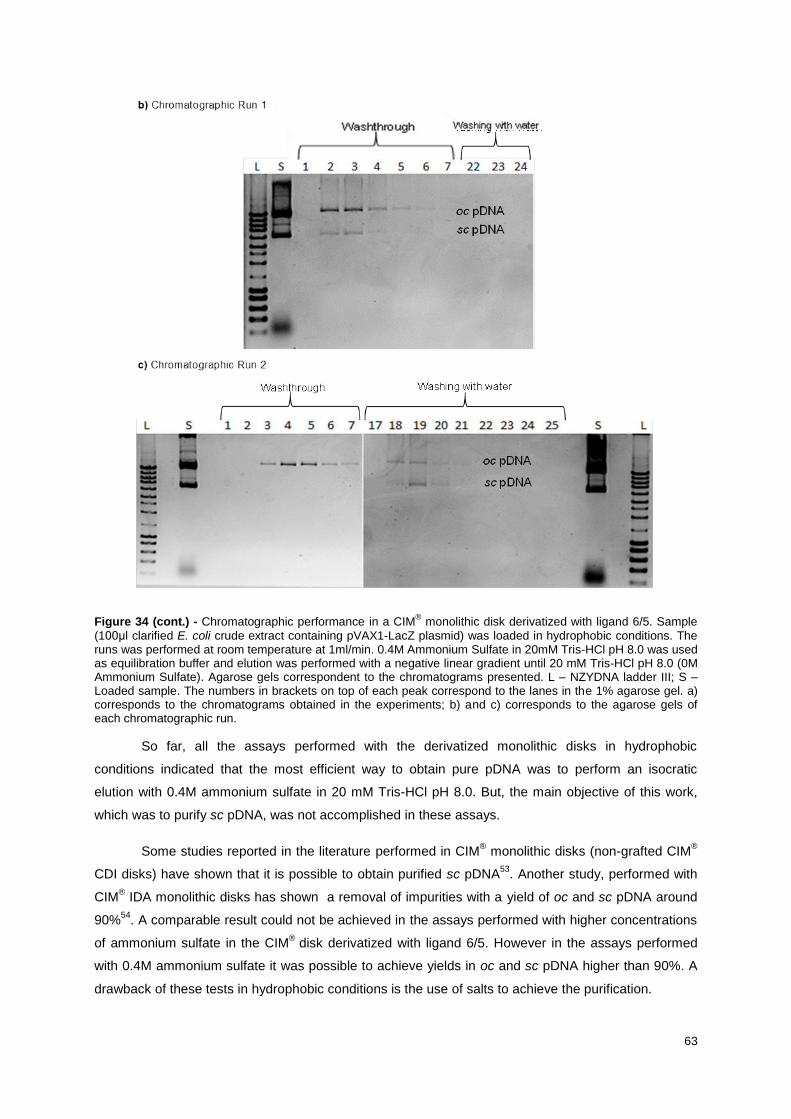
63
Figure 34 (cont.) - Chromatographic performance in a CIM® monolithic disk derivatized with ligand 6/5. Sample
(100μl clarified E. coli crude extract containing pVAX1-LacZ plasmid) was loaded in hydrophobic conditions. The runs was performed at room temperature at 1ml/min. 0.4M Ammonium Sulfate in 20mM Tris-HCl pH 8.0 was used as equilibration buffer and elution was performed with a negative linear gradient until 20 mM Tris-HCl pH 8.0 (0M Ammonium Sulfate). Agarose gels correspondent to the chromatograms presented. L – NZYDNA ladder III; S – Loaded sample. The numbers in brackets on top of each peak correspond to the lanes in the 1% agarose gel. a) corresponds to the chromatograms obtained in the experiments; b) and c) corresponds to the agarose gels of each chromatographic run.
So far, all the assays performed with the derivatized monolithic disks in hydrophobic
conditions indicated that the most efficient way to obtain pure pDNA was to perform an isocratic
elution with 0.4M ammonium sulfate in 20 mM Tris-HCl pH 8.0. But, the main objective of this work,
which was to purify sc pDNA, was not accomplished in these assays.
Some studies reported in the literature performed in CIM® monolithic disks (non-grafted CIM
®
CDI disks) have shown that it is possible to obtain purified sc pDNA53
. Another study, performed with
CIM® IDA monolithic disks has shown a removal of impurities with a yield of oc and sc pDNA around
90%54
. A comparable result could not be achieved in the assays performed with higher concentrations
of ammonium sulfate in the CIM®
disk derivatized with ligand 6/5. However in the assays performed
with 0.4M ammonium sulfate it was possible to achieve yields in oc and sc pDNA higher than 90%. A
drawback of these tests in hydrophobic conditions is the use of salts to achieve the purification.
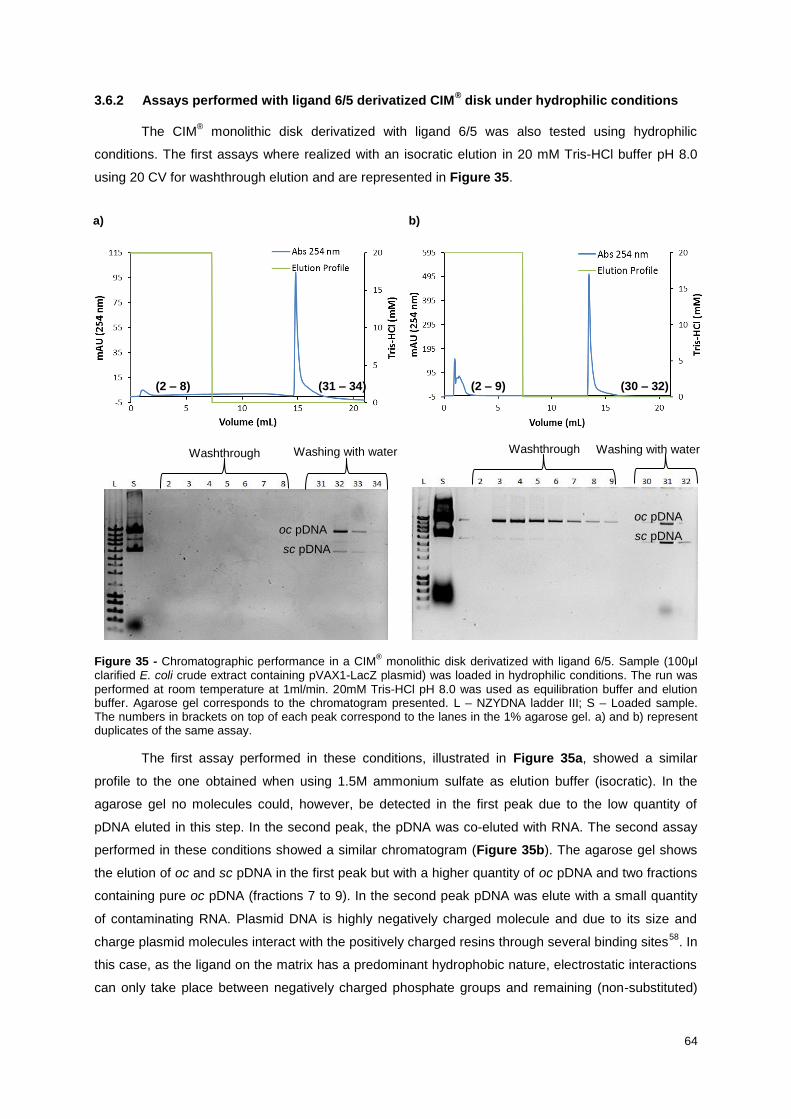
64
3.6.2 Assays performed with ligand 6/5 derivatized CIM® disk under hydrophilic conditions
The CIM® monolithic disk derivatized with ligand 6/5 was also tested using hydrophilic
conditions. The first assays where realized with an isocratic elution in 20 mM Tris-HCl buffer pH 8.0
using 20 CV for washthrough elution and are represented in Figure 35.
Figure 35 - Chromatographic performance in a CIM® monolithic disk derivatized with ligand 6/5. Sample (100μl
clarified E. coli crude extract containing pVAX1-LacZ plasmid) was loaded in hydrophilic conditions. The run was
performed at room temperature at 1ml/min. 20mM Tris-HCl pH 8.0 was used as equilibration buffer and elution buffer. Agarose gel corresponds to the chromatogram presented. L – NZYDNA ladder III; S – Loaded sample. The numbers in brackets on top of each peak correspond to the lanes in the 1% agarose gel. a) and b) represent duplicates of the same assay.
The first assay performed in these conditions, illustrated in Figure 35a, showed a similar
profile to the one obtained when using 1.5M ammonium sulfate as elution buffer (isocratic). In the
agarose gel no molecules could, however, be detected in the first peak due to the low quantity of
pDNA eluted in this step. In the second peak, the pDNA was co-eluted with RNA. The second assay
performed in these conditions showed a similar chromatogram (Figure 35b). The agarose gel shows
the elution of oc and sc pDNA in the first peak but with a higher quantity of oc pDNA and two fractions
containing pure oc pDNA (fractions 7 to 9). In the second peak pDNA was elute with a small quantity
of contaminating RNA. Plasmid DNA is highly negatively charged molecule and due to its size and
charge plasmid molecules interact with the positively charged resins through several binding sites58
. In
this case, as the ligand on the matrix has a predominant hydrophobic nature, electrostatic interactions
can only take place between negatively charged phosphate groups and remaining (non-substituted)
a) b)
(2 – 8) (31 – 34)
Washthrough Washing with water
oc pDNA
sc pDNA
(2 – 9) (30 – 32)
Washing with water Washthrough
oc pDNA
sc pDNA
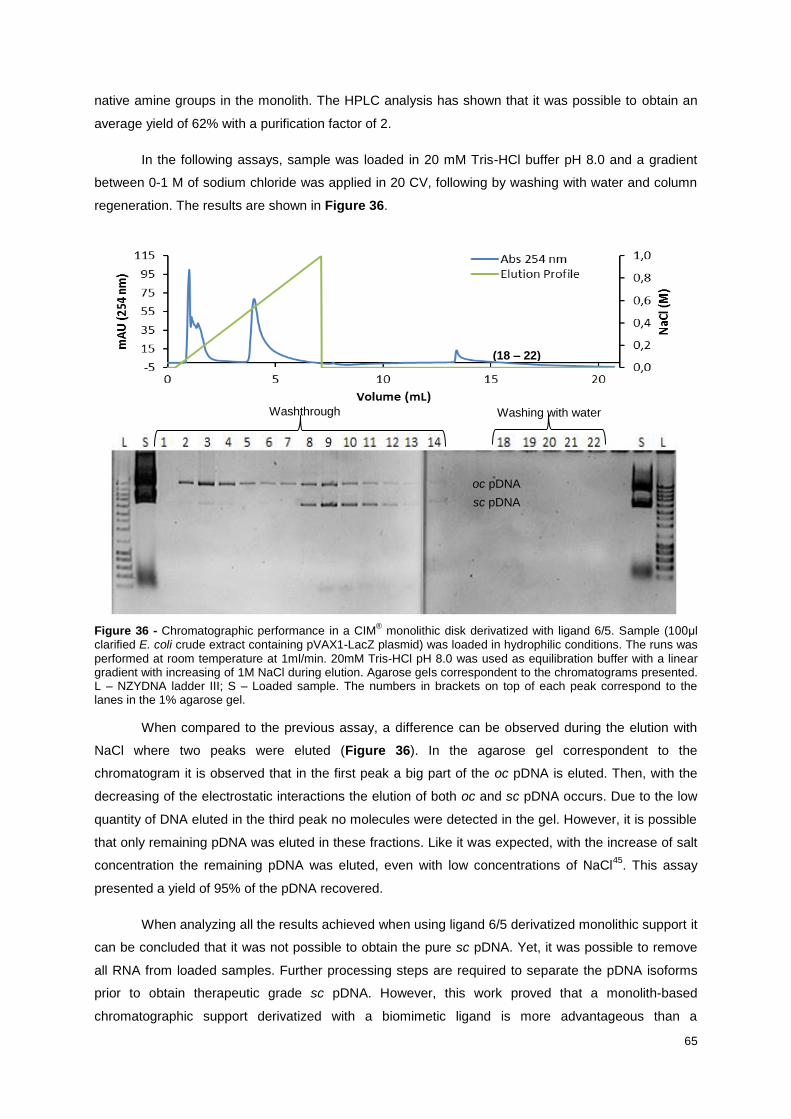
65
native amine groups in the monolith. The HPLC analysis has shown that it was possible to obtain an
average yield of 62% with a purification factor of 2.
In the following assays, sample was loaded in 20 mM Tris-HCl buffer pH 8.0 and a gradient
between 0-1 M of sodium chloride was applied in 20 CV, following by washing with water and column
regeneration. The results are shown in Figure 36.
Figure 36 - Chromatographic performance in a CIM® monolithic disk derivatized with ligand 6/5. Sample (100μl
clarified E. coli crude extract containing pVAX1-LacZ plasmid) was loaded in hydrophilic conditions. The runs was
performed at room temperature at 1ml/min. 20mM Tris-HCl pH 8.0 was used as equilibration buffer with a linear gradient with increasing of 1M NaCl during elution. Agarose gels correspondent to the chromatograms presented. L – NZYDNA ladder III; S – Loaded sample. The numbers in brackets on top of each peak correspond to the lanes in the 1% agarose gel.
When compared to the previous assay, a difference can be observed during the elution with
NaCl where two peaks were eluted (Figure 36). In the agarose gel correspondent to the
chromatogram it is observed that in the first peak a big part of the oc pDNA is eluted. Then, with the
decreasing of the electrostatic interactions the elution of both oc and sc pDNA occurs. Due to the low
quantity of DNA eluted in the third peak no molecules were detected in the gel. However, it is possible
that only remaining pDNA was eluted in these fractions. Like it was expected, with the increase of salt
concentration the remaining pDNA was eluted, even with low concentrations of NaCl45
. This assay
presented a yield of 95% of the pDNA recovered.
When analyzing all the results achieved when using ligand 6/5 derivatized monolithic support it
can be concluded that it was not possible to obtain the pure sc pDNA. Yet, it was possible to remove
all RNA from loaded samples. Further processing steps are required to separate the pDNA isoforms
prior to obtain therapeutic grade sc pDNA. However, this work proved that a monolith-based
chromatographic support derivatized with a biomimetic ligand is more advantageous than a
(18 – 22)
8 – 13)
Washing with water Washthrough
oc pDNA
sc pDNA
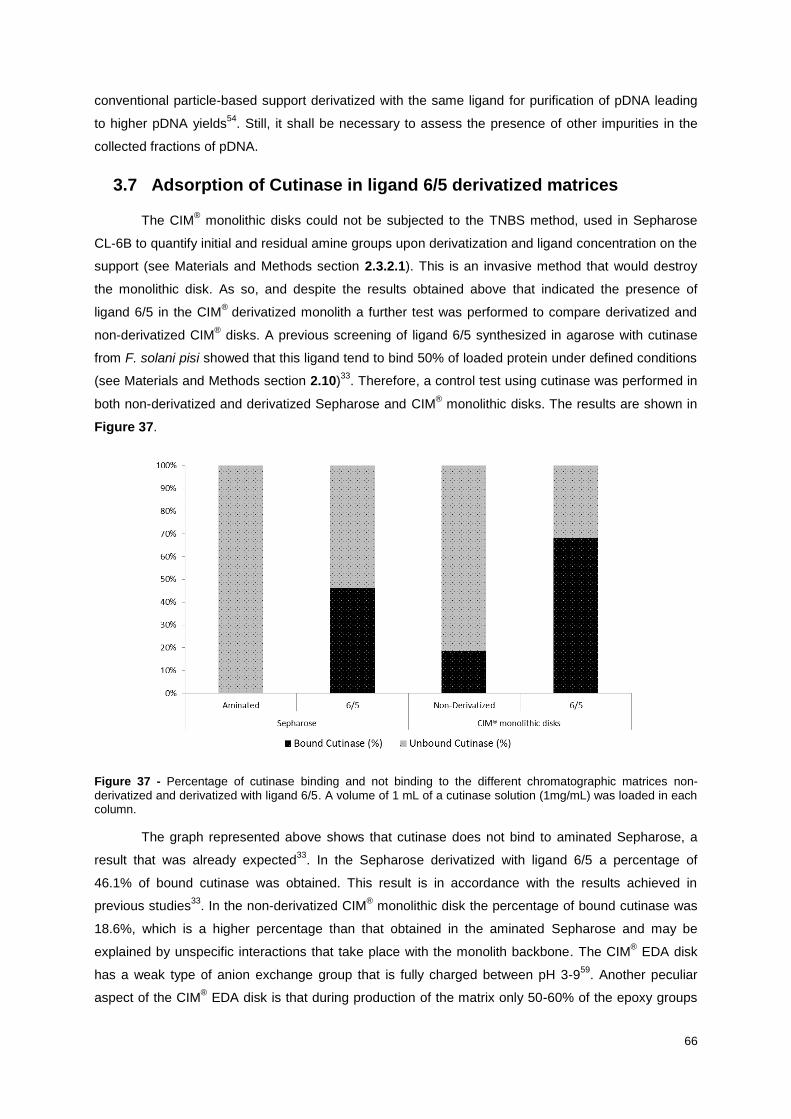
66
conventional particle-based support derivatized with the same ligand for purification of pDNA leading
to higher pDNA yields54
. Still, it shall be necessary to assess the presence of other impurities in the
collected fractions of pDNA.
3.7 Adsorption of Cutinase in ligand 6/5 derivatized matrices
The CIM® monolithic disks could not be subjected to the TNBS method, used in Sepharose
CL-6B to quantify initial and residual amine groups upon derivatization and ligand concentration on the
support (see Materials and Methods section 2.3.2.1). This is an invasive method that would destroy
the monolithic disk. As so, and despite the results obtained above that indicated the presence of
ligand 6/5 in the CIM®
derivatized monolith a further test was performed to compare derivatized and
non-derivatized CIM® disks. A previous screening of ligand 6/5 synthesized in agarose with cutinase
from F. solani pisi showed that this ligand tend to bind 50% of loaded protein under defined conditions
(see Materials and Methods section 2.10)33
. Therefore, a control test using cutinase was performed in
both non-derivatized and derivatized Sepharose and CIM® monolithic disks. The results are shown in
Figure 37.
Figure 37 - Percentage of cutinase binding and not binding to the different chromatographic matrices non-
derivatized and derivatized with ligand 6/5. A volume of 1 mL of a cutinase solution (1mg/mL) was loaded in each column.
The graph represented above shows that cutinase does not bind to aminated Sepharose, a
result that was already expected33
. In the Sepharose derivatized with ligand 6/5 a percentage of
46.1% of bound cutinase was obtained. This result is in accordance with the results achieved in
previous studies33
. In the non-derivatized CIM® monolithic disk the percentage of bound cutinase was
18.6%, which is a higher percentage than that obtained in the aminated Sepharose and may be
explained by unspecific interactions that take place with the monolith backbone. The CIM® EDA disk
has a weak type of anion exchange group that is fully charged between pH 3-959
. Another peculiar
aspect of the CIM® EDA disk is that during production of the matrix only 50-60% of the epoxy groups

67
are converted with the remaining epoxy groups being ended capped with OH groups (information
provided by BIA Separations). These groups available in the disk can have some capacity to interact
with cutinase, explaining the higher value of enzyme that was bound to the matrix. The derivatized
monolith presented a value of 68.1% of cutinase bound to the matrix. The difference (49.8%) is
comparable to the result obtained with Sepharose.
These results could confirm the presence of ligand 6/5 in the CIM® derivatized monolith,
although its density in the matrix was not determined in the present work.
4. Conclusion
The assessment of a large combinatorial library of triazine-scaffolded synthetic affinity ligands to
bind nucleic acids and potentially purify plasmid DNA from E. coli crude extracts was performed in a
previous work. From this previous screening, two symmetric ligands (5/6 and 6/5), mimicking a
dipeptide Phe-Leu, were selected and their capability to purify pDNA was studied.
Sepharose CL-6B derivatized with ligands 5/6 and 6/5 was used in gravity flow assays to purify a
plasmid (pVAX1-LacZ) in both hydrophobic and hydrophilic conditions. Under hydrophobic binding
conditions (20 mM Tris HCl buffer pH 8.0 with 0.4 M ammonium sulphate) both ligands have shown
that it was possible to purify sc pDNA in some fractions excluded from the columns. pDNA (oc pDNA
and sc pDNA) was separated from RNA that was totally retained in the column. With a hydrophilic
binding environment (20 mM Tris HCl buffer pH 8.0) the behavior of solid-phase synthesized ligands
was less symmetric. With ligand 5/6, the RNA was less retained in the column, and co-eluted partially
with pDNA. Oppositely, when performing the assays with ligand 6/5 the removal of RNA was
accomplished and isolation of sc pDNA was obtained in some fractions.
Ligand 6/5 was also shown to perform similarly with three plasmids of different sizes (pVAX1-
LacZ (6.1 kb), pCEP4 (10.4 kb) and pVAX1TSAGFP (5.1 kb)) under hydrophobic conditions.
Based on these results, ligand 6/5 was chosen as the lead to perform chromatographic assays in
the AKTA purifier system.
Different elution buffers were studied for separation of RNA from plasmid DNA isoforms using
Sepharose CL-6B derivatized with ligand 6/5 in the AKTA purifier system. Assays were performed with
0.4M, 0.8M and 1.5M of ammonium sulfate in the binding buffer. Similar purification results could be
obtained in these assays, although the reproducibility in some cases was not fully proven.
Nevertheless, in most assays, RNA was retained in the column while pDNA was excluded in the flow
through fractions. With 20 mM Tris HCl buffer pH 8.0 containing 0.8M sodium citrate, purification of sc
pDNA was also obtained in some fractions and pDNA was equally isolated from RNA.
The derivatization of CIM® monoliths with triazine-scaffold synthetic affinity ligands has been
attempted and successfully achieved.
68
CIM® monolithic disks were derivatized with ligand 6/5 following a solid-phase protocol well
established for agarose. It was demonstrated that, despite the manufacturer’s instructions, CIM®
monolithic disks stand stable at 82°C, for 72 hours. These conditions were established to be the
minimal required to ensure a value of 90% of derivatization in a systematic study of solid-phase
synthesis of ligand 6/5 in Sepharose CL-6B, at different temperatures and incubation times.
Although a quantitative assessment of ligand 6/5 density on the CIM® support was not possible
with the methodology used for Sepharose CL-6B (TNBS test) the presence of the ligand in CIM®-
derivatized disks was assessed and confirmed by the binding profile towards cutinase from Fusarium
solani pisi, which was similar to the one reported in previous studies with ligand 6/5-agarose
adsorbent.
Chromatographic assays were performed with the CIM® monolithic disk derivatized with ligand
6/5 in conditions previously tested with ligand 6/5 derivatized Sepharose CL-6B. Similar elution
patterns for pDNA and RNA were obtained when comparing with Sepharose CL-6B under identical
binding/elution conditions. In hydrophobic (best) conditions pDNA was excluded in the wash through
fractions while RNA was mostly retained in the column.
With CIM® monolithic disks, pure plasmid DNA was isolated from E. coli lysate extracts with
higher yield (91%) as compared to Sepharose (76.2) under best tested conditions (20 mM Tris HCl pH
8.0 with 0.4 M ammonium sulphate).
5. Further work
Further work will include to try to further optimize the binding and elution procedures in CIM®
derivatized monoliths with different concentrations of ammonium sulfate in the binding buffer, to
attempt the separation of sc pDNA (more hydrophobic) from oc DNA isoform (less hydrophobic). This
would include the use ammonium sulfate substitutes to promote hydrophobic interaction with the
ligand. Sodium citrate was used in the present work at 0.8 M concentration. However, some assays
could be performed in different concentrations. All tests were carried out in Tris-HCl buffer. Another
salt/buffer described in the literature as an effective promoter of hydrophobic binding with related
ligands is potassium phosphate51
. The binding temperature in hydrophobic conditions could also be
changed as it could affect ligand 6/5 affinity/binding towards pDNA.
The work for this dissertation was based in one ligand (6/5, mimic of a Phe-Leu dipeptide). Other
ligands already described as potential good ligands in the screening of a large combinatorial ligand
library could also be tested in CIM monolithic disks. Ligands such as 1/8 (mimic of Ala-Gln), 3/5 (mimic
of Tyr-Phe), 4/3 (mimic of Lys-Tyr), 5/8 (mimic of Phe-Gln) and 5/11 (mimic of Phe-Ile) that also
exhibited different affinities towards different DNA sequences could be exposed to the same tests
performed with ligand 6/5 in Sepharose CL-6B and, depending on the results, also in CIM® monolithic
disks34
.
69
In order to obtain a known density of ligands in the CIM® monolithic disks it is important to
perform a non-invasive methodology to quantify amine groups on the surface of the support. A
possible method is to monitor the initial and post-modification residual amine groups with a ionic
capacity measurement60
.
Finally, it would also be important to perform a purity assessment to quantify overall contaminants
removal. Only RNA removal was assessed in the present work. However, it would be necessary to
ensure the elimination of other contaminants like proteins, endotoxins and gDNA by performing
appropriate assays required for this evaluation44,55
.
70
6. References
1. Sousa, A., Sousa, F. and Queiroz, J.A. Differential interactions of plasmid DNA, RNA and genomic DNA with amino acid-based affinity matrices. J. Sep. Sci. 33, 2610–8 (2010).
2. Han, Y., Liu, S., Ho, J., Danquah, M.K. and Forde, G.M. Using DNA as a drug—Bioprocessing and delivery strategies. Chem. Eng. Res. Des. 87, 343–348 (2009).
3. Shamlou, P.A. Scaleable processes for the manufacture of therapeutic quantities of plasmid DNA. Biotechnol. Appl. Biochem. 37, 207–18 (2003).
4. Sousa, F., Prazeres, D.M.F. and Queiroz, J.A. Affinity chromatography approaches to overcome the challenges of purifying plasmid DNA. Trends Biotechnol. 26, 518–25 (2008).
5. Diogo, M.., Queiroz, J.A. and Prazeres, D.M.F. Chromatography of plasmid DNA. J. Chromatogr. A 1069, 3–22 (2005).
6. Ghanem, A., Healey, R. and Adly, F.G. Current trends in separation of plasmid DNA vaccines: a review. Anal. Chim. Acta 760, 1–15 (2013).
7. Diogo, M.M. Queiroz, J.A, Monteiro, G.A., Martins, S.A.M., Ferreira, G.N.M. and Prazeres, D.M.F. Purification of a cystic fibrosis plasmid vector for gene therapy using hydrophobic interaction chromatography. Biotechnol. Bioeng. 68, 576–83 (2000).
8. Prazeres, D.M.F., Ferreira, G.N.M., Monteiro, G.A., Cooney, C.L. and Cabral, J.M.S. Large-scale production of pharmaceutical-grade plasmid DNA for gene therapy : problems and bottlenecks. 17, 169–174 (1999).
9. Ferreira, G.N.M., Monteiro, G.A., Prazeres, D.M.F. and Cabral, J.M.S. Downstream processing of plasmid DNA for gene therapy and DNA vaccine applications. 18, 380–388 (2000).
10. Prather, K.J., Sagar, S., Murphy, J. and Chartrain, M. Industrial scale production of plasmid DNA for vaccine and gene therapy: plasmid design, production, and purification. Enzyme Microb. Technol. 33, 865–883 (2003).
11. Ferreira, G.N.M. Chromatographic Approaches in the Purification of Plasmid DNA for Therapy and Vaccination. Chem. Eng. Technol. 28, 1285–1294 (2005).
12. Balagurumoorthy, P., Adelstein, S.J. and Kassis, A.I. Method to eliminate linear DNA from mixture containing nicked circular, supercoiled, and linear plasmid DNA. Anal. Biochem. 381, 172–4 (2008).
13. Sousa, A., Sousa, F. and Queiroz, J.A. Biorecognition of supercoiled plasmid DNA isoform in lysine-affinity chromatography. J. Chromatogr. B. Analyt. Technol. Biomed. Life Sci. 877, 3257–60 (2009).
14. Kelly, W.J. Perspectives on plasmid-based gene therapy: challenges for the product and the process. Biotechnol. Appl. Biochem. 37, 219–23 (2003).
15. Remaut, K., Sanders, N.N., Fayazpour, F., Demeester, J. and De Smedt, S.C. Influence of plasmid DNA topology on the transfection properties of DOTAP/DOPE lipoplexes. J. Control. Release 115, 335–43 (2006).
16. Hernández, O.R., Fernández, M.L., Hernández, J.V., Peña, M.P. and Díaz, E.M.. Scalable Technology to Produce Pharmaceutical Grade Plasmid DNA for Gene Therapy, Gene Therapy
71
- Developments and Future Perspectives, Prof. Chunsheng Kang (Ed.), ISBN: 978-953-307-617-1, InTech (2011)
17. Stadler, J., Lemmens, R. and Nyhammar, T. Plasmid DNA purification. J. Gene Med. 6 Suppl 1, S54–66 (2004).
18. Prazeres, D.M.F., Schluep, T. and Cooney, C. Preparative purification of supercoiled plasmid DNA using anion-exchange chromatography. J. Chromatogr. A 806, 31–45 (1998).
19. Freitas, S.S., Santos, J.A.L. and Prazeres, D.M.F. Plasmid purification by hydrophobic interaction chromatography using sodium citrate in the mobile phase. Sep. Purif. Technol. 65, 95–104 (2009).
20. Queiroz, J.A., Tomaz, C.T. and Cabral, J.M.S. Hydrophobic interaction chromatography of proteins. J. Biotechnol. 87, 143–59 (2001).
21. Tetala, K.K.R. and van Beek, T.A. Bioaffinity chromatography on monolithic supports. J. Sep. Sci. 33, 422–38 (2010).
22. Mallik, R. and Hage, D.S. Affinity monolith chromatography. J. Sep. Sci. 29, 1686–1704 (2006).
23. Hage, D.S., Anguizola, J.A., Bi, C., Li, R., Matsuda, R., Papastavros, E., Pfaunmiller, E., Vargas, J., Zheng, X. Pharmaceutical and biomedical applications of affinity chromatography: recent trends and developments. J. Pharm. Biomed. Anal. 69, 93–105 (2012).
24. Roque, A.C.A. and Lowe, C.R. Advances and applications of de novo designed affinity ligands in proteomics. Biotechnol. Adv. 24, 17–26 (2006).
25. Lowe, C.R., Lowe, A.R. and Gupta, G. New developments in affinity chromatography with potential application in the production of biopharmaceuticals. J. Biochem. Biophys. Methods 49, 561–74 (2001).
26. Lowe, C.R. Combinatorial approaches to affinity chromatography. Curr. Opin. Chem. Biol. 5, 248–56 (2001).
27. Roque, A.C.A., Taipa, M.A. and Lowe, C.R. A new method for the screening of solid-phase combinatorial libraries for affinity chromatography. J. Mol. Recognit. 17, 262–7 (2004).
28. Roque, A.C.A., Taipa, M.A. and Lowe, C.R. Synthesis and screening of a rationally designed combinatorial library of affinity ligands mimicking protein L from Peptostreptococcus magnus. J. Mol. Recognit. 18, 213–24 (2005).
29. Sousa, F., Cruz, C. and Queiroz, J.A. Amino acids-nucleotides biomolecular recognition: from biological occurrence to affinity chromatography. J. Mol. Recognit. 23, 505–18 (2010).
30. Sousa, F., Tomaz, C.T., Prazeres, D.M.F. and Queiroz, J.A. Separation of supercoiled and open circular plasmid DNA isoforms by chromatography with a histidine-agarose support. Anal. Biochem. 343, 183–5 (2005).
31. Sousa, F., Matos, T., Prazeres, D.M.F. and Queiroz, J.A. Specific recognition of supercoiled plasmid DNA in arginine affinity chromatography. Anal. Biochem. 374, 432–4 (2008).
32. Sousa, A., Sousa, F., Prazeres, D.M.F. and Queiroz, J.A. Histidine affinity chromatography of homo-oligonucleotides. Role of multiple interactions on retention. Biomed. Chromatogr. 23, 745–53 (2009).
72
33. Sousa, I.T., Ruiu, L., Lowe, C.R. and Taipa, M.A. Synthetic affinity ligands as a novel tool to improve protein stability. J. Mol. Recognit. 22, 83–90 (2009).
34. Belchior, J.F.R. Screening and evaluation of synthetic protein-mimic affinity ligands for the purification of plasmid DNA. M.Sc Diss. Biotechnol. Inst. Super. Técnico, Univ. Lisboa (2013).
35. Sproß, J. and Sinz, A. Monolithic media for applications in affinity chromatography. J. Sep. Sci. 1958–1973 (2011). doi:10.1002/jssc.201100400
36. CIM Convective Interaction Media. at <http://www.biaseparations.com/education/brochures/product/download/file_id-730>
37. Brne, P. Convective Interaction Media short monolithic columns : Enabling chromatographic supports for the separation and purification of large biomolecules Review. 1876–1892 (2005).
38. Palanisamy, U.D., Hussain, A., Iqbal, S., Sproule, K. and Lowe, C.R. Design, synthesis and characterisation of affinity ligands for glycoproteins. J. Mol. Recognit. 12, 57–66 (1999).
39. Filippusson, H., Erlendsson, L.S. and Lowe, C.R. Design, synthesis and evaluation of biomimetic affinity ligands for elastases. J. Mol. Recognit. 13, 370–381 (2000).
40. Antoni, G., Presentini, R. and Neri, P. A simple method for the estimation of amino groups on insoluble matrix beads. Anal. Biochem. 129, 60–3 (1983).
41. Teng, S.F., Sproule, K., Hussain, A. and Lowe, C.R. A strategy for the generation of biomimetic ligands for affinity chromatography . Combinatorial synthesis and biological evaluation of an IgG binding ligand. 67–75 (1999).
42. Roque, A.C.A., Taipa, M.A. and Lowe, C.R. An artificial protein L for the purification of immunoglobulins and Fab fragments by affinity chromatography. J. Chromatogr. A 1064, 157–167 (2005).
43. Diogo, M.M., Queiroz, J.A, Prazeres, D.M.F.. Assessment of purity and quantification of plasmid DNA in process solutions using high-performance hydrophobic interaction chromatography. J. Chromatogr. A 998, 109–117 (2003).
44. Caramelo-Nunes, C., Gabriel, M.F., Almeida, P., Marcos, J.C. and Tomaz, C.T. Negative pseudo-affinity chromatography for plasmid DNA purification using berenil as ligand. J. Chromatogr. B. Analyt. Technol. Biomed. Life Sci. 944, 39–42 (2014).
45. Benčina, M., Podgornik, A. and Štrancar, A. Characterization of methacrylate monoliths for purification of DNA molecules. J. Sep. Sci. 27, 801–810 (2004).
46. Diogo, M.M., Queiroz, J.A., Monteiro, G.A. and Prazeres, D.M.F. Separation and analysis of plasmid denatured forms using hydrophobic interaction chromatography. Anal. Biochem. 275, 122–4 (1999).
47. Bicho, D., Sousa, Â., Sousa, F., Queiroz, J.A. and Tomaz, C.T. Effect of chromatographic conditions and plasmid DNA size on the dynamic binding capacity of a monolithic support. J. Sep. Sci. 37, 2284–92 (2014).
48. Moreira, K.A., Diogo, M.M., Prazeres, D.M.F., Filho, J.L.L. and Porto, A.L.F. Purification of plasmid ( pVaxLacZ ) by hydrophobic interaction chromatography. Braz. Arch.Biol. Technol. 48, 113–117 (2005).
73
49. Pereira, L.R., Prazeres, D.M.F. and Mateus, M. Hydrophobic interaction membrane chromatography for plasmid DNA purification: Design and optimization. J. Sep. Sci. 33, 1175–84 (2010).
50. Urthaler, J., Schlegl, R., Podgornik, A., Strancar, A., Jungbauer, A. and Necina, R. Application of monoliths for plasmid DNA purification. J. Chromatogr. A 1065, 93–106 (2005).
51. Bonturi, N., Radke, V.S.C.O., Bueno, S.M.A., Freitas, S., Azzoni, A.R. and Miranda, E.A.Sodium citrate and potassium phosphate as alternative adsorption buffers in hydrophobic and aromatic thiophilic chromatographic purification of plasmid DNA from neutralized lysate. J. Chromatogr. B. 919-920, 67–74 (2013).
52. Mota, É., Sousa, A., Černigoj, U., Queiroz, J.A., Tomaz, C.T. and Sousa, F. Rapid quantification of supercoiled plasmid deoxyribonucleic acid using a monolithic ion exchanger. J. Chromatogr. A 1291, 114–21 (2013).
53. Sousa, A., Bicho, D., Tomaz, C.T., Sousa, F. and Queiroz, J.A. Performance of a non-grafted
monolithic support for purification of supercoiled plasmid DNA ଝ. J. Chromatogr. A 1218,
1701–1706 (2011).
54. Shin, M.J., Tan, L., Jeong, M.H., Kim, J.H. and Choe, W.S. Monolith-based immobilized metal affinity chromatography increases production efficiency for plasmid DNA purification. J. Chromatogr. A 1218, 5273–8 (2011).
55. Sousa, A., Tomaz, C.T., Sousa, F. and Queiroz, J.A. Successful application of monolithic innovative technology using a carbonyldiimidazole disk to purify supercoiled plasmid DNA suitable for pharmaceutical applications. J. Chromatogr. A 1218, 8333–43 (2011).
56. Han, Y., You, G., Pattenden, L.K. and Forde, G.M. The harnessing of peptide–monolith constructs for single step plasmid DNA purification. Process Biochem. 45, 203–209 (2010).
57. Smrekar, F., Podgornik, A., Ciringer, M., Kontrec, S., Raspor, P., Strancar, A. and Peterka, M. Preparation of pharmaceutical-grade plasmid DNA using methacrylate monolithic columns. Vaccine 28, 2039–45 (2010).
58. Danquah, M.K. and Forde, G.M. The suitability of DEAE-Cl active groups on customized poly(GMA-co-EDMA) continuous stationary phase for fast enzyme-free isolation of plasmid DNA. J. Chromatogr. B. Analyt. Technol. Biomed. Life Sci. 853, 38–46 (2007).
59. EDA for Ligand Immobilization. at <http://www.biaseparations.com/interactions/category/32-activated/category/118-eda-for-ligand-immobil>
60. Podgornik, A., Vidič, J., Jančar, J., Lendero, N., Frankovič, V. and Štrancar, A. Noninvasive Methods for Characterization of Large-Volume Monolithic Chromatographic Columns. Chem. Eng. Technol. 28, 1435–1441 (2005).
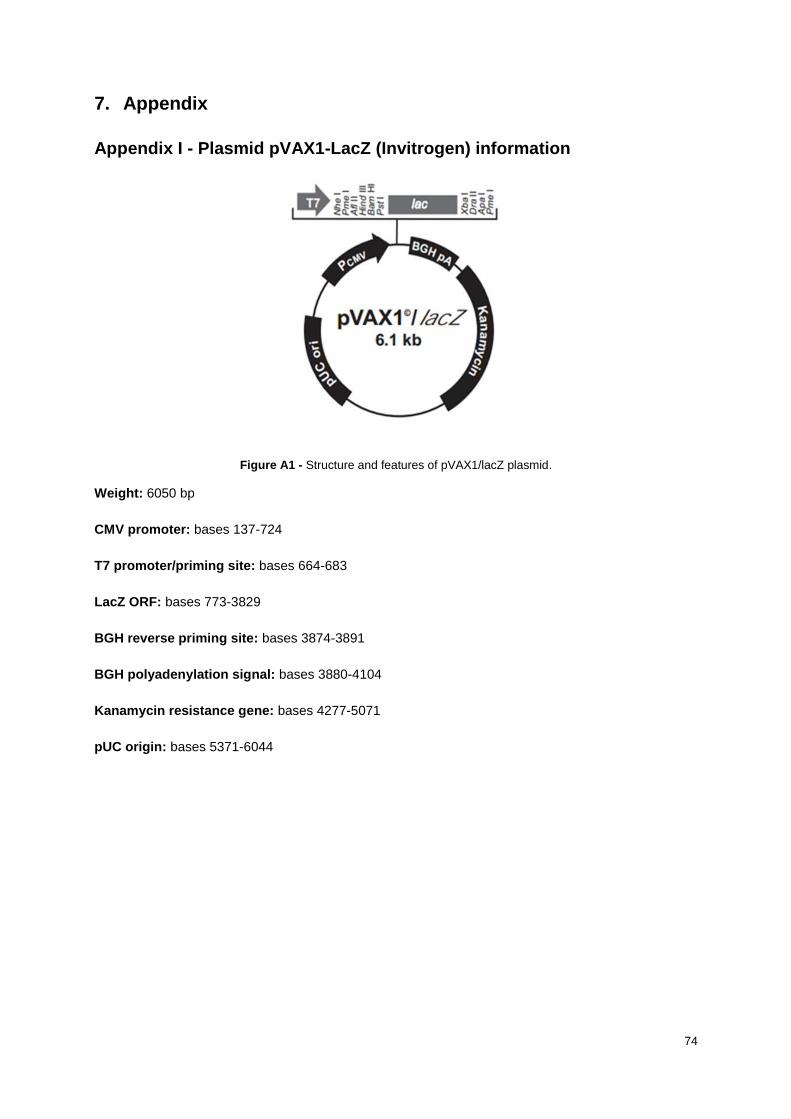
74
7. Appendix
Appendix I - Plasmid pVAX1-LacZ (Invitrogen) information
Figure A1 - Structure and features of pVAX1/lacZ plasmid.
Weight: 6050 bp
CMV promoter: bases 137-724
T7 promoter/priming site: bases 664-683
LacZ ORF: bases 773-3829
BGH reverse priming site: bases 3874-3891
BGH polyadenylation signal: bases 3880-4104
Kanamycin resistance gene: bases 4277-5071
pUC origin: bases 5371-6044
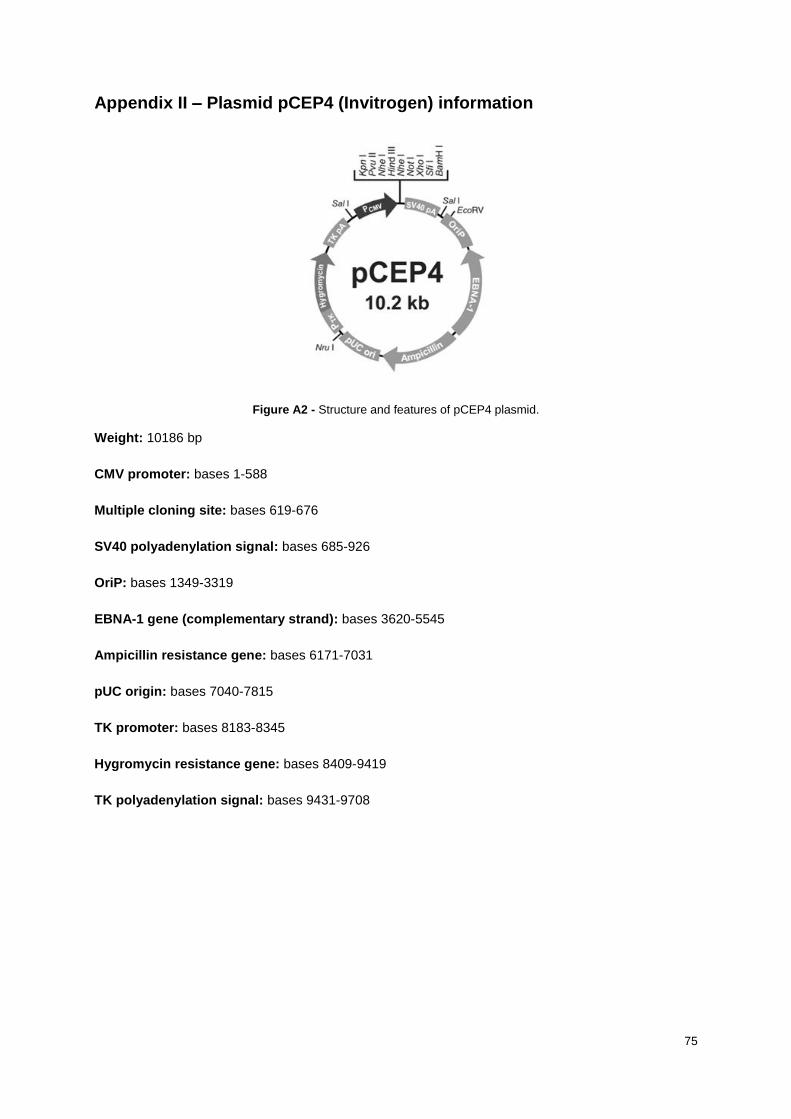
75
Appendix II – Plasmid pCEP4 (Invitrogen) information
Figure A2 - Structure and features of pCEP4 plasmid.
Weight: 10186 bp
CMV promoter: bases 1-588
Multiple cloning site: bases 619-676
SV40 polyadenylation signal: bases 685-926
OriP: bases 1349-3319
EBNA-1 gene (complementary strand): bases 3620-5545
Ampicillin resistance gene: bases 6171-7031
pUC origin: bases 7040-7815
TK promoter: bases 8183-8345
Hygromycin resistance gene: bases 8409-9419
TK polyadenylation signal: bases 9431-9708

76
Appendix III – Plasmid pVAX1TSAGFP information
Figure A3 - Structure and features of pVAX1TSAGFP plasmid.
Weight: 5112 bp
Appendix IV - NZYDNA Ladder III (NZYTech)
Figure A4 - NZYDNA Ladder III electrophoresed in a 1% (w/v) electrophoresis grade agarose gel.
NZYDNA Ladder III
Catalogue numbers:
MB04401, 200 lanes
MB04402, 500 lanes
Storage conditions: NZYDNA Ladder III should be stored at -20 °C until first use. Thereafter, the product can be
stored at 4 °C for up to 6 months. Avoid multiple freeze thaw cycles, as these can damage the product.
Shipping conditions: Room temperature
Product life: Three years
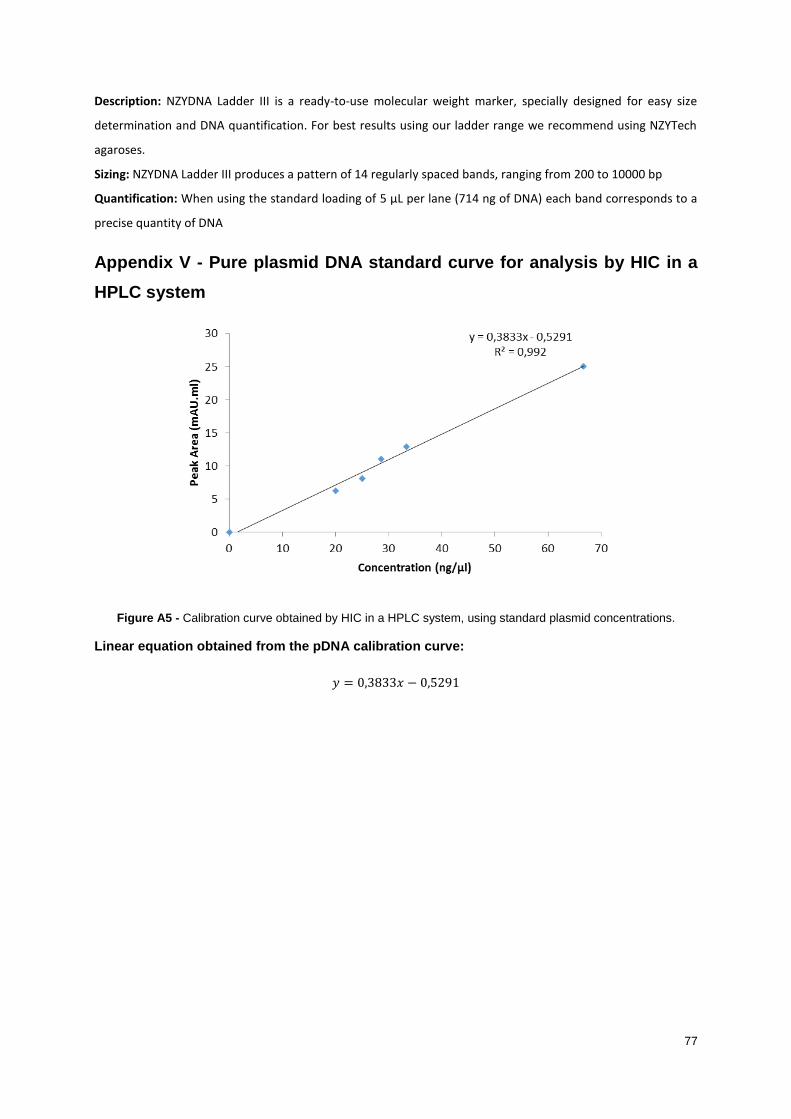
77
Description: NZYDNA Ladder III is a ready-to-use molecular weight marker, specially designed for easy size
determination and DNA quantification. For best results using our ladder range we recommend using NZYTech
agaroses.
Sizing: NZYDNA Ladder III produces a pattern of 14 regularly spaced bands, ranging from 200 to 10000 bp
Quantification: When using the standard loading of 5 µL per lane (714 ng of DNA) each band corresponds to a
precise quantity of DNA
Appendix V - Pure plasmid DNA standard curve for analysis by HIC in a
HPLC system
Figure A5 - Calibration curve obtained by HIC in a HPLC system, using standard plasmid concentrations.
Linear equation obtained from the pDNA calibration curve:
𝑦 = 0,3833𝑥 − 0,5291