Embed Size (px)
Citation preview

This article was downloaded by: [Karolinska Institutet, University Library]On: 02 October 2014, At: 14:10Publisher: Taylor & FrancisInforma Ltd Registered in England and Wales Registered Number: 1072954 Registeredoffice: Mortimer House, 37-41 Mortimer Street, London W1T 3JH, UK
Road Materials and Pavement DesignPublication details, including instructions for authors andsubscription information:http://www.tandfonline.com/loi/trmp20
Development of low-temperatureperformance specifications for asphaltmixtures using the bending beamrheometerZacGary Jonesa, Pedro Romeroa & Kevin VanFrankb
a Department of Civil & Environmental Engineering, University ofUtah, Salt Lake City, UT, USAb Construction Materials Engineering (CME), Salt Lake City, UT, USAPublished online: 23 Apr 2014.
To cite this article: ZacGary Jones, Pedro Romero & Kevin VanFrank (2014) Development of low-temperature performance specifications for asphalt mixtures using the bending beam rheometer,Road Materials and Pavement Design, 15:3, 574-587, DOI: 10.1080/14680629.2014.908135
To link to this article: http://dx.doi.org/10.1080/14680629.2014.908135
PLEASE SCROLL DOWN FOR ARTICLE
Taylor & Francis makes every effort to ensure the accuracy of all the information (the“Content”) contained in the publications on our platform. However, Taylor & Francis,our agents, and our licensors make no representations or warranties whatsoever as tothe accuracy, completeness, or suitability for any purpose of the Content. Any opinionsand views expressed in this publication are the opinions and views of the authors,and are not the views of or endorsed by Taylor & Francis. The accuracy of the Contentshould not be relied upon and should be independently verified with primary sourcesof information. Taylor and Francis shall not be liable for any losses, actions, claims,proceedings, demands, costs, expenses, damages, and other liabilities whatsoever orhowsoever caused arising directly or indirectly in connection with, in relation to or arisingout of the use of the Content.
This article may be used for research, teaching, and private study purposes. Anysubstantial or systematic reproduction, redistribution, reselling, loan, sub-licensing,systematic supply, or distribution in any form to anyone is expressly forbidden. Terms &Conditions of access and use can be found at http://www.tandfonline.com/page/terms-and-conditions

Road Materials and Pavement Design, 2014Vol. 15, No. 3, 574–587, http://dx.doi.org/10.1080/14680629.2014.908135
Development of low-temperature performance specifications for asphaltmixtures using the bending beam rheometer
ZacGary Jonesa∗, Pedro Romeroa and Kevin VanFrankb
aDepartment of Civil & Environmental Engineering, University of Utah, Salt Lake City, UT, USA;bConstruction Materials Engineering (CME), Salt Lake City, UT, USA
(Received 22 May 2013; accepted 20 March 2014 )
Thermal cracking due to stress at low temperature is a major factor in roadway degradation. Thepurpose of this study was to measure low-temperature response of asphalt mixtures from fieldcores, assess the practicality of using the bending beam rheometer (BBR) to test field mixtures,compare test results to observed field performance, determine whether a specification valuecan be obtained to evaluate low-temperature pavement performance, and determine if samplesconstructed in the laboratory using the same mix design reflect field performance. In this study,the BBR was used to test multiple field and laboratory asphalt mixtures. Field samples wereobtained from cores located in the Salt Lake Valley in Utah. The response of field cores showedthat although the same binder grade is used in the region, the resulting mixtures have significantdifferences in creep moduli and m-values. This indicates that binder testing alone might notbe enough to control the material’s creep modulus. The combination of BBR test results andfield surveys indicates that both creep modulus and m-value play a significant role in low-temperature performance of asphalt pavements. Pavements with high creep moduli and lowm-values are more susceptible to low-temperature thermal distress. From field observations,the field performance of each section was known; by plotting the test results of the field sampleson a Black Space diagram, it can be observed that a thermal stress failure envelope might exist.However, more research will be necessary to further define a specific value for this specification.
Keywords: low; temperature; asphalt; performance; bending beam rheometer; thermal distress
IntroductionThermal cracking due to stress at low temperature is a major factor in roadway degradation. Infact, many studies have found that in areas which routinely experience freezing temperatures,thermal cracking is the principal form of deterioration of asphalt pavements (Marasteanu et al.,2007). In this study, the bending beam rheometer (BBR) was used to test multiple asphalt mixturesincluding field samples and samples prepared in the laboratory. Field samples were obtained fromcores that were taken from multiple roads around the Salt Lake Valley in Utah and preparedfor BBR testing. All the mixtures were made using binders that had the same performance low-temperature grade of −28◦C, as appropriate for the region. The resulting BBR data were thencompared to low-temperature field performance. This was completed through a series of visualsurveys of the sections. Each section was surveyed on three separate occasions.
Testing asphalt mixtures using the BBR has many advantages, including existing familiaritywith the test procedures and minimal amount of material needed.
∗Corresponding author. Emails: [email protected]; [email protected]
© 2014 Taylor & Francis
Dow
nloa
ded
by [
Kar
olin
ska
Inst
itute
t, U
nive
rsity
Lib
rary
] at
14:
10 0
2 O
ctob
er 2
014

Road Materials and Pavement Design 575
Testing was completed for seven field sections to evaluate both the test method, in terms ofpracticality and precision, and the possibility of using a single-point measurement such as creepmodulus or m-value at 60 seconds for performance specification. This paper details the testingmethods employed in the study, resulting data, field surveys and conclusions.
BackgroundThermal cracking of asphalt concrete is the resulting distress from exposure to low-temperatureconditions. Like most materials, asphalt concrete contracts when exposed to low temperatures.This contraction is countered by the frictional force of the underlying layers inducing thermalstresses on the pavement. As temperatures decrease, contraction of the pavement subsequentlyincreases and results in an increase in thermal stress experienced by the pavement. Once the stressreaches the strength of the material, a crack will develop. Different materials will accumulatestresses at a different rate depending on their properties, specifically their relaxation modulus.Thus, relaxation modulus is the most important material property used to predict thermal cracking.
Low-temperature testingCurrently, there are multiple tests that can be conducted to determine low-temperature perfor-mance of asphalt mixtures. Three of the most common tests are the Temperature SpecimenRestraint Specimen Test (TSRST) (American Association of State Highway and TransportationOfficial [AASHTO], 2005; Velásquez, Labuz, Marasteanu, & Zofka, 2009), the Superpave IndirectTensile (IDT) Test (AASHTO, 2002), and the BBR Test.
Bending beam rheometerLike the IDT, the BBR is a creep test. AASHTO T313/ASTM D6648 describes the BBR, picturedin Figure 1, as being used to perform tests on beams of asphalt binder after being conditionedat the desired test temperature (AASHTO, 2009; American Society of Testing and Materials[ASTM], 2008). The test produces the creep stiffness and the stress relaxation capacity by theway of applying the elastic solution to a simply supported beam. These values have been usedto calculate thermal stresses (Marasteanu, 2004). Using the BBR to test asphalt mixtures in theplace of binder was proposed by Marasteanu et al. in different studies (Marasteanu et al., 2004;Zofka, Marasteanu, Li, Clyne, & McGraw, 2005). The compliance curves resulting from their testsshowed good correlation with curves generated by the IDT. This research was further advancedby Ho and Romero (Clendennen & Romero, 2013; Ho, 2009; Romero, Hoe, & VanFrank, 2011),who determined that BBR testing of small amounts of material can produce behavioural resultsthat are representative of the entire mixture.
While the TSRST and the IDT can be used for the prediction of low-temperature thermalcracking of asphalt pavements, they both require more material and a more involved testingprocess than the BBR. Because of this, the BBR was chosen in this study as a more practical testmethod.
Sample fabricationThe BBR test requires minimal amounts of material. Because of this, it is possible to tests multiplesample replicates directly obtained from the same field core. The samples can come from coresfrom sections with different layer thicknesses or gyratory prepared samples that are constructedin the laboratory.
Dow
nloa
ded
by [
Kar
olin
ska
Inst
itute
t, U
nive
rsity
Lib
rary
] at
14:
10 0
2 O
ctob
er 2
014

576 Z.G. Jones et al.
Figure 1. Cannon BBR.
Testing procedureBBR testing has been used to determine properties of asphalt mixes at low-temperatures(AASHTO, 2009; ASTM, 2008; Ho, 2009; Marasteanu, 2004; Marasteanu et al., 2004; Marasteanuet al., 2007; Marasteanu, Velasquez, Cannone Falchetto, & Zofka, 2009; Romero et al., 2011;Zofka et al., 2005). However, an actual limit similar to what is used to grade asphalt binders,which would indicate whether or not a mixture would experience cracking and can potentially beused to develop a performance-based specification, has not been determined. Furthermore, thereare still questions regarding the practicality of using this method on field cores.
The BBR test requires each core or gyratory sample to be cut into beams that measure12.7 mm × 6.35 mm ×127 mm (width × thickness × length). Cores often consist of more thanone layer of asphalt concrete, as shown in Figure 2.
The uppermost, or most recent, layer of each core is removed from the rest of the layers andfurther prepared for testing. The top layer can be removed by the use of a lapidary saw. In somecases, a chip seal may be present; this layer is too thin to test using the BBR, so it should alsobe removed from the uppermost layer of asphalt concrete. The remaining puck is then cut intorectangular blocks in order to maximise the number of beams each core could produce. This isshown in Figure 3. Blocks can be cut using a small tile saw. The blocks were then cut into beamswith the correct dimensions previously described.
Dow
nloa
ded
by [
Kar
olin
ska
Inst
itute
t, U
nive
rsity
Lib
rary
] at
14:
10 0
2 O
ctob
er 2
014

Road Materials and Pavement Design 577
Figure 2. Field core displaying multiple layers of asphalt concrete.
Figure 3. Example of block being removed from circular puck.
Figure 4. Template used to ensure proper beam dimensions.
The fact that each beam was only 6.35 mm thick allowed us to obtain a sufficient numberof samples from each core, even if the top layer of interest was relatively thin. As previouslymentioned, this is an advantage of using the BBR.
To ensure that each beam had consistent dimensions as specified by Romero et al. (2011),a template was used. This template, pictured in Figure 4, confirms that each beam’s width andthickness are within the acceptable range of ±0.25 mm. Acceptable beams would fit within eachof the slots, but would not be able to pass beyond the shelf. The larger slot measures width whilethe smaller slot measures thickness.
Next, the exact dimensions of each beam are measured. The measurements included totallength, thickness at one-third of the total length from each end, width one-third of the total length
Dow
nloa
ded
by [
Kar
olin
ska
Inst
itute
t, U
nive
rsity
Lib
rary
] at
14:
10 0
2 O
ctob
er 2
014

578 Z.G. Jones et al.
from each end and mass. Once the samples were cut to proper dimensions they are stored togetheron a flat tray at room temperature for less than one week. This ensures any excess water from thecutting process evaporates and prevents deformation.
All of the mixtures in this study were prepared using a low-temperature binder grade of −28◦Cin order to follow similar protocols of binder testing, and BBR testing of mixtures took place ata single temperature of −18◦C (low-temperature performance grade (PG) +10◦C). Testing wasalso conducted at other temperatures (−24◦C and −12◦C) in order to construct master curves.Before each testing session, the BBR is calibrated for both temperature and force/deflectionas recommended by the manufacturer. Prior to testing, each sample soaks in the temperaturecontrolled bath for 60 minutes to ensure that the entire beam is brought to test temperature.Testing of each sample requires approximately eight minutes. Every 10 minutes, a beam is addedto the bath. After an hour, the first beam placed in the bath is ready to test. Every 10 minutes, thebeam that has been in the bath for one hour is ready to be tested, the previously tested sampleis removed, and a new beam is placed in the bath to begin soaking. This allows for a quickand effective way to test materials. All testing procedures follow AASHTO T313 Standard TestMethod for Determining the Flexural Stiffness of Asphalt Binder Using the BBR (AASTHO, 2009)with minor modifications as described next.
The initial load (35 ± 10 mN) applied by the BBR is the same as what is described in AASHTOT313. The testing protocol of the BBR manufacturer states that the BBR can apply up to 450-gforce without further change in air-bearing system. Previous research has determined that the450 g of applied loading for the BBR test can produce significant deflections of asphalt mixturebeams at the recommended test temperatures of PG +10◦C (Romero et al., 2011; Zofka, 2007).This led to the applied load of 450 g (4413 ± 50 mN) being selected for the BBR tests in thisresearch. Each test produces a series of data that includes force and deflection as a function of time.These values are then used to calculate creep modulus and the m-value (slope of creep modulusagainst time on a log–log scale). Figure 5 shows the BBR with a beam in testing position.
Data analysisThe BBR automatically records the load and the deformation of the beam. Knowing the beamdimensions and using beam elastic solutions along with elastic-viscoelastic correspondence
Figure 5. Sample beam in the BBR testing position (pictured out of bath for clarity).
Dow
nloa
ded
by [
Kar
olin
ska
Inst
itute
t, U
nive
rsity
Lib
rary
] at
14:
10 0
2 O
ctob
er 2
014

Road Materials and Pavement Design 579
Figure 6. Individual compliance curves of three test temperatures.
principle, the compliance as a function of time of the material is determined. Following thisdetermination for each mixture, the data are averaged to obtain the compliance of the mixture asa whole. The compliance can be plotted against time to create the individual creep compliancecurve for each mixture at all three test temperatures as shown in Figure 6.
Research approachObjectivesThe objectives of this work are as follows:
• Measure the low-temperature response of asphalt mixtures obtained from field cores usingthe BBR.
• Assess the practicality of using the BBR to test field mixtures.• Compare the test results of field cores to observed field performance.• Determine whether a specification value can be obtained to evaluate low-temperature
performance of the pavement. This value should be as simple as possible.
For the BBR to be practical for field performance testing, we must eliminate the rigorouscalculations and instead focus on the implications of accessible test outputs to identify and developperformance-based specifications. Two outputs readily available from the BBR test are the creepstiffness and m-value at 60 seconds.
Creep modulus and m-valueThe standard BBR currently used in binder laboratories reports the creep stiffness and m-value at60 seconds. The term creep stiffness is simply the ratio of force to displacement and is related tothe modulus and the moment of inertia of the beam (EI, respectively). Because the geometry ofthe beams tested by the BBR is known, using the force and recorded deflection, the creep moduluscan be calculated. The m-value is the slope of the stiffness curve generated during the BBR testand is indicative of the materials ability to relax. A high m-value is associated with high relaxationabilities while a low m-value has lower relaxation abilities (Anderson et al., 1994).
Original testing indicated that using longer loading times, such as two hours, to evaluate limitingstiffness and m-value was best. However, this amount of time was considered to be too long so thetime-temperature superposition principle was implemented to decrease the testing time. With the
Dow
nloa
ded
by [
Kar
olin
ska
Inst
itute
t, U
nive
rsity
Lib
rary
] at
14:
10 0
2 O
ctob
er 2
014

580 Z.G. Jones et al.
reduced testing time, binder specifications were developed for both creep stiffness and m-value.The maximum allowable creep stiffness at 60 seconds for a binder is 300 MPa, while the minimumallowable m-value for a binder is 0.300 (Anderson et al., 1994). Although these are the specifi-cations set in the place for binder and mixtures may react differently, it is important to rememberthat both values play a role in low-temperature performance. However, the familiarity with suchparameter (S and m-value) for asphalt binders makes them attractive to use in asphalt mixtures too.
Methods to predict thermal crackingLimiting thermal cracking can be done one of two ways: limit the creep modulus of the materialor increase the relaxation modulus of the material. Creep modulus and relaxation modulus of thematerials are key factors that influence thermal cracking. Therefore, theoretically, a limiting valueshould be able to be determined to develop a specification or prediction of performance.
Deme and Young evaluated results from a test road in St. Anne, Canada, in the 1980s (Deme& Young, 1987). Their study shows that pavements with high stiffness moduli (creep moduli)demonstrated severe thermal distress during the first winter while mixtures which incorporatedsofter, less susceptible-asphalts resisted cracking for over eight years. They suggested that if thestiffness of the mixture at 180 seconds is greater than about 10 GPa (1,500,000 psi), then thermalcracking is to be expected. This conclusion coincides with results obtained at Penn State duringthe Strategic Highway Research Program (AASHTO, 2005; Petersen et al., 1994).
Field samplesSite selectionField cores were taken from seven state roads around the Salt Lake Valley, each of which wereconstructed based upon Utah Department of Transportation (UDOT) design specifications. Theselection of the sections was based upon the following criteria:
• Constructed within the past three years.• Thick pavement layers to ensure any visible distress were not reflective of the underlying
layers.• All were built using the same low-temperature binder grade (−28◦C).• Had ability to obtain cores.
In order to obtain cores, the road or lane must be closed following UDOT protocols. Withoutexpress permission from UDOT, this cannot be done, thus limited roadways were available foruse in this study. Roads were selected and cored without prior distress surveys being conductedin order to eliminate any bias. Anywhere from two to four cores were taken from each section.The cores were taken in close proximity to one another; because of this, it can be assumed thatcores taken from the same road are of the same mixture and should have similar properties. Thecores were numbered in order and grouped according to the road which they were taken. All corenumbers and the roads they came from can be seen in Table 1.
Mix design informationAll road surfaces evaluated were designed based on UDOT specifications (UDOT, 2012). Theywere all Superpave, densely graded mixtures designed based on an N -design of 100 gyrations.The voids in the mineral aggregate, VMA, was in the range of 13–14% and air voids were between2.5–3.7%. The low-temperature binder grade of all sections was −28◦C as shown in Table 1.
Dow
nloa
ded
by [
Kar
olin
ska
Inst
itute
t, U
nive
rsity
Lib
rary
] at
14:
10 0
2 O
ctob
er 2
014

Road Materials and Pavement Design 581
Table 1. Summary of field sample results.
Core Binder Creep modulus at CVa creep m-Value at BeamsProject ID grade 60s PG + 10◦C (MPa) modulus (%) 60s PG + 10◦C testedb
SR 171 576 PG64-28 2938 8.5 0.233 8577 PG64-28 2715 10.9 0.211 4578 PG64-28 2626 15.1 0.280 8579 PG64-28 2550 12.2 0.285 6
SR 111 580 PG64-28 9081 15.7 0.103 10581 PG64-28 11386 10.9 0.124 10
SR 269 586 PG64-28 5726 15.4 0.159 5587 PG64-28 5186 15.5 0.179 10
SR 266 590 PG64-28 6523 6.0 0.084 4591 PG64-28 7388 12.7 0.130 4
SR 71 592 PG64-28 9533 10.2 0.126 13593 PG64-28 8931 13.8 0.127 11
SR 68 594 PG64-28 4284 7.1 0.185 5595 PG64-28 4547 10.4 0.181 7
SR 48 596 PG64-28 10437 13.3 0.160 12597 PG64-28 10774 14.1 0.151 16
aCV = std. dev./mean.bThe number of beams tested varied from project to project due to layer thickness.
Quality control of dataA quality check of the data was conducted for each core using the estimated stiffness at 60 secondsduring each test. The coefficient of variation (CV) is determined by dividing the standard deviationby the mean. Previous work has shown that a CV of 15% or less is reasonable when testing asphaltmixtures (Ho, 2009; Romero & Anderson, 2001; Romero et al., 2011; Zofka, 2007). These worksalso show that when conducting analysis of many beams, such as 50 or more, the results aresimilar to results from far less beams so long as the CV is 15% or less. In cases where the CV wasgreater than 15%, a trimmed mean method was used. The trimmed mean method is particularlyuseful for this study because it removes the samples with results lying furthest from the mean inboth the positive and negative direction. This allows for the data to take the form of a normaldistribution, as any group of samples from the same mixture should be.
Once the variability of the test was verified, the compliance of each sample beam was used tocalculate the average compliance of each core at the selected temperature. The point of evaluationwas selected to be 60 seconds. It is important to have the point of evaluation be at least 10 secondsafter the initial load to allow for stabilised readings. After this, the time which is taken for the pointof evaluation is irrelevant as long as it is consistent throughout each test. The point of evaluationwas taken at 60 seconds for two reasons: 60 seconds is the default output for the BBR testingprogramme and it is also the same for the BBR binder testing protocol AASHTO T313/ASTMD6648 (AASHTO, 2009; ASTM, 2008).
Field sample test resultsVariabilityAs can be seen in Table 1, the CV within each core was 15% or less. The difference in creepstiffness between different cores was less than 10% for all but one section.
Dow
nloa
ded
by [
Kar
olin
ska
Inst
itute
t, U
nive
rsity
Lib
rary
] at
14:
10 0
2 O
ctob
er 2
014

582 Z.G. Jones et al.
During preparation, precautions were taken to ensure that the layer each beam came from wasdocumented. This allowed for the evaluation of the stiffness at different depths within each core.No correlations were observed between the depth of the sample and stiffness.
Creep modulus and m-valueAs can be seen in Table 1, the values of the creep modulus varied widely even though all bindershad the same low-temperature grade. For example, SR 171 had an average creep modulus of2700 MPa, while SR 48 had an average creep modulus of 10,600 MPa despite the fact that both ofthese sections used PG64-28 binder. The m-values for these two sections were 0.252 and 0.156,respectively.
This indicates that both binder and mixture properties influence performance characteristics ofpavements. Other research has shown similar results and has tried to bridge the gap by modellingthe different components (Christensen, Pellinen, & Bonaquist, 2003). BBR testing allows fordirect measurement of mixture properties.
As previously mentioned, the results had a wide range of creep moduli and m-values. However,two roads stood out: SR 111 and SR 48 both had a relatively high creep modulus when compared tothe other roads. Material with a high modulus has been shown to be prone to thermal cracking, asdiscussed previously (Deme & Young, 1987). A very simple explanation is a drop in temperaturecauses thermal strain (ε = α� T) and stress is σ = ε E. Because of this, it was predicted thatthese two roads had the highest potential to show low-temperature thermal distress.
Field surveysIn order to make a direct comparison of data to field performance, it was necessary to evaluatethe roads from which the cores came from. The location of the core removal was found in everyroad to ensure the accuracy of the survey. Each road was surveyed and photographed to documentsigns of thermal cracking and degradation or the lack thereof. Surveys were conducted on threeseparate occasions:
(1) 13 June 2012(2) 9 January 2013(3) 23 January 2013
The surveys that took place on 13 June 2012 resulted in no visual thermal distresses on anyof the sections in question. Surveys on 9 January 2013 also showed now thermal distresses. Inthe days following 9 January 2013, the Salt Lake Valley experienced a stretch of extremely coldweather, as shown in Figure 7.
In the days following these extremely low temperatures, it was determined that one more roundof visual surveys would be necessary. On 23 January 2013 each section was surveyed once more.As predicted, SR 111 showed signs of thermal distress in the form of thermal cracking. This canbe seen in Figure 8. SR 48 and the rest of the roads did not display thermal distresses.
Although both SR 111 and SR 48 have high creep moduli, SR 111 has a significantly lowerm-value, or a lesser ability to relax. This observation leads to the idea that energy, absorption andloss must be considered when evaluating asphalt concrete mixtures.
Black spaceAs discussed on the previous section, both the creep modulus and the m-value are needed topredict low-temperature cracking. The m-value is related to the energy dissipated. In a viscoelastic
Dow
nloa
ded
by [
Kar
olin
ska
Inst
itute
t, U
nive
rsity
Lib
rary
] at
14:
10 0
2 O
ctob
er 2
014

Road Materials and Pavement Design 583
Figure 7. Daily low temperatures for Salt Lake City (National Oceanic and Atmospheric Administration,2013).
(a)
(b)
Figure 8. (a) SR 111 on 13 June 2012, no visible thermal distress and (b) 23 January 2013, showing athermal crack.
Dow
nloa
ded
by [
Kar
olin
ska
Inst
itute
t, U
nive
rsity
Lib
rary
] at
14:
10 0
2 O
ctob
er 2
014
584 Z.G. Jones et al.
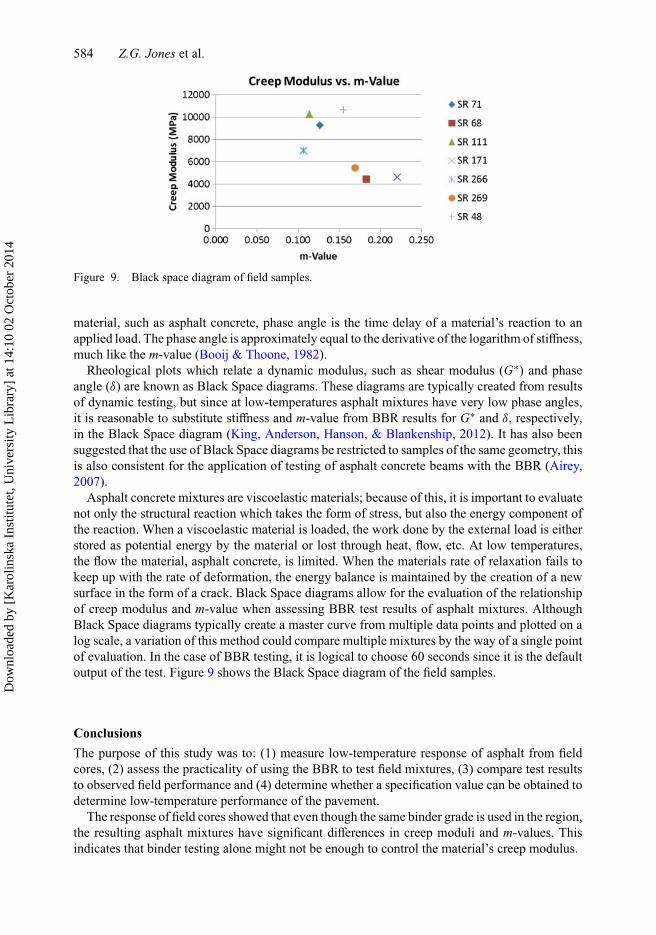
Figure 9. Black space diagram of field samples.
material, such as asphalt concrete, phase angle is the time delay of a material’s reaction to anapplied load. The phase angle is approximately equal to the derivative of the logarithm of stiffness,much like the m-value (Booij & Thoone, 1982).
Rheological plots which relate a dynamic modulus, such as shear modulus (G∗) and phaseangle (δ) are known as Black Space diagrams. These diagrams are typically created from resultsof dynamic testing, but since at low-temperatures asphalt mixtures have very low phase angles,it is reasonable to substitute stiffness and m-value from BBR results for G∗ and δ, respectively,in the Black Space diagram (King, Anderson, Hanson, & Blankenship, 2012). It has also beensuggested that the use of Black Space diagrams be restricted to samples of the same geometry, thisis also consistent for the application of testing of asphalt concrete beams with the BBR (Airey,2007).
Asphalt concrete mixtures are viscoelastic materials; because of this, it is important to evaluatenot only the structural reaction which takes the form of stress, but also the energy component ofthe reaction. When a viscoelastic material is loaded, the work done by the external load is eitherstored as potential energy by the material or lost through heat, flow, etc. At low temperatures,the flow the material, asphalt concrete, is limited. When the materials rate of relaxation fails tokeep up with the rate of deformation, the energy balance is maintained by the creation of a newsurface in the form of a crack. Black Space diagrams allow for the evaluation of the relationshipof creep modulus and m-value when assessing BBR test results of asphalt mixtures. AlthoughBlack Space diagrams typically create a master curve from multiple data points and plotted on alog scale, a variation of this method could compare multiple mixtures by the way of a single pointof evaluation. In the case of BBR testing, it is logical to choose 60 seconds since it is the defaultoutput of the test. Figure 9 shows the Black Space diagram of the field samples.
ConclusionsThe purpose of this study was to: (1) measure low-temperature response of asphalt from fieldcores, (2) assess the practicality of using the BBR to test field mixtures, (3) compare test resultsto observed field performance and (4) determine whether a specification value can be obtained todetermine low-temperature performance of the pavement.
The response of field cores showed that even though the same binder grade is used in the region,the resulting asphalt mixtures have significant differences in creep moduli and m-values. Thisindicates that binder testing alone might not be enough to control the material’s creep modulus.
Dow
nloa
ded
by [
Kar
olin
ska
Inst
itute
t, U
nive
rsity
Lib
rary
] at
14:
10 0
2 O
ctob
er 2
014

Road Materials and Pavement Design 585
Figure 10. Black space diagram with the possible thermal stress failure envelope.
The results show that using the BBR to test field mixtures was found to be practical, the processis simple. A core is taken from the project in question, the uppermost layer is removed and cutinto small beams which can then be measured and tested almost immediately. Coring, cutting andtesting at one temperature could all be completed for a single core within one work day.
The first two rounds of field surveys showed that no cracking was present on the seven sectionsevaluated. After the Salt Lake Valley experienced a period of extremely low temperatures, anothersurvey was conducted. As predicted, SR 111 showed thermal distress but SR 48 did not. Thisreinforces the conclusion that low-temperature binder grade alone is not enough to characterisethe performance of asphalt concrete mixtures in the field. Every road analysed was built withbinder that had the same low-temperature grade and experienced the same temperature extremesyet only SR 111 displayed thermal distress.
It is theorised that a specification used to predict low-temperature performance will need toinclude the creep modulus and the relaxation modulus of the material which are representedthrough the creep stiffness and the m-value output of the BBR test. When evaluating the BlackSpace diagram, the relationship between creep moduli and m-values, it can be seen that a possiblethermal stress distress envelope could be developed. An example of this possible distress envelopeis depicted as a red line in Figure 10. It is clear that there are two distinct groups in the relationship:one group is near the envelope while the others are distant. SRs 48, 71, 111, and 266 are all nearthe possible envelope. Although only SR 111 has shown thermal stress to date, it is likely thatthe other three sections near the envelope are more “at risk” to thermal distress and would beexpected to crack prior to the sections which are further away from the envelope.
RecommendationsIt is recommended that all sections that displayed a creep modulus/m-value relationship near thepossible thermal stress failure envelope continue to be monitored for thermal distress.
Further research should focus on taking field cores of thick-layered pavements with known mixdesigns that show thermal distress to verify the conclusion which states that pavements with acombination of high creep moduli and low m-values are more prone to thermal distress. Analysisof more mixtures that are prone to thermal distress will allow for a more accurate definition of
Dow
nloa
ded
by [
Kar
olin
ska
Inst
itute
t, U
nive
rsity
Lib
rary
] at
14:
10 0
2 O
ctob
er 2
014

586 Z.G. Jones et al.
the proposed thermal stress failure envelope. Field testing of pavements that do not show thermaldistress will also be beneficial in defining the thermal stress failure envelope. Sources of thesepavements should not be limited to state roads; they should also include city, county and federalsections.
DisclaimerThe authors alone are responsible for the preparation and accuracy of the information, data,analysis, discussions, recommendations, and conclusions presented herein. The contents do notnecessarily reflect the views, opinions, endorsements, or policies of the Utah Department ofTransportation and the US Department of Transportation. The Utah Department of Transportationmakes no representation or warranty of any kind, and assumes no liability therefore.
AcknowledgementsThe authors are thankful to the people involved in this research from Utah Department of Transportationand the University of Utah. From UDOT, Mr Clark Allen and Mr Bin Shi provided assistance and supportthroughout the project. From the University of Utah, Mr Mark Bryant ensured that the equipment was runningcorrectly and that everyone was safe. Mr Charan Kumar helped in the completion of the testing.
ReferencesAirey, G. D. (2007). Use of black diagrams to identify inconsistencies in rheological data. Road Materials
and Pavement Design. (PhD thesis). University of Minnesota, Minneapolis, pp. 403–424.American Association of State Highway and Transportation Officials (AASHTO) Designation T314-02.
(2002). Standard method of test for determining the fracture properties of asphalt binder in direct tension(DT). Standard Specifications for Transportation Materials and Methods of Sampling and Testing, Part2B: Tests, 22nd ed., Washington, DC: Author.
American Association of State Highway and Transportation Officials (AASHTO). (2005). Standard spec-ification for performance-graded asphalt binder. Standard Specifications for Transportation Materialsand Methods of Sampling and Testing, M 320-05, 25th ed., Washington, DC: Author.
American Association of State Highway and Transportation Officials. (2009). Determining the flexuralcreep stiffness of asphalt binder using the bending beam rheometer (BBR). Standard Specificationsfor Transportation Materials and Methods of Sampling and Testing T 313, 29th ed., Washington, DC:Author.
American Society of Testing and Materials. (2008). Standard test method for determining the flexuralcreep stiffness of asphalt binder using the bending beam rheometer (BBR). ASTM D6648-08. WestConshohocken, PA: ASTM International.
Anderson, D. A., Christensen, D. W., Bahia, H. U., Dongre, R., Sharma, M. G., Antle, C. E., & Button, J.(1994). Binder characterization and evaluation. SHRP A-369, Vol. 3, Physical Characterization StrategicHighway Research Program National Research Council, Washington, DC.
Booij, H. C., & Thoone, G. P. (1982). Generalizations of Kramers-Kronig transforms and some approxima-tions of relations between viscoelastic quantities. Rheologica Acta, 21, 15–24.
Christensen, D. W., Pellinen, T., & Bonaquist, R. F. (2003). Hirsh model for estimating the modulus ofasphalt concrete. Journal of the Association of Asphalt Paving Technologists, 72, 97–121.
Clendennen, C., & Romero, P. (2013). Evaluating the representative volume element of Asphalt concretemixture beams for testing in the bending beam rheometer. In N. Kringos, B. Birgisson, D. Frost, &L. Wang (Eds.), Multi-Scale modeling and characterization of infrastructure materials (pp. 13–30).Stockholm, Sweden: Elsevier.
Deme, I. J., & Young, F. D. (1987). Saint Anne test road revisited twenty years later (Report SM/M/89/172).Toronto: Shell Canada Products Company.
Ho, C.-H. (2009). Control of thermal-induced failures in asphalt pavements (PhD dissertation). TheUniversity of Utah, Salt Lake City, UT.
Dow
nloa
ded
by [
Kar
olin
ska
Inst
itute
t, U
nive
rsity
Lib
rary
] at
14:
10 0
2 O
ctob
er 2
014

Road Materials and Pavement Design 587
King, G., Anderson, M., Hanson, G., & Blankenship, P. (2012). Using black space diagrams to predictage-induced cracking. In A. Scarpas, N. Kringos, I. Al-Qadi, & A. Loizos (Eds.), Proceedings of 7thRILEM international conference on cracking in pavements (pp. 453–463). The Netherlands: Delft.
Marasteanu, M. (2004). The role of bending beam rheometer parameters in thermal stress calculations.Transportation Research Record1875, 9–13.
Marasteanu, M., Li, X., Clyne, T. R., Voller, V. R., Timm, D. H., & Newcomb, D. E. (2004). Low temperaturecracking of asphalt concrete pavements. MN/RC – 2004–23, Minnesota: Department of Transportation.
Marasteanu, M., Velasquez, R., Cannone Falchetto, A., & Zofka, A. (2009). Development of a simple testto determine the low temperature creep compliance of asphalt Mixtures. Final Report for Highway IdeaProject 133. Washington DC: Transportation Research Board of the National Academies.
Marasteanu, M., Zofka, A., Turos, M., Li, X., Velasques, R., Li, X., … McGraw, J. (2007). Investiga-tion of low temperature cracking in asphalt pavements. National Pooled Fund Study 776. Minnesota:Department of Transportation Report MN/RC 2007–43.
National Oceanic and Atmospheric Administration. (2013). National weather service forecast office. NOAA.Retrieved February 1, 2013, from http://www.nws.noaa.gov/climate/index.php?wfo=slc
Petersen, J. C., Robertson, R. E., Branthaver, J. F., Harnsberger, P. M., Duvall, J. J., Kim, S. S., … Bahia, H.U. (1994). Binder characterization and evaluation. SHRP A-367, Vol. 1. In Physical CharacterizationStrategic Highway Research Program National Research Council. Washington, DC.
Romero, P., & Anderson, R. M. (2001). Variability of asphalt mixtures tests using the Superpave sheartester repeated shear at constant height test. Paper: 01-2098, the Annual Meeting of the TransportationResearch Board, Washington, DC.
Romero, P., Hoe, C. H., & VanFrank, K. (2011). Control cold temperature and fatigue cracking for asphaltmixtures. Publication UT-10.08. Utah: Department of Transportation.
Utah Department of Transportation. (2012). Materials Manual of Instruction (MOI) Part 8, Section 960guideline for Superpave volumetric mix design. Retrieved June 20, 2012, from www.udot.utah.gov/main/uconowner.gf?n=9043802887095370.
Velásquez, R., Labuz, J., Marasteanu, M., & Zofka, A. (2009). Revising thermal stresses in the TSRST fortow-temperature cracking prediction. Journal of Materials in Civil Engineering, 21(11), 680–687.
Zofka, A. (2007). Investigation of asphalt concrete creep behavior using 3-point bending test (PhDdissertation). The University of Minnesota, Minneapolis.
Zofka, A., Marasteanu, M. O., Li, X., Clyne, T. R., & McGraw, J. (2005). Simple method to obtain asphaltbinders low temperature properties from asphalt mixtures properties. The Journal of the Association ofAsphalt Paving Technologists, 74, 255–282.
Dow
nloa
ded
by [
Kar
olin
ska
Inst
itute
t, U
nive
rsity
Lib
rary
] at
14:
10 0
2 O
ctob
er 2
014