Embed Size (px)
Citation preview
SPPI Mini Presentation
Development of a Securities Brokerage
Services Price Index in Canada
by
Nassim Ketita*, Lucy Opsitnik**, and Min Xie***
Producer Prices Division Statistics Canada
*613-797-3107 E-mail: [email protected]
**613-882-1558
E-mail: [email protected]
***613-864-5453 E-mail: [email protected]
31st Meeting of the Voorburg Group on Service Statistics Zagreb, Croatia
September 19 - 23, 2016
The authors would like to thank the many individuals from various divisions of Statistics Canada who provided comments, and assume all responsibility for omissions and inconsistencies.
Table of Contents 1. Introduction ...................................................................................................................1
2. Securities brokerage services ..........................................................................................1
2.1 Definition of the service being priced ..............................................................................1
2.2 Pricing unit of measure ...................................................................................................2
3. Market conditions and constraints ..................................................................................3
3.1 Size of the industry .........................................................................................................3
3.2 Regulatory environment .................................................................................................7
4. Standard classification structure and detail related to the area ........................................7
4.1 Industry classification .....................................................................................................7
4.2 Product classification .................................................................................................... 11
5. Evaluation of standard versus definition and market conditions .................................... 12
6. Existing programs in Statistics Canada ........................................................................... 15
6.1 Turnover ...................................................................................................................... 15
6.2 Securities brokerage in the Supply-Use Tables ............................................................... 16
6.3 Special considerations .................................................................................................. 16
7. Statistics Canada’s Securities Brokerage Services Price Index (SBSPI) .............................. 17
7.1 Data ............................................................................................................................... 18
7.2 Coverage........................................................................................................................ 18
7.3 Usefulness ..................................................................................................................... 18
7.4 Methodology ................................................................................................................. 19
7.5 Initial findings ............................................................................................................... 20
8. Conclusion .................................................................................................................... 20
References ........................................................................................................................... 21
Appendix A .......................................................................................................................... 22
Appendix B .......................................................................................................................... 23

1
1. Introduction
In Canada, development of Services Producer Price Indexes (SPPIs) has largely been on an industry basis following the North American Industry Classification System (NAICS). Most of the SPPIs are sampled from firms on the Business Register, a sampling frame that identifies firms by industry, not by product. In general, SPPIs align with overall output measures, and development has targeted industries based on size (contribution to GDP), or those which provide a high level of services to the business sector. This paper will focus on the development of the Securities Brokerage Services Price Index (SBSPI), which covers a portion of ISIC 6612 – Security and commodity contracts brokerage.1 Section 2 defines the services of the industry, and pricing unit of measure, Section 3 discusses market conditions and constraints, Section 4 presents classification while Section 5 evaluates the categorization against the service definition and market conditions, Section 6 discusses related programs at Statistics Canada, Section 7 presents the SBSPI program at Statistics Canada, and Section 8 concludes. 2. Securities brokerage services
2.1 Definition of the service being priced
This paper focuses on NAICS 523120 – Securities Brokerage, “[which] comprises establishments primarily engaged in buying or selling securities for others on a commission basis.” The primary service of this industry is to match buyers and sellers of securities without taking an ownership position giving Canadian retail and institutional investors’ access to capital markets. Provision of services within the industry can be thought of primarily in terms of type of service provided, generally summarized as:
Securities brokerage – facilitating a sale of exchange traded or non-exchange traded stocks, sometimes providing advice and continuous individual “portfolio” management, collecting a fee or commission for the initial trade.
Mutual funds brokerage – facilitating a sale of mutual fund shares either on behalf of the bank subsidiary or an independent mutual fund company, but not managing the fund’s portfolio and collecting a sales fee or “load” for the transaction.
Options brokerage – the writing of options contracts and collecting a fee or premium, purchase of securities is not necessary to purchase an option.
Margin lending – adding to a client’s investment to allow them to purchase more shares and collecting interest.
Payment for order flow – not a service per se, but a relevant source of revenue. An introducing broker receives a few cents per share sold from the floor broker.
Another consideration is the level of involvement or responsibility being undertaken by the broker:
1 ISIC 6612 also includes: Foreign currency exchange services (i.e., selling to the public); Commodity contracts brokerage; and, Oil and gas lease brokers' offices, which will not be discussed.
2
Investment Advice – where the broker will discuss the client’s investment aims and objectives and then recommend a range of investments that they feel would best suit those needs. The client can accept or reject their proposals. Advisory services tend to be done in direct contact with a broker.
Discretionary Service – the brokerage will take a sum of money and invest it on the client’s behalf. Unlike the advisory service, the broker does not have to tell the investor about every trade – the stockbroker has a lot of “discretion” on how to invest the clients’ money.
Execution Only – where the broker is simply instructed to buy or sell a particular investment and has no say about the trade. This service is available to the masses via online brokerage houses.
Portfolio management – the process of building and maintaining an investment portfolio that properly addresses the strategy the advisory component has defined.
Administration – trading, clearing and reporting functions required to effectively execute the portfolio management process.
Services provided by brokers include one or more of the dimensions listed above, however, Administration services can be considered to be the most crucial aspect given that, regardless of the service category, a client requires administration in order to execute trades. Fundamentally, the role of the broker is to receive, transmit, and execute the trading of securities with other investors without taking possession of the securities, acting as an intermediary for a client. In addition, Portfolio Management and Investment Advice fall under unique NAICS industries (52392 and 52393, respectively) and, although they are services that the client might expect to receive for their commission as part of a full service brokerage transaction, the focus of this paper will be on the primary services of NAICS 52312 – Securities brokerage.
2.2 Pricing unit of measure
The unit of measure for pricing targets the predominant sources of revenue within the industry, which include commissions, fees, mutual funds, and margin lending interest. Typical pricing units of measure for commissions are per trade or per share, depending on the type of account and the broker’s commission schedule. The fee category is broader as it can cover anything from a yearly fee for advisory services to a service fee for mailing a stock certificate. Measuring these services can be based on per account or per unit of time basis. Mutual fund transactions may involve a load, a commission charged to the client for either a purchase or sale, as well as a trailer fee, which is a payment to the broker from the mutual fund company itself. Trailer fees are quoted as a percentage of the market value of the trade whereas loads can also follow this model or be a simple flat fee per trade. A margin account is a type of collateralized loan in which investors can borrow against their securities. The unit of measure for this revenue is per loan.

3
3. Market conditions and constraints
3.1 Size of the industry
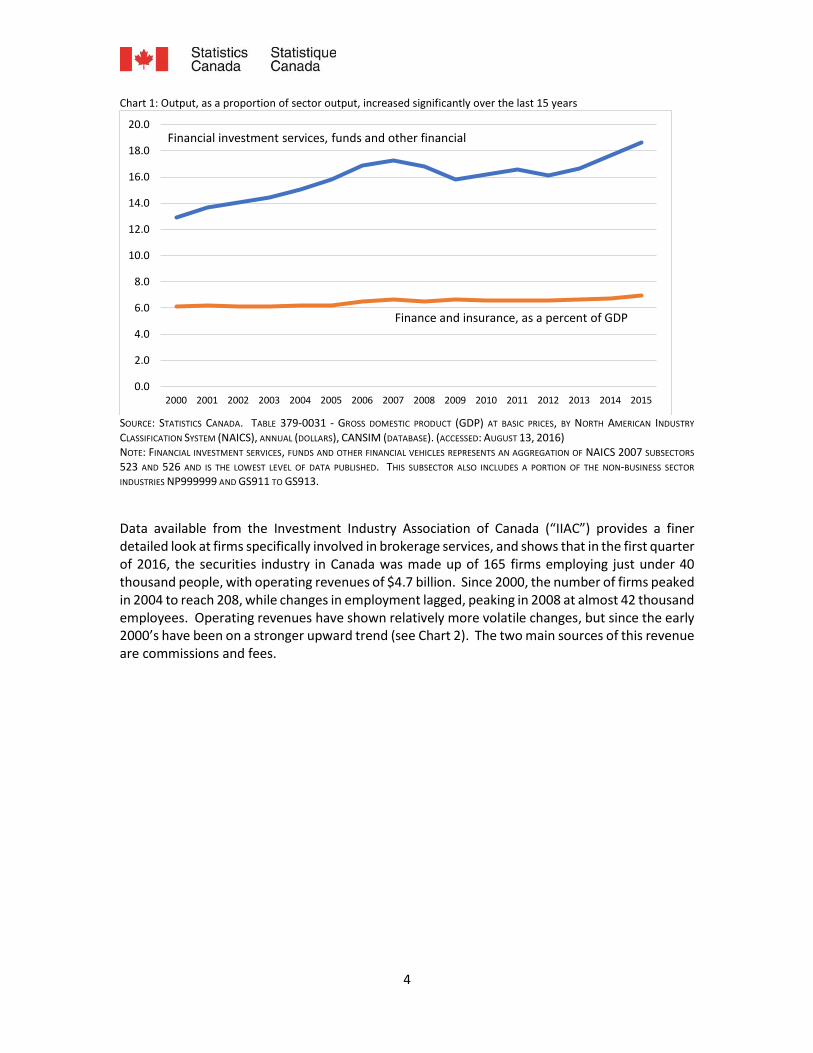
Financial services are an important part of any developed economy. Baily and Elliott (2013) describe the three major roles of this industry: providing credit, providing liquidity, and providing risk management services. Well-functioning financial markets encourage growth by allowing firms to fund projects and households to make large purchases such as new homes. In Canada, as of 2015, the finance and insurance sector contributed $115 billion to GDP (2007 constant dollars) and represented 7 percent of GDP at basic prices, a proportion that has remained relatively stable since 2000.2 The financial services sector also represented 30% of the Toronto Stock Exchange (TSX) and the TSX Venture Exchange with $689 billion in total market capitalization, as of December 2015.3 Five of the ten largest firms that trade on the TSX are in this industry. Although the contribution of finance and insurance has remained relatively stable, the subsector which includes securities brokerage services has increased its contribution to GDP by over 40% over the same period (see Chart 1 below), and as of 2015 stood at just under one-fifth of finance and insurance GDP. Therefore, although the proportion of finance and insurance in the overall economy has remained relatively stable, the share attributed to the activities of NAICS 523 – Securities, commodity contracts, and other financial investment and related activities, and NAICS 526 – Funds and other financial vehicles, have gained greater relevance, and combined represented 1.3 percent of overall GDP in 2015.
2 Statistics Canada. Table 379-0031 - Gross domestic product (GDP) at basic prices, by North American Industry Classification System (NAICS), monthly (dollars), CANSIM (database). (accessed: August 13, 2016) 3 TMX Group Limited
4
Chart 1: Output, as a proportion of sector output, increased significantly over the last 15 years
SOURCE: STATISTICS CANADA. TABLE 379-0031 - GROSS DOMESTIC PRODUCT (GDP) AT BASIC PRICES, BY NORTH AMERICAN INDUSTRY
CLASSIFICATION SYSTEM (NAICS), ANNUAL (DOLLARS), CANSIM (DATABASE). (ACCESSED: AUGUST 13, 2016) NOTE: FINANCIAL INVESTMENT SERVICES, FUNDS AND OTHER FINANCIAL VEHICLES REPRESENTS AN AGGREGATION OF NAICS 2007 SUBSECTORS
523 AND 526 AND IS THE LOWEST LEVEL OF DATA PUBLISHED. THIS SUBSECTOR ALSO INCLUDES A PORTION OF THE NON-BUSINESS SECTOR
INDUSTRIES NP999999 AND GS911 TO GS913.
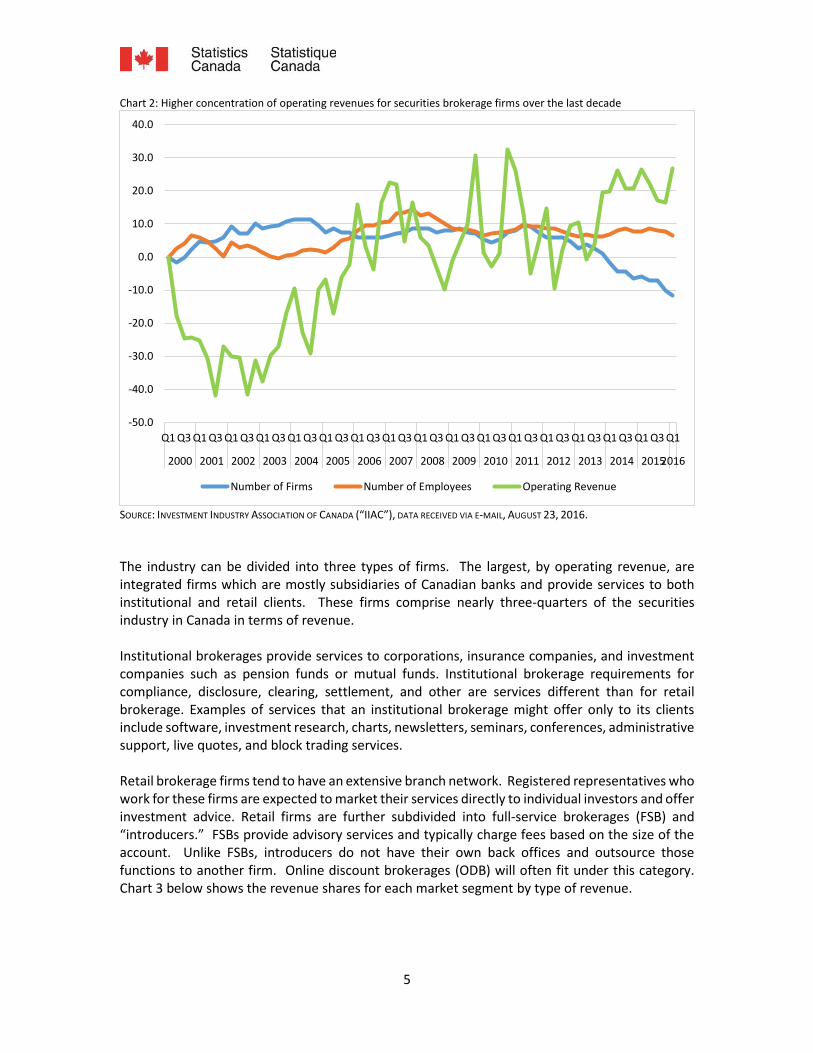
Data available from the Investment Industry Association of Canada (“IIAC”) provides a finer detailed look at firms specifically involved in brokerage services, and shows that in the first quarter of 2016, the securities industry in Canada was made up of 165 firms employing just under 40 thousand people, with operating revenues of $4.7 billion. Since 2000, the number of firms peaked in 2004 to reach 208, while changes in employment lagged, peaking in 2008 at almost 42 thousand employees. Operating revenues have shown relatively more volatile changes, but since the early 2000’s have been on a stronger upward trend (see Chart 2). The two main sources of this revenue are commissions and fees.
0.0
2.0
4.0
6.0
8.0
10.0
12.0
14.0
16.0
18.0
20.0
2000 2001 2002 2003 2004 2005 2006 2007 2008 2009 2010 2011 2012 2013 2014 2015
Finance and insurance, as a percent of GDP
Financial investment services, funds and other financial
5
Chart 2: Higher concentration of operating revenues for securities brokerage firms over the last decade
SOURCE: INVESTMENT INDUSTRY ASSOCIATION OF CANADA (“IIAC”), DATA RECEIVED VIA E-MAIL, AUGUST 23, 2016.
The industry can be divided into three types of firms. The largest, by operating revenue, are integrated firms which are mostly subsidiaries of Canadian banks and provide services to both institutional and retail clients. These firms comprise nearly three-quarters of the securities industry in Canada in terms of revenue. Institutional brokerages provide services to corporations, insurance companies, and investment companies such as pension funds or mutual funds. Institutional brokerage requirements for compliance, disclosure, clearing, settlement, and other are services different than for retail brokerage. Examples of services that an institutional brokerage might offer only to its clients include software, investment research, charts, newsletters, seminars, conferences, administrative support, live quotes, and block trading services. Retail brokerage firms tend to have an extensive branch network. Registered representatives who work for these firms are expected to market their services directly to individual investors and offer investment advice. Retail firms are further subdivided into full-service brokerages (FSB) and “introducers.” FSBs provide advisory services and typically charge fees based on the size of the account. Unlike FSBs, introducers do not have their own back offices and outsource those functions to another firm. Online discount brokerages (ODB) will often fit under this category. Chart 3 below shows the revenue shares for each market segment by type of revenue.
-50.0
-40.0
-30.0
-20.0
-10.0
0.0
10.0
20.0
30.0
40.0
Q1 Q3 Q1 Q3 Q1 Q3 Q1 Q3 Q1 Q3 Q1 Q3 Q1 Q3 Q1 Q3 Q1 Q3 Q1 Q3 Q1 Q3 Q1 Q3 Q1 Q3 Q1 Q3 Q1 Q3 Q1 Q3 Q1
2000 2001 2002 2003 2004 2005 2006 2007 2008 2009 2010 2011 2012 2013 2014 20152016
Number of Firms Number of Employees Operating Revenue
6
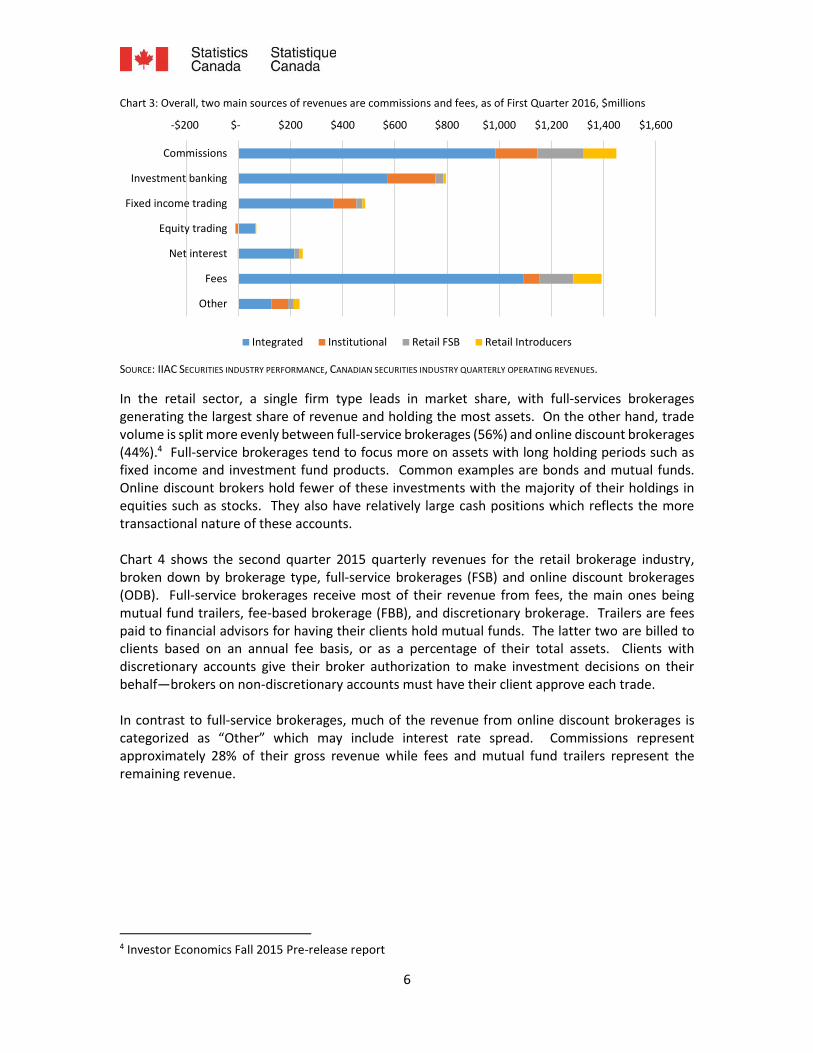
Chart 3: Overall, two main sources of revenues are commissions and fees, as of First Quarter 2016, $millions
SOURCE: IIAC SECURITIES INDUSTRY PERFORMANCE, CANADIAN SECURITIES INDUSTRY QUARTERLY OPERATING REVENUES.
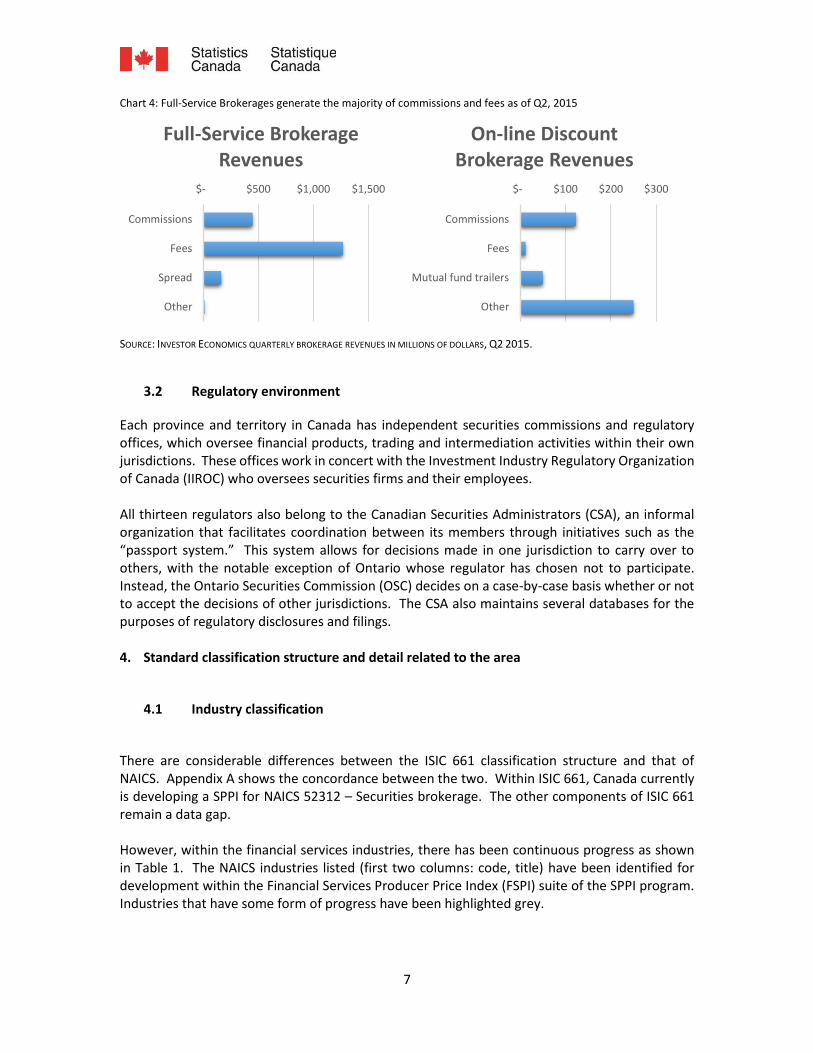
In the retail sector, a single firm type leads in market share, with full-services brokerages generating the largest share of revenue and holding the most assets. On the other hand, trade volume is split more evenly between full-service brokerages (56%) and online discount brokerages (44%).4 Full-service brokerages tend to focus more on assets with long holding periods such as fixed income and investment fund products. Common examples are bonds and mutual funds. Online discount brokers hold fewer of these investments with the majority of their holdings in equities such as stocks. They also have relatively large cash positions which reflects the more transactional nature of these accounts. Chart 4 shows the second quarter 2015 quarterly revenues for the retail brokerage industry, broken down by brokerage type, full-service brokerages (FSB) and online discount brokerages (ODB). Full-service brokerages receive most of their revenue from fees, the main ones being mutual fund trailers, fee-based brokerage (FBB), and discretionary brokerage. Trailers are fees paid to financial advisors for having their clients hold mutual funds. The latter two are billed to clients based on an annual fee basis, or as a percentage of their total assets. Clients with discretionary accounts give their broker authorization to make investment decisions on their behalf—brokers on non-discretionary accounts must have their client approve each trade. In contrast to full-service brokerages, much of the revenue from online discount brokerages is categorized as “Other” which may include interest rate spread. Commissions represent approximately 28% of their gross revenue while fees and mutual fund trailers represent the remaining revenue.
4 Investor Economics Fall 2015 Pre-release report
-$200 $- $200 $400 $600 $800 $1,000 $1,200 $1,400 $1,600
Commissions
Investment banking
Fixed income trading
Equity trading
Net interest
Fees
Other
Integrated Institutional Retail FSB Retail Introducers
7
Chart 4: Full-Service Brokerages generate the majority of commissions and fees as of Q2, 2015
SOURCE: INVESTOR ECONOMICS QUARTERLY BROKERAGE REVENUES IN MILLIONS OF DOLLARS, Q2 2015.
3.2 Regulatory environment
Each province and territory in Canada has independent securities commissions and regulatory offices, which oversee financial products, trading and intermediation activities within their own jurisdictions. These offices work in concert with the Investment Industry Regulatory Organization of Canada (IIROC) who oversees securities firms and their employees. All thirteen regulators also belong to the Canadian Securities Administrators (CSA), an informal organization that facilitates coordination between its members through initiatives such as the “passport system.” This system allows for decisions made in one jurisdiction to carry over to others, with the notable exception of Ontario whose regulator has chosen not to participate. Instead, the Ontario Securities Commission (OSC) decides on a case-by-case basis whether or not to accept the decisions of other jurisdictions. The CSA also maintains several databases for the purposes of regulatory disclosures and filings. 4. Standard classification structure and detail related to the area
4.1 Industry classification
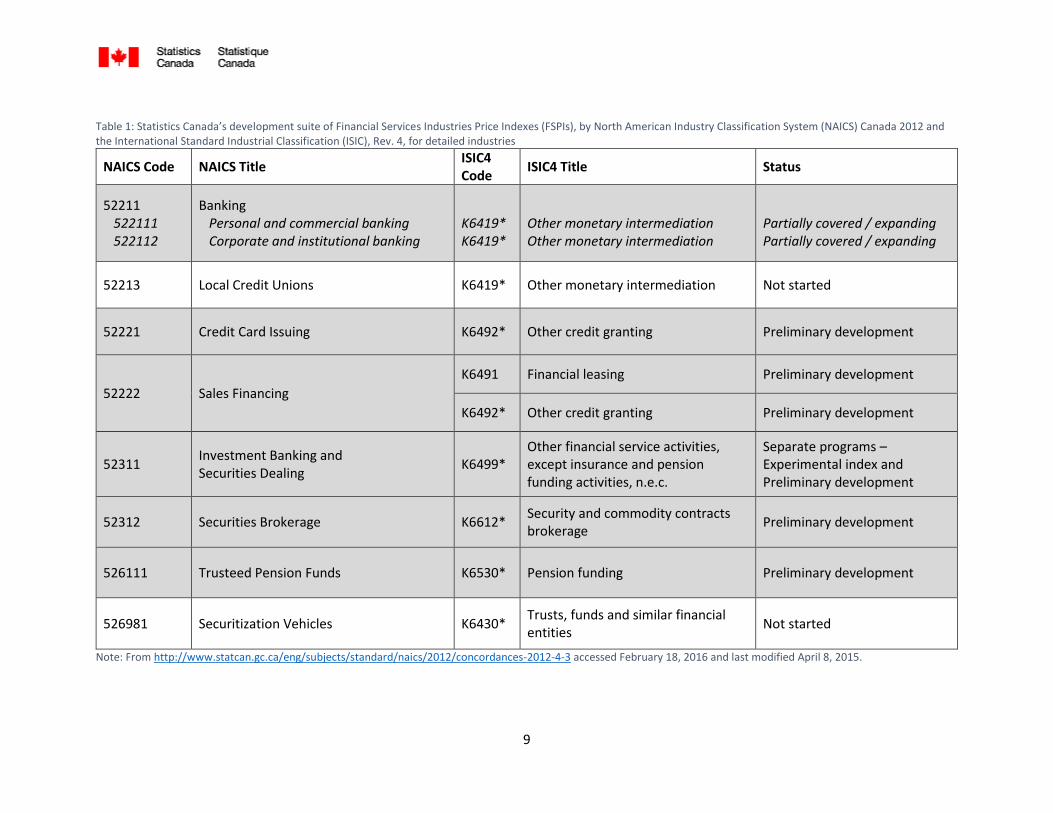
There are considerable differences between the ISIC 661 classification structure and that of NAICS. Appendix A shows the concordance between the two. Within ISIC 661, Canada currently is developing a SPPI for NAICS 52312 – Securities brokerage. The other components of ISIC 661 remain a data gap. However, within the financial services industries, there has been continuous progress as shown in Table 1. The NAICS industries listed (first two columns: code, title) have been identified for development within the Financial Services Producer Price Index (FSPI) suite of the SPPI program. Industries that have some form of progress have been highlighted grey.
$- $500 $1,000 $1,500
Commissions
Fees
Spread
Other
Full-Service Brokerage Revenues
$- $100 $200 $300
Commissions
Fees
Mutual fund trailers
Other
On-line Discount Brokerage Revenues
8
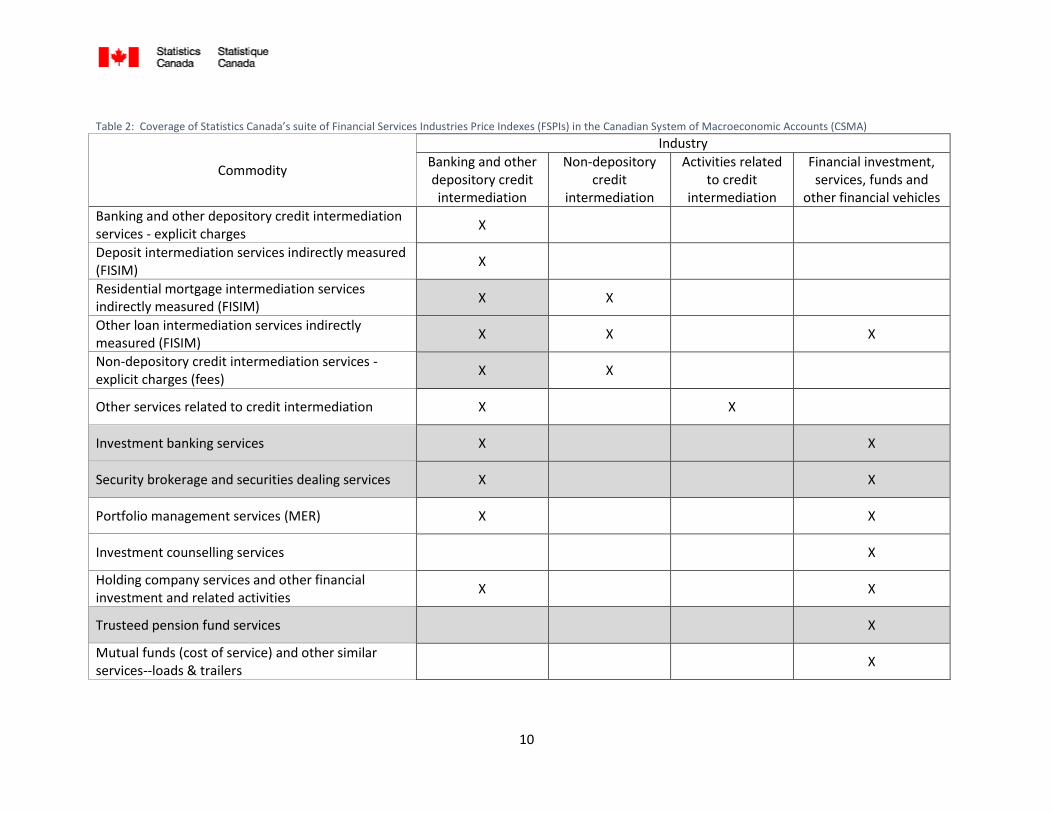
The concordance of the NAICS Canada 2012 to the International Standard Industrial Classification of Economic Activities Revision 4 (ISIC Rev. 4) is also shown in Table 1, for the industries listed as priorities for development in Canada, along with the status of index development. The concordance is shown at the lowest level of both classifications, namely at the 5- or 6-digit level in the NAICS and the 4-digit level in the ISIC, where the relationships between the two classifications are simple or complex, depending on the industry in question. For example, most ISIC4 classes are shown with an asterisk attached to the ISIC alpha-numeric code, which indicates that a NAICS class is equal to a portion of an ISIC class. So for the majority of the ISIC in the table, the relationship to NAICS is complex. However, given the level of development of price indexes in the Canadian context, aligning price indexes to NAICS or ISIC activities could prove to be a fairly straightforward exercise, as will be explained in section 5.3. The last column of Table 1 provides an indication of the status of development As mentioned, Table 1 shows the development scope of Financial Services Price Indexes (FSPI) in Canada, based on initial priorities, primarily industries with significant contribution to business services output, or industries with existing information gaps. The relationship of FSPI targeted industries to output in the Canadian System of Macroeconomic Accounts (CSMA) is shown in Table 2, below. Table 2 presents a matrix of how the NAICS currently targeted for development in Canada, align with output, as represented by an “X”. Given the different services provided in each industry, and the complexity of the activities, development in Canada has followed a detailed approach. Cells highlighted grey in Table 2 align with industries that have initiated some form of development or are in production, within the FSPI program in Canada.
9
Table 1: Statistics Canada’s development suite of Financial Services Industries Price Indexes (FSPIs), by North American Industry Classification System (NAICS) Canada 2012 and the International Standard Industrial Classification (ISIC), Rev. 4, for detailed industries
NAICS Code NAICS Title ISIC4 Code
ISIC4 Title Status
52211 522111 522112
Banking Personal and commercial banking Corporate and institutional banking
K6419* K6419*
Other monetary intermediation Other monetary intermediation
Partially covered / expanding Partially covered / expanding
52213 Local Credit Unions K6419* Other monetary intermediation Not started
52221 Credit Card Issuing K6492* Other credit granting Preliminary development
52222 Sales Financing
K6491 Financial leasing Preliminary development
K6492* Other credit granting Preliminary development
52311 Investment Banking and Securities Dealing
K6499* Other financial service activities, except insurance and pension funding activities, n.e.c.
Separate programs – Experimental index and Preliminary development
52312 Securities Brokerage K6612* Security and commodity contracts brokerage
Preliminary development
526111 Trusteed Pension Funds K6530* Pension funding Preliminary development
526981 Securitization Vehicles K6430* Trusts, funds and similar financial entities
Not started
Note: From http://www.statcan.gc.ca/eng/subjects/standard/naics/2012/concordances-2012-4-3 accessed February 18, 2016 and last modified April 8, 2015.
10
Table 2: Coverage of Statistics Canada’s suite of Financial Services Industries Price Indexes (FSPIs) in the Canadian System of Macroeconomic Accounts (CSMA)
Commodity
Industry
Banking and other depository credit intermediation
Non-depository credit
intermediation
Activities related to credit
intermediation
Financial investment, services, funds and
other financial vehicles
Banking and other depository credit intermediation services - explicit charges
X
Deposit intermediation services indirectly measured (FISIM)
X
Residential mortgage intermediation services indirectly measured (FISIM)
X X
Other loan intermediation services indirectly measured (FISIM)
X X X
Non-depository credit intermediation services - explicit charges (fees)
X X
Other services related to credit intermediation X X
Investment banking services X X
Security brokerage and securities dealing services X X
Portfolio management services (MER) X X
Investment counselling services X
Holding company services and other financial investment and related activities
X X
Trusteed pension fund services X
Mutual funds (cost of service) and other similar services--loads & trailers
X
11
4.2 Product classification
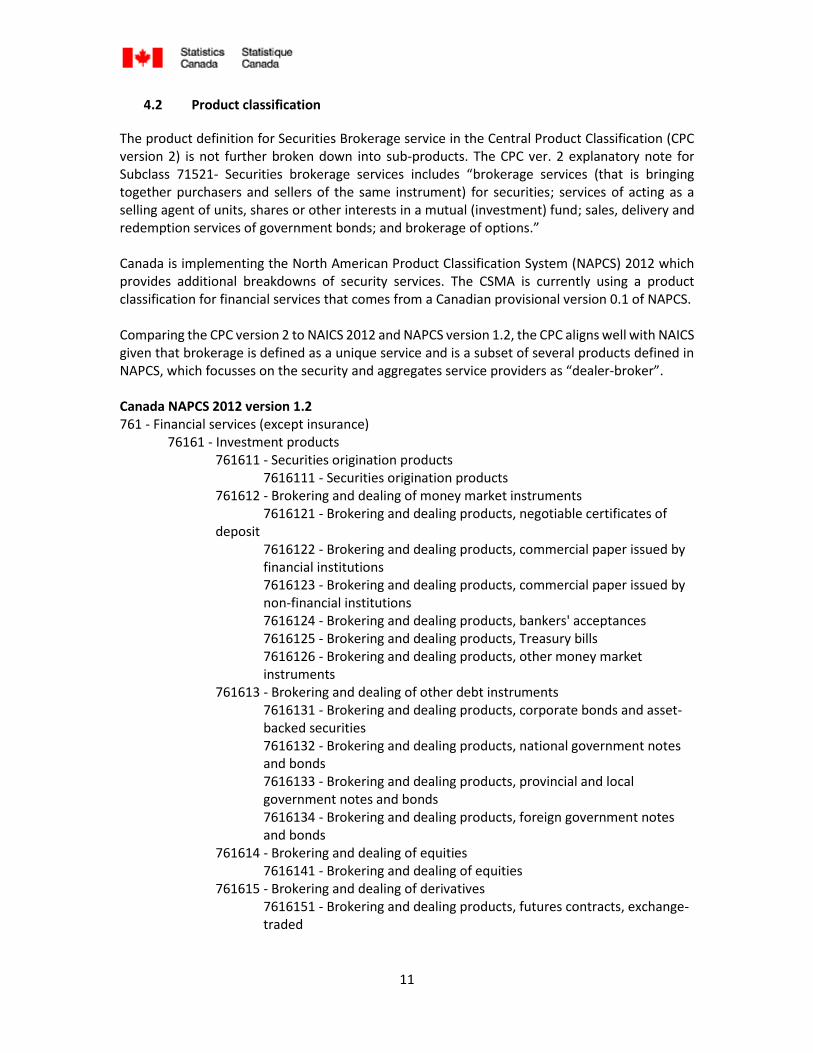
The product definition for Securities Brokerage service in the Central Product Classification (CPC version 2) is not further broken down into sub-products. The CPC ver. 2 explanatory note for Subclass 71521- Securities brokerage services includes “brokerage services (that is bringing together purchasers and sellers of the same instrument) for securities; services of acting as a selling agent of units, shares or other interests in a mutual (investment) fund; sales, delivery and redemption services of government bonds; and brokerage of options.” Canada is implementing the North American Product Classification System (NAPCS) 2012 which provides additional breakdowns of security services. The CSMA is currently using a product classification for financial services that comes from a Canadian provisional version 0.1 of NAPCS. Comparing the CPC version 2 to NAICS 2012 and NAPCS version 1.2, the CPC aligns well with NAICS given that brokerage is defined as a unique service and is a subset of several products defined in NAPCS, which focusses on the security and aggregates service providers as “dealer-broker”. Canada NAPCS 2012 version 1.2 761 - Financial services (except insurance)
76161 - Investment products 761611 - Securities origination products
7616111 - Securities origination products 761612 - Brokering and dealing of money market instruments
7616121 - Brokering and dealing products, negotiable certificates of deposit
7616122 - Brokering and dealing products, commercial paper issued by financial institutions 7616123 - Brokering and dealing products, commercial paper issued by non-financial institutions 7616124 - Brokering and dealing products, bankers' acceptances 7616125 - Brokering and dealing products, Treasury bills 7616126 - Brokering and dealing products, other money market instruments
761613 - Brokering and dealing of other debt instruments 7616131 - Brokering and dealing products, corporate bonds and asset-backed securities 7616132 - Brokering and dealing products, national government notes and bonds 7616133 - Brokering and dealing products, provincial and local government notes and bonds 7616134 - Brokering and dealing products, foreign government notes and bonds
761614 - Brokering and dealing of equities 7616141 - Brokering and dealing of equities
761615 - Brokering and dealing of derivatives 7616151 - Brokering and dealing products, futures contracts, exchange-traded
12
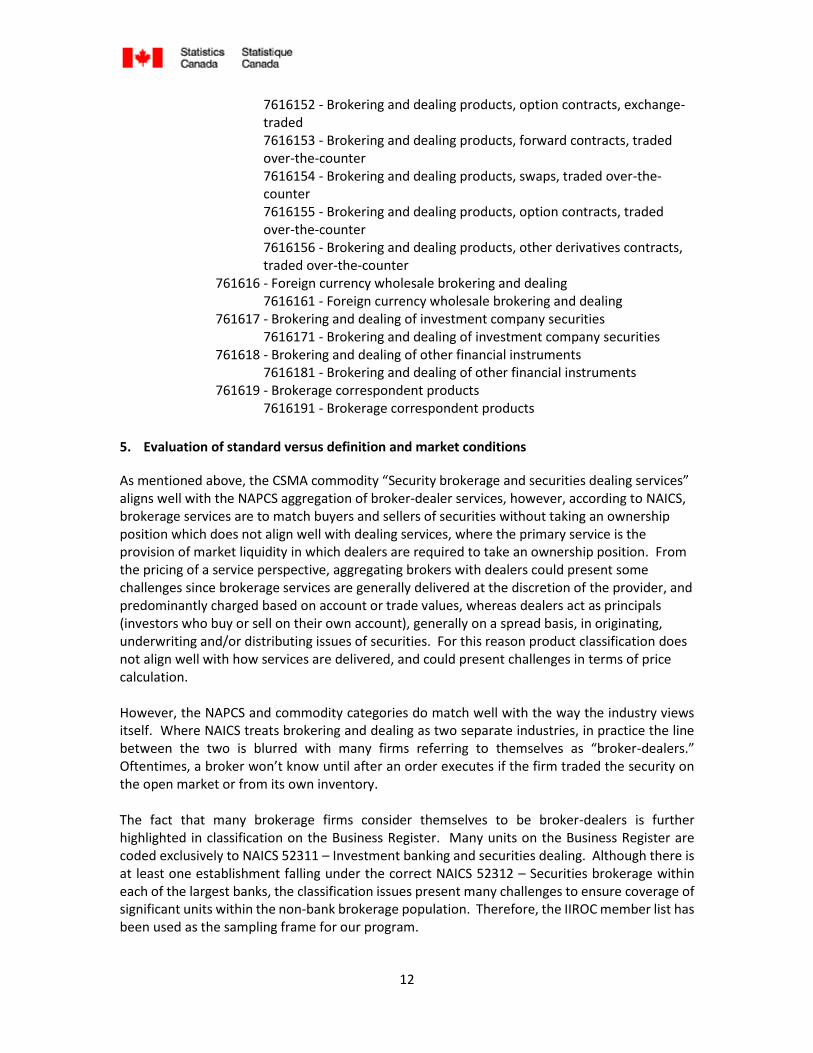
7616152 - Brokering and dealing products, option contracts, exchange-traded 7616153 - Brokering and dealing products, forward contracts, traded over-the-counter 7616154 - Brokering and dealing products, swaps, traded over-the-counter 7616155 - Brokering and dealing products, option contracts, traded over-the-counter 7616156 - Brokering and dealing products, other derivatives contracts, traded over-the-counter
761616 - Foreign currency wholesale brokering and dealing 7616161 - Foreign currency wholesale brokering and dealing
761617 - Brokering and dealing of investment company securities 7616171 - Brokering and dealing of investment company securities
761618 - Brokering and dealing of other financial instruments 7616181 - Brokering and dealing of other financial instruments
761619 - Brokerage correspondent products 7616191 - Brokerage correspondent products
5. Evaluation of standard versus definition and market conditions
As mentioned above, the CSMA commodity “Security brokerage and securities dealing services” aligns well with the NAPCS aggregation of broker-dealer services, however, according to NAICS, brokerage services are to match buyers and sellers of securities without taking an ownership position which does not align well with dealing services, where the primary service is the provision of market liquidity in which dealers are required to take an ownership position. From the pricing of a service perspective, aggregating brokers with dealers could present some challenges since brokerage services are generally delivered at the discretion of the provider, and predominantly charged based on account or trade values, whereas dealers act as principals (investors who buy or sell on their own account), generally on a spread basis, in originating, underwriting and/or distributing issues of securities. For this reason product classification does not align well with how services are delivered, and could present challenges in terms of price calculation. However, the NAPCS and commodity categories do match well with the way the industry views itself. Where NAICS treats brokering and dealing as two separate industries, in practice the line between the two is blurred with many firms referring to themselves as “broker-dealers.” Oftentimes, a broker won’t know until after an order executes if the firm traded the security on the open market or from its own inventory. The fact that many brokerage firms consider themselves to be broker-dealers is further highlighted in classification on the Business Register. Many units on the Business Register are coded exclusively to NAICS 52311 – Investment banking and securities dealing. Although there is at least one establishment falling under the correct NAICS 52312 – Securities brokerage within each of the largest banks, the classification issues present many challenges to ensure coverage of significant units within the non-bank brokerage population. Therefore, the IIROC member list has been used as the sampling frame for our program.

13
Unlike most of Statistics Canada’s SPPI program which is industry-based, the securities brokerage SPPI will align better with CSMA needs. As mentioned earlier, full-service brokerages focus more on assets with long holding periods such as bonds and mutual funds, and derive most of their revenue from fees, with the main ones including mutual fund trailer fees, and fees billed to clients for fee-based and discretionary brokerage activities. An analysis of services that overlap between the predominant activities performed by brokers, the output concept, and the activities covered by our program, shows that while there are differences among each program, commissions and fees account for more than three-quarters of Securities Brokerage and Dealing in the supply-use tables (see Table 3 below). Furthermore, the design of our program will allow the CSMA to use specific indexes, which align with the framework of the supply-use tables, in order to arrive at measures of real output. A detailed discussion is provided in section 7.3 below. Table 3: Commissions and fees account for just under half of revenues of broker-dealers, but over three-quarters of output of the brokerage and dealing commodity within the CSMA
Investment Industry
Association of Canada
(IIAC)
All Broker-
Dealers
NAICS
Securities Brokerage
Supply-Use Tables
Securities Brokerage and Dealing
Coverage
Securities Brokerage SPPI
IIAC Revenue Category
2015 Revenue
($M)
% of
Total
In/Out of Scope
% of
Total
In/Out of
Scope
% of
Total
In/Out of
Scope
% of
Total
Commission 2,998 17 In 23 In 28 In 36
Mutual Funds 2,840 16 In 22 Out - Out -
Fees 5,343 30 In 41 In 49 In 64
Other 980 6 In 8 In 9 Out
Net Interest 864 5 In 7 Out - Out -
Investment Banking
3,246 18 Out - Out - Out -
Fixed Income Trading
1,466 8 Out - In 14 Out -
Equity Trading 8 0 Out - In 0 Out -
Total 17,745 100 13,025 100 10,795 100 8,341 100
SOURCE: IIAC WITH “% OF TOTAL” CALCULATIONS PRODUCED USING IIAC REVENUE DATA. NOTE: “OUT” IN NAICS COLUMN MEANS THE ACTIVITY IS COVERED UNDER NAICS 52311. – INVESTMENT BANKING AND SECURITIES DEALING, WHILE “OUT” IN SUPPLY-USE TABLES COLUMN MEANS OUTPUT FROM THE SERVICE LINE IS NOT INCLUDED IN CSMA COMMODITY FOR
“SECURITIES BROKERS AND DEALING SERVICES”. “OUT” IN SECOND-LAST COLUMN REFERS TO CURRENT INDEX PROGRAM COVERAGE.
14
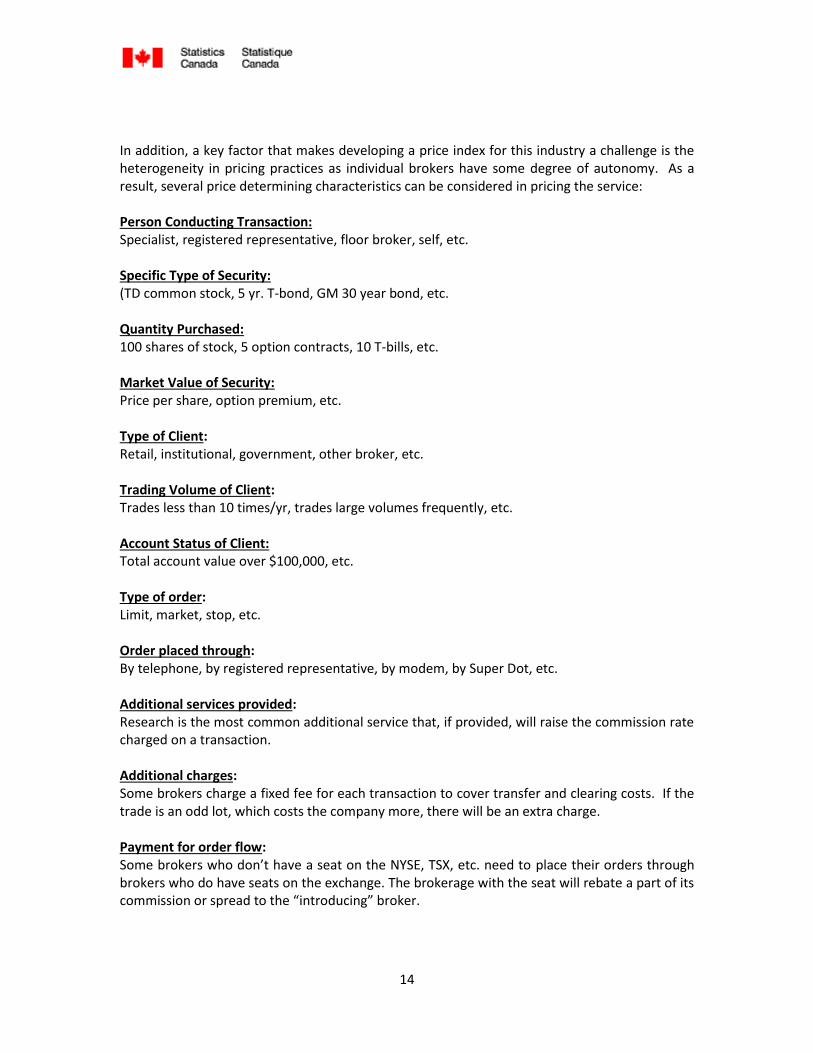
In addition, a key factor that makes developing a price index for this industry a challenge is the heterogeneity in pricing practices as individual brokers have some degree of autonomy. As a result, several price determining characteristics can be considered in pricing the service: Person Conducting Transaction: Specialist, registered representative, floor broker, self, etc. Specific Type of Security: (TD common stock, 5 yr. T-bond, GM 30 year bond, etc. Quantity Purchased: 100 shares of stock, 5 option contracts, 10 T-bills, etc. Market Value of Security: Price per share, option premium, etc. Type of Client: Retail, institutional, government, other broker, etc. Trading Volume of Client: Trades less than 10 times/yr, trades large volumes frequently, etc. Account Status of Client: Total account value over $100,000, etc. Type of order: Limit, market, stop, etc. Order placed through: By telephone, by registered representative, by modem, by Super Dot, etc. Additional services provided: Research is the most common additional service that, if provided, will raise the commission rate charged on a transaction. Additional charges: Some brokers charge a fixed fee for each transaction to cover transfer and clearing costs. If the trade is an odd lot, which costs the company more, there will be an extra charge. Payment for order flow: Some brokers who don’t have a seat on the NYSE, TSX, etc. need to place their orders through brokers who do have seats on the exchange. The brokerage with the seat will rebate a part of its commission or spread to the “introducing” broker.
15
6. Existing programs in Statistics Canada
6.1 Turnover
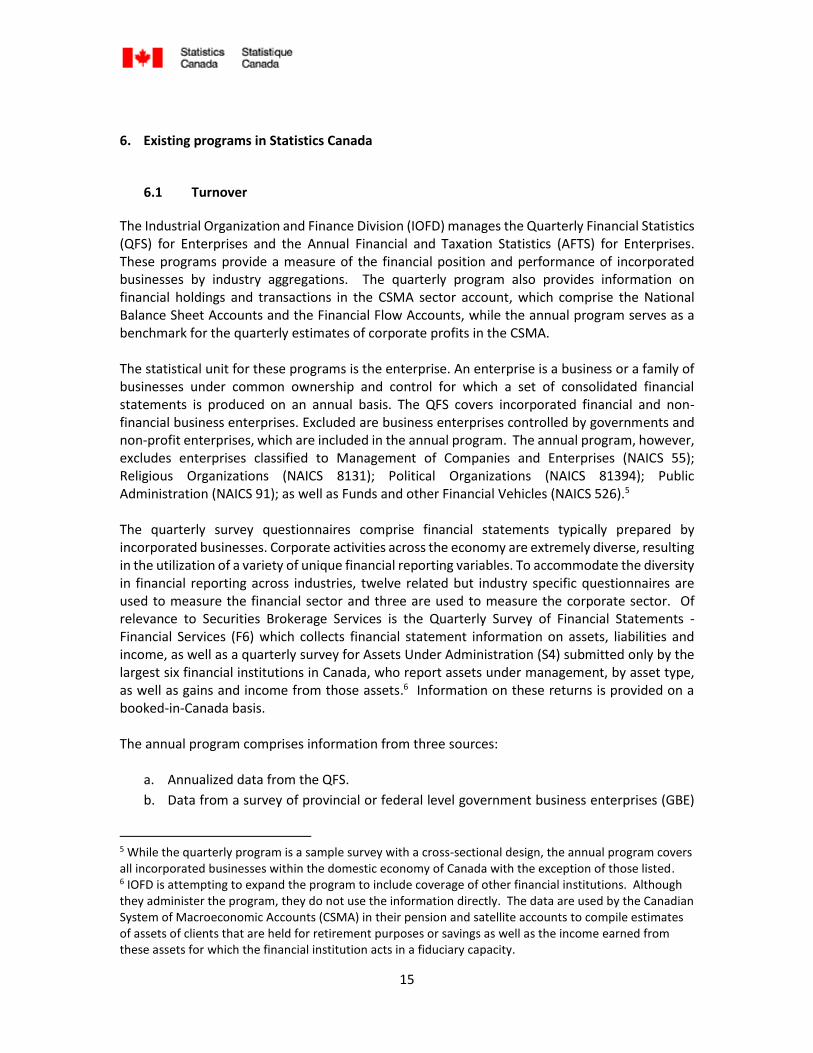
The Industrial Organization and Finance Division (IOFD) manages the Quarterly Financial Statistics (QFS) for Enterprises and the Annual Financial and Taxation Statistics (AFTS) for Enterprises. These programs provide a measure of the financial position and performance of incorporated businesses by industry aggregations. The quarterly program also provides information on financial holdings and transactions in the CSMA sector account, which comprise the National Balance Sheet Accounts and the Financial Flow Accounts, while the annual program serves as a benchmark for the quarterly estimates of corporate profits in the CSMA. The statistical unit for these programs is the enterprise. An enterprise is a business or a family of businesses under common ownership and control for which a set of consolidated financial statements is produced on an annual basis. The QFS covers incorporated financial and non-financial business enterprises. Excluded are business enterprises controlled by governments and non-profit enterprises, which are included in the annual program. The annual program, however, excludes enterprises classified to Management of Companies and Enterprises (NAICS 55); Religious Organizations (NAICS 8131); Political Organizations (NAICS 81394); Public Administration (NAICS 91); as well as Funds and other Financial Vehicles (NAICS 526).5 The quarterly survey questionnaires comprise financial statements typically prepared by incorporated businesses. Corporate activities across the economy are extremely diverse, resulting in the utilization of a variety of unique financial reporting variables. To accommodate the diversity in financial reporting across industries, twelve related but industry specific questionnaires are used to measure the financial sector and three are used to measure the corporate sector. Of relevance to Securities Brokerage Services is the Quarterly Survey of Financial Statements - Financial Services (F6) which collects financial statement information on assets, liabilities and income, as well as a quarterly survey for Assets Under Administration (S4) submitted only by the largest six financial institutions in Canada, who report assets under management, by asset type, as well as gains and income from those assets.6 Information on these returns is provided on a booked-in-Canada basis. The annual program comprises information from three sources:
a. Annualized data from the QFS.
b. Data from a survey of provincial or federal level government business enterprises (GBE)
5 While the quarterly program is a sample survey with a cross-sectional design, the annual program covers all incorporated businesses within the domestic economy of Canada with the exception of those listed. 6 IOFD is attempting to expand the program to include coverage of other financial institutions. Although they administer the program, they do not use the information directly. The data are used by the Canadian System of Macroeconomic Accounts (CSMA) in their pension and satellite accounts to compile estimates of assets of clients that are held for retirement purposes or savings as well as the income earned from these assets for which the financial institution acts in a fiduciary capacity.
16
that operate in the business sector, obtained from the Public Sector Statistics Division at
Statistics Canada.
c. Administrative corporate taxation data in the form of T2 Corporation Income Tax returns
and the General Index of Financial Information (GIFI) obtained from the Tax Data Division
at Statistics Canada.
6.2 Securities brokerage in the Supply-Use Tables
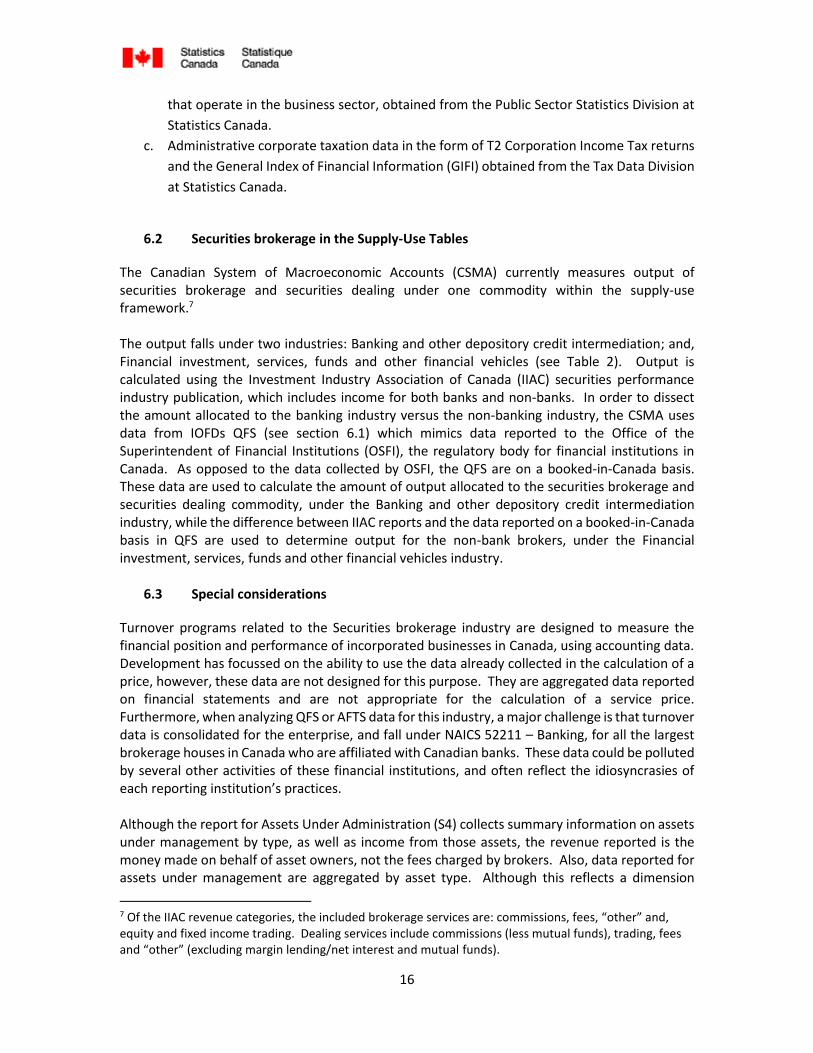
The Canadian System of Macroeconomic Accounts (CSMA) currently measures output of securities brokerage and securities dealing under one commodity within the supply-use framework.7 The output falls under two industries: Banking and other depository credit intermediation; and, Financial investment, services, funds and other financial vehicles (see Table 2). Output is calculated using the Investment Industry Association of Canada (IIAC) securities performance industry publication, which includes income for both banks and non-banks. In order to dissect the amount allocated to the banking industry versus the non-banking industry, the CSMA uses data from IOFDs QFS (see section 6.1) which mimics data reported to the Office of the Superintendent of Financial Institutions (OSFI), the regulatory body for financial institutions in Canada. As opposed to the data collected by OSFI, the QFS are on a booked-in-Canada basis. These data are used to calculate the amount of output allocated to the securities brokerage and securities dealing commodity, under the Banking and other depository credit intermediation industry, while the difference between IIAC reports and the data reported on a booked-in-Canada basis in QFS are used to determine output for the non-bank brokers, under the Financial investment, services, funds and other financial vehicles industry.
6.3 Special considerations
Turnover programs related to the Securities brokerage industry are designed to measure the financial position and performance of incorporated businesses in Canada, using accounting data. Development has focussed on the ability to use the data already collected in the calculation of a price, however, these data are not designed for this purpose. They are aggregated data reported on financial statements and are not appropriate for the calculation of a service price. Furthermore, when analyzing QFS or AFTS data for this industry, a major challenge is that turnover data is consolidated for the enterprise, and fall under NAICS 52211 – Banking, for all the largest brokerage houses in Canada who are affiliated with Canadian banks. These data could be polluted by several other activities of these financial institutions, and often reflect the idiosyncrasies of each reporting institution’s practices. Although the report for Assets Under Administration (S4) collects summary information on assets under management by type, as well as income from those assets, the revenue reported is the money made on behalf of asset owners, not the fees charged by brokers. Also, data reported for assets under management are aggregated by asset type. Although this reflects a dimension
7 Of the IIAC revenue categories, the included brokerage services are: commissions, fees, “other” and, equity and fixed income trading. Dealing services include commissions (less mutual funds), trading, fees and “other” (excluding margin lending/net interest and mutual funds).
17
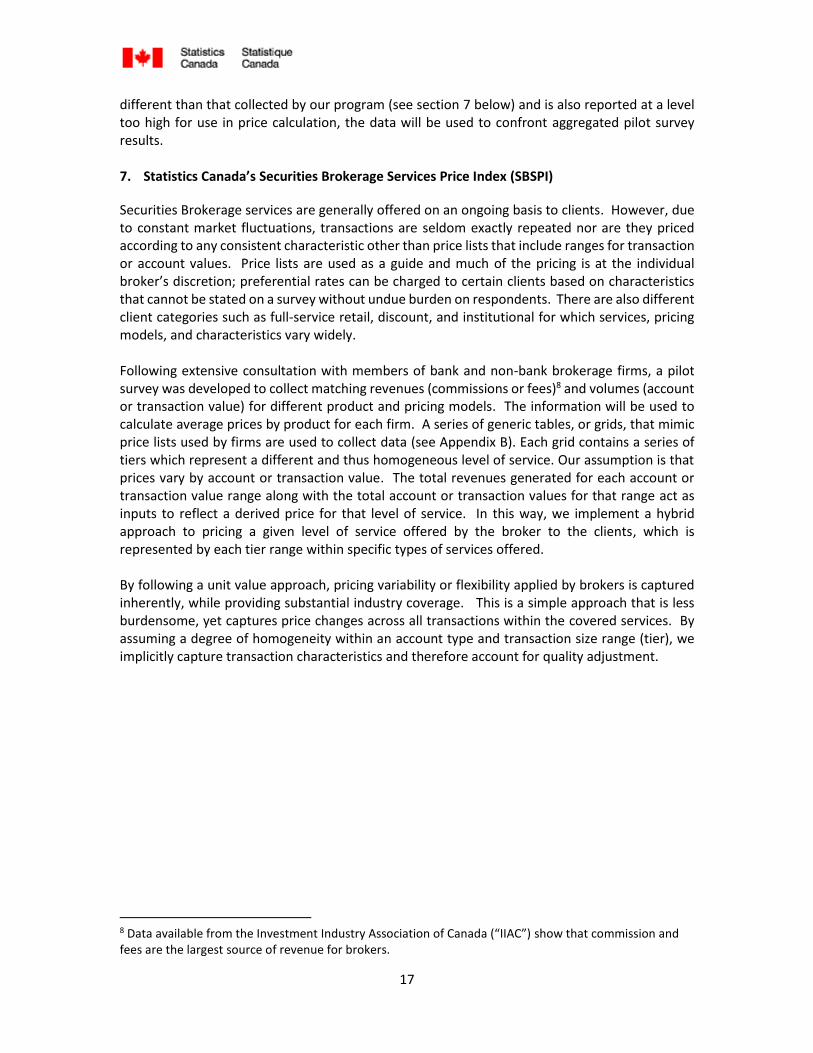
different than that collected by our program (see section 7 below) and is also reported at a level too high for use in price calculation, the data will be used to confront aggregated pilot survey results. 7. Statistics Canada’s Securities Brokerage Services Price Index (SBSPI)
Securities Brokerage services are generally offered on an ongoing basis to clients. However, due to constant market fluctuations, transactions are seldom exactly repeated nor are they priced according to any consistent characteristic other than price lists that include ranges for transaction or account values. Price lists are used as a guide and much of the pricing is at the individual broker’s discretion; preferential rates can be charged to certain clients based on characteristics that cannot be stated on a survey without undue burden on respondents. There are also different client categories such as full-service retail, discount, and institutional for which services, pricing models, and characteristics vary widely. Following extensive consultation with members of bank and non-bank brokerage firms, a pilot survey was developed to collect matching revenues (commissions or fees)8 and volumes (account or transaction value) for different product and pricing models. The information will be used to calculate average prices by product for each firm. A series of generic tables, or grids, that mimic price lists used by firms are used to collect data (see Appendix B). Each grid contains a series of tiers which represent a different and thus homogeneous level of service. Our assumption is that prices vary by account or transaction value. The total revenues generated for each account or transaction value range along with the total account or transaction values for that range act as inputs to reflect a derived price for that level of service. In this way, we implement a hybrid approach to pricing a given level of service offered by the broker to the clients, which is represented by each tier range within specific types of services offered. By following a unit value approach, pricing variability or flexibility applied by brokers is captured inherently, while providing substantial industry coverage. This is a simple approach that is less burdensome, yet captures price changes across all transactions within the covered services. By assuming a degree of homogeneity within an account type and transaction size range (tier), we implicitly capture transaction characteristics and therefore account for quality adjustment.
8 Data available from the Investment Industry Association of Canada (“IIAC”) show that commission and fees are the largest source of revenue for brokers.
18
7.1 Data
Given that existing data offered little information useful to our program, and could not be used to create a Securities Brokerage Services Price Index (SBSPI), development turned to focus on data collection via the Survey of Securities Brokerage Services. The Survey of Securities Brokerage Services collects data used to calculate prices of Full-Service Retail Brokerage services offered by Securities Brokerage and Dealer firms in Canada since our research indicated that the greatest proportion of output is produced from that segment. Our pilot also focusses on commissions and fee based brokerage services as these constitute the largest revenue generating activities of these firms and as such would have the largest impact on index movement. Data is collected at the national level and encompasses aggregate transaction details for the main product/service types:
a. Transaction Based
b. Fee-Based (non-discretionary)
c. Advisor Managed (discretionary)
7.2 Coverage
Our survey covers revenues from commissions and fees categories representing about half of industry output. In terms of the Security Brokerage and Securities Dealing Services output commodity, our coverage is partially in line. We exclude institutional and discount client transactions since their pricing characteristics vary widely as well as mutual funds (also excluded by the CSMA). Also, while the commodity includes output from Fixed Income and Equity trading services, we have excluded them as they are securities dealing services which fall under NAICS 523110 – Investment Banking and Securities Dealing Services. Our frame is based on the Investment Industry Regulatory Organization of Canada’s (IIROC) member list for securities brokers given the unique way brokerage offices are affiliated with Canadian financial services enterprises. In some instances, financial institutions on the Business Register include establishments with the NAICS 52312, however, not all of the largest firms in Canada engaged in brokerage activities had specific units with the target NAICS and, therefore, the IIROC list was deemed more appropriate in order to ensure proper coverage of Canadian activities that align with those contributing to output. As a result, of the almost 180 firms included in the IIROC list, the sample for our pilot is made up of 18 firms, and includes a good mix of both bank and non-bank brokers covering more than 80% of total asset under management in Canada.9 7.3 Usefulness
The primary purpose of the SBSPI is to deflate output in the Canadian System of Macroeconomic Accounts. The Securities Brokerage industry in Canada consists of subsidiaries of the Big Banks
9 Investor Economics Fall 2015 Pre-release report.
19
and other non-bank firms, and therefore falls under two industries in the CSMA; Banking and Other Depository Credit Intermediation; and, Financial Investment Services, Funds and other Financial Vehicles (see Table 2 above). Furthermore, the CSMA commodity aggregates two activities, those of securities brokerages and securities dealers. As a result, we have designed our sampling strategy to test the pricing characteristics of both types of firms (bank subsidiaries and non-bank brokerage firms) during the pilot program. This will allow us to furnish the CSMA with two sub-indexes if the price change characteristics are found to differ between the two groups. The sub-index derived from the bank subsidiaries could also be used in a broader Banking Services Price Index (BSPI) which could be useful to clients within and outside of the CSMA. In addition, given that the main activities of brokers differs from that of NAICS 52311 – Investment banking and securities dealing, a unique index for each of those services is under development. The end result will be that the CSMA will be able to apply specific indexes to output as needed.10 7.4 Methodology
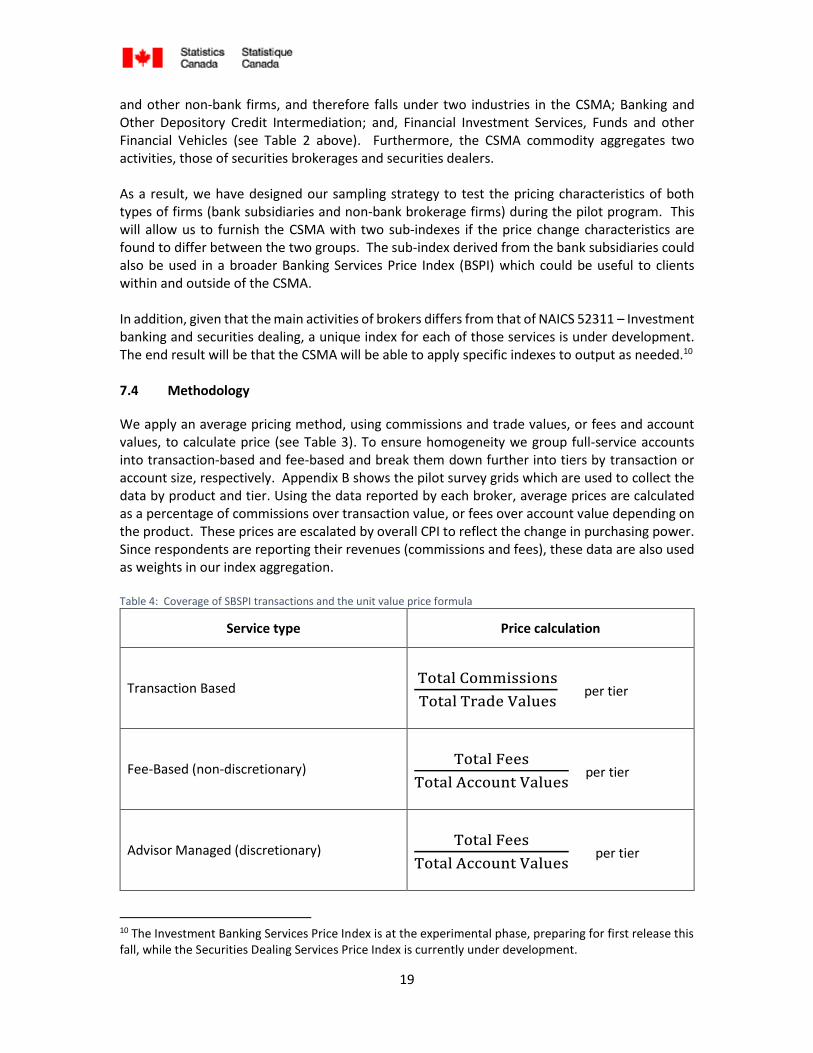
We apply an average pricing method, using commissions and trade values, or fees and account values, to calculate price (see Table 3). To ensure homogeneity we group full-service accounts into transaction-based and fee-based and break them down further into tiers by transaction or account size, respectively. Appendix B shows the pilot survey grids which are used to collect the data by product and tier. Using the data reported by each broker, average prices are calculated as a percentage of commissions over transaction value, or fees over account value depending on the product. These prices are escalated by overall CPI to reflect the change in purchasing power. Since respondents are reporting their revenues (commissions and fees), these data are also used as weights in our index aggregation. Table 4: Coverage of SBSPI transactions and the unit value price formula
Service type Price calculation
Transaction Based Total Commissions
Total Trade Values per tier
Fee-Based (non-discretionary) Total Fees
Total Account Values per tier
Advisor Managed (discretionary) Total Fees
Total Account Values per tier
10 The Investment Banking Services Price Index is at the experimental phase, preparing for first release this fall, while the Securities Dealing Services Price Index is currently under development.
20
7.5 Initial findings
The average pricing method provides updated and accurate price information on a quarterly basis, however, there are challenges. First, this method requires high data quality. Brokers report service characteristics (or tiers) that shift over time and have different ways of grouping their services or accounts. These issues, to a certain extent, have led to a low level of response for some key units. The survey data also shows significant quarterly volatility. In order to mitigate these challenges, we are examining how the program might be able to better suit our respondents’ record-keeping practices in terms of how data are reported within their systems, how easily they understand our needs, and are analysing the impact of changing the survey frequency from a quarterly to an annual basis.11 Another challenge is adjusting for quality changes, many of which are difficult to quantify. The quality of service one receives from a full-service firm can vary greatly as there is a large range in broker skill and experience. Since we are using a unit value approach for which there is no quality adjustment, we require our product groupings to remain as homogeneous as possible to ensure consistent service interpretation. 8. Conclusion
In this paper, we discuss the idiosyncrasies of the securities brokerage industry and its role in the Canadian financial services sector. Output in the finance and insurance sector in Canada is increasingly impacted by the Financial investment services, funds and other financial vehicles subsector, which includes NAICS 52312 – Securities Brokerage Services. As a result, ensuring a quality index that largely covers the activities of the industry are crucial to the accurate measurement of prices and real output in the industry. The aim of our pilot program is to test the possibility of generating a unit value price index to broadly measure the price of services within this industry. Within our pilot program, using survey data from full service brokers, we find that price levels tend to drift lower for transaction-based accounts but are stable for fee-based accounts. Our data also indicate a rising trend in the popularity of fee-based accounts in the full-service brokerage industry. However, the program is not without its challenges, resulting in continuing consultation, and research on potential sources of data for index calculation and confrontation. Finally, the financial services industry is one that frequently innovates, therefore, our index must be flexible enough to adapt to changes in the market. For example, online and mobile account management tools have become increasingly important with many firms competing to provide the best user experience. Full-service brokerages offer a number of related services not necessarily tied to account activity or asset values. These can range from estate or retirement planning to philanthropy. In order to continue to be relevant, basket updates, tier changes, and new products or account types will need to be revisited on a regular basis.
11 Simple solutions considered include moving some information provided in a reporting guide, directly onto the questionnaire.
21
References Baily, Martin Neil and Douglas J. Elliot. 2013. “The Role of Finance in the Economy: Implications for Structural Reform of the Financial Sector.” The Brookings Institution. Mazin, Yana, Judi Lepage, Lucy Opsitnik and Min Xie. 2012. “Services Producer Price Index Development: Progress and Recommendations Report.” Internal report. December 2012. Mazin, Yana. 2010. “SPPI Development – Securities Brokerage.” Internal report. August 2010. Investment Industry Association of Canada (“IIAC”). 2016. “2016 Q1 Securities Industry Performance.” www.iiac.ca. (Report downloaded July 11, 2016). Investor Economics. 2015. “Retail Brokerage and Distribution Advisory Service - Winter 2015 Edition.” TMX Group Ltd. 2016. “A Capital Opportunity: A Global Market for Financial Services Companies.” www.tsx.com (Accessed July 16, 2016).
22
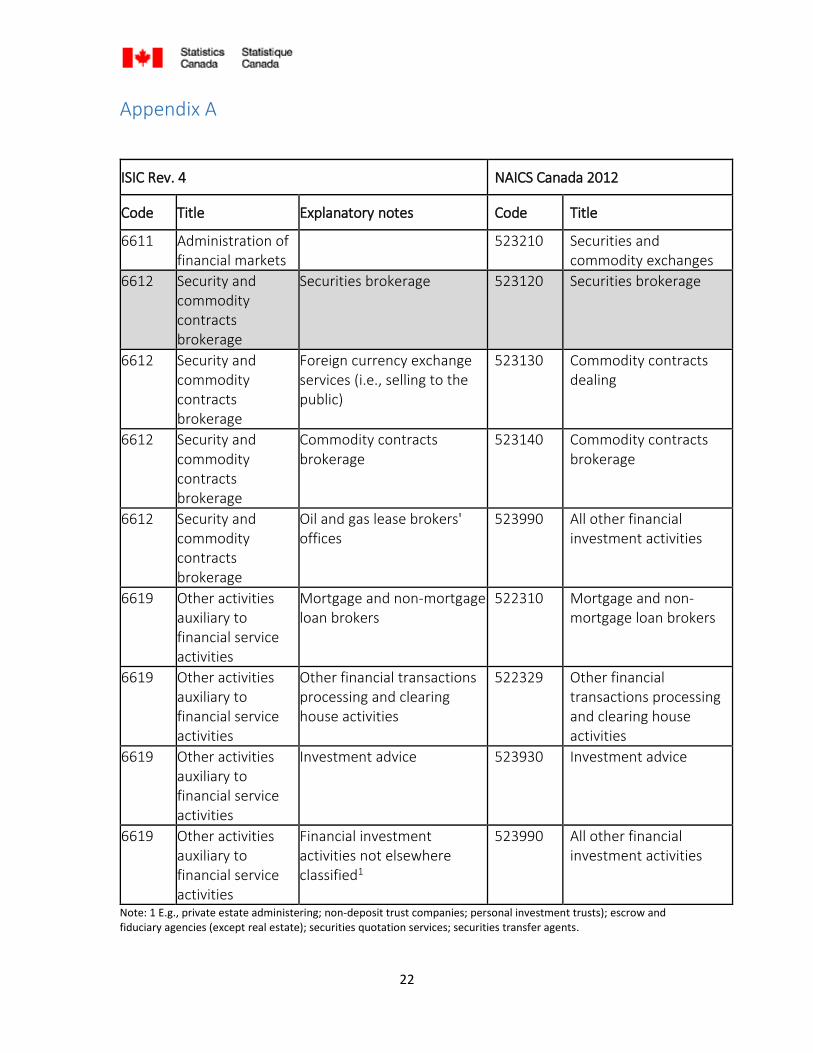
Appendix A
ISIC Rev. 4 NAICS Canada 2012
Code Title Explanatory notes Code Title
6611 Administration of financial markets
523210 Securities and commodity exchanges
6612 Security and commodity contracts brokerage
Securities brokerage 523120 Securities brokerage
6612 Security and commodity contracts brokerage
Foreign currency exchange services (i.e., selling to the public)
523130 Commodity contracts dealing
6612 Security and commodity contracts brokerage
Commodity contracts brokerage
523140 Commodity contracts brokerage
6612 Security and commodity contracts brokerage
Oil and gas lease brokers' offices
523990 All other financial investment activities
6619 Other activities auxiliary to financial service activities
Mortgage and non-mortgage loan brokers
522310 Mortgage and non-mortgage loan brokers
6619 Other activities auxiliary to financial service activities
Other financial transactions processing and clearing house activities
522329 Other financial transactions processing and clearing house activities
6619 Other activities auxiliary to financial service activities
Investment advice 523930 Investment advice
6619 Other activities auxiliary to financial service activities
Financial investment activities not elsewhere classified1
523990 All other financial investment activities
Note: 1 E.g., private estate administering; non-deposit trust companies; personal investment trusts); escrow and fiduciary agencies (except real estate); securities quotation services; securities transfer agents.
23
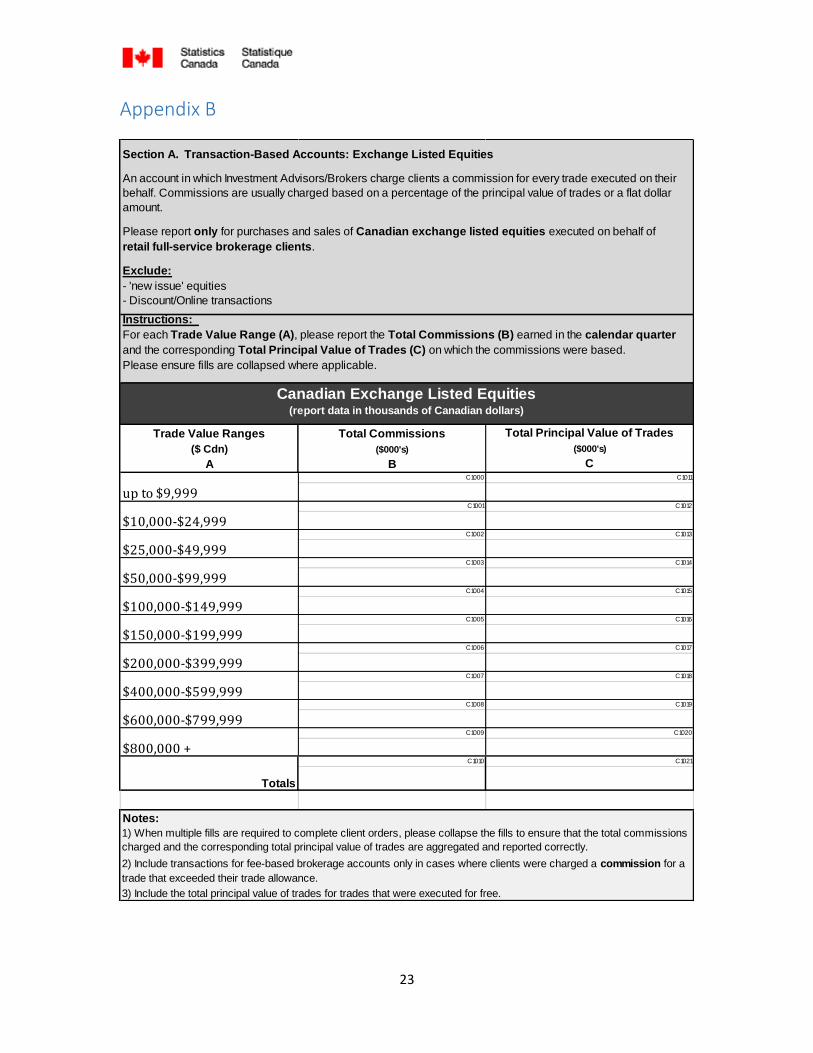
Appendix B
Trade Value Ranges
($ Cdn)
A
Total Commissions
($000's)
B
Total Principal Value of Trades
($000's)
CC1000 C1011
C1001 C1012
C1002 C1013
C1003 C1014
C1004 C1015
C1005 C1016
C1006 C1017
C1007 C1018
C1008 C1019
C1009 C1020
C1010 C1021
Notes:
3) Include the total principal value of trades for trades that were executed for free.
Section A. Transaction-Based Accounts: Exchange Listed Equities
Instructions:
For each Trade Value Range (A), please report the Total Commissions (B) earned in the calendar quarter
and the corresponding Total Principal Value of Trades (C) on which the commissions were based.
Please ensure fills are collapsed where applicable.
An account in which Investment Advisors/Brokers charge clients a commission for every trade executed on their
behalf. Commissions are usually charged based on a percentage of the principal value of trades or a flat dollar
amount.
Please report only for purchases and sales of Canadian exchange listed equities executed on behalf of
retail full-service brokerage clients.
Exclude:
- 'new issue' equities
- Discount/Online transactions
2) Include transactions for fee-based brokerage accounts only in cases where clients were charged a commission for a
trade that exceeded their trade allowance.
up to $9,999
Canadian Exchange Listed Equities(report data in thousands of Canadian dollars)
Totals
$50,000-$99,999
$100,000-$149,999
1) When multiple fills are required to complete client orders, please collapse the fills to ensure that the total commissions
charged and the corresponding total principal value of trades are aggregated and reported correctly.
$150,000-$199,999
$200,000-$399,999
$400,000-$599,999
$10,000-$24,999
$25,000-$49,999
$600,000-$799,999
$800,000 +
24
Account/Household Value
Ranges ($ Cdn)
A
Total Fees
($000's)
B
Total Account/Household Values
($000's)
CC1022 C1031
C1023 C1032
C1024 C1033
C1025 C1034
C1026 C1035
C1027 C1036
C1028 C1037
C1029 C1038
C1030 C1039
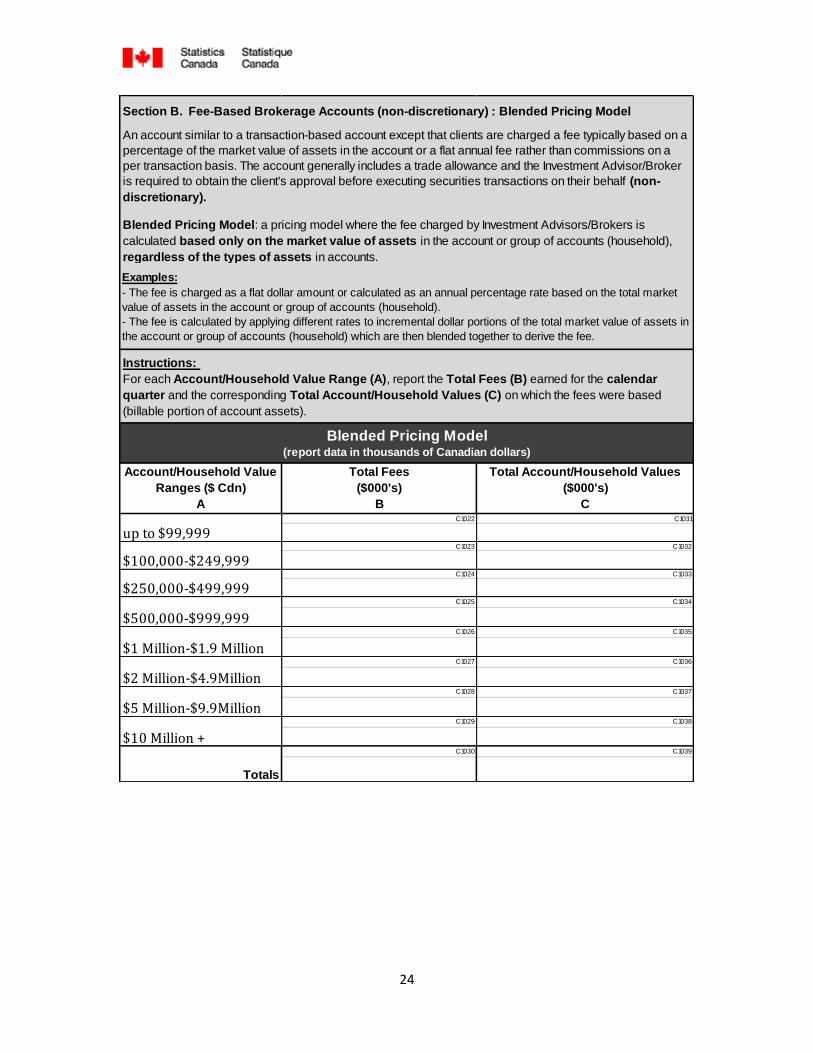
Section B. Fee-Based Brokerage Accounts (non-discretionary) : Blended Pricing Model
An account similar to a transaction-based account except that clients are charged a fee typically based on a
percentage of the market value of assets in the account or a flat annual fee rather than commissions on a
per transaction basis. The account generally includes a trade allowance and the Investment Advisor/Broker
is required to obtain the client's approval before executing securities transactions on their behalf (non-
discretionary).
Blended Pricing Model: a pricing model where the fee charged by Investment Advisors/Brokers is
calculated based only on the market value of assets in the account or group of accounts (household),
regardless of the types of assets in accounts.
Instructions:
For each Account/Household Value Range (A), report the Total Fees (B) earned for the calendar
quarter and the corresponding Total Account/Household Values (C) on which the fees were based
(billable portion of account assets).
$5 Million-$9.9Million
$10 Million +
Totals
Examples:
- The fee is charged as a flat dollar amount or calculated as an annual percentage rate based on the total market
value of assets in the account or group of accounts (household).
- The fee is calculated by applying different rates to incremental dollar portions of the total market value of assets in
the account or group of accounts (household) which are then blended together to derive the fee.
up to $99,999
$100,000-$249,999
$250,000-$499,999
$500,000-$999,999
$1 Million-$1.9 Million
$2 Million-$4.9Million
Blended Pricing Model(report data in thousands of Canadian dollars)
25
Account/Household Value
Ranges ($ Cdn)
A
Total Fees
($000's)
B
Total Account/Household Values
($000's)
CC1040 C1049
C1041 C1050
C1042 C1051
C1043 C1052
C1044 C1053
C1045 C1054
C1046 C1055
C1047 C1056
C1048 C1057
Account/Household Value
Ranges ($ Cdn)
A
Total Fees
($000's)
B
Total Account/Household Values
($000's)
CC1058 C1067
C1059 C1068
C1060 C1069
C1061 C1070
C1062 C1071
C1063 C1072
C1064 C1073
C1065 C1074
C1066 C1075
Totals
$250,000-$499,999
$500,000-$999,999
up to $99,999
$100,000-$249,999
$2 Million-$4.9Million
$5 Million-$9.9Million
$10 Million +
$1 Million-$1.9 Million
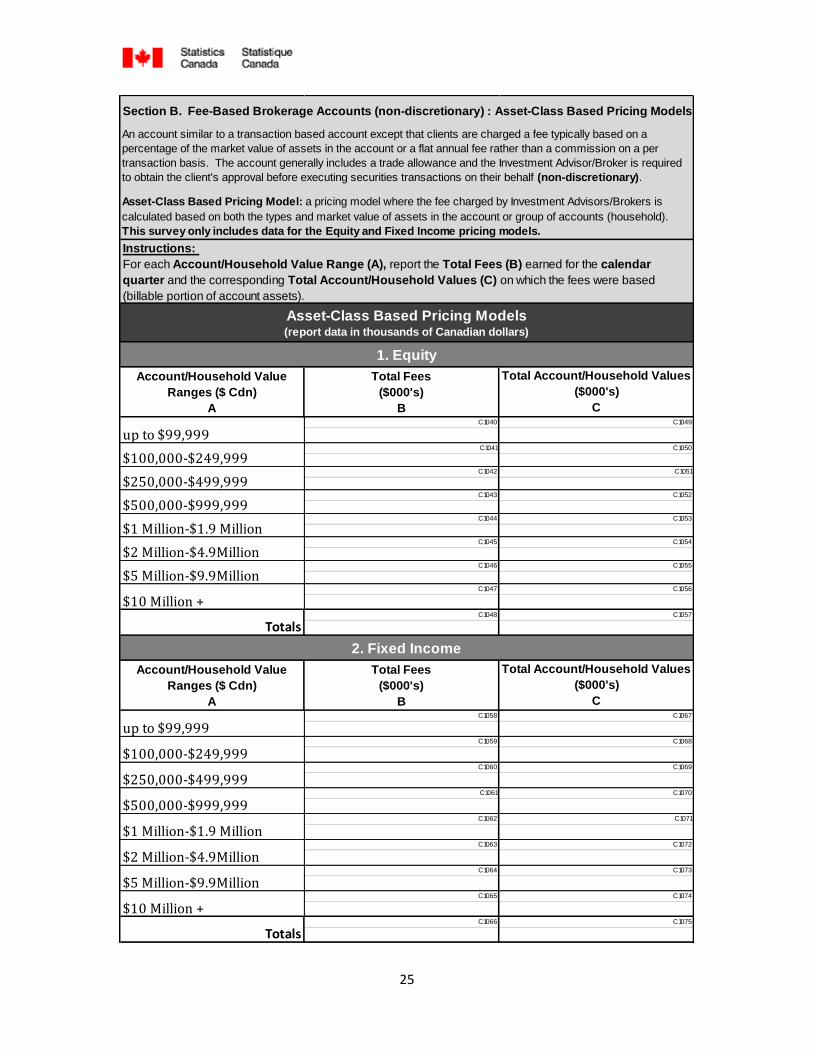
1. Equity
2. Fixed Income
Section B. Fee-Based Brokerage Accounts (non-discretionary) : Asset-Class Based Pricing Models
Asset-Class Based Pricing Model: a pricing model where the fee charged by Investment Advisors/Brokers is
calculated based on both the types and market value of assets in the account or group of accounts (household).
This survey only includes data for the Equity and Fixed Income pricing models.
Asset-Class Based Pricing Models(report data in thousands of Canadian dollars)
up to $99,999
$100,000-$249,999
$250,000-$499,999
$500,000-$999,999
$1 Million-$1.9 Million
Totals
$2 Million-$4.9Million
$5 Million-$9.9Million
$10 Million +
Instructions:
For each Account/Household Value Range (A), report the Total Fees (B) earned for the calendar
quarter and the corresponding Total Account/Household Values (C) on which the fees were based
(billable portion of account assets).
An account similar to a transaction based account except that clients are charged a fee typically based on a
percentage of the market value of assets in the account or a flat annual fee rather than a commission on a per
transaction basis. The account generally includes a trade allowance and the Investment Advisor/Broker is required
to obtain the client's approval before executing securities transactions on their behalf (non-discretionary).
26
Account/Household Value
Ranges ($ Cdn)
A
Total Fees
($000's)
B
Total Account/Household Values
($000's)
CC1076 C1084
C1077 C1085
C1078 C1086
C1079 C1087
C1080 C1088
C1081 C1089
C1082 C1090
C1083 C1091
Totals
$500,000-$999,999
$1 Million-$1.9 Million
$2 Million-$4.9Million
$5 Million-$9.9Million
$10 Million +
Blended Pricing Model(report data in thousands of Canadian dollars)
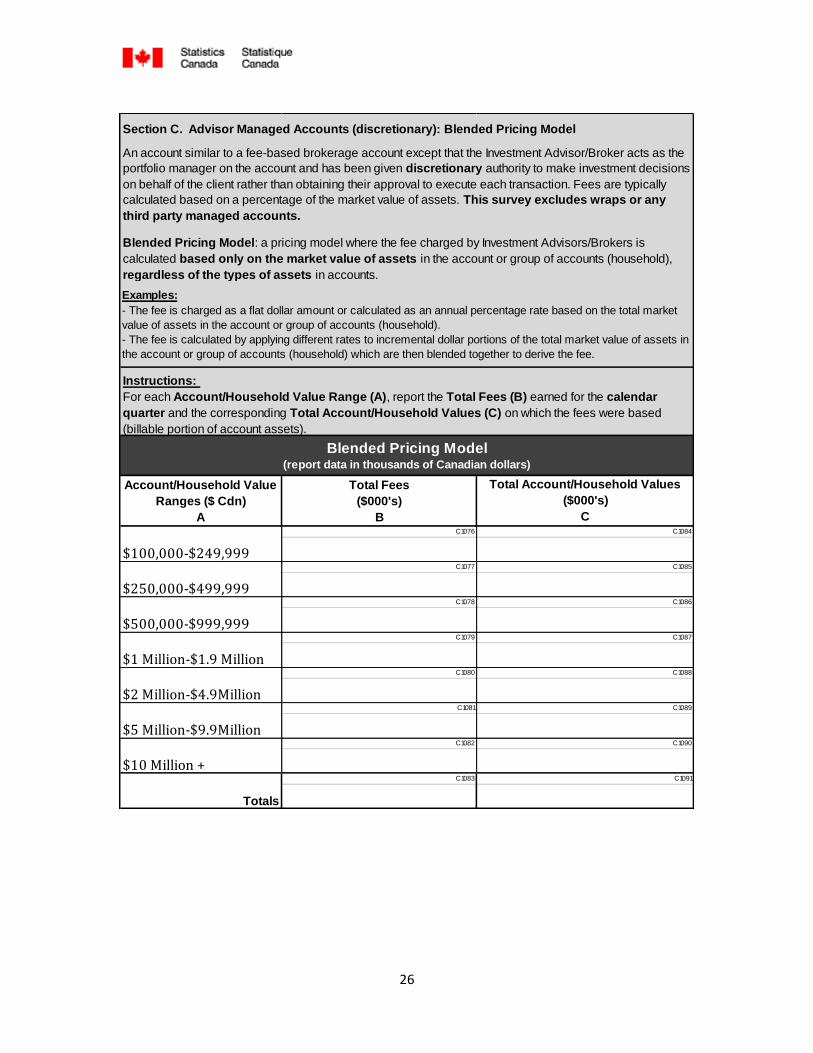
Section C. Advisor Managed Accounts (discretionary): Blended Pricing Model
$100,000-$249,999
$250,000-$499,999
An account similar to a fee-based brokerage account except that the Investment Advisor/Broker acts as the
portfolio manager on the account and has been given discretionary authority to make investment decisions
on behalf of the client rather than obtaining their approval to execute each transaction. Fees are typically
calculated based on a percentage of the market value of assets. This survey excludes wraps or any
third party managed accounts.
Blended Pricing Model: a pricing model where the fee charged by Investment Advisors/Brokers is
calculated based only on the market value of assets in the account or group of accounts (household),
regardless of the types of assets in accounts.
Instructions:
For each Account/Household Value Range (A), report the Total Fees (B) earned for the calendar
quarter and the corresponding Total Account/Household Values (C) on which the fees were based
(billable portion of account assets).
Examples:
- The fee is charged as a flat dollar amount or calculated as an annual percentage rate based on the total market
value of assets in the account or group of accounts (household).
- The fee is calculated by applying different rates to incremental dollar portions of the total market value of assets in
the account or group of accounts (household) which are then blended together to derive the fee.
27
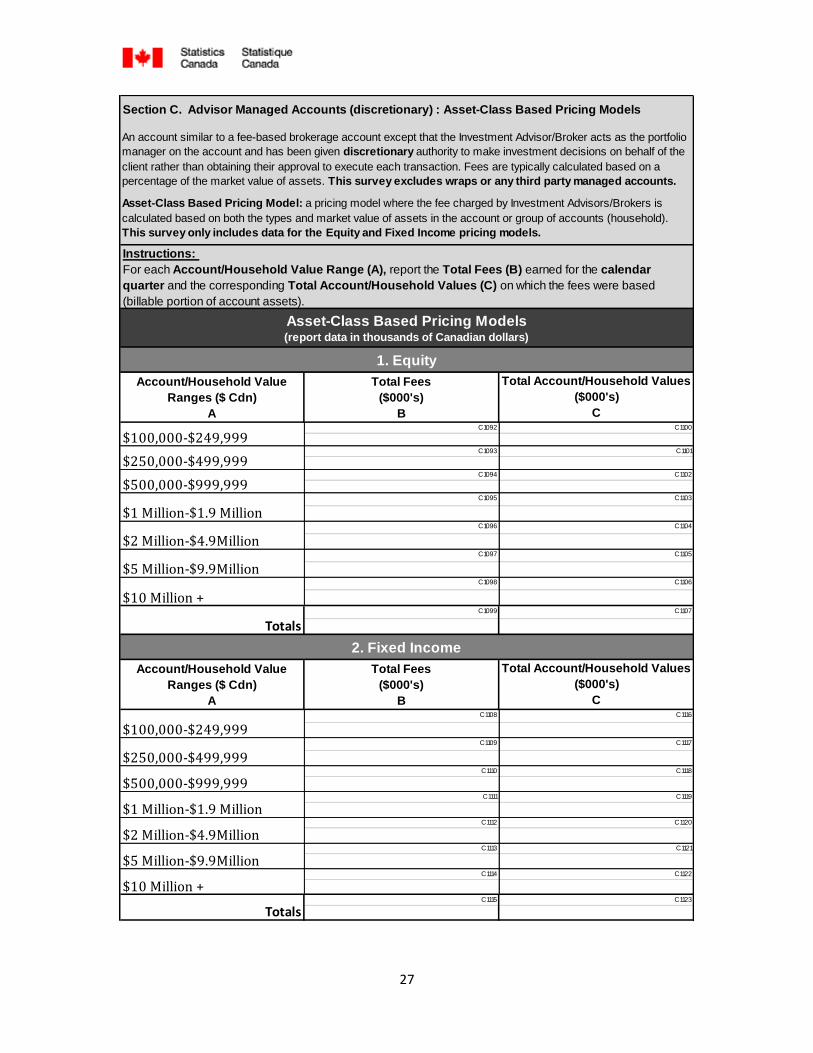
Section C. Advisor Managed Accounts (discretionary) : Asset-Class Based Pricing Models
Account/Household Value
Ranges ($ Cdn)
A
Total Fees
($000's)
B
Total Account/Household Values
($000's)
CC1092 C1100
C1093 C1101
C1094 C1102
C1095 C1103
C1096 C1104
C1097 C1105
C1098 C1106
C1099 C1107
Account/Household Value
Ranges ($ Cdn)
A
Total Fees
($000's)
B
Total Account/Household Values
($000's)
CC1108 C1116
C1109 C1117
C1110 C1118
C1111 C1119
C1112 C1120
C1113 C1121
C1114 C1122
C1115 C1123
$5 Million-$9.9Million
$10 Million +
Totals
2. Fixed Income
$100,000-$249,999
$250,000-$499,999
$500,000-$999,999
$1 Million-$1.9 Million
$2 Million-$4.9Million
Totals
An account similar to a fee-based brokerage account except that the Investment Advisor/Broker acts as the portfolio
manager on the account and has been given discretionary authority to make investment decisions on behalf of the
client rather than obtaining their approval to execute each transaction. Fees are typically calculated based on a
percentage of the market value of assets. This survey excludes wraps or any third party managed accounts.
Asset-Class Based Pricing Models(report data in thousands of Canadian dollars)
1. Equity
$100,000-$249,999
$250,000-$499,999
Asset-Class Based Pricing Model: a pricing model where the fee charged by Investment Advisors/Brokers is
calculated based on both the types and market value of assets in the account or group of accounts (household).
This survey only includes data for the Equity and Fixed Income pricing models.
Instructions:
For each Account/Household Value Range (A), report the Total Fees (B) earned for the calendar
quarter and the corresponding Total Account/Household Values (C) on which the fees were based
(billable portion of account assets).
$500,000-$999,999
$1 Million-$1.9 Million
$2 Million-$4.9Million
$5 Million-$9.9Million
$10 Million +