Embed Size (px)
Citation preview

Tim MarkerFAA Technical Center
Development of a Lab-Scale Test For Evaluating Decomposition Products of
Burnthrough Compliant Insulation Systems

Fuselage Burnthrough Chronology
Full-sale test article built at FAATC in mid 1990’s for evaluating performance ofburnthrough-resistant thermal acoustic insulation materials.
Testing indicated burnthrough-resistant insulation provided a much moresurvivable cabin atmosphere when compared to current insulation materials.
Although burnthrough resistant materials provide a benefit, the ingress of toxicgases resulting from decomposition of the insulation needs to be quantified.
FAA issued NPRM, 2003 Final Rule issued, 2009 compliance.
2005 FAATC began development of a lab-scale test for evaluating toxicgas decomposition products that could be generated inside fuselageduring a postcrash fire.

It is anticipated that this test method could be used to evaluate the potential toxicity of insulation constructions and innovations meetingthe new burnthrough test requirements, in order to ensure that an adverse condition will not result inside an intact fuselage when exposed to an external fuel fire, despite the high burnthrough performance associated with a particular system.
Development of Lab-Scale Test For MeasuringDecomposition Products During a Postcrash Fire
This test method could also be used to evaluate the toxic contribution of the basic fuselage structure, whenever a nonmetallic material is used as the primary component.

Conduct lab-scale burnthrough test on 2 types of burnthrough resistantinsulation, and 1 type of structural composite material (without insulation).Measured the build-up of toxic and flammable gases within an enclosuresimulating a fuselage
Conduct subsequent full-scale tests with identical insulation materials toestablish realistic baseline data using FTIR.
Methodology
Determine concentration scaling factor between lab and full-scale tests inorder to develop appropriate pass/fail criteria for lab-scale test.
complete
complete
pending
complete
Produce Final Report and guidance on the acceptable level of decompositionproducts generated during lab-scale box test.

Apparatus for Evaluating Toxic Gas Decomposition Products

Fourier Transform Infrared (FTIR)/Total Hydrocarbon Gas analysis systemused to collect and measure toxic and flammable gases yielded during tests.
Burner configuration according to 25.856(b) Appendix F, Part VII.
Steel cube box simulates intact fuselage and serves as enclosure to collectemitted gases.
Additional analyzers measured the concentration of carbon monoxide,carbon dioxide, oxygen, and total hydrocarbons (THC) as propane.
Lab-Scale Apparatus for Evaluating Toxic Gas Decomposition Products
FTIR and THC Sampling System Used in Lab-Scale Testing
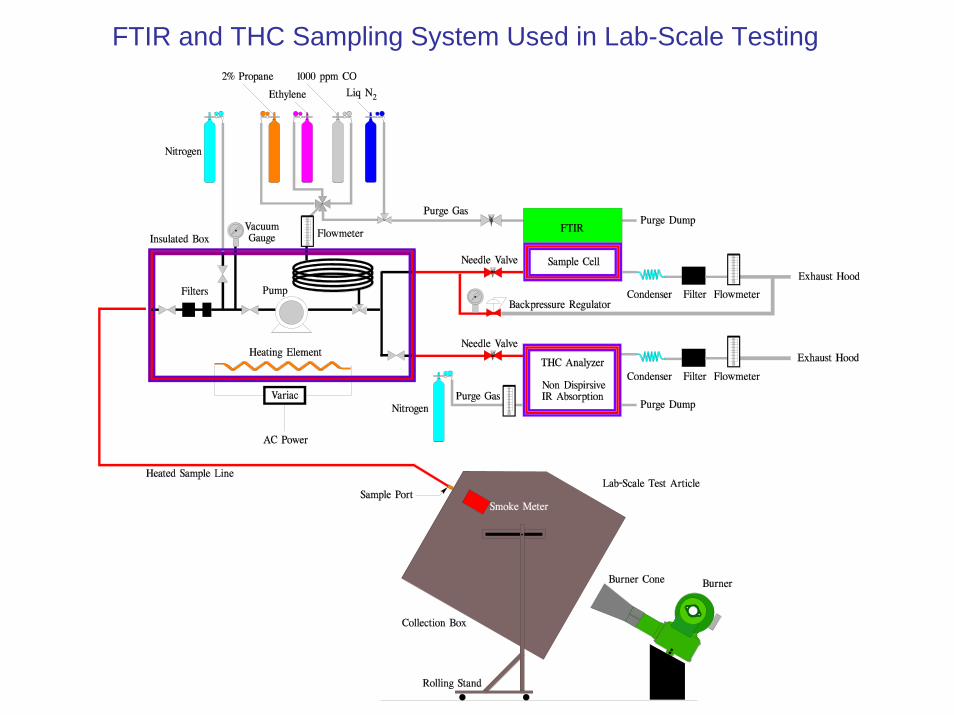
Gases Measured By FTIR
Flammable Gases
C2H2 Acetylene
C2H4 Ethylene
C2H6 Ethane
C3H8 Propane
C6H5NH2 Aniline
C6H5OH Phenol
C6H6 Benzene
CH2CHCHO Acrolein
CH4 Methane
Other Gases
CO2 Carbon Dioxide
H2O Water
N2O Nitrous Oxide
Sulfur DioxideSO2
Nitrogen DioxideNO2
Nitrogen OxideNO
AmmoniaNH3
Hydrofluoric AcidHF
Hydrogen CyanideHCN
Hydrogen ChlorideHCL
Hydrogen BromideHBr
Carbonyl SulfideCOS
Carbonyl FluorideCOF2
PhosgeneCOCl2
Carbon DioxideCO2
Carbon MonoxideCO
MethaneCH4
AcroleinCH2CHCHO
BenzeneC6H6
PhenolC6H5OH
AnilineC6H5NH2
Toxic Gases

Material Systems Tested in Lab-Scale Apparatus
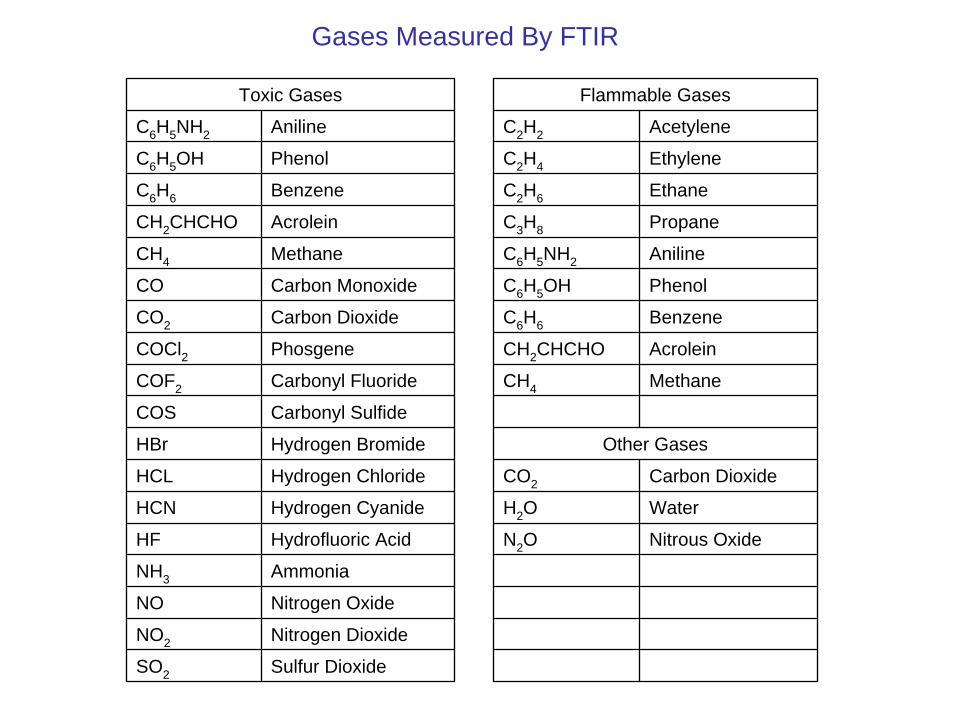
051213 Box Test 5-- PAN/ Metalized PVF
0
50
100
150
200
250
300
350
400
450
500
0 60 120 180 240 300
Time (seconds)
Oth
er G
ases
(pp
m)
0
5,000
10,000
15,000
20,000
25,000
CO
, CO
2 and H2O
(ppm)
C2H2 C2H4 C2H6 C3H8 C6H5NH2 C6H5OH C6H6 CH2CHCHO CH4 COCl2 COF2 COS HBr HClHCN HF N20 NH3 NO NO2 SO2 CO CO2 water
PAN Insulation Test Using FTIR Analysis

051213 Box Test 5- PAN/Metalized PVF
0
1
2
3
0 60 120 180 240 300Time (seconds)
CO
, CO
2 an
d O
2 D
eple
tion
(Per
cent
)
0
0.02
0.04
0.06
0.08
0.1
0.12
Total Hydrocarbons as Propane
(Percent)
CO CO2 O2 depletion THC as Propane
PAN Insulation Test Using Gas Analyzers

051212 Box Test 2-- FG/Ceramic Barrier/Metalized PVF
0
50
100
150
200
250
300
350
400
450
500
0 60 120 180 240 300Time (seconds)
Oth
er G
ases
(pp
m)
0
5,000
10,000
15,000
20,000
25,000
CO
, CO
2 and H2O
(ppm)
C2H2 C2H4 C2H6 C3H8 C6H5NH2 C6H5OH C6H6 CH2CHCHO CH4 COCl2 COF2 COS HBr HClHCN HF N20 NH3 NO NO2 SO2 CO CO2 water
FG/Ceramic Barrier Insulation Test Using FTIR Analysis

051208 ACM-- Box Test 1
0
10
20
30
40
50
60
70
80
0 60 120 180 240 300T ime (seconds)
Oth
er G
ases
(pp
m)
0
500
1000
1500
2000
2500
3000
3500
4000
H2O
and CO
2 (ppm)
C 2H 2 C 2H 4 C 2H 6 C 3H 8 C 6H 5NH 2 C 6H 5OH C 6H 6 C H 2C H C H O C H 4 C O C OC l2 C OF2 C OS H B r H C lH C N H F N 20 N H 3 N O N O2 SO2 C O2 w ater
Structural Composite Material Test Using FTIR Analysis

Comparison of Box Test Results at 5 Minutes
0
5,000
10,000
15,000
20,000
25,000
CO CO2 H20 THC as Propane
Gas
Yie
lds
(ppm
)
PAN/Metallized PVFFG/Ceramic Barrier/Metallized PVFStructural Composite

Comparison of Box Test Results at 5 Minutes
0
50
100
150
200
250
300
350
400
450
500
C6H5N
H2 C6H
5OH
C6H6
CH2CHCHO COCl2 COF2
COS HBr HClHCN
HF N20
NH3
NO NO2 SO2
Gas
Yie
lds
(ppm
)
PAN/Metallized PVFFG/Ceramic Barrier/Metallized PVFStructural Composite
Development of a Laboratory-Scale Test for Evaluating the Decomposition Products Generated Inside an Intact Fuselage During a Simulated Postcrash Fuel Fire Timothy R. Marker Louise C. Speitel April 2007 DOT/FAA/AR-TN07/15 This document is available to the public through the National Technical Information Services (NTIS), Springfield, Virginia 22161
U.S. Department of Transportation Federal Aviation Administration te
tec
hnic
al n
ote
tech
nica
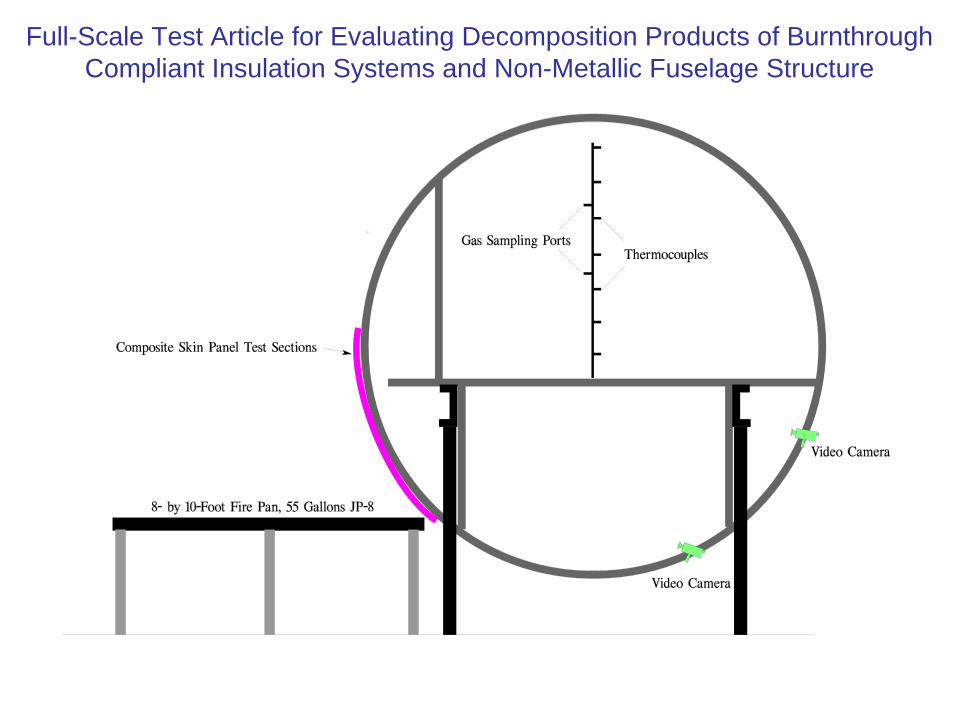
Full-Scale Test Article for Evaluating Decomposition Products of BurnthroughCompliant Insulation Systems and Non-Metallic Fuselage Structure

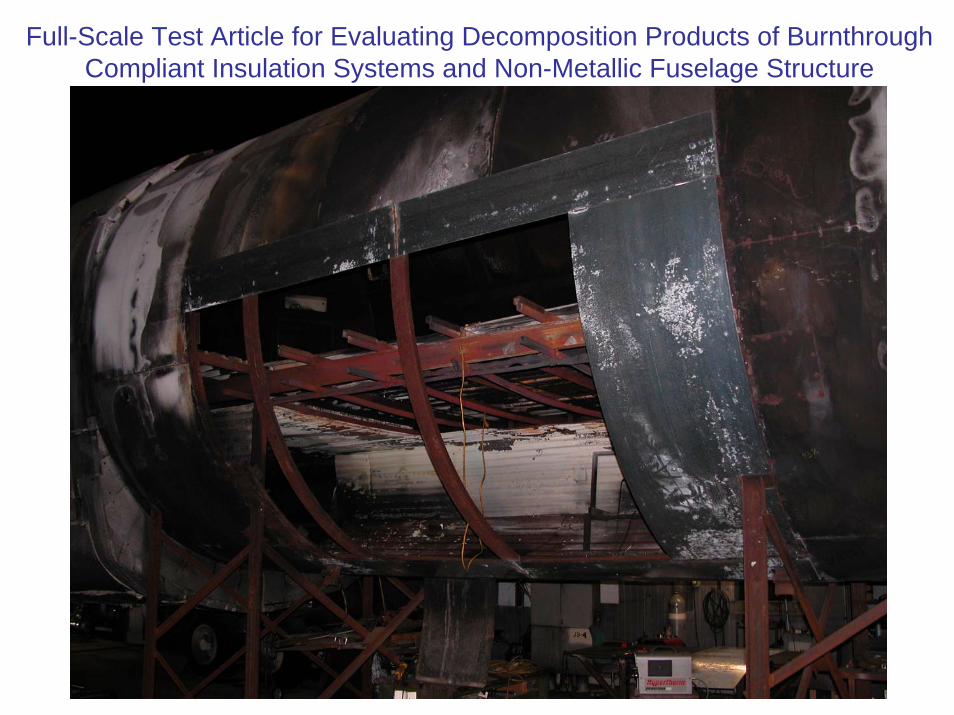
Full-Scale Test Article for Evaluating Decomposition Products of BurnthroughCompliant Insulation Systems and Non-Metallic Fuselage Structure
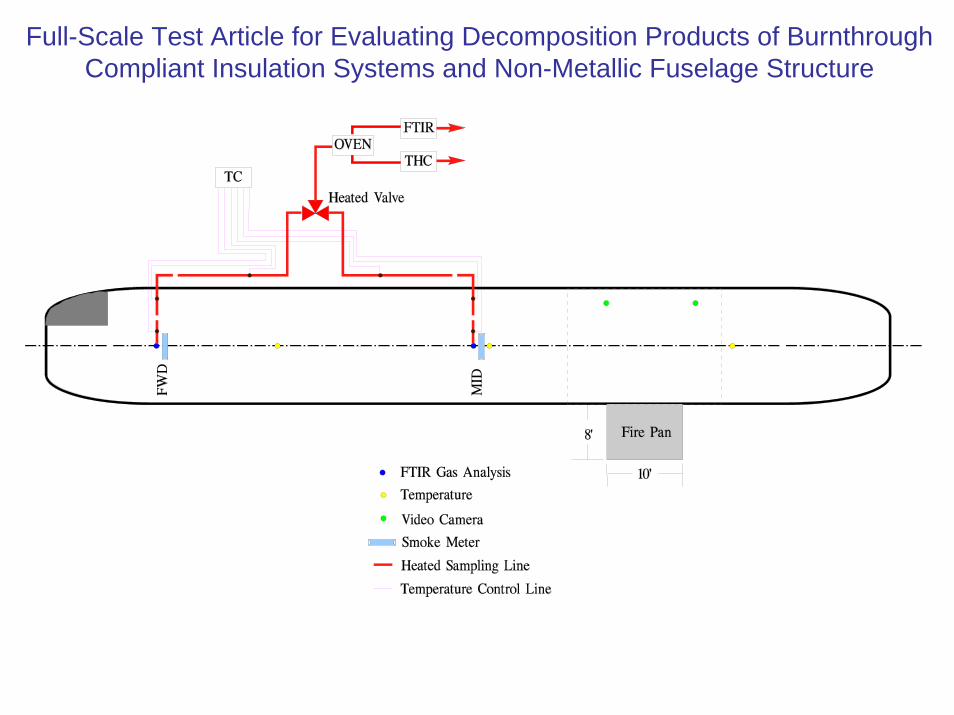
Full-Scale Test Article for Evaluating Decomposition Products of BurnthroughCompliant Insulation Systems and Non-Metallic Fuselage Structure
Full-Scale Test Article for Evaluating Decomposition Products of BurnthroughCompliant Insulation Systems and Non-Metallic Fuselage Structure

FTIR and THC Sampling System Used in Full-Scale Testing

Full-Scale Test ResultsPAN Insulation System

Full-Scale Test Results, PAN Insulation System

Full-Scale Test Results, PAN Insulation SystemPre-test

Full-Scale Test Results, PAN Insulation SystemPost-test

Full-Scale Test Results, PAN Insulation SystemPost-test
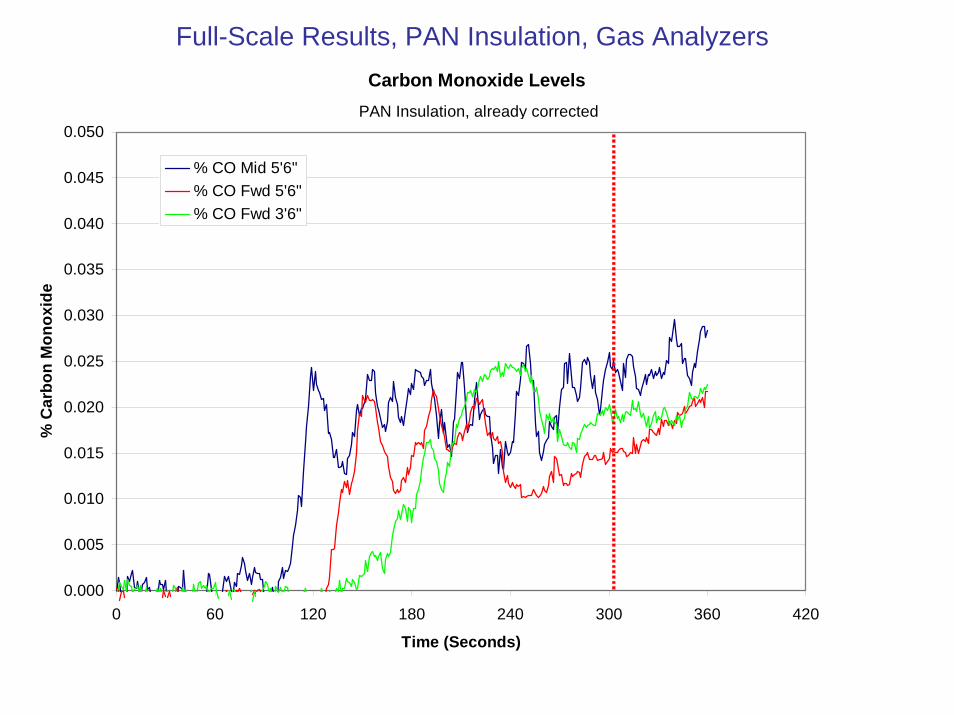
Full-Scale Results, PAN Insulation, Gas AnalyzersCarbon Monoxide Levels
0.000
0.005
0.010
0.015
0.020
0.025
0.030
0.035
0.040
0.045
0.050
0 60 120 180 240 300 360 420
Time (Seconds)
% C
arbo
n M
onox
ide
% CO Mid 5'6"% CO Fwd 5'6"% CO Fwd 3'6"
PAN Insulation, already corrected

Carbon Dioxide Levels
0.00
0.05
0.10
0.15
0.20
0.25
0.30
0.35
0.40
0.45
0.50
0 60 120 180 240 300 360 420
Time (Seconds)
% C
arbo
n D
ioxi
de
% CO2 Mid 5'6"% CO2 Fwd 3'6"
PAN Insulation, already corrected
Full-Scale Results, PAN Insulation, Gas Analyzers

Full-Scale Test PAN Metallized PVF (10/25/2007)Mid Station at 5' 6"
0
5
10
15
20
25
30
35
40
45
50
55
60
65
70
0 60 120 180 240 300 360
Time (Seconds)
Oth
er G
ases
(ppm
)
0
200
400
600
800
1000
1200
1400
1600
1800
2000
2200
CO
, CO
2 , and H2 O
(ppm)
C2H2 C2H4 C2H6 C3H8 C6H5NH2 C6H5OH C6H6 CH2CHCHO CH4 COCl2 COF2 COS HBR HCL HCN HF N20 NH3 NO NO2 SO2 CO CO2 water
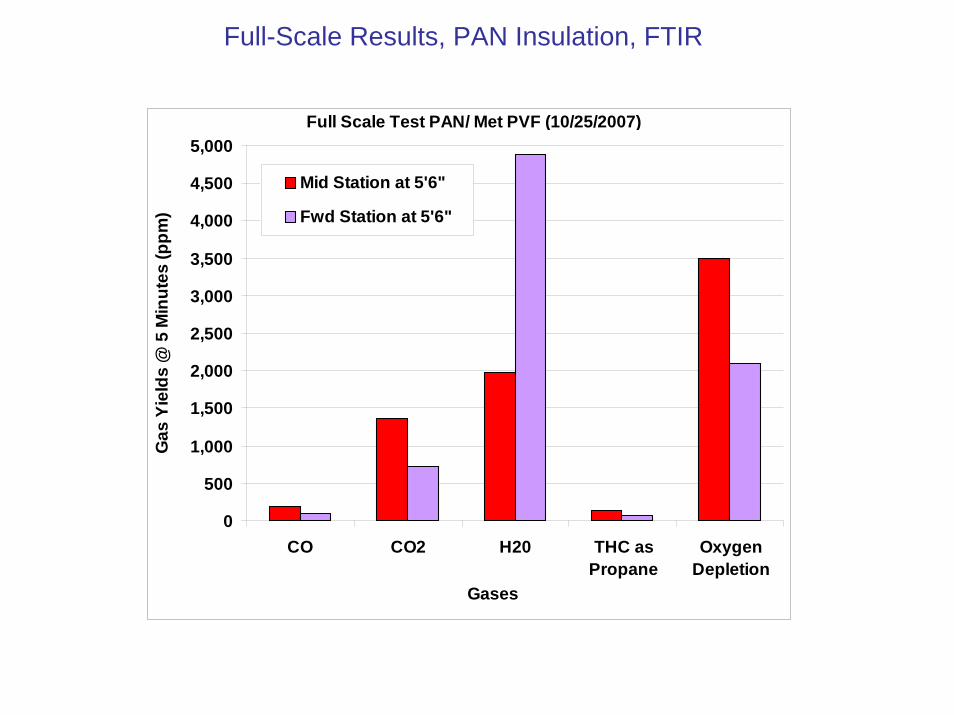
Full-Scale Results, PAN Insulation, FTIR
0
500
1,000
1,500
2,000
2,500
3,000
3,500
4,000
4,500
5,000
CO CO2 H20 THC asPropane
OxygenDepletion
Gases
Gas
Yie
lds
@ 5
Min
utes
(ppm
)Mid Station at 5'6"
Fwd Station at 5'6"
Full Scale Test PAN/ Met PVF (10/25/2007)
Full-Scale Results, PAN Insulation, FTIR

Full Scale Test PAN/Met PVF (10/25/2007)Comparision of FTIR and Gas Analyzer Results at 300 Seconds
Mid Station at 5'6"
0
200
400
600
800
1000
1200
1400
1600
1800
2000
CO CO2 THC as Propane
Gases
Gas
Yie
lds
(ppm
)
FTIR Gas Analysers
Full-Scale Results, PAN Insulation, Comparison

Full-Scale Test ResultsCeramic Barrier Insulation System
(Modified Configuration)
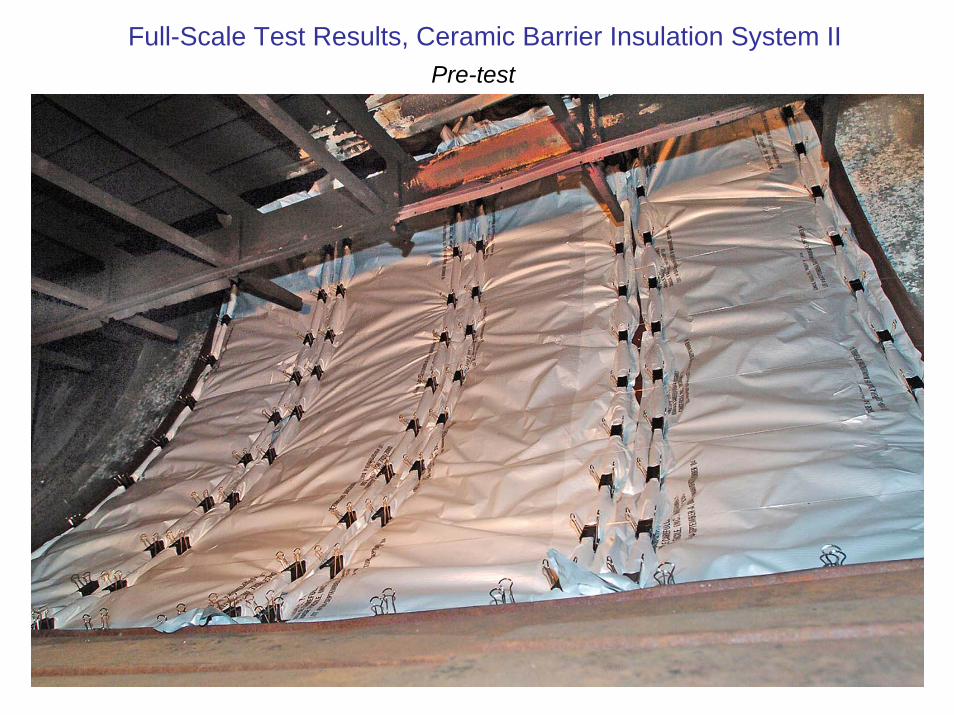
Full-Scale Test Results, Ceramic Barrier Insulation System IIPre-test

Full-Scale Test Results, Ceramic Barrier Insulation System II

Full-Scale Test Results, Ceramic Barrier Insulation System IIPost-test

Full-Scale Test Results, Ceramic Barrier Insulation System IIPost-test

Full-Scale Test Results, Ceramic Barrier Insulation System IIPost-test

Full-Scale Test Results, Ceramic Barrier Insulation System IIPost-test
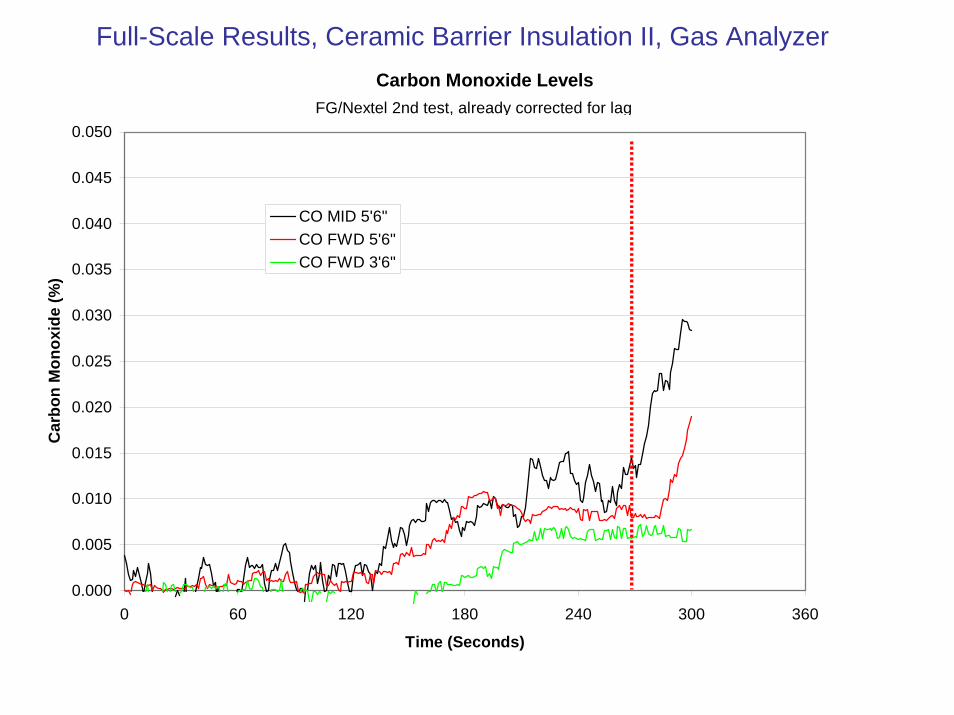
Full-Scale Results, Ceramic Barrier Insulation II, Gas Analyzer Carbon Monoxide Levels
0.000
0.005
0.010
0.015
0.020
0.025
0.030
0.035
0.040
0.045
0.050
0 60 120 180 240 300 360
Time (Seconds)
Car
bon
Mon
oxid
e (%
)
CO MID 5'6"CO FWD 5'6"CO FWD 3'6"
FG/Nextel 2nd test, already corrected for lag
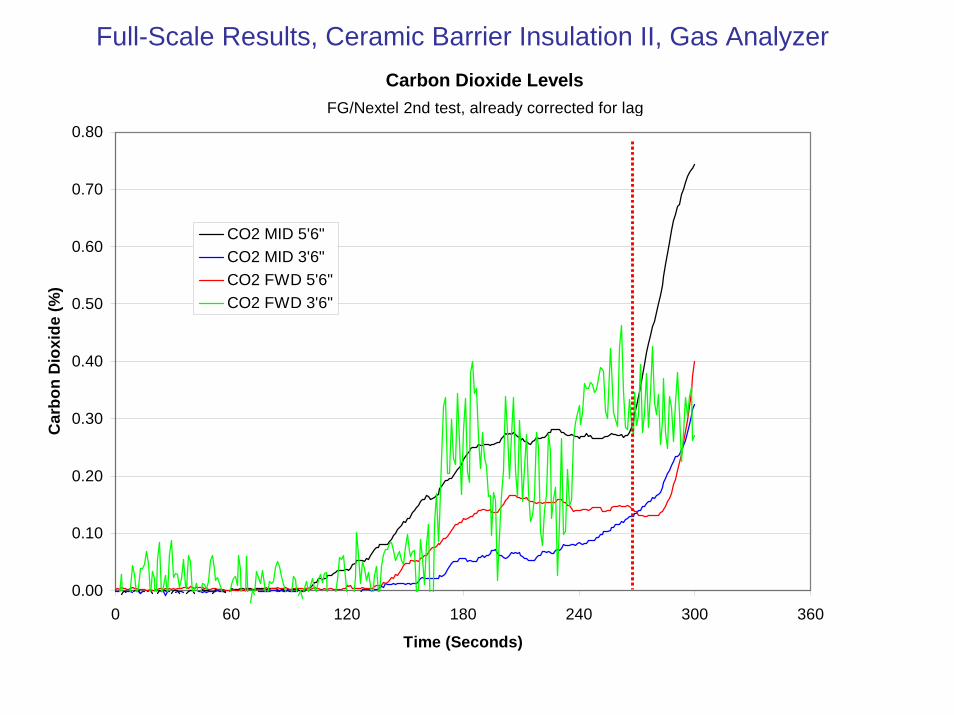
Carbon Dioxide Levels
0.00
0.10
0.20
0.30
0.40
0.50
0.60
0.70
0.80
0 60 120 180 240 300 360
Time (Seconds)
Car
bon
Dio
xide
(%)
CO2 MID 5'6"CO2 MID 3'6"CO2 FWD 5'6"CO2 FWD 3'6"
FG/Nextel 2nd test, already corrected for lag
Full-Scale Results, Ceramic Barrier Insulation II, Gas Analyzer
0
1,000
2,000
3,000
4,000
5,000
6,000
7,000
CO CO2 H20 THC asPropane
OxygenDepletion
Gases
Gas
Yie
lds
@ 2
60 S
econ
ds (p
pm)
Mid Station at 5'6"
Fwd Station at 5'6"
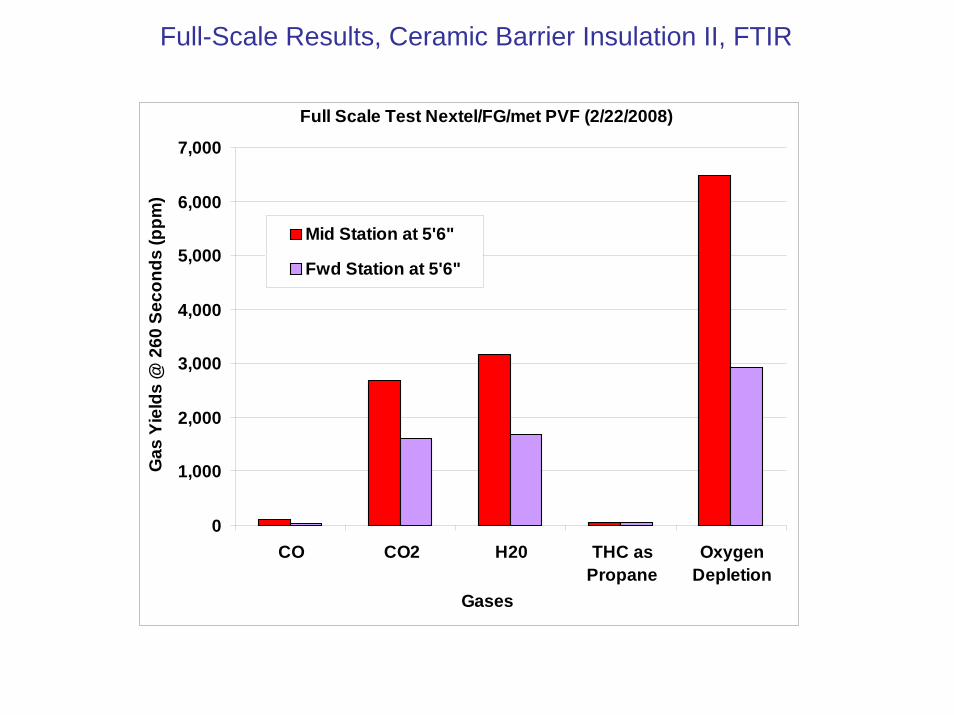
Full Scale Test Nextel/FG/met PVF (2/22/2008)
Full-Scale Results, Ceramic Barrier Insulation II, FTIR

Full Scale Test Nextel/FG/Met PVF (2/22/2008)Comparision of FTIR and Gas Analyzer Results at 260 Seconds
Mid Station at 5'6"
0
500
1000
1500
2000
2500
3000
CO CO2 THC as Propane
Gases
Gas
Yie
lds
(ppm
)
FTIR Gas Analysers
Full-Scale Results, Ceramic Barrier Insulation II, Comparison

Full-Scale Test ResultsStructural Composite System

Full-Scale Test Results, Structural Composite SystemPre-test
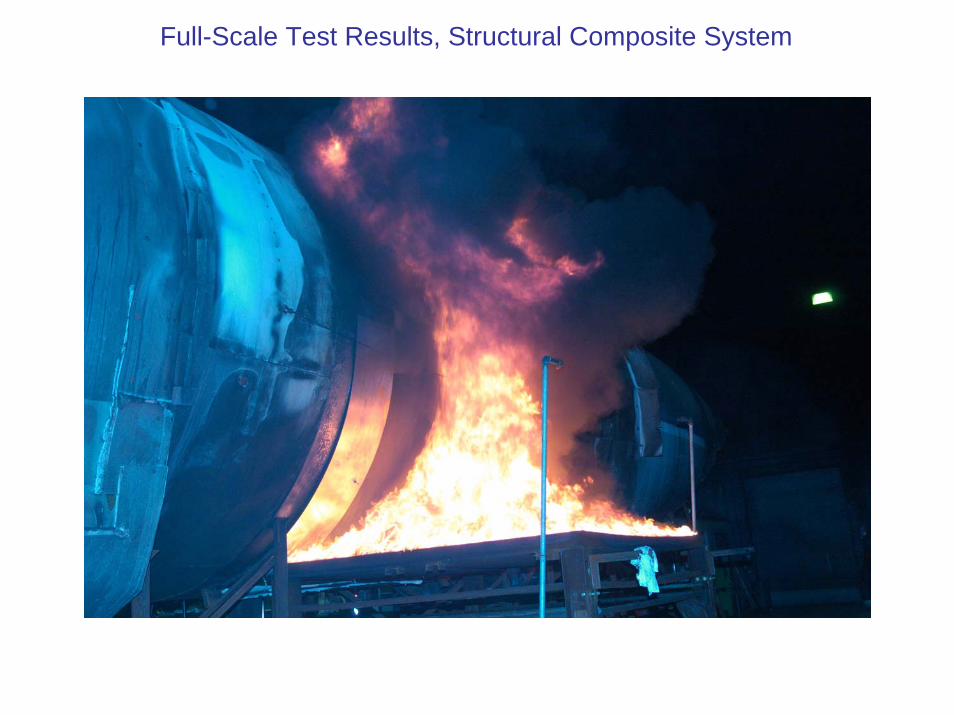
Full-Scale Test Results, Structural Composite System

Full-Scale Test Results, Structural Composite SystemPost-test
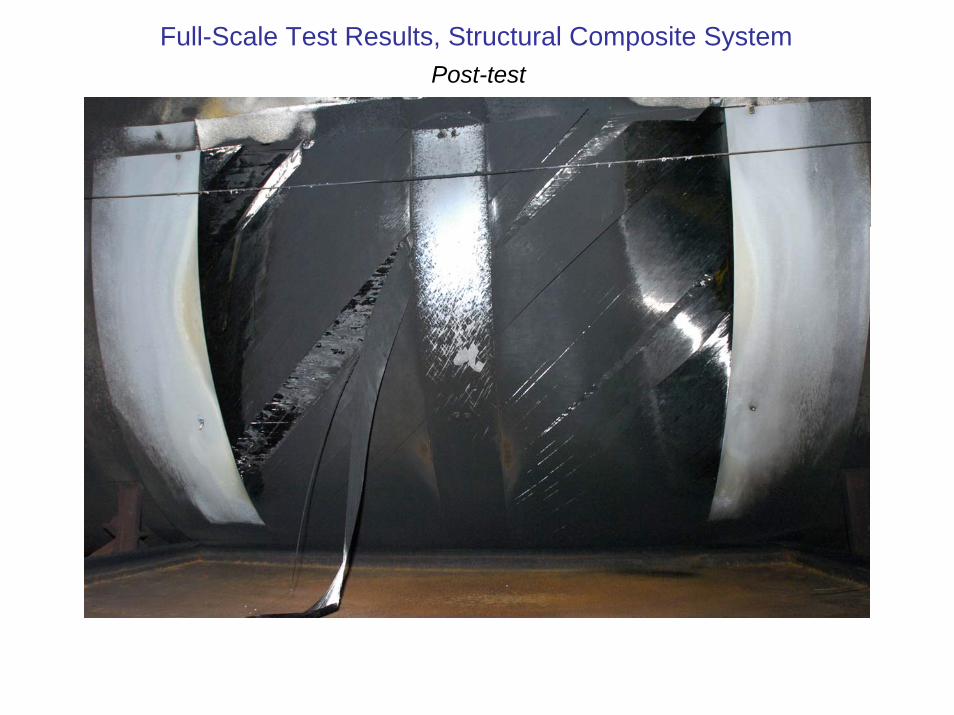
Full-Scale Test Results, Structural Composite SystemPost-test

Full-Scale Test Results, Structural Composite SystemPost-test

Full-Scale Results, Structural Composite, Gas AnalyzerCarbon Monoxide
0.000
0.002
0.004
0.006
0.008
0.010
0.012
0.014
0.016
0.018
0.020
0 60 120 180 240 300 360 420 480
Time (Seconds)
Car
bon
Mon
oxid
e (%
)
CO Mid 5'6"CO FWD 5'6"CO FWD 3'6"
Carbon/Epoxy, already corrected for lag

Carbon Dioxide Levels
0.000
0.005
0.010
0.015
0.020
0.025
0.030
0.035
0.040
0.045
0.050
0 60 120 180 240 300 360 420 480
Time (Seconds)
Car
bon
Dio
xide
(%)
CO2 Mid 5'6"CO2 FWD 3'6"
Carbon/Epoxy, already corrected for lag
Full-Scale Results, Structural Composite, Gas Analyzer

Full Scale Test Structural Composite (11/28/2007)Mid Station at 5'6"
0
5
10
15
20
0 60 120 180 240 300 360 420Time ( Seconds)
Oth
er G
ases
(ppm
)
0
500
1000
1500
2000
2500
3000
3500
4000
CO
2 and H20 (ppm
)
C2H2 C2H4 C2H6 C3H8 C6H5NH2 C6H5OH C6H6 CH2CHCHO CH4 CO COCl2 COF2 COS HBR HCL HCN HF N20 NH3 NO NO2 SO2 CO2 water
Full-Scale Results, Structural Composite, FTIR

0
100
200
300
400
500
600
700
CO CO2 H20 THC asPropane
OxygenDepletion
Gases
Gas
Yie
lds
@ 5
Min
utes
(ppm
)Mid Station at 5'6"
Fwd Station at 5'6"
Full Scale Test Structural Composite (11/28/2007)
Full-Scale Results, Structural Composite, FTIR

Full Scale Test Structural Composite (11/28/2007)Comparision of FTIR and Gas Analyzer Results at 5 Minutes
Mid Station at 5'6"
0
20
40
60
80
100
120
140
160
CO CO2 THC as Propane
Gases
Gas
Yie
lds
(ppm
)FTIR Gas Analysers
Full-Scale Results, Structural Composite, Comparison
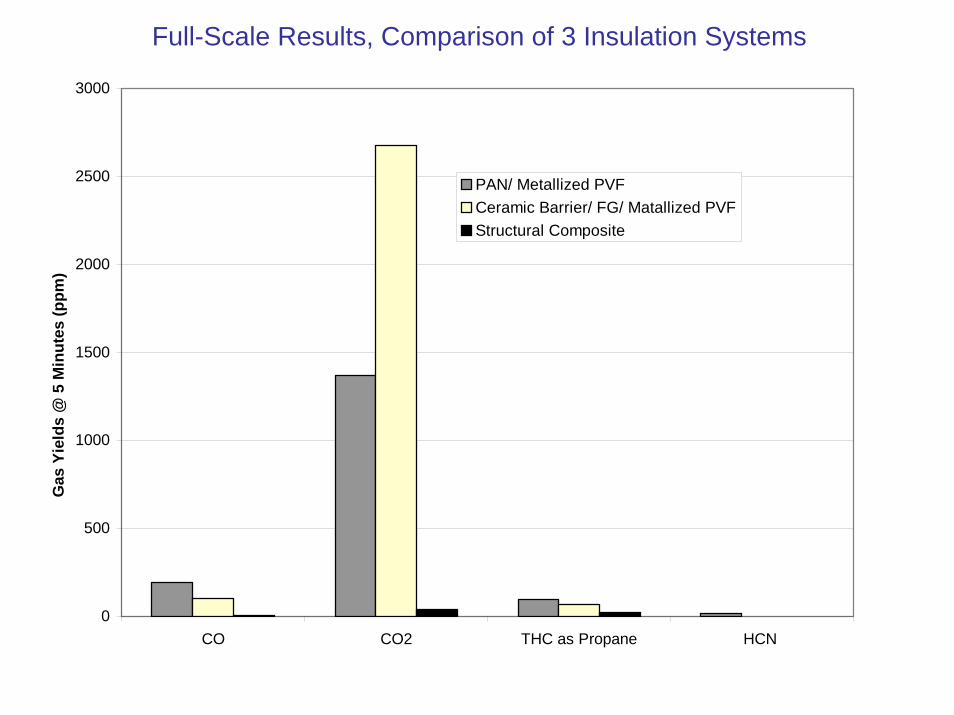
Full-Scale Results, Comparison of 3 Insulation Systems
0
500
1000
1500
2000
2500
3000
CO CO2 THC as Propane HCN
Gas
Yie
lds
@ 5
Min
utes
(ppm
)
PAN/ Metallized PVFCeramic Barrier/ FG/ Matallized PVFStructural Composite

Fractional Effective Dose ComparisonForward Station, 66" Height
0
0.1
0.2
0.3
0.4
0.5
0.6
0.7
0.8
0.9
1
0 60 120 180 240 300 360 420 480
Time (Seconds)
Frac
tiona
l Effe
ctiv
e D
ose
(%)
PAN FED Fwd 66"Ceramic Barrier FED Fwd 66"Composite Skin FED Fwd 66"

Fractional Effective Dose ComparisonMid Station, 66" Height
0
0.1
0.2
0.3
0.4
0.5
0.6
0.7
0.8
0.9
1
0 60 120 180 240 300 360 420 480
Time (Seconds)
Frac
tiona
l Effe
ctiv
e D
ose
(%)
PAN FED Mid 66"Ceramic Barrier FED Mid 66"Composite Skin FED Mid 66"

What do we do with all this data?
How does data compare to small scale results?

Determination of Full Scale Test Article Volume

Determination of Gas Concentration Scaling Factor
Ratio of VolumeBox to Burn AreaBox = 60.33 ft3 / 9.25 ft2 = 6.52
Ratio of VolumeFSTest to Burn AreaFSTest = 9258.1 ft3 / 64 ft2 = 144.7
Ratio of Full Scale to Lab Scale = 144.7 / 6.52 = 22.2
Theoretical Lab Scale Box Concentration is 22.2 Times Greater than Full Scale Concentration
Full-Scale Test Article has 22.2 Times More Volume per Burn Area than Lab Scale Box

Gas Concentration Scaling, PAN Insulation System
0
10
20
30
40
50
60
70
80
90
100
C6H5N
H2 C6H
5OH
C6H6
CH2CHCHO COCl2 COF2
COS HBr HClHCN
HF N20
NH3 NO NO2 SO2
COCO2H20
THC as Pro
pane
Oxygen
Dep
letion
Gases
Box
Tes
t Yie
lds/
Ful
l Sca
le Y
ield
sFire Side at 5'6"Forward at 5'6"
PAN/Met PVFScaling Divisors @ 5 Minutes

Gas Concentration Scaling, Ceramic Barrier Insulation System
05
1015202530354045505560657075808590
C6H5N
H2 C6H
5OH
C6H6
CH2CHCHO COCl2 COF2
COS HBr HClHCN
HF N20
NH3 NO NO2 SO2
COCO2H20
THC as Pro
pane
Oxygen
Dep
letion
Gases
Box
Tes
t Yie
lds/
Ful
l Sca
le Y
ield
s
Mid Station at 5'6"Fwd Station at 5'6"
Nextel/FG/met PVFScaling Divisors @ 260 Seconds

Gas Concentration Scaling, Structural Composite System
0
5
10
15
20
25
30
35
40
45
50
C6H5N
H2 C6H
5OH
C6H6
CH2CHCHO COCl2 COF2
COS HBr HClHCN
HF N20
NH3 NO NO2 SO2
COCO2H20
THC as Pro
pane
Oxygen
Dep
letion
Gases
Box
Tes
t Yie
lds/
Ful
l Sca
le Y
ield
s Mid Station at 5'6"Fwd Station at 5'6"
Structural CompositeScaling Divisors @ 5 Minutes
Gas Concentration Scaling, Findings
Analysis only considers volumetric aspects
Analysis assumes perfect mixing
Analysis does not consider surface area effects
Not all of gases scale similarly (example: COS)
Primary intoxicants (CO, HCN) scaled similarly

Development of Decomposition Products Limits forBurnthrough Compliant Insulation Systems
Difficult to use volumetric scaling as basis for setting limits in lab-scale test.
Since full-scale tests did not result in adverse conditions inside fuselage,
Take maximum (peak) values obtained in box test for each gas,
Add reasonable safety factor,
Establish acceptable decomposition limits in box test

Example: HCN
During full-scale tests, HCN did not reach toxic levels for any of three materials
HCN acceptable limit would be set at 500 ppm in box test.
If a burnthrough compliant material produced greater than 500 ppm HCNduring a box test, then a full-scale test would be necessary.
Development of Decomposition Products Limits forBurnthrough Compliant Insulation Systems
PAN material 470 ppm
FG/ceramic barrier 120 ppm
Composite skin 0 ppm
During lab-scale tests, HCN reached the following levels:

60 Minute Exposure
30 Minute Exposure
FED Effect
Mid Station at 5'6"
Fwd Station at 5'6"
Mid Station at 5'6"
Fwd Station at 5'6"
Mid Station at 5'6"
Fwd Station at 5'6"
Incap Conc LC50
Derived from 60
min ERPG3
Derived from 30
min IDLH
ERPG 3 (2007)
IDLH (1995)
FED Effect
NH2 4.63 3.27 5.5 3.27 1.73 0.29 Not Avail 600 ? 100 0.009 68.73 91.14 6.14 600 x 15.7 (IDLH) 9,420 0.010 C6H5NH2 14.8 16.6 3.5OH 7.02 4.59 9.57 5.01 9.4 4 Not Avail 2400 1500 200 250 0.004 52.22 38.95 9.78 2400 x 4.2 (ERPG) 10,080 0.005 C6H5OH 7.4 4.1 1.0
10.46 10.41 8.05 4.56 7.21 3.21 ? ? 12,000 3000 1000 500 0.001 76.60 52.5 8.3312,000 x 5.0
(ERPG) 60,000 0.001 C6H6 7.3 6.5 1.2
HCHO 0 0 0 0 0 0 10928 7783 18 12 1.5 2 0.000 55.50 146.04 0 7783 x 4 (LC50) 31,132 0.005 CH2CHCHO #DIV/0! #DIV/0! ND2 0 0 0 0 0 0 ? 102 d 12 12 1 2 0.000 0.00 3.9 0 102 x 4 (LC50) 408 0.010 COCl2 ND #DIV/0! ND
0 0.21 0 0 0 0 ? ? 300 25 (est) ? 0.001 0.00 0 0.43 300 x 4 (ERPG3) 1,200 0.000 COF2 ND ND #DIV/0!
0 0.61 0 0 0.53 0.34
500* (500 for 15min-
brain damage)
(1000 for 15
minutes)1200 (H2S) 100 (H2S) ? 0.001 38.66 0 0.84 500 x 4 2,000 0.019 COS >40 ND 1.6 Yes 5
0 0 0 0 0 0 16830 15900 1800 180 150 (est) 30 0.000 0.00 0 0 15900 x 4 (LC50) 63,600 0.000 HBr ND ND ND0 0 0 0 0.49 0.29 16830 15900 1800 300 150 50 0.000 0.00 0 3.43 15900 x 4 (LC50) 63,600 0.000 HCl ND ND 7.0
16.4 10.75 0 0 0 0 176 560 300 300 25 50 0.093 467.00 111.74 0 176 x 20 (Incap) 3,520 0.133 HCN 28.5 #DIV/0! ND Yes 6peak) 22.7 26.9 176 560 300 300 25 50 0.153 467.00 111.74 0 176 x 20 (Incap) 3,520 0.133 HCN 20.6 Yes
0 0 0 0 0 0 7663 7227 600 180 50 30 0.000 14.46 19.3 0 7227 x 4 (LC50) 28,908 0.001 HF #DIV/0! #DIV/0! ND3.95 9.94 7.81 3.72 2.99 1 ? ? ? ? 18.75 62.56 0 No Limit N20 4.7 8.0 ND
5.55 4.32 4.5 1.82 1.36 1 ? ? 9000 1800 750 300 0.003 367.20 289.19 3.3 9000 x 65.3 (ERPG) 587,700 0.001 NH3 66.2 64.3 2.40 0 0 0 0 0 12850 4260 1800 600 150 100 0.000 0.00 0 0 4260 x 4 (LC50) 17,040 0.000 NO ND ND ND
2.02 1.19 13.13 6.19 0 0 2570 852 360 120 30 20 0.007 0.00 0 0 852 x 4 3,408 0.000 NO2 ND ND ND19.81 2.06 2.04 1.33 2.82 2.56 ? 2115 180 600 15 100 0.009 246.57 0 31.17 2115 x 11.8 24,957 0.010 SO2 12.4 ND 11.1
peak) 55.4 65.5 ? 2115 180 600 15 100 0.031 246.57 0 31.17 2115 x 4.5 9,518 0.026 SO2 4.5 Yes 3
190.9 104.8 99.18 44.49 7.7 4.2 6850 16600 6000 7200 500 1200 0.028 4645.76 2116.23 55.3216600 x 17.6
(ERPG3) 292,160 0.016 CO 24.3 21.3 7.2 Yes 6,51367.6 730.3 2674.66 1608 42 30 88000 40000 0.030 11506.60 12657 96.7 88,000 x 6.6 580,800 0.022 CO2 8.4 4.7 2.3 Yes c 17,71973.9 4885 3160.63 1684 627 276 10164.77 19430 1808.29 No Limit N/A H2O 5.1 6.1 2.9
s ne 97.9 72.2 68.17 55.21 22 20.8 0.005 629.71 903.5 22.0 21,000 x 6.9 144,900 0.006
THC as Propane 6.4 13.3 1.0
en tion 3500 2100 6470 2920 150 0 136000 3000.00 1120 Remove
Oxygen Depletion 0.9 7.5
Gases to Measure FED > .02
Acceptable Lab-Scale Tox Limit
(ppm)PAN/Met PVF
FG/ Ceramic Barrier/Met PVF (260 Sec)
Structural Composite
Scaling Factor Mid Station at 5'6"
FG/Ceramic
Barrier/Met PVF
Yields 5
utes test
PAN/Met PVF
FG/Ceramic Barrier/Met PVF
(260 Sec)Structural Composite
Max AlloweConc. (ppm ) Max BoTest Conc x1.4
Full-Scale Test Data Lab-Scale Data
Structural Composit
e
5 Minute Exposure
PAN/Met PVF
Allowable Exposure from Various References
Acceptable Lab-Scale Tox Limit= 5
Min Exp Limit x Scaling Factor
(ppm)