Embed Size (px)
Citation preview
ZAMBIA
Millennium Development GoalsProgress Report 2003
ZAMBIA
Millennium Development GoalsProgress Report 2003
All rights reserved. No part of this publication may be reproduced, stored in a retrieval system or transmitted in any form or by any means, electronic, mechanical photocopying recording or otherwise, without prior permission of the Government of the Republic of Zambia and the United Nations System in Zambia
Zambia Millennium Development Goals Report 2003
Foreword
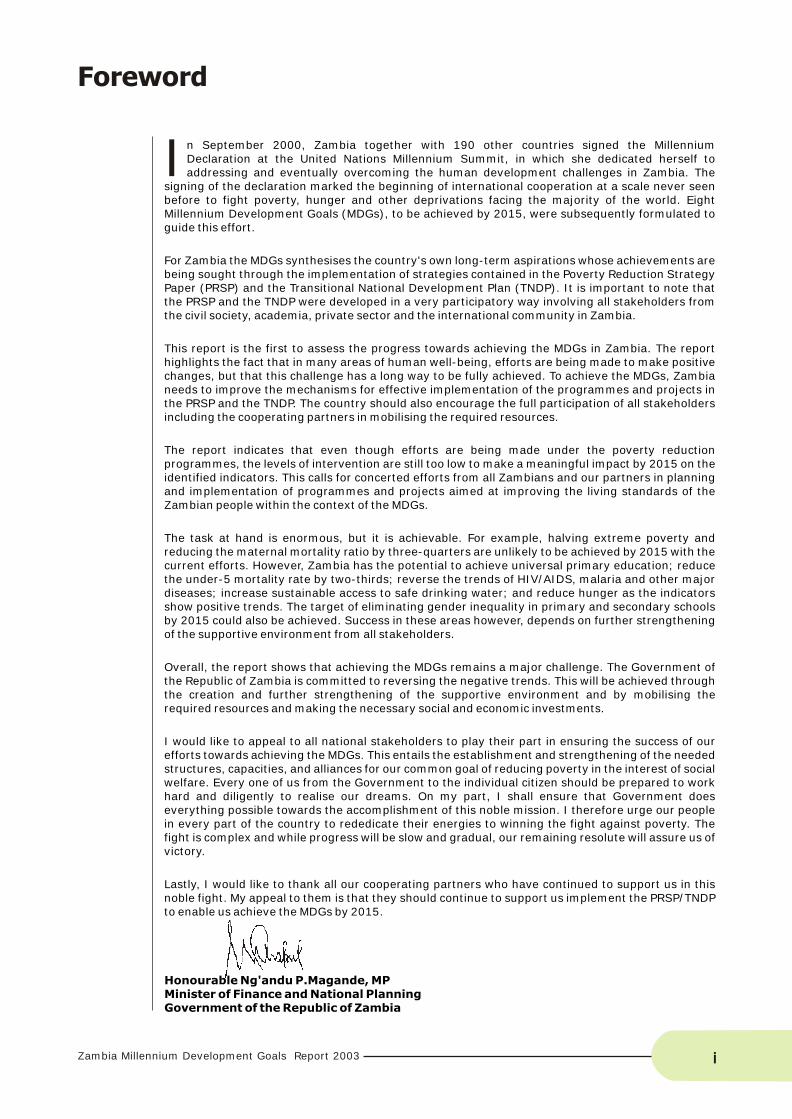
In September 2000, Zambia together with 190 other countries signed the Millennium Declaration at the United Nations Millennium Summit, in which she dedicated herself to addressing and eventually overcoming the human development challenges in Zambia. The
signing of the declaration marked the beginning of international cooperation at a scale never seen before to fight poverty, hunger and other deprivations facing the majority of the world. Eight Millennium Development Goals (MDGs), to be achieved by 2015, were subsequently formulated to guide this effort.
For Zambia the MDGs synthesises the country's own long-term aspirations whose achievements are being sought through the implementation of strategies contained in the Poverty Reduction Strategy Paper (PRSP) and the Transitional National Development Plan (TNDP). It is important to note that the PRSP and the TNDP were developed in a very participatory way involving all stakeholders from the civil society, academia, private sector and the international community in Zambia.
This report is the first to assess the progress towards achieving the MDGs in Zambia. The report highlights the fact that in many areas of human well-being, efforts are being made to make positive changes, but that this challenge has a long way to be fully achieved. To achieve the MDGs, Zambia needs to improve the mechanisms for effective implementation of the programmes and projects in the PRSP and the TNDP. The country should also encourage the full participation of all stakeholders including the cooperating partners in mobilising the required resources.
The report indicates that even though efforts are being made under the poverty reduction programmes, the levels of intervention are still too low to make a meaningful impact by 2015 on the identified indicators. This calls for concerted efforts from all Zambians and our partners in planning and implementation of programmes and projects aimed at improving the living standards of the Zambian people within the context of the MDGs.
The task at hand is enormous, but it is achievable. For example, halving extreme poverty and reducing the maternal mortality ratio by three-quarters are unlikely to be achieved by 2015 with the current efforts. However, Zambia has the potential to achieve universal primary education; reduce the under-5 mortality rate by two-thirds; reverse the trends of HIV/AIDS, malaria and other major diseases; increase sustainable access to safe drinking water; and reduce hunger as the indicators show positive trends. The target of eliminating gender inequality in primary and secondary schools by 2015 could also be achieved. Success in these areas however, depends on further strengthening of the supportive environment from all stakeholders.
Overall, the report shows that achieving the MDGs remains a major challenge. The Government of the Republic of Zambia is committed to reversing the negative trends. This will be achieved through the creation and further strengthening of the supportive environment and by mobilising the required resources and making the necessary social and economic investments.
I would like to appeal to all national stakeholders to play their part in ensuring the success of our efforts towards achieving the MDGs. This entails the establishment and strengthening of the needed structures, capacities, and alliances for our common goal of reducing poverty in the interest of social welfare. Every one of us from the Government to the individual citizen should be prepared to work hard and diligently to realise our dreams. On my part, I shall ensure that Government does everything possible towards the accomplishment of this noble mission. I therefore urge our people in every part of the country to rededicate their energies to winning the fight against poverty. The fight is complex and while progress will be slow and gradual, our remaining resolute will assure us of victory.
Lastly, I would like to thank all our cooperating partners who have continued to support us in this noble fight. My appeal to them is that they should continue to support us implement the PRSP/TNDP to enable us achieve the MDGs by 2015.
Honourable Ng'andu P.Magande, MPMinister of Finance and National PlanningGovernment of the Republic of Zambia
i
Preface
he MDGs Report is an important tool in setting a platform for dialogue in Zambia on the critical issues of human development. It provides a chance for another look at the current human development challenges and discuss the T
responses that can be taken by Government and complemented by her cooperating partners to overcome the challenges. The United Nations system hopes that this dialogue will move beyond debate to the formulation of concrete actions that will help Zambia take significant steps in achieving the Millennium Development Goals.
This report is written through a collaborative alliance between Government, Civil Society Organisations under the umbrella of the Civil Society for Poverty Reduction (CSPR), academia, political leaders and the UN Country Team (UNCT). A National MDG Task Force comprising the Ministry of Finance and National Planning, Cabinet Office, CSPR and UNCT was tasked to consult all stakeholders and produce the report that can be nationally owned because it speaks for everyone.
The exercise generated a momentum that drove the activities and stimulated the active participation of all the stakeholders. The UN Country Team will strive to ensure that this momentum is sustained to carry through the next important steps of the MDGs campaign, which involves further sensitisation, localising the MDGs and costing them.
On behalf of the UNCT, I wish to acknowledge Government's leadership of the Task Force through the Ministry of Finance and National Planning that galvanised the active participation of all the relevant Ministries and institutions. In this regard, I wish to thank Mr. Richard Chizyuka, Permanent Secretary and Mr. James Mulungushi Director of Planning and their team for this leadership. I also wish to thank all Civil Society Organisations that participated through the Civil Society for Poverty Reduction as well as the Economic Association of Zambia for facilitating the activities. Also acknowledged is the active participation of Senior Chieftainesses Chiyawa and Nkomeshe and Senior Chief Nalubamba.
Aeneas C. ChumaResident CoordinatorUnited Nations System in Zambia
Zambia Millennium Development Goals Report 2003ii

Table of Contents
List of Figures
List of of Appendix Tables
Foreword ....................................................................................................................................i
Preface.......................................................................................................................................ii
List of acronyms..........................................................................................................................iv
Status at a Glance........................................................................................................................v
Introduction.................................................................................................................................1
Zambia: Development Context.......................................................................................................2
Goal 1: Eradicate Extreme Poverty and Hunger.................................................................................3
Goal 2: Achieve Universal Primary Education....................................................................................6
Goal 3: Promote Gender Equality and Empower Women.....................................................................8
Goal 4: Reduce Child Mortality......................................................................................................10
Goal 5: Improve Maternal Health..................................................................................................12
Goal 6: Combat HIV/AIDS, Malaria and other Diseases....................................................................14
Goal 7: Ensure Environmental Sustainability...................................................................................18
Goal 8: Develop a Global Partnership forDevelopment.....................................................................22
List of Tables - Status in Figures
Table 1: Proportion of People Living in Extreme Poverty.....................................................................3
Table 2: Proportion of People who Suffer from Hunger.......................................................................5
Table 3: Universal Primary Education..............................................................................................7
Table 4: Gender Equality and Empowerment of Women.....................................................................9
Table 5: Child Mortality................................................................................................................11
Table 6: Maternal Health.............................................................................................................13
Table 7: HIV/AIDS......................................................................................................................15
Table 8: Malaria Cases................................................................................................................17
Table 9: Environmental Sustainability............................................................................................19
Table 10: Access to Safe Drinking water and Basic Sanitation..........................................................21
Table 11: ODA Indicators for Zambia.............................................................................................22
Figure 1: Real GDP Growth............................................................................................................2
Figure 2: Proportion of People Living in Extreme Poverty....................................................................3
Figure 3: Underweight- Under Five Children.....................................................................................4
Figure 4: Net Enrolment Ratio in Primary Education..........................................................................7
Figure 5: Gender Equality in Primary and Secondary Schools..............................................................8
Figure 6: Under-Five Mortality Ratio..............................................................................................11
Figure 7: Maternal Mortality..........................................................................................................12
Figure 8: ESS Trends of HIV Infection among Ante Natal Clinic Attendees..........................................14
Figure 9: New Cases of Malaria Per 1,000......................................................................................16
Figure 10: Percentage of Housholds with Access to Safe Drinking water..............................................20
Figure 11: Debt Service as a Percentage of Exports.........................................................................23
Appendix Table I: key Socio - Economic Indicators..........................................................................24
Appendix Table II: Data Sources...................................................................................................25
Zambia Millennium Development Goals Report 2003 iii
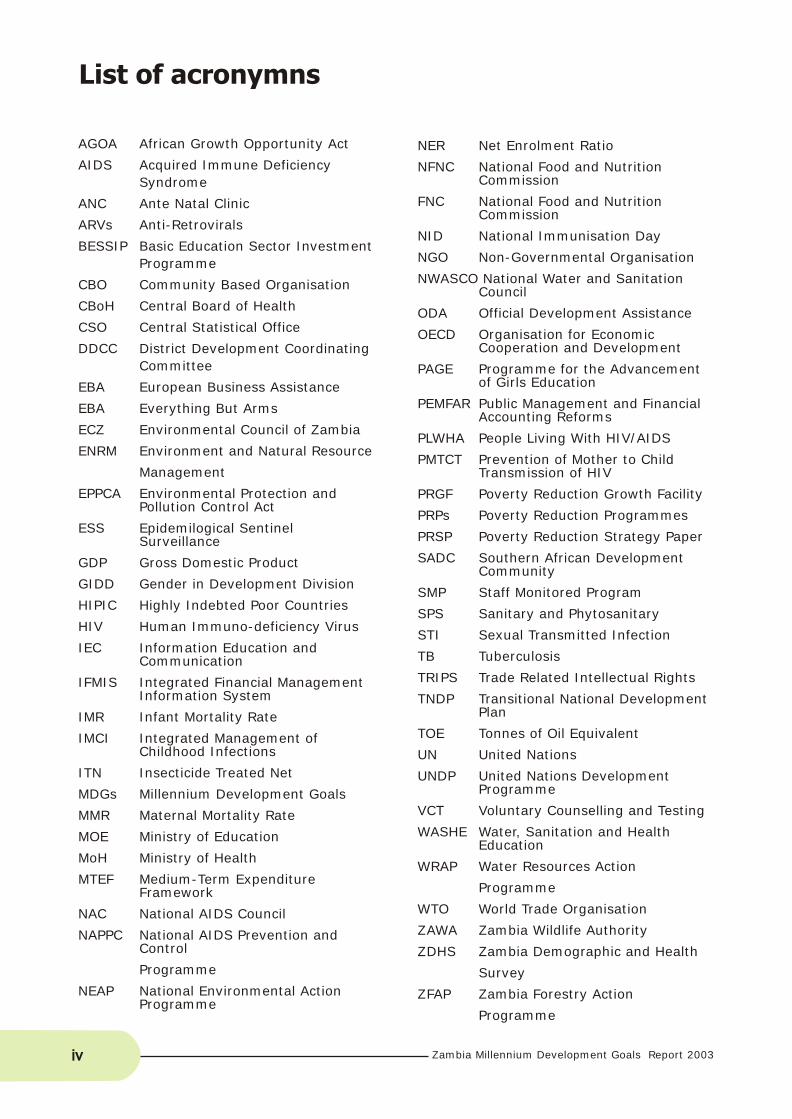
List of acronymns
AGOA African Growth Opportunity Act
AIDS Acquired Immune Deficiency
Syndrome
ANC Ante Natal Clinic
ARVs Anti-Retrovirals
BESSIP Basic Education Sector Investment
Programme
CBO Community Based Organisation
CBoH Central Board of Health
CSO Central Statistical Office
DDCC District Development Coordinating
Committee
EBA European Business Assistance
EBA Everything But Arms
ECZ Environmental Council of Zambia
ENRM Environment and Natural Resource
Management
EPPCA Environmental Protection and Pollution Control Act
ESS Epidemilogical Sentinel Surveillance
GDP Gross Domestic Product
GIDD Gender in Development Division
HIPIC Highly Indebted Poor Countries
HIV Human Immuno-deficiency Virus
IEC Information Education and Communication
IFMIS Integrated Financial Management Information System
IMR Infant Mortality Rate
IMCI Integrated Management of Childhood Infections
ITN Insecticide Treated Net
MDGs Millennium Development Goals
MMR Maternal Mortality Rate
MOE Ministry of Education
MoH Ministry of Health
MTEF Medium-Term Expenditure Framework
NAC National AIDS Council
NAPPC National AIDS Prevention and Control
Programme
NEAP National Environmental Action Programme
NER Net Enrolment Ratio
NFNC National Food and Nutrition Commission
FNC National Food and Nutrition Commission
NID National Immunisation Day
NGO Non-Governmental Organisation
NWASCO National Water and Sanitation Council
ODA Official Development Assistance
OECD Organisation for Economic Cooperation and Development
PAGE Programme for the Advancement of Girls Education
PEMFAR Public Management and Financial Accounting Reforms
PLWHA People Living With HIV/AIDS
PMTCT Prevention of Mother to Child Transmission of HIV
PRGF Poverty Reduction Growth Facility
PRPs Poverty Reduction Programmes
PRSP Poverty Reduction Strategy Paper
SADC Southern African Development Community
SMP Staff Monitored Program
SPS Sanitary and Phytosanitary
STI Sexual Transmitted Infection
TB Tuberculosis
TRIPS Trade Related Intellectual Rights
TNDP Transitional National Development Plan
TOE Tonnes of Oil Equivalent
UN United Nations
UNDP United Nations Development Programme
VCT Voluntary Counselling and Testing
WASHE Water, Sanitation and Health Education
WRAP Water Resources Action
Programme
WTO World Trade Organisation
ZAWA Zambia Wildlife Authority
ZDHS Zambia Demographic and Health
Survey
ZFAP Zambia Forestry Action
Programme
Zambia Millennium Development Goals Report 2003iv
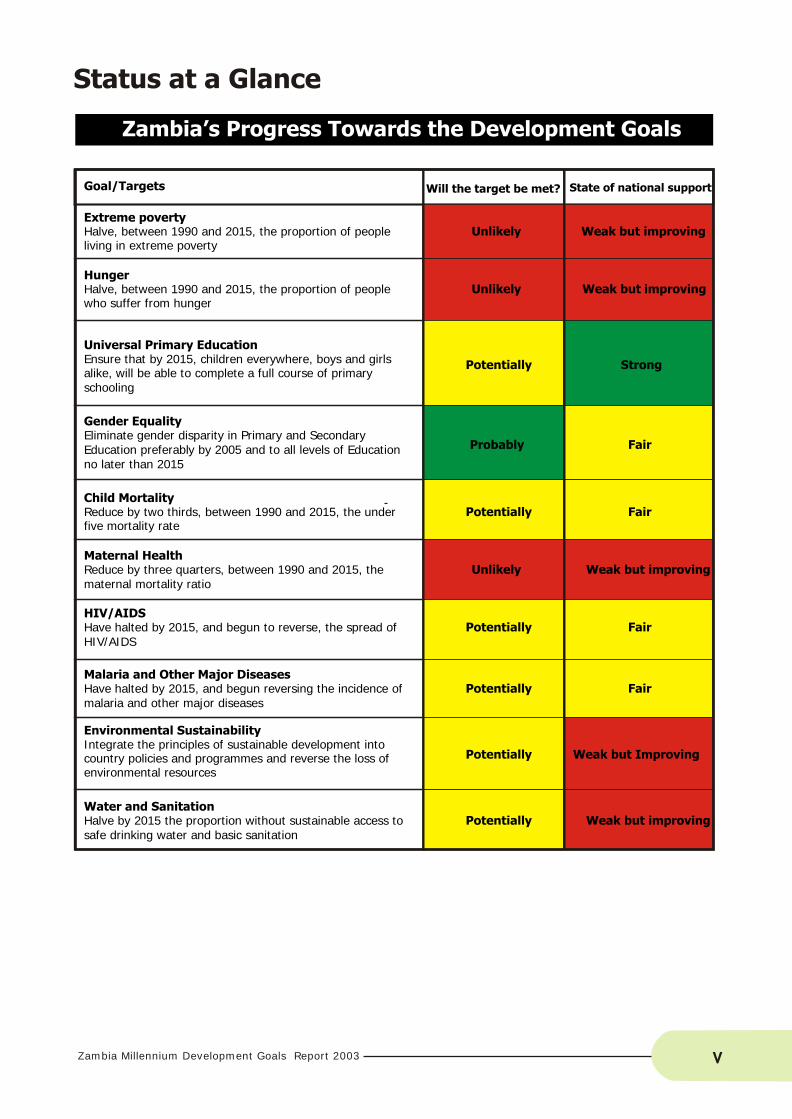
Status at a Glance
Zambia’s Progress Towards the Development Goals
Goal/Targets Will the target be met? State of national support
Hunger
Halve, between 1990 and 2015, the proportion of peoplewho suffer from hunger
Unlikely
Weak but improving
Universal Primary Education
Ensure that by 2015, children everywhere, boys and girlsalike, will be able to complete a full course of primary schooling
Potentially
Strong
Gender Equality
Eliminate gender disparity in Primary and SecondaryEducation preferably by 2005 and to all levels of Educationno later than 2015
Probably
Fair
Child Mortality
Reduce by two thirds, between 1990 and 2015, the under -
five mortality rate
Potentially
Fair
Maternal Health
Reduce by three quarters, between 1990 and 2015, the maternal mortality ratio
Unlikely
Weak but improving
HIV/AIDS Have halted by 2015, and begun to reverse, the spread of HIV/AIDS
Potentially
Fair
Malaria and Other Major Diseases Have halted by 2015, and begun reversing the incidence ofmalaria and other major diseases
Potentially
Fair
Environmental Sustainability Integrate the principles of sustainable development into country policies and programmes and reverse the loss of environmental resources
Potentially
Weak but Improving
Water and SanitationHalve by 2015 the proportion without sustainable access tosafe drinking water and basic sanitation
Potentially Weak but improving
Extreme povertyHalve, between 1990 and 2015, the proportion of peopleliving in extreme poverty
Unlikely Weak but improving
Zambia Millennium Development Goals Report 2003 V
Introduction
h is i s the f i r s t M i l l enn ium
Development Goals (MDGs) Progress
Report for Zambia. It aims at Tgenerating dialogue on all aspects of
development including the setting of national
targets, designing pro-poor policies and
enabling all parties to hold each other
accountable for shared objectives towards
the realization of the goals. In this process,
civil society, the private sector, government
and development partners all play
complementary roles.
The Millennium Development Goals, which
are to be achieved by 2015, were adopted at
the United Nations (UN) Millennium Summit
and are listed as follows:
1. Eradicate extreme poverty and hunger;
2. Achieve universal primary education;
3. Promote gender equality and women
empowerment;
4. Reduce child mortality;
5. Improve maternal health;
6. Combat HIV/AIDS, malaria and other
diseases;
7. Ensure environmental sustainability; and,
8. Develop a global partnership for
development.
Numerical targets and appropriate indicators
to monitor progress have been set for each
goal. A common list of 18 targets and more
than 40 indicators corresponding to these
goals has been prepared collaboratively by
the UN, the World Bank, International
Monetary Fund (IMF) and the Organisation for
Economic Cooperation and Development
(OECD) to ensure a common assessment and
understanding of the status of MDGs at
global, regional and national levels.
Monitoring and reporting on the MDGs will
take place at global and country levels to help
keep poverty issues at the front and centre of
national and global development agenda.
This report uses the same mechanism in
monitoring progress and poverty reduction as
utilized by other national frameworks and
initiatives such as the Poverty Reduction
Strategy Paper (PRSP), which is the poverty
focus of the Transit ional National
Development Plan (TNDP). The MDG targets
and indicators will be domesticated using the
targets in the PRSP process.
The trends in this report are based on
information at three points in time, where
possible; 1990, 2000 and 2015. Whenever
data is not available for 1990 or 2000, the
estimates cited refer to years closest to the
two points in time. The year of the data is
indicated in the tables. For 2015, the targets
are calculated using the 1990 baseline data
according to how the relevant target has been
formulated. Data used in this report is mainly
from Central Statistical Office (CSO) and
other national data sources.
This report is organized into sections; the first
outlines the overall development context in
broad terms and the eight successive sections
assess the country's progress towards the
attainment of each of the MDGs. Each section
examines the targets of a goal through a
review of its status and trends, challenges to
their achievement, and supportive
environment containing policies and
programmes in place that would enhance
their achievement. A summary on the status
and statistics at a glance are also provided.
Zambia Millennium Development Goals Report 20031
Zambia Millennium Development Goals Report 2003
Zambia: Development Context
ambia has a population of 9.9 million
of which 65 percent lives in rural
areas. About 73 percent of the Zpopulation is poor, while 58 percent lives in
extreme poverty. Compared to other
countries worldwide, Zambia's development
lags behind as indicated by the United
Nations Development Programme (UNDP)
2003 Human Development Report. In the
Report, Zambia's human development index
ranks 163 out of the 175 countries surveyed.
Socio-economic Situation
Since independence in 1964, Zambia has
experienced a mix of positive and negative
policy changes, external conditions, and
economic performance. For example, the
country's economic policy has varied
between administrative controls and liberal
economic management. Since the 1980s, a
number of reforms have been introduced
aimed at restructuring the economy and
restoring economic growth, following the
collapse of copper prices. After 1991, the
breadth and pace of the reforms was
increased but despite this, economic
performance has been unsatisfactory. On
average, growth in GDP has been fluctuating
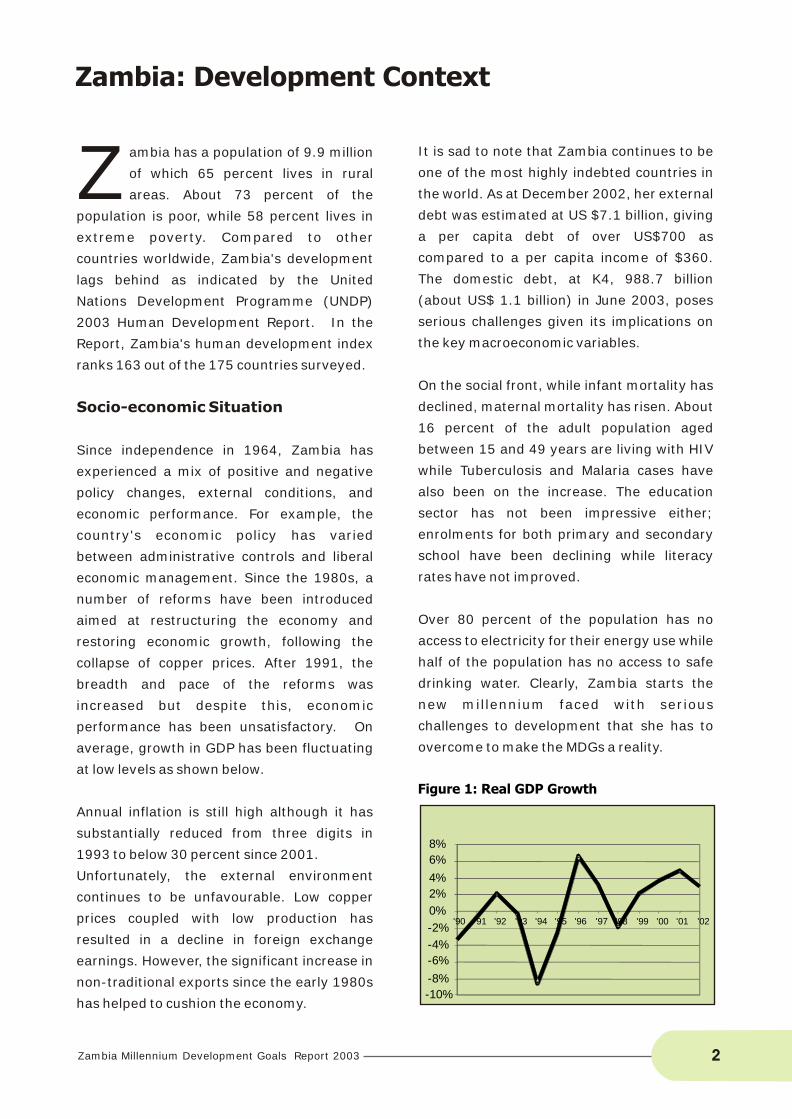
at low levels as shown below.
Annual inflation is still high although it has
substantially reduced from three digits in
1993 to below 30 percent since 2001.
Unfortunately, the external environment
continues to be unfavourable. Low copper
prices coupled with low production has
resulted in a decline in foreign exchange
earnings. However, the significant increase in
non-traditional exports since the early 1980s
has helped to cushion the economy.
It is sad to note that Zambia continues to be
one of the most highly indebted countries in
the world. As at December 2002, her external
debt was estimated at US $7.1 billion, giving
a per capita debt of over US$700 as
compared to a per capita income of $360.
The domestic debt, at K4, 988.7 billion
(about US$ 1.1 billion) in June 2003, poses
serious challenges given its implications on
the key macroeconomic variables.
On the social front, while infant mortality has
declined, maternal mortality has risen. About
16 percent of the adult population aged
between 15 and 49 years are living with HIV
while Tuberculosis and Malaria cases have
also been on the increase. The education
sector has not been impressive either;
enrolments for both primary and secondary
school have been declining while literacy
rates have not improved.
Over 80 percent of the population has no
access to electricity for their energy use while
half of the population has no access to safe
drinking water. Clearly, Zambia starts the
new millennium faced with serious
challenges to development that she has to
overcome to make the MDGs a reality.
Figure 1: Real GDP Growth
-10%
-8%
-6%
-4%
-2%
0%
2%
4%
6%
8%
'90 '91 '92 '93 '94 '95 '96 '97 '98 '99 '00 '01 '02
2
Goal 1
Target 1: Halve, between 1990 and 2015, the proportion of people living in extreme poverty
Status and Trends
Almost three quarters of the population live
below the national poverty line. The Objective
of reducing extreme poverty from 58 percent
in 1998 to 29 percent in 2015 constitutes a
major challenge for Zambia. Extreme poverty
is much higher in rural areas (71 percent)
compared to urban areas (36 percent).
Relative to 1991, these represent an increase
for urban areas from 32 percent but a
decrease for rural areas from 81 percent.
Youth unemployment is also high, especially
in urban areas where it has increased from 34
percent in 1990 to 51 percent in 2000.
The high poverty levels in Zambia are due to
many factors including unfavourable terms of
trade, the debt burden, and an unstable
macroeconomic environment.
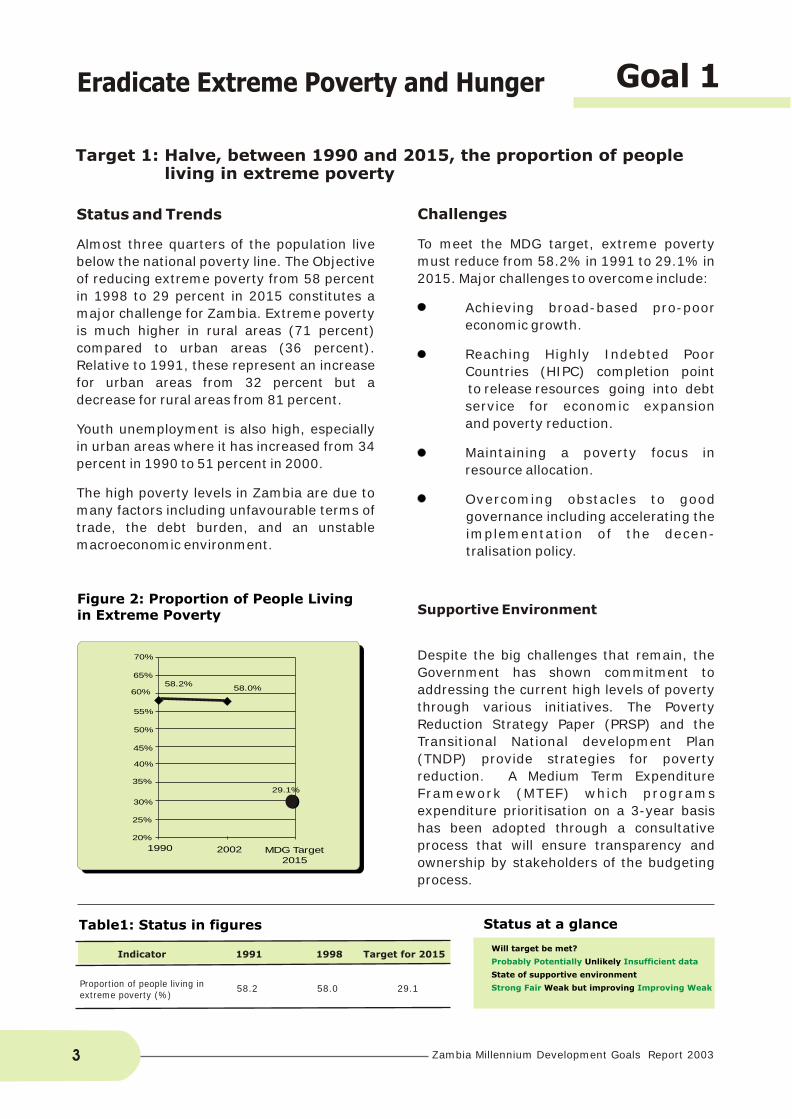
Figure 2: Proportion of People Living in Extreme Poverty
Challenges
To meet the MDG target, extreme poverty
must reduce from 58.2% in 1991 to 29.1% in
2015. Major challenges to overcome include:
Achieving broad-based pro-poor
economic growth.
Reaching Highly Indebted Poor
Countries (HIPC) completion point
to release resources going into debt
service for economic expansion
and poverty reduction.
Maintaining a poverty focus in
resource allocation.
Overcoming obstacles to good
governance including accelerating the
implementation of the decen-
tralisation policy.
Supportive Environment
Despite the big challenges that remain, the
Government has shown commitment to
addressing the current high levels of poverty
through various initiatives. The Poverty
Reduction Strategy Paper (PRSP) and the
Transitional National development Plan
(TNDP) provide strategies for poverty
reduction. A Medium Term Expenditure
Framework (MTEF) which programs
expenditure prioritisation on a 3-year basis
has been adopted through a consultative
process that will ensure transparency and
ownership by stakeholders of the budgeting
process.
Will target be met?
Unlikely
State of supportive environment
Weak but improving
Probably Potentially Insufficient data
Strong Fair Improving Weak
Indicator
Proportion of people living in extreme poverty (%)
1991
58.2
1998
58.0
Target for 2015
29.1
Table1: Status in figures Status at a glance
Eradicate Extreme Poverty and Hunger
Zambia Millennium Development Goals Report 20033
29.1%
58.0%58.2%
55%
60%
70%
65%
50%
45%
40%
30%
35%
25%
20%
1990 2002 MDG Target2015
Target 2: Halve, between 1990 and 2015, the proportion of people who suffer from hunger
Status and Trends
The high levels of hunger manifested in a
deteriorating food security and nutrition
situation are a cause of serious concern. As a
result, Zambia is experiencing a high
prevalence of stunting among children aged
under five years, currently at 47 percent
nationally. Stunting reflects chronic
malnutrition caused by low food intake. The
problem is more serious in rural areas at 52
percent compared to urban areas where it is
34 percent. In all areas, however, the poor
are the most negatively affected.
Another common problem, wasting or acute
malnutrition, affects about 5 and 6 percent of
all rural and urban households respectively.
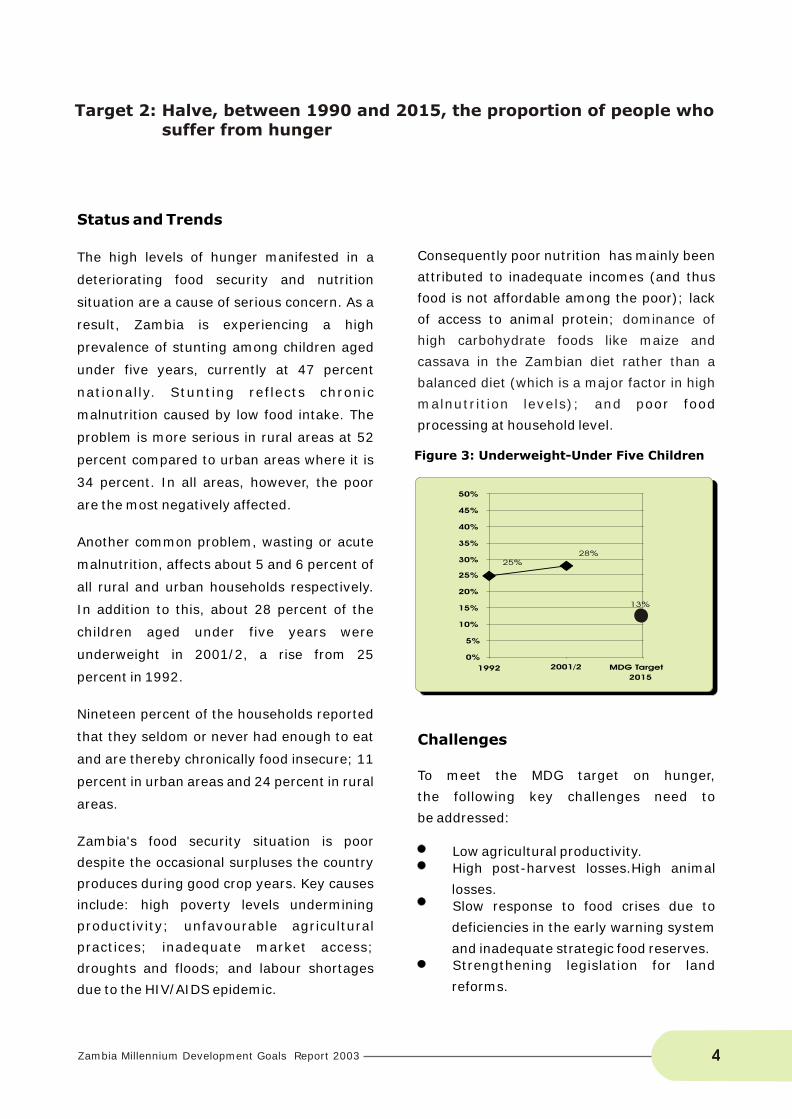
In addition to this, about 28 percent of the
children aged under five years were
underweight in 2001/2, a rise from 25
percent in 1992.
Nineteen percent of the households reported
that they seldom or never had enough to eat
and are thereby chronically food insecure; 11
percent in urban areas and 24 percent in rural
areas.
Zambia's food security situation is poor
despite the occasional surpluses the country
produces during good crop years. Key causes
include: high poverty levels undermining
productivity; unfavourable agricultural
practices; inadequate market access;
droughts and floods; and labour shortages
due to the HIV/AIDS epidemic.
Figure 3: Underweight-Under Five Children
Consequently poor nutrition has mainly been
attributed to inadequate incomes (and thus
food is not affordable among the poor); lack
of access to animal protein;
oor food
processing at household level.
Challenges
To meet the MDG target on hunger,
the following key challenges need to
be addressed:
Low agricultural productivity.
High post-harvest losses.High animal
losses.
Slow response to food crises due to
deficiencies in the early warning system
and inadequate strategic food reserves.
Strengthening legislation for land
reforms.
dominance of
high carbohydrate foods like maize and
cassava in the Zambian diet rather than a
balanced diet (which is a major factor in high
malnutrition levels); and p
25%
28%
13%
0%
5%
10%
15%
20%
25%
30%
35%
40%
45%
50%
1992 2001/2 MDG Target
2015
Zambia Millennium Development Goals Report 2003 4
Supportive Environment
Government and other development
agencies have recognized the importance of
agriculture as the engine for reducing
poverty in Zambia because it is the main
source of livelihood for the majority of the
rural people. The PRSP and TNDP and other
policy documents emphasize agricultural
development. Many other organisations are
complementing Government efforts in
promoting food security and nutrition. These
include: NGOs, research institutions,
cooperating partners, and the private sector.
Status at a glance
Will target be met?
Unlikely
State of supportive environment
Weak but improving
Probably Potentially Insufficient data
Strong Fair Improving Weak
Indicator
Percentage of underweightChildren (under 5years of age)
Percentage of stunted children(under 5years of age)
Percentage of wasted children(under 5years of age)
Value 1990
251
401
511
Value 2001/2
28
47
5
Value 2015
12.5
20.0
2.5
Table 2: Status in figures
Zambia Millennium Development Goals Report 20035
1 Data for 1992
Target 3: Ensure that by 2015, children everywhere, boys and girls alike, will be able to complete a full course of primary schooling
Status and Trends
Improving educational status is critical in the
fight against poverty and hunger and in
improving well-being for the country as a
whole. Education builds people's abilities in
terms of skills and the ability to receive and
process information for livelihood choices.
Yet Zambia is facing reversals in educational
attainment. The primary Net Enrolment Ratio
(NER) dropped by 4 percentage points
between 1990 and 2003. However, the
proportion of grade 1 pupils reaching grade 7
increased from 64 percent in 2000 to 73
percent in 2003. The gender gap in enrolment
remained unchanged at 2 percentage points
between 2000 and 2003. Similarly, during the
same period, the gender gap in completion
rates remained high at 14 percentage points.
Female literacy rates continued to be lower
than those of males and the gender gap has not narrowed between 1990 and 2000.
Some of the reasons behind the decline of
both NER and the literacy levels for the 15-24
years age group include: deterioration in the
quality of education; the HIV/AIDS
pandemic; poor school infrastructure in rural
areas; and a decline in the number of
teachers, most of whom are dying from AIDS.
AIDS reportedly killed 800 teachers in 1998
and hundreds more are expected to die in the
coming years.
With respect to literacy rates, these are
further affected by the poor conditions of
service especially in rural areas. These
conditions contribute to the high teacher
attrition rates. This has resulted in
overcrowded classrooms and an increase in
Goal 2 Achieve Universal Primary Education
Zambia Millennium Development Goals Report 2003 6
Challenges
Deterioration between 1990 and 2003 in
indicators measuring progress for achieving
universal primary education poses great
challenges in meeting the target by 2015.
Challenges include:
Reversing the low levels of completion
and equity in basic education.
Increasing budget allocation to the
sector.
Arresting the deteriorating quality of
education.
Reversing trends in HIV/AIDS
Supportive Environment
The Government has put in place favourable
policies and programmes aimed at improving
the education sector. These include: the
education policy from 1996 “Educating our
future”; removal of examination and
stationery fees; and free primary education
policy declared in 2002.
The Basic Education Sector Investment
Programme (BESSIP), which ended in 2002
was put in place to ensure successful
implementation and financing of policies and
strategies. In 2003, BESSIP was succeeded
by a Five-Year Sector Plan, which
encompasses all sub-sectors of education
from basic to tertiary level. Gender issues in
primary education have been addressed
through the Programme for the Advancement
of Girls Education (PAGE), which starting
from 2003 was mainstreamed into the school
system. Other programmes include the
Primary Reading Programme, Interactive
Radio Instruction, and Community Schools.
In order to strengthen implementation of
reforms, Government allocation of resources
to districts is now based on new criteria that
includes increases in girl pupils.
In addition, Co-operating partners and the
private sector have provided support to the
education sector in many ways. Community
support is strong and is manifested in their
involvement in the construction and
expansion of community schools with
volunteer teachers drawn from the
communities themselves.
Indicator
Net enrolment ratio in primary education GirlsBoys
Proportion of pupils starting grade 1 whoreach grade 7GirlsBoys
Proportion of pupils staring grade1 who reach grade 7GirlsBoys
Literacy rate of 15 - 24 years oldFemaleMale
1990
80%
64%
69%
57%
71%
71%
64%
75%
57%
71%
71%
79%
2003
76%
73%
75%
66%
71%
80%
73%
70%
66%
66%
80%
75%
2015
100%
100%
100%
100%
Table 3: Status in figures Status at a glance
50%
60%
70%70%
76%
80% 80%
90%
100%
Value 1990 Value 2000 Value 2003 MDG Target 2015
Figure 4: Net enrolment Ratio in Primary Education
Zambia Millennium Development Goals Report 20037
Will target be met?
Potentially
State of supportive environment
Strong
Probably Unlikely Insufficient data
Fair Weak but improving Improving Weak
the pupil teacher ratio, which stood at 46
during 2000-2002 and rose to 52 in 2003.
The situation is so critical that in rural areas
some schools have a single teacher for all
grades.
100%
Status and Trends
The exploitation of the full potential of
Zambia's human resource is constrained by
gender disparities. Females lag behind males
in educational attainment, non-agricultural
employment and participation in politics.
Despite efforts by government and NGOs to
reduce gender inequalities in these sectors,
the gender gap persists.
The ratio of literate females to males (15-24
year olds) declined between 1990 and 2002
while the Zambian education system is
characterized by gender disparities at all
levels. However, there is relatively narrower
gender parity in grades 1 to 7 (98 percent)
between 1990 and 2003 but it decreases in
the last years of middle and basic schooling
and becomes slightly wider at secondary level
(90 percent in 2003) and is widest at tertiary
level (46 percent).
At middle to basic and secondary school
levels girls drop out of school due to many
reasons including pregnancies, early
marriages and domestic chores. These result
in fewer females entering colleges and
universities. In addition, there is limited
hostel accommodation space in most
tertiary institutions for females. The most
disadvantaged in this case are females in
rural areas.
The gender disparities in the education
system are later manifested in the labour
markets. There are fewer women in skilled
jobs as seen in the low share of women in
formal wage employment in the non-
agricultural sector, which declined from 39
percent in 1990 to 35 percent in 2000. The
situation at Parliament equally shows wide
gender gaps despite some improvements. In
1991 only 6 percent of the members of
parliament were female. This figure rose to 10
percent in 1996 and to 12 percent in 2001 but
still falls well below the SADC requirement of
30 percent.
2000 2001 MDG Target 2015
90%
90%
100%100%98% 98%
95%92%
85%
85%
75%
Ratio of girls to boys in primary schools
Ratio of girls to boys in secondadary schools
Figure 5: Gender Equality in Primary and Secondary Schools
Target 4: Eliminate gender disparity in primary and secondary education preferably by 2005 and to all levels of education no later than 2015
Goal 3 Promote Gender Equality and Empower Women
Zambia Millennium Development Goals Report 2003 8
National Gender Policy covering all sectors
was adopted. The policy attempts to redress
gender imbalances by promoting, inter alia,
equality in access to all levels of education
and training (formal and non-formal) and by
promoting and increasing participation of
women in decision making bodies.
Government has also established a Gender
Management System, which is a holistic and
system-wide approach for gender
mainstreaming, for use by government in
partnership with stakeholders, including civil
society and the private sector. In addition to
the National Gender Policy, government has
also put in place a supportive environment for
other partners working to promote girls'
education and empowerment of women.
These include NGOs working on gender.
At the international level, Government has
committed itself to all the gender instruments
and conventions including the Beijing
Platform for Action and the SADC
Declaration and its addendum on Violence
Against Women of 1997.
Challenges
Gender disparities arise from multiple factors
including strongly entrenched cultural norms
that need to be tackled to attain gender
equity and equality by 2015. The challenges
Zambia faces are:
Reversing the high female illiteracy.
Strengthening affirmative action to
promote gender equality.
Changing of attitudes towards
increasing female leadership in
politics and government.
Increasing knowledge in gender and
development issues
Reducing the drop-out of school rate
due to pregnancies, early marriages
and domestic chores.
Supportive Environment
Recognizing the prevailing gender disparity
throughout society, Government has put in
place an institutional mechanism for gender
mainstreaming. In 1996, the Gender in
Development Divis ion (GIDD) was
established at Cabinet Office. In 2000, the
Indicator
Ratio of girls to boys in primary schools
Ratio of girls to boys in secondary schools
Ratio of females to males ta tertiary levels
Ratio of literacy females to males of 15 - 24 years
Share of women in wage formal employment innon agric sector
Proportion os seats held by women in Nationalparliament
1990
0.98
0.92
0.46
0.90
39%
6%
Data for 1991 Data for 2000 Data for 2001 Data for 2002
2003
0.98
0.90
0.46
0.80
035%
12%
2015
1
2
2
2
2
2
3
3
3
4
4
1
1
100%
Table 4: Status in figures Status at a glance
Will target be met?
Unlikely
State of supportive environment
Weak but improving
Probably Potentially Insufficient data
Strong Fair Improving Weak
Zambia Millennium Development Goals Report 20039
Status and Trends
This is one of the targets that Zambia has the
potential of achieving. Although still relatively
high, infant mortality rates (IMR) have
decreased between 1992 and 2002. In 1992,
IMR was 107 deaths per 1,000 live births. It
rose slightly to 109 in 1996 but decreased to
95 deaths per 1,000 live births in 2002. In
addition, under-five mortality has dropped by
15 percent from 191 in 1992 to 168 deaths
per 1,000 live births in 2002.
The childhood mortality indicators are better
in the urban areas than in rural areas. In 2002
for example IMR was 77 deaths per 1,000 live
births for the urban areas compared to 103
deaths per 1,000 live births for rural areas.
For the same period, under-five mortality
ratio was 140 deaths per 1,000 live births for
urban areas compared to 182 deaths per
1,000 live births for rural areas.
Several factors have contributed to the
decline in the above indicators. These include
improved childhood immunization rates
(increased routine immunization coverage
for measles from 77 percent in 1992, to 87
percent in 1996 and 84 percent in 2002) and
provision of micronutrients such as vitamin A
through supplementation and fortification of
foods. Early medical interventions may also
have played a role in reducing childhood
mortality. In one survey for example, up to 70
Target 5: Reduce by two thirds, between 1990 and 2015, the under five mortality rate
Reduce Child Mortality Goal 4
Zambia Millennium Development Goals Report 2003 10
Challenges
The major challenges to overcome before
under-five mortality could be reduced to 63
per 1,000 live births in 2015 are:
Inadequate child health services.
High prevalence of Malaria.
Increased national prevalence of HIV
among pregnant women.
L im i t ed cove rage o f PMTCT
programmes.
percent of children with acute respiratory
infection were taken to a health facility.
High levels of childhood malnutrition.
High maternal mortality ratio.
Supportive Environment
The policy environment, as articulated in the
national health policy, is conducive and
supportive of child health programmes.
Several chi ld health services and
programmes have been put in place
including: improved child immunisation
coverage both for routine and during the
National Immunization Days (NID);
Integrated Management of Childhood
Infections (IMCI) program; Prevention of
Mother to Child Transmission of HIV
(PMTCT); and, nutrition and breast-feeding
support programmes.
Other child friendly health programmes
initiated at various levels of health care
include: the roll back malaria; safe water
programmes; integrated reproductive health
programmes; and the school nutrition and
health programmes.
Figure 6: Under -Five Mortality Ratio
Value 1992
50
75
100
63
125
150
175
200
168
191
Value 2002 MDG Target 2015
Indicator
Under 5 Mortality Ratio (U5MR)
Infant Mortality Ration (IMR)
Proportion of 1 year old children immunizedagainst measles
1990
191
107
77
2002
163
95
84
Target for2015
63
36
N/A
1
1
1
Table 5: Status in figures Status at a glance
Will target be met?
Potentially
State of supportive environment
Fair
Probably Unlikely Insufficient data
Strong Weak but improving Improving Weak
Zambia Millennium Development Goals Report 200311
Data for 19921
Status and Trends
Maternal Mortality Ratio (MMR) has increased
from 649 in 1996 to 729 per 100,000 live
births in 2002. This is despite high antenatal
care attendance (urban 80 percent, rural 68
percent) and attention given to reproductive
health programs over the past 12 years.
The reasons for increasing MMR include high
percentage of unskilled home deliveries,
limited access to facilities (i.e. few facilities,
distance to facilities), poor quality of care
(untrained staff and lack of surgical and
medical supplies). Prenatal complications,
complicated deliveries, postpartum deaths
from haemorrhage and infections and post
abortion complications also contribute to
increased MMR. Distance to health facilities
and non-availability or cost of transport have
been identified as the major reasons for low
attendance to reproductive health services in
a recent survey. These findings could also in
part explain the steady decline in the
proportion of births that are delivered in
health facilities from 51 percent in 1992 to 45
percent in 2002.
Challenges
Several challenges beset this goal of reducing
the maternal mortality ratio by three quarters
by 2015 and these include:
Limited access to reproductive health
services.
Low quality of reproductive health
care.
High HIV/AIDS prevalence among
women.
Low levels of contraceptive use.
150
350
649
729
750
182
650
450
550
250
1996 2002 MDG Target 2015
Figure 7: Maternal Mortality
Target 6: Reduce by three quarters, between 1990 and 2015, the maternal mortality ratio
Goal 5 Improve Maternal Health
Zambia Millennium Development Goals Report 2003 12
Low advocacy levels for reproductive
health.
Negative cultural practices.
Supportive Environment
Although reproductive health services are
clearly articulated in several important
national documents, practical action on the
delivery of reproductive health services
remains low. This however has recently
shown signs of improving with the
introduction of several programmes and
health related activities such as the recent
integration of PMTCT services into routine
reproductive health services, ongoing
training of reproductive health providers
(such as traditional birth attendants and
midwives). Other measures include: family
planning programmes both by Government
and Non Governmental Organisations; safe
motherhood programs; adolescent sexual
reproductive health programs; and, targeting
of pregnant women under the Roll Back
Malaria Insecticide Treated Nets (ITN)
voucher scheme.
Indicator
Maternal mortality ratio (per 100, 00 live births
Percent births attended by skilled personnel
1990
649
51
Data for 1992 Data for 1996
2002
729
45
Target for2015
162
N/A1
1
2
2
Table 6: Status of figures Status at a glance
Will target be met?
Unlikely
State of supportive environment
Weak but improving
Probably Potentially Insufficient data
Strong Fair Improving Weak
Zambia Millennium Development Goals Report 200313
Status and Trends
The national HIV prevalence rates among
adults 15 to 49 years have been estimated at
16 percent with infection rates much higher
among women (18 percent) than men (13
percent). The rates are also higher in urban
(23 percent) than in rural (11 percent) areas.
The epidemic is at different levels of evolution
in Zambia with urban areas having a stable
epidemic while the rural epidemic is yet to
stabilize.
Prevalence rates increase with age, rising
from 11 percent among 15-24 years olds to
25 percent among the 30-34 years olds,
before falling to a level of 17 percent in those
aged 45-49 years.
Prior to the Zambia Demographic Health
Survey (ZDHS) 2001/2002, HIV trends were
monitored using the Epidemiological Sentinel
Surveillance system (ESS) using antenatal
clinic (ANC) attendees aged 15 to 45 years.
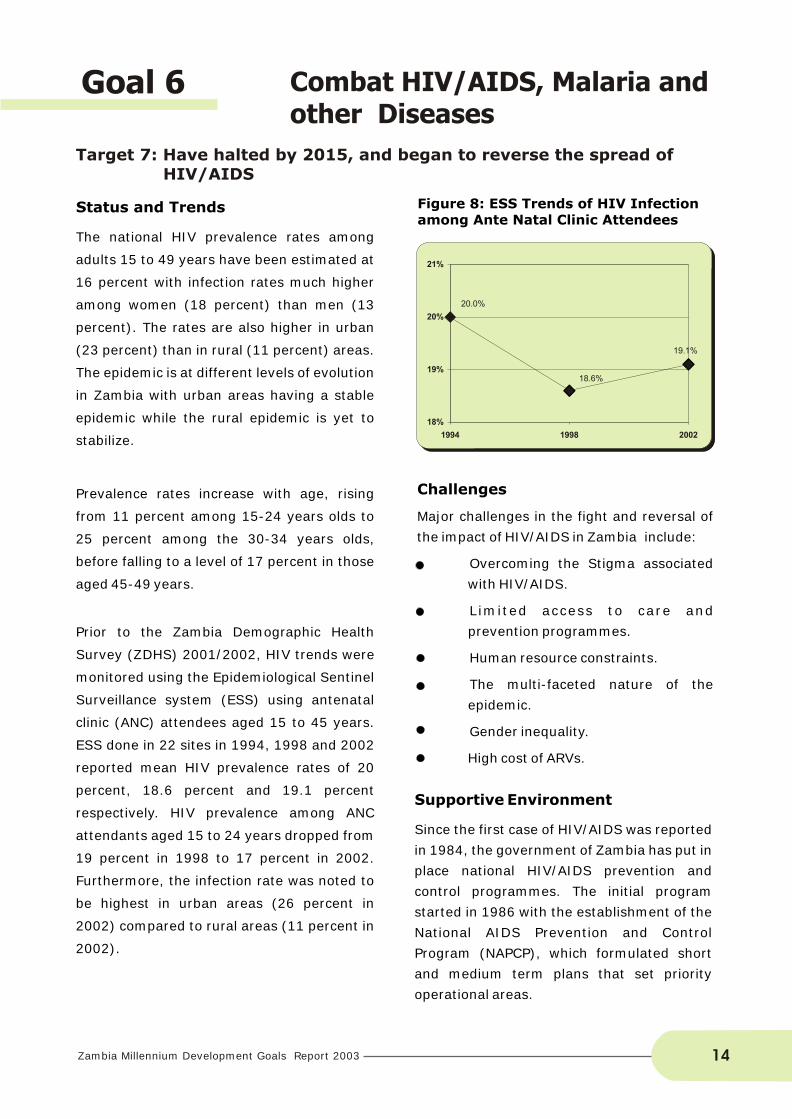
ESS done in 22 sites in 1994, 1998 and 2002
reported mean HIV prevalence rates of 20
percent, 18.6 percent and 19.1 percent
respectively. HIV prevalence among ANC
attendants aged 15 to 24 years dropped from
19 percent in 1998 to 17 percent in 2002.
Furthermore, the infection rate was noted to
be highest in urban areas (26 percent in
2002) compared to rural areas (11 percent in
2002).
Challenges
Major challenges in the fight and reversal of
the impact of HIV/AIDS in Zambia include:
Overcoming the Stigma associated
with HIV/AIDS.
Limited access to care and
prevention programmes.
Human resource constraints.
The multi-faceted nature of the
epidemic.
Gender inequality.
High cost of ARVs.
Supportive Environment
Since the first case of HIV/AIDS was reported
in 1984, the government of Zambia has put in
place national HIV/AIDS prevention and
control programmes. The initial program
started in 1986 with the establishment of the
National AIDS Prevention and Control
Program (NAPCP), which formulated short
and medium term plans that set priority
operational areas.
Figure 8: ESS Trends of HIV Infection among Ante Natal Clinic Attendees
Target 7: Have halted by 2015, and began to reverse the spread of HIV/AIDS
Combat HIV/AIDS, Malaria and other Diseases
Goal 6
Zambia Millennium Development Goals Report 2003 14
19.1%
18.6%
20.0%
In 1999, the National AIDS Council (NAC) was
created. This semi autonomous, multi-
sectoral body has developed a National
HIV/AIDS/STI/TB Strategic intervention plan
(2002-2005). The plan incorporates a
mechanism for inter-sectoral coordination
and collaboration. It contains strategies and
interventions on prevention, treatment and
care. These prevention and mitigation
strategies and interventions have been
developed to encompass all government
ministries, the private sector, religious groups
and civil society.
The political leadership has intensified its
participation in the fight against HIV/AIDS.
This is seen in increasing references by
leaders to the social, economic and health
impact of HIV/AIDS in Zambia. Other notable
developments include: the passing of the
NAC Act in 2002 by the Zambian Parliament,
the mainstreaming of HIV/AIDS in PRSP,
establishment of HIV/AIDS sub committees
(task forces) under the provincial and District
Development Coordinating Committees
(DDCC), increasing involvement and support
by traditional and religious leaders in the fight
against HIV/AIDS. Even more recent is the
Zambian Government's provision of anti-
retroviral therapy in public hospitals. The
government has also recently endorsed the 3
by 5 HIV initiative (3 million people living with
HIV/AIDS on ARVs by the year 2005) being
spearheaded by the multi and bi-lateral
cooperating partners as a way of increasing
access to ARV therapy in the world.
The health sector programmes include care
and support (the introduction of ARV therapy
in all provincial hospitals), the establishment
of Voluntary Counselling and Testing (VCT)
centres in every district of Zambia, the
scaling up of (PMTCT) centres from 6 to 74,
support to Home-based care programmes,
the incorporation of nutritional programmes
as part of care and support of PLWHA and the
provisions of condoms and STI drugs.
Indicator
ESS Trends of HIV infection among ANC
ZDHS HIV prevelance rate (Male and Female rate)
Children orphaned
1990
20%
Data for 1994
2002
19%
16%
Target for2015
19%
16%
1 million
1
1
Table 7: Status in figures Status at a glance
Will target be met?
Potentially
State of supportive environment
Fair
Probably Unlikely Insufficient data
Strong Weak but improving Improving Weak
Zambia Millennium Development Goals Report 200315
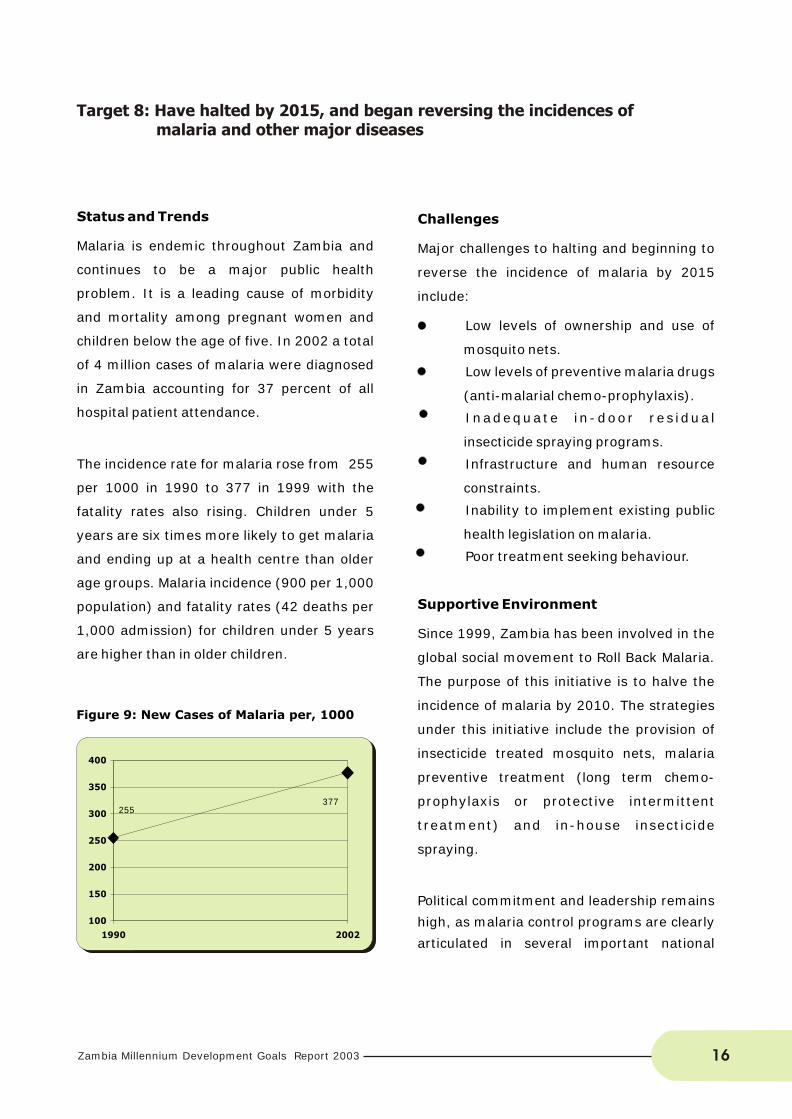
255377
Target 8: Have halted by 2015, and began reversing the incidences of malaria and other major diseases
Status and Trends
Malaria is endemic throughout Zambia and
continues to be a major public health
problem. It is a leading cause of morbidity
and mortality among pregnant women and
children below the age of five. In 2002 a total
of 4 million cases of malaria were diagnosed
in Zambia accounting for 37 percent of all
hospital patient attendance.
The incidence rate for malaria rose from 255
per 1000 in 1990 to 377 in 1999 with the
fatality rates also rising. Children under 5
years are six times more likely to get malaria
and ending up at a health centre than older
age groups. Malaria incidence (900 per 1,000
population) and fatality rates (42 deaths per
1,000 admission) for children under 5 years
are higher than in older children.
Challenges
Major challenges to halting and beginning to
reverse the incidence of malaria by 2015
include:
Low levels of ownership and use of
mosquito nets.
Low levels of preventive malaria drugs
(anti-malarial chemo-prophylaxis).
Inadequate in-door res idua l
insecticide spraying programs.
Infrastructure and human resource
constraints.
Inability to implement existing public
health legislation on malaria.
Poor treatment seeking behaviour.
Supportive Environment
Since 1999, Zambia has been involved in the
global social movement to Roll Back Malaria.
The purpose of this initiative is to halve the
incidence of malaria by 2010. The strategies
under this initiative include the provision of
insecticide treated mosquito nets, malaria
preventive treatment (long term chemo-
prophylaxis or protective intermittent
treatment) and in-house insecticide
spraying.
Political commitment and leadership remains
high, as malaria control programs are clearly
articulated in several important national
Figure 9: New Cases of Malaria per, 1000
Zambia Millennium Development Goals Report 2003 16
documents. Information Education and
Communication (IEC) initiatives have
also been supported at the highest
levels of government.
Malaria has also been incorporated in
the epidemic awareness/ preparedness
committees at Ministry of Health. The
Government adopted the anti-malarial drug
policy in April 2003 in which first line and
second line anti malarial drugs have been
defined. Malaria programs at the district level
have been included in the DDCC plans.
Indicator
New cases of malaria per 1,000
Malaria fatality rates per 1a,ooo
1990
255
11
Data for 1999
2002
377
48
Target for2015
</=121
N/A
1
1
Table 8: Status in figuresStatus at a glance
Will target be met?
Potentially
State of supportive environment
Fair
Probably Unlikely Insufficient data
Strong Weak but improving Improving Weak
Zambia Millennium Development Goals Report 200317
Goal 7:
Status and Trends
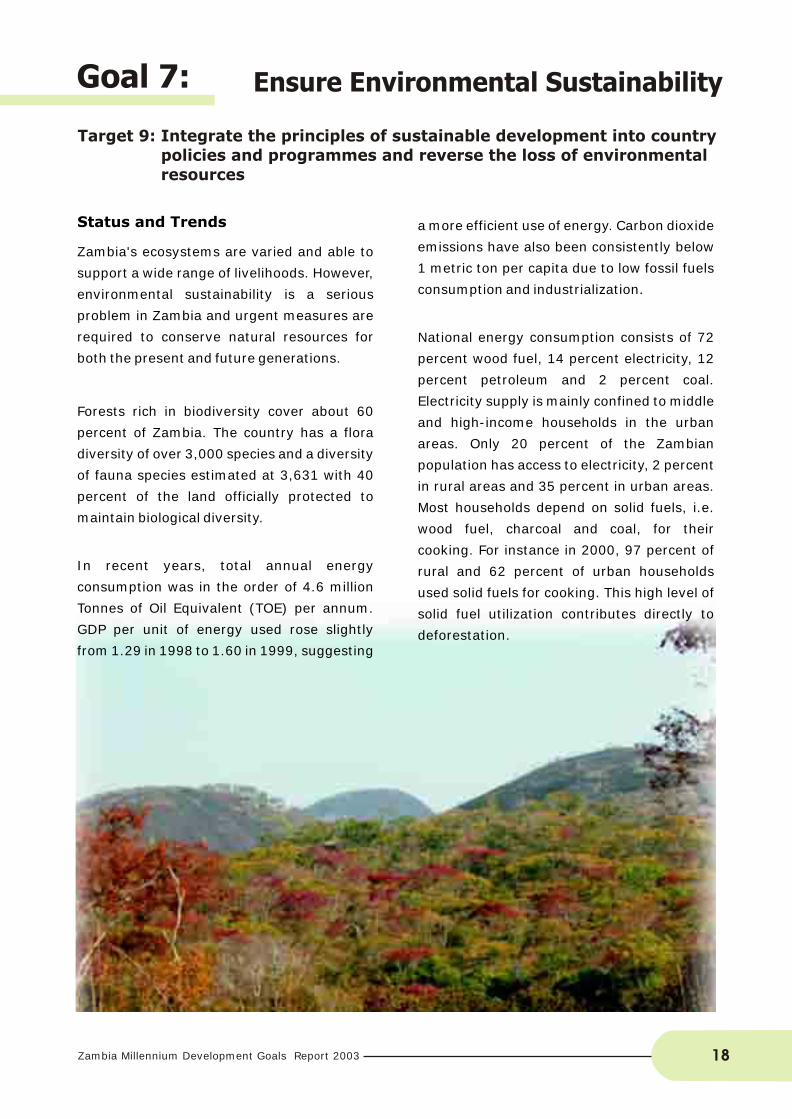
Zambia's ecosystems are varied and able to
support a wide range of livelihoods. However,
environmental sustainability is a serious
problem in Zambia and urgent measures are
required to conserve natural resources for
both the present and future generations.
Forests rich in biodiversity cover about 60
percent of Zambia. The country has a flora
diversity of over 3,000 species and a diversity
of fauna species estimated at 3,631 with 40
percent of the land officially protected to
maintain biological diversity.
In recent years, total annual energy
consumption was in the order of 4.6 million
Tonnes of Oil Equivalent (TOE) per annum.
GDP per unit of energy used rose slightly
from 1.29 in 1998 to 1.60 in 1999, suggesting
a more efficient use of energy. Carbon dioxide
emissions have also been consistently below
1 metric ton per capita due to low fossil fuels
consumption and industrialization.
National energy consumption consists of 72
percent wood fuel, 14 percent electricity, 12
percent petroleum and 2 percent coal.
Electricity supply is mainly confined to middle
and high-income households in the urban
areas. Only 20 percent of the Zambian
population has access to electricity, 2 percent
in rural areas and 35 percent in urban areas.
Most households depend on solid fuels, i.e.
wood fuel, charcoal and coal, for their
cooking. For instance in 2000, 97 percent of
rural and 62 percent of urban households
used solid fuels for cooking. This high level of
solid fuel utilization contributes directly to
deforestation.
Ensure Environmental Sustainability
Target 9: Integrate the principles of sustainable development into country policies and programmes and reverse the loss of environmental resources
Zambia Millennium Development Goals Report 2003 18
Challenges
The following are some of the challenges to
sustainable environmental protection and
utilisation:
Unsustainable use of natural
resources.Weak institutional capacity to enforce
environmental laws and to coordinate
trans-boundary natural resources
management efforts.Weak mechanisms for encouraging
genuine participation of communities
and the private sector in Environment
Natural Resource Management
(ENRM).
Supportive Environment
To help monitor and enforce environment
l e g i s l a t i on and r egu l a t i on s , t he
Environmental Protection and Pollution
Control Act (EPPCA) was enacted in 1990,
which also established the Environmental
Council of Zambia (ECZ) in 1992.
In 1994, the National Environmental Action
Plan was approved which provided updated
information and environmental policy
actions. The Policy for National Parks and
Wildlife was approved in 1997. This was
followed by the enactment of the Zambia
Wildlife Act of 1998 which also created the
Zambia Wildlife Authority (ZAWA) with
responsibility for promoting the sustainable
use of Zambia's wildlife resources.
Again, in 1994, the government formulated
the National Energy Policy with the main
objective of promoting optimum supply and
utilisation of energy. In 1998, the Zambia
Forestry Action Plan (ZFAP) was developed to
improve the sustainable management of
forest resources over a 20-year period. This
led to the adoption of a New Forest Policy in
1998 and enactment of the Forest Act in 1999
which has provided for the transformation of
the Forest Department into a Forestry
Commission as well as provided mechanisms
to enhance part ic ipat ion of local
communities, NGOs, CBOs, the private sector
and other stakeholders in the management of
forestry resources.
In September 2003, the Government
revamped the environmental policy
development process with a view to
harmonize all the regulations and policies in
the tourism, environment and natural
resources sectors. Government is also
working towards the domestication of the
international environment conventions it has
ratified.
Indicator
% of land covered by forest
% of land protected to maintain biological diversity
GDP (Million K) per unit of energy used - Tons of OilEquivalent (TOE)
Carbon dioxide emission per capita
% of population using solid fuels
1990
59.8
38.8
1.29
0.3
88
Data for 1992 Data for 1998 Data for 1999 Data for 2000 Data for 2001
2002
59.6
39.2
1.60
0.2
85.2
1
1
Table 9: Status in figures Status at a glance
Will target be met?
Potentially
State of supportive environment
Fair
Probably Unlikely Insufficient data
Strong Weak but improving Improving Weak
Zambia Millennium Development Goals Report 200319
Target 10: Halve by 2015 the proportion without sustainable access to safe drinking water and basic sanitation
Status and Trends
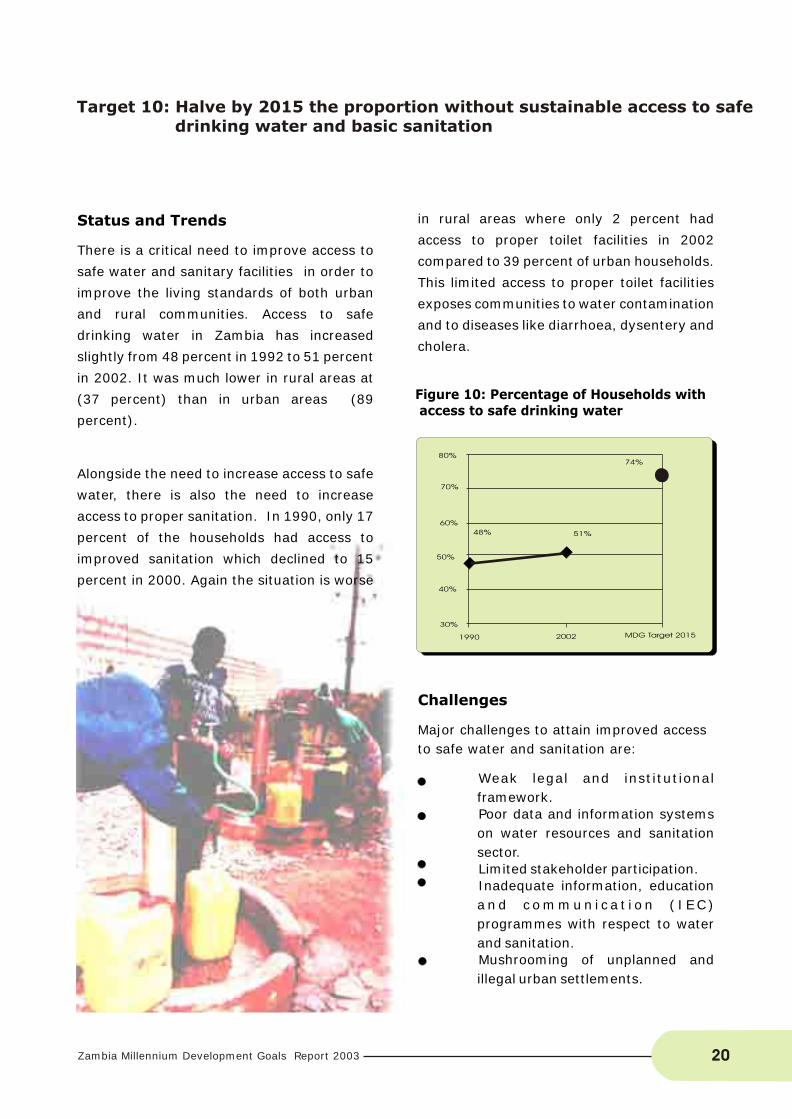
There is a critical need to improve access to
safe water and sanitary facilities in order to
improve the living standards of both urban
and rural communities. Access to safe
drinking water in Zambia has increased
slightly from 48 percent in 1992 to 51 percent
in 2002. It was much lower in rural areas at
(37 percent) than in urban areas (89
percent).
Alongside the need to increase access to safe
water, there is also the need to increase
access to proper sanitation. In 1990, only 17
percent of the households had access to
improved sanitation which declined to 15
percent in 2000. Again the situation is worse
Challenges
Major challenges to attain improved access
to safe water and sanitation are:
Weak legal and institutional
framework.
Poor data and information systems
on water resources and sanitation
sector.
Limited stakeholder participation.
Inadequate information, education
a n d c o m m u n i c a t i o n ( I E C )
programmes with respect to water
and sanitation.
Mushrooming of unplanned and
illegal urban settlements.
in rural areas where only 2 percent had
access to proper toilet facilities in 2002
compared to 39 percent of urban households.
This limited access to proper toilet facilities
exposes communities to water contamination
and to diseases like diarrhoea, dysentery and
cholera.
30%
40%
50%
60%
70%
80%74%
51%48%
1990 2002 MDG Target 2015
Figure 10: Percentage of Households with access to safe drinking water
Zambia Millennium Development Goals Report 2003 20
Supportive Environment
The National Water Policy, formulated in
1994, aims at promoting sustainable water
resources management development, with a
view to facilitating adequate, equitable and
good quality water for all users at acceptable
costs and ensuring security of supply under
varying conditions.
This led to the enactment of the Water Supply
and Sanitation Act No 28 of 1997 which
provided for the creation of commercial
utilities to manage the urban water systems,
ten of which are now in existence. The
Government also created the National Water
Supply and Sanitation Council (NWASCO) to
regulate service providers.
The WASHE (Water, Sanitation and Health
Education) was adopted in 1996 as a national
strategy for improving service provision in
rural areas. This is implemented through the
DDCC with the aim of integrating water
issues into district development planning. Of
the 72 districts, 63 have active D-WASHEs in
operation.
Indicator
Households with access to safe drinking water (%)
Households with access to improved sanitationr (%)
1990
48
17
Data for 1992 Data for 2001/2
2002
51
15
Target for2015
74
42
1 2
21
Table 10: Status in figures Status at a glance
Will target be met?
Potentially
State of supportive environment
Weak but improving
Probably Unlikely Insufficient data
Strong Fair Improving Weak
Zambia Millennium Development Goals Report 200321
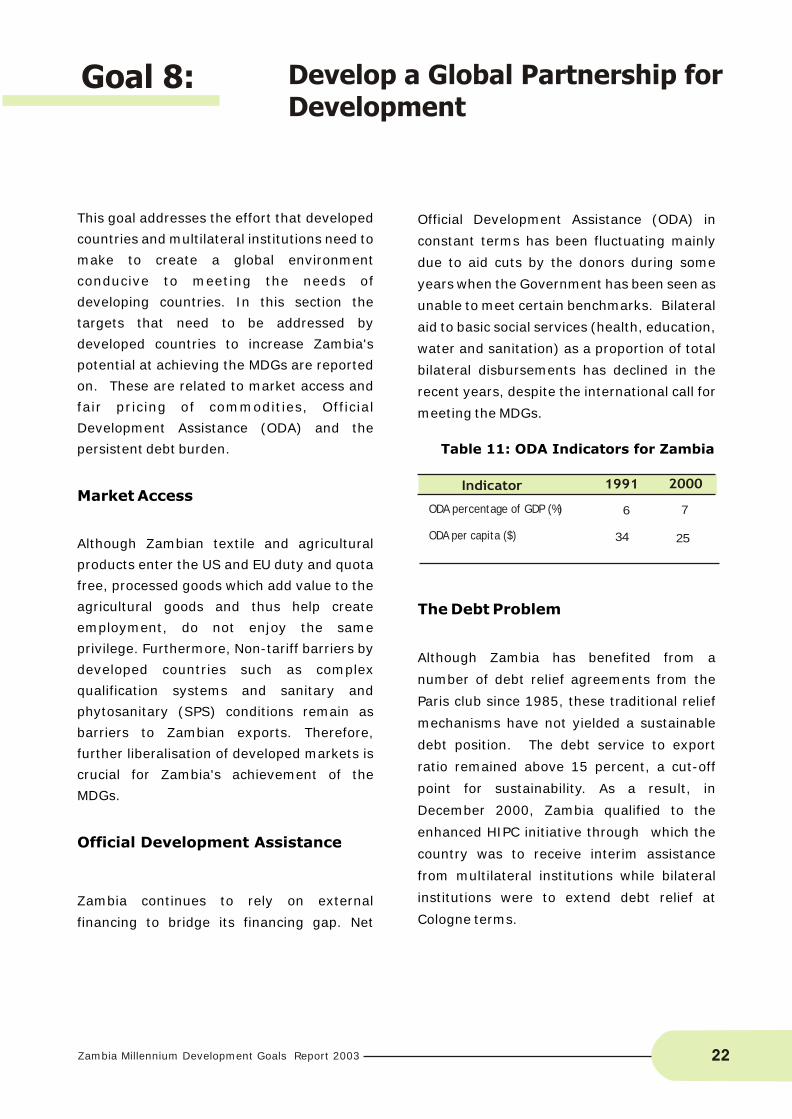
Official Development Assistance (ODA) in
constant terms has been fluctuating mainly
due to aid cuts by the donors during some
years when the Government has been seen as
unable to meet certain benchmarks. Bilateral
aid to basic social services (health, education,
water and sanitation) as a proportion of total
bilateral disbursements has declined in the
recent years, despite the international call for
meeting the MDGs.
The Debt Problem
Although Zambia has benefited from a
number of debt relief agreements from the
Paris club since 1985, these traditional relief
mechanisms have not yielded a sustainable
debt position. The debt service to export
ratio remained above 15 percent, a cut-off
point for sustainability. As a result, in
December 2000, Zambia qualified to the
enhanced HIPC initiative through which the
country was to receive interim assistance
from multilateral institutions while bilateral
institutions were to extend debt relief at
Cologne terms.
Indicator
ODA percentage of GDP (%)
ODA per capita ($)
1991
6
34
2000
7
25
Table 11: ODA Indicators for Zambia
This goal addresses the effort that developed
countries and multilateral institutions need to
make to create a global environment
conducive to meeting the needs of
developing countries. In this section the
targets that need to be addressed by
developed countries to increase Zambia's
potential at achieving the MDGs are reported
on. These are related to market access and
fair pricing of commodities, Official
Development Assistance (ODA) and the
persistent debt burden.
Market Access
Although Zambian textile and agricultural
products enter the US and EU duty and quota
free, processed goods which add value to the
agricultural goods and thus help create
employment, do not enjoy the same
privilege. Furthermore, Non-tariff barriers by
developed countries such as complex
qualification systems and sanitary and
phytosanitary (SPS) conditions remain as
barriers to Zambian exports. Therefore,
further liberalisation of developed markets is
crucial for Zambia's achievement of the
MDGs.
Official Development Assistance
Zambia continues to rely on external
financing to bridge its financing gap. Net
Zambia Millennium Development Goals Report 2003 22
Develop a Global Partnership for Development
Goal 8:

The country was expected to reach
completion point in 2003 and receive
maximum debt relief. At HIPC completion
point, the international creditors have
pledged to reduce the external debt stock by
US$3.8 billion over a period of 20 years.
However, the budget overrun of 2003
resulted in the suspension of the Poverty
Reduction Growth Facility (PRGF), which
automatically stopped Zambia's progression
to completion point. Instead, a temporary
Staff Monitored Program (SMP) was put in
place. This means that Zambia's ability to
achieve the MDGs through the redirection of
resources from debt service to poverty
reduction activities is hindered.
Challenges for global partnership
Great effort is being made to improve the
international architecture so that it meets the
needs of developing countries. However, a
number of challenges still remain for global
environment to work in Zambia's favour:
Undeveloped export oriented
sectors. Thus, even in the context of
growing opportunities, Zambia is
unable to export.
Stringent qualification systems
and sanitary and phytosanitary
(SPS) conditions. Makes the
initiatives by developed countries
difficult to utilise.
Inadequate public expenditure
management. This, for example,
makes it difficult for those donors
willing to provide more generous aid
such as through poverty oriented
budget support to do so.
Lack of policy on aid/debt co-
ordination and management. Thus
no clear oversight as to how aid and
debt are contracted and applied. This is
worsened by a lack of database to
track ODA and debt.
Figure 11: Debt Service as a Percentage of Exports
Zambia Millennium Development Goals Report 200323
16%
55%
31%
35%
27%
15%
28%
14%16%
20%19%
15%14%
0%
10%
20%
19
90
19
92
19
94
19
96
19
98
20
00
20
02
30%
40%
50%
60%
Zambia Millennium Development Goals Report 2003 24
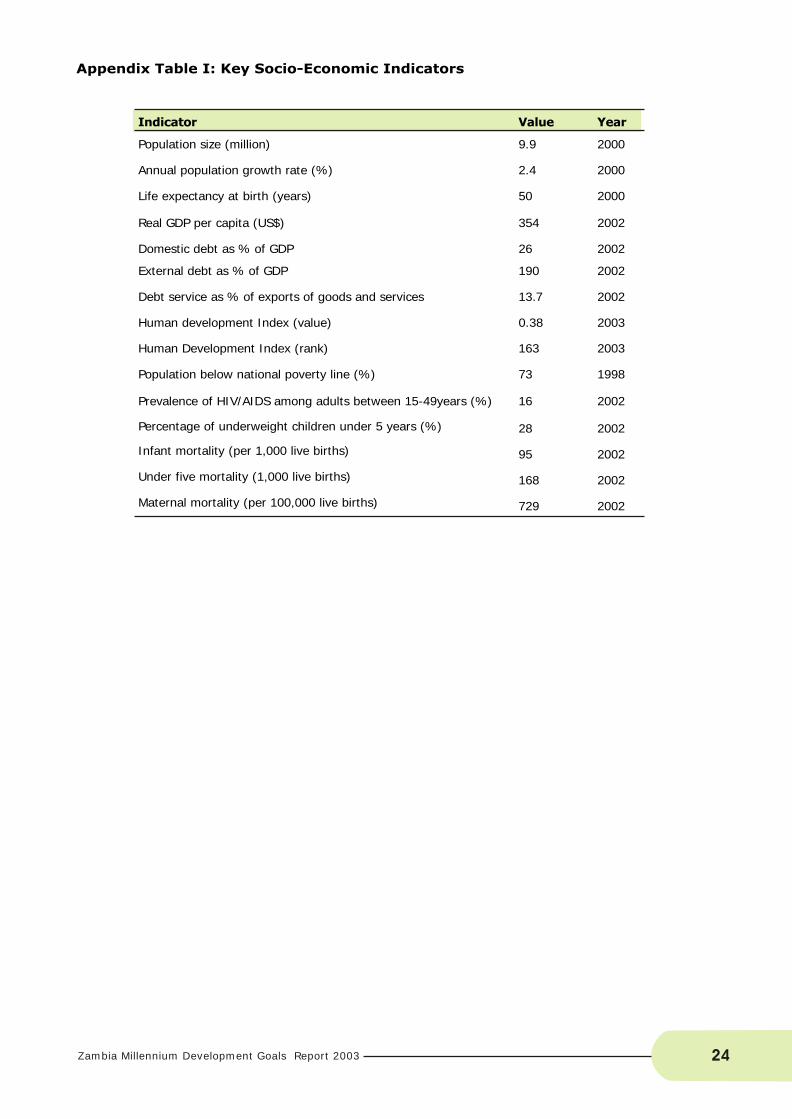
Appendix Table I: Key Socio-Economic Indicators
Indicator Value
Population size (million) 9.9
Annual population growth rate (%) 2.4
Life expectancy at birth (years) 50
Real GDP per capita (US$) 354
Domestic debt as % of GDP 26
External debt as % of GDP 190
Debt service as % of exports of goods and services 13.7
Human development Index (value) 0.38
Human Development Index (rank) 163
Population below national poverty line (%) 73
Prevalence of HIV/AIDS among adults between 15-49years (%)
Percentage of underweight children under 5 years (%)
16
28
Infant mortality (per 1,000 live births)
95
Under five mortality (1,000 live births)
168
Maternal mortality (per 100,000 live births) 729
Year
2000
2000
2000
2002
2002
2002
2002
2003
2003
1998
2002
2002
2002
2002
2002
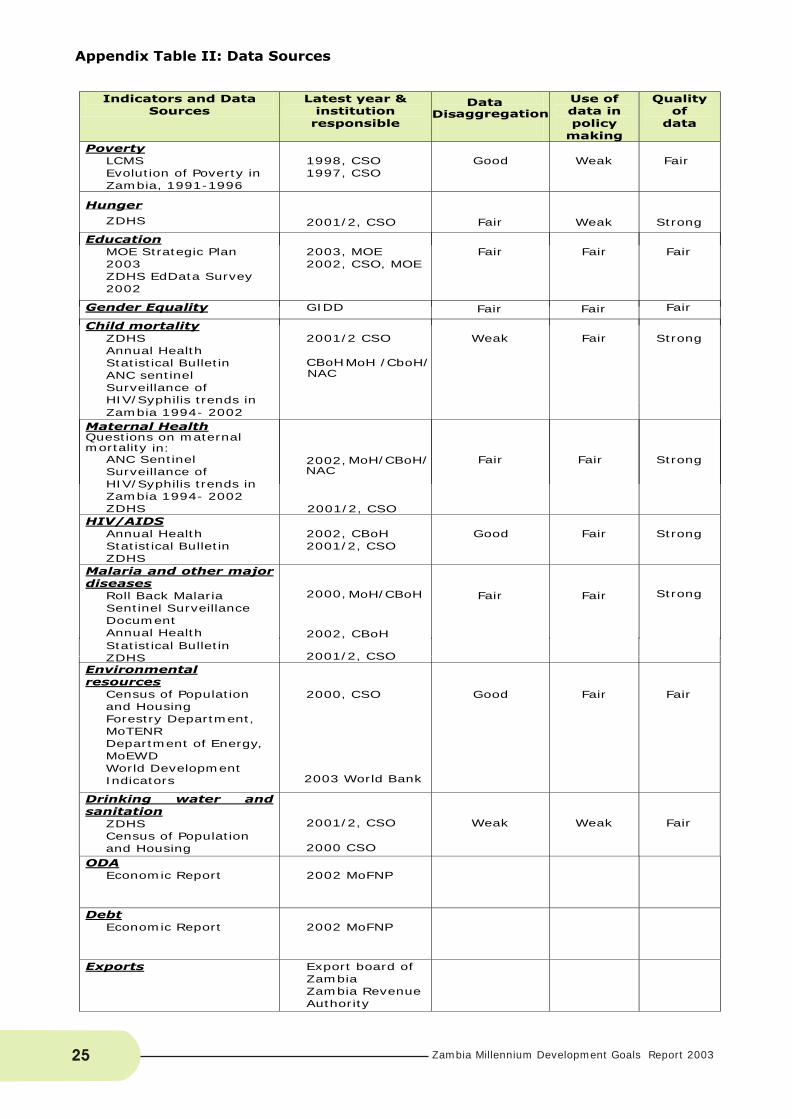
Appendix Table II: Data Sources
Zambia Millennium Development Goals Report 200325
ODA
Economic Report
2002 MoFNP
Debt
Economic Report
2002 MoFNP
Exports
Export board of Zambia Zambia Revenue Authority
Statistical Bulletin ZDHS 2001/2, CSO
Environmental resources
Census of Population and Housing Forestry Department, MoTENR Department of Energy, MoEWD World Development Indicators
2000, CSO
2003 World Bank
Good
Fair
Fair
Drinking water and sanitation
ZDHS Census of Population and Housing
2001/2, CSO
2000 CSO
Weak
Weak
Fair
Indicators and Data Sources
Latest year & institution
responsible
Use of data in policy
making
Quality of
data
Poverty
LCMS Evolution of Poverty in Zambia, 1991-1996
1998, CSO 1997, CSO
Good Weak
Fair
Hunger
ZDHS
2001/2, CSO
Fair
Weak
Strong
Education
MOE Strategic Plan 2003 ZDHS EdData Survey 2002
2003, MOE 2002, CSO, MOE
Fair
Fair
Fair
Gender Equality
GIDD Fair Fair
Child mortality
ZDHS Annual Health Statistical Bulletin ANC sentinel Surveillance of HIV/Syphilis trends in
2001/2 CSO
CBoH MoH /CboH/ NAC
Weak
Fair
Strong
Zambia 1994- 2002
Maternal Health
Questions on maternal mortality in:
ANC Sentinel Surveillance of HIV/Syphilis trends in Zambia 1994- 2002 ZDHS
2002, MoH/CBoH/ NAC
2001/2, CSO
Fair
Strong
HIV/AIDS
Annual Health Statistical Bulletin ZDHS
2002, CBoH 2001/2, CSO
Fair
Strong
Malaria and other major diseases
Roll Back Malaria Sentinel Surveillance Document Annual Health
2000, MoH/CBoH
2002, CBoH
Fair
Fair
Strong
Fair
Fair
Good
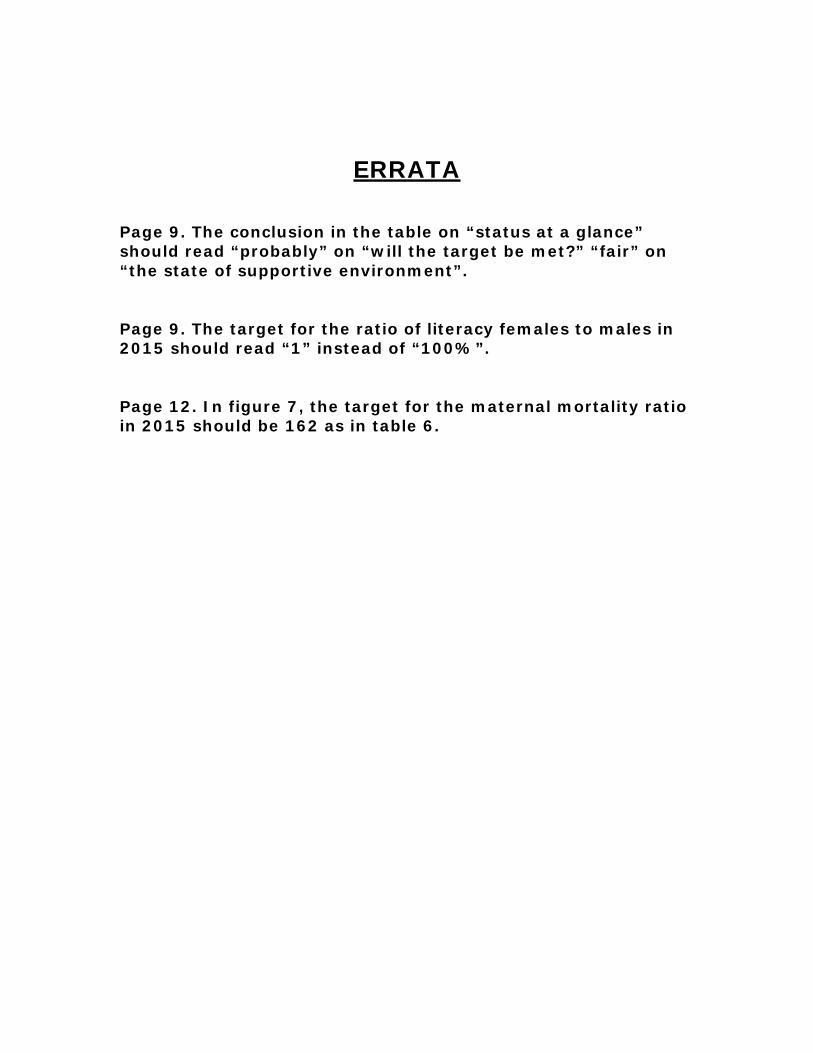
ERRATA Page 9. The conclusion in the table on “status at a glance” should read “probably” on “will the target be met?” “fair” on “the state of supportive environment”. Page 9. The target for the ratio of literacy females to males in 2015 should read “1” instead of “100%”. Page 12. In figure 7, the target for the maternal mortality ratio in 2015 should be 162 as in table 6.