Embed Size (px)
Citation preview
Developing SSU rDNA metagenomic profiles of aquatic microbial communities for environmental
assessments.
By: Michael M. Marshall, Rebecca N. Amos, Vincent C. Henrich and Parke A. Rublee.
Marshall, M.M., R. Amos, V.C. Henrich, and P.A. Rublee. (2008). Metagenomic profiling of aquatic microbial
communities using SSU rDNA sequences: Implications for environmental assessments. Ecological
Indicators 8:442-453. DOI:10.1016/j.ecolind.2007.04.007
Made available courtesy of Elsevier: http://dx.doi.org/10.1016/j.ecolind.2007.04.007
***Reprinted with permission. No further reproduction is authorized without written permission from
Elsevier. This version of the document is not the version of record. Figures and/or pictures may be
missing from this format of the document.***
Abstract:
Five water samples from three sources, two municipal reservoirs in central North Carolina and Toolik Lake in
Alaska, were processed to conduct a comparative survey of microbial small subunit rDNA sequences. Genomic
DNA was extracted and amplified by PCR using universal SSU rDNA primers to generate 16S and 18S rDNA
clone libraries and 50 clones from each library were sequenced and placed in operational taxonomic units
(OTUs). Through this recovery and analysis of SSU rRNA genes, a metagenomic profile of the microbial
community emerged for each environmental sample. Analyses of these profiles, including species diversity
estimates and rank-abundance curves, revealed that approximately 64% of prokaryotic OTUs and 80% of
eukaryotic OTUs were novel. Diversity estimates were consistent with predicted ecosystem characteristics: they
were greater for the mesotrophic to eutrophic temperate lakes, than for the oligotrophic arctic lake. Sample
comparisons showed that community similarity declined as geographic distance between sites increased. Real-
time quantitative PCR results showed that OTUs which had been recovered from only one library were actually
present in other samples, but at much lower frequencies, suggesting that many, if not most, microorganisms are
cosmopolitan. Together, these results support the potential value of using the microbial community as an
indicator of local environmental conditions. In other words, it may be realistic to monitor water quality using a
single, comprehensive suite of microorganisms by analyzing patterns of relative abundance.
Keywords: Metagenomics; Water quality assessment; Microbial community
Article:
1. Introduction
Molecular approaches have great potential for comprehensive environmental assessments of aquatic microbial
communities ([Devereux et al., 2006] and [von Mering et al., 2007]). This potential derives from several
methodological characteristics, which allow for more thorough assessments of microbial communities than non-
molecular methods. The greater sensitivity and specificity provided by molecular assays are advantages that
have become well-known through studies that employ techniques like PCR and real-time PCR to target single
taxa in environmental samples (e.g. [Bowers et al., 2000] and [Wilson et al., 2000]). With molecular approaches,
it is also possible to generate libraries of cloned DNA, such as prokaryotic or eukaryotic small subunit
ribosomal RNA genes (SSU rDNA), which have illuminated the extensive diversity of known and novel taxa in
aquatic systems (e.g. Crump et al., 2003). Finally, the development of microarray technologies (e.g. Castiglioni
et al., 2004) holds promise for assessing multiple targets in a single assay.
The value of these molecular technologies in comprehensive environmental assessments also relies on the well-
known linkage between environmental parameters and the presence of specific microbial taxa. For example,
there are seasonal changes in phytoplankton taxa in arctic and temperate lakes, such as cryptophyte dominance
under winter ice, followed by spring diatom blooms and dominance by green algae and cyanobacteria during
warmer summer months (e.g. Wetzel, 1983). Other studies have shown that lake bacterial communities shift in
response to changes in organic matter source ([Lindström, 2001] and [Crump et al., 2003]) and the abundance
of algal taxa (Lindström, 2001). Callieri and Stockner (2002) have noted that autotrophic picoplankton (0.2–
2 μm) communities change across trophic, temperature, and phosphorus concentration gradients in lakes. Since
microbial taxa generally have short generation times and high metabolic rates, they can be viewed as rapid and
sensitive biological indicators of environmental change. Such change may be monitored at the cellular level as
ribosomal RNA gene transcription is either up- or down-regulated. However, rDNA also provides an
environmental signal since microbial populations constantly fluctuate in response to changing conditions, and
rDNA is generally a reflection of cell abundance. It is also easier to extract and purify DNA than RNA from
natural samples without degradation. Thus, a profile of microbial community rDNAs should reflect the
character of the surrounding environment.
Generally, molecular methods have been used to determine the presence or abundance of single species or
limited taxonomic groups, or to assess taxonomic diversity qualitatively in natural systems. For example,
ribosomal RNA genes have been used for the identification of microbial taxa (e.g. [Pace et al., 1986], [Ward et
al., 1990] and [Amann et al., 1995]). In recent years, this approach has been expanded to characterize a largely
unknown composite of microbial genomes represented in environmental samples. An unexpected level of
species diversity has been recovered from marine samples using 16S rRNA genes and whole-genome shotgun
cloning methods ([Giovannoni et al., 1990], [Venter et al., 2004] and [Sogin et al., 2006]). Samples from the
Antarctic polar front and equatorial Pacific Ocean have shown high levels of eukaryotic diversity based on 18S
rDNA sequences ([López-Garcia et al., 2001], [Moon-van der Staay et al., 2001] and [Venter et al., 2004]).
Similar approaches have revealed a considerable number of unidentified prokaryotes and eukaryotes in
freshwater sources (e.g. [Bahr et al., 1996], [Zwart et al., 1998], [Glöckner et al., 2000] and [Crump et al.,
2003]), confirming that most microbial species are not routinely cultured ([Ward et al., 1990] and [Torsvik et al.,
2002]).
Changes in prokaryotic communities related to physical, chemical, and biological characteristics of aquatic
systems have also been demonstrated using molecular methods (e.g. [Methé and Zehr, 1999], [Van Hannen et
al., 1999], [Casamayor et al., 2002], [Crump et al., 2003] and [Fawley et al., 2004]). Characterizations of
rDNAs drawn from marine samples have even revealed that the microbial community profile is highly
predictable for a given collection location and time of year (Fuhrman et al., 2006). These studies also raise
intriguing questions concerning the distribution limits of microorganisms because taxa have often been detected
in unexpected places. For example, the SAR11 cluster, an SSU rRNA gene cluster believed to represent a group
of uncultured α-Proteobacteria, has been found in both oceanic systems and arctic freshwater lakes
([Giovannoni et al., 1990] and [Bahr et al., 1996]). In fact, several recent papers have discussed the possibility
that microbial species are globally distributed (e.g. [Zwart et al., 1998], [Zwart et al., 2002], [Finlay, 2002],
[Fenchel, 2003], [Papke et al., 2003] and [Whitaker et al., 2003]).
Exhaustive characterizations of species richness may ultimately demonstrate that ―everything microbial is
everywhere‖, but this approach often overlooks important quantitative data. Metagenomic profiles, however,
encompass both qualitative and quantitative aspects of diversity, which are essential for a substantial
environmental characterization. In this study, our primary objective was to evaluate whether metagenomic
profiling can be used as an ecosystem assessment tool. To do so, we compared five metagenomic profiles of
three aquatic systems by evaluating the sequence information generated from a relatively small number of
clones taken from rDNA clone libraries. We also determined if patterns of sample complexity and similarity
followed generally acknowledged ecological precepts.
2. Materials and methods
2.1. Definition
As used in this paper, the term ―metagenomic profile‖ refers to the DNA sequences that are recovered and
analyzed to characterize the pool of genomes present in a sample. In this study, profiles are based on the
recovery and analysis of SSU rDNA sequences from prokaryotic and eukaryotic microbes.
2.2. Water samples
Three lakes were sampled in this study: Lake Townsend (36°11′N, 79°43′W, Greensboro, NC); City Lake
(35°59′N, 79°56′W, High Point, NC); Toolik Lake (68°38′N, 149°43′W, Alaska). Lake Townsend and City
Lake are temperate mesotrophic and eutrophic municipal drinking water reservoirs, respectively. Toolik Lake is
a highly oligotrophic, glacial lake located within the Arctic Long Term Ecological Research (LTER) Site above
the Arctic Circle in Alaska (O’Brien et al., 1997; http://ecosystems.mbl.edu/ARC/). Three Lake Townsend
samples were collected: two pelagic surface water samples collected at the same location on 14 June 2000 and
28 March 2001, and a near-shore sample also collected on 14 June 2000. A third pelagic sample was collected
from City Lake, an artificially aerated reservoir, near a subsurface water treatment system intake on 22 May
2001. The fourth pelagic sample was collected from Toolik Lake near the main LTER sampling station on 11
August 2000. Each sample ( 100 ml) was drawn through a GF/C glass fiber filter that was placed in CTAB
buffer for storage at room temperature until later DNA extraction.
2.3. DNA extraction
Genomic DNA was extracted from each water sample using a CTAB (cetyltrimethylammonium bromide)
buffer DNA isolation technique (Schaefer, 1997). Briefly, the glass fiber filter was macerated in 2 ml CTAB
using a sterile wooden applicator stick. The mixture was heated for 1 h at 65 °C, then mixed with 2 ml 24:1 (v/v)
chloroform–isoamyl alcohol by inverting several times and then centrifuged. The aqueous portion was
transferred to a 1.5 ml tube, 0.7 volumes of 100% 2-propanol were added, and the tube mixed by inverting
several times. The precipitate was pelleted by centrifugation at 14,000 rpm for 25 min at room temperature, the
supernatant decanted, and the DNA pellet air-dried. The pellet was then rehydrated in 25 μl TE buffer (pH 7.4)
and stored at −20 °C.
2.4. PCR amplification and verification
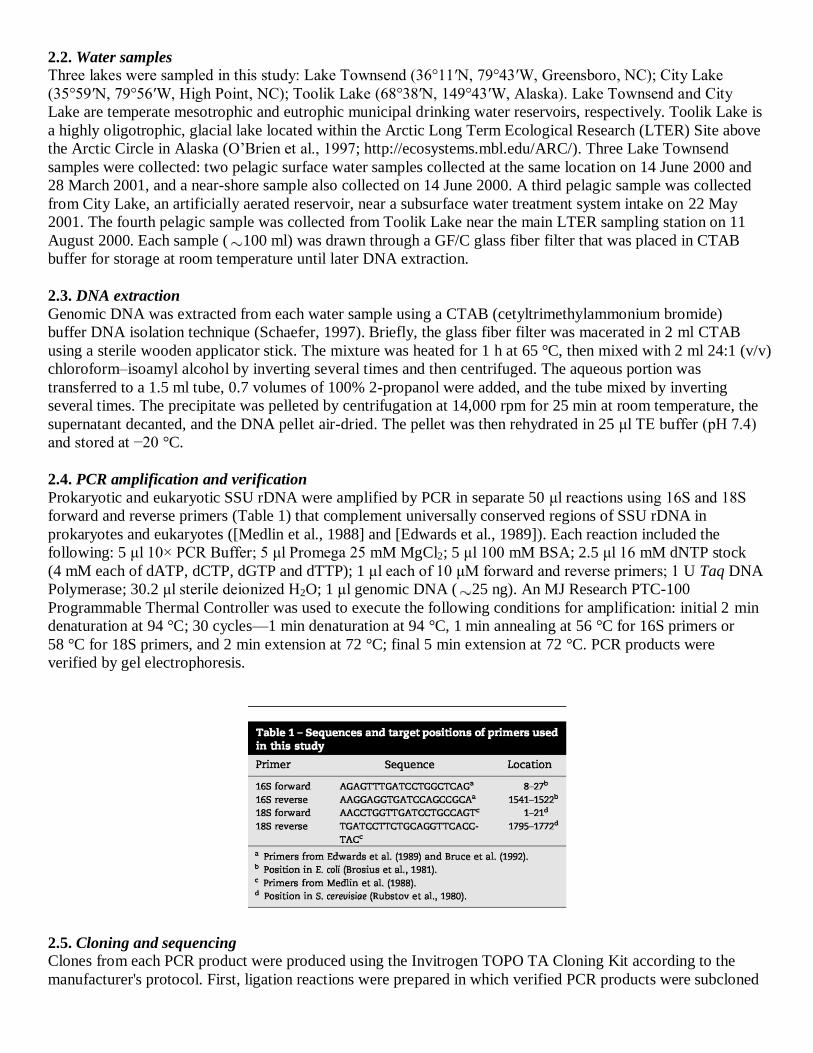
Prokaryotic and eukaryotic SSU rDNA were amplified by PCR in separate 50 μl reactions using 16S and 18S
forward and reverse primers (Table 1) that complement universally conserved regions of SSU rDNA in
prokaryotes and eukaryotes ([Medlin et al., 1988] and [Edwards et al., 1989]). Each reaction included the
following: 5 μl 10× PCR Buffer; 5 μl Promega 25 mM MgCl2; 5 μl 100 mM BSA; 2.5 μl 16 mM dNTP stock
(4 mM each of dATP, dCTP, dGTP and dTTP); 1 μl each of 10 μM forward and reverse primers; 1 U Taq DNA
Polymerase; 30.2 μl sterile deionized H2O; 1 μl genomic DNA ( 25 ng). An MJ Research PTC-100
Programmable Thermal Controller was used to execute the following conditions for amplification: initial 2 min
denaturation at 94 °C; 30 cycles—1 min denaturation at 94 °C, 1 min annealing at 56 °C for 16S primers or
58 °C for 18S primers, and 2 min extension at 72 °C; final 5 min extension at 72 °C. PCR products were
verified by gel electrophoresis.
2.5. Cloning and sequencing
Clones from each PCR product were produced using the Invitrogen TOPO TA Cloning Kit according to the
manufacturer's protocol. First, ligation reactions were prepared in which verified PCR products were subcloned
en masse into the pCR® 4-TOPO
® plasmid vector. Reaction mixtures were then used to transform TOP10
Chemically Competent E. coli cells and transformants containing recombinant plasmids were identified by the
formation of bacterial colonies on LB agar plates containing 50 μg/ml ampicillin. This process eliminates the
need to screen recombinants from non-recombinants because a lethal fusion gene is expressed in non-
recombinants, resulting in cell death. In contrast, recombinants are able to survive due to the presence of a PCR
amplicon insert, which interrupts the lethal gene. Individual colonies were inoculated into LB liquid medium
containing 50 μg/ml ampicillin and cultured overnight with antibiotic selection. Purified plasmid DNA from
each overnight culture was recovered using a Qiagen QIAprep Spin Miniprep Kit according to the
manufacturer's protocol.
In summary, each lake sample was used to prepare separate PCR reactions for the amplification of 16S rDNA
and 18S rDNA. Each PCR reaction product was used to construct a library of clones, each of which
corresponded to a single SSU rDNA amplicon. Finally, restriction digests and gel electrophoresis were
performed to verify the presence of a DNA fragment corresponding in size to 16S rDNA or 18S rDNA in each
clone.
A LI-COR Global Edition IR2 System for automated DNA sequencing was used to generate sequences for fifty
verified clones from each library. Comparative analyses of these sequences were performed so that clones could
be sorted into artificial groups as a means to investigate microbial communities within and between samples.
Sequencing reactions were prepared using an Epicentre Technologies SequiTherm EXCEL™ II DNA
Sequencing Kit-LC (for 25–41 cm gels) according to the Cycle Sequencing Protocol provided. Sequencing
reactions included: 3.5× SequiTherm EXCEL II Sequencing Buffer; IRD-labeled M13-20 forward and reverse
primers; purified 16S rDNA or 18S rDNA; sterile deionized H2O; SequiTherm EXCEL II DNA Polymerase;
SequiTherm EXCEL II-LC Termination Mixes A, C, G and T (each containing dATP, dCTP, dTTP, 7-deaza-
dGTP, and one ddNTP). Using an MJ Research PTC-100 Programmable Thermal Controller, reactions were
amplified by PCR using the following conditions: initial 4.5 min denaturation at 95 °C; 30 cycles of 30 s
denaturation at 95 °C, 30 s annealing at 51 °C, and 1 min extension at 70 °C. After amplification, Stop/Loading
Buffer was added to each reaction, which was then denatured for 5 min at 95 °C and loaded into a 41 cm
polyacrylamide gel. During electrophoresis of the reaction products, dual 700 and 800 nm detection channels
were used simultaneously to generate bidirectional sequences which were at least 550 nucleotides (nt) in each
direction.
2.6. Sequence alignments and community analyses
Partial sequences, consisting of the first 500 nt from both 5′ and 3′ ends, were obtained for each clone and used
in subsequent data analyses. 1000 nt of sequence data provide sufficient information for a detailed phylogenetic
analysis (Pace et al., 1986). For comparison, we also generated complete 18S rDNA sequences in a later
examination and obtained the same results. All sequences were submitted to CHIMERA_CHECK (Version 2.7;
Ribosomal Database Project II, Center for Microbial Ecology, Michigan State University
[http://rdp.cme.msu.edu/html/analyses.html]), a program designed to detect the presence of chimeric properties,
so that PCR artifacts could be identified and eliminated. Based on this inspection, only one 16S rDNA clone
appeared to be chimeric and was excluded from further consideration. All remaining sequences were submitted
to the National Center for Biotechnology Information for BLAST analysis (Altschul et al., 1990
[http://www.ncbi.nlm.nih.gov/]), a web-based program that was used to compare each clone sequence to
reported sequences in the GenBank database. The results were used to determine whether or not each clone
should be characterized as novel.
Sequence alignments and taxonomic analyses were performed using the BioEdit Sequence Alignment Editor
and Analysis software (Version 5.0.9; Department of Microbiology, North Carolina State University
[http://www.mbio.ncsu.edu/BioEdit/bioedit.html]), which includes CLUSTAL W as an accessory application
for multiple alignments. Briefly, the CLUSTAL W basic multiple alignment algorithm performs three primary
functions (Thompson et al., 1994). First, pairwise alignments of all sequences are generated and used to
calculate a distance matrix giving the divergence of each pair of sequences. Second, the distance matrix is used
to compute a guide tree, and third, the branching order of the tree is used to align the sequences progressively.
In this study, sequences within each library were initially aligned for comparison with each other. Sequences
from two libraries were then combined and aligned for pairwise sample comparisons (100 sequences of 16S
rDNA or 18S rDNA). Finally, all sequences were combined for group comparisons using all 249 16S rDNA
sequences and all 250 18S rDNA sequences.
Taxonomic analyses were performed using the BioEdit sequence identity matrix application, which executes a
pairwise comparison of all sequences submitted and calculates the proportion of identical nucleotides between
each pair. Clone sequences that returned an identity score of 0.975 or higher, indicating at least 97.5% similarity,
were grouped together, while any remaining sequences were grouped alone. This similarity threshold results in
groupings, or operational taxonomic units (OTUs), which generally correspond to the species level ([Godon et
al., 1997] and [Schloss and Handelsman, 2005]). By definition, OTUs with only one clone (―unique OTUs‖)
occurred when a sequence was less than 97.5% similar to every other sequence in the library.
After grouping clones into OTUs, several diversity indices were calculated for each library. These included: (1)
species richness, or the total number of OTUs; (2) evenness, or Simpson's dominance index, which measures
the distribution of clones among OTUs; (3) the Shannon–Wiener diversity index, a statistic used to measure the
probability of correctly guessing the OTU identity of a randomly selected clone (Colinvaux, 1993). In addition,
Sorenson similarity coefficients (Lincoln et al., 1998) were calculated to measure community similarity, or the
proportion of OTUs shared by two libraries.
We also estimated total species richness (S) using four methods based on the distribution of OTUs within a
library. These included: Scov, an estimate based on ―coverage‖ ([Good, 1953] and [Giovannoni et al., 1990]);
Smax, an estimate based on rarefaction analysis ([Hurlbert, 1971] and [Nübel et al., 1999]) which was performed
using the program Analytic Rarefaction (Version 1.3; Stratigraphy Lab, University of Georgia
[http://www.uga.edu/~strata/software/]); SACE and SChao1, two estimates that were evaluated using a form
processor and spreadsheet available through a web-based interface
(http://www.aslo.org/lomethods/free/2004/0114a.html).
Coverage uses the diversity profile of a subsample to estimate the fraction of actual diversity recovered from a
sample of infinite size ([Good, 1953], [Giovannoni et al., 1990] and [Ravenschlag et al., 1999]). Scov projects a
total species number based on this proportion. In a rarefaction analysis, species richness and relative abundance
data are used to plot the accumulation of species with sampling effort. The resulting curve approaches an
asymptotic maximum that can be estimated by extrapolation using the same approach as the Michaelis–Menten
equation of enzyme kinetics (Nübel et al., 1999). This asymptote represents Smax, a theoretical species richness
maximum (Colwell and Coddington, 1994). The SACE calculation, which is based on coverage, provides an
estimate based on the relative number of species that occur only once, no more than 10 times, and more than 10
times ([Chao et al., 1993] and [Kemp and Aller, 2004]). It is considered to be more useful when some species
occur more frequently. In contrast, SChao1 takes into account the relative number of three classes: single species,
those that appear twice, and the total number ([Chao, 1984] and [Kemp and Aller, 2004]). This may be more
appropriate when most species are rare. Since each approach computes richness differently, estimates varied
depending on the method used. In general, larger data sets yield estimates that are more precise and unbiased
(Hughes et al., 2001), so microbial communities should be sampled extensively before any method is relied on
exclusively. In this work, four different methods were utilized for comparative purposes to emphasize the
uncertainty in species richness estimates.
2.7. Real-time quantitative PCR
Real-time Q-PCR experiments were designed to analyze the relative abundance of two 16S rDNA OTUs and
one 18S rDNA OTU in three different samples using a Cepheid Smart Cycler system. The amount of
fluorescent dye bound to each target OTU was measured over 40 cycles and compared among pelagic temperate
lake samples. Individual 25 μl reactions included: 2.5 μl Takara 10× Ex Taq™ Buffer; 1.25 μl Takara dNTP
Mixture (2.5 mM each); 1.25 μl SYBR®
Green I nucleic acid gel stain (10×); 0.25 μl Takara Ex Taq™; 1 μl
OTU-specific forward and reverse primers (10 μM each); 16.75 μl sterile deionized H2O; 1 μl experimental
template (genomic DNA ~0.025 μg/μl), 1 μl positive control (mixed clone standard—25 pg/μl each), or 1 μl
negative control (sterile deionized H2O). The mixed clone standard was prepared by combining three clones
representing the three OTUs investigated. Relative abundance estimates were calculated using a 1:10 dilution
series of the mixed clone standard to determine cycle number differences between 25, 2.5, 0.25, and 0.025 pg
template concentrations.
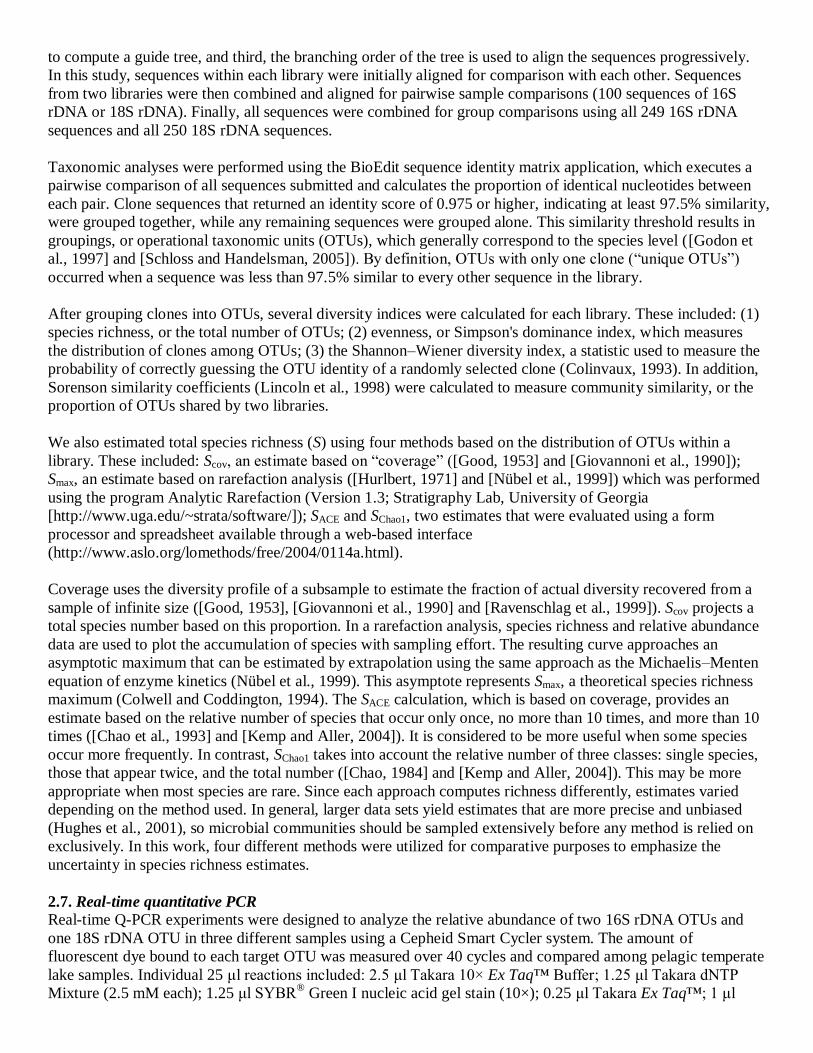
3. Results
For each sample, libraries of SSU rDNA clones were produced, individual clones were randomly selected for
sequencing, and sequences were aligned and sorted into OTUs. Rank abundance curves for each sample showed
some OTUs with multiple sequences, but most OTUs were represented by a single sequence (Fig. 1). When all
249 prokaryotic sequences were compiled, it was determined that 49 OTUs contained multiple clones and that
62 OTUs were unique, represented by only a single clone. An analysis of all eukaryotic sequences (250 clones)
showed that 42 OTUs had multiple clones and that 67 OTUs were unique.
3.1. Sequence identification
The non-chimeric sequences were submitted for BLAST analysis to assess phylogenetic affiliations with
sequences reported in the GenBank database. If a sequence displayed <97.5% identity with all GenBank entries,
it was considered to be novel and is described here as ―unknown‖. Thus, a sequence that displayed ≥97.5%
identity with a GenBank entry is referred to as ―known,‖ even if the GenBank entry did not include a species
identification. We found that the 97.5% identity threshold produced consistent results for sequences in the same
OTU and that these OTUs generally corresponded to species-level units when the GenBank entry provided a
species identification. The proportion of known OTUs was determined for each library (Table 2). The lowest
proportion of known OTUs (25%) was found in the Lake Townsend spring sample and the highest proportion
(48.6%) was found in Toolik Lake. In general, the proportion of known 16S rDNA OTUs was higher than
known 18S rDNA OTUs.
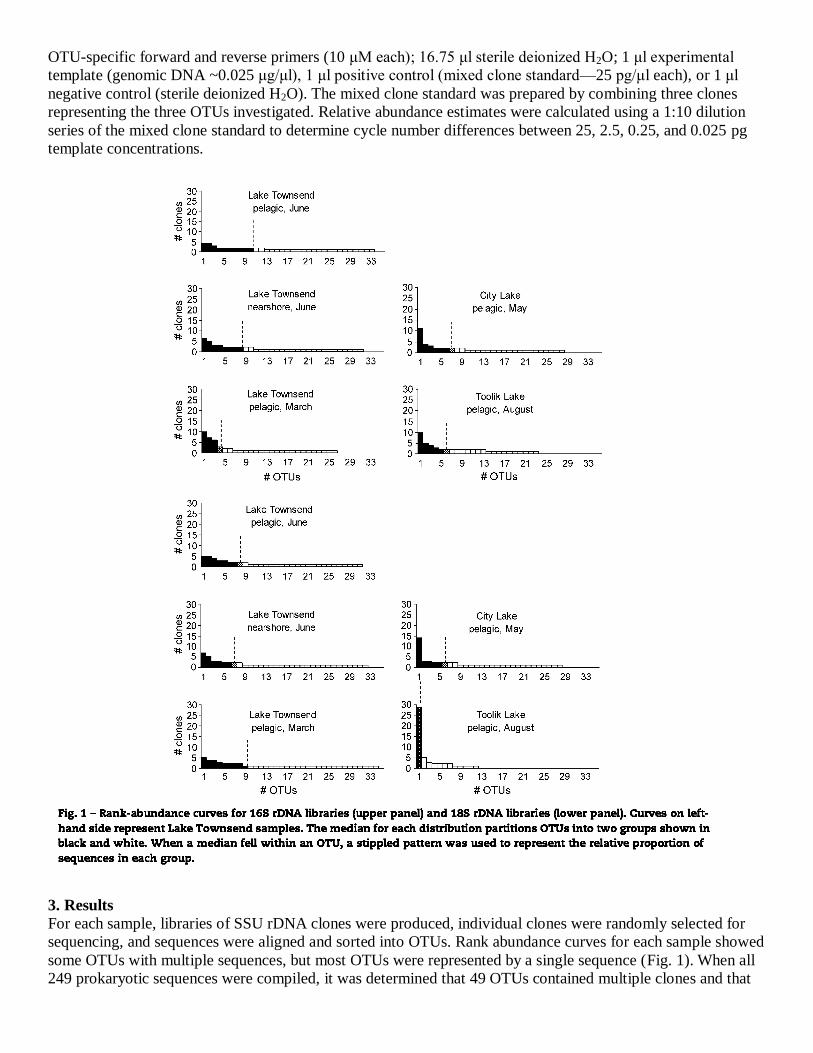
3.2. Species diversity
Measurements of species diversity differed among lakes (Table 2). Collectively, these measurements indicated
that the temperate lakes have greater species diversity for prokaryotes and eukaryotes. Lake Townsend
contained the most species and showed the most even OTU distribution. In contrast, richness estimates for
Toolik Lake were the lowest, especially for eukaryotes, indicating that only a few competitors dominate the
arctic community.
Rank-abundance curves illustrate diversity patterns. For the temperate lakes, these curves showed that few taxa
appeared multiple times while many were represented by a single clone only, a trend indicating the presence of
numerous species at low relative abundance (Fig. 1). In the arctic lake, fewer OTUs were recognized, but the
number of sequences within some OTUs was relatively high. This implies either that fewer OTUs were present
or that a larger proportion of the OTUs that were present were also rare, relative to the temperate samples.
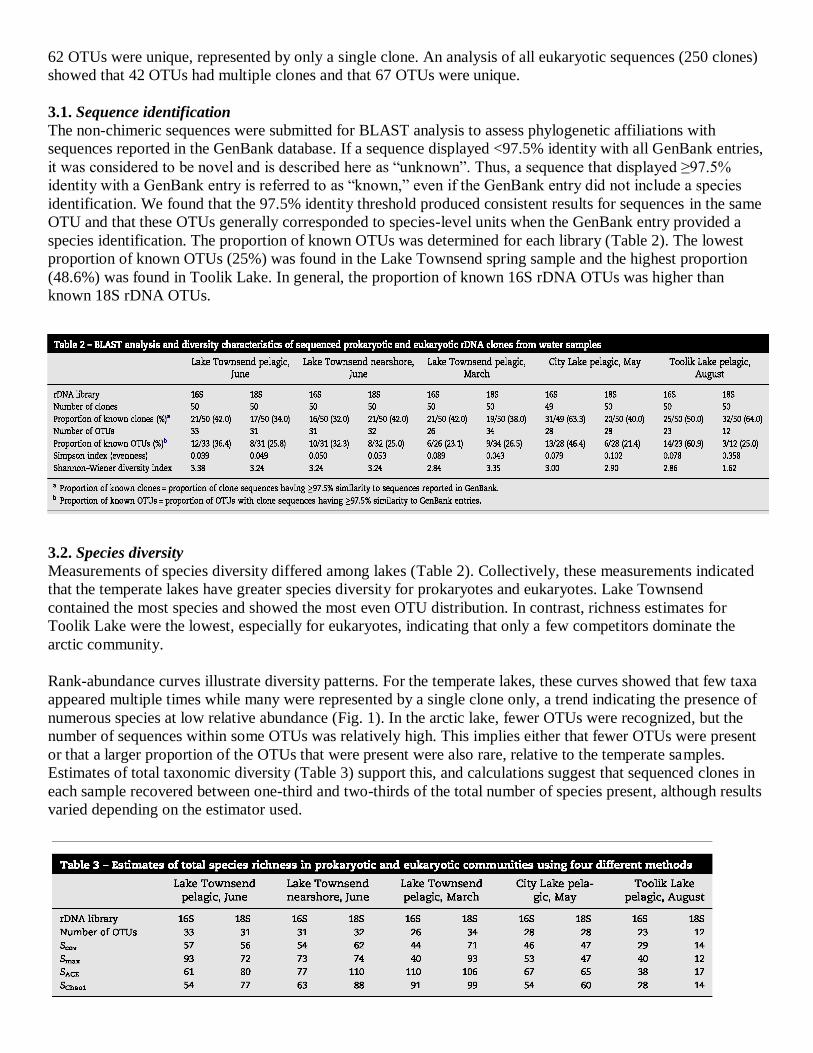
Estimates of total taxonomic diversity (Table 3) support this, and calculations suggest that sequenced clones in
each sample recovered between one-third and two-thirds of the total number of species present, although results
varied depending on the estimator used.
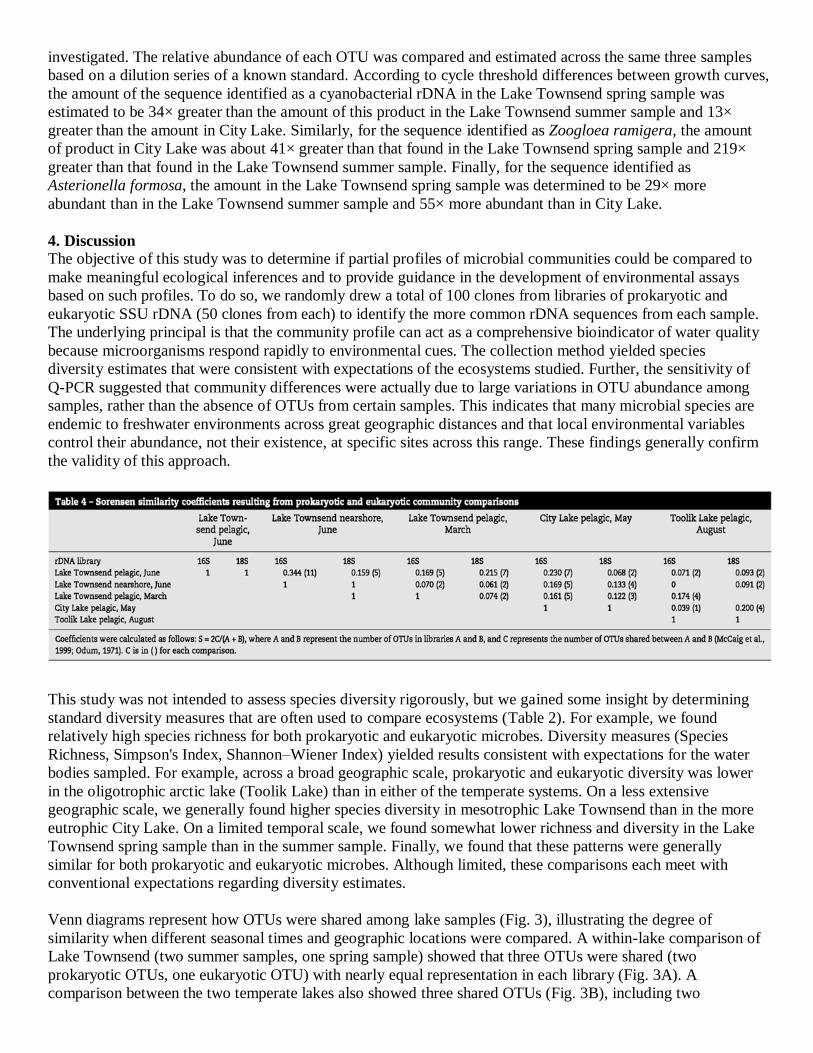
3.3. Library comparisons
Library comparisons were made to determine if similar estimates of species diversity indicated similar
community composition. For each pairwise comparison, a similarity coefficient was calculated (Table 4) to
quantify how many of the same OTUs appeared among the 50 clones characterized from each library. This
analysis showed some overlap between every pair of samples, but the extent of commonality varied
considerably. For example, no prokaryotic sequences were shared between one of the Lake Townsend summer
samples and Toolik Lake, so their similarity is based only on overlapping eukaryotic OTUs. In other cases,
roughly equal proportions of prokaryotes and eukaryotes were shared.
In addition, some comparisons indicated that shared OTUs are more likely to be identified sequences. Between
the two Lake Townsend summer samples that were collected at the same time but at different locations, 16 of
63 eukaryotic OTUs were identified (25.8% in the Lake Townsend pelagic sample and 25% in the Lake
Townsend nearshore sample) and three of these OTUs appeared in both samples. Thus, it appears that 60% of
the eukaryotic taxa that were found in both places can be identified.
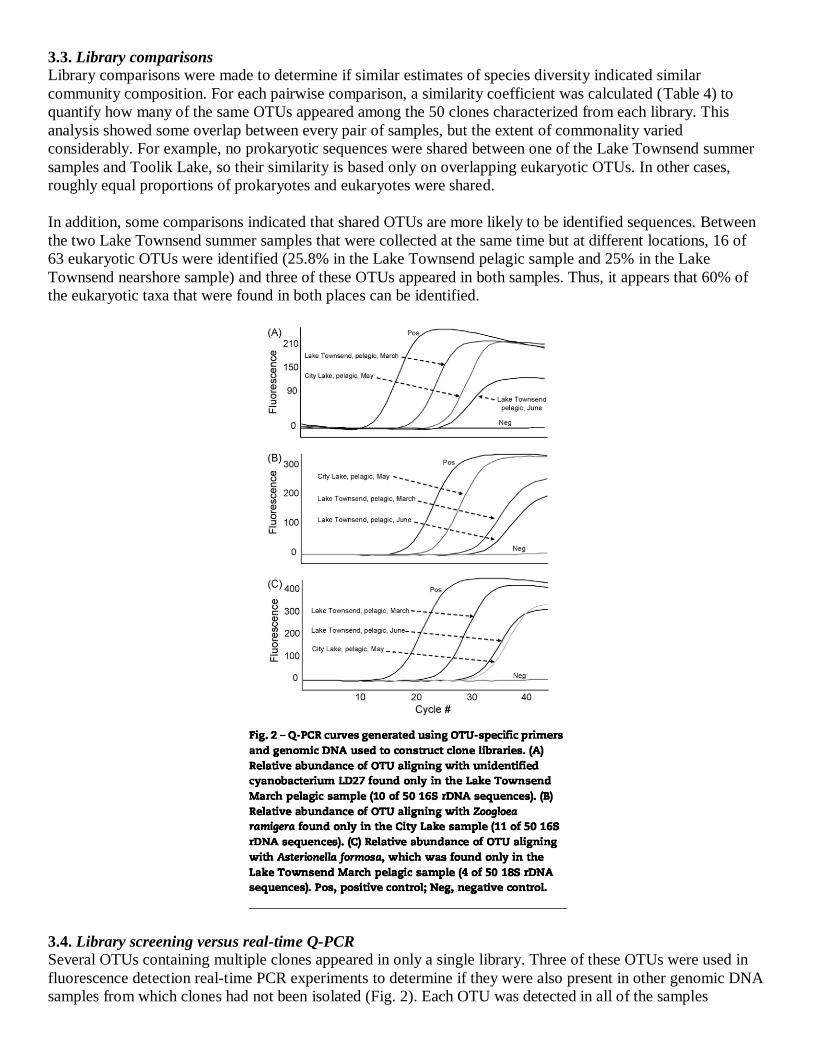
3.4. Library screening versus real-time Q-PCR
Several OTUs containing multiple clones appeared in only a single library. Three of these OTUs were used in
fluorescence detection real-time PCR experiments to determine if they were also present in other genomic DNA
samples from which clones had not been isolated (Fig. 2). Each OTU was detected in all of the samples
investigated. The relative abundance of each OTU was compared and estimated across the same three samples
based on a dilution series of a known standard. According to cycle threshold differences between growth curves,
the amount of the sequence identified as a cyanobacterial rDNA in the Lake Townsend spring sample was
estimated to be 34× greater than the amount of this product in the Lake Townsend summer sample and 13×
greater than the amount in City Lake. Similarly, for the sequence identified as Zoogloea ramigera, the amount
of product in City Lake was about 41× greater than that found in the Lake Townsend spring sample and 219×
greater than that found in the Lake Townsend summer sample. Finally, for the sequence identified as
Asterionella formosa, the amount in the Lake Townsend spring sample was determined to be 29× more
abundant than in the Lake Townsend summer sample and 55× more abundant than in City Lake.
4. Discussion
The objective of this study was to determine if partial profiles of microbial communities could be compared to
make meaningful ecological inferences and to provide guidance in the development of environmental assays
based on such profiles. To do so, we randomly drew a total of 100 clones from libraries of prokaryotic and
eukaryotic SSU rDNA (50 clones from each) to identify the more common rDNA sequences from each sample.
The underlying principal is that the community profile can act as a comprehensive bioindicator of water quality
because microorganisms respond rapidly to environmental cues. The collection method yielded species
diversity estimates that were consistent with expectations of the ecosystems studied. Further, the sensitivity of
Q-PCR suggested that community differences were actually due to large variations in OTU abundance among
samples, rather than the absence of OTUs from certain samples. This indicates that many microbial species are
endemic to freshwater environments across great geographic distances and that local environmental variables
control their abundance, not their existence, at specific sites across this range. These findings generally confirm
the validity of this approach.
This study was not intended to assess species diversity rigorously, but we gained some insight by determining
standard diversity measures that are often used to compare ecosystems (Table 2). For example, we found
relatively high species richness for both prokaryotic and eukaryotic microbes. Diversity measures (Species
Richness, Simpson's Index, Shannon–Wiener Index) yielded results consistent with expectations for the water
bodies sampled. For example, across a broad geographic scale, prokaryotic and eukaryotic diversity was lower
in the oligotrophic arctic lake (Toolik Lake) than in either of the temperate systems. On a less extensive
geographic scale, we generally found higher species diversity in mesotrophic Lake Townsend than in the more
eutrophic City Lake. On a limited temporal scale, we found somewhat lower richness and diversity in the Lake
Townsend spring sample than in the summer sample. Finally, we found that these patterns were generally
similar for both prokaryotic and eukaryotic microbes. Although limited, these comparisons each meet with
conventional expectations regarding diversity estimates.
Venn diagrams represent how OTUs were shared among lake samples (Fig. 3), illustrating the degree of
similarity when different seasonal times and geographic locations were compared. A within-lake comparison of
Lake Townsend (two summer samples, one spring sample) showed that three OTUs were shared (two
prokaryotic OTUs, one eukaryotic OTU) with nearly equal representation in each library (Fig. 3A). A
comparison between the two temperate lakes also showed three shared OTUs (Fig. 3B), including two
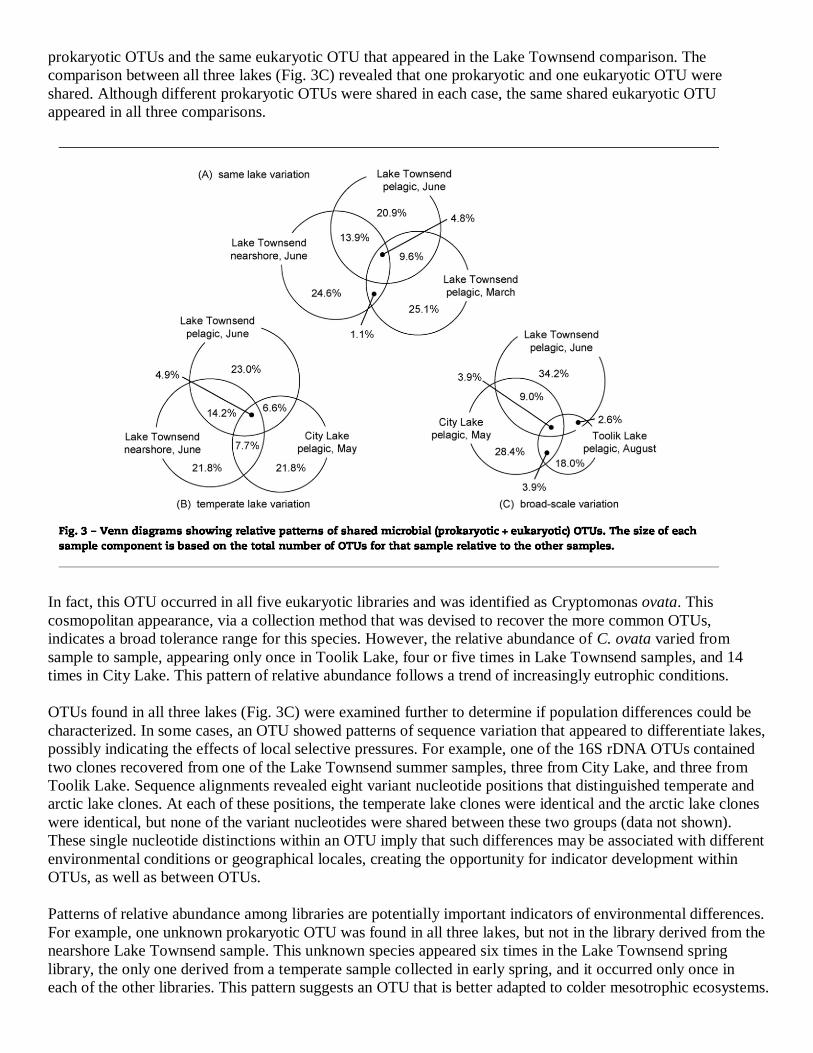
prokaryotic OTUs and the same eukaryotic OTU that appeared in the Lake Townsend comparison. The
comparison between all three lakes (Fig. 3C) revealed that one prokaryotic and one eukaryotic OTU were
shared. Although different prokaryotic OTUs were shared in each case, the same shared eukaryotic OTU
appeared in all three comparisons.
In fact, this OTU occurred in all five eukaryotic libraries and was identified as Cryptomonas ovata. This
cosmopolitan appearance, via a collection method that was devised to recover the more common OTUs,
indicates a broad tolerance range for this species. However, the relative abundance of C. ovata varied from
sample to sample, appearing only once in Toolik Lake, four or five times in Lake Townsend samples, and 14
times in City Lake. This pattern of relative abundance follows a trend of increasingly eutrophic conditions.
OTUs found in all three lakes (Fig. 3C) were examined further to determine if population differences could be
characterized. In some cases, an OTU showed patterns of sequence variation that appeared to differentiate lakes,
possibly indicating the effects of local selective pressures. For example, one of the 16S rDNA OTUs contained
two clones recovered from one of the Lake Townsend summer samples, three from City Lake, and three from
Toolik Lake. Sequence alignments revealed eight variant nucleotide positions that distinguished temperate and
arctic lake clones. At each of these positions, the temperate lake clones were identical and the arctic lake clones
were identical, but none of the variant nucleotides were shared between these two groups (data not shown).
These single nucleotide distinctions within an OTU imply that such differences may be associated with different
environmental conditions or geographical locales, creating the opportunity for indicator development within
OTUs, as well as between OTUs.
Patterns of relative abundance among libraries are potentially important indicators of environmental differences.
For example, one unknown prokaryotic OTU was found in all three lakes, but not in the library derived from the
nearshore Lake Townsend sample. This unknown species appeared six times in the Lake Townsend spring
library, the only one derived from a temperate sample collected in early spring, and it occurred only once in
each of the other libraries. This pattern suggests an OTU that is better adapted to colder mesotrophic ecosystems.
The same comparison also revealed a eukaryotic OTU, which had the most variable abundance. This sequence
was recovered once from City Lake, five times from Lake Townsend in March, and 29 times from Toolik Lake.
Thus, it likely represents a cold water adapted species. In fact, the OTU shows 99.5% sequence identity with
Leptodiaptomus coloradensis (GenBank accession number AY339152), a planktonic crustacean copepod,
although this species may actually represent Diaptomus (Leptodiaptomus) pribilofensis since this is the only
cold water diaptomid species detected so far in Toolik Lake (O’Brien et al., 1997).
Our results, and those of others (e.g. Kemp and Aller, 2004), consistently demonstrate rank abundance curves
with long ―tails‖ of rare taxa. It is clearly difficult to quantify actual microbial diversity in any system and
exhaustive microbial inventories are not yet practical, so reliable estimators of natural diversity using available
data are essential ([Hughes et al., 2001] and [Curtis et al., 2002]). Recent work by Venter et al. (2004) and
Sogin et al. (2006) illustrate this challenge. Venter et al. (2004) used whole-genome shotgun sequencing to
study Sargasso Sea microorganisms. They analyzed six gene sequences to predict species richness using various
diversity estimators. Each gene sequence examined indicated a minimum of 300 species and more than 1000
species when combined. Sogin et al. (2006) used massive parallel sequencing (Margulies et al., 2005) to
compare sequences of nearly 118,000 amplified PCR fragments of ribosomal genes in eight deepwater ocean
samples. They found that each sample was dominated by a few species, but that thousands of rare species were
also present.
Several recent papers review species richness estimators (e.g. Kemp and Aller, 2004) and estimates vary
according to the estimator used. In our study, we compared four estimates of total species richness using
different methods: Scov, based on a simple coverage calculation; Smax, based on rarefaction analysis; the
SACE and SChao1 diversity estimators. Our results suggest that a limited sampling of 50 prokaryotic and 50
eukaryotic clones accounted for 25–50% of the total taxa present, except for the arctic lake libraries, which had
much lower estimates of diversity and therefore represented a much higher percentage of estimated total taxa.
Such calculations are tenuous, however, since rank abundance curves consistently show long tails of rare taxa,
and accumulation curves frequently do not reach asymptotes (cf. [Kemp and Aller, 2004] and [Countway et al.,
2005]).
Previous studies of prokaryotes and eukaryotes in Toolik Lake highlight this difficulty. Bahr et al. (1996) and
Crump et al. (2003) used molecular approaches to census prokaryotic species in Toolik Lake and found a much
greater diversity of taxa than indicated in this study. For eukaryotes, over 130 species of phytoplankton have
been identified by direct microscopic observation, along with a number of ciliated protozoans and rotifers
(O’Brien et al., 1997). Further, nanoflagellates are also common in Toolik, but have not been identified. In each
of these studies, collection protocols were more extensive and multiple samples were analyzed to develop taxon
lists.
Based on most of the rank abundance curves, we also note that our sampling regimen recovered a relatively
small proportion of OTUs with multiple clones and a large proportion of rare individuals, many of which are
represented by only a single clone. This observation is consistent with recent reports of a large ―rare biosphere‖
of microbes in aquatic systems (Sogin et al., 2006). It follows that the resources necessary to extensively sample
the taxa of any ecosystem using molecular tools would be prohibitive for routine assessments. However, this
does not preclude the use of such tools for lake assessments, if comparisons can be achieved by characterizing
the more common OTUs in a given sample.
Despite the limitations of a small sample size, our data suggest that even limited molecular assessments of
aquatic systems can be used to characterize those systems for two reasons. First, we found both unique and
common taxa in our sample libraries (Fig. 3). This result is consistent with the fact that microbes have varied
tolerance ranges. For example, the chrysophyte Cryptomonas ovata was found frequently in each sample, while
many OTUs, such as Enterococcus gallinarum HPC254 and Didinium nasutum, were found in only one sample.
Second, the Q-PCR assays also showed that three OTUs were distributed much more widely than indicated by
the library screenings (Fig. 2). This suggests that the relative abundance of individual OTUs, rather than simply
differences in community OTU composition, may account for many of the differences observed among the
microbial communities sampled. As applied to ecosystem assessments, it may be more effective, and practical,
to quantify differences in species abundance, instead of relying on apparent species differences among samples.
The Q-PCR assays allowed for an estimation of the sensitivity of this approach in detecting community
members. Based on four complete E. coli genomes (GenBank entries AE005174, AE014075, BA000007, and
U00096) 16S rDNA comprises an average of about 0.206% of the E. coli genome, so 52 pg of 16S rDNA can
be expected to be present in 25 ng of genomic DNA material. Q-PCR methods resulted in the detection of a
specific rDNA signal in genomic samples when as little as 3.6 × 10⁻³
pg of starting material was present, based
on a comparison of fluorescent signals from genomic samples and signals from rDNA clones of known
concentration used as positive controls. These calculations suggest that an extraordinarily large clone library
would be required to ensure the recovery of such rare rDNAs by shotgun cloning.
Several studies have suggested that the widespread distribution of microbial taxa occurs because they are
abundant, reproduce rapidly, and are easily dispersed (e.g. [Finlay, 2002], [Griffin et al., 2002] and [Fenchel,
2003]). This idea has been supported by studies of aquatic systems (e.g. [Zwart et al., 1998], [Glöckner et al.,
2000] and [Zwart et al., 2002]), although there is also evidence that at least some extremophiles have much
more restricted distributions ([Papke et al., 2003] and [Whitaker et al., 2003]). Our ability to detect three OTUs
across lakes using Q-PCR, even at low abundance, is consistent with the idea of widespread species distribution.
In terms of indicator development, these results suggest that it is not necessary to extensively census a
representative microbial community for every different combination of environmental characteristics. Instead, a
single comprehensive suite of microorganisms could operate as a bioindicator for any environmental assessment,
simply by noting patterns of relative abundance and associating these patterns with local environmental
conditions. Since microorganisms that are rare in one environment may be much more common in another, the
development of a comprehensive suite could be accomplished by modestly sampling several libraries derived
from well-selected sites over time to recover sufficient microbial diversity. During the development process, Q-
PCR experiments could be used in parallel as a validation tool to detect rare rDNAs and measure quantitative
differences between samples. Only robust rDNAs that produce reliable data would become part of the
community profile used as an indicator for environmental assessments.
As metagenomic profiles are being developed and interpreted, a variety of technical concerns must be
considered, including DNA extraction and PCR biases (e.g. [Liesack et al., 1991], [Reysenbach et al., 1992],
[Haldeman et al., 1994] and [Chandler et al., 1997]), the sampling effort required to characterize diversity
sufficiently (e.g. [Hughes et al., 2001] and [Kemp and Aller, 2004]), and accurate identification of unknown
taxa (e.g. [Kroes et al., 1999], [McCaig et al., 1999] and [Suau et al., 1999]). Clearly, the diversity of OTUs
recovered from amplification libraries depends on PCR conditions. Nevertheless, several observations suggest
the validity of the data reported here. First, the more common OTUs varied in their relative abundance among
the five samples, strongly suggesting that their frequency reflects sample differences rather than amplification
bias. Second, some OTUs were recovered multiple times from one library, while not at all from other libraries,
thus discounting the likelihood that PCR biases explain the recovery of these OTUs. Third, the recovery of
chimeric clones was low (0.02%), suggesting that amplification artifacts were minimal. Q-PCR using primers
intended to be OTU-specific revealed tremendous differences in abundance for a given OTU among the
genomic samples. In these cases, the OTU was always detected in greatest abundance in the genomic sample
which had yielded the clone. Finally, single nucleotide variation at various sites within OTUs, although not
examined extensively in this study, suggests that microdiversity is an important feature of community
organization ([Acinas et al., 2004] and [Fawley et al., 2004]).
The results of this study suggest that metagenomic profiling can be used to characterize ecosystems. Although
there is still much to be learned about the difficulties of adequately sampling diverse ecosystems, effectively
quantifying results, and optimizing methodologies, it is evident that microbial communities can tell us much
about the state of aquatic ecosystems. As the bioindicator potential of aquatic microbial communities is
elucidated, application of this knowledge through methods such as microarrays should provide useful tools for
research, regulatory agencies, and industry.
Acknowledgments:
This work was supported by grant #82946501 and STAR grant # R8316270 from the US Environmental
Protection Agency and funding provided by the UNCG Gene Microarray Applications Project. We thank Lisa
Balser, Larry Cook and David Remington for data collection, analysis and discussion. We also thank two
anonymous reviewers for constructive critiques that improved the manuscript.
References:
Acinas et al., 2004 S.G. Acinas, V. Klepac-Ceraj, D.E. Hunt, C. Pharino, I. Ceraj, D.L. Distel and M.F. Polz,
Fine-scale phylogenetic architecture of a complex bacterial community, Nature 430 (2004), pp. 551–554.
Altschul et al., 1990 S.F. Altschul, W. Gish, W. Miller, E.W. Myers and D.J. Lipman, Basic local alignment
search tool, J. Mol. Biol. 215 (1990), pp. 403–410.
Amann et al., 1995 R.I. Amann, W. Ludwig and K.-H. Schleifer, Phylogenetic identification and in situ
detection of individual microbial cells without cultivation, Microbiol. Rev. 59 (1995), pp. 143–169.
Bahr et al., 1996 M. Bahr, J.E. Hobbie and M.L. Sogin, Bacterial diversity in an arctic lake, a freshwater
SAR11 cluster, Aquat. Microb. Ecol. 11 (1996), pp. 271–277.
Bowers et al., 2000 H.A. Bowers, T. Tengs, H.B. Glasgow, J.M. Burkholder, P.A. Rublee and D.W. Oldach,
Development of real-time PCR assays for rapid detection of Pfiesteria piscicida and related
dinoflagellates, Appl. Environ. Microbiol. 66 (2000), pp. 4641–4648.
Brosius et al., 1981 J. Brosius, T.J. Dull, D.D. Sleeter and H.F. Noller, Gene organization and primary structure
of a ribosomal RNA operon from Escherichia coli, J. Mol. Biol. 148 (1981), pp. 107–127.
Bruce et al., 1992 K.D. Bruce, W.D. Hiorns, J.L. Hobman, A.M. Osborn, P. Strike and D.A. Ritchie,
Amplification of DNA from native populations of soil bacteria by using the polymerase chain reaction,
Appl. Environ. Microbiol. 58 (1992), pp. 3413–3416.
Callieri and Stockner, 2002 C. Callieri and J.G. Stockner, Freshwater autotrophic picoplankton: a review, J.
Limnol. 61 (2002), pp. 1–14.
Casamayor et al., 2002 E.O. Casamayor, C. Pedrós-Alió, G. Muyzer and R. Amann, Microheterogeneity in 16S
ribosomal DNA-defined bacterial populations from a stratified planktonic environment is related to
temporal changes and to ecological adaptations, Appl. Environ. Microbiol. 68 (2002), pp. 1706–1714.
Castiglioni et al., 2004 B. Castiglioni, E. Rizzi, A. Frosini, K. Sivonen, P. Rajaniemi, A. Rantala, M.A. Mugnai,
S. Ventura, A. Wilmotte, C. Boutte, S. Grubisic, P. Balthasart, C. Consolandi, R. Bordoni, A. Mezzelani,
C. Battaglia and G. De Bellis, Development of a universal microarray based on the ligation detection
reaction and 16S rRNA gene polymorphism to target diversity of cyanobacteria, Appl. Environ.
Microbiol. 70 (2004), pp. 7161–7172.
Chao, 1984 A. Chao, Non-parametric estimation of the number of classes in a population, Scand. J. Stat. 11
(1984), pp. 265–270.
Chao et al., 1993 A. Chao, M.-C. Ma and M.C.K. Yang, Stopping rules and estimation for recapture debugging
with unequal failure rates, Biometrika 80 (1993), pp. 193–201.
Chandler et al., 1997 D.P. Chandler, J.K. Fredrickson and F.J. Brockman, Effect of PCR template concentration
on the composition and distribution of total community 16S rDNA clone libraries, Mol. Ecol. 6 (1997),
pp. 475–482.
Colinvaux, 1993 P. Colinvaux, Ecology vol. 2, John Wiley & Sons, Inc., New York (1993).
Colwell and Coddington, 1994 R.K. Colwell and J.A. Coddington, Estimating terrestrial biodiversity through
extrapolation, Phil. Trans. R. Soc. Lond. B 345 (1994), pp. 101–118.
Countway et al., 2005 P.D. Countway, R.J. Gast, P. Savai and D.A. Caron, Protistan diversity estimates based
on 18S rDNA from seawater incubations in the western north Atlantic, J. Eukaryot. Microbiol. 52
(2005), pp. 95–106.
Crump et al., 2003 B.C. Crump, G.W. Kling, M. Bahr and J.E. Hobbie, Bacterioplankton community shifts in
an arctic lake correlate with seasonal changes in organic matter source, Appl. Environ. Microbiol. 69
(2003), pp. 2253–2268.
Curtis et al., 2002 T.P. Curtis, W.T. Sloan and J.W. Scannell, Estimating prokaryotic diversity and its limits,
Proc. Natl. Acad. Sci. U. S. A. 99 (2002), pp. 10494–10499.
Devereux et al., 2006 R. Devereux, P. Rublee, J.H. Paul, K.G. Field and J.W. Santo Domingo, Development
and applications of microbial ecogenomic indicators for monitoring water quality: report of a workshop
assessing the state of the science, research needs and future directions, Environ. Monit. Assess. 116
(2006), pp. 459–479.
Edwards et al., 1989 U. Edwards, T. Rogall, H. Blöcker, M. Emde and E.C. Böttger, Isolation and direct
complete nucleotide determination of entire genes. Characterization of a gene coding for 16S ribosomal
RNA, Nucleic Acids Res. 17 (1989), pp. 7843–7853.
Fawley et al., 2004 M.W. Fawley, K.P. Fawley and M.A. Bucheim, Molecular diversity among communities of
freshwater microchlorophytes, Microb. Ecol. 48 (2004), pp. 489–499.
Fenchel, 2003 T. Fenchel, Biogeography for bacteria, Science 301 (2003), pp. 925–926.
Finlay, 2002 B.J. Finlay, Global dispersal of free-living microbial eukaryote species, Science 296 (2002), pp.
1061–1063.
Fuhrman et al., 2006 J.A. Fuhrman, I. Hewson, M.S. Schwalbach, J.A. Steele, M.V. Brown and S. Naeem,
Annually reoccurring bacterial communities are predictable from ocean conditions, Proc. Natl. Acad. Sci.
U. S. A. 103 (2006), pp. 13104–13109.
Giovannoni et al., 1990 S.J. Giovannoni, T.B. Britshgi, C.L. Moyer and K.G. Field, Genetic diversity in
Sargasso Sea bacterioplankton, Nature 345 (1990), pp. 60–63.
Glöckner et al., 2000 F.O. Glöckner, E. Zaichikov, N. Belkova, L. Denissova, J. Pernthaler, A. Pernthaler and R.
Amann, Comparative 16S rRNA analysis of lake bacterioplankton reveals globally distributed
phylogenetic clusters including an abundant group of Actinobacteria, Appl. Environ. Microbiol. 66
(2000), pp. 5053–5065.
Godon et al., 1997 J.-J. Godon, E. Zumstein, P. Dabert, F. Habouzit and R. Moletta, Molecular microbial
diversity of an aerobic digester as determined by small-subunit rDNA sequence analysis, Appl. Environ.
Microbiol. 63 (1997), pp. 2802–2813.
Good, 1953 I.J. Good, The population frequencies of species and the estimation of population parameters,
Biometrika 40 (1953), pp. 237–262.
Griffin et al., 2002 D.W. Griffin, C.A. Kellogg, V.H. Garrison and E.A. Shinn, The global transport of dust, Am.
Sci. 90 (2002), pp. 228–235.
Haldeman et al., 1994 D.L. Haldeman, P.S. Amy, D.C. White and D.B. Ringelberg, Changes in bacteria
recoverable from subsurface volcanic rock samples during storage at 4 °C, Appl. Environ. Microbiol. 60
(1994), pp. 2697–2703.
Hughes et al., 2001 J.B. Hughes, J.J. Hellmann, T.H. Ricketts and J.M. Bohannan, Counting the uncountable:
statistical approaches to estimating microbial diversity, Appl. Environ. Microbiol. 67 (2001), pp. 4399–
4406.
Hurlbert, 1971 S.H. Hurlbert, The nonconcept of species diversity: a critique and alternative parameters,
Ecology 52 (1971), pp. 577–586.
Kemp and Aller, 2004 P.F. Kemp and J.Y. Aller, Estimating prokaryotic diversity: when are 16S rDNA
libraries large enough?, Limnol. Oceanogr. Methods 2 (2004), pp. 114–125.
Kroes et al., 1999 I. Kroes, P.W. Lepp and D.A. Relman, Bacterial diversity within the human subgingival
crevice, Proc. Natl. Acad. Sci. U. S. A. 96 (1999), pp. 14547–14552.
Liesack et al., 1991 W. Liesack, H. Weyland and E. Stackebrandt, Potential risks of gene amplification by PCR
as determined by 16S rDNA analysis of a mixed-culture of strict barophilic bacteria, Microbial. Ecol. 21
(1991), pp. 191–198.
Lincoln et al., 1998 R. Lincoln, G. Boxshall and P. Clark, A Dictionary of Ecology Evolution and Systematics,
Cambridge University Press, New York (1998).
Lindström, 2001 E.S. Lindström, Investigating influential factors on bacterioplankton community
composition—results from a field study of five mesotrophic lakes, Microb. Ecol. 42 (2001), pp. 598–
608.
López-Garcia et al., 2001 P. López-Garcia, F. Rodriguez-Valera, C. Pedrós-Alió and D. Moreira, Unexpected
diversity of small eukaryotes in deep-sea Antarctic plankton, Nature 409 (2001), pp. 603–607.
Margulies et al., 2005 M. Margulies, M. Egholm, W.E. Altman, S. Attiya, J.S. Bader, L.A. Bemben, J. Berka,
M.S. Braverman, Y.J. Chen and Z. Chen et al., Genome sequencing in microfabricated high-density
picolitre reactors, Nature 437 (2005), pp. 376–380.
McCaig et al., 1999 A.E. McCaig, L.A. Glover and J.I. Prosser, Molecular analysis of bacterial community
structure and diversity in unimproved and improved upland grass pastures, Appl. Environ. Microbiol. 65
(1999), pp. 1721–1730.
Medlin et al., 1988 L. Medlin, H.J. Elwood, S. Stickel and M.L. Sogin, The characterization of enzymatically
amplified eukaryotic 16S-like rRNA-coding regions, Gene 71 (1988), pp. 491–499.
Methé and Zehr, 1999 B.A. Methé and J.P. Zehr, Diversity of bacteria communities in Adirondack lakes: do
species assemblages reflect lake water chemistry?, Hydrobiologia 401 (1999), pp. 77–96.
Moon-van der Staay et al., 2001 S.Y. Moon-van der Staay, R. De Wachter and D. Vaulot, Oceanic 18S rDNA
sequences from picoplankton reveal unsuspected eukaryotic diversity, Nature 409 (2001), pp. 607–610.
Nübel et al., 1999 U. Nübel, F. Garcia-Pichel, M. Kühl and G. Muyzer, Spatial scale and the diversity of benthic
cyanobacteria and diatoms in a salina, Hydrobiologia 401 (1999), pp. 199–206.
O’Brien et al., 1997 W.J. O’Brien, M. Bahr, A.E. Hershey, J.E. Hobbie, G.W. Kipphut, G.W. Kling, H. Kling,
M. McDonald, M.C. Miller, P. Rublee and J.R. Vestal, The limnology of Toolik Lake. In: A.M. Milner
and M.W. Oswood, Editors, Freshwaters of Alaska—Ecological Syntheses, Springer-Verlag Publishers,
New York (1997), pp. 61–106.
Odum, 1971 E.P. Odum, Fundamentals of Ecology, Saunders College Publishing, Philadelphia, PA (1971).
Pace et al., 1986 N.R. Pace, D.A. Stahl, D.J. Lane and G.J. Olsen, The analysis of natural microbial populations
by ribosomal RNA sequences, Adv. Microb. Ecol. 9 (1986), pp. 1–55.
Papke et al., 2003 R.T. Papke, N.B. Ramsing, M.M. Bateson and D.M. Ward, Geographical isolation in hot
springs cyanobacteria, Environ. Microbiol. 5 (2003), pp. 650–659.
Ravenschlag et al., 1999 K. Ravenschlag, K. Sahm, J. Pernthaler and R. Amann, High bacterial diversity in
permanently cold marine sediments, Appl. Environ. Microbiol. 65 (1999), pp. 3982–3989.
Reysenbach et al., 1992 A.L. Reysenbach, L.J. Giver, G.S. Wickham and N.R. Pace, Differential amplification
of rRNA genes by polymerase chain reaction, Appl. Environ. Microbiol. 58 (1992), pp. 3417–3418.
Rubstov et al., 1980 P.M. Rubstov, M.M. Musakhanov, V.M. Zakharyev, A.S. Krayev, K.G. Skryabin and A.A.
Bayev, The structure of the yeast ribosomal RNA genes. I. The complete nucleotide sequence of the 18S
ribosomal RNA gene from Saccharomyces cerevisiae, Nucleic Acids Res. 8 (1980), pp. 5779–5794.
Schaefer, 1997 Schaefer, E.F., 1997. A DNA assay to detect the toxic dinoflagellate Pfiesteria piscicida, and
the application of a PCR based probe. MS Thesis. University of North Carolina, Greensboro.
Schloss and Handelsman, 2005 P.D. Schloss and J. Handelsman, Introducing DOTUR, a computer program for
defining operational taxonomic units and estimating species richness, Appl. Environ. Microbiol. 71
(2005), pp. 1501–1506.
Sogin et al., 2006 M.L. Sogin, H.G. Morrison, J.A. Huber, D.M. Welch, S.M. Huse, P.R. Neal, J.M. Arrieta and
G.J. Herndl, Microbial diversity in the deep sea and the underexplored ―rare biosphere‖, Proc. Natl.
Acad. Sci. 103 (2006), pp. 12115–12120.
Suau et al., 1999 A. Suau, R. Bonnet, M. Sutren, J. Godon, G.R. Gibson, M.D. Collins and J. Doré, Direct
analysis of genes encoding 16S rRNA from complex communities reveals many novel molecular species
within the human gut, Appl. Environ. Microbiol. 65 (1999), pp. 4799–4807.
Thompson et al., 1994 J.D. Thompson, D.G. Higgins and T.J. Gibson, CLUSTAL W: improving the sensitivity
of progressive multiple sequence alignment through sequence weighting, position-specific gap penalties
and weight matrix choice, Nucleic Acids Res. 22 (1994), pp. 4673–4680.
Torsvik et al., 2002 V. Torsvik, L. Øvreås and T.F. Thingstad, Prokaryotic diversity—magnitude, dynamics,
and controlling factors, Science 296 (2002), pp. 1064–1066.
Van Hannen et al., 1999 E.J. Van Hannen, M. Veninga, J. Bloem, H.J. Gons and H.J. Laanbroek, Genetic
changes in the bacterial community structure associated with protistan grazers, Arch. Hydrobiol. 145
(1999), pp. 25–38.
Venter et al., 2004 J.C. Venter, K. Remington, J.F. Heidelberg, A.L. Halpern, D. Rusch, J.A. Eisen, D. Wu, I.
Paulsen, K.E. Nelson, W. Nelson, D.E. Fouts, S. Levy, A.H. Knap, M.W. Lomas, K. Nealson, O. White,
J. Peterson, J. Hoffman, R. Parsons, H. Baden-Tillson, C. Pfannkoch, Y.-H. Rogers and H.O. Smith,
Environmental genome shotgun sequencing of the Sargasso Sea, Science 304 (2004), pp. 66–74.
von Mering et al., 2007 C. von Mering, P. Hugenholtz, J. Raes, S.G. Tringe, T. Doerks, L.J. Jensen, N. Ward
and P. Bork, Quantitative phylogenetic assessment of microbial communities in diverse environments,
Science 315 (2007), pp. 1126–1130.
Ward et al., 1990 D.M. Ward, R. Weller and M.M. Bateson, 16S rRNA sequences reveal numerous uncultured
microorganisms in a natural community, Nature 345 (1990), pp. 63–65.
Wetzel, 1983 R.G. Wetzel, Limnology, CBS College Publishing, New York (1983).
Whitaker et al., 2003 R.J. Whitaker, D.W. Grogan and J.G. Taylor, Geographic barriers isolate endemic
populations of hyperthermophilic archaea, Science 301 (2003), pp. 976–978.
Wilson et al., 2000 K.M. Wilson, M.A. Schembri, P.D. Baker and C.P. Saint, Molecular characterization of the
Toxic cyanobacterium Cylindrospermopsis raciborskii and design of a species-specific PCR, Appl.
Environ. Microbiol. 66 (2000), pp. 332–338.
Zwart et al., 2002 G. Zwart, B.C. Crump, M.P. Kamst-van Agterveld, F. Hagen and S.K. Han, Typical
freshwater bacteria: an analysis of available 16S rRNA gene sequences from plankton of freshwater
lakes and rivers, Aquat. Microb. Ecol. 28 (2002), pp. 141–155.
Zwart et al., 1998 G. Zwart, W.D. Hiorns, B.A. Methé, M.P. van Agterveld, R. Huismans, S.C. Nold, J.P. Zehr
and H.J. Laanbroek, Nearly identical 16S rRNA sequences recovered from lakes in North America and
Europe indicate the existence of clades of globally distributed freshwater bacteria, Syst. Appl. Microbiol.
21 (1998), pp. 546–556.


![Saizen [somatropin (rDNA origin) for injection] … · Saizen® [somatropin (rDNA origin) for injection] cool.click](https://img.dokumen.tips/doc/110x75/5b8977fc7f8b9abe1e8db089/saizen-somatropin-rdna-origin-for-injection-saizen-somatropin-rdna-origin.jpg)