Embed Size (px)
Citation preview
Ge Lin,1 Ph.D.; Gregory Elmes,2 Ph.D.; Mike Walnoha,2 M.A.; and Xiannian Chen,2 M.S.
Developing a Spatial-Temporal Methodfor the Geographic Investigation ofShoeprint Evidence
ABSTRACT: This article examines the potential of a spatial-temporal method for analysis of forensic shoeprint data. The large volume of shoe-print evidence recovered at crime scenes results in varied success in matching a print to a known shoe type and subsequently linking sets of matchedprints to suspected offenders. Unlike DNA and fingerprint data, a major challenge is to reduce the uncertainty in linking sets of matched shoeprintsto a suspected serial offender. Shoeprint data for 2004 were imported from the Greater London Metropolitan Area Bigfoot database into a geographicinformation system, and a spatial-temporal algorithm developed for this project. The results show that by using distance and time constraints interac-tively, the number of candidate shoeprints that can implicate one or few suspects can be substantially reduced. It concludes that the use of space-timeand other ancillary information within a geographic information system can be quite helpful for forensic investigation.
KEYWORDS: forensic science, shoeprints, matching, geographic information systems, space-time algorithm, burglary, serial crime, forensicdatabase
The use of geographic information systems (GIS) in the criminaljustice field has its roots in an earlier generation of police crimemapping (1,2). Functions such as hot spot analysis, time-seriesmapping, and pattern detection have become an integral part ofcrime pattern analysis (3–5). Integration of such spatial analysistools within GIS have resulted in new opportunities for analysis offorensic evidence. While there is a clear advantage to using GISfor crime mapping, GIS applications for forensic and crime sceneinvestigation have rarely been explored. Although fingerprints arethe most prevalent impression evidence, shoeprints, tool marks, andtire tracks are routinely collected at crime scenes. While fingerprintevidence provides a greater than 95% probability of linking a sus-pect to a crime scene, shoeprints and other impressions have amuch lower probability of positive association between evidenceand offender. Improved information can enhance the level of confi-dence and lead to either a positive identification or an exonerationof a suspect (6). In this article, we demonstrate how GIS analysiscan enhance the matching of shoeprint evidence.
Shoeprint evidence is sometimes overlooked, even though crimi-nals presumably leave impressions routinely when entering andexiting crime scenes. A lack of focus on the search for, collection,and preservation of shoeprint evidence lowers the recovery rates ofshoeprint evidence relative to fingerprints. According to a 2004London Metropolitan Police report, the evidence recovery rate forshoeprints was 12.4% as opposed to 19% for fingerprints. Thereport stated that, with greater attention, the recovery rate of shoe-prints can be raised to 30% for burglaries (7). In contrast to finger-prints, shoeprints are much less likely to be consideredunique. Consequently, even though criminals make little attemptto mask their footwear, investigators may overlook shoeprint
evidence at crime scenes (8). The previous lack of attention toshoeprints in criminal investigations presents an opportunity toenhance the value of shoeprint evidence and its use in the appre-hension of criminals (9).
Identical or similar shoeprints are frequent and without siftingout unrelated shoeprints it is difficult to establish connectionsbetween a shoeprint and a suspect. Forensic principles often lookfor a match between evidence and suspect beyond a reasonabledoubt and most shoeprint evidence does not meet such a high stan-dard. For example, if two matched size 10 Nike prints are found attwo different crime scenes, it may be inferred that the two werelinked, but it cannot be certain that the crimes were committed bythe same suspect. Crime mapping, which draws spatial statisticalinference from spatial patterns, can provide some clues for investi-gating forensic evidence patterns. For example, most crimes areassociated with a criminal’s activity space—the area he or she ismost familiar with (10). If a neighborhood appears as a crime hotspot on a map, it may be inferred that repeat offenders may live orwork in close proximity to that location. Local residents can usetheir mental maps and this hot spot information to avoid certainareas, while police can identify hot spots with GIS and allocatemore resources to crime hot spots (3,11). Forensic investigators arealso likely to benefit from crime mapping because inferential infor-mation, such as the distance and time of crimes for sets of matchedshoeprints, can be readily displayed and related to others.
Crime mapping and spatial inference can contribute to forensicshoeprint matching in four ways. First, clusters exist at the street,neighborhood, and city scales and the relative importance of factorsthat influence hot spots at the street scale differ from those thatinfluence hot spots at the neighborhood or city scale (11,12). Thebloody shoeprints found at the scene of the double murder ofNicole Brown Simpson and Ronald Goldman, for example, weredeemed to be from a relatively rare Bruno Magli ‘‘Lorenzo’’ modelsize 12 boot (13). Even in a city the size of Los Angeles it is likelythat few individuals would wear the same model and size of BrunoMagli shoes, but if we enlarge the area to nationwide, we may find
1Department of Health Services Research & Administration, University ofNebraska Medical Center, Omaha, NE 68198-4350.
2Department of Geology and Geography, West Virginia University,Morgantown, WV 26506-6300.
Received 8 Dec. 2007; and in revised form 30 May 2008; accepted 13July 2008.
J Forensic Sci, January 2009, Vol. 54, No. 1doi: 10.1111/j.1556-4029.2008.00913.x
Available online at: www.blackwell-synergy.com
152 � 2008 American Academy of Forensic Sciences

that scores of individuals owned a pair. In fact it was determinedthat only 29 pairs of black, size 12, Lorenzo Bruno Magli shoeshad been sold in the U.S. (13). Secondly, crimes occur in differenttime frames and one can exclude some evidence on the grounds oftime constraints. If two crime scenes are 10 miles apart it would beimpossible for the same person to be involved if they were knownto be committed only 5 min apart. Thirdly, crimes can be groupedby frequency on the basis of location or certain types of individuals(11). Because many crimes are committed by a repeat offenderwho commits at least three offenses, geographically connected andmatched evidence can be useful for identifying related crimescenes. Finally, shoeprint retrievals at crime scenes are oftenenhanced and stored as images in a database that also includesinformation on type of crime, mode of entry, date and time of sus-pected crime occurrence, geographic coordinates of a crime scene,etc. (14,15). This ancillary information can enhance the value ofthe forensic evidence. Alexandre (7) lists three common uses for ashoeprint database: (i) determine the brand and type of shoe thatleft the impression at the crime scene; (ii) compare identifiedimpressions with suspects’ shoes; and (iii) demonstrate that a partic-ular impounded shoe left the shoeprint at the scene. In this article,we provide an additional way of utilizing shoeprints by using aGIS for spatial inference of shoeprint clustering.
Data and Geospatial Issues for Shoeprint Investigation
A forensic shoeprint dataset was extracted from the Bigfoot data-base maintained by the Forensic Analysis Unit of the MetropolitanPolice Service in London, England (16). The Bigfoot database con-tains c. 10% of all crime sites in the Metropolitan district and since1997, more than 10,000 shoeprints have been recorded per year.When forensic evidence is collected it is usually photographed,or gelled and then entered into an image database along with the geo-graphic coordinates of the site. Criteria for matching shoeprints arebased on the same guidelines as fingerprints. In other words, a pair ofmatched shoeprints should have identical brand name, model, size,
and degree of wear. If two shoeprints have an identical name-model-size combination, but different wear, they are coded as being similarto each other, but not identical. If a serial offender wore two types ofshoes, and both types are matched multiple times, the two types ofshoeprints are treated as worn by two ‘‘separate offenders.’’
This study is based on data recorded for c. 100,000 burglaries in2004. A total of 10,096 shoeprints were recovered for the year2004. Of those, 9210 were assigned shoeprint codes, and 886 werecoded ‘‘unknown,’’ which were excluded from the analysis. Forthose with a known name and brand, the real shoeprint label waschanged to protect the confidentiality of the data. Figure 1 providesa sample of 201 ‘‘MARK175’’ shoeprints in the database from 33London boroughs and it is inconceivable that all of them were leftby a single suspect. The challenge is how to group them so thatone suspect is likely to be associated with each group of shoeprintsthat has an identical brand, model, size, and wear.
To perform spatial analysis on the massive shoeprint database,we need to assess several geospatial issues for shoeprint data. Thefirst issue is that an area with a high concentration of crime doesnot necessarily have a concomitantly high concentration of forensicevidence. The amount of forensic evidence depends on how muchevidence remains at the crime scene and how much effort is madeto recover that evidence. Before analyzing a particular set of evi-dence geographically, one should establish quality measures, suchas certain ground conditions that may be more likely to imprintshoe marks than others. Shoeprint data quality may be assessed bythe number recovered, coded by brand names and model number.This leads to the ‘‘recognizable impression rate,’’ the ratio ofclearly coded shoeprints to the total number of shoeprints in a geo-graphic area. A high recognizable impression rate is associated withhigh quality shoeprint evidence, which is related to shoeprint wear,ground conditions, evidence preservation methods, and shoeprintimpression generating processes. A second measure is the ‘‘recov-ery rate,’’ the ratio of the total number of shoeprint evidencerecords and the total number of crimes in a geographic unit. Ifrecovery rates across boroughs are fairly evenly distributed, it
FIG. 1—MARK175 shoeprints distribution in London metropolitan area.
LIN ET AL. • SPATIAL-TEMPORAL INVESTIGATION OF SHOEPRINT EVIDENCE 153
implies that the collection was without operational and environmen-tal constraints. The spatial distribution of prints can be consideredunbiased. In the preliminary assessment of data quality, we disag-gregated the 10,096 shoeprints to the 33 metro-London boroughsand divided them by burglary incidences from March 2004 to Feb-ruary 2005 for each borough. We found a recovery rate of about10% for each borough, and there is no spatial clustering of recov-ery rates or bias toward a few boroughs.
The second issue is that shoeprint evidence can be classifiedaccording to rarity. Many shoeprints with the same size and similarpatterns of wear will be found for a common brand and model. Fora forensic investigator, the problem is not about matching shoe-prints for a rare brand and model, because they face much lessresistance to be admitted as evidence. When a large number ofmatched shoeprints are presented, their admissibility as evidencecould be problematic. Hence, it becomes a challenge for a forensicinvestigator to connect the matched prints for a common brand andmodel from a relatively large number of crime scenes. Tradition-ally, shoeprints were connected through a descriptive report, mostlyfor rare brands, leaving a large number of matched shoeprintsunderutilized (7,8). When these more common shoeprints are in aGIS database, several methods can be used to enhance their usabil-ity. For instance, the probability of similar impressions being fromthe exact same shoes decreases with distance. Based on the conceptof journey-to-crime, a space-time constraint can be set out torestrict the scope of matched evidence. If two matched shoeprintsare too far apart for a given distance-time constraint among 201matched shoeprints in Fig. 1, then the two shoeprints should notpoint to the same suspect, or one print should be excluded from afocused analysis.
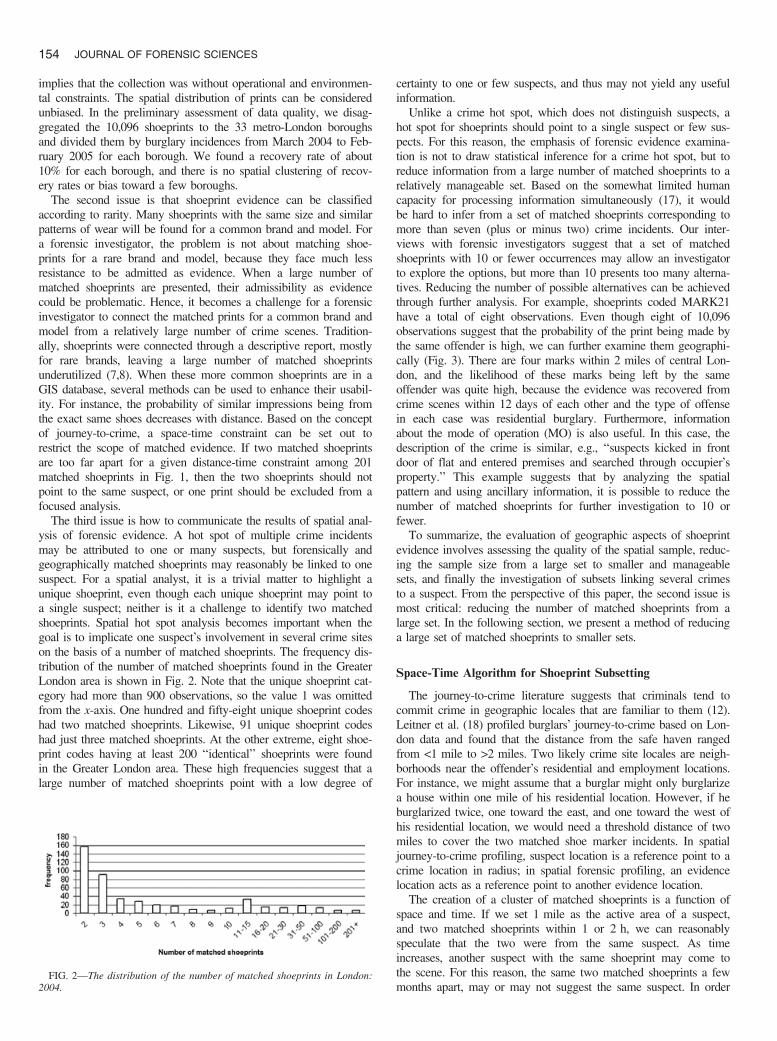
The third issue is how to communicate the results of spatial anal-ysis of forensic evidence. A hot spot of multiple crime incidentsmay be attributed to one or many suspects, but forensically andgeographically matched shoeprints may reasonably be linked to onesuspect. For a spatial analyst, it is a trivial matter to highlight aunique shoeprint, even though each unique shoeprint may point toa single suspect; neither is it a challenge to identify two matchedshoeprints. Spatial hot spot analysis becomes important when thegoal is to implicate one suspect’s involvement in several crime siteson the basis of a number of matched shoeprints. The frequency dis-tribution of the number of matched shoeprints found in the GreaterLondon area is shown in Fig. 2. Note that the unique shoeprint cat-egory had more than 900 observations, so the value 1 was omittedfrom the x-axis. One hundred and fifty-eight unique shoeprint codeshad two matched shoeprints. Likewise, 91 unique shoeprint codeshad just three matched shoeprints. At the other extreme, eight shoe-print codes having at least 200 ‘‘identical’’ shoeprints were foundin the Greater London area. These high frequencies suggest that alarge number of matched shoeprints point with a low degree of
certainty to one or few suspects, and thus may not yield any usefulinformation.
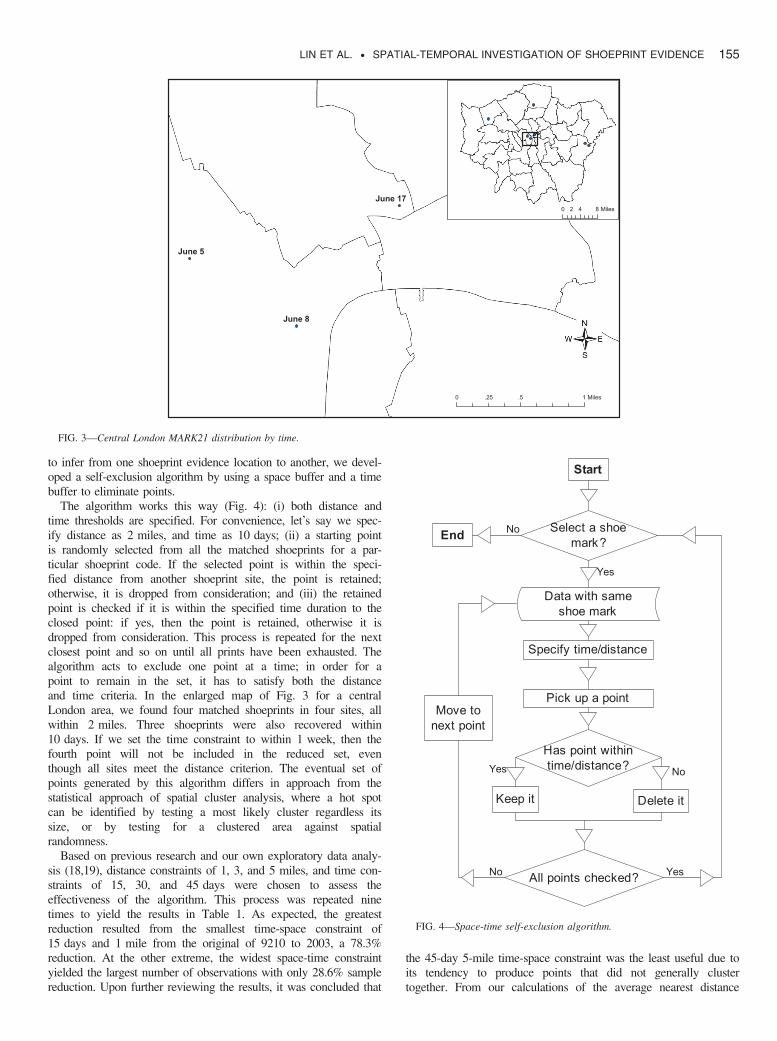
Unlike a crime hot spot, which does not distinguish suspects, ahot spot for shoeprints should point to a single suspect or few sus-pects. For this reason, the emphasis of forensic evidence examina-tion is not to draw statistical inference for a crime hot spot, but toreduce information from a large number of matched shoeprints to arelatively manageable set. Based on the somewhat limited humancapacity for processing information simultaneously (17), it wouldbe hard to infer from a set of matched shoeprints corresponding tomore than seven (plus or minus two) crime incidents. Our inter-views with forensic investigators suggest that a set of matchedshoeprints with 10 or fewer occurrences may allow an investigatorto explore the options, but more than 10 presents too many alterna-tives. Reducing the number of possible alternatives can be achievedthrough further analysis. For example, shoeprints coded MARK21have a total of eight observations. Even though eight of 10,096observations suggest that the probability of the print being made bythe same offender is high, we can further examine them geographi-cally (Fig. 3). There are four marks within 2 miles of central Lon-don, and the likelihood of these marks being left by the sameoffender was quite high, because the evidence was recovered fromcrime scenes within 12 days of each other and the type of offensein each case was residential burglary. Furthermore, informationabout the mode of operation (MO) is also useful. In this case, thedescription of the crime is similar, e.g., ‘‘suspects kicked in frontdoor of flat and entered premises and searched through occupier’sproperty.’’ This example suggests that by analyzing the spatialpattern and using ancillary information, it is possible to reduce thenumber of matched shoeprints for further investigation to 10 orfewer.
To summarize, the evaluation of geographic aspects of shoeprintevidence involves assessing the quality of the spatial sample, reduc-ing the sample size from a large set to smaller and manageablesets, and finally the investigation of subsets linking several crimesto a suspect. From the perspective of this paper, the second issue ismost critical: reducing the number of matched shoeprints from alarge set. In the following section, we present a method of reducinga large set of matched shoeprints to smaller sets.
Space-Time Algorithm for Shoeprint Subsetting
The journey-to-crime literature suggests that criminals tend tocommit crime in geographic locales that are familiar to them (12).Leitner et al. (18) profiled burglars’ journey-to-crime based on Lon-don data and found that the distance from the safe haven rangedfrom <1 mile to >2 miles. Two likely crime site locales are neigh-borhoods near the offender’s residential and employment locations.For instance, we might assume that a burglar might only burglarizea house within one mile of his residential location. However, if heburglarized twice, one toward the east, and one toward the west ofhis residential location, we would need a threshold distance of twomiles to cover the two matched shoe marker incidents. In spatialjourney-to-crime profiling, suspect location is a reference point to acrime location in radius; in spatial forensic profiling, an evidencelocation acts as a reference point to another evidence location.
The creation of a cluster of matched shoeprints is a function ofspace and time. If we set 1 mile as the active area of a suspect,and two matched shoeprints within 1 or 2 h, we can reasonablyspeculate that the two were from the same suspect. As timeincreases, another suspect with the same shoeprint may come tothe scene. For this reason, the same two matched shoeprints a fewmonths apart, may or may not suggest the same suspect. In order
FIG. 2—The distribution of the number of matched shoeprints in London:2004.
154 JOURNAL OF FORENSIC SCIENCES
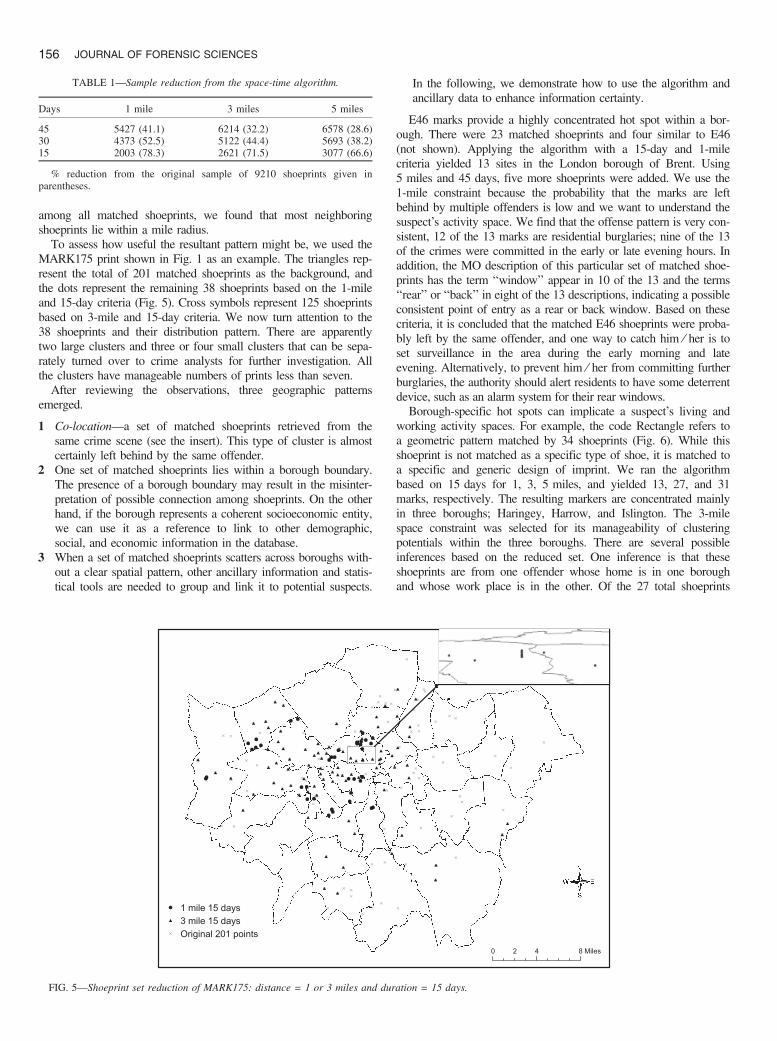
to infer from one shoeprint evidence location to another, we devel-oped a self-exclusion algorithm by using a space buffer and a timebuffer to eliminate points.
The algorithm works this way (Fig. 4): (i) both distance andtime thresholds are specified. For convenience, let’s say we spec-ify distance as 2 miles, and time as 10 days; (ii) a starting pointis randomly selected from all the matched shoeprints for a par-ticular shoeprint code. If the selected point is within the speci-fied distance from another shoeprint site, the point is retained;otherwise, it is dropped from consideration; and (iii) the retainedpoint is checked if it is within the specified time duration to theclosed point: if yes, then the point is retained, otherwise it isdropped from consideration. This process is repeated for the nextclosest point and so on until all prints have been exhausted. Thealgorithm acts to exclude one point at a time; in order for apoint to remain in the set, it has to satisfy both the distanceand time criteria. In the enlarged map of Fig. 3 for a centralLondon area, we found four matched shoeprints in four sites, allwithin 2 miles. Three shoeprints were also recovered within10 days. If we set the time constraint to within 1 week, then thefourth point will not be included in the reduced set, eventhough all sites meet the distance criterion. The eventual set ofpoints generated by this algorithm differs in approach from thestatistical approach of spatial cluster analysis, where a hot spotcan be identified by testing a most likely cluster regardless itssize, or by testing for a clustered area against spatialrandomness.
Based on previous research and our own exploratory data analy-sis (18,19), distance constraints of 1, 3, and 5 miles, and time con-straints of 15, 30, and 45 days were chosen to assess theeffectiveness of the algorithm. This process was repeated ninetimes to yield the results in Table 1. As expected, the greatestreduction resulted from the smallest time-space constraint of15 days and 1 mile from the original of 9210 to 2003, a 78.3%reduction. At the other extreme, the widest space-time constraintyielded the largest number of observations with only 28.6% samplereduction. Upon further reviewing the results, it was concluded that
the 45-day 5-mile time-space constraint was the least useful due toits tendency to produce points that did not generally clustertogether. From our calculations of the average nearest distance
FIG. 3—Central London MARK21 distribution by time.
FIG. 4—Space-time self-exclusion algorithm.
LIN ET AL. • SPATIAL-TEMPORAL INVESTIGATION OF SHOEPRINT EVIDENCE 155
among all matched shoeprints, we found that most neighboringshoeprints lie within a mile radius.
To assess how useful the resultant pattern might be, we used theMARK175 print shown in Fig. 1 as an example. The triangles rep-resent the total of 201 matched shoeprints as the background, andthe dots represent the remaining 38 shoeprints based on the 1-mileand 15-day criteria (Fig. 5). Cross symbols represent 125 shoeprintsbased on 3-mile and 15-day criteria. We now turn attention to the38 shoeprints and their distribution pattern. There are apparentlytwo large clusters and three or four small clusters that can be sepa-rately turned over to crime analysts for further investigation. Allthe clusters have manageable numbers of prints less than seven.
After reviewing the observations, three geographic patternsemerged.
1 Co-location—a set of matched shoeprints retrieved from thesame crime scene (see the insert). This type of cluster is almostcertainly left behind by the same offender.
2 One set of matched shoeprints lies within a borough boundary.The presence of a borough boundary may result in the misinter-pretation of possible connection among shoeprints. On the otherhand, if the borough represents a coherent socioeconomic entity,we can use it as a reference to link to other demographic,social, and economic information in the database.
3 When a set of matched shoeprints scatters across boroughs with-out a clear spatial pattern, other ancillary information and statis-tical tools are needed to group and link it to potential suspects.
In the following, we demonstrate how to use the algorithm andancillary data to enhance information certainty.
E46 marks provide a highly concentrated hot spot within a bor-ough. There were 23 matched shoeprints and four similar to E46(not shown). Applying the algorithm with a 15-day and 1-milecriteria yielded 13 sites in the London borough of Brent. Using5 miles and 45 days, five more shoeprints were added. We use the1-mile constraint because the probability that the marks are leftbehind by multiple offenders is low and we want to understand thesuspect’s activity space. We find that the offense pattern is very con-sistent, 12 of the 13 marks are residential burglaries; nine of the 13of the crimes were committed in the early or late evening hours. Inaddition, the MO description of this particular set of matched shoe-prints has the term ‘‘window’’ appear in 10 of the 13 and the terms‘‘rear’’ or ‘‘back’’ in eight of the 13 descriptions, indicating a possibleconsistent point of entry as a rear or back window. Based on thesecriteria, it is concluded that the matched E46 shoeprints were proba-bly left by the same offender, and one way to catch him ⁄ her is toset surveillance in the area during the early morning and lateevening. Alternatively, to prevent him ⁄ her from committing furtherburglaries, the authority should alert residents to have some deterrentdevice, such as an alarm system for their rear windows.
Borough-specific hot spots can implicate a suspect’s living andworking activity spaces. For example, the code Rectangle refers toa geometric pattern matched by 34 shoeprints (Fig. 6). While thisshoeprint is not matched as a specific type of shoe, it is matched toa specific and generic design of imprint. We ran the algorithmbased on 15 days for 1, 3, 5 miles, and yielded 13, 27, and 31marks, respectively. The resulting markers are concentrated mainlyin three boroughs; Haringey, Harrow, and Islington. The 3-milespace constraint was selected for its manageability of clusteringpotentials within the three boroughs. There are several possibleinferences based on the reduced set. One inference is that theseshoeprints are from one offender whose home is in one boroughand whose work place is in the other. Of the 27 total shoeprints
TABLE 1—Sample reduction from the space-time algorithm.
Days 1 mile 3 miles 5 miles
45 5427 (41.1) 6214 (32.2) 6578 (28.6)30 4373 (52.5) 5122 (44.4) 5693 (38.2)15 2003 (78.3) 2621 (71.5) 3077 (66.6)
% reduction from the original sample of 9210 shoeprints given inparentheses.
FIG. 5—Shoeprint set reduction of MARK175: distance = 1 or 3 miles and duration = 15 days.
156 JOURNAL OF FORENSIC SCIENCES

that remain from the 3-mile buffer, 23 are residential burglaries,and 16 indicated forced entries by smashing windows or forcingopen windows or doors. In particular, a cluster of residentialburglaries exists in the borough of Harrow and seven of the 11residential burglaries were committed during the workday(7:30 am–5:00 pm) and are tightly clustered, revealing some consis-tency within that particular borough. A similar pattern exists forHaringey borough with the smallest space constraint. The smallerdistance range suggests nonresidential, because industrial parks arezoned in smaller areas. In fact, four out of the five points werenonresidential burglaries in this borough and all four occurred inthe evening or early morning hours, as opposed to usual workdayhours. In addition, these four points are not very tightly clustered intime. A lead can be reasonably pursued for one suspect in twolocations, one in the suspect’s residential location, and the other inthe suspect’s work location.
Conclusion
The current study explores ways to use a GIS to improve theusefulness of forensic data for crime analysts. As forensic andcrime data are often related in a geographic context, we were ableto use some existing crime mapping analysis techniques, such asjourney to crime, residential and work location inferences, andspace-time constraints. Although the quality of forensic data isassessed by a high confidence in matching, not all forensic dataachieve the desired quality level. DNA and fingerprint matchesoften lead to one-to-one linkage of a crime scene to a suspect with100% certainty, but forensic evidence from industrial products,such as shoe marks and tool marks, can often have multiplematches, and how to reduce a set of evidence with multiplematches poses a challenge for crime analysts. We demonstrate thatthe use of space-time information within a geographic informationsystem in these situations can be quite helpful.
Shoe impressions from burglaries in the Greater London areawere used to demonstrate the space-time algorithm that reduces a
relatively large set of matched shoe impressions to manageablesubsets based on distance and time constraints. A range of diame-ters, such as 1, 3, and even 5 miles represented the residentialactive space for a suspect. Although a habitual burglar can commita crime anytime during a year, from the point of apprehending thesuspect, the most useful information is derived from activitieswithin a short duration, and we found that 15 days in combinationwith a distance threshold of 1 or 3 miles often yield the most man-ageable subsets. In general, large numbers of common shoeprints(e.g., more than 200) require a shorter distance to break them tomanageable subsets of 7–10 clustered points. For a small set ofmatched shoeprints (e.g., 50 or fewer), reducing a distance con-straint from 3 to 1 mile usually has little effect on the eliminationof points from the original set. Although these results are contextdependent—Greater London in 2004—they serve as a basis to gen-erate some empirical tables for useful space time constraints. In thisway, crime analysts from different places can refer to differentspace-time criteria for disentangling large geo-spatial forensic evi-dence databases.
Although it is not an emphasis of the current study, we evaluatedthe data quality of the shoeprint dataset. In so doing, we neededto distinguish conceptual differences of crime rate from forensicevidence recovery rate in general, and recognizable impression ratefrom impression evidence in particular. The spatial analysis of thecurrent study is based on the assumption that forensic evidence isevenly recovered over geographic space, and all impression evi-dence is treated with the same quality standard. Although we donot observe general violations of these assumptions, the resultscould be biased if evidence from one area is more often recoveredthan evidence from another area. We also point out conceptual dif-ferences of a crime hot spot versus a forensic evidence hot spot inreference to a repeat offender. In addition, ancillary informationwithin an administrative boundary should be used with caution.The results could be interpreted differently if borough boundariesare defined arbitrarily without sociodemographic and zoning impli-cations. Future studies should evaluate how a crime analysis may
FIG. 6—Borough-specific pattern Reg: distance = 3 miles and duration = 15 days in box.
LIN ET AL. • SPATIAL-TEMPORAL INVESTIGATION OF SHOEPRINT EVIDENCE 157
operate based on different assumptions, such as geographic dispar-ity in evidence recoveries.
Finally, the current study demonstrates only one type of GISanalysis, space-time, for one type of forensic evidence, shoeprints.There are many types of GIS analysis, such as the geographicaccuracy of evidence collection, registration, and referencing thatcan be readily used or integrated with crime scene sketching orcomputer-aided design (CAD) technologies. This study providesthe basis for an analytical approach that can be used for spatialanalysis of other forensic evidence.
Acknowledgments
The research was supported by US Department of Justice,Office of Justice Programs, West Virginia University ForensicScience Initiative, Award Number: 2003-RC-CX-K001. Wegratefully acknowledge the assistance of C. Leist and B. Milne,Forensic Analysis Unit, Metropolitan Police Service, in acquir-ing the shoeprint data.
References
1. Block CR, Dabdoub M, Fregly S, editors. Crime analysis through com-puter mapping. Washington, DC: Police Executive Research Forum,1995.
2. Harries K. Mapping crime: principle and practice. Washington, DC:U.S. Department of Justice, National Institute of Justice, 1999.
3. Craglia M, Haining R, Wiles P. A comparative evaluation of approachesto urban crime pattern analysis. Urban Stud 2000;37(4):711–30.
4. Chainey S, Ratcliffe J. GIS and crime mapping. West Sussex: JohnWiley and Sons, 2005.
5. Levine N. CrimeStat: a spatial statistics program for the analysis ofcrime incident locations (v 3.1). Houston, TX: Ned Levine & Associ-ates. Washington, DC: National Institute of Justice, 2007.
6. Hamm ED. Track identification: an historical overview. J Forensic Iden-tif 1989;39(6):333–8.
7. Alexandre G. Computerized classification of the shoeprints of burglars’soles. Forensic Sci Int 1996;82:59–65.
8. Hilderbrand D. Footwear, the missed evidence. Wildomar, CA: StaggsPublishing, 1999.
9. Ashley W. What shoe was that? The use of computerized image data-base to assist in identification. Forensic Sci Int 1996;82(1):7–20.
10. Cohen L, Felson M. Social change and crime rate trends: a routineactivity approach. Am Sociol Rev 1979;44(4):588–608.
11. Eck JE, Chainey S, Cameron JG, Leitner M, Wilson RE. Mappingcrime: understanding hot spots. Washington, DC: U.S. Department ofJustice, National Institute of Justice, 2005;1–13.
12. Gore RZ, Pattavina A. Applications for examining the journey-to-crimeusing incident-based offender residence probability surfaces. Police Q2004;7(4):457–74.
13. CNN Webpage US story 1997. Judge allows new shoe photo in Simpsontrial. Available at: http://www.cnn.com/US/9701/06/simpson/ (lastaccessed April 2008).
14. Geradts Z, Keijzer J. The image-database REBEZO for shoeprints withdevelopments on automatic classification of shoe outsole designs. Foren-sic Sci Int 1996;82(1):21–31.
15. Geradts Z, Bijhold J. Content based information retrieval in forensicimage databases. J Forensic Sci 2002;47(2):285–92.
16. Milne R. Operation bigfoot—a volume crime database project. Sci Jus-tice 2001;41(3):215–8.
17. Miler GA. The magical number seven, plus or minus two: some limitson our capacity for processing information. Psychol Rev 1956;63(2):81–97.
18. Leitner M, Kent J, Oldfield I, Swoope E. Geoforensic analysis revis-ited—the application of Newton’s geographic profiling method to serialburglaries in London, UK. Police Pract Res, Int J 2007;8(4):359–70.
19. Polvi N, Looman T, Humphries C, Pease K. Repeat break-and-enter vic-timizations: time-course and crime prevention opportunity. J Police SciAdm 1990;17:8–11.
Additional information and reprint requests:Gregory Elmes, Ph.D.Professor, Department of Geology and Geography330 Brooks HallP.O. Box 6300West Virginia UniversityMorgantownWV 26506E-mail: [email protected]
158 JOURNAL OF FORENSIC SCIENCES


![AUTOMATIC EXTRACTION OF SPATIO -TEMPORAL …temporal and geographic information extracted from documents and recorded in temporal and geographic document profiles. [13] Presented a](https://img.dokumen.tips/doc/110x75/60417bbbe7be4b58d3219a6d/automatic-extraction-of-spatio-temporal-temporal-and-geographic-information-extracted.jpg)


![Geographic Differences in Temporal Incidence Trends of ... · Geographic Differences in Temporal Incidence Trends of ... [PYO]), 371 HCV incident ... leading to the loss of data on](https://img.dokumen.tips/doc/110x75/5b08e8eb7f8b9a520e8d616f/geographic-differences-in-temporal-incidence-trends-of-differences-in-temporal.jpg)