Embed Size (px)
Citation preview
Detroit Multi-pollutant Pilot Project: CMAS 2009
Chapel Hill, NCOct 20, 2009

Team Members• Karen Wesson• Madeleine Strum• Marc Houyoux• Rich Mason• Lee Tooly• Tesh Rao• Louise Camalier1
• Sharon Phillips
• James Thurman• Elineth Torres• Robin Langdon2
• Darryl Weatherhead• Larry Sorrels• Mark Morris• Neal Fann
Assistance from outside OAQPS includes MDEQ, SEMCOG, LADCO, OTAQ, CAMD, & ORD.
2
1 Current on sabbatical to Johns Hopkins2 No longer at EPA
3
Detroit Multi-pollutant Pilot Project: Overview
• NRC report recommended “Air Quality Management in the United States (2004)”:– … that the United States transition from a pollutant-by-pollutant
approach to air quality management to a multi-pollutant, risk-based approach . . .
• In response, EPA is investigating the application our technical tools/methods in a multi-pollutant, risk-based approach to control strategy development.
We selected the Detroit urban area as a testbed to apply and evaluate MP tools & compare a MP-based control strategy to a SIP-based control strategy.
Goal: To get reductions at the monitors for PM2.5 & O3 to meet the current standards, AND also reduce PM2.5, O3 & HAP exposure across domain, especially in densely populated areas.
4
Detroit Multi-pollutant Pilot Project: Highlights
• This project is our 1st assessment of a Multi-Pollutant, Risk-Based approach to developing control strategies and comparison to a SIP-based approach.
• Showed the value of . . .– Developing a MP modeling platform for the Detroit urban area; and – Understanding the MP nature of air quality issues in this area through formal
development of a “Conceptual Model”– Collecting local-scale information including emissions, AQ modeling, control and
health data
• Demonstrated that our “Multi-pollutant, Risk-Based” (MPRB) Control Strategy achieved:– Same or greater reductions of PM2.5 & O3 at monitors– Improved air quality regionally and across urban core for O3, PM2.5, and
selected air toxics– Approximately 2x greater benefits for PM2.5 & O3
– Reduction in non-cancer risk– More cost effective and beneficial
4
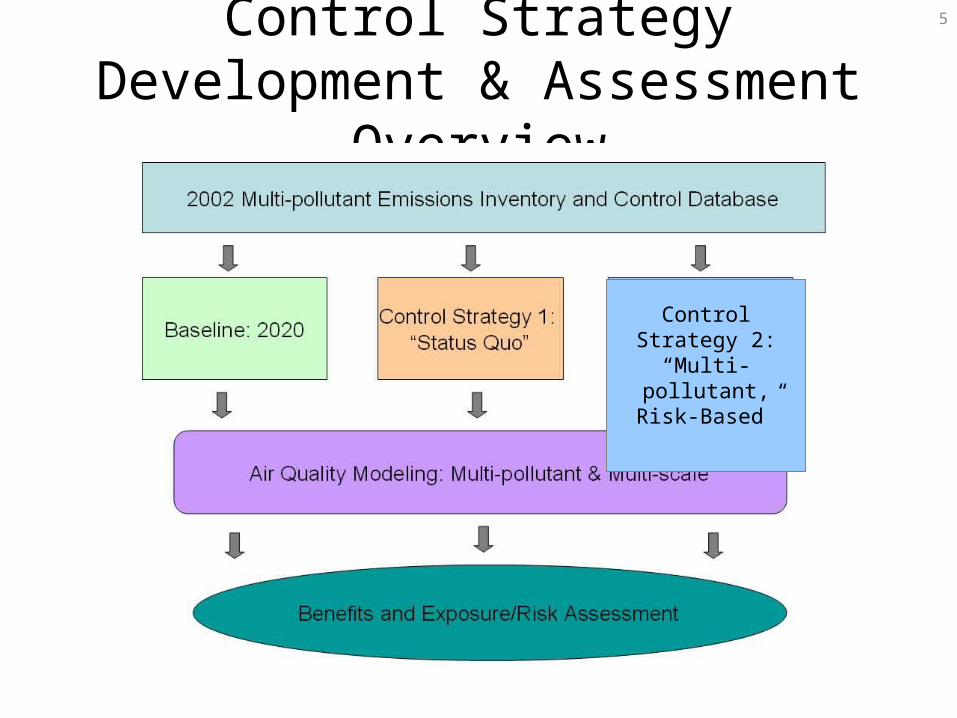
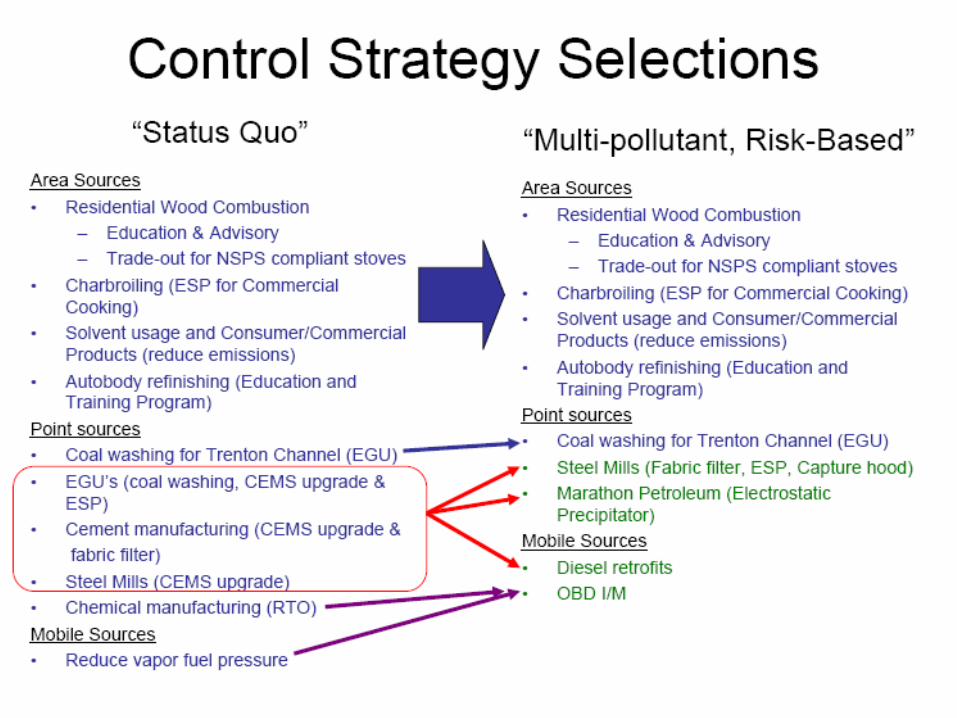
Control Strategy Development & Assessment Overview
Control Strategy 2: “Multi-pollutant,
Risk-Based”
5
Control Strategy 1: “Status Quo”
• “Status Quo” because controls were selected to achieve separate O3 and PM2.5 attainment goals based on least-cost criteria– PM2.5 Controls from EPA PM2.5 NAAQS RIA 15/35– O3 Controls from MDEQ Draft O3 SIP Strategy Plan for 85 ppb NAAQS
• However, controls were “multi-pollutanized” so that air toxics and other criteria pollutant changes were quantified and modeled– Not a trivial task and required collaboration from across Office (e.g.,
SPPD engineers for specific sectors)– Need continued focus and efforts in this area as critical for future multi-
pollutant work
6
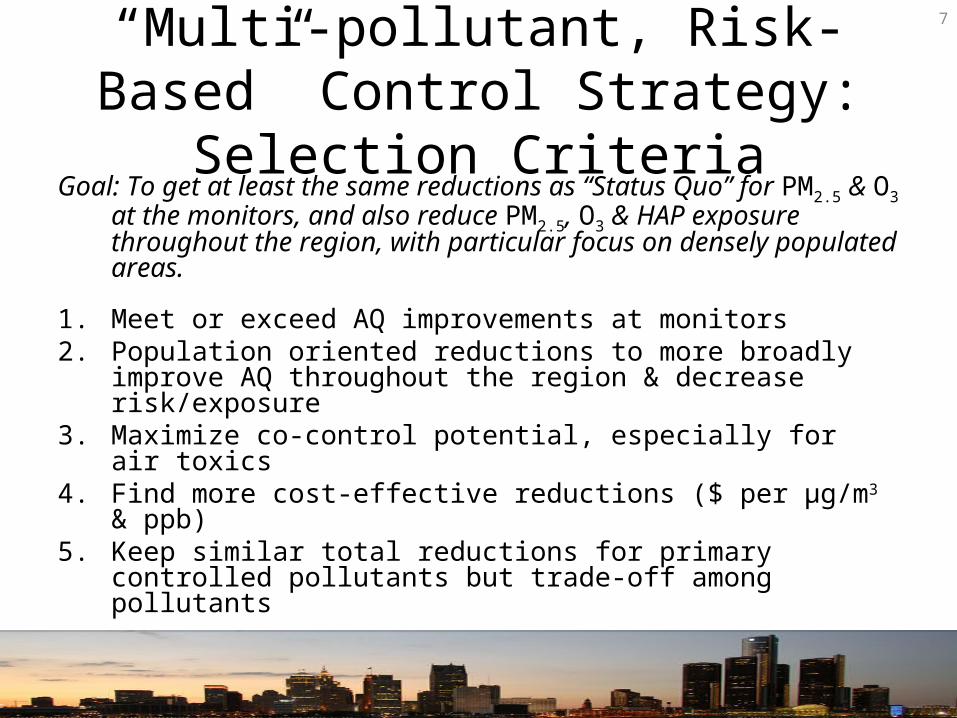
“Multi-pollutant, Risk-Based” Control Strategy: Selection Criteria
Goal: To get at least the same reductions as “Status Quo” for PM2.5 & O3 at the monitors, and also reduce PM2.5, O3 & HAP exposure throughout the region, with particular focus on densely populated areas.
1. Meet or exceed AQ improvements at monitors2. Population oriented reductions to more broadly improve
AQ throughout the region & decrease risk/exposure3. Maximize co-control potential, especially for air toxics4. Find more cost-effective reductions ($ per µg/m3 & ppb)5. Keep similar total reductions for primary controlled
pollutants but trade-off among pollutants
7
Pollutant 2020 Base (tons)
“Status Quo” “MP, Risk-Based” Total tons DifferenceTons
Reduced% Change from Base
Tons Reduced
% Change from Base
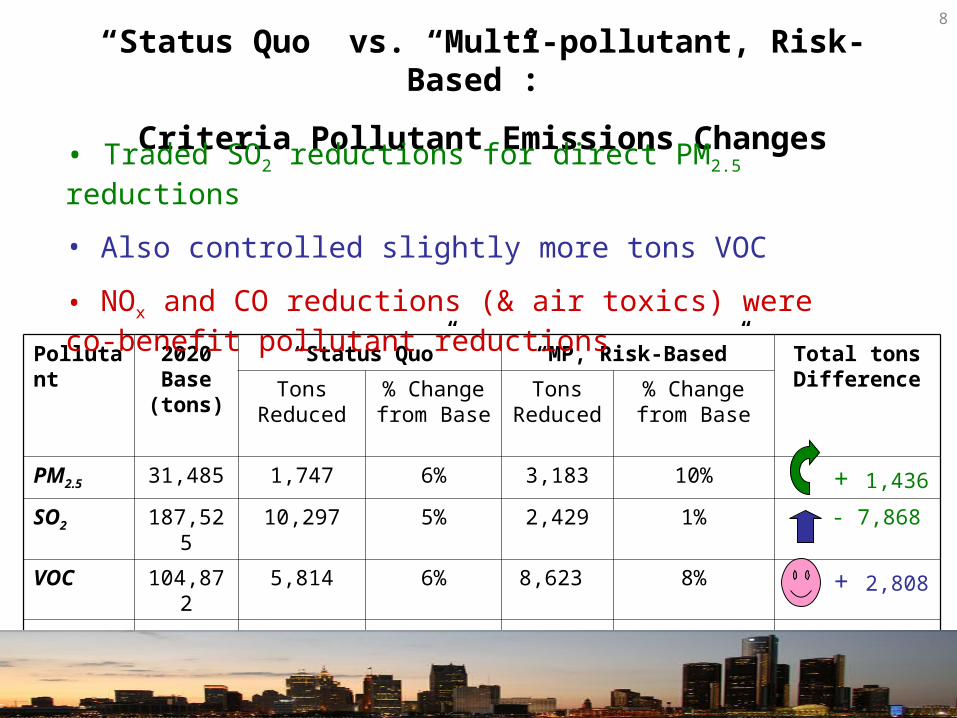
PM2.5 31,485 1,747 6% 3,183 10% + 1,436
SO2 187,525 10,297 5% 2,429 1% - 7,868
VOC 104,872 5,814 6% 8,623 8% + 2,808
NOx 118,432 31 0.03% 2,016 2% + 1,985
CO 424,426 1546 0.4% 64,187 15% + 62,641
“Status Quo” vs. “Multi-pollutant, Risk-Based”:
Criteria Pollutant Emissions Changes
• Traded SO2 reductions for direct PM2.5 reductions
• Also controlled slightly more tons VOC
• NOx and CO reductions (& air toxics) were co-benefit pollutant reductions
8
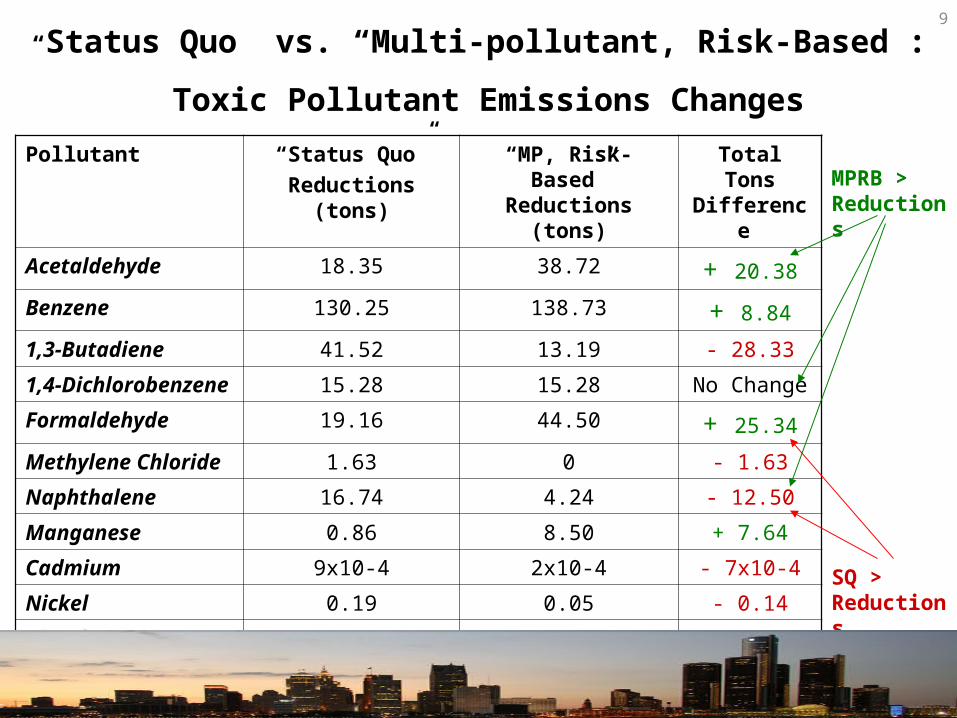
Pollutant “Status Quo”
Reductions (tons)
“MP, Risk-Based” Reductions (tons)
Total Tons Difference
Acetaldehyde 18.35 38.72 + 20.38
Benzene 130.25 138.73 + 8.84
1,3-Butadiene 41.52 13.19 - 28.33
1,4-Dichlorobenzene 15.28 15.28 No Change
Formaldehyde 19.16 44.50 + 25.34
Methylene Chloride 1.63 0 - 1.63
Naphthalene 16.74 4.24 - 12.50
Manganese 0.86 8.50 + 7.64
Cadmium 9x10⁻⁴ 2x10⁻⁴ - 7x10⁻⁴
Nickel 0.19 0.05 - 0.14
Diesel PM 0 30.70 + 30.70
“Status Quo” vs. “Multi-pollutant, Risk-Based”:
Toxic Pollutant Emissions Changes
MPRB > Reductions
SQ > Reductions
9
Criteria for “Success”• Improved O3 & PM2.5 air quality at monitors
– Compare total reduction at monitors for “Status Quo” vs “MP, Risk-Based”– Focus on differences at projected non-attainment monitors
• Improved air quality regionally and across urban core– O3, PM2.5, and selected air toxics
• Greater benefits: PM2.5 & O3
– Population weighted air quality change– Monetized benefits
• Reduction in total cancer and non-cancer risk– Cancer
• Max individual risk below 100 in a million• Minimizing total incidence
– Non-cancer• Max hazard index (HI) below 1• Minimizing people above HI of 1
• Greater net benefits and cost effectiveness for overall strategy
10
Criteria 1:
Improved O3 & PM2.5
Air Quality at Monitors
11
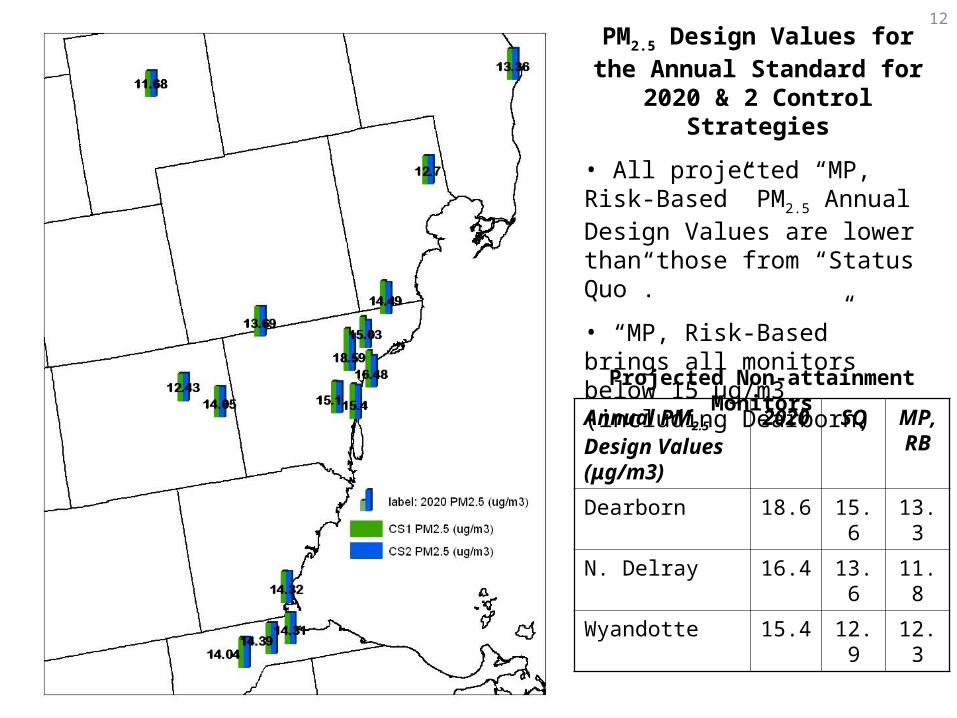
Annual PM2.5 Design Values (μg/m3)
2020 SQ MP,RB
Dearborn 18.6 15.6 13.3
N. Delray 16.4 13.6 11.8
Wyandotte 15.4 12.9 12.3
PM2.5 Design Values for the Annual Standard for 2020 & 2
Control Strategies
• All projected “MP, Risk-Based” PM2.5 Annual Design Values are lower than those from “Status Quo”.
• “MP, Risk-Based” brings all monitors below 15 μg/m3 (including Dearborn)
Projected Non-attainment Monitors
12
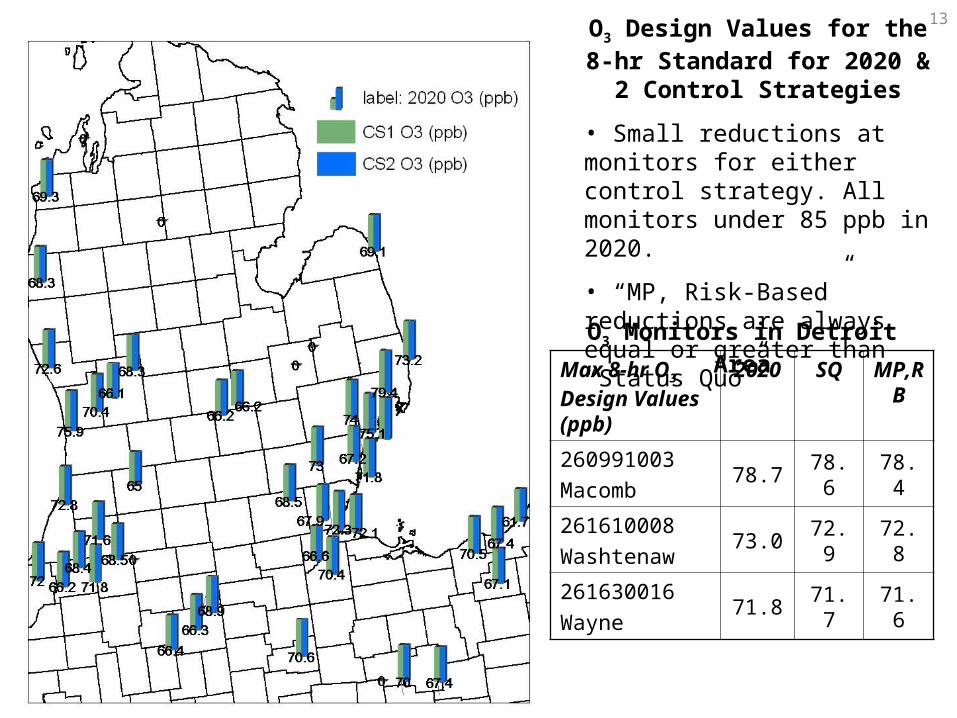
O3 Design Values for the 8-hr Standard for 2020 & 2 Control
Strategies
• Small reductions at monitors for either control strategy. All monitors under 85 ppb in 2020.
• “MP, Risk-Based” reductions are always equal or greater than “Status Quo”
Max 8-hr O3 Design Values (ppb)
2020 SQ MP,RB
260991003
Macomb78.7 78.6 78.4
261610008
Washtenaw73.0 72.9 72.8
261630016
Wayne71.8 71.7 71.6
O3 Monitors in Detroit Area
13
Criteria 2:
Air Quality Improvements
Across Region
& in Urban Core
14
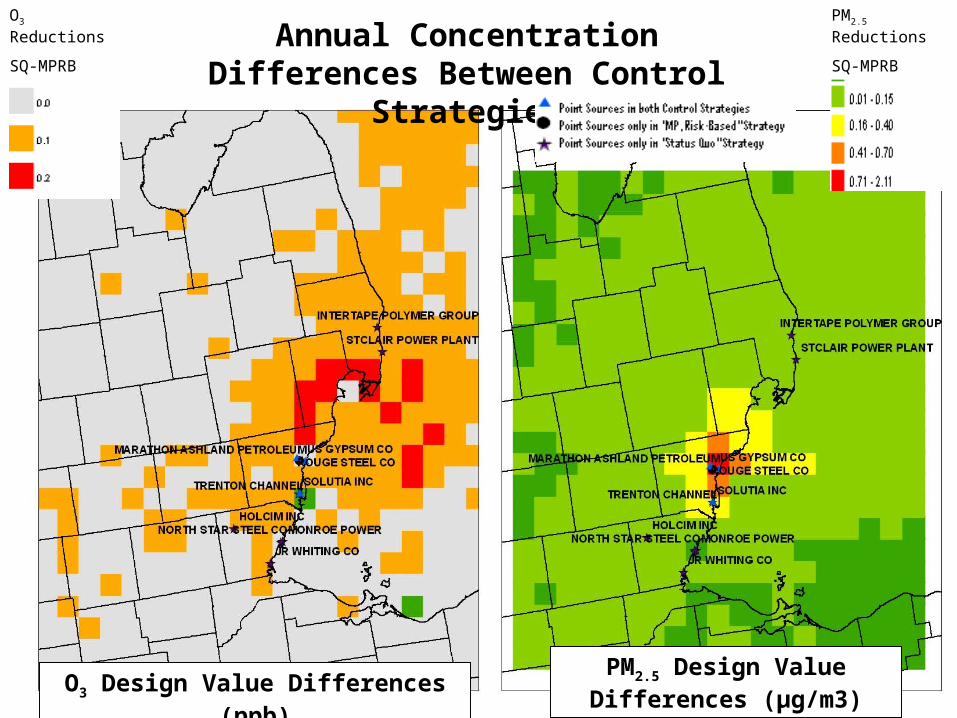
Annual Concentration Differences Between Control Strategies
O3 Design Value Differences (ppb)PM2.5 Design Value Differences (μg/m3)
O3 Reductions
SQ-MPRB
PM2.5 Reductions
SQ-MPRB
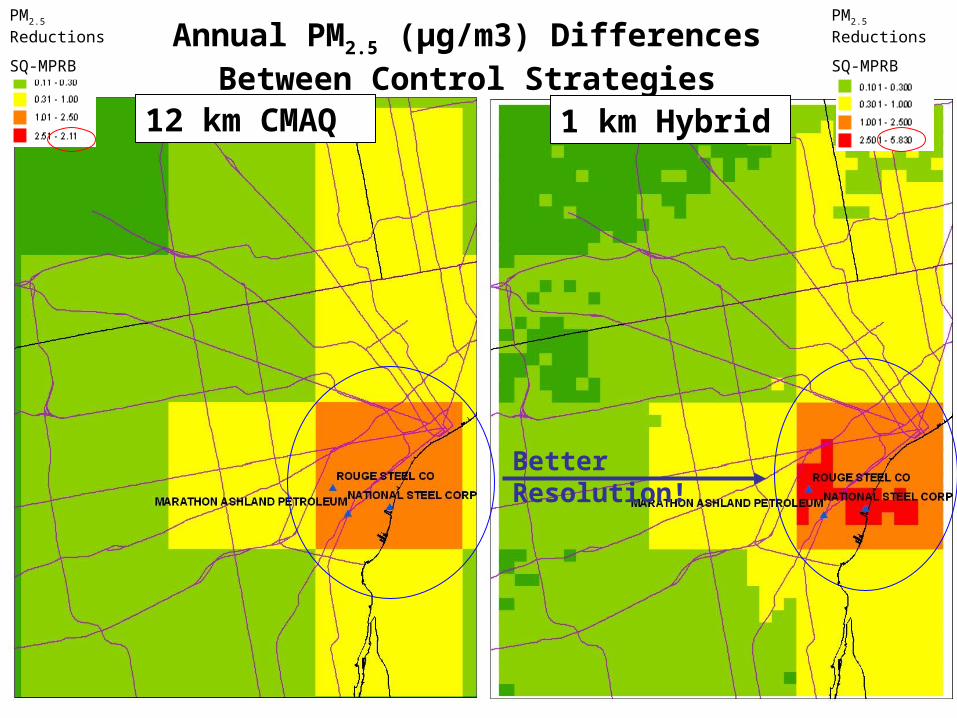
Annual PM2.5 (μg/m3) Differences Between Control Strategies
12 km CMAQ 1 km Hybrid
PM2.5 Reductions
SQ-MPRB
PM2.5 Reductions
SQ-MPRB
Better Resolution!
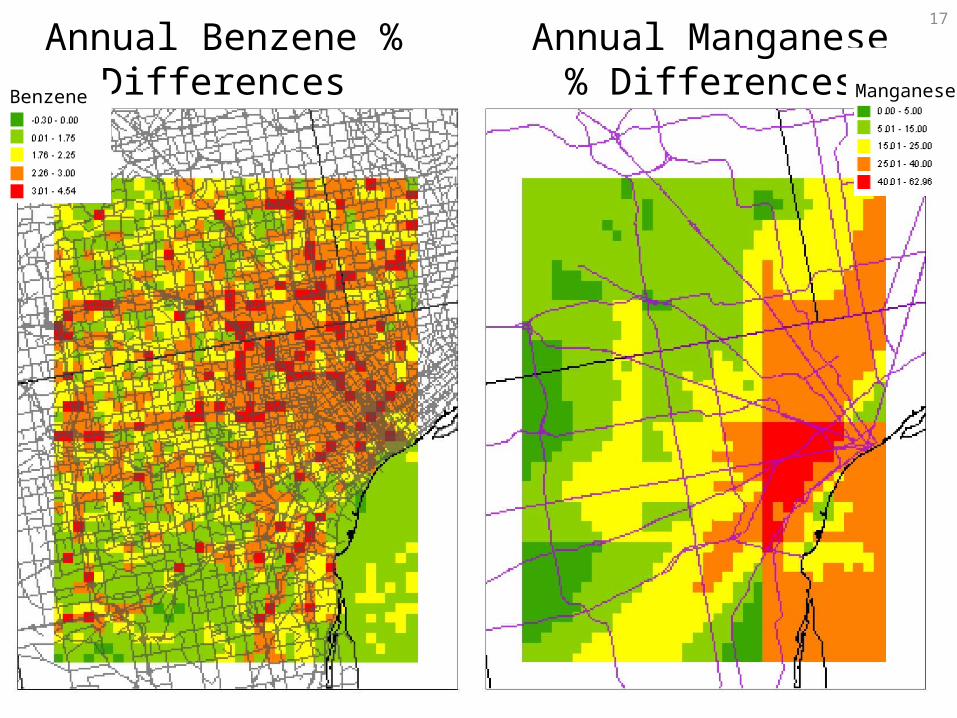
Annual Benzene % Differences
Annual Manganese % DifferencesBenzene Manganese
17
Criteria 3:
PM2.5 & O3
Health Benefits
18
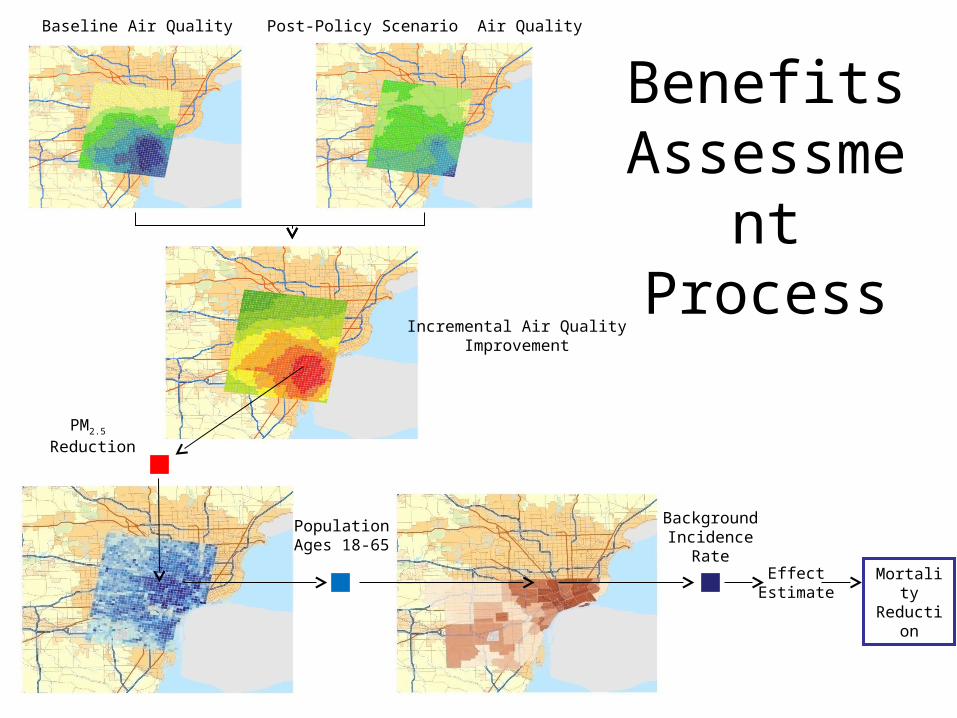
Baseline Air Quality Post-Policy Scenario Air Quality
Incremental Air QualityImprovement
PM2.5 Reduction
PopulationAges 18-65
BackgroundIncidence
RateEffect
EstimateMortality Reductio
n
Benefits Assessment
Process
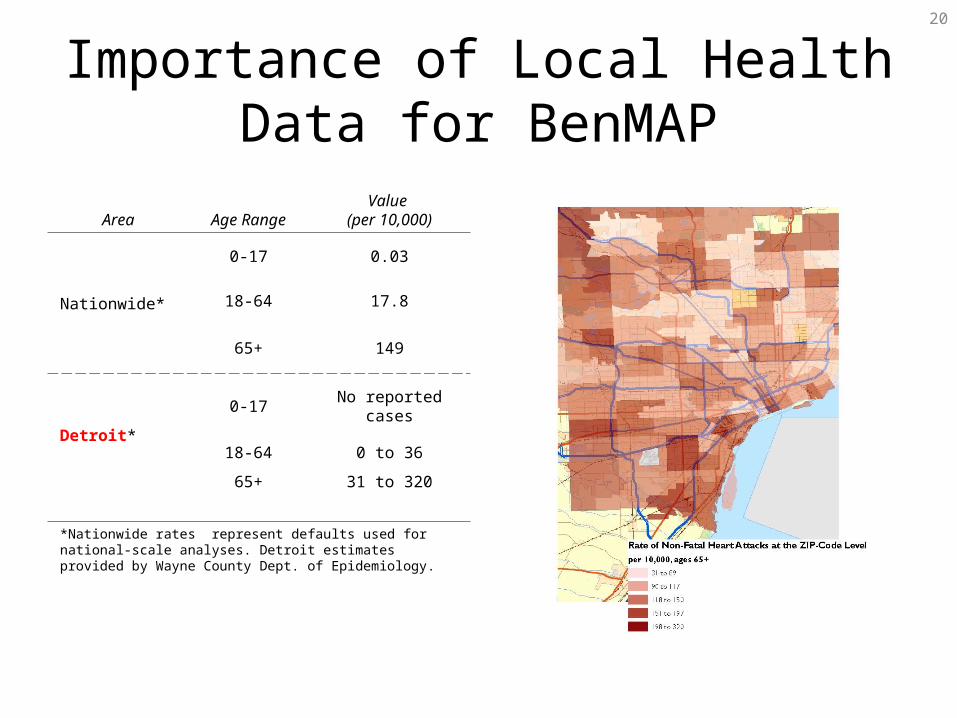
Importance of Local Health Data for BenMAP
20
Area Age RangeValue
(per 10,000)
Nationwide*
0-17 0.03
18-64 17.8
65+ 149
Detroit*
0-17 No reported cases
18-64 0 to 36
65+ 31 to 320
*Nationwide rates represent defaults used for national-scale analyses. Detroit estimates provided by Wayne County Dept. of Epidemiology.
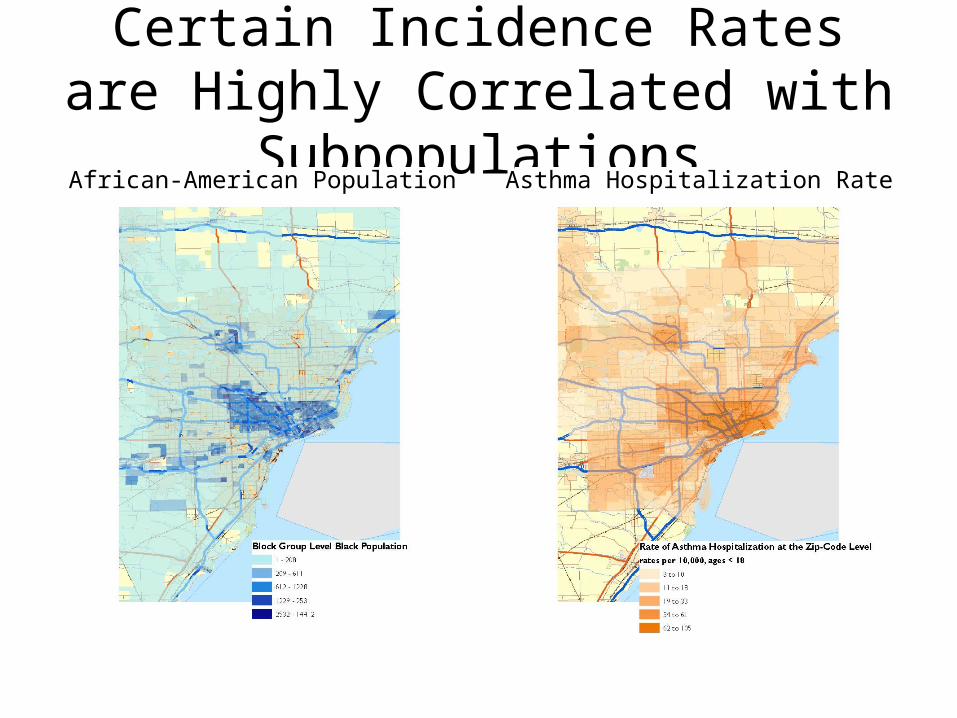
Certain Incidence Rates are Highly Correlated with Subpopulations
African-American Population Asthma Hospitalization Rate
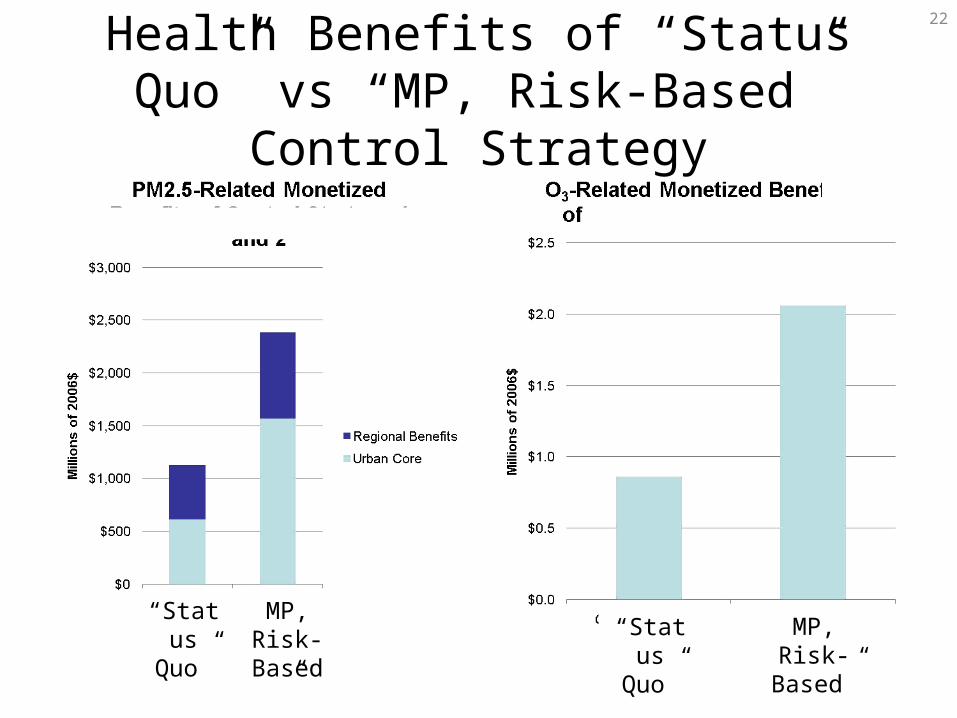
Health Benefits of “Status Quo” vs “MP, Risk-Based” Control Strategy
“Status Quo”
MP, Risk-
Based”
MP, Risk-
Based”
“Status Quo”
22
Benefits-Related Insights
• Fine-scale analyses yield an improved:– Estimate of total benefits– Characterization of health impacts to specific
sub-populations – Estimate of distribution of health impacts across
locations
• Improved benefits estimates can help us maximize net benefits by applying controls to:– Sources nearest population centers– Sources nearest susceptible populations
23
Criteria 4:
Cancer & Non-Cancer Risk
24
Human Exposure Model (HEM-3)
• Tool for estimating ambient concentrations, human exposures and health risks that may result from air pollution emissions.– Used for RTR risk assessments
• Accepts user-supplied gridded modeling results like those from CMAQ or a CMAQ-AERMOD hybrid
26
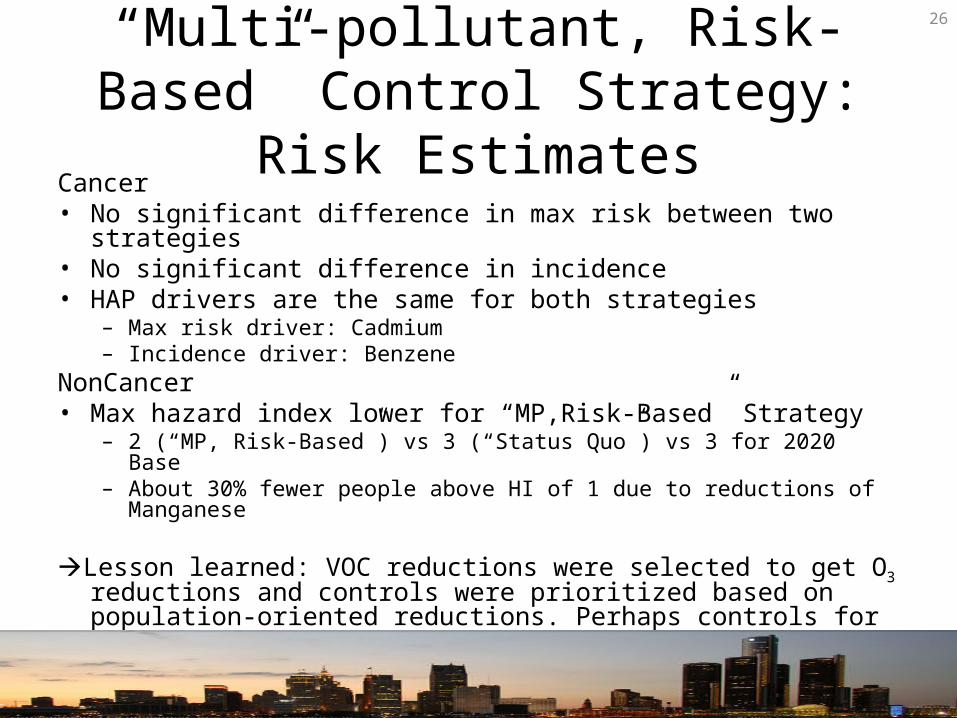
“Multi-pollutant, Risk-Based” Control Strategy: Risk Estimates
Cancer• No significant difference in max risk between two strategies • No significant difference in incidence• HAP drivers are the same for both strategies
– Max risk driver: Cadmium– Incidence driver: Benzene
NonCancer• Max hazard index lower for “MP,Risk-Based” Strategy
– 2 (“MP, Risk-Based”) vs 3 (“Status Quo”) vs 3 for 2020 Base– About 30% fewer people above HI of 1 due to reductions of Manganese
Lesson learned: VOC reductions were selected to get O3 reductions and controls were prioritized based on population-oriented reductions. Perhaps controls for reducing VOC should also be prioritized based on HAP risk?
26
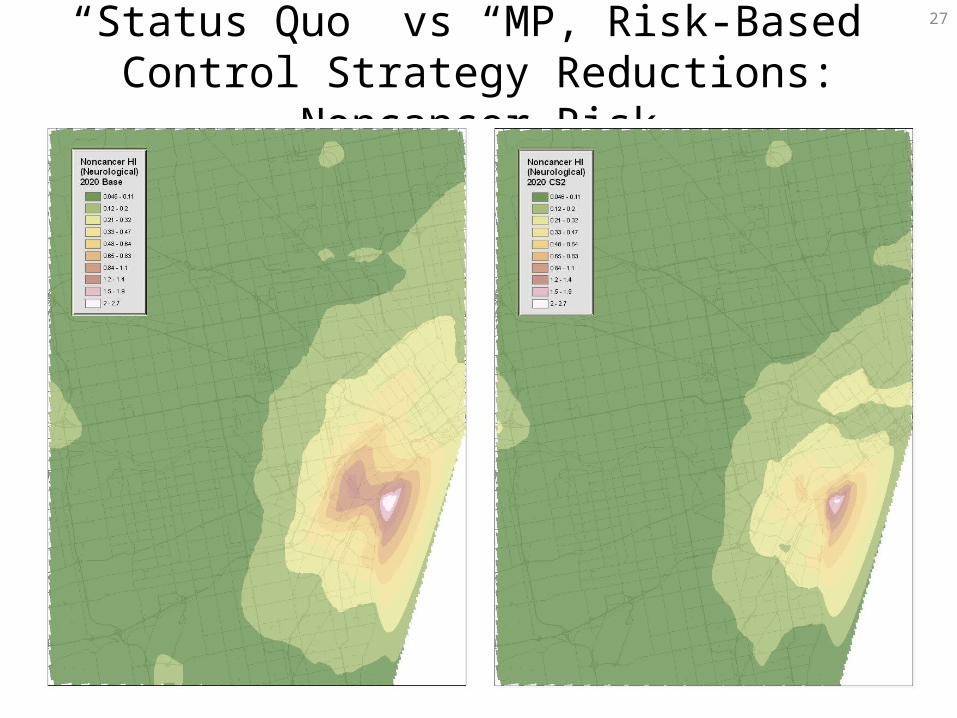
“Status Quo” vs “MP, Risk-Based” Control Strategy Reductions: Noncancer Risk
27
Criteria 5:
Net Benefits
& Cost Effectiveness
28
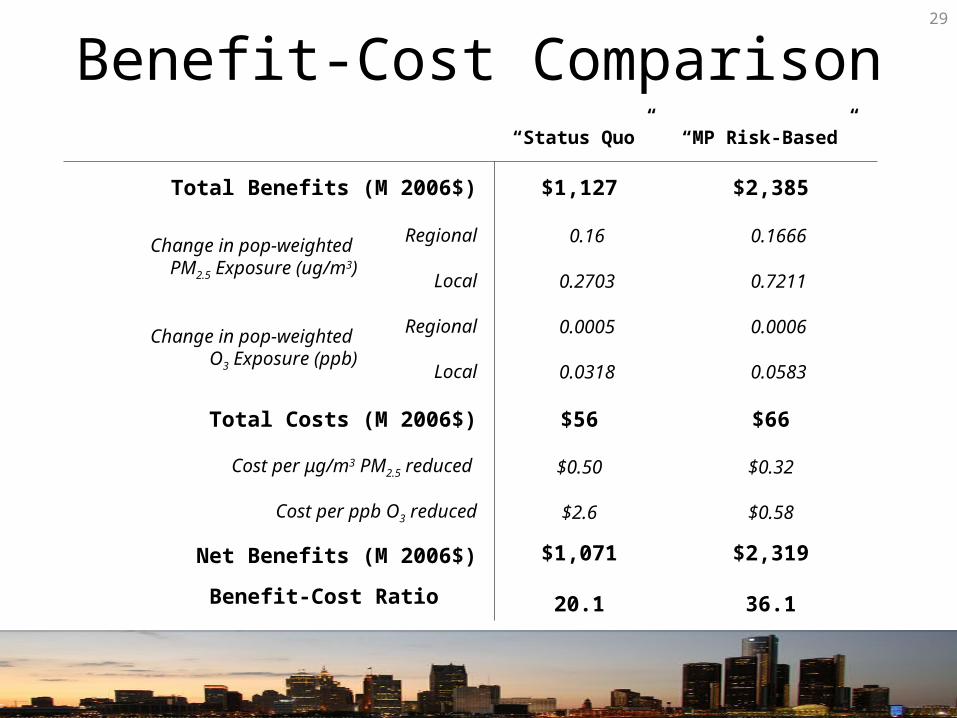
Benefit-Cost Comparison“Status Quo” “MP Risk-Based”
Total Benefits (M 2006$) $1,127 $2,385
Change in pop-weighted PM2.5 Exposure (ug/m3)
Regional 0.16 0.1666
Local 0.2703 0.7211
Change in pop-weighted O3 Exposure (ppb)
Regional 0.0005 0.0006
Local 0.0318 0.0583
Total Costs (M 2006$) $56 $66
Cost per μg/m3 PM2.5 reduced $0.50 $0.32
Cost per ppb O3 reduced $2.6 $0.58
Net Benefits (M 2006$)
Benefit-Cost Ratio
$1,071
20.1
$2,319
36.1
29
Summary• First assessment of a Multi-Pollutant, Risk-Based approach to developing
control strategies and comparison to a SIP-based approach.• Found that valuable first steps were:
– Develop & evaluate a “platform” for the Detroit MP analyses; and – Fully understand the AQ issues for the area through development of a
Conceptual Model – Collect local-scale information including emissions, AQ modeling, control and
health data• “MP, Risk-Based” approach met all “Criteria for Success”
– Same or greater reductions at all monitors for PM2.5 & O3, including greatest reductions at Michigan projected nonattainment monitors
– Improved air quality regionally and in urban core for O3, PM2.5, and selected air toxics
– Greater benefits (~2x) for PM2.5 & O3 with “MP, Risk-Based” Control Strategy– Reduction in non-cancer risk, though no significant change in cancer risk
• Lesson learned: VOC controls could also be prioritized based on HAPS risk.– More cost effective and beneficial
30
Additional Acknowledgements
• Assistance from outside OAQPS includes OTAQ, CAMD, ORD, MDEQ, SEMCOG, LADCO.
• Others within OAQPS who have been invaluable in their assistance to the project include Roger Brode, Kirk Baker, Bryan Hubbell, David Misenheimer, Josh Drunkenbrod, Brian Timin, Kim Teal, Brenda Shine, Keith Barnett, Pat Dolwick, and Norm Possiel.
• Contractor support was provided by CSC, Environ, and ECR.
31