Embed Size (px)
Citation preview
H
D23
D
m
af
Fr
Lab
C. R. Geoscience 344 (2012) 688–703
A
Art
Re
Ac
Av
W
Ed
Ke
Se
U-
Ga
Mo
Mo
Te
Nu
Ga
Mo
*
16
htt
ydrology, environment
etermination of transfer time for sediments in alluvial plains using8U-234U-230Th disequilibria: The case of the Ganges river system
etermination des temps de transfert des sediments dans les plaines alluviales par la
ethodologie des desequilibres radioctifs 238U-234U-230Th : le cas du Ganges et de ses
fluents
ancois Chabaux *, Estelle Blaes, Mathieu Granet, Raphael di Chiara Roupert, Peter Stille
oratoire d’hydrologie et de geochimie de Strasbourg (LHyGES), EOST, universite de Strasbourg et CNRS, 1, rue Blessig, 67084 Strasbourg cedex, France
R T I C L E I N F O
icle history:
ceived 1st June 2012
cepted after revision 26 October 2012
ailable online 22 November 2012
ritten on invitation of the
itorial Board
ywords:
dimentary transfer time
series nuclides
nges river
deling
ts cles :
mps de transfert sedimentaire
cleides des series de l’U
nges
delisation
A B S T R A C T
An approach to deriving the transfer time of sediments within alluvial plains by using the
variation of the U-seriesnuclides insediments collected along rivers ispresented inthisarticle
and discussed in the light of new data from samples from different locations within the
Ganges watershed and its outlet. These data indicate that the upstream-downstream
variation of 238U-234U-230Th disequilibria in the sediments, with different variation trends for
suspended and coarse-grained sediments, isprobably a general featureof all Himalayan rivers
flowing across the Indo-Gangetic plain. The data therefore confirm the occurrence of very
different transfer times within the plain, depending on the sediments granulometry, with
much shorter transfer time for the fine-grained (a few ky or less) than for the coarse-grained
sediments (100 ky or more). A new solving approach, using a parallel stochastic Quantum-
behaved Particle Swarm Optimization (p-QPSO), has been developed for identifying the
unknown parameters of the model necessary for the determination of the transfer time. The
data of sediments collected at the Ganges outlet show significant variations of the 234U/230Th
activity ratios for the fine-grained sediment end-member collected in 2004 and 2008. Such
variations indicate that the fine-grained sediments transit quickly (a year or less) within the
plain. The highly variable activity ratios might be the result of quickly changing weathering
intensities. Conversely, the U-Th variations observed for the 2004 and 2008 bedload from the
Ganges basin cannot result from a short sedimentary transfer time. They probably result from
the dredge sampling procedure, which might be influenced by local placer effects controlling
the abundance of U and Th carrying minerals. Dredging may not allow the sampling of a
representative bedload, hence it may cause an artificial mineralogical and, therefore, an U-Th
variability for bedload sediments collected at different periods. At this stage, the transfer time
uncertainty induced by this variability is difficult to assess.
� 2012 Published by Elsevier Masson SAS on behalf of Academie des sciences.
R E S U M E
L’approche proposee pour determiner les temps de transferts des sediments dans les
plaines alluviales a partir de la variation des nucleides des series de l’U, mesures dans les
sediments collectes le long des fleuves est presentee dans ce papier et discutee a la lumiere
de nouvelles donnees obtenues sur des sediments collectes a differents endroits de la
plaine du Ganges et a son exutoire. Ces donnees indiquent que la variation amont-aval des
Corresponding author.
E-mail address: [email protected] (F. Chabaux).
Contents lists available at SciVerse ScienceDirect
Comptes Rendus Geoscience
w ww.s c ien ced i rec t . c o m
31-0713/$ – see front matter � 2012 Published by Elsevier Masson SAS on behalf of Academie des sciences.
p://dx.doi.org/10.1016/j.crte.2012.10.013

1
peeetaesraaGmocthfaeverDdthobSaethrw2
F. Chabaux et al. / C. R. Geoscience 344 (2012) 688–703 689
. Introduction
The sediment transfer time in alluvial plains is a keyarameter for the understanding and modelling of thevolution of the continental surface and its response toxternal forcing factors i.e. climate changes, tectonicvents or human activities. Besides modelling, experimen-l and tracing approaches have been developed to
stimate more or less directly these time-dependentediment parameters, including the sediment basinesponse time to external perturbations (e.g., Castelltortnd Van Den Driessche, 2003; Castelltort et al., 2004; Davynd Lague, 2009; Liebault et al., 2012; Metivier andaudemer, 1999; Paola et al., 1992; Sear et al., 2000). Aore accurate estimate of these parameters can be
btained by using radiochronometers. The application ofosmonuclides would undoubtedly open new horizons in
is field of research (Wittmann et al., 2011); however, sor, their sediment analysis has mainly been devoted to the
stimation of denudation rates at the watershed scale (e.g.,on Blanckenburg, 2005, 2006). On the other hand, anffort has been made in recent years to develop and useadioactive U-series disequilibria (i.e., 238U-234U-230Th).ePaolo et al. (2006, this issue and references therein),eveloped the concept of the comminution age based one analysis of the (234U/238U) activity ratio which allows
ne to constrain the time ‘‘elapsed subsequent to bedrockeing reduced by physical weathering to small grains’’.everal other studies underline the potential of such anpproach (e.g., Dosseto et al., 2010; Lee et al., 2010; Mahert al., 2006). At the same time, it has been proposed to usee variation of the U-series nuclides in sediments along
ivers to recover the time constant of the sediment transferithin alluvial plains (Chabaux et al., 2006; Dosseto et al.,
006; Granet et al., 2007, 2010). The potential of these
latter approaches has been emphasized in the study of thesediments from the Ganges river system (Granet et al.,2007, 2010), one of the world’s largest purveyor ofQuaternary alluvial sediments shed from the largestorogen, i.e., Himalaya. The analysis of sediments collectedalong the Ganges river and two of its Himalayan tributariesallowed one to define a transfer scenario with timeconstants for the sediment transfer which vary strongly infunction of the sediments granulometry.
The aim of this article is to present the principles of thisapproach and to discuss some possible limits in the light ofnew data from samples collected at different locationswithin the Ganges watershed and its outlet.
2. Principle of the approach
The potential of U-series nuclides to provide informa-tion on the transfer time of sediments in alluvial plains is aconsequence of the dual property of these nuclides: (1) tobe fractionated during water-rock interactions and henceduring chemical weathering processes; and (2) to haveradioactive decay periods of the same order of magnitudeas the time-scales of these processes (e.g. Chabaux et al.,2003a, 2008; Dosseto et al., 2008a). The approach,illustrated in the study of sediments from the Gangesriver basin (Granet et al., 2007, 2010), mainly relies on theprinciple that in large alluvial plains sediments are onlytransferred along the streams and not affected byadditional inputs of new weathering products from freshbedrocks; in such a case, the intensity of 238U-234U-230Thdisequilibria in river sediments will only depend on twoparameters: (a) the duration of the transfer including thetime spent in soils and in the river; and (b) the nature andthe intensity of U-Th fractionations occurring in sedimentsduring their transfer into alluvial plains. In the limiting
desequilibres 238U-234U-230Th dans les sediments, avec des tendances de variations
differentes pour les sediments en suspension et les sediments a grains grossiers, est
probablement une caracteristique generale des rivieres himalayennes dans la plaine Indo-
gangetique. Ces donnees confirment donc l’existence de temps de transfert tres differents
des sediments dans la plaine du Ganges, selon leur granulometrie, avec des temps
beaucoup plus courts pour les sediments fins (quelques ka ou moins) que pour les
sediments grossiers (100 ka ou plus). Une nouvelle approche de resolution integrant
l’utilisation d’une optimisation stochastique par agregat particulaire quantique (version
parallele) (p-QPSO en anglais) fut developpee pour caracteriser les parametres du modele
utilise pour determiner les temps de transferts. Les donnees collectees a l’exutoire du
Ganges montrent, quant a elles, des variations significatives des rapports d’activite
(234U/230Th) pour le pole fin des sediments collectes en 2004 et 2008. De telles variations
indiquent que ces sediments a grains fins transitent rapidement (de l’ordre de l’annee ou
moins) dans la plaine. Ces variations rapides des rapports d’activites des sediments fins
pourraient provenir d’un changement de l’intensite des processus d’alteration dans la
plaine du Ganges d’une annee sur l’autre. En revanche, les variations U-Th observees dans
les sediments de fond de rivieres collectes en 2004 et 2008, ne peuvent pas s’expliquer par
des temps de transferts rapides de ces sediments. Elles sont certainement liees a la
procedure d’echantillonnage par dragage, qui pourrait etre influencee par des effets de
concentration locaux de mineraux portant l’U et le Th. Le dragage ne permettrait pas de
collecter un echantillon representatif en Th et en U, ce qui conduirait a une variabilite
mineralogique et en U-Th artificielle, lorsque sont compares entre eux des sediments
collectes a differentes periodes. L’incertitude qu’induit une telle variabilite sur le temps de
transfert calcule est difficile a evaluer a ce stade.
� 2012 Publie par Elsevier Masson SAS pour l’Academie des sciences.

cafraalothacwthththdithframsythwThevclaraanDe20ev23
de
@2
@
@2
@
@2
@2
23
y�
ofinof(e
cainranuthaccothcomUsupreappl
F. Chabaux et al. / C. R. Geoscience 344 (2012) 688–703690
se of a pure transport regime, without secondary U-Thctionations, Th activity ratios of the sediments collectedng the stream are only affected by radioactive decay. In
is simple case, the determination of the sediments Thtivity ratios along the river yields directly the ‘‘age’’,hich corresponds to the residence time of the sediment ine plain. If secondary U-Th fractionation occurred duringe transit of the sediments within the alluvial plain, thene time information derived from the variation of U-Thsequilibria in sediments along the alluvial plain requirese identification of the origin of these secondary U-Thctionations and their modelling by using realistic
athematical laws. For the sediments of the Ganges riverstem (Granet et al., 2007, 2010) it has been shown thate main U-Th fractionations are related to sedimenteathering during their transit and storage in the plain.e interpretation of U-Th data relies in this case on a timeolution law of the U-series nuclides, which is thessical law used to account for the variations of the
dioactive disequilibria during weathering, namely a lossd gain model (e.g., Chabaux et al., 2003b, 2011, 2012;quincey et al., 2002; Dosseto et al., 2008b; Ma et al.,10, 2012). In the frame of such a scenario the temporalolution of the number of the atoms of the four8U-234U-230Th-232Th nuclides per gram of sample isscribed by the four following equations:
38U
t¼ f 238
238U0 � k238238U � l238
238U (1)
34U
t¼ f 234
234U0 � k234234U � l234
234U þ l238238U (2)
30Th
@t¼ f 230
230Th0 � k230230Th � l230
230Th þ l234234U
(3)32Th
@t¼ f 232
232Th0 � k232232Th � l232
232Th (4)
li is the decay constant (in y�1) of nuclide i (here 238U,4U, 230Th, and 232Th), ki is the first-order rate constant (in1) for leaching of nuclide i and fi is the input flux (in y�1)
nuclide i gained by the sample. For simplification, theput fluxes are expressed as the proportion of the number atoms of nuclides added per year to the initial samplexpressed as li N0).
Solving the above equation system allows one tolculate the theoretical activities of the various nuclides
the sample at time t and the three independent activitytios (234U/238U), (230Th/238U), and (230Th/232Th). Theclide activities and the activity ratios are a function ofe mobility parameters (ki, fi) of the model, the initialtivities of the different nuclides and the time t. The time t
rresponds to the time span between the initial state ofe sample at t = 0 and its present state. Thus, the time t
rresponds to the time duration elapsed for a sample toove from the starting position to its current position.ually the reference sample is collected at a localitystream in the plain, which corresponds to the starting or
ference position. It is important to note that such anproach implies that the transfer of sediments within theain works at steady state.
The mobility parameters (ki, fi) are usually unknown.The approach retained to solve this problem is to collect aseries of samples along the alluvial plain and to considerthe mobility parameters as constant for the whole plain.The determined radioactive disequilibria of these samplesare then used to determine: (1) the mobility parameters ofthe different radionuclides; and (2) the age of the differentsamples relative to the reference sample; this agecorresponds to the mean residence time of the samplein the alluvial plain and defines the time span necessary tomove from the reference position to its current position.
In the studies of the Ganges sediments and itstributaries, this mathematical approach allowed one toderive a long sediment transfer time of 100 ky or more forcoarse-grained sediments; the fine-grained material,however, has a much shorter transfer time of a few ky(Granet et al., 2007, 2010).
3. Sampling locations and mineralogical andgeochemical characteristics of sediments
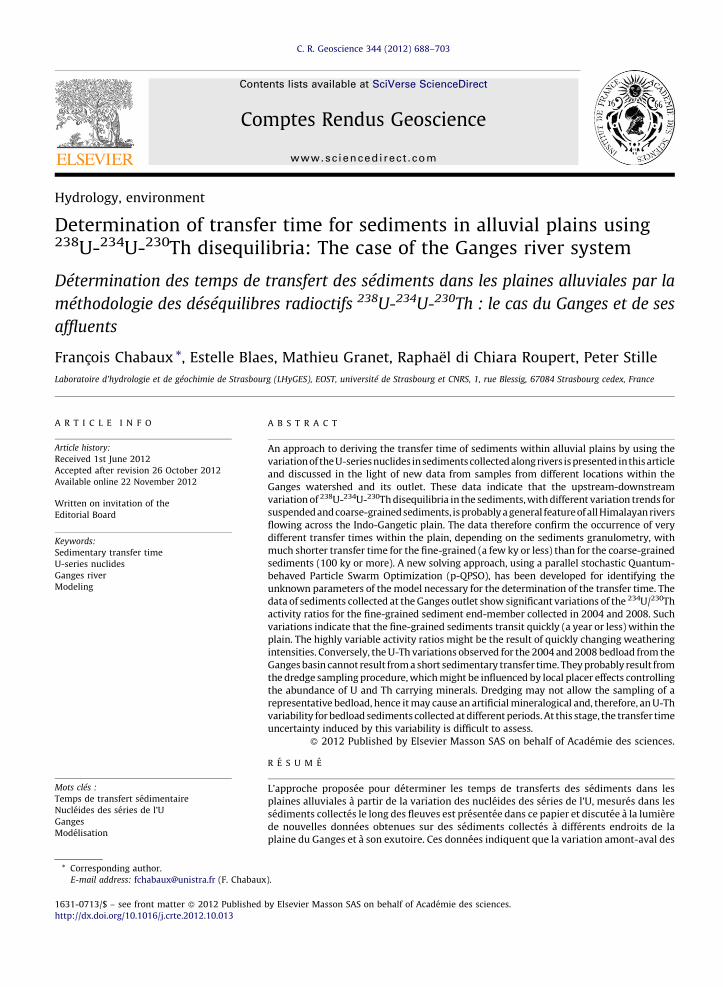
In order to complement the first results obtained on theGanges river system and to validate the previous conclu-sions concerning the transfer time of sediments within thealluvial Gangetic plains (Granet et al., 2007, 2010),additional sediments have been sampled in three otherareas during several field campaigns (between 2004 and2009) and analyzed. They come: (1) from Rishikesh andKanpur situated at the upstream portion of the Gangesriver; (2) from Harding Bridge at the outlet of the Gangesriver just before the confluence with the Brahmaputrariver; and (3) from the Kosi river, with one samplecollected at the outlet of the Range and another one justbefore the confluence with the Ganges River (Fig. 1).
For each sampling location, both suspended and bedloador bank river sediments (Table 1) were collected andanalyzed. Bedload sediments were dredged in the center ofthe channel, whereas bank sediments, which correspond tothe most recent deposits, were sampled in the active part ofthe channel. River bank sediments, which actually are ratherbar sediments, have been collected at several places in thesame sampling location, in order to integrate a total surfaceof about a few square meters. Suspended materials werecollected at different depths of the water column by using apolypropylene bottle, ballasted and equipped with a depthprobe. The sampling depth given in Table 1 corresponds tothe average depth recorded during the filling of the bottleand may fluctuate by � 0.5 m. Suspended sediments arecollected by filtration of water samples through a 0.22 mmwith a diameter of 99 mm PES filter in pressurized tefloncoated filtration units within 12 to 48 h of collection (Galyet al., 2008; Granet et al., 2010; Lupker et al., 2011). To assessthe temporal variability of U-Th series nuclides of thesediments during the monsoon season when 70–80% of thetotal annual rainfall occurs (Singh et al., 2007), the Ganges riverat its outlet (Harding Bridge) was sampled four times (once inJuly 2004 and three times in 2008).
The bedload or bank sediments (grain size of �200–500 mm) are mainly composed of quartz, feldspar, mica andheavy minerals (zircons, xenotimes, monazites and garnet)(Garzanti et al., 2010; Singh, 2009; Singh et al., 1993, 2007).
Sino2
cdsc2soththmeinsHssH
4
aMimbTcsdz
F
T
F
F
T
G
F. Chabaux et al. / C. R. Geoscience 344 (2012) 688–703 691
uspended sediments (grain size of �0–50 mm) are enriched mica, contain some calcite, dolomite and fewer amounts
f epidote, amphibole and garnet (details in Garzanti et al.,011; see also Singh et al., 2007).
Sedimentological analysis of the river sedimentsollected in the Ganges basin from the Himalayan frontownstream to the Ganges mainstream in Bangladeshuggests that mineral sorting strongly controls thehemical composition of the sediments (Lupker et al.,011, 2012a). Grain size, shape and density of the sedimentuspension are defined by the hydro-dynamical conditionsf the water column. This results in a mineralogical andus chemical differentiation of sediments at the scale ofe water column; it is illustrated through the variations ofajor elements at the scale of the water column (for
xample, decrease of Al2O3 and increase of SiO2 withcreasing depth). Major element data further indicate that
ediments from Gangetic plain rivers (Ganges river,imlayan rivers in the downstream part of the plain)
uffered a higher degree of chemical weathering than theediments from the Himalayan rivers at the outlet of theigh Range (Lupker et al., 2011, 2012a).
. Analytical techniques
U, Th concentrations and U, Th isotopic ratios werenalyzed in Strasbourg (LHyGeS) by Thermal Ionisationass Spectrometry (TIMS) on a Thermo Scientific Triton. Toprove the digestion of sediments, samples were crushed
y using first an agate disk mill and then an agate ball mill.he grain size of the sample is < 100 mm with the firstrushing step and decreases to < 50 mm after the secondtep. This is of prime importance in order to get a fulligestion of the samples, in particular of the minerals such asircons, xenotimes and monazites which are U and Th-rich.
For U and Th analyses, 100 mg of crushed powder werespiked with a mixed 233U-229Th tracer. The U-Th tracer wasregularly calibrated by TIMS with the AThO rock standard.The sample-spike mix was then dissolved using a three-stepprocedure with HNO3-HF acids, HClO4 and HCl–H3BO3 acids(Granet et al., 2007, 2010; Pelt et al., 2008). Separation andpurification of the U and Th fractions were achieved by usingconventional anion exchange chromatography (Granetet al., 2007; Pelt et al., 2008). The accuracy and reproduc-ibility of (234U/238U) activity ratio were controlled byanalyzing the HU1 secular equilibrium standard solution.During the period of data acquisition (2008–2010), themean (234U/238U) ratio of the HU1-standard was0.999 � 0.005 (n = 45; 2s), which is in agreement with thevalue of 1 for a rock in secular equilibrium. During the course ofthis study, the accuracy of Th isotopic ratio measurements wasassessed by analysing the BRGM Th105 standard solution(Innocent, 2008): 232Th/230Th =220316 � 4480 (n = 27, 2s).The reproducibility of U concentration and activity ratios wasbetter than 2 and 0.5%, respectively. For Th, the reproducibilityof concentration and activity ratios was better than 2%. Thetotal procedure blanks were < 50 pg for U and < 500 pg for Th.This is negligible (< 2%) compared to the amounts of elementsanalysed in the studied samples (at least 100 ng and 1000 ng ofU and Th, respectively).
5. Results and discussion
5.1. Variations of U and Th nuclides in the upstream part of
the Ganges and Kosi rivers
The U and Th isotope systematics in the sediments ofthe Kosi and of the upstream Ganges rivers are veryconsistent with those obtained previously, for the Gangesmain stream, and two of its tributaries, the Gandak and
ig. 1. Map of the Ganges River basin and locations of river sampling, modified from Chabaux et al. (2001). MCT: Main Central Thrust; MFT: Main Frontal
hrust. Location numbers are those given in Table 1. Stars give the location of samples studied by Granet et al. (2010), whose results are given in insert of
ig. 2.
ig. 1. Carte du bassin du Ganges avec la localisation des echantillons (d’apres Chabaux et al. (2001)). MCT : « Main Central Thrust » ; MFT : « Main Frontal
hrust ». Les numeros des positions sont ceux indiques dans le Tableau 1. Les etoiles correspondent aux lieux de prelevement des echantillons etudies par
ranet et al. (2010), dont les donnees sont representees en encart de la Fig. 2.

GhSimsa(FcoimthdimracorasedothtrepracGain
Ta
U-
Ta
Do
Bri
G
K
H
G
G
K
K
An
for
me
co
pe
F. Chabaux et al. / C. R. Geoscience 344 (2012) 688–703692
aghara rivers (Granet, 2007; Granet et al., 2007, 2010).ilar to previous studies, the data points of each
mpling site define trends in the isochron diagramig. 2) that can be interpreted in terms of mixing ofarse- and fine-grained sediments. In addition, the dataply a systematic upstream to downstream variation of
e 238U-234U-230Th disequilibria in the sediments withfferent variation trends for the two sediment end-embers: both the (230Th/232Th) and (238U/232Th) activitytios decrease from upstream to downstream in thearse-grained sediments, whereas only the (238U/232Th)tio decreases significantly in the fine-grained suspendeddiment (Fig. 2). This indicates that the upstream-wnstream variation of 238U-234U-230Th disequilibria ine sediments along the rivers, with different variationnds for suspended and coarse-grained sediments, is
obably a general feature of all Himalayan rivers flowingross the Indo-Gangetic plain. Therefore, using the newnges and Kosi river data, one might expect to arrive at
terpretations and conclusions similar to those of Granet
et al. (2007, 2010): sediment transfer time within thewatershed varies as a function of the sediment grain size,with much shorter transfer time for the fine-grained thanfor the coarse-grained sediment.
5.1.1. Sediment transfer time calculation
A more quantitative estimate of the sediment transfertime can be made by using the loss and gain model,detailed in section 2, and already applied in the previousstudies on Ganges plain sediments (Granet et al., 2007,2010). This approach is basically similar to those devel-oped for interpreting the variations of U series disequilib-rium in weathering profiles (e.g. Chabaux et al., 2003b,2011, 2012; Dequincey et al., 2002; Dosseto et al., 2008b,2012; Ma et al., 2010, 2012). Such approaches allowfor solving systems of significantly under-constrainedequations, which is the general situation for all thesestudies. Thus, in the case of the Kosi and the Upper Ganges,the U-Th analysis of only two sediment samples perriver, yields three independent activity ratios, namely
ble 1
series isotope data, for the sediments of the Upper Ganges, Kosi, Chambal, Gomti rivers and at Harding Bridge, the outlet of the Ganges.
bleau 1
nnees des series de l’U pour les sediments de la partie amont du Ganges, des affluents Kosi, Chambal et Gomti et du Ganges a son exutoire (Harding
dge).
Type Sampling date Depth m U ppm Th ppm (234U/238U) (230Th/232Th) (238U/232Th) (230Th/238U) Th/Nd
anges
Rishikesh (#1, 3087.600 N, 78819.820 E)
BR922 SL Aug. 2009 0.2 4.58 15.7 1.004 0.988 0.883 1.12 0.60
BR920 SL Aug. 2009 6 4.38 15.3 0.997 1.030 0.868 1.19 0.57
BR924 Bank Aug. 2009 2.91 12.5 1.003 0.754 0.704 1.07 0.56
anpur (#2, 26836.780 N, 80816.550 E)
BR907 SL Aug. 2009 0 3.85 17.8 1.001 0.998 0.655 1.53 0.59
BR945 SL Aug. 2009 3 2.77 12.7 1.001 0.901 0.659 1.37 0.57
BR905 Bedload Aug. 2009 – 1.87 10.7 1.007 0.628 0.530 1.19 0.55
arding Bridge (#3, 2483.170 N, 8981.480 E)
BR415 SL July 2004 0 3.78 19.2 1.018 0.773 0.596 1.30
BR413 SL July 2004 4 3.43 18.5 1.010 0.703 0.564 1.25
BR412 SL July 2004 6.5 3.15 17.2 1.014 0.716 0.555 1.29
BR418 Bedload July 2004 10 6.03 44.1 0.998 0.446 0.415 1.07
BR8218 SL 1st Sept. 2008 2 2.77 17.4 1.016 0.658 0.482 1.37
BR8217 SL 1st Sept. 2008 4 2.72 17.4 1.010 0.633 0.476 1.33
BR8216 SL 1st Sept. 2008 7 2.69 17.6 1.009 0.612 0.462 1.33
BR8221 Bedload 1st Sept. 2008 12 5.11 41.7 1.004 0.397 0.372 1.07
BR8253 SL 10th Sept. 2008 0 2.86 18.0 1.018 0.702 0.483 1.45
BR8251 SL 10th Sept. 2008 5 2.63 17.2 1.012 0.623 0.464 1.34
BR8281 SL 22th Sept. 2008 0 3.02 18.8 1.015 0.753 0.488 1.54
BR8280 SL 22th Sept. 2008 6 2.97 18.9 1.015 0.657 0.476 1.38
BR8283 Bedload 22th Sept. 2008 12.5 2.38 16.4 1.007 0.485 0.442 1.10
anges tributaries
Chambal (#4, 26839.450 N, 77854.150 E)
BR938 Bank Aug. 2009 – 1.24 8.47 1.010 0.524 0.446 1.18
omti (#5, 25834.660 N, 83859.920 E)
BR8126 SL Aug. 2008 0 4.00 19.6 0.993 0.747 0.619 1.21
osi Upstream (#6, 26850.890 N, 8789.080 E)
PB68 SL July 2005 0 4.37 23.0 1.005 0.630 0.576 1.09 0.52
PB65 SL July 2005 3 4.26 21.8 1.003 0.635 0.594 1.07 0.54
PB70 Bank July 2005 – 2.68 14.9 0.994 0.560 0.547 1.02 0.51
osi Downstream (#7, 25825.120 N, 87813.660 E)
BR103 Bedload Aug. 2001 – 3.44 25.0 1.008 0.475 0.418 1.14 0.55
alytical uncertainties are based on external reproducibility of synthetic standard solutions, rock standards and rock samples and are estimated to be �2%
U and Th content, 0.5% for (234U/238U), �2% for (230Th/232Th) and (238U/232Th) and 2% for (230Th/238U). (234U/238U) activity ratios are calculated from
asured 234U/235U isotopic ratios assuming that 238U/235U = 137.88. Parenthesis means activity ratios hereafter calculated using the following decay
nstant: l238 = 1.551 � 10�10 y�1, l234 = 2.826 � 10�6 y�1, l232 = 4.948 � 10�11 y�1 and l230 = 9.158 � 10�6 y�1 (Akovali, 1994; Cheng et al., 2000). Five
rcent of uncertainty for the Th/Nd ratios. SL: Suspended Load, #: position on the map

(2
waoscpndarthnstikaSlaaromina(NcinTtrsU
F
tr
w
se
F
K
b
G
F. Chabaux et al. / C. R. Geoscience 344 (2012) 688–703 693
38U/232Th), (234U/238U) and (230Th/232Th) activity ratios,hich is obviously insufficient to precisely determine the
ge of the downstream sample relative to the upstreamne, and the eight mobility parameters of the model. Theolving approach, developed for solving such under-onstrained problem, aims to find a set of plausiblearameters (here the mobility parameters ki, fi of the fouruclides 238U, 234U, 230Th, 232Th) and the age of theownstream sediment relative to the upstream one) fromn a priori set of parameters, which fits best the activityatios in a least square frame work. In the present study,
e solving approach developed to perform the determi-ation of these unknown parameters is a paralleltochastic Quantum-behaved Particle Swarm Optimiza-on (Mikki and Kishk, 2005; Sun et al., 2004). To ournowledge, it is probably the first time that such anpproach is used for this kind of problem in geochemistry.uch a method is well-adapted: (1) for situations whererge numbers of parameters and low numbers of data are
vailable (present case); and (2) for cases where an a priorielationship can be proposed for the different parameters,r at least some of them (more detail in Appendix A). Forodelling the Ganges and the Kosi river data, some a prioriformation can be indeed provided on the values of the U
nd Th mobility parameters. The Th/Nd elemental ratiosd can be seen as a relatively immobile element) of the
oarse-grained and fine-grained sediments are relativelyvariant from upstream to downstream locations (Fig. 3).
his implies that sediment weathering during theiransfer and residence within the alluvial plain does not
ignificantly mobilize Th, which is clearly not the case for. This therefore justifies considering Th to be immobile
(kTh and fTh � 0). Furthermore, from the literature data itcan be seen that the kU parameters range from 10�7 to 10�4
y�1 (e.g., Andersen et al., 2009; Dequincey et al., 2002;Dosseto et al., 2008b; Vigier et al., 2001). In the presentstudy, we expanded the a priori interval of variations for kU
to the interval 10�9–10�3 y�1. In addition, as in the Gangessystem, the U activity ratios of waters are > 1 and < 1.5(Chabaux et al., 2001; Granet et al., 2007), the k234/k238
ratios and f234/f238 ratios (with k and f the model mobilityparameters) are also suggested to be in range between 1and 1.5. Thus f234/f238 ratios can indeed be assimilated tothe activity ratios of the incoming U input whereas k234/k238 ratios represent the differential removal of 234Urelative to 238U for leaching processes. Therefore, bothratios should have values close to those of river water ofthe studied region.
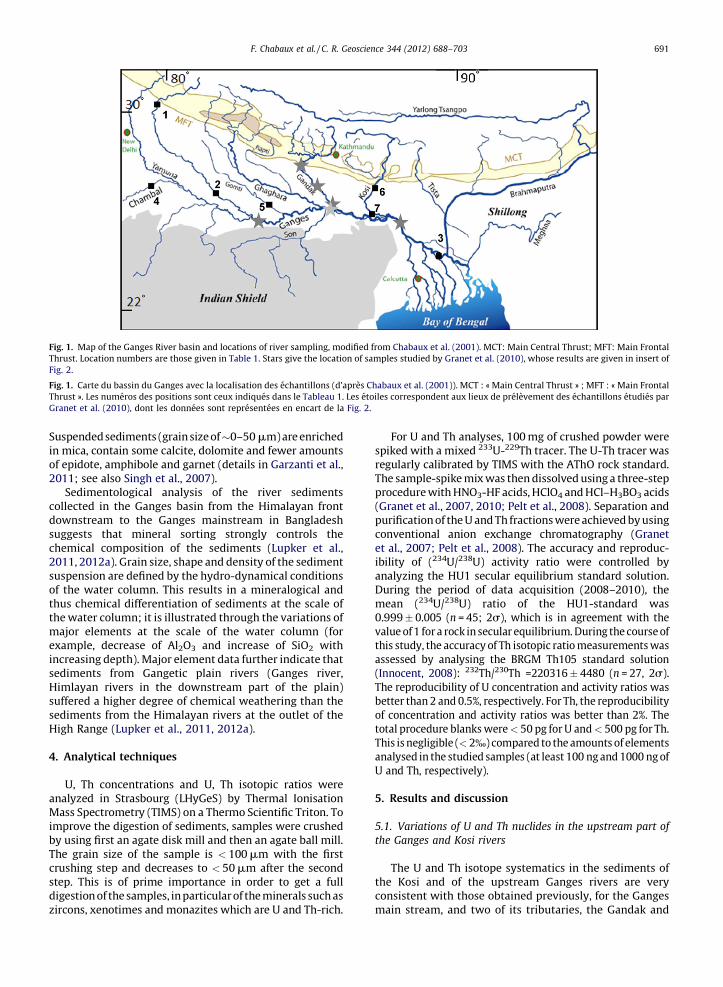
Solving Eqs. (1)–(4) with the above intervals of a priorivalues for the mobility parameters leads to transfer timesof 90 ky to 170 ky for bedload sediments collected betweenRishikesh and Kanpur (with k238 leaching coefficientsranging from 10.3 � 10�5 y�1 to 0.66 � 10�5 y�1) (Fig. 4,Table 2a), and from 100 to 170 ky for the Kosi river (with ak238 parameter ranging from 4.3 � 10�5 y�1 to 1.3 � 10�5
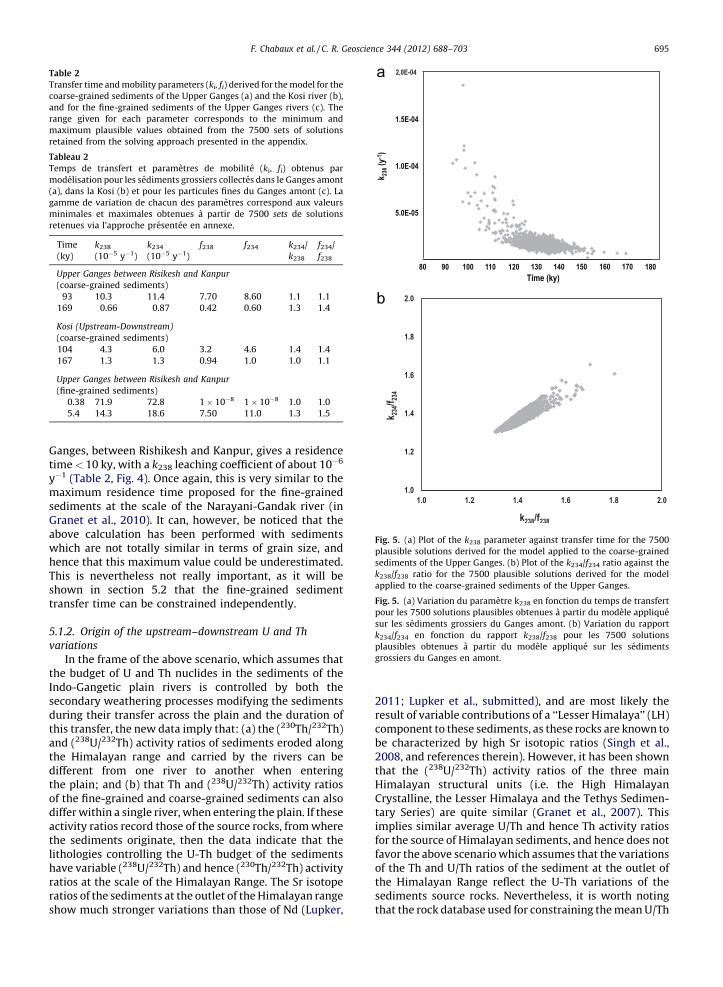
y�1) (Fig. 4, Table 2b). The results of the model also suggestthat the different mobility parameters depend on eachother and on the transfer time. Thus, the above values ofsediment transfer time for both Ganges and Kosi rivers arelinked to the value of the k238 leaching parameters (Fig. 5a),whereas the ratios k238/f238 and k234/f234 are correlatedwith each other (Fig. 5b).
Even if it is clear that supplementary sedimentsamples would be required to get a better precision of
ig. 2. Plot of the sediment data points in the (230Th/232Th) vs (238U/232Th) diagram for the sediment samples from Rishikesh (black squares), Kanpur (white
iangles), Kosi downstream (grey triangles) and Kosi upstream (grey squares) rivers. Larger symbols are used to indicate bedload and bank river sediments,
hereas the same but smaller symbols are used to indicate suspended river materials. Insert: data from Granet et al. (2010) for the Narayani-Gandak river
diments.
ig. 2. Representation des donnees dans le diagramme (230Th/232Th) vs (238U/232Th) pour les sediments de riviere collectes a Rishikesh (carres noirs),
anpur (triangles blancs), la Kosi aval (triangles gris), la Kosi amont (carres gris). Les symboles plus gros indiquent les sediments de fond/sediments de
erge, les memes symboles mais plus petits sont utilises pour les sediments en suspension. Encart : donnees de Granet et al., 2010 pour les sediments de la
andak et du Ganges.

thpoUptimrivbeet
Fig
Ko
at
Fig
bla
de
Fig
da
Fig
est
F. Chabaux et al. / C. R. Geoscience 344 (2012) 688–703694
e coarse-grained sediment transfer time, the importantint to stress here, is that the new data obtained for theper Ganges and Kosi rivers confirm the long transfere of bank sediments within alluvial plains of the Ganges
er system (Granet et al., 2007, 2010). This result might surprising in the light of 10Be data for instance (Lupker
al., 2012b), which indicates that the denudation rates are
one order of magnitude shorter than the above U/Thtransfer times. A specific study comparing the results of theU-Th and 10Be methods is certainly required to constrainthe origin of such an apparent discrepancy. This, however,is beyond the scope of this study.
The same solving approach applied to the fine-grainedsediment end-member from the upstream part of the
0
2
4
6
8
10
12
14
0.00 0.1 0 0.20 0.30 0.4 0 0.50 0.6 0 0.7 0 0.8 0 0.9 0 1.00
Dept
h (m
)
Th/Nd
Rishikesh
Kanpur
Kosi downstream
Kosi upstream
. 3. Depth-variations of Th/Nd ratios for the sediments of the Rishikesh (black squares), Kanpur (white triangles), Kosi downstream (grey triangles) and
si upstream (grey squares) sampling locations. As no depth has been allocated to the bedload, these latter and bank samples were defined for this graphic
a depth of 12 m.
. 3. Variations des rapports Th/Nd en fonction de la profondeur pour les sediments de riviere collectes a Rishikesh (carres noirs), Kanpur (triangles
ncs), Kosi aval (triangles gris) et Kosi amont (carres gris). Comme les profondeurs des sediments de berge et de certains sediments de fond ne sont pas
finies, une valeur arbitraire de 12 m a ete utilisee.
. 4. Time interpretation for the U-Th variations of river sediments in the (230Th/232Th) vs (238U/232Th) diagram. Insert: previous estimates based on U-Th
ta from Gandak and Ganges sediments (Granet et al., 2010).
. 4. Interpretation en terme de temps de transfert des variations U-Th des sediments dans le diagramme (230Th/232Th) versus (238U/232Th). Encart:
imations faites a partir des donnees U-Th des sediments de la Gandak et du Ganges (Granet et al., 2010).
GtiymsGawhTstr
5
v
thInsdthathdthodathlihrrs
T
T
c
a
ra
m
re
T
T
m
(a
g
m
re
F. Chabaux et al. / C. R. Geoscience 344 (2012) 688–703 695
anges, between Rishikesh and Kanpur, gives a residenceme < 10 ky, with a k238 leaching coefficient of about 10�6
�1 (Table 2, Fig. 4). Once again, this is very similar to theaximum residence time proposed for the fine-grained
ediments at the scale of the Narayani-Gandak river (inranet et al., 2010). It can, however, be noticed that thebove calculation has been performed with sedimentshich are not totally similar in terms of grain size, andence that this maximum value could be underestimated.his is nevertheless not really important, as it will behown in section 5.2 that the fine-grained sedimentansfer time can be constrained independently.
.1.2. Origin of the upstream–downstream U and Th
ariations
In the frame of the above scenario, which assumes thate budget of U and Th nuclides in the sediments of thedo-Gangetic plain rivers is controlled by both the
econdary weathering processes modifying the sedimentsuring their transfer across the plain and the duration ofis transfer, the new data imply that: (a) the (230Th/232Th)
nd (238U/232Th) activity ratios of sediments eroded alonge Himalayan range and carried by the rivers can be
ifferent from one river to another when enteringe plain; and (b) that Th and (238U/232Th) activity ratios
f the fine-grained and coarse-grained sediments can alsoiffer within a single river, when entering the plain. If thesectivity ratios record those of the source rocks, from wheree sediments originate, then the data indicate that the
thologies controlling the U-Th budget of the sedimentsave variable (238U/232Th) and hence (230Th/232Th) activityatios at the scale of the Himalayan Range. The Sr isotopeatios of the sediments at the outlet of the Himalayan range
2011; Lupker et al., submitted), and are most likely theresult of variable contributions of a ‘‘Lesser Himalaya’’ (LH)component to these sediments, as these rocks are known tobe characterized by high Sr isotopic ratios (Singh et al.,2008, and references therein). However, it has been shownthat the (238U/232Th) activity ratios of the three mainHimalayan structural units (i.e. the High HimalayanCrystalline, the Lesser Himalaya and the Tethys Sedimen-tary Series) are quite similar (Granet et al., 2007). Thisimplies similar average U/Th and hence Th activity ratiosfor the source of Himalayan sediments, and hence does notfavor the above scenario which assumes that the variationsof the Th and U/Th ratios of the sediment at the outlet ofthe Himalayan Range reflect the U-Th variations of thesediments source rocks. Nevertheless, it is worth noting
able 2
ransfer time and mobility parameters (ki, fi) derived for the model for the
oarse-grained sediments of the Upper Ganges (a) and the Kosi river (b),
nd for the fine-grained sediments of the Upper Ganges rivers (c). The
nge given for each parameter corresponds to the minimum and
aximum plausible values obtained from the 7500 sets of solutions
tained from the solving approach presented in the appendix.
ableau 2
emps de transfert et parametres de mobilite (ki, fi) obtenus par
odelisation pour les sediments grossiers collectes dans le Ganges amont
), dans la Kosi (b) et pour les particules fines du Ganges amont (c). La
amme de variation de chacun des parametres correspond aux valeurs
inimales et maximales obtenues a partir de 7500 sets de solutions
tenues via l’approche presentee en annexe.
Time
(ky)
k238
(10�5 y�1)
k234
(10�5 y�1)
f238 f234 k234/
k238
f234/
f238
Upper Ganges between Risikesh and Kanpur
(coarse-grained sediments)
93 10.3 11.4 7.70 8.60 1.1 1.1
169 0.66 0.87 0.42 0.60 1.3 1.4
Kosi (Upstream-Downstream)
(coarse-grained sediments)
104 4.3 6.0 3.2 4.6 1.4 1.4
167 1.3 1.3 0.94 1.0 1.0 1.1
Upper Ganges between Risikesh and Kanpur
(fine-grained sediments)
0.38 71.9 72.8 1 � 10�8 1 � 10�8 1.0 1.0
5.4 14.3 18.6 7.50 11.0 1.3 1.5
Fig. 5. (a) Plot of the k238 parameter against transfer time for the 7500
plausible solutions derived for the model applied to the coarse-grained
sediments of the Upper Ganges. (b) Plot of the k234/f234 ratio against the
k238/f238 ratio for the 7500 plausible solutions derived for the model
applied to the coarse-grained sediments of the Upper Ganges.
Fig. 5. (a) Variation du parametre k238 en fonction du temps de transfert
pour les 7500 solutions plausibles obtenues a partir du modele applique
sur les sediments grossiers du Ganges amont. (b) Variation du rapport
k234/f234 en fonction du rapport k238/f238 pour les 7500 solutions
plausibles obtenues a partir du modele applique sur les sediments
grossiers du Ganges en amont.
hat the rock database used for constraining the mean U/Th
how much stronger variations than those of Nd (Lupker, t
ranoasHiesU
prblSinsprethrivpethpratdaHico(23
atva
sewtiosemrato(Gfra(23
frovaalothwincoouthdihodihythof
5.2
gr
thcoraachiInde
F. Chabaux et al. / C. R. Geoscience 344 (2012) 688–703696
tios of the three main Himalayan lithologies is probablyt entirely representative of the whole Himalayan Range,
it mainly comprises rocks from the Central Nepalmalaya. In addition, it is not perfectly adapted totimate the U/Th ratios of these units, as the budget ofand Th in sediments could be significantly affected by theesence of minor lithologies such as leucogranites andack shales, which are U and Th-rich (Chabaux et al., 2001;
gh et al., 2003). The geographical repartition of suchecific lithologies is not perfectly known. Their occur-nce along the High Range might control the variations ofe (238U/232Th) and (230Th/232Th) activity ratios in theer sediments at the outlet of the Range. The analysis ofbbles collected in different Himalayan rivers, as done fore Narayani-Gandak river (Granet et al., 2010), couldovide additional information to test this hypothesis. But
this stage and keeping in mind the above limitations, theta base for estimating the average U/Th ratio of themalayan structural units rather excludes a scenario thatnsiders the variations of the (238U/232Th) and0Th/232Th) activity ratios in the Himalayan sediments
the outlet of the High Range to be the result of theriabilities of the U-Th signatures of the source rocks.Therefore, as an alternative, we propose that the
diments, which arrive in the Indian plain, have beeneathered sufficiently long time to allow for a modifica-n of their U-Th values. It has been shown that the
diments carried by the Kali Gandaki river, one of theain Nepalese streams flowing within the Himalayannge, have been weathered for a relatively long period (up 100 ky) before their removal and transport by the riversranet et al., 2007). These weathering processes canctionate U and Th and produce sediments with8U/232Th) and (230Th/232Th) activity ratios differentm those of the unaltered Himalayan rocks. In this case,riations in the intensity of these weathering processesng the High Range might explain why the sediments of
e different Himalayan rivers have different U/Th ratioshen they enter the Indian plain. The difference observed
the U-Th systematics of fine-grained sediments andarse-grained sediments in the Himalayan rivers at thetlet of the range would then indicate that in function ofe granulometry: (1) the sediments originate fromfferent geographical areas or from different pedologicalrizons; or (2) the sediments are transported over
fferent time-scales. In order to better constrain thesepotheses, it is now of prime importance to study in detaile U-Th systematics of the sediments from the High Range
the Himalaya.
. Variations of the U and Th isotopes ratios in the fine-
ained sediments at the outlet of the Ganges river
As for sediments of the two other sampling locations,e Ganges sediments collected at its outlet, before thenfluence with the Brahmaputra, display a relatively widenge of variations in their (238U/232Th) and (230Th/232Th)tivity ratios, with low values in bedload sediments andgh values in the suspended sediments (Table 1, Fig. 6a). the isochron diagram (Fig. 6a), the data points also
sorting) relationships between a coarse-grained and a fine-grained sediment end-member. In detail, however, thedata points plot along different mixing trends, relativelyclose to each other for all the suspended sedimentscollected in 2008, whereas the 2004 data points plot
Fig. 6. (a) Plot of the sediment data points in the (230Th/232Th) versus
(238U/232Th) diagram for Harding bridge samples. Larger symbols are used
to indicate bedload and bank river sediments, whereas the same but
smaller symbols are used to indicate suspended river materials. (b)
Comparison with data points of suspended sediments collected in the
Chambal river, the Himalayan rivers at the outlet of the Himalaya range,
and the Himalayan river in the plain.
Fig. 6. (a) Representation dans le diagramme (230Th/232Th) versus
(238U/232Th) des donnees des sediments collectes a Harding Bridge. Les
symboles plus gros indiquent les sediments de fond/sediments de berge,
les memes symboles mais plus petits sont utilises pour les sediments en
suspension. (b) Comparaison avec les donnees des sediments en
suspension pour la Chambal, les rivieres himalayennes en sortie de
chaine, et les rivieres himalayennes dans la plaine.
Data source: this study–Granet et al., 2010.
arly along a different trend. Such a difference suggests
fine linear trends, which again might reflect mixing (or cle
theavom(2cbGmoototh
eaisoecththseisdbGins2mcainsu(splo(2
tea(2
thasrUcticthin2InMd
F. Chabaux et al. / C. R. Geoscience 344 (2012) 688–703 697
at the U-Th characteristic of the fine-grained sedimentnd-members can vary significantly from one year tonother and probably also within a year; significantariations of the (238U/232Th) and (234U/230Th) ratios arebservable, whereas the Th and U activity ratios remainore or less invariant for the different sampling periods004 and 2008). If the U-Th variations between sediments
ollected in 2008 and 2004 do not result from a samplingias, they imply that the transfer of sediments for theanges is not stationary over a few years, or even a fewonths. The immediate corollary is that the transfer time
f the fine-grained end-member of the Ganges sedimentsr at least of one of its components is much shorter than 10
20 ky (Granet et al., 2010; previous section), probably ofe order of the year or less.The geochemical variations in the fine-grained sediment
nd-member are not only reflected by the U/Th ratios butlso by major element concentrations and deuteriumotope ratios in sediments regularly collected at the outletf the Ganges over the 2002–2010 years/period (Lupkert al., 2012a). These latter are assumed to be the result ofhanges in the proportion of sediment contributions frome South Ganges tributaries (mainly the Chambal river) ande Himalayan rivers. Although the number of Chambal
ediments analyzed for U and Th is small (this study; Sarint al., 1990), the position of these sediment data points in theochron diagram and in the (234U/238U) versus (230Th/238U)iagram (not shown) indicates that this assumption cannote upheld as an explanation for the U-Th variations in theanges sediment end-member. In the isochron diagram forstance, the data points representative of the Chambal
uspended sediments plot between the suspended 2008 and004 sediments and, therefore, cannot be a mixing end-ember (Fig. 6b). An alternative mixing scenario, which
ould be proposed to explain the difference between 2004nd 2008 suspended sediments (Fig. 6b), would be toterpret the particular U-Th characteristics of the 2004
ediments by a stronger sediment contribution frompstream Ganges tributaries relative to plain sedimentsediments from Gandak and Ghaghara river on the Indianlain for instance). However, again, this scenario fails whenoking at the position of the data in the (234U/238U) vs30Th/238U) diagram (not shown).
Not only for these reasons, but also because themporal variations are observed for the (238U/232Th)
ctivity ratios (and 230Th/238U ratios) and not for the30Th/232Th) (nor the (234U/238U) ratios) at the outlet ofe Ganges, we suggest that these variations may reflect
nnual changes in the degree of weathering of the Gangesuspended sediments. In such a scenario the lower U/Thatios of the 2004 suspended sediments point to a smaller
loss and hence a smaller degree of weathering than in thease of the 2008 suspended sediments. Such an explana-on is consistent with the observation that the amount ofarbonates in the 2004 sediments (6 to 8%) is higher than in
e 2008 sediments (3–4%) (carbonate concentrations Lupker et al., 2012a). It may be related to the fact that in
004 the monsoon was much less intense across the wholedo-Gangetic plain than in 2008 (data from the Indiaeteorological Department, http://imd.gov.in/section/hy-
ro/distrainfall/districtrain.html). Such a relation between
the weathering intensity of sediments and the rainfallintensity is quite possible in view of the relationshipsbetween weathering fluxes carried by rivers and the riverdischarge observed at both regional or local scale (Millotet al., 2002; Olivia et al., 2003; Viville et al., 2012 andreferences therein).
5.3. U-Th disequilibrium in the bedload sediments of the
Ganges outlet
As observed in the isochron diagram (Fig. 6), the(238U/232Th) and (230Th/232Th) activity ratios of the bed-load sediments collected at the outlet of the Ganges basinvary significantly over the 2004–2008 period. The range ofvariation is smaller than observed for the upstream anddowstream sediments of the Upper Ganges or the Kosiriver. It is, however, very similar to the upstream-downstream variation in the Gandak river sediments(Granet et al., 2007). Such annual variations within a singlelocation are unexpected for a scenario of long sedimenttransfer time (� 100 ky or more) within the plain andmight question the reliability of such estimates.
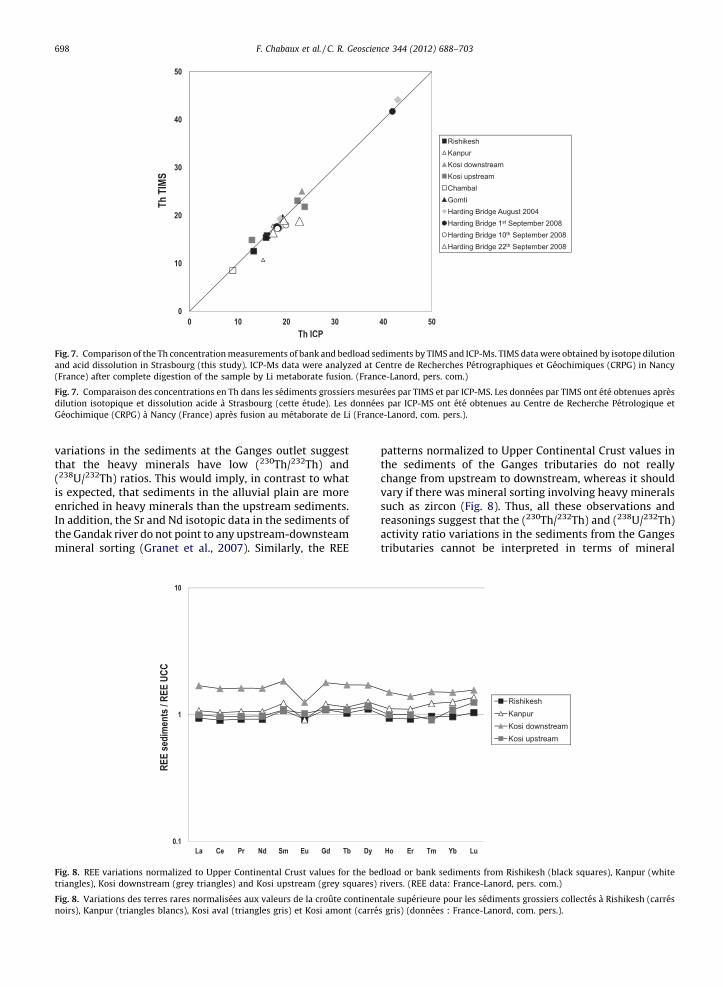
Looking in more details at the data, one observes thatthe two samples with the lowest (238U/232Th) and(230Th/232Th) activity ratios are the most enriched in Uand Th (Table 1). In addition, these two samples haverelatively high Zr and Hf concentrations, whereas thesample with the highest (230Th/232Th) activity ratio haslower Zr content (unpublished data, France-Lanord per-sonal communication). This certainly indicates that theobserved variations result from variation in the proportionof minor heavy minerals within the sediments; Garzantiet al. (2010) have indeed shown that Th and U in bedloadsediments are mainly contained in minor minerals (zircon,monazite, allanite and xenotime), whereas in the sus-pended sediments they are mainly carried by clayminerals. The rock dissolution and grinding procedurewas modified a few years ago to avoid the existence ofresidual and undissolved minerals (Granet et al., 2010)and, thus, also applied in this study. It allows for a completedissolution of minerals; this is validated by U and Thconcentration reproducibility tests of Ganges river sedi-ments, but also by the good consistency obtained in thisstudy between the Th concentrations determined by TIMSand by ICP-MS (Fig. 7); the ICP-MS determinations havebeen performed after a complete digestion of the sampleby Li metaborate fusion. We therefore consider that theobserved variation of the Th and U/Th activity ratios in theGanges sediments over the 2004–2008 period is real andnot a consequence of analytical bias. Such a variationmight point to a very fast transfer of the coarse sediments(or at least a part of it) within the Ganges basin as alreadyproposed for the fine-grained sediment end-member. Inthis case, the upstream-downstream variation reported forthe (230Th/232Th) and (238U/232Th) activity ratios insediments of the Ganges tributaries (Kosi river, Ghagharariver, Gandak river, Upper Ganges river) can no longer beinterpreted in terms of long transfer time. They shouldrather be interpreted in terms of mineral sorting along therivers flow path (with logically preferential upstreamdepositions of heavy minerals). Th and U/Th activity ratio
vath(23
is
enInthm
Fig
an
(Fr
Fig
dil
Ge
Fig
tri
Fig
no
F. Chabaux et al. / C. R. Geoscience 344 (2012) 688–703698
riations in the sediments at the Ganges outlet suggestat the heavy minerals have low (230Th/232Th) and8U/232Th) ratios. This would imply, in contrast to whatexpected, that sediments in the alluvial plain are moreriched in heavy minerals than the upstream sediments.
addition, the Sr and Nd isotopic data in the sediments ofe Gandak river do not point to any upstream-downsteamineral sorting (Granet et al., 2007). Similarly, the REE
patterns normalized to Upper Continental Crust values inthe sediments of the Ganges tributaries do not reallychange from upstream to downstream, whereas it shouldvary if there was mineral sorting involving heavy mineralssuch as zircon (Fig. 8). Thus, all these observations andreasonings suggest that the (230Th/232Th) and (238U/232Th)activity ratio variations in the sediments from the Gangestributaries cannot be interpreted in terms of mineral
. 7. Comparison of the Th concentration measurements of bank and bedload sediments by TIMS and ICP-Ms. TIMS data were obtained by isotope dilution
d acid dissolution in Strasbourg (this study). ICP-Ms data were analyzed at Centre de Recherches Petrographiques et Geochimiques (CRPG) in Nancy
ance) after complete digestion of the sample by Li metaborate fusion. (France-Lanord, pers. com.)
. 7. Comparaison des concentrations en Th dans les sediments grossiers mesurees par TIMS et par ICP-MS. Les donnees par TIMS ont ete obtenues apres
ution isotopique et dissolution acide a Strasbourg (cette etude). Les donnees par ICP-MS ont ete obtenues au Centre de Recherche Petrologique et
ochimique (CRPG) a Nancy (France) apres fusion au metaborate de Li (France-Lanord, com. pers.).
0.1
1
10
La Ce Pr Nd Sm Eu Gd Tb Dy Ho Er Tm Yb Lu
REE
sedi
men
ts / R
EE U
CC
Rishikesh
Kanpur
Kosi downstream
Kosi upstream
. 8. REE variations normalized to Upper Continental Crust values for the bedload or bank sediments from Rishikesh (black squares), Kanpur (white
angles), Kosi downstream (grey triangles) and Kosi upstream (grey squares) rivers. (REE data: France-Lanord, pers. com.)
. 8. Variations des terres rares normalisees aux valeurs de la croute continentale superieure pour les sediments grossiers collectes a Rishikesh (carres
irs), Kanpur (triangles blancs), Kosi aval (triangles gris) et Kosi amont (carres gris) (donnees : France-Lanord, com. pers.).

sstoUGfothwsmccrm(Gsadpdoebbpsmd
6
sbasaudGarUdctisom
thsdfothvrwrvb
F. Chabaux et al. / C. R. Geoscience 344 (2012) 688–703 699
orting, and hence reflect long transfer time for theediments within the plain. It is therefore a priori difficult
involve short sedimentary transfer time to account for the-Th variations observed in the bedload collected at theanges basin outlet over the period 2004–2008. We proposer this reason that such variations might simply be linked toe sampling procedure of the bedload by dredging, whichould not allow for the collection of a representative
ediment sample especially with respect to the amount ofinor minerals. The difference in the mineral densities,
ombined with the local dynamics of stream waters mightause local redistributions of sediments and minerals on theiver bottom with formations of ‘‘placer’’ enriched in heavy
inerals and ‘‘anti-placer’’ zones depleted in heavy mineralsarzanti et al., 2010). Thus, dredging might imperfectly
ample all these different sediment types and result in anrtificial mineralogical and, hence, U-Th variability whenifferent bedload sediments have been collected at differenteriods. The real impact of such a sampling bias is, however,ifficult to correctly assess on the basis of our data alone. Itbviously creates an additional uncertainty on the estimat-d sediment transfer time. However, it seems that estimatesased on bank sediment analysis and not on dredgededloads, as done for the Gandak and Ghaghara rivers, arerobably more reliable. Indeed such samples are compositeamples (see Section 3), which probably allow one to get aore representative coarse-grained sediment than by
redging.
. Conclusions
The new U and Th data presented in this study foruspended and coarse-grained sediments (bedload andank sediments) from the Upper Ganges and the Kosi riversre entirely consistent with the 238U-234U-230Th-232Thystematics obtained previously for the Ganges main streamnd two of its tributaries (Granet et al., 2007, 2010): anpstream–downstream variation of the 238U-234U-230Thisequilibria in the sediments along the rivers within theanges plain, with different variation trends for suspendednd coarse-grained sediments. Assuming that such trendsesult from the combination of both radioactive decay and-Th fractionations associated to the sediment weatheringuring its transit and storage in the plain, the above dataonfirm the occurrence of very different sediment transfermes which strongly depend on their grain size: muchhorter transfer time for the fine-grained sediment (a few kyr less) than for the coarse-grained sediment (100 ky orore).
The fine-grained sediment end-members collected ate Ganges outlet in 2004 and 2008, however, show
ignificantly different 234U/230Th activity ratios. Thisifference is most probably an indication of a quick transitr the fine-grained sediment end-member (of the order ofe year or less) within the plain. It is proposed that the
ariation of the U/Th ratio in this sediment end-memberesults from a significant difference in the intensity ofeathering of these sediments during their transfer in the
ivers from one year to another. Conversely, the U-Thariations observed in the bedload collected at the Ganges
short sediment transfer time. They probably are the resultof dredging; this kind of sampling might not allow for thecollection of a representative sediment sample, especiallywith respect to minor minerals that carry U and Th. Itresults in an artificial U-Th variability in the differentbedload sediments collected at different periods andcertainly induces an uncertainty on the estimated sedi-ment transfer time. This uncertainty, however, could bereduced when bank sediments can be studied instead ofbedload sediments.
Acknowledgments
The financial support by the INSU/CNRS, the REALISEnetwork and the University of Strasbourg over the 2001-2010 period has allowed the development of the study of238U-series disequilibria in sediments and more generallyon environmental samples in Strasbourg laboratory. Allthese French research organizations are warmly thankedfor their support. The Simone and Cino Del DucaFoundation is also thanked for support to FC in 2005.Estelle Blaes acknowledges the Region Alsace and the CNRS(BDI), France, for the funding of her Ph.D. scholarship, andthe University of Strasbourg for a temporary lecturer(ATER) position in 2010. A part of this study has beenperformed in the frame of the ‘‘Calimero’’ ANR project.M. Lupker and C. France-Lanord are thanked for thesamples provided for this study. Discussions withP. Ackerer, C. France-Lanord and M. Lupker during thecourse of this study were very appreciated. We are alsovery grateful to F. Delay for his insightful comments on themanuscript. Review by M. Lupker helped to improve themanuscript. This is a EOST-LHyGeS contribution.
Appendix A. Solving approach for model equations
The gain and loss model used to interpret the radioactive
disequilibrium variations along the river stream is described
by the ordinary differential equation system given in section
2 (Eqs. (1) to (4)), whose analytical solutions can be found in
Chabaux et al. (2012). A stochastic bound constrained
optimization algorithm based on a particle swarm technique
has been constructed and used to perform the calculation of
the leaching rate and input flux constants (k238, f238
coefficients) of each nuclide and the transfer time. The
optimization algorithm uses the measured (234U/238U),
(230Th/238U), (238U/232Th) and (230Th/232Th) activity ratios
of each sample as constrains for the model.
A.1. Particle Swarm Optimization (PSO) algorithm
Classical techniques using population-based evolutionary
systems such as particle Swarm Optimization (PSO, e.g.,
Kennedy and Eberhart, 1995) are intended to mimic the
evolution of a social organism, in which individuals (also
called ‘‘particles’’ or ‘‘bees’’) describe the candidate solution
o a designed problem. Each particle flies through a
asin outlet over the period 2004-2008 cannot result from t
pr
op
po
ea
th
po
po
sw
pa
m
nni
xni j
wfotimswthbebestethveanacnudogu(oswbepapadeinPa
m
m
we
j�h
wnipath
wa
fu
pr
Cj of
to
F. Chabaux et al. / C. R. Geoscience 344 (2012) 688–703700
escribed and bounded multidimensional space to find the
timal solution. Each individual evaluates its current
sition with reference to a goal (the objective function at
ch iteration). Particles are allowed to share memories of
eir best position in a prescribed local neighborhood. These
sitions are then used to update particle velocities and
sitions (see the following Eqs. (5) and (6)). Let M be the
arm size and D the size of the search domain (number of
rameters). In the original PSO version, each M-particle
oves inside the D-dimensional search space according to:
þ1j ¼ nn
i j þ c1rand1 Pni j � xn
i j
� �þ c2rand2 Pn
gi � xni j
� �(5)
þ1 ¼ xni j þ Dtnnnþ1
i j (6)
here xi j tnð Þ ¼ xni j is the position vector of the ith-particle
r the jth-parameter at the time iteration tn and Dtn is thee step, Pg tð Þ ¼ Pg1 tð Þ; Pg2 tð Þ; :::; PgD tð Þ
� �is the global best
arm position vector i.e. the best sought position amonge whole set of individuals and over all the times stepstween 0 and tn and Pi tð Þ ¼ Pi1 tð Þ; Pi2 tð Þ; :::; PiD tð Þð Þ is thest position experienced by particle i over all the timeps between 0 and tn. Each particle can be represented by
e position vector xi tð Þ ¼ xi1 tð Þ; xi2 tð Þ; :::; xiD tð Þð Þ and thelocity vector ni tð Þ ¼ ni1 tð Þ; ni2 tð Þ; :::; niD tð Þð Þ for i = 1,. . .,Md j = 1,. . .,D. The parameters c1 and c2 are called theceleration coefficients and rand1, rand2 are randommbers distributed uniformly between 0 to 1. Thewnside of PSO is that global convergence cannot bearanteed. Classical PSO systems must be bound statesr conditioned states) to guarantee collectiveness of thearm. Therefore quantum PSO (QPSO) technique hasen developed by Sun et al. (2004). In traditional PSO,rticles move ‘‘freely’’ in a finite zone whereas in QPSO,rticles, bounds or more exactly prescribed probabilitynsity functions rule the particle motion at any position
the whole feasible search space.Quantum-behavedrticle Swarm Optimization (QPSO) algorithm
In QPSO approach, all particles move under quantum-
echanical rules rather than classical Newtonian random
otion. In quantum mechanics, the governing equation is the
ll-known time-dependent Schrodinger equation
@@t
C x; tð Þ ¼ HC x; tð Þ (7)
here H ¼ � �h2
2mr2 þ V xð Þ is a time-independent Hamilto-
an operator, 9 is Planck’s constant, m is the mass of therticle and V(x) is the potential energy of the particle ate vector position x.
The unknown in the previous Schrodinger equation is the
ve function C x; tð Þ. In the QPSO approach, the wave
nction is a spatially distributed function measuring the
obability of a particle motion and obeying to the norm
x; tð Þj2. Clerc and Kennedy, 2002 showed that convergence
the algorithm might be achieved if each i-particle moves
ward its local attractor. During the optimization procedure,
all ‘‘bees’’ are flying towards the optimum location defined by
vector p(t).
Let the ith-particle local attractor be a vector pi with
coordinates in the D-dimensional parameter space
pi j j ¼ 1; :::; Dð Þ with:
pi j tð Þ ¼ fPi j tð Þ 1 � fð ÞPg j tð Þ; f ¼ c1rand1
c1rand1 þ c2rand2;
1 � j � D (8)
Equation (8) requires only two random numbers and can
be seen as a stochastic local attractor of the ith-particle. Here,
c1 is called the cognitive parameter and c2 is called the social
parameter. The random scalar w is uniformly distributed
between 0 to 1. In the QPSO approach, the original PSO
system is considered as a quantum-like system, making that
each particle has a quantum behavior with motions ruled by
the wave probability density function (pdf). Different
attractive potential field functions have been tested. A
‘‘reasonable’’ potential field selection is intended to attract
particles towards the center of the potential field. However,
such convergence speed is achieved while sacrificing an even
search activity over the whole space of parameters.
For the sake of simplicity let us take particles moving in a
one-dimensional parameter space and let us define r as r = x-
p, where x is the current particle position and p is the average
best position. We present here the simplest potential, the so-
called delta-well function given by V xð Þ ¼ �gd x � pð Þ ¼�gd rð Þ where g is proportional to the depth of the well. In
QPSO optimization, we are only interested in bounds states
given by the stationary states i.e. the wave envelope function
(Mikky and Kishk, 2005). Assuming the principle of separa-
tion for time and space variables in the wave function, the
time-independent solution of the Schrodinger equation, i.e.,
the so-called wave envelope function is given by:
c rð Þ ¼ 1ffiffiffiLp e� rj j=L (9)
where E represents the particle energy, c rð Þ the waveenvelope, L = 92/mg is the characteristic length of thepotential well, m the mass particle, g the intensity (depth)of the potential well and jrj = jx-pj. We note that thissolution is very similar to the classical solution to ahomogeneous diffusion problem with a delta-Diracfunction as sink-source term.
It can be shown that following this potential field, we have
an analytical expression for the probability density function
(pdf) of the particle’s motion. The probability density
function Q is thus given by
Q rð Þ ¼ c rð Þð Þ2 ¼ 1
Le�2 rj j=L (10)
and the corresponding probability distribution function F
is
F rð Þ ¼ 1 � e�2 rj j=L (11)
p
N
th
‘‘
M
m
fo
th
e
u
th
a
s
x
is
x
wbfoamism
m
wpQmYL
x
wethpsebaeppspa
F. Chabaux et al. / C. R. Geoscience 344 (2012) 688–703 701
Now, one needs to link the above quantum description
rovided by the wave function (Eqs. (10) and (11)) and a
ewtonian description of the particle motion. The next step is
erefore to measure the position of the particle i.e.
collapsing the quantum state to the classical state’’. A classical
onte Carlo method is used to simulate the process of
easurement. The procedure of simulation is described as
llows. Let v be the random number uniformly distributed in
e interval (0, 1). Substituting v for F(r) leads to 1 � v ¼�2 rj j=L and because u = 1–v is also a random number of
niform distribution between 0 and 1, it becomes obvious
at r ¼ �L=2ln 1=uð Þ.For time dependent Ln (iterative procedure), i.e. Ln ¼ L tnð Þ
nd using r tnð Þ ¼ x tnð Þ � p tnð Þ, one can obtain the random
equence of the position as,
tnþ1ð Þ ¼ p tnð Þ � L tnð Þ2
ln 1=uð Þ (12)
For the D-dimensional search space, the particle position
updated at each iteration step by using:
nþ1i j ¼ pn
i j �Ln
i j
2ln 1=uð Þ; u � U 0; 1ð Þ (13)
here u is a random number with uniform distributionetween 0 and 1 and pn
i j is the ith-particle local attractorr its coordinate j in the D-dimensional parameter space
t time iteration tn. In QPSO, a global point namedainstream vector or mean best position of the population
introduced. The global point, denoted m, is defined as theean of the individual best positions among all particles,
tnð Þ ¼ mn1; :::mn
D
� �¼ 1
M
XM1
Pni1; :::;
1
M
XM1
PniD
!(14)
here M is the population size and Pi is the personal bestosition of particle i. To guarantee the convergence of thePSO algorithm, the crucial condition, L(t)!0 when t!+1ust be satisfied (more details in Sun et al. (2004)).
ielding to a possible expression of L(t) in the formni j ¼ 2a mn
j � xni j
� �.
Hence, one has
nþ1i j ¼ pn
i j � a mnj � xn
i j
� �ln 1=uð Þ (15)
here the parameter a is known as the contraction–xpansion coefficient. The latter can be tuned to controle convergence speed of the algorithms. Other attractive
otential fields have been investigated in the present studyuch as Harmonic Oscillator or Square Well potential. Inssence, all other potential field distributions are compati-le with the notion of convengence beard by QPSOlgorithms (Yukawa potential, Woods-Saxon potential,tc.) but they do not lead to analytical solutions to thearticle motion pdfs which are a crux point to obtain QPSOrocedures easy to implement and rapid to calculate. Theimplest way of improving QPSO without changing theotential field (and the pdf of particle motion) discussed
With exceptions of the swarm size (Number of bees), the
number of maximum iterations and the problem dimension
D, the most important parameter is the contraction-expan-
sion coefficient which is crucial to the dynamical behavior of
each individual and the convergence speed. Results from
several stochastic simulations reported in Sun et al. (2004)
showed that the particle position either converges to its local
optimum when a < 1.78 or diverges when a > 1.8. To
prevent blowing the swarm apart, we set the contraction-
expansion factor to eg0� 1.781 where g0� 0.577 is the Euler-
Mascheroni constant. For practical consideration, the Euler-
Maclaurin method is used to generate a. Values for the
cognitive parameter c1 and the social parameters c2 are better
to be chosen even at c1 = c2 = 2 (see Mikki and Kishk, 2005).
A.2. Optimization of the determination of time-scales of
sedimentary transfer using QPSO
For weathering optimization problem solved by QPSO-
based method, our objective function is the relative squared
error RSE defined by:
RSE ¼X
k¼1;N pt;l¼1;Nact
F l; kð Þ � Fexp l; kð Þs l; kð Þ
� �2
(16)
where F (l, k) is the l-activity ratio at experimental point k
defined in the ‘‘assemble section’’ of the input file, Fexp (l, k)is the measured ratio and s (l, k) the corresponding errorbar at the given point. The optimization process usingQPSO is outlined below.
Choose a suitable potential well (Delta well, Harmonic
well, Square well). Solve the Schrodinger equation to get the
envelope wave function c (r) and then the pdf function of the
particle position.
‘‘Collapse’’ wave function into the bounded region
(absolute/relative bounds) using Monte Carlo procedure.
Initialize the swarm of size MaxBee:
for t = 1 to MaxIter until convergenceCompute the fitness value of each particle with theobjective function defined as RSEUpdate the particle best position Pi
Update the global best position of the swarm Pg
Compute the mean best position m of the swarmfor each particle in the swarmUpdate each component of the particle’s position andadjust the component xi
end forRescale solutions within absolute and relative boundsEvaluate convergenceend for
References
Andersen, M.B., Erel, Y., Bourdon, B., 2009. Experimental evidence for234U-238U fractionation during granite weathering with implicationsfor 234U/238U in natural waters. Geochim. Cosmochim. Acta 73,
4124–4141. bove is to select and control the coefficient a.
Ca
Ca
Ch
Ch
Ch
Ch
Ch
Ch
Ch
Cle
Da
De
De
Do
Do
Do
Do
Do
Ga
Ga
Ga
Gr
Gr
F. Chabaux et al. / C. R. Geoscience 344 (2012) 688–703702
stelltort, S., Van Den Driessche, J., 2003. How plausible are high-frequency sediment supply-driven cycles in the stratigraphicrecord? Sediment. Geol 157, 3–13.
stelltort, S., Van Den Driessche, J., Davy, J.P., 2004. Reply to comment on‘‘How plausible are high-frequency sediment supply-driven cycles inthe stratigraphic record? By Jasper’’. Sediment. Geol. 164, 331–334.
abaux, F., Riotte, J., Clauer, N., France-Lanord, C., 2001. Isotopic tracingof the dissolved U fluxes of Himalayan rivers: implications for presentand past U budgets of the Ganges-Brahmaputra system. Geochim.Cosmochim. Acta 65, 3201–3217.
abaux, F., Riotte, J., Dequincey, O., 2003a. U-Th-Ra fractionation duringweathering and river transport. Rev. Mineral. Geochem. 52, 533–576.
abaux, F., Dequincey, O., Leveque, J., Leprun, J., Clauer, N., Riotte, J.,Paquet, H., 2003b. Tracing and dating recent chemical transfers inweathering profiles by trace-element geochemistry and238U-234U-230Th disequilibria: the example of the Kaya lateritic topo-sequence (Burkina-Faso). C. R. Geoscience 335, 1219–1231.
abaux, F., Granet, M., Pelt, E., France-Lanord, C., Galy, V., 2006.238U-234U-230Th disequilibria and timescale of sedimentary transfersin rivers: Clues from the Gangetic plain rivers. J. Geochem. Explor. 88,373–375.
abaux, F., Bourdon, B., Riotte, J., 2008. U-Series Geochemistry inWeathering Profiles, River Waters and Lakes. In: U-Th Series Nuclidesin Aquatic Systems, Elsevier, pp. 49–104 (Chapter 3).
abaux, F., Ma, L., Stille, P., Pelt, E., Granet, M., Lemarchand, D., di ChiaraRoupert, R., Brantley, S.L., 2011. Determination of chemical weather-ing rates from U series nuclides in soils and weathering profiles:Principles, applications and limitations. Appl. Geochem 26, 20–23.
abaux, F., Blaes, E., Stille, P., di Chiara Roupert, R., Dosseto, A., Pelt, E.,Ma, L., Buss, H.L., Brantley, S.L. Regolith formation rate from U-seriesnuclides: Implications from the study of a spheroidal weatheringprofile in the Rio Icacos watershed. Geochimica et Cosmochimica Acta(2012), http://dx.doi.org/10.1016/j.gca.2012.09.037.
rc, M., Kennedy, J., 2002. The particle swarm: explosion, stability, andconvergence in a multi-dimensional complex space. IEEE Trans.Evolutionary Computation 6, 58–73.
vy, P., Lague, D., 2009. Fluvial erosion/transport equation of landscapeevolution models revisited. J. Geophys. Res. 114 .
Paolo, D.J., Maher, K., Christensen, J.N., McManus, J., 2006. Sedimenttransport time measured with U-series isotopes: Results from ODPNorth Atlantic drift site 984. Earth Planet. Sci. Lett. 248, 394–410.
quincey, O., Chabaux, F., Clauer, N., Sigmarsson, O., Liewig, N., Leprun, J.,2002. Chemical mobilizations in laterites: evidence from trace ele-ments and 238U-234U-230Th disequilibria. Geochim. Cosmochim. Acta66, 1197–1210.
sseto, A., Bourdon, B., Gaillardet, J., Maurice-Bourgoin, L., Allegre, C.,2006. Weathering and transport of sediments in the Bolivian Andes:time constraints from uranium-series isotopes. Earth Planet. Sci. Lett.248, 759–771.
sseto, A., Bourdon, B., Turner, S.P., 2008a. Uranium-series isotopes inriver materials: insights into the timescales of erosion and sedimenttransport. Earth Planet. Sci. Lett. 265, 1–17.
sseto, A., Turner, S.P., Chappell, J., 2008b. The evolution of weatheringprofiles through time: new insights from uranium-series isotopes.Earth Planet. Sci. Lett. 274, 359–371.
sseto, A., Hesse, P.P., Maher, K., Fryirs, K., Turner, S., 2010. Climatic andvegetation control on sediment dynamics during the last glacial cycle.Geology 38, 395–398.
sseto, A., Buss, H.L., Suresh, P.O., 2012. Rapid regolith formation overvolcanic bed rock and implications for landscape evolution. EarthPlanet. Sci. Lett. 337–338, 47–55.
ly, V., France-Lanord, C., Lartiges, B., 2008. Loading and fate of particu-late organic carbon from the Himalaya to the Ganga–Brahmaputradelta. Geochim. Cosmochim. Acta 72, 1767–1787.
rzanti, E., Ando, S., France-Lanord, C., Censi, P., Vignola, P., Galy, V.,Najman, Y., 2010. Mineralogical and chemical variability of fluvialsediments, 1: Bedload sand (Ganga-Brahmaputra, Bangladesh). EarthPlanet. Sci. Lett. 299, 368–381.
rzanti, E., Ando, S., France-Lanord, C., Censi, P., Vignola, P., Galy, V.,Lupker, M., 2011. Mineralogical and chemical variability of fluvialsediments, 2: Suspended-load silt (Ganga-Brahmaputra, Bangladesh).Earth Planet. Sci. Lett. 302, 107–120.
anet, M., 2007. Constantes de temps des processus d’erosion et d’alter-ation dans le systeme himalayen: approche geochimique elementaireet isotopique par les series de l’Uranium. These, Universite Louis-Pasteur, Strasbourg.
anet, M., Chabaux, F., Stille, P., France-Lanord, C., Pelt, E., 2007. Time-scales of sedimentary transfer and weathering processes from U-series nuclides: Clues from the Himalayan rivers. Earth Planet. Sci.Lett. 261, 389–406.
Granet, M., Chabaux, F., Stille, P., Dosseto, A., France-Lanord, C., Blaes, E.,2010. U-series disequilibria in suspended river sediments and impli-cation for sediment transfer time in alluvial plains: the case of theHimalayan rivers. Geochim. Cosmochim. Acta 74, 2851–2865.
Innocent, C., 2008. Intercomparaison de quatre standards isotopiques deTh synthetises au BRGM. Premiers resultats. Rapport BRGM/RP-56066-FR. 36 p., (7 ill.).
Kennedy J., Eberhart, R.C., 1995. Particle swarm optimization. in Proc. IEEEConf. Neural Networks IV, Piscataway, NJ.
Lee, V.E., DePaolo, D.J., Christensen, J.N., 2010. Uranium-series comminu-tion ages of continental sediments: case study of a Pleistocene alluvialfan. Earth Planet. Sci. Lett. 296, 244–254.
Liebault, F., Bellot, H., Chapuis, M., Klotz, S., Deschatres, M., 2012. Bedloadtracing in a high-sediment-load mountain stream. Earth Surf. Process.Landforms 37, 385–399.
Lupker, M., 2011. Dynamique sedimentaire, erosion physiqueet alteration. chimique dans le systeme himalayen. These, l’InstitutNational. Polytechnique de Lorraine, Nancy.
Lupker, M., France-Lanord, C., Lave, J., Bouchez, J., Galy, V., Metivier, F.,Gaillardet, J., Lartiges, B., Mugnier, J.-L., 2011. A Rouse-based methodto integrate the chemical composition of river sediments: applicationto the Ganga Basin. J. Geophys. Res. Earth Surface 116, 1–24.
Lupker, M., France-Lanord, C., Galy, V., Lave, J., Gaillardet, J., Gajurel, A.P.,Guilmette, C., Rahman, M., Singh, S.K., Sinha, R., 2012a. Predominantfloodplain over mountain weathering of Himalayan sediments(Ganga basin). Geochim. Cosmochim. Acta 84, 410–432.
Lupker, M., Blard, P.H., Lave, J., France-Lanord, C., Leanni, L., Puchol, N.,Charreau, J., Bourles, D., 2012b. 10Be-derived Himalayan denudationrates and sediment budgets in the Ganga basin. Earth Planet. Sci. Lett.333–334, 146–156.
Lupker, M., France-Lanord, C., Galy, V., Lave, J., Kudrass, H. Increasingchemical weathering in the Himalayan system since the Last GlacialMaximum. Earth Planet. Sci. Lett. (submitted).
Ma, L., Chabaux, F., Pelt, E., Blaes, E., Jin, L., Brantley, S.L., 2010. Regolithproduction rates calculated with uranium-series isotopes at Susque-hanna/Shale Hills Critical Zone Observatory. Earth Planet. Sci. Lett.297, 211–225.
Ma, L., Chabaux, F., Pelt, E., Granet, M., Sak, P.S., Gaillardet, J., Lebedeva, M.,Brantley, S.L., 2012. The effect of curvature on weathering rindformation: evidence from Uranium-series isotopes in basaltic andes-ite weathering clasts in Guadeloupe. Geochim. Cosmochim. Acta 80,92–107.
Maher, K., Steefel, C.I., DePaolo, D.J., Viani, B.E., 2006. The mineral disso-lution rate conundrum: insights from reactive transport modeling ofU isotopes and pore fluid chemistry in marine sediments. Geochim.Cosmochim. Acta 70, 337–363.
Metivier, F., Gaudemer, Y., 1999. Stability of output fluxes of large rivers inSouth and East Asia during the last 2 million years: implications onfloodplain processes. Basin Res. 11, 293–303.
Mikki, S., Kishk, A., 2005. Investigation of the quantum particle swarmoptimization technique for electromagnetic applications. Antennasand Propagation Society International Symposium, IEEE 2A, 45-48.
Millot, R., Gaillardet, J., Dupre, B., Allegre, C.J., 2002. The global control ofsilicate weathering rates and the coupling with physical erosion: newinsights from rivers of the Canadian Shield. Earth Planet. Sci. Lett.6095, 1–16.
Olivia, P., Viers, J., Dupre, B., 2003. Chemical weathering in graniticenvironments. Chem. Geol. 202, 225–256.
Paola, C., Heller, P., Angevine, C., 1992. The large-scale dynamics of grain-size variation in alluvial basins, 1: theory. Basin Res. 4, 73–90.
Pelt, E., Chabaux, F., Innocent, C., Navarre-Sitchler, A., Sak, P., Brantley, S.,2008. Uranium-thorium chronometry of weathering rinds: Rockalteration rate and paleo-isotopic record of weathering fluids. EarthPlanet Sci. Lett. 276, 98–105.
Sarin, M., Krishnaswami, S., Somayajulu, B., Moore, W., 1990. Chemistry ofuranium, thorium, and radium isotopes in the Ganga-Brahmaputrariver system: Weathering processes and fluxes to the Bay of Bengal.Geochim. Cosmochim. Acta 54, 1387–1396.
Sear, D.A., Lee, M.W. E., Oakley, R.J., Carling, P.A., Collins, M.B., 2000. Coarsesediment tracing technology in littoral and fluvial environments: areview. In: Tracers in the Environment edited by F. I, pp. 21–55.
Singh, P., 2009. Major, trace and REE geochemistry of the Ganga Riversediments: Influence of provenance and sedimentary processes.Chem. Geol. 266, 242–255.
Singh, A., Bhardwaj, B.D., Ahmad, A.H.M., 1993. Tectonic setting andsedimentology of Ganga. River sediments, India. Boreas 22, 38–46.
Singh, S.K., Dalai, T.K., Krishnaswami, S., 2003. 238U series isotopes and232Th in carbonates and black shales from the Lesser Himalaya:implications to dissolved uranium abundances in Ganga-Indus sourcewaters. J. Environ. Radioact. 67, 69–90.

S
S
S
V
F. Chabaux et al. / C. R. Geoscience 344 (2012) 688–703 703
ingh, M., Singh, I.B., Muller, G., 2007. Sediment characteristics andtransportation dynamics of the Ganga River. Geomorphology 86,144–175.
ingh, S.K., Rai, S.K., Krishnaswami, S., 2008. Sr and Nd isotopes in riversediments from the Ganga Basin: sediment provenance and spatialvariability in physical erosion. J. Geophys. Res. 113, 18p.
un J., Xu W., Feng B., 2004. A global search strategy of quantum-behavedparticle swarm optimization. Cybernetics and Intelligent Systems,IEEE Conference, vol. 1, pp. 111–116.
igier, N., Bourdon, B., Turner, S., Allegre, C.J., 2001. Erosion timescalesderived from U-decay series measurements in rivers. Earth Planet. Sci.Lett. 193, 549–563.
Viville, D., Chabaux, F., Stille, P., Pierret, M.-C., Gangloff, S., 2012. Erosionand weathering Fluxes in granitic basins: the example of the Streng-bach catchment (Vosges massif, eastern France). Catena 92, 122–129.
von Blanckenburg, F., 2005. The control mechanisms of erosion andweathering at basin scale from cosmogenic nuclides in river sedi-ment. Earth Planet. Sci. Lett. 237, 462–479.
von Blanckenburg, F., 2006. The control mechanisms of erosion andweathering at basin scale from cosmogenic nuclides in river sedi-ment. Earth Planet. Sci. Lett. 242, 224–239.
Wittmann, H., von Blanckenburg, F., Maurice, L., Guyot, J.L., Kubik, P.,2011. Recycling of Amazon floodplain sediment quantified by cos-mogenic 26Al and 10Be. Geology 39, 467–470.