Embed Size (px)
Citation preview
*Correspondence: D. F. Nascimento. Clinical Pharmacology Unit, Department of Physiology and Pharmacology, Federal University of Ceará. Rua Coronel Nunes de Melo, n. 1127 - Rodolfo Teófilo - 60430-270 - Fortaleza - CE, Brazil. E-mail: [email protected]
ArticleBrazilian Journal of
Pharmaceutical Sciencesvol. 46, n. 4, out./dez., 2010
Determination of nimodipine in plasma by HPLC-MS/MS and pharmacokinetic application
Demétrius Fernandes do Nascimento1,*, Manoel Odorico de Moraes1, Fernando Antônio Frota Bezerra1, Andréa Vieira Pontes1, Célia Regina Amaral Uchoa1, Renata Amaral de Moraes1, Ismenia Osório Leite1, Gilmara Silva de Melo Santana1, Ana Paula Macedo Santana1, Ana Lourdes Almeida
e Silva Leite1, José Pedrazzoli Júnior2, Maria Elisabete Amaral de Moraes1
1Clinical Pharmacology Unit, Department of Physiology and Pharmacology, Federal University of Ceará, 2Integrated Unit of Pharmacology and Gastroenterology, São Francisco University Medical School
To develop and validate a rapid, specific and highly sensitive method to quantify nimodipine in human plasma using dibucaine as the internal standard (IS). The analyte and IS were extracted from plasma samples by liquid-liquid extraction using hexane-ethyl acetate (1:1 v/v). The chromatographic separation was performed on a Varian® Polaris C18 analytical column (3 mm, 50 x 2.0 mm) and pre-column SecurityguardTM C18 (4.0 x 3.0 mm) with a mobile phase of Acetonitrile-Ammonium acetate 0.02 ml/L (80:20v/v). The method had a chromatographic run time of 4.5 min and linear calibration curve over the range of 0.1- 40 ng/mL (r > 0.9938). The limit of quantification was 100 pg/mL. Acceptable precision and accuracy were obtained for concentrations over the standard curve ranges. This validated method was successfully applied in determining the pharmacokinetic profile of nimodipine tablets of 30 mg administered to 24 healthy volunteers. The proposed method of analysis provided a sensitive and specific assay for nimodipine determination in human plasma. The time for the determination of one plasma sample was 4.5 min. This method is suitable for the analysis of nimodipine in human plasma samples collected for pharmacokinetic, bioavailability or bioequivalence studies in humans.
Uniterms: Nimodipine/determination in plasma. Nimodipine/pharmacokinetic profile. Nimodipine/quantitative analysis. Pharmacokinetics/method validation.
Um método rápido, específico e sensível para quantificar nimodipino em plasma humano usando dibucaína como padrão interno (IS) é descrito. O analito e o IS foram extraídos das amostras de plasma por extração líquido-líquido usando hexano-acetato de etila (1:1 v/v). A separação cromatográfica foi realizada utilizando-se uma coluna analítica C18 Varian® Polaris (3 mm, 50 x 2,0 mm) e uma pré-coluna SecurityguardTM C18 (4,0 x 3,0 mm) e acetonitrila-acetato de amônia 0,02 mol/L (80:20 v/v) como fase móvel. O método apresentou tempo total de corrida de 4,5 min e curva de calibração linear com concentrações entre 0,1-40 ng/mL (r > 0,9938). O limite de quantificação foi de 100 pg/mL. Os valores de precisão e exatidão foram obtidos por meio da análise das amostras de controle de qualidade. A análise de uma única amostra de plasma foi realizada em 4,5 minutos. A metodologia validada foi aplicada na determinação do perfil farmacocinético do nimodipino, comprimido de 30 mg administrado em 24 voluntários saudáveis. O método para quantificar nimodipino em plasma é adequado para aplicação em estudos farmacocinéticos, biodisponibilidade e bioequivalência em humanos.
Unitermos: Nimodipino/determinação em plasma. Nimodipino/perfil farmacocinético. Nimodipino/análise quantitativa. Farmacocinética/validação de método.

D. F. Nascimento, M. O. Moraes, F. A. F. Bezerra, A. V. Pontes, C. R. A. Uchoa, R. A. Moraes, I. O. Leite, G. S. M. Santana1, A. P. M. Santana, et al.666
INTRODUCTION
Nimodipine (Figure 1) is a dihydropyridine cal- cal-cium channel blocker known for its preferential action on cerebral blood vessels (Kazda, Toward, 1982; Haws et al., 1983), but it is currently used to prevent and treat the ischemic damage caused by cerebral arterial spasm in subarachnoid hemorrhage (Dorhout Mees et al., 2007; Stachura et al., 2002). Nimodipine has also been used in the treatment of ischemic stroke (Svetyi et al., 2002; So-brado et al., 2003; Fogelholm et al., 2004), multi-infarct dementia (Fischhof et al., 1989; Pantoni et al., 2000) and migraine prophylaxis (Evers, 1999; Victor, Ryan, 2003).
Several analytical techniques have been applied in the quantification of nimodipine in biological matrices. Gas chromatography (GC) methods with electron-capture (Krol et al., 1984; Jackobsen, et al., 1986) and nitrogen-phosphorus detection (Rosseel, Bogaert, Huyghens, 1990) were used to determine nimodipine in plasma, which can provide a lower limit of quantification (LLOQ) of 5 ng/mL, using 1 mL of plasma. The method described by Krol et al. (1984) is sensitive and selective; however, it requires a large amount of plasma and elaborate and lengthy sample preparation.
HPLC with UV detection (Qian, Gallo, 1992; Aymard et al., 1998) and electrochemical detection (López et al., 2000) has a sensitivity of about 1 ng/mL, using 1 mL of plasma, but these methods are time-consuming (more than 10 min). In all the reported methods above, plasma volume requirement was high, chromatographic run time was longer and sensitivity was inadequate for pharmacokinetic studies. The relatively longer run time for nimodipine registered by these analytical methods are not adequate for the analysis of a high number of samples. Fischer et al., 1993 developed a GC-MS method combined with chiral stationary phase HPLC for the separation and determination of nimodipine enantiomers, which had an LLOQ of 0.1 ng/mL, using 0.5 mL of plasma. However, the analytical time was more than 30 min, which is not suitable for the analysis of a large number of biological samples.
The usefulness of liquid chromatography/tandem mass spectrometry (LC-MS/MS) has been demonstrated for a wide range of applications in the bioanalytical, environmental and pharmaceutical fields (Jemal, 2000; Cech, Enke, 2001; Niessen, 2003). This powerful se-paration and detection technique is widely used for the determination of drugs in biological fluids. Mück (1995) developed an LC-MS-MS method providing an LLOQ of 0.5 ng/mL, using a 1 mL plasma sample. This method was used for the quantification of nimodipine enantio-mers. Gualano et al. (1999) and Qiu et al. (2004) reported an LC-MS/MS method with an atmospheric pressure chemical ionization (APCI) source in selected reaction monitoring mode for the determination of nimodipine in human plasma with an LLOQ of 0.25 and 0.24 ng/mL, respectively.
Nirogi et al. (2006) developed an LC-MS-MS me-thod to determine nimodipine in human plasma which had an LLOQ of 200 pg/mL using 0.5mL plasma. Recently, Qin et al. (2008) published a method for quantification of nimodipine in human plasma using ultra performance liquid chromatography–tandem mass spectrometry. The validated method attained a limit of quantification of 0.2ng/mL using 500 µL plasma. In these methods, nimo-dipine concentrations were not always detectable in the small plasma samples used (0.5–1 mL). This fact made them unsuitable for time-course analysis in cases where only small plasma volumes are available (pharmacokinetic studies in experimental animals or children).
LC-MS/MS is one of the most common techniques employed for the quantification of drugs in biological ma-trices, due to its higher levels of specificity and sensitivity. Thus, the present report describes the development and validation of an LC-MS/MS method for the quantification of nimodipine with use of dibucaine as the internal standard (Figure 1) and the method’s clinical application in pharma-cokinetic and bioavailability studies in human volunteers.
MATERIAL AND METHODS
Reference compounds and chemicals
Nimodipine was purchased from ICN Biomedical (Ohio, USA) and dibucaine (IS) was purchased from USP Pharmacopeia (New York, NY, USA). Acetonitrile (ACN) was purchased from EM Science (Gibbstown, NJ, USA); methanol (MeOH), ethyl acetate, hexane and ammonium acetate were purchased from Merck (Rio de Janeiro, RJ, Brazil). The ACN and MeOH used were HPLC grade solvents. All other reagents were analytical grade. A Milli-Q® (Millipore, Mosheim, France) water
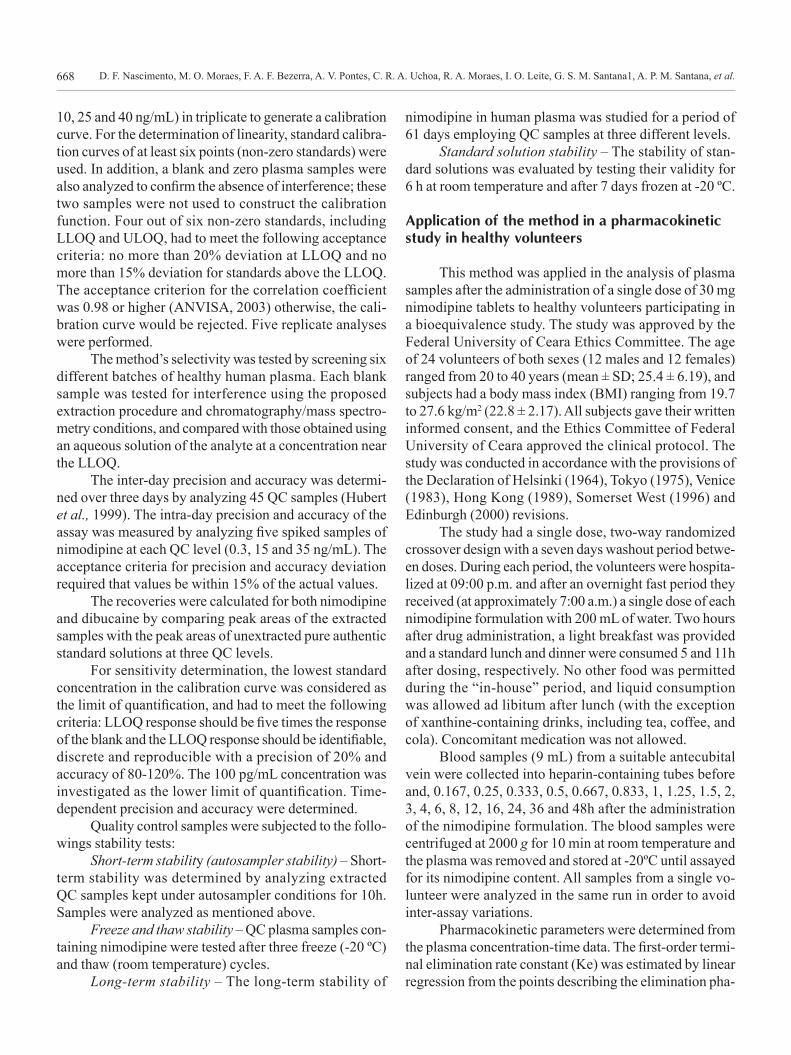
FIGURE 1 - Chemical structures of nimodipine (A) and dibucaine (B, internal standard).
Determination of nimodipine in plasma by HPLC-MS/MS and pharmacokinetic application 667
purification system was used to obtain the purified water for the HPLC analysis.
Preparation of standard solutions and reagents
A stock solution of nimodipine 100 mg/mL was pre-pared in ACN. Working standard solutions were prepared from the stock solution by dilution with ACN to produce a final concentration of 10 mg/mL.
A stock solution of dibucaine 100 mg/mL (Figure 1) was prepared in MeOH. Working standard solutions were prepared from the stock solution by dilution with MeOH to produce a final concentration of 50 ng/mL.
Calibration curves
Calibration standards were prepared by spiking control human plasma with standard solutions containing nimodipine to give standards of 0.1, 0.5, 2.0, 10, 25 and 40 ng/mL. A fixed concentration of dibucaine was added to all assay tubes as an internal standard. Zero concentration plasma samples used in each run were prepared containing internal standard only. In each run, a plasma blank sample (no IS) was also analyzed.
Quality control samples
Quality control (QC) samples were prepared at three different levels: low level (LQC), three times the lower limit of quantification (LLOQ); middle level (MQC), approximately midway between low quality control and high quality control; and high level (HQC), 75-90% of the upper limit of the quantification (ULOQ). Quality control samples were prepared by spiking different samples of human plasma with 0.3, 15 and 35 ng/mL of nimodipine.
Sample extraction procedure
To prevent the photodegradation of nimodipine, the whole experiment including plasma collecting, sample preparation and instrumental analyses were performed under feeble yellow light.
A total of 300 mL of plasma were extracted from the appropriate tube after adding 25 mL of internal standard dibucaine (50 ng/mL). The tubes were vortex-mixed for 1 min. A volume of 1000 mL of hexane/ethyl acetate (1:1 v/v) was then added, and the samples were vortex-mixed for 5 min. The tubes were centrifuged at 2000 g for 5 min at 37 ºC. The upper organic layer (800 mL) was carefully removed, transferred to new tubes, and evaporated to dry-ness with a gentle stream of nitrogen in a dry bath at 37 ºC.
A 150-mL aliquot of ACN was added to tubes which were then vortex-mixed for 1 min to reconstitute the resi-due. The solutions were transferred to microvials which were capped and placed in an autosampler rack. Aliquots of 10 mL were injected automatically into the liquid chro-matography system.
Mass spectrometry and chromatography conditions
The chromatographic runs were carried out using an HP/Quat Pump Series 1100 analytical pump and an HP/ALS Series 1100 auto sampler. The mobile phase involved a mixture of ACN-0.02 mol/L ammonium ace-tate (80:20, v/v) pumped at a flow rate of 1.0 mL/min through the analytical column (Varian® Polaris C18 , 3 mm, 50 x 2.0 mm) and pre-column (SecurityguardTM C18 , 4.0 x 3.0 mm), at 20 ºC. A split of the column eluant of ap-proximately 1:10 was included so that only approximately 50 mL/min entered the mass spectrometer. The injection volume was 10 mL and the total run time was 4.5 min.
The mass spectrometer (micromass Quattro LC) equipped with an electrospray source using a crossflow counter electrode was run in positive mode (ES+), and set up in multiple reaction monitoring (MRM), monitoring the transitions 418.6>342.6 and 344.2 >271.0 for nimodipine and dibucaine, respectively. The source and dessolvation temperature was 100 °C and 300 °C, respectively. The cone and dessolvation gas flow (N2) was 116 L/h and 533 L/h, respectively. The dwell time was set at 0.5 s, and the values of the capillary voltage, the cone energy and collision energy were 4.2 KV, 15 V, 10 eV for nimodipine and 4.2 KV, 20 V and 21 eV for dibucaine, with a gas pressure (argon) of 2.5 x 10⁻³ mbar. Data acquisition and analysis were perfor-med using the software MassLynx (V 3.5, running under Windows NT (v 4.0) on a Pentium PC).
Method validation
Sample analysis was always carried out in a GLP-compliant manner, and therefore, the LC-MS-MS methods needed to be validated according to currently accepted Food and Drug Administration (FDA) and National Health Surveillance Agency (ANVISA) bioanalytical method validation guidelines (FDA, 2001; ANVISA, 2003). The following parameters were considered.
Linearity (ANVISA, 2003) was determined to assess the performance of the method. A linear least-squares regression with a weighting index of 1/x was performed on the peak areas of nimodipine and IS to nimodipine con-centration ratios for the six plasma standards (0.1, 0.5, 2.0,
D. F. Nascimento, M. O. Moraes, F. A. F. Bezerra, A. V. Pontes, C. R. A. Uchoa, R. A. Moraes, I. O. Leite, G. S. M. Santana1, A. P. M. Santana, et al.668
10, 25 and 40 ng/mL) in triplicate to generate a calibration curve. For the determination of linearity, standard calibra-tion curves of at least six points (non-zero standards) were used. In addition, a blank and zero plasma samples were also analyzed to confirm the absence of interference; these two samples were not used to construct the calibration function. Four out of six non-zero standards, including LLOQ and ULOQ, had to meet the following acceptance criteria: no more than 20% deviation at LLOQ and no more than 15% deviation for standards above the LLOQ. The acceptance criterion for the correlation coefficient was 0.98 or higher (ANVISA, 2003) otherwise, the cali-bration curve would be rejected. Five replicate analyses were performed.
The method’s selectivity was tested by screening six different batches of healthy human plasma. Each blank sample was tested for interference using the proposed extraction procedure and chromatography/mass spectro-metry conditions, and compared with those obtained using an aqueous solution of the analyte at a concentration near the LLOQ.
The inter-day precision and accuracy was determi-ned over three days by analyzing 45 QC samples (Hubert et al., 1999). The intra-day precision and accuracy of the assay was measured by analyzing five spiked samples of nimodipine at each QC level (0.3, 15 and 35 ng/mL). The acceptance criteria for precision and accuracy deviation required that values be within 15% of the actual values.
The recoveries were calculated for both nimodipine and dibucaine by comparing peak areas of the extracted samples with the peak areas of unextracted pure authentic standard solutions at three QC levels.
For sensitivity determination, the lowest standard concentration in the calibration curve was considered as the limit of quantification, and had to meet the following criteria: LLOQ response should be five times the response of the blank and the LLOQ response should be identifiable, discrete and reproducible with a precision of 20% and accuracy of 80-120%. The 100 pg/mL concentration was investigated as the lower limit of quantification. Time-dependent precision and accuracy were determined.
Quality control samples were subjected to the follo-wings stability tests:
Short-term stability (autosampler stability) – Short-term stability was determined by analyzing extracted QC samples kept under autosampler conditions for 10h. Samples were analyzed as mentioned above.
Freeze and thaw stability – QC plasma samples con-taining nimodipine were tested after three freeze (-20 ºC) and thaw (room temperature) cycles.
Long-term stability – The long-term stability of
nimodipine in human plasma was studied for a period of 61 days employing QC samples at three different levels.
Standard solution stability – The stability of stan-dard solutions was evaluated by testing their validity for 6 h at room temperature and after 7 days frozen at -20 ºC.
Application of the method in a pharmacokinetic study in healthy volunteers
This method was applied in the analysis of plasma samples after the administration of a single dose of 30 mg nimodipine tablets to healthy volunteers participating in a bioequivalence study. The study was approved by the Federal University of Ceara Ethics Committee. The age of 24 volunteers of both sexes (12 males and 12 females) ranged from 20 to 40 years (mean ± SD; 25.4 ± 6.19), and subjects had a body mass index (BMI) ranging from 19.7 to 27.6 kg/m2 (22.8 ± 2.17). All subjects gave their written informed consent, and the Ethics Committee of Federal University of Ceara approved the clinical protocol. The study was conducted in accordance with the provisions of the Declaration of Helsinki (1964), Tokyo (1975), Venice (1983), Hong Kong (1989), Somerset West (1996) and Edinburgh (2000) revisions.
The study had a single dose, two-way randomized crossover design with a seven days washout period betwe-en doses. During each period, the volunteers were hospita-lized at 09:00 p.m. and after an overnight fast period they received (at approximately 7:00 a.m.) a single dose of each nimodipine formulation with 200 mL of water. Two hours after drug administration, a light breakfast was provided and a standard lunch and dinner were consumed 5 and 11h after dosing, respectively. No other food was permitted during the “in-house” period, and liquid consumption was allowed ad libitum after lunch (with the exception of xanthine-containing drinks, including tea, coffee, and cola). Concomitant medication was not allowed.
Blood samples (9 mL) from a suitable antecubital vein were collected into heparin-containing tubes before and, 0.167, 0.25, 0.333, 0.5, 0.667, 0.833, 1, 1.25, 1.5, 2, 3, 4, 6, 8, 12, 16, 24, 36 and 48h after the administration of the nimodipine formulation. The blood samples were centrifuged at 2000 g for 10 min at room temperature and the plasma was removed and stored at -20ºC until assayed for its nimodipine content. All samples from a single vo-lunteer were analyzed in the same run in order to avoid inter-assay variations.
Pharmacokinetic parameters were determined from the plasma concentration-time data. The first-order termi-nal elimination rate constant (Ke) was estimated by linear regression from the points describing the elimination pha-
Determination of nimodipine in plasma by HPLC-MS/MS and pharmacokinetic application 669
se on a log-linear plot. The elimination half-life (t1/2) was derived from this rate constant (t1/2 = ln(2)/Ke) where t1/2 is the half-life time, ln(2) is the Neperian logarithm and Ke is the elimination rate constant. The maximum observed plasma concentration (Cmax) and the time taken to achieve this maximum level (Tmax) were obtained directly from the curves. The areas under the curve for nimodipine plasma concentration versus time for 0-48h (AUC0-48h) were cal-culated by applying the linear trapezoidal method. The extrapolation of this area to infinity (AUC0-∞) was done by adding the value C48/Ke to the calculated AUC0-48 where C48 is the nimodipine plasma concentration at 48h and Ke is the first-order terminal elimination rate constant.
Bioequivalence (BE) between the reference and test formulations was assessed on the basis of maximum plasma concentration of nimodipine (Cmax) and area under the plasma concentration versus time curve from time 0 to the last sampling time (AUC0–48h) by calculating the mean ratios and 90% confidence interval (CIs) on log-transformed data. The inclusion of the 90% CIs for the ratios in the 80% to 125% bioequivalence interval, were analyzed using a parametric test (ANOVA). The variability between the groups (sequence), periods and formulations was evaluated using ANOVA test. The computer programs used to calculate the pharmacokinetic parameters (Cmax and AUC) and to carry out statistical analysis were Win-NonlinTM, version 3.1 (Pharsight, Mountain View, CA); EquivTest, version 2.0 (Statistical Solution Ltd., Saugus, MA); and GraphPad Prim, version 2.0 (Software Inc., San Diego, CA).
RESULTS AND DISCUSSION
Method validation
Separation and specificityLC-MS/MS method in multiple reaction monitoring
(MRM) is a very powerful technique for pharmacokinetic studies since it provides sensitivity and selectivity require-ments for analytical methods. Thus, the MRM technique was chosen for the assay development. The MRM state file parameters were optimized to maximize the response for the analyte.
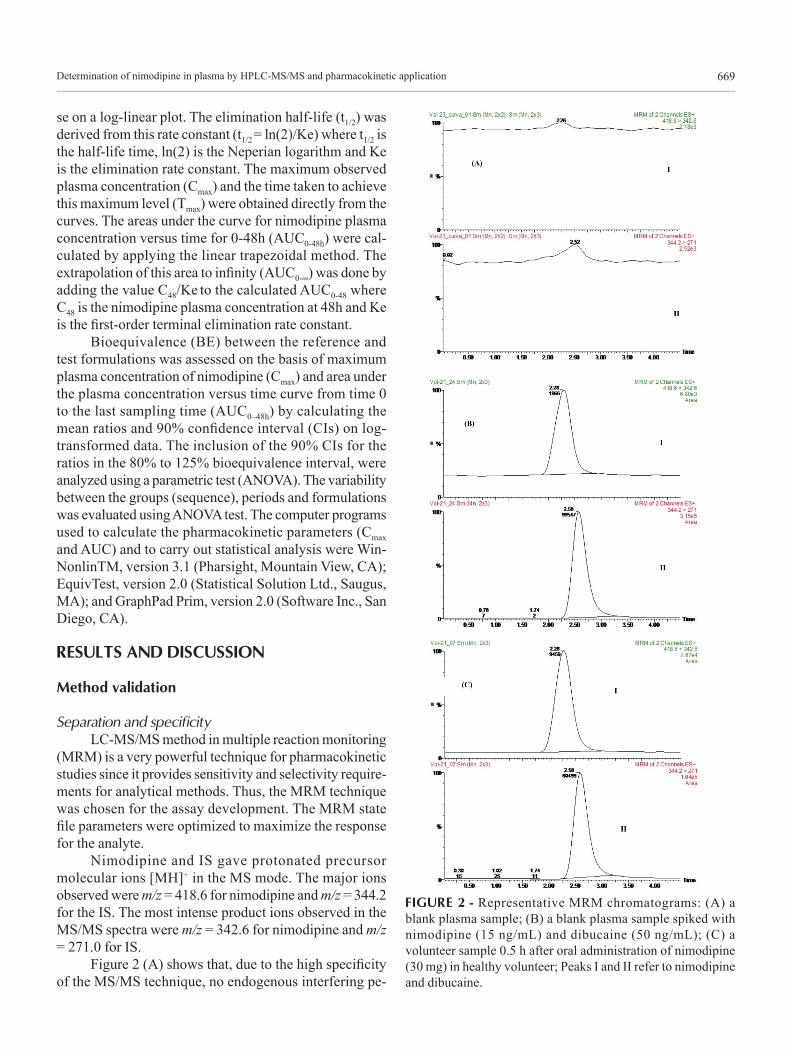
Nimodipine and IS gave protonated precursor molecular ions [MH]+ in the MS mode. The major ions observed were m/z = 418.6 for nimodipine and m/z = 344.2 for the IS. The most intense product ions observed in the MS/MS spectra were m/z = 342.6 for nimodipine and m/z = 271.0 for IS.
Figure 2 (A) shows that, due to the high specificity of the MS/MS technique, no endogenous interfering pe-
FIGURE 2 - Representative MRM chromatograms: (A) a blank plasma sample; (B) a blank plasma sample spiked with nimodipine (15 ng/mL) and dibucaine (50 ng/mL); (C) a volunteer sample 0.5 h after oral administration of nimodipine (30 mg) in healthy volunteer; Peaks I and II refer to nimodipine and dibucaine.
D. F. Nascimento, M. O. Moraes, F. A. F. Bezerra, A. V. Pontes, C. R. A. Uchoa, R. A. Moraes, I. O. Leite, G. S. M. Santana1, A. P. M. Santana, et al.670
aks appeared at the retention times of the compounds of interest. Figure 2 (B) also shows that under the described chromatographic conditions, the retention times were 2.28 min and 2.58 min for nimodipine and dibucaine, respectively. The total HPLC-MS-MS analysis time was 4.5 min per sample.
Most reported methods require extensive sample work-up and laborious, time-consuming extraction pro-cedures. Although many of these methods offer the ad-vantage of being specific, they do require large volumes of plasma and/or are not economically feasible for routine use in most bioavailability, pharmacokinetic or bioequiva-lence studies where only small volumes of serum/plasma may be obtained.
The LC-MS-MS method described here provides the necessary level of linearity, accuracy and precision for routine analysis of nimodipine in plasma. In addition, the high selectivity of multiple reaction monitoring (MRM) for different compounds meant that a simple extraction procedure could be used with shorter analysis times.
The combination of HPLC with ESI-MS-MS leads to short retention times and yields both high selectivity and sensitivity. ESI is an ionization technique that produces high mass-to-charge [M + 1]+ precursor ions with minimal fragmentation of the analyte.
Linearity and lower limit of quantificationThe linear regression of the peak area to concen-
trations ratios was fitted over the concentration range of 0.10-40 ng/mL, and a typical equation of the calibration curve was as follows: Y = 0.0502682 X + 0.00630674 (r = 0.993824), where Y is the peak area ratio of nimodipine to dibucaine, and X is the concentration of nimodipine, and r is the correlation linear coefficient. Results of six represen-tative calibration curves for HPLC-MS-MS determination of nimodipine are given in Table I.
The present LC-MS-MS method offered an LLOQ of 100 pg/mL with a mean accuracy of 7.0% and a mean precision of 103.0% (n=5), which is more sensitive than or comparable to reported methods (Krol et al., 1984; Ja-ckobsen et al., 1986; Rosseel Bogaert, Huyghens, 1990; Qian, Gallo, 1992; Aymard et al., 1998; López et al., 2000; Blardi et al., 2002; Mück, 1995; Qiu et al., 2004; Nirogi et al., 2006; Qin et al., 2008). Data for LLOQ are presented in Table II. With the present LLOQ of 100 pg/mL, the nimodipine concentration can be determined in plasma samples up to 48 h after a single oral dose of 30 mg nimo-dipine, which is sufficiently sensitive to investigate the pharmacokinetic behavior of nimodipine, to establish the relationship between dose and pharmacological effect and to identify doses that produce toxic responses in humans.
The presented method is not entirely different from those described earlier (Gualano et al., 1999; Qiu et al., 2004; Nirogi et al., 2006; Qin et al., 2008) but combines lower plasma volume (300 mL), short retention time (2.28 min for nimodipine and 2.58 min for dibucaine), a simple extraction procedure, sensitivity (100 pg/mL), accuracy, precision and linearity.
Precision and accuracy
The intra-day and inter-day precision and accuracy of the assay were measured by analyzing five spiked samples of nimodipine at each QC level (0.3, 15 and 35 ng/mL). The results for intra-day and inter-day pre-cision and accuracy are summarized in Table II. These results were within the acceptance criteria for precision and accuracy which stipulate that the deviation of values should be within 15% of the actual values (Shah et al., 2000; FDA, 2001; ANVISA, 2003).
Recovery
The mean extraction recovery of nimodipine, deter-mined at three concentrations of the quality controls, were 71.5 (CV 3.09%), 70.51 (CV 1.64%), 74.02% (CV 4.23%), respectively. The mean extraction recovery of dibucaine was found to be 84.06% (4.78%).
Several kinds of liquid-liquid extraction and solid phase extraction methods have been published for the extraction of nimodipine from plasma samples (Mück, Bode, 1994; López et al., 2000). The solid phase extraction is laborious and requires SPE cartridges, increasing the cost of the analysis. In this experiment, different liquid-liquid extraction conditions were evaluated including different extraction solvents. Four organic extraction solvents (hexane/n-butyl alcohol hexane/isoamyl alcohol, diethyl ether/dichloromethane and hexane/ethyl acetate) were evaluated. Among the tested solvents, hexane/ethyl acetate gave the best recovery values for both the drug and internal standard.
Stability studies
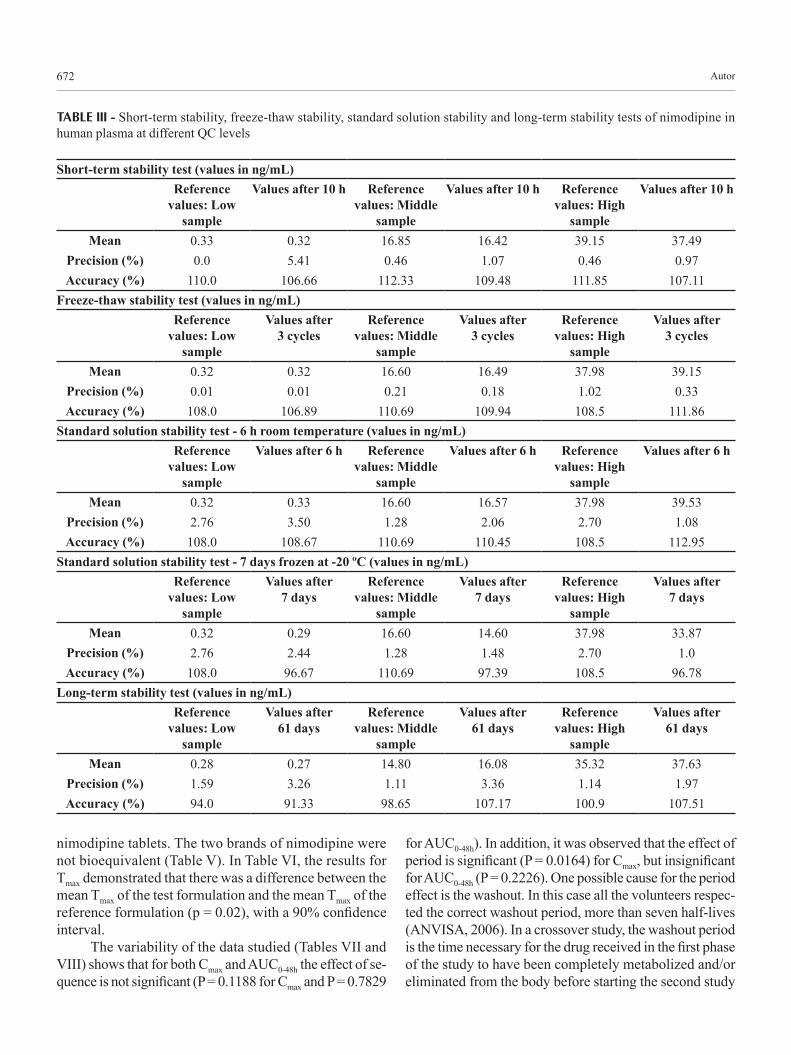
Short-term stability indicated reliable stability behavior under the experimental conditions of the regular runs. Results are given below in Table III. The data that represent the stability of nimodipine plasma samples over three cycles of freezing and thawing are given in Table III. The results indicate that the analyte is stable in human plasma for three freeze-thaw cycles, when stored at –20 ºC and thawed to room temperature.
Determination of nimodipine in plasma by HPLC-MS/MS and pharmacokinetic application 671
TABLE I - Data of concentrations of nimodipine calibration standards and statistics for precision and accuracy from six representative calibration curves
Nominal Concentration (ng/mL)
Mean ± SD (ng/mL)
Precision (%)
Accuracy (%)
0.10 0.1 ± 0.01 10.0 100.00.50 0.5 ± 0.01 2.0 100.02.0 1.91 ± 0.04 2.18 95.3310.0 9.3 ± 0.07 0.76 92.9725.0 26.3 ± 1.17 4.46 105.2040.0 42.48 ± 0.1 0.24 106.21
Equation of the calibration curve: Y = 0.0502682 X + 0.00630674 (r = 0.993824)
TABLE II - Analytical precision and accuracy of nimodipine determination in spiked plasma samples, and of the lower limit of quantification (n=5)
Intra-day LOQ LQC MQC HQC Nominal Concentration, ng/mL 0.1 0.3 15 35
Mean ± SD 0.1 ± 0.01 0.30 ± 0.03 16.36 ± 0.13 38.40 ± 0.53Precision (%) 0.0 8.57 0.81 1.37Accuracy (%) 110 100.67 109.09 109.72
Inter-dayMean ± SD 0.103 ± 0.01 0.31 ± 0.02 15.99 ± 0.66 38.39 ± 1.29Precision (%) 7.0 5.46 4.12 3.37Accuracy (%) 103 102.89 106.60 109.69
Table III summarizes the long-term stability data of nimodipine in plasma samples stored for a period of 61 days at –20 ºC. The stability study of nimodipine in human plasma showed good stability behavior as the mean values of the tested samples were within the acceptance criteria of ±15% of the initial values of the controls. These findings indicate that the storage of nimodipine plasma samples at –20 ºC is adequate for up to 61 days, and no stability-related problems would be expected during the routine analysis of samples for pharmacokinetic, bioavailability or bioequivalence studies.
The stability of working solutions was tested and es-tablished at room temperature for 6h. Based on the results obtained, working solutions were prepared freshly just spiking samples for the calibration curve and the QC’s. The results revealed optimum stability for the prepared working solutions throughout the period intended for their daily use.
Pharmacokinetic study
Nimodipine was well tolerated at the doses adminis-tered and no significant adverse reactions were observed
or reported. No biochemical parameters presented any clinically relevant alterations. There were no drop-outs, and all volunteers who started the study continued to the end and were discharged in good health.
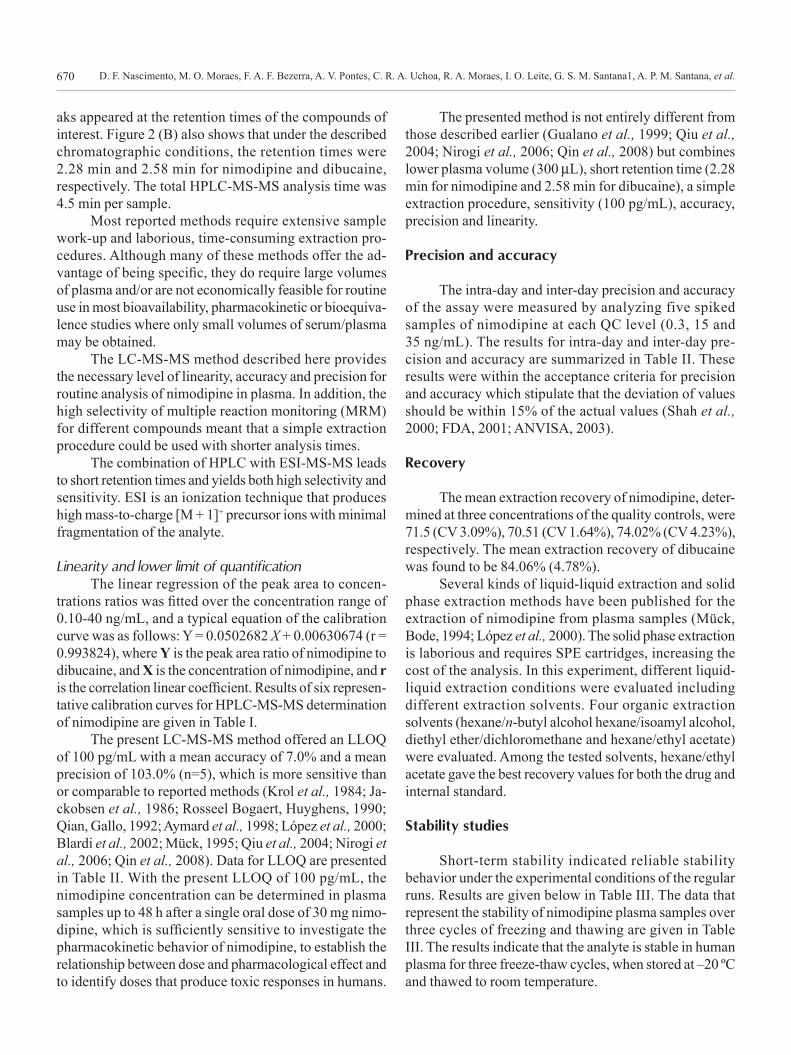
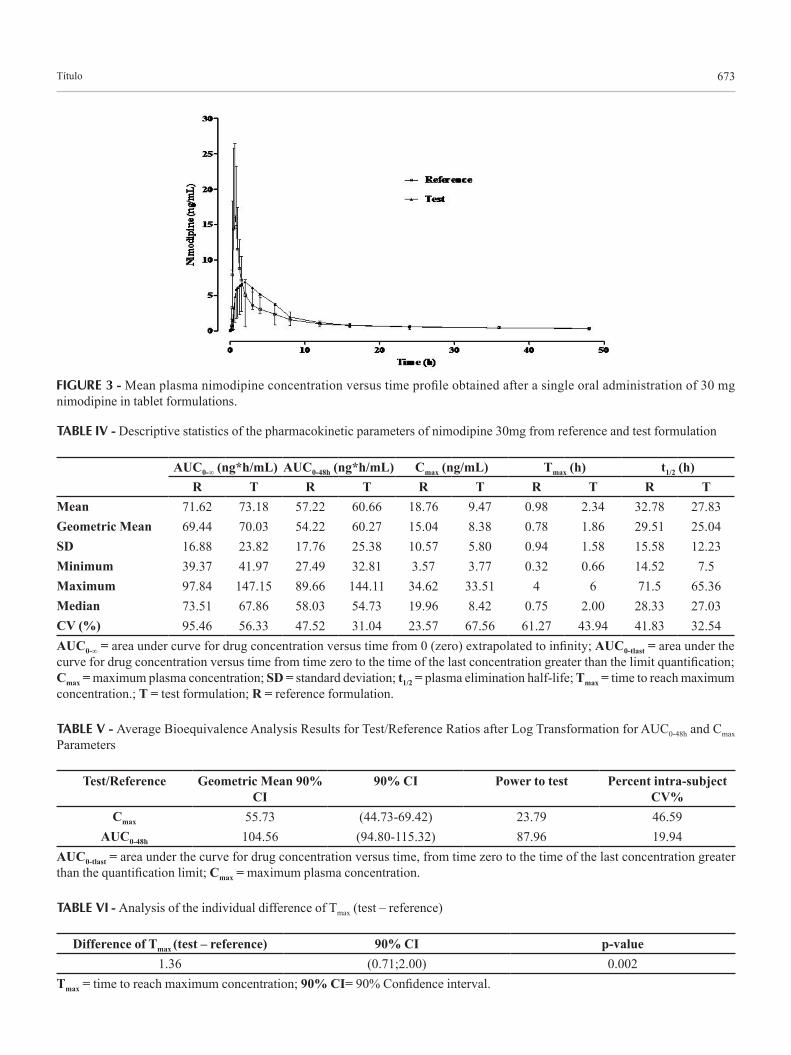
The method was applied to determine the plasma concentration of nimodipine following a single oral ad-ministration (30 mg) to 24 healthy volunteers. The mean (SD) concentration-time profiles for the two brands of nimodipine tablets are shown in Figure 3.
The pharmacokinetic parameters for both formula-tions are shown in Table IV. Mean peak plasma concen-tration of nimodipine was reached at 9.47 ng/mL (test formulation) and 18.76 ng/mL (reference formulation) at 2.34 and 0.98 h, respectively, after a single oral dose and then levels declined and remained detectable up to 48 h. The extent of absorption is a key characteristic of drug formulation, and therefore, AUC is an important parame-ter for comparative bioavailability studies (FDA, 2001). However, two other parameters, Cmax and Tmax, are also important features of the therapeutic use of a drug (Chow, Liu, 2000) and hence were also considered in this study.
The statistical comparison of AUC0-48h and Cmax cle-arly indicated a significant difference in the two brands of
Autor672
TABLE III - Short-term stability, freeze-thaw stability, standard solution stability and long-term stability tests of nimodipine in human plasma at different QC levels
Short-term stability test (values in ng/mL)Reference
values: Low sample
Values after 10 h Reference values: Middle
sample
Values after 10 h Reference values: High
sample
Values after 10 h
Mean 0.33 0.32 16.85 16.42 39.15 37.49Precision (%) 0.0 5.41 0.46 1.07 0.46 0.97Accuracy (%) 110.0 106.66 112.33 109.48 111.85 107.11
Freeze-thaw stability test (values in ng/mL)Reference
values: Low sample
Values after 3 cycles
Reference values: Middle
sample
Values after 3 cycles
Reference values: High
sample
Values after 3 cycles
Mean 0.32 0.32 16.60 16.49 37.98 39.15Precision (%) 0.01 0.01 0.21 0.18 1.02 0.33Accuracy (%) 108.0 106.89 110.69 109.94 108.5 111.86
Standard solution stability test - 6 h room temperature (values in ng/mL)Reference
values: Low sample
Values after 6 h Reference values: Middle
sample
Values after 6 h Reference values: High
sample
Values after 6 h
Mean 0.32 0.33 16.60 16.57 37.98 39.53Precision (%) 2.76 3.50 1.28 2.06 2.70 1.08Accuracy (%) 108.0 108.67 110.69 110.45 108.5 112.95
Standard solution stability test - 7 days frozen at -20 ºC (values in ng/mL)Reference
values: Low sample
Values after 7 days
Reference values: Middle
sample
Values after 7 days
Reference values: High
sample
Values after 7 days
Mean 0.32 0.29 16.60 14.60 37.98 33.87Precision (%) 2.76 2.44 1.28 1.48 2.70 1.0Accuracy (%) 108.0 96.67 110.69 97.39 108.5 96.78
Long-term stability test (values in ng/mL)Reference
values: Low sample
Values after 61 days
Reference values: Middle
sample
Values after 61 days
Reference values: High
sample
Values after 61 days
Mean 0.28 0.27 14.80 16.08 35.32 37.63Precision (%) 1.59 3.26 1.11 3.36 1.14 1.97Accuracy (%) 94.0 91.33 98.65 107.17 100.9 107.51
nimodipine tablets. The two brands of nimodipine were not bioequivalent (Table V). In Table VI, the results for Tmax demonstrated that there was a difference between the mean Tmax of the test formulation and the mean Tmax of the reference formulation (p = 0.02), with a 90% confidence interval.
The variability of the data studied (Tables VII and VIII) shows that for both Cmax and AUC0-48h the effect of se-quence is not significant (P = 0.1188 for Cmax and P = 0.7829
for AUC0-48h). In addition, it was observed that the effect of period is significant (P = 0.0164) for Cmax, but insignificant for AUC0-48h (P = 0.2226). One possible cause for the period effect is the washout. In this case all the volunteers respec-ted the correct washout period, more than seven half-lives (ANVISA, 2006). In a crossover study, the washout period is the time necessary for the drug received in the first phase of the study to have been completely metabolized and/or eliminated from the body before starting the second study
Título 673
FIGURE 3 - Mean plasma nimodipine concentration versus time profile obtained after a single oral administration of 30 mg nimodipine in tablet formulations.
TABLE IV - Descriptive statistics of the pharmacokinetic parameters of nimodipine 30mg from reference and test formulation
AUC0-∞ (ng*h/mL) AUC0-48h (ng*h/mL) Cmax (ng/mL) Tmax (h) t1/2 (h)R T R T R T R T R T
Mean 71.62 73.18 57.22 60.66 18.76 9.47 0.98 2.34 32.78 27.83Geometric Mean 69.44 70.03 54.22 60.27 15.04 8.38 0.78 1.86 29.51 25.04SD 16.88 23.82 17.76 25.38 10.57 5.80 0.94 1.58 15.58 12.23Minimum 39.37 41.97 27.49 32.81 3.57 3.77 0.32 0.66 14.52 7.5Maximum 97.84 147.15 89.66 144.11 34.62 33.51 4 6 71.5 65.36Median 73.51 67.86 58.03 54.73 19.96 8.42 0.75 2.00 28.33 27.03CV (%) 95.46 56.33 47.52 31.04 23.57 67.56 61.27 43.94 41.83 32.54AUC0-∞ = area under curve for drug concentration versus time from 0 (zero) extrapolated to infinity; AUC0-tlast = area under the curve for drug concentration versus time from time zero to the time of the last concentration greater than the limit quantification; Cmax = maximum plasma concentration; SD = standard deviation; t1/2 = plasma elimination half-life; Tmax = time to reach maximum concentration.; T = test formulation; R = reference formulation.
TABLE V - Average Bioequivalence Analysis Results for Test/Reference Ratios after Log Transformation for AUC0-48h and Cmax Parameters
Test/Reference Geometric Mean 90% CI
90% CI Power to test Percent intra-subject CV%
Cmax 55.73 (44.73-69.42) 23.79 46.59AUC0-48h 104.56 (94.80-115.32) 87.96 19.94
AUC0-tlast = area under the curve for drug concentration versus time, from time zero to the time of the last concentration greater than the quantification limit; Cmax = maximum plasma concentration.
TABLE VI - Analysis of the individual difference of Tmax (test – reference)
Difference of Tmax (test – reference) 90% CI p-value1.36 (0.71;2.00) 0.002
Tmax = time to reach maximum concentration; 90% CI= 90% Confidence interval.

D. F. Nascimento, M. O. Moraes, F. A. F. Bezerra, A. V. Pontes, C. R. A. Uchoa, R. A. Moraes, I. O. Leite, G. S. M. Santana1, A. P. M. Santana, et al.674
period, i.e. this time must be sufficiently long that no resi-due is found from one treatment to another. The presence of residual effects influences the statistical inference of bioequivalence between the formulations (ANVISA, 2002).
The observed pharmacokinetics differences can be explained by possible variations in pharmaceutical development during the formulation process, such as the use of different raw materials or distinct amounts of the excipients, size of the particle or the crystalline form of excipient, lipid-soluble or water-soluble, and hydration, among others (Ansel, Popovich, Allen Jr, 2000).
According to the literature, the t1/2 of nimodipine is approximately 8-9h but the initial decline in plasma con-centration occurs faster, equivalent to a half-life of 1 to 3h. (Yan, Ding, Liu, 1993; Lian-Quing, Heng-Shan, Gang, 1993; Dollery, 1999; Blardi et al., 2002; Qiu et al., 2004; Zhonggui et al., 2004; Hernandez-Hernandez et al., 2002). Previous studies showed these data, but sampling was con-cluded between 5 and 10h after dosing, thereby possibly missing a longer elimination phase. Our results demons-trated, however, that the mean half-life of nimodipine for the two formulations tested was 27.83 h (test formulation) and 32.78 h (reference formulation). Such a discrepancy
could be due to the greater sensitivity of our method, with a limit of quantification of 100 pg/mL, while values found in previous studies were in the range 0.24 to 5 ng/mL (Krol et al., 1984; Jackobsen et al., 1986; Rosseel et al., 1990; Qian, Gallo, 1992; Fischer et al., 1993; Yan et al., 1993; Mück, 1995; Aymard et al., 1998; Gualano et al., 1999; López et al., 2000; Blardi et al., 2002; Qiu et al., 2004; Zhonggui et al., 2004; Nirogi et al., 2006). This improved sensitivity enabled the determination of plasma drug concentrations up to 48 h after drug administration, which was not possible in other studies that allowed the measurement of plasma drug levels only up to 10 h after drug administration.
CONCLUSION
The proposed method of analysis provided a sensi-tive and specific assay for nimodipine determination in human plasma. The determination of one plasma sample needed only 4.5 min and more than 320 samples could be assayed daily, including sample preparation, data acquisi-tion and processing stages. The method proved superior in sensitivity and speed to other reported methods. It was shown that this method is suitable for the analysis
TABLE VII - Result of analysis of variance (ANOVA) to assess the effects of sequence and period for Cmax, log transformed, after administration of the test and reference formulations to 24 healthy volunteers
Source Degrees of freedom Sum of Squares Mean Square F PInter-Individual
Sequence 1 1.3058 1.3058 2.6333 0.1188Residues (inter) 22 10.9093 0.4958 2.5235 0.0174
Intra-IndividualDrug 1 4.1027 4.1027 20.8794 0.0001Period 1 1.3241 1.3241 6.7386 0.0164Residues (intra) 22 4.3229 0.1964
Total 47 21.9649
TABLE VIII - Result of analysis of variance (ANOVA) to assess the effects of sequence and period for AUC0-48h, log transformed, after administration of the test and reference formulations to 24 healthy volunteers
Source Degrees of freedom Sum of Squares Mean Square F PInter-Individual
Sequence 1 0.0168 0.0168 0.0777 0.7829Residues (inter) 22 4.7590 0.2163 5.5403 8.391E-05
Intra-IndividualDrug 1 0.0238 0.0238 0.6113 0.4426Period 1 0.0614 0.0614 1.5747 0.2226Residues (intra) 22 0.8589 0.0390
Total 47 5.7201

Determination of nimodipine in plasma by HPLC-MS/MS and pharmacokinetic application 675
of nimodipine in human plasma samples collected for pharmacokinetic, bioavailability or bioequivalence stu-dies in humans.
ACKNOWLEDGEMENTS
Dr. Albert Leyva provided English language edi-ting of the manuscript. This work was supported by the Conselho Nacional de Desenvolvimento Científico e Tecnológico (CNPq) and the Claude Bernard Institute (InCB), Brazil.
REFERENCES
AGÊNCIA NACIONAL DE VIGILÂNCIA SANITÁRIA (ANVISA) / Manual de boas práticas em biodisponibilidade: bioequivalência. Gerência-Geral de Inspeção e Controle de Medicamentos e Produtos. Brasília: Dupligráfica Editora Ltda./DF, 2002. 246 p.
ANSEL, H.C.; POPOVICH, N.G.; ALLEN JR, L.V. Farmacotécnica. Formas farmacêuticas & sistemas de liberação de fármacos. 6.ed. São Paulo: Premier, 2000. 568 p.
AYMARD, G.; CAYRE-CASTEL, M.; FERNANDEZ, C.; LACOMBLEZ, L.; DIQUET, B. High-performance liquid chromatography with ultraviolet and fluorimetric detection for the simultaneous determination of tacrine, nimodipine, and their respective metabolites in the plasma of patients with Alzheimer disease. Ther. Drug Monit., v.20, p.422-429, 1998.
BLARDI, P.; URSO, R.; DE LALLA, A.; VOLPI, L.; PERRI, T.D.; AUTERI, A. Nimodipine: Drug pharmacokinetics and plasma adenosine levels in patients affected by cerebral ischemia. Clin. Pharmacol. Ther., v.72, p.556-561, 2002.
BRASIL. Resolução Nº 899, de 29 de maio de 2003. Guia para validação de métodos analíticos e bioanalíticos. Agência Nacional de Vigilância Sanitária (ANVISA). Diário oficial da República Federativa do Brasil, Poder executivo, Brasília, DF, 02 de junho de 2003. Seções 2-4, 13 p. (Métodos Bioanalíticos).
BRASIL. Resolução Nº 1170, de 19 de abril de 2006. Guia para provas de Biodisponibilidade relativa/Bioequivalência de Medicamentos. Agência Nacional de Vigilância Sanitária (ANVISA). Diário oficial da República Federativa do Brasil, Poder executivo, Brasília, DF, 24 de abril de 2006. Seção 1, item g, 6 p. (Etapa Clínica).
CECH, N.B.; ENKE, C.G. Practical implications of some recent studies in electrospray ionization fundamentals. Mass Spectrom. Rev., v.20, p.362-387, 2001.
CHOW, C.S.; LIU, J.P. Design and analysis of bioavailability and bioequivalence studies. New York: Hardcover, 2000. 577 p.
DOLLERY, C. Therapeutic drugs. Edinburgh: Churchill Livingstone, 1999. 3184 p.
DORHOUT MEES, S.; RINKEL, G.J.E.; FEIGIN, V.L.; ALGRA, A.; VAN DEN BERGH, W.M.; VERMEULEN, M.; VAN GIJN, J. Calcium antagonists for aneurysmal subarachnoid haemorrhage. Cochrane Database Syst. Rev., n.3, 2007. CD000277.
EVERS, S. Drug treatment of migraine in children: a comparative review. Paediatr. Drugs, v.1, p.7-18, 1999.
FISCHER, C.; SCHONBERGER, F.; MUCK, W.; HEUCK, K.; EICHELBAUM, M.; Simultaneous assessment of the intravenous and oral disposition of the enantiomers of racemic nimodipine by chiral stationary-phase high-performance liquid chromatography and gas chromatography/mass spectroscopy combined with a stable isotope technique. J. Pharm. Sci., v.82, p.244-250, 1993.
FISCHHOF, P.K.; WAGNER, G.; LITTSCHAUER, L.; APECECHEA, M.; HIERSEMENZEL, R.; ROHMEL, J.; RIITHER, E.; HOFFMEISTER, F.; SCHMAGE, N. Therapeutic results with nimodipine in primary degenerative dementia and multi-infarct dementia. In: BERGENER, M.; REISBERG, B. (Eds.) Diagnosis and treatment of senile dementia. Berlin: Springer, 1989. p.350-359.
FOGELHOLM, R.; PALOMÄKI, H.; ERILÄ, T.; RISSANEN, A.; KASTE, M. Blood pressure, nimodipine, and outcome of ischemic stroke. Acta Neurol. Scand., v.109, p.200-204, 2004.
GUALANO, V.; NTSIKOUSSALABONGUI, B.; MIGNOT, A.; DUVAUCHELLE, T.; FELICES, M.; GUILLAUME, M.; ORLANDINI, B.; HOLGUIN, J.A.; ALCAIDE, A. Comparative bioavailability of two oral nimodipine formulations after administration to 24 healthy volunteers. Clin. Drug Invest., v.17, p.475-482, 1999.
GUIDANCE FOR INDUSTRY: BIOANALYTICAL METHOD VALIDATION. US Department of Health and Human
D. F. Nascimento, M. O. Moraes, F. A. F. Bezerra, A. V. Pontes, C. R. A. Uchoa, R. A. Moraes, I. O. Leite, G. S. M. Santana1, A. P. M. Santana, et al.676
Services, Food and Drug Administration. Center for Drug Evaluation and Research (CDER). Rockville, MD: FDA, 2001. 25 p.
HAWS, C.W.; GOURLEY, J.K.; HEISTAD, D.D. Effects of nimodipine on cerebral blood flow. J. Pharmacol. Exp. Ther., v.225, p.24-28, 1983.
HERNANDEZ-HERNANDEZ, R.; COLL, T.; RACHITZKY, P.; ARMAS-HERNANDEZ, M.J.; ARMAS-PADILLA, M.C.; VELASCO, M.; RIZZO, A. Comparison of two nimodipine formulations in healthy volunteers. J. Hum. Hypertens., v.16 suppl., p.S142-S144, 2002.
HUBERT, P.H.; CHIAP, P.; CROMMEN, J.; BOULANGER, B.; CHAPUZET, E.; MERCIER, N.; BERVOAS-MARTIN, S.; CHEVALIER, P.; GRANDJEAN, D.; LAGORCE, P.; LALLIER, M.; LAPARRA, M.C.; LAURENTIE, M.; NIVET, J.C. The SFSTP guide on the validation of chromatographic methods for drug bioanalysis: from the Washington Conference to the laboratory. Anal. Chim. Acta, v.391, p.135-148, 1999.
JACKOBSEN, P.; MIKKELSEN, E.O.; LAURSEN, J.; JENSEN, F. Determination of nimodipine by gas chromatography using electron-capture detection; external factors influencing nimodipine concentrations during intravenous administration. J. Chromatogr., v.374, p.383-387, 1986.
JEMAL, M. High-throughput quantitative bioanalysis by LC/MS/MS. Biomed. Chromatogr., v.14, p.422-429, 2000.
KAZDA, S.; TOWARD, R. Nimodipine: a new calcium antagonistic drug with a preferential cerebrovascular action. Acta. Neurochir., v.63, p.259-265, 1982.
KROL, G.J.; NOE, A.J.; YEH, S.C.; RAEMSCH, K.D. Gas and liquid chromatographic analyses of nimodipine calcium antagonist in blood plasma and cerebrospinal fluid. J. Chromatogr., v.305, p.105-118, 1984.
L I A N - Q U I N G , G . ; H E N G - S H A N , T. ; G A N G C . Pharmacokinetics and bioavailability of nimodipine capsules and tablets in 8 Chinese healthy men. Acta Pharmacol. Sin.,v.14, p.295-297, 1993.
LÓPEZ, J.A.; MARTINEZ, V.; ALONSO, R.M.; JIMÉNEZ, R.M. High-performance liquid chromatography with
amperometric detection applied to the screening of 1,4-dihydropyridines in human plasma. J. Chromatogr. A., v.870, p.105-114, 2000.
MÜCK, W.M. Enantiospecific determination of nimodipine in human plasma by liquid chromatography-tandem mass spectrometry. J. Chromatogr. A., v.712, p.45-53, 1995.
MÜCK, W.; BODE, H. Bioanalytics of nimodipine- an overview of methods. Pharmazie. v.49, p.130-139, 1994.
NIESSEN, W.M. Progress in liquid chromatography-mass spectrometry instrumentation and its impact on high-throughput screening. J. Chromatogr. A., v.1000, p.413-436, 2003.
NIROGI, R.V.S.; KANDIKERE, V.N.; MAURYA, S.; MUDIGONDA, K.; BOOSI, R. Liquid chromatographic-electrospray tandem mass spectrometric method for the quantification of nimodipine. Pharmazie, v.61, p.828-834, 2006.
PANTONI, L.; BIANCHI, C.; BENEKE, M.; INZITARI, D.; WALLIN, A.; ERKINJUNTTI, T. The Scandinavian Multi-Infarct Dementia Trial: a double-blind, placebo-controlled trial on nimodipine in multi-infarct dementia. J. Neurol. Sci., v.175, p.116-123, 2000.
QIAN, M.; GALLO, J .M. High-performance l iquid chromatographic determination of the calcium channel blocker nimodipine in monkey plasma. J. Chromatogr., v.578, p.316-320, 1992.
QIN, F.; Y, MA.; WANG, Y.; CHEN, L.; WANG, D.; LI, F. Determination of nimodipine in human plasma by ultra performance liquid chromatography–tandem mass spectrometry and pharmacokinetic application. J. Pharm. Biomed. Anal., v.46, p.557-562, 2008.
QIU, F.; CHEN, X.; LI, X.; ZHONG, D. Determination of nimodipine in human plasma by a sensitive and selective liquid chromatography–tandem mass spectrometry method. J. Chromatogr. B., v.802, p.291-297, 2004.
ROSSEEL, M.T.; BOGAERT, M.G.; HUYGHENS, L. Determination of the calcium antagonist nimodipine in plasma by capillary gas chromatography and nitrogen detection. J. Chromatogr., v.533, p.224-228, 1990.
SHAH, V.P.; MIDHA, K.K.; FINDLAY, J.W.; HILL, H.M.;
Determination of nimodipine in plasma by HPLC-MS/MS and pharmacokinetic application 677
HULSE, J .D.; MCGILVERAY, I .J . ; MCKAY, G. Bioanalytical method validation--a revisit with a decade of progress. Pharm. Res., v.17, p.1551-1557, 2000.
SOBRADO, M.; LÓPEZ, M.G.; CARCELLER, F.; GARCÍA, A.G.; RODA, J.M.. Combined nimodipine and citicoline reduce infarct size, Attenuate apoptosis and increase bcl-2 expression after Focal cerebral ischemia. Neuroscience, v.118, p.107-113, 2003.
STACHURA, K.; DANILEWICZ, B. Cerebral vasospasm after subarachnoid hemorrhage. Current possibilities of prevention and treatment. Przegl. Lek., v.59, p.46-48, 2002.
SVETYI, L.I.; KURKOVA, K.S. Comparative clinico-pharmacological characteristics of nimodipine, nifedipine
and foridon in the treatment of patients with ischemic stroke in late rehabilitative and residual periods. Klin. Med. (Mosk), v.80, p.47-51. 2002.
VICTOR, S.; RYAN, S. Drugs for preventing migraine headaches in children. Cochrane Database Syst. Rev., n.4, 2003. CD002761.
YAN, X.F.; DING, D.Y.; LIU, R.J. Studies on the bioavailability and pharmacokinetics of nimodipine tablet in human body. Yao Xue Xue Bao, v.28, p.45-49, 1993.
ZHONGGUI, H.; DAFANG, Z.; XIAOYAN, C.; XIAOHONG, L.; XING, T.; LIMEI, Z. Development of a dissolution medium for nimodipine tablets based on bioavailability evaluation. European J. Pharm. Sci., v.21, p.487-491, 2004.
Received for publication on 03th April 2009.Accepted for publication on 29th April 2010.


![[Product Monograph Template - Standard] - APILAMe-lactancia.org/media/papers/Nimodipine-DS-Bayer2011.pdf · Page 1 of 27 PRODUCT MONOGRAPH PrNIMOTOP® Tablets nimodipine tablets Bayer](https://img.dokumen.tips/doc/110x75/5aae9c437f8b9a22118c3d62/product-monograph-template-standard-apilame-1-of-27-product-monograph-prnimotop.jpg)