Embed Size (px)
Citation preview
Determination of Exchange Rates
The demand and supply model for currency shows the relationship between quantity demanded and the exchange rate or price for the currency.
The demand curve for dollars slopes downward because foreigners demand a greater quantity of dollars as the local currency depreciates in value.
The supply curve for dollars slopes upward because Americans supply more dollars as the dollar appreciates relative to the peso.
The demand or supply curves shift because of changing economic conditions outside the model, reflecting relative differences between the two countries.
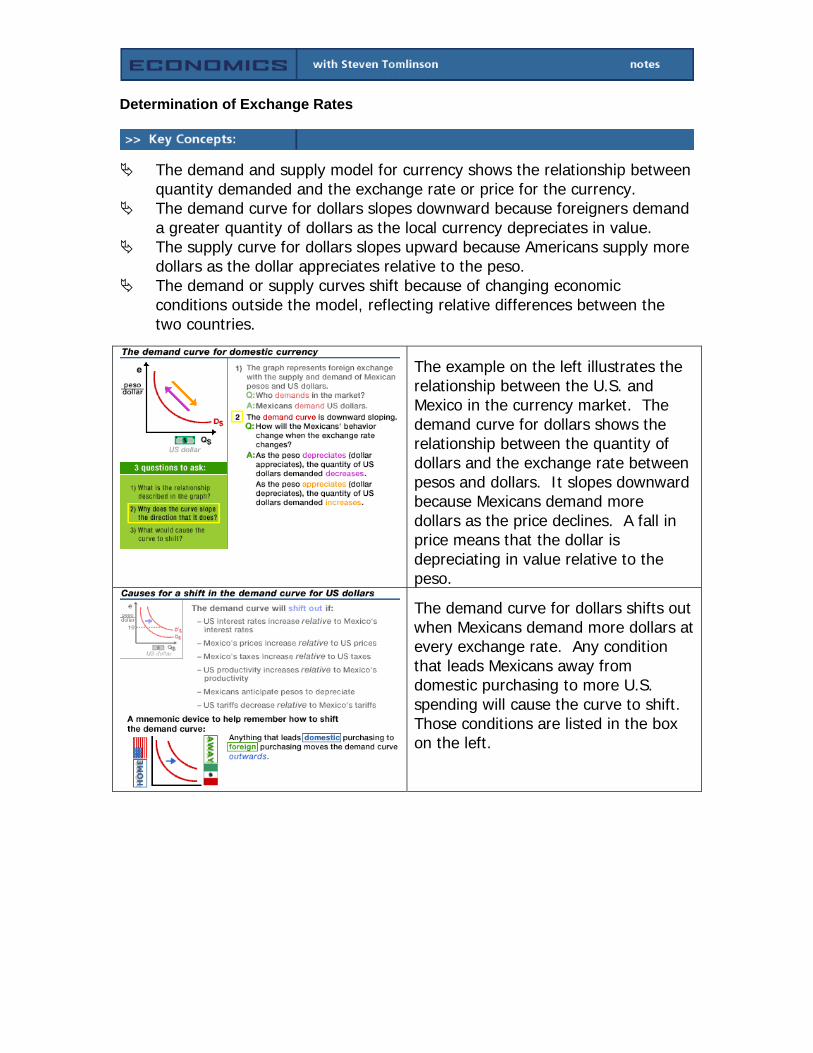
The example on the left illustrates the relationship between the U.S. and Mexico in the currency market. The demand curve for dollars shows the relationship between the quantity of dollars and the exchange rate between pesos and dollars. It slopes downward because Mexicans demand more dollars as the price declines. A fall in price means that the dollar is depreciating in value relative to the peso.
The demand curve for dollars shifts out when Mexicans demand more dollars at every exchange rate. Any condition that leads Mexicans away from domestic purchasing to more U.S. spending will cause the curve to shift. Those conditions are listed in the box on the left.
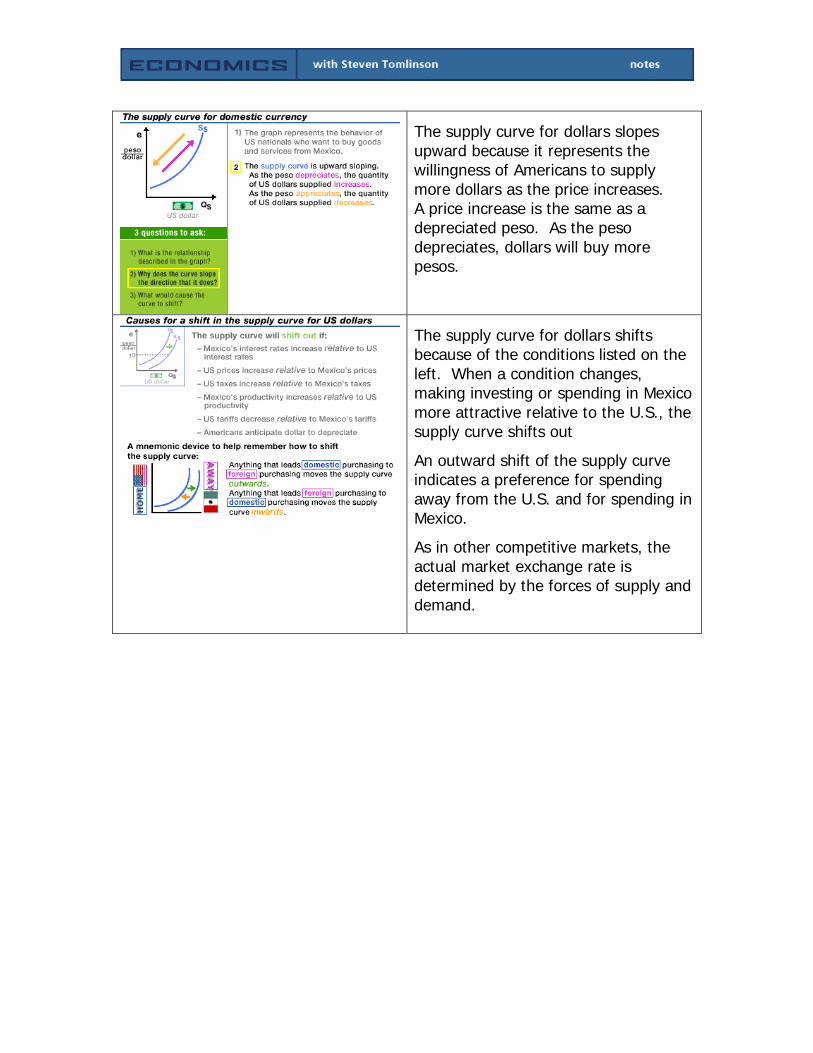
The supply curve for dollars slopes upward because it represents the willingness of Americans to supply more dollars as the price increases. A price increase is the same as a depreciated peso. As the peso depreciates, dollars will buy more pesos.
The supply curve for dollars shifts because of the conditions listed on the left. When a condition changes, making investing or spending in Mexico more attractive relative to the U.S., the supply curve shifts out
An outward shift of the supply curve indicates a preference for spending away from the U.S. and for spending in Mexico.
As in other competitive markets, the actual market exchange rate is determined by the forces of supply and demand.


