Embed Size (px)
Citation preview
Jurnal Ekonomi Pembangunan, ISSN 1411-6081176
Avalaible online at http://journals.ums.ac.id
Jurnal Ekonomi Pembangunan, 17 (2), December 2016, 176-192
DETERMINANT OF LOCAL EXPENDITURE QUALITY MODEL AND RELATION WITH LOCAL DEVELOPMENT IN EAST JAVA
Yufita Listiana, Bambang Juanda, Sri MulatsihGraduate School of Rural Planning and Development Bogor Agricultural University
Jl. Kamper Wing 2 Lv 5 Kampus IPB Dramaga Bogor 1660 IndonesiaCorresponding E-mail: [email protected]
Recieved: July 2016; Accepted: December 2016
Abstract
Keywords: Expenditure Quality, Local Development, Accountability, Transparency, Structural Equation ModellingJEL Classification: H54, H72, H75, O21
1. IntroductionDevelopment is a systematic effort and
sustainable for create a condition that can provide a variety of alternatives for achieving the aspirations of every citizen (Rustiadi et al, 2011). Todaro (2006) explain that the development is seen as a multidimensional process that covers a wide range of fundamental changes on the social structure, the attitude of society and national institutions that pursue the acceleration of economic growth, overcome income inequality, and overcome poverty. Along with the implementation of regional autonomy and the change paradigms underlying development to the society, regional development requires a participatory approach, involving all of elements of society in the region.
Implementation of regional autonomy, it means the region is given authority to manage the potential of the region in developing the potential its resources. Regional autonomy policy
has been established that fiscal decentralization is based on the consideration that region is more aware of the needs and standards public service in the region. Each region is given authority and obligation to arrange the local budget (APBD). Local budget can maximize their local revenue of existing potential, then spend those funds according the program and needs of the region has been set.
Minister Regulation No. 13 of 2006 also have determined structure of expenditure consist of indirect and direct expenditures. Indirect expenditure is budgeted expenditure not directly related to the implementation of programs and activities that include: personnel expenditure, interest expenditure, subsidy, grant expenditures, social aid, profit sharing expenditure, financial aid, and unexpected expenditures.While direct expenditure is budgeted expenditure directly related to the implementation of programs and
This research aim is to analyze local expenditure quality in East
continuously
Java based on five construct variables. Each construct variables consist of 40 indicators. This research use secondary data is Local Government Management Evaluation Report each region in East Java. Data of local development use poverty, unemployment, Gini index, economic growth, GDP per capita, and Human Development Index. This research uses analysis Structural Equation Modeling. It uses to know appropriate indicators to improve spending quality. The result shows that from 40 indicators just there are 21 indicators which have reached criteria good expenditure quality. Effectively has influence to expenditure quality more than 50% to describe model variation in local expenditure quality. It means that East Java has high financial effectively in increase public service because quality expenditure increasing each year.
Jurnal Ekonomi Pembangunan, ISSN 1411-6081 177
Avalaible online at http://journals.ums.ac.id
Jurnal Ekonomi Pembangunan, 17 (2), December 2016, 176-192
activities that include: personnel expenditure, spending of goods and services, as well as capital expenditures.In general, the problems encountered in local expenditure is the dominance of indirect expenditure compared local revenue and cause of increasing local transfer. Allocation of local transfer consist of share profit fund, General Allocation Grant (DAU), and Special Allocation Fund (DAK). If it occure countinously so increase local expenditure greater than local revenue which region will have deficit and impact to quality of the fulfillment of the right to public services not yet optimal.
Local budget especially local expenditure to this day increase countinously will have an impact on quality of public services and encourage the government activities and the private sector in the region. Expenditure less than optimal will have impact in low quality of public services and the declining performance local development. Based on data local budget of 2014, knows that every year local budget and expenditure from 2009 to 2013 has increased. In 2009 the revenue of Rp 367.268 billion up to Rp 652.865 billion in 2013. So local expenditure increased from the year 2009 amount Rp 415.232 billion to Rp 707.083 billion in 2013. In terms of the revenue side and the expenditure incurred throughout provinces in Indonesia from 2009 to 2013 is always running a budget deficit. In the local budget, to cover the budget deficit can be sourced from the remaining balance in the previous year’s budget, disbursement of reserves, sale of the wealth of separated region, and loan. Occurrence of budget deficit continously going to have an impact on infrastructure expenditure savings. Infrastructure expenditure increasingly little will also impact on the state of quality local expenditure decreases.
East Java Province is one of provinces in Indonesia which has 38 District/City. Since 2009 until 2013, East Java Province has local budget that is increasing every year, especially on the portion of local expenditure. This relates to research Juanda et al (2013) which explains that the quality of local expenditure depends on several
indicators of which should pay attention to local priorities, budget allocation accuracy, timeliness, efficient, accountability and transparency. Based on data local budget in East Java in 2008 to 2012 knows that local budget progress in East Java in 2008 to 2012 has increased. In 2010 and 2012 local expenditure greater than total revenue. Local expenditure were initially Rp 6.639.781 in 2008 to Rp 12.214.783 in 2012 means that local expenditure each year is always increasing. Besides that the growth of local revenue is much slower than the needs of the public service budget. Budgeting funds received as local income allocated in the region in the form of direct expenditure and indirect expenditure.
Quality expenditure as expenditure allocated by regional development priorities doing efficiently and effectively, timely, transparant and accountable. Juanda et al (2013) explains that five indicators have related. Quality expenditure will certainly put a priority to be implemented with discipline. High Discipline on our priorities will determine the accuracy of the budget allocation as shown by the indicator of capital expenditure, the allocation of subsidies, grants and social aid and personnel expenditure. The next priority expenditures that have been determined well then budgeted is not timely, then the result is not good. So, timely variable is something no less important in a quality expenditure. Quality expenditure can understood with fulfill of concept economic, efficient and effective. Besides that, government expenditure managed to be transparent and accountable for the economic, efficiency and effectiveness of public expenditure has done.
Based on the decision of the Ministry of Internal Affairs in 2014 about the performance of local government processes, East Java has a score 3,0519 and known to have the title quite well in comparison with other provinces in Indonesia. However, if it is associated with the performance of the local development one of which can be seen from the economic growth it can be proved that there are still some districts/cities in East Java that has economic growth below the national
Jurnal Ekonomi Pembangunan, ISSN 1411-6081178
Avalaible online at http://journals.ums.ac.id
Jurnal Ekonomi Pembangunan, 17 (2), December 2016, 176-192
growth. This proves that the region has a high predicate does not guarantee that region has a good development performance anyway. So, need for this research related to the performance evaluation of local government processes such as through expenditure quality desired region. Measurement of quality local expenditure need special model because it has abstract concept or can not direct measurement. Beside that quality local expenditure can seen from local development include of several indicators like economy growth, gini index, poverty, unemployment, GDP of per capita, human development index.
2. MethodsData used in this research is secondary data.
Sources of data this research were obtained from Ministry of Internal Affairs namely Directorate General of Regional Autonomy is evaluation data Management Local Government (EPPD) of each districts/cities in East Java, Directorate General Financial Balance, State Audit Agency (BPK), Central Bureau of Statistic (BPS). Therefore, this
research selected data use time series in 200-2012.
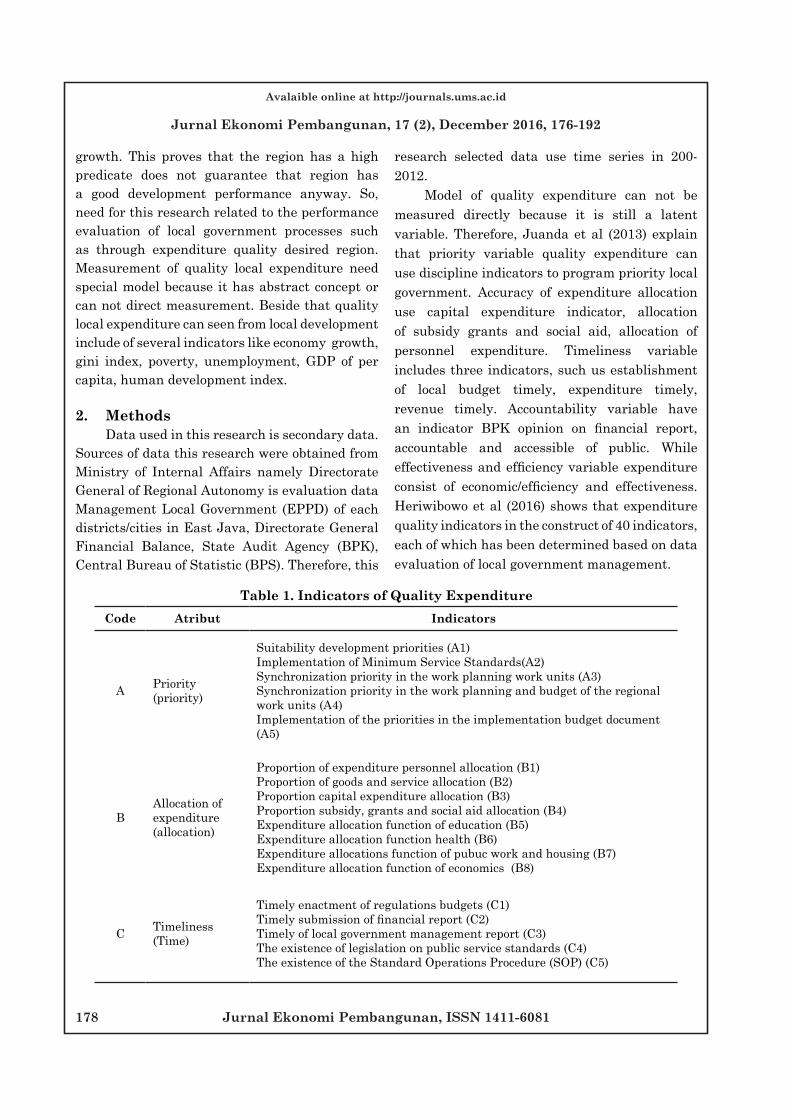
Model of quality expenditure can not be measured directly because it is still a latent variable. Therefore, Juanda et al (2013) explain that priority variable quality expenditure can use discipline indicators to program priority local government. Accuracy of expenditure allocation use capital expenditure indicator, allocation of subsidy grants and social aid, allocation of personnel expenditure. Timeliness variable includes three indicators, such us establishment of local budget timely, expenditure timely, revenue timely. Accountability variable have an indicator BPK opinion on financial report, accountable and accessible of public. While effectiveness and efficiency variable expenditure consist of economic/efficiency and effectiveness. Heriwibowo et al (2016) shows that expenditure quality indicators in the construct of 40 indicators, each of which has been determined based on data evaluation of local government management.
Table 1. Indicators of Quality ExpenditureCode Atribut Indicators
A Priority (priority)
Suitability development priorities (A1)Implementation of Minimum Service Standards(A2)Synchronization priority in the work planning work units (A3)Synchronization priority in the work planning and budget of the regional work units (A4)Implementation of the priorities in the implementation budget document (A5)
BAllocation of expenditure (allocation)
Proportion of expenditure personnel allocation (B1)Proportion of goods and service allocation (B2)Proportion capital expenditure allocation (B3)Proportion subsidy, grants and social aid allocation (B4)Expenditure allocation function of education (B5)Expenditure allocation function health (B6)Expenditure allocations function of pubuc work and housing (B7)Expenditure allocation function of economics (B8)
C Timeliness (Time)
Timely enactment of regulations budgets (C1)Timely submission of financial report (C2)Timely of local government management report (C3)The existence of legislation on public service standards (C4)The existence of the Standard Operations Procedure (SOP) (C5)
Jurnal Ekonomi Pembangunan, ISSN 1411-6081 179
Avalaible online at http://journals.ums.ac.id
Jurnal Ekonomi Pembangunan, 17 (2), December 2016, 176-192
Code Atribut Indicators
DTransparency and accountability (accountability)
The availability of information media budgeting (D1)Opinion Audit Agency to local financial report (D2Ratio of follow up the findings of BPK (D3)Availability of electronic procurement system (D4)The existence of society satisfaction survey (D5)
E Effectivity (effectivity)
Performance education affairs (E1)Performance of health affairs (E2)Performance of public work affairs (E3)Performance environmental affairs (E4)Performance development planning affairs (E5)Poverty (E6) Poverty t+1 (E6a)Unemployment (E7) Unemployment t+1 (E7a)Gini Index (E8) Gini Index t+1 (E8a)Economic growth (E9) Economic growth t+1 (E9a)GDP per capita (E10) GDP per capita t+1 (E10a)Human Development Index (E11) HDI t+1 (E11a)
Source: Heriwibowo et al (2016)
The method of analysis using the analysis Partial Least Squares of Structural Equation Modeling (SEM) to determine the quality local expenditure of each indicator and constructs that have been set. This analysis is a combination of the two methodologies disciplines that econometric perspective that focuses on predictions and psychometrika were able to describe the concept of a model with latent variables (variables that can not be measured directly), but measured by the indicators (Ghozali et al, 2015). SEM-PLS is similar to the regeresion analysis ordinay least squares (OLS) because it has the purpose of maximizing the variance of the dependent variable that can be explained in the model. Or in other words, to maximize the value of R-squared and minimize residual or errors. Another aims of the SEM-PLS is evaluate the quality of the data based on the measurement model. Therefore, SEM-PLS can be viewed as a combination of regression and factor analysis. SEM-PLS can handle reflective measurement models
(reflective measuremenet model) and formative measurement model (formative measurement model) (Hair et al., 2011). This research was calculated using SEM-PLS softwere like SmartPLS. From these calculations will produce a loading factor of each construct. PLS-SEM path modeling using SmartPLS is appropriate to carry on the confirmatory factor analysis which is more reliable and valid (Asyraf, 2013).
Further evaluation models of the evaluation of measurement model and evaluation of the structural model (Hair et al., 2011). PLS-SEM analysis usually consists of two sub-models of the measurement model (measurement model) or often called the outer model and the structural model (structural model) or commonly called inner models. The model shows that how presented the manifest variables or latent variables observed variables to be measured. While the structural model shows the estimated force between the latent variables or constructs. Here are pictures of models from this research:
Jurnal Ekonomi Pembangunan, ISSN 1411-6081180
Avalaible online at http://journals.ums.ac.id
Jurnal Ekonomi Pembangunan, 17 (2), December 2016, 176-192
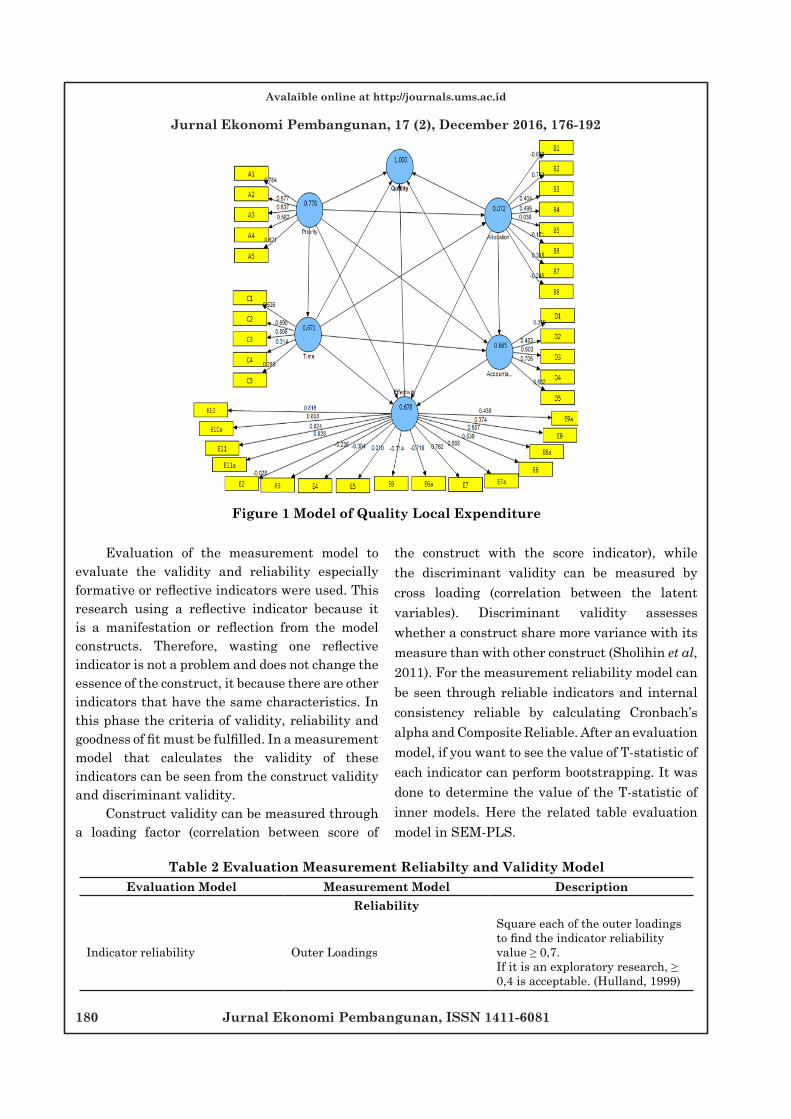
Figure 1 Model of Quality Local Expenditure
Evaluation of the measurement model to evaluate the validity and reliability especially formative or reflective indicators were used. This research using a reflective indicator because it is a manifestation or reflection from the model constructs. Therefore, wasting one reflective indicator is not a problem and does not change the essence of the construct, it because there are other indicators that have the same characteristics. In this phase the criteria of validity, reliability and goodness of fit must be fulfilled. In a measurement model that calculates the validity of these indicators can be seen from the construct validity and discriminant validity.
Construct validity can be measured through a loading factor (correlation between score of
the construct with the score indicator), while the discriminant validity can be measured by cross loading (correlation between the latent variables). Discriminant validity assesses whether a construct share more variance with its measure than with other construct (Sholihin et al, 2011). For the measurement reliability model can be seen through reliable indicators and internal consistency reliable by calculating Cronbach’s alpha and Composite Reliable. After an evaluation model, if you want to see the value of T-statistic of each indicator can perform bootstrapping. It was done to determine the value of the T-statistic of inner models. Here the related table evaluation model in SEM-PLS.
Table 2 Evaluation Measurement Reliabilty and Validity ModelEvaluation Model Measurement Model Description
Reliability
Indicator reliability Outer Loadings
Square each of the outer loadings to find the indicator reliability value ≥ 0,7.If it is an exploratory research, ≥ 0,4 is acceptable. (Hulland, 1999)
Jurnal Ekonomi Pembangunan, ISSN 1411-6081 181
Avalaible online at http://journals.ums.ac.id
Jurnal Ekonomi Pembangunan, 17 (2), December 2016, 176-192
Evaluation Model Measurement Model Description
Internal ConsistencyReliability Reliability numbers
Composite reliability ≥ 0,7 , if it is an exploratory research composite reliability ≥ 0,6 (Bagozzi dan Yi, 1988)
Validity
Convergent validity AVE numbers AVE numbers should be ≥0,5 (Bagozzi dan Yi, 1988)
Discriminant validity AVE numbers and Latent Variable Correlations
Fornell and Larcker (1981) suggest that the square root of AVE of each latent variable should be greater than the correlations among the latent variables.
Source: Kay Wong et al (2013)
3. Result and DiscussionEast Java is the province of the referenced
economy after Jakarta and West Java Province. East Java is the second largest contributor development in national economy after Jakarta with contributions amount 14.40% in 2014. East Java Province has a strategic position in the industry because it location between Central Java and Bali. Based on the statistics area of East Java province in 2015, economic growth amount 6.31% increasing in 2012 amount to 6.64%. However, the next year in 2013 and 2014 economic growth in East Java slowed down by 6.08% and 5.86%. East Java is known as region that has a population density is quite high and are second after West Java. Besides that, East Java is a region that has a number of District/City is good too much in the other province. Therefore, the characteristics of each region is very different to make a self-sufficient region and not too dependent on the central region. Importance of a difference to know what are region able to survive in improving the economy and improve the welfare of society can be seen in the economy growth. Beside that, East Java is one of include region has highest financial performance among other provinces in Indonesia based on the decision Ministry of Internal Affairs in 2014. However, the real
conditions in East Java are still some regions that have high levels of economic growth below the average national economy growth.
Expenditure quality has 40 indicators used to evaluate the performance of development especially in the field of expenditure based Priority, Time Allocation, timeliness, accountability and effectiveness constructs suitable with the conceptual framework of measuring the quality of expenditure (Juanda et al, 2013). Based on construct variables can be explained that what variables are more dominant in East Java province in terms of supporting expenditure quality. This research uses techniques Partial Least Square (PLS) with SmartPLS softwere version 2.0. Measurement model in PLS model consists of two measuring devices that construct validity and test realibility.
Construct validity is composed of convergent validity and discriminant validity. Convergent validity can measure by a factor loading indicators (correlation between the values of the indicator to construct a variable value) to the value of the construct. This research there were 5 construct variables each of these variables does not equal the number of indicators. Based on the results of the measurement model, constructs should be a validity test (loading factor > 0.4). Loading
Jurnal Ekonomi Pembangunan, ISSN 1411-6081182
Avalaible online at http://journals.ums.ac.id
Jurnal Ekonomi Pembangunan, 17 (2), December 2016, 176-192
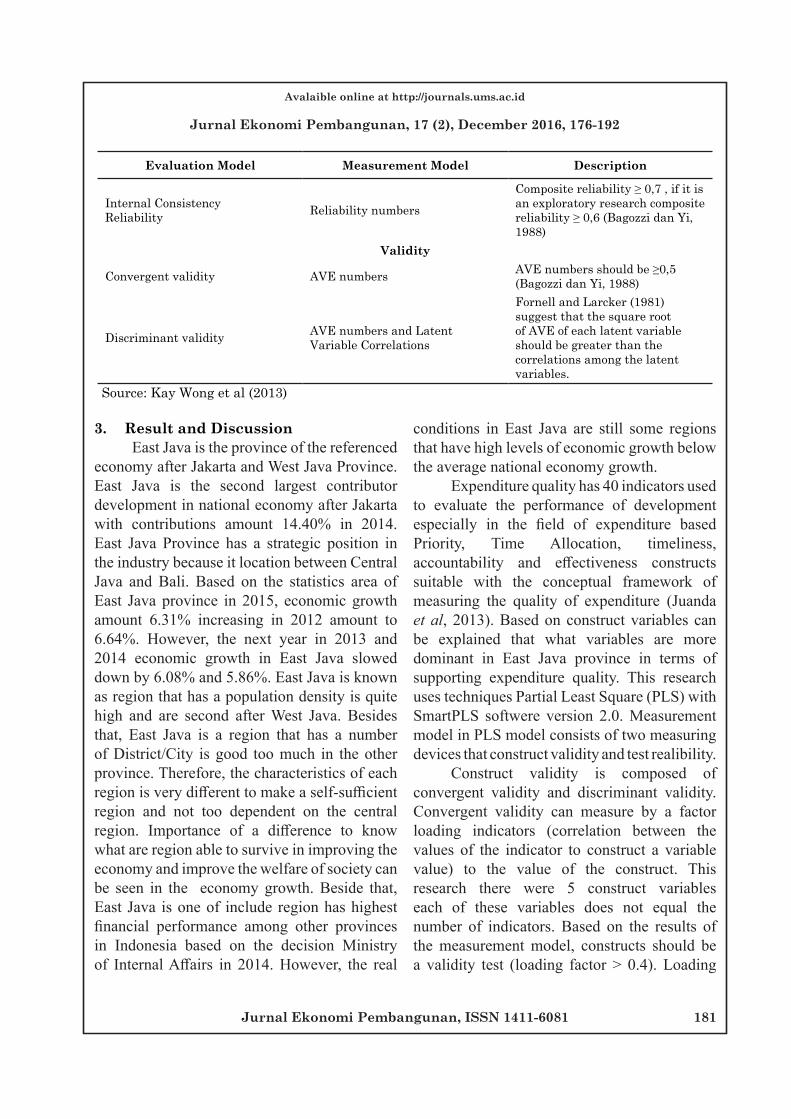
factors are used to determine the appropriate indicators that can meet the established criteria. The results of the correlation between indicators
and construct can be view by coefficients that match the criteria as shown in Figure 2.
Figure 2 First Structural Model of Expenditure Quality East Java Source: Processed data from Output SmartPLS 2.0
Based on Figure 2 that are 40 indicators will be obtained indicators have reached the convergent validity criteria based on factors loading. Hair et al (2011) explain that for loading factors that not fulfill the criteria should be eliminated because it can increase the value of the loading factor and construct reliability (CR) in a model. The results obtained in model after the elimination of a number of indicators can be found 21 valid indicators. However, the result is correlation between the path coefficients has a negative value. It is not suitable with the first hypothesis which states that the associations of each construct variable have prediction positive
effect on the expenditure quality. Therefore, data of expenditure quality has done moderating effect.
Moderating variables are variables that have a high dependency correlation with dependent variable (endogenous) and independent variables (exogenous). Moderating variables are used with the intent to influence or change the first correlation between the independent variables (exogenous) and the dependent variable (endogenous). In this research, the moderating variables are latent variables priorities and timeliness as a priority is something that takes precedence in decision making local expenditure quality. While timeliness variable is
Jurnal Ekonomi Pembangunan, ISSN 1411-6081 183
Avalaible online at http://journals.ums.ac.id
Jurnal Ekonomi Pembangunan, 17 (2), December 2016, 176-192
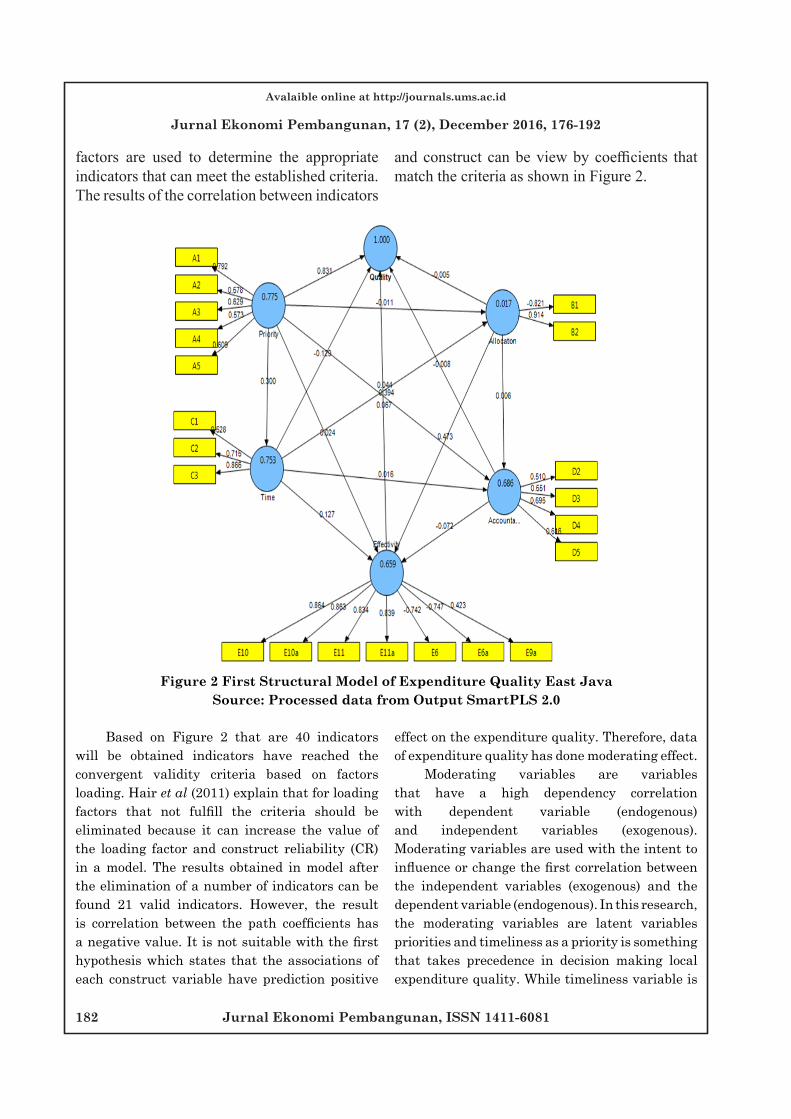
a budget discipline oriented to the needs of society without leaving a balance between the financing of government administration, development and
society service. Here are the results after using the model of expenditure quality moderating effect can be seen in Figure 3.
Figure 3 Expenditure Quality of Model with Moderation Effect
Based on Figure 3 shows the results of test the validity of convergent measured by the outer loading, Communality and AVE (Average Variance Extraced). In the test of convergent validity in exploratory research is acceptable if the outer loading> 0.4, communality> 0.5 and AVE> 0.5 (Hair et al, 2011). On models with the expenditure quality use moderating effect is known that from 40 indicators of the expenditure just are only 21 indicators that have suitable of criteria in convergent validity. In models with the moderating effects CR value also increased compared to the first model.
Results of test the construct validity of the model expendituree quality there are 21 indicators that are relevant in improving local expenditure quality in East Java and discriminant validity results indicate that the constructs of effectifity is higher than other constructs. It means that East Java use financial budget which economis,
efficient and effectively. Effectiveness consist of poverty, economic growth, GDP per capita, and human development index. All of about the support local development. It suitable with the region document ini East Java that GDP per capita and human development index increasingly each year also economic growth increase slow down. It also means that effectivity have high influence to expenditure quality. East Java have a good economic performance during 2006-2013, because this region has industry field which get Product Domestic Regional Bruto second larger in Indnesia after Jakarta.
In addition to test the construct validity, reliability test measured by two criteria: Composite Realibity and Cronbach Alpha to be of greater value than 0.7 even if the value of 0.6 is acceptable for exploratory research (Hair et al, 2011). Results realibility constructs can be seen in Table 3.
Jurnal Ekonomi Pembangunan, ISSN 1411-6081184
Avalaible online at http://journals.ums.ac.id
Jurnal Ekonomi Pembangunan, 17 (2), December 2016, 176-192
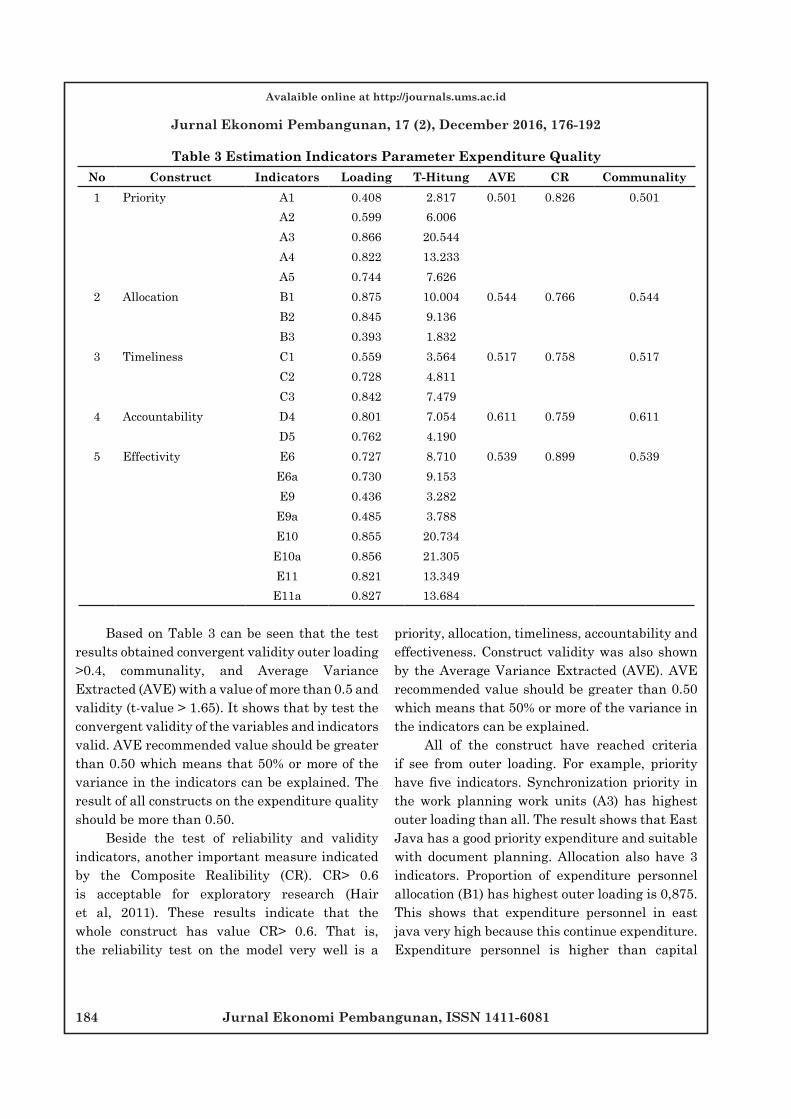
Table 3 Estimation Indicators Parameter Expenditure QualityNo Construct Indicators Loading T-Hitung AVE CR Communality1 Priority A1 0.408 2.817 0.501 0.826 0.501
A2 0.599 6.006A3 0.866 20.544A4 0.822 13.233A5 0.744 7.626
2 Allocation B1 0.875 10.004 0.544 0.766 0.544B2 0.845 9.136B3 0.393 1.832
3 Timeliness C1 0.559 3.564 0.517 0.758 0.517C2 0.728 4.811C3 0.842 7.479
4 Accountability D4 0.801 7.054 0.611 0.759 0.611D5 0.762 4.190
5 Effectivity E6 0.727 8.710 0.539 0.899 0.539E6a 0.730 9.153E9 0.436 3.282
E9a 0.485 3.788E10 0.855 20.734
E10a 0.856 21.305E11 0.821 13.349
E11a 0.827 13.684
Based on Table 3 can be seen that the test results obtained convergent validity outer loading >0.4, communality, and Average Variance Extracted (AVE) with a value of more than 0.5 and validity (t-value > 1.65). It shows that by test the convergent validity of the variables and indicators valid. AVE recommended value should be greater than 0.50 which means that 50% or more of the variance in the indicators can be explained. The result of all constructs on the expenditure quality should be more than 0.50.
Beside the test of reliability and validity indicators, another important measure indicated by the Composite Realibility (CR). CR> 0.6 is acceptable for exploratory research (Hair et al, 2011). These results indicate that the whole construct has value CR> 0.6. That is, the reliability test on the model very well is a
priority, allocation, timeliness, accountability and effectiveness. Construct validity was also shown by the Average Variance Extracted (AVE). AVE recommended value should be greater than 0.50 which means that 50% or more of the variance in the indicators can be explained.
All of the construct have reached criteria if see from outer loading. For example, priority have five indicators. Synchronization priority in the work planning work units (A3) has highest outer loading than all. The result shows that East Java has a good priority expenditure and suitable with document planning. Allocation also have 3 indicators. Proportion of expenditure personnel allocation (B1) has highest outer loading is 0,875. This shows that expenditure personnel in east java very high because this continue expenditure. Expenditure personnel is higher than capital
Jurnal Ekonomi Pembangunan, ISSN 1411-6081 185
Avalaible online at http://journals.ums.ac.id
Jurnal Ekonomi Pembangunan, 17 (2), December 2016, 176-192
expenditure because it pattern of expenditure on focused to government affairs (Larengkum et al, 2014).
Timeliness has three indicators but timely of local government management report (C3) is highest outer loading. This shows that region in East Java dicipline to report the result of use expenditure. Accountability has two indicators and the highest outer loading is Availability of electronic procurement system (D4). This shows that good accountability and can be seeing at electronic procurement system in each region. Effectivity have eight indicators, each indicator have impact to local development. GDP per capita (E10) is one of indicators which have highest in east java. It can be support conditional economics
in east java because have high GDP per capita, if the high GDP per capita, economic growth in the state alleged that high anyway.
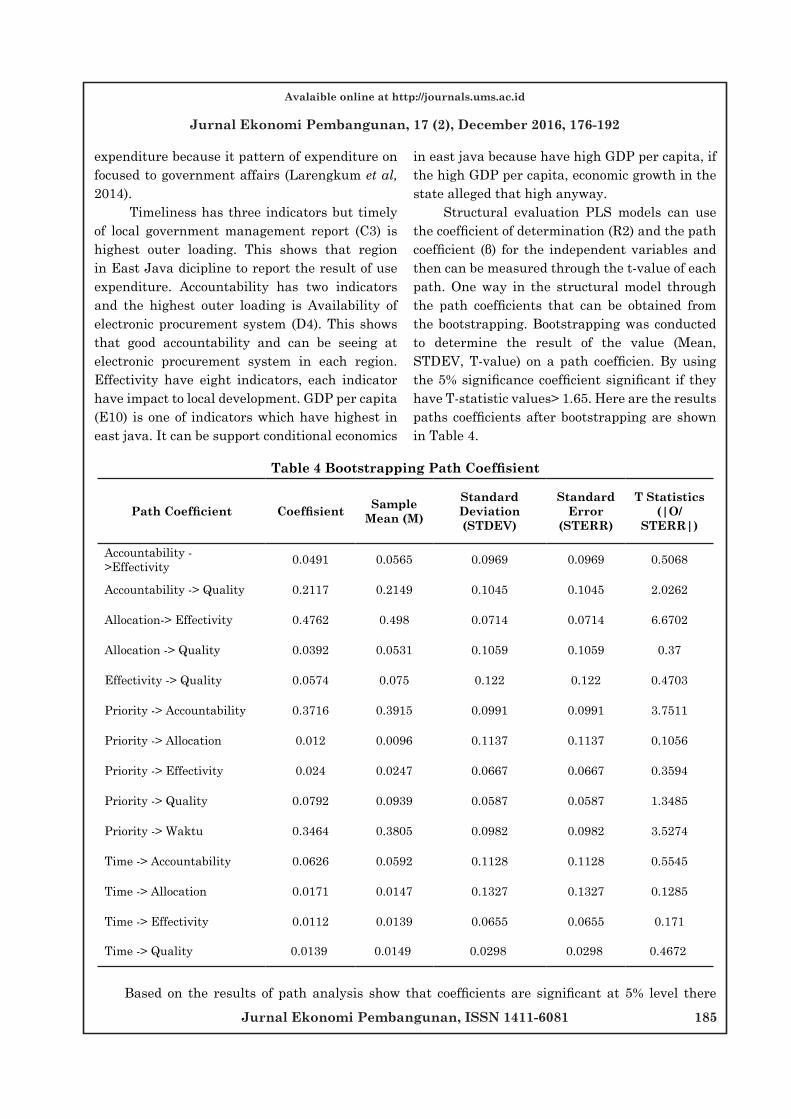
Structural evaluation PLS models can use the coefficient of determination (R2) and the path coefficient (β) for the independent variables and then can be measured through the t-value of each path. One way in the structural model through the path coefficients that can be obtained from the bootstrapping. Bootstrapping was conducted to determine the result of the value (Mean, STDEV, T-value) on a path coefficien. By using the 5% significance coefficient significant if they have T-statistic values> 1.65. Here are the results paths coefficients after bootstrapping are shown in Table 4.
Table 4 Bootstrapping Path Coeffisient
Path Coefficient Coeffisient Sample Mean (M)
Standard Deviation (STDEV)
Standard Error
(STERR)
T Statistics (|O/
STERR|)
Accountability - >Effectivity 0.0491 0.0565 0.0969 0.0969 0.5068
Accountability -> Quality 0.2117 0.2149 0.1045 0.1045 2.0262
Allocation-> Effectivity 0.4762 0.498 0.0714 0.0714 6.6702
Allocation -> Quality 0.0392 0.0531 0.1059 0.1059 0.37
Effectivity -> Quality 0.0574 0.075 0.122 0.122 0.4703
Priority -> Accountability 0.3716 0.3915 0.0991 0.0991 3.7511
Priority -> Allocation 0.012 0.0096 0.1137 0.1137 0.1056
Priority -> Effectivity 0.024 0.0247 0.0667 0.0667 0.3594
Priority -> Quality 0.0792 0.0939 0.0587 0.0587 1.3485
Priority -> Waktu 0.3464 0.3805 0.0982 0.0982 3.5274
Time -> Accountability 0.0626 0.0592 0.1128 0.1128 0.5545
Time -> Allocation 0.0171 0.0147 0.1327 0.1327 0.1285
Time -> Effectivity 0.0112 0.0139 0.0655 0.0655 0.171
Time -> Quality 0.0139 0.0149 0.0298 0.0298 0.4672
Based on the results of path analysis show that coefficients are significant at 5% level there

Jurnal Ekonomi Pembangunan, ISSN 1411-6081186
Avalaible online at http://journals.ums.ac.id
Jurnal Ekonomi Pembangunan, 17 (2), December 2016, 176-192
are only 4 path coefficient of 14 path coefficients. The path coefficient consist of accountability that influence significantly the local expenditure quality (0.21; 2.03), significantly influence the effectiveness to the allocation (0,47; 6,67), priorities which influence to the accountability (0.37; 3, 75) and the priorities that significantly influence to timeliness (0.34; 3.53). Of the four path coefficients were positive and significant influence of which have the meanings:a. Accountability = 0,217 means that, the
influence accountability on the local expenditure quality amount to 0,217. This means that if accountability is increasing one unit so the local expenditure quality will be increase by 0,217 units.
b. Allocation = 0.476 means that a largeinfluence allocation to effectiveness of budget amounted to 0.476. This means that if the allocation increase by one unit then the budget effectiveness will be increase by 0.476 units.
c. Priority = 0.37 means that the influence ofpriority to accountability is 0.37. This meansthat if the priority increases by one unit thenthe accountability will be increase by 0.37units.
d. Priority = 0.34 means that the influenceof priorities to the timeliness is 0.34. Thismeans that if the priority increase by oneunit the priority increase by 0.34 units.
Allocation constructs coefficient has thehighest influence to the effectiveness of 0.47 and significance of the highest compared to other constructs. This means that the allocation of variables accounted for 47% in improving the expenditure quality. The results of path analysis explains that the local expenditure quality is determined by the effectiveness of the allocation constructs. This means that the allocation in a region very important to support local development. It is development of the local expenditure quality of the 2009-2012 in East Java province.
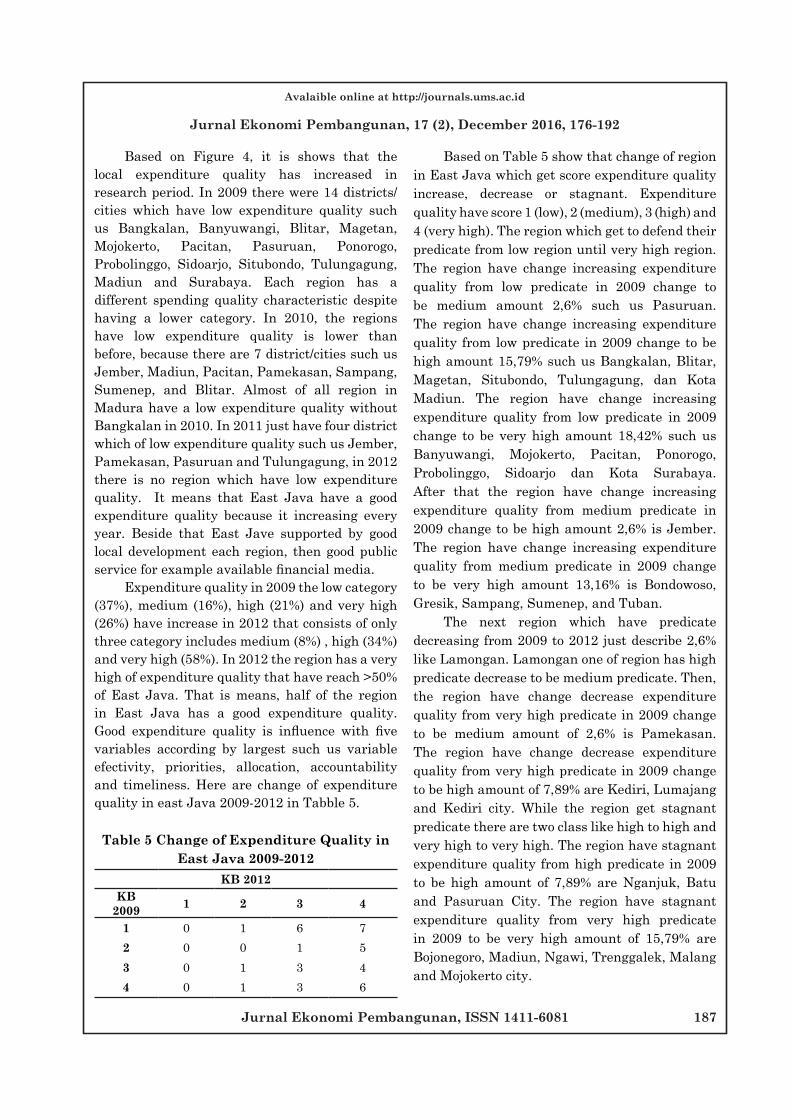
Figure 4 Map of Expenditure Quality in East 2009-2012
Jurnal Ekonomi Pembangunan, ISSN 1411-6081 187
Avalaible online at http://journals.ums.ac.id
Jurnal Ekonomi Pembangunan, 17 (2), December 2016, 176-192
Based on Figure 4, it is shows that the local expenditure quality has increased in research period. In 2009 there were 14 districts/cities which have low expenditure quality such us Bangkalan, Banyuwangi, Blitar, Magetan, Mojokerto, Pacitan, Pasuruan, Ponorogo, Probolinggo, Sidoarjo, Situbondo, Tulungagung, Madiun and Surabaya. Each region has a different spending quality characteristic despite having a lower category. In 2010, the regions have low expenditure quality is lower than before, because there are 7 district/cities such us Jember, Madiun, Pacitan, Pamekasan, Sampang, Sumenep, and Blitar. Almost of all region in Madura have a low expenditure quality without Bangkalan in 2010. In 2011 just have four district which of low expenditure quality such us Jember, Pamekasan, Pasuruan and Tulungagung, in 2012 there is no region which have low expenditure quality. It means that East Java have a good expenditure quality because it increasing every year. Beside that East Jave supported by good local development each region, then good public service for example available financial media.
Expenditure quality in 2009 the low category (37%), medium (16%), high (21%) and very high (26%) have increase in 2012 that consists of only three category includes medium (8%) , high (34%) and very high (58%). In 2012 the region has a very high of expenditure quality that have reach >50% of East Java. That is means, half of the region in East Java has a good expenditure quality. Good expenditure quality is influence with five variables according by largest such us variable efectivity, priorities, allocation, accountability and timeliness. Here are change of expenditure quality in east Java 2009-2012 in Tabble 5.
Table 5 Change of Expenditure Quality in East Java 2009-2012
KB 2012KB
2009 1 2 3 4
1 0 1 6 72 0 0 1 53 0 1 3 44 0 1 3 6
Based on Table 5 show that change of region in East Java which get score expenditure quality increase, decrease or stagnant. Expenditure quality have score 1 (low), 2 (medium), 3 (high) and 4 (very high). The region which get to defend their predicate from low region until very high region. The region have change increasing expenditure quality from low predicate in 2009 change to be medium amount 2,6% such us Pasuruan. The region have change increasing expenditure quality from low predicate in 2009 change to be high amount 15,79% such us Bangkalan, Blitar, Magetan, Situbondo, Tulungagung, dan Kota Madiun. The region have change increasing expenditure quality from low predicate in 2009 change to be very high amount 18,42% such us Banyuwangi, Mojokerto, Pacitan, Ponorogo, Probolinggo, Sidoarjo dan Kota Surabaya. After that the region have change increasing expenditure quality from medium predicate in 2009 change to be high amount 2,6% is Jember. The region have change increasing expenditure quality from medium predicate in 2009 change to be very high amount 13,16% is Bondowoso, Gresik, Sampang, Sumenep, and Tuban.
The next region which have predicate decreasing from 2009 to 2012 just describe 2,6% like Lamongan. Lamongan one of region has high predicate decrease to be medium predicate. Then, the region have change decrease expenditure quality from very high predicate in 2009 change to be medium amount of 2,6% is Pamekasan. The region have change decrease expenditure quality from very high predicate in 2009 change to be high amount of 7,89% are Kediri, Lumajang and Kediri city. While the region get stagnant predicate there are two class like high to high and very high to very high. The region have stagnant expenditure quality from high predicate in 2009 to be high amount of 7,89% are Nganjuk, Batu and Pasuruan City. The region have stagnant expenditure quality from very high predicate in 2009 to be very high amount of 15,79% are Bojonegoro, Madiun, Ngawi, Trenggalek, Malang and Mojokerto city.
Jurnal Ekonomi Pembangunan, ISSN 1411-6081188
Avalaible online at http://journals.ums.ac.id
Jurnal Ekonomi Pembangunan, 17 (2), December 2016, 176-192
Based on describe about change of expenditure quality from 2009-2012 can know that the region which have increase predicate expenditure quality amount of 63,16%, then the region which have decrease predicate expenditure quality amount of 13,16%. While the region which have stagnant predicate expenditure quality amount of 23,68%. All of expenditure quality influence by the budget priorities are priorities suitability, implementations of minimum standard service, synchronization priority for the working plan work unit, synchronization priority in the work plan and budget of the regional work units, implementation of the priorities in the implementation budget document was appropriate. It means that East Java doing activities according to the working plan on document region by Development Planning Medium Run of Region (RPJMD). Determination of priority aims to improve control, transparency, participation, accountability through decision making based (Alkin & Christie, 2004).
Allocation of expenditure quality in East Java is higher personnel expenditure than capital expenditure. The allocation of personnel expenditures are routine expenditures incurred each year by region to provide salaries to civil servant in the government. Allocation consist of three indicators. Indicators which influence to expenditure allocation is proportion of expenditure on personnel allocation, proportion of the expenditure allocation on goods and service, proportion of capital expenditure. Indicators which have high score is personnel allocation and capital expenditure get lower value than personnel allocation and goods and service allocations. It means that available infrastructure saving because East Java have deficit budget in 2010 to 2012. Capital expenditure allocation was based on the local needs for facilities and infrastructure. The higher level of capital investment expected to improve the quality of public services, because the fixed assets due to capital expenditure is a key for the implementation of governmental duties and provides services to the public (Oktora et al, 2013)
Timeliness of budget in East Java is also very good. This is supported by the budget- regulations setting, timely submission of financial statements, and Timeliness of local government management report. Based on the results of the data model of the expenditure quality can be know that the largest factor loading is achieved by the timeliness of local government management report of 0867. It means that timeliness of local government management report influence 86% to the local expenditure quality. In case of delay in submission of the report will impact to lack of financial performance in the implementation of public revenue and expenditure. The financial statements will be submitted to the State Audit Agency (BPK) after the end of the budget used. Based on that, the State Audit Agency will give opinions related to the financial management system. It same with the decision of the Ministry of Internal Affairs in 2014 about the performance of financial reports that East Java had the highest score compared to other province in Indonesia.
Accountability is aspect of the disclosure of information in transparency process to public service of all budget activities have done. Based on the Report of Opinion State Audit Agency since 2010 until 2014 East Java province has gained the title of financial statements WTP (unqualified) respectively. In 2015, East Java back predicate WTP in financial report. This means that the area of East Java has a level of integrity and high transparency between government officers along with the participation society of East Java. WTP Opinion may reflect that accountability has been implemented to produce good performance. Accountability in the region is needed to produce the performance of governance, regional development and public service better than before.
Effectiveness in development also needed. The construct is an indicator of the effectiveness of the impact of a development activity. It is necessary that the planned activities will give positive impact the maximum output. So, with a development activities financed through local
Jurnal Ekonomi Pembangunan, ISSN 1411-6081 189
Avalaible online at http://journals.ums.ac.id
Jurnal Ekonomi Pembangunan, 17 (2), December 2016, 176-192
expenditure is expected to get efficient ouput, economic and effective. The effectiveness of which can directly influence the quality of expenditure includes poverty, economic growth, the GDP per capita and Human Development Index (HDI). The highest value of CR was also achieved by the construct of the effectiveness of 90%, it means that the effectiveness construct has large influence in the local expenditure quality. Expenditure quality in East Java province has been using highly efficient and effective spending in reach performance targets. This is same with the priorities construct that describes the overall performance of the construction in East Java in accordance with the working plan on budget document region guided by RPJMD in region.
The difference of this study with previous research is the variable used as well as different locations to analyze the expenditure quality and its relation to development performance. Heriwibowo et al (2016) data used particularly in the variable effectivity construct consists of a group of performance indicators of output, outcome, and impact. While in this particular research the effectivity of using only performance output and impact indicators. Beside that, the performance indicators use effects of poverty, unemployment, gini index, economic growth, per capita income and human development index. Each of these performance indicators are also used in the construction of t and t + 1 to see the impact in subsequent years. The method used at that Structural Equation Modelling (SEM), but previous studies add a cluster analysis because the data produced is not homogeneous. This study does not require a cluster analysis because the data is already homogeneous, in a previous study, the research areas that are used throughout the provinces in Indonesia, while this study within the scope of the district/city, especially in East Java. The results are significant indicators also different, the earlier study as many as 24 indicators whereas this study of 21 indicators. Variable which highest is priority in research before while this research is effectivity.
Researchers try to use this region in the province of East Java because based on the results of previous studies have an order higher than any other province in Indonesia. Factors that support the quality of budget and expenditure is as well as the efforts of local governments to efficiency use of the budget, while the factors that resistor the quality of budget and expenditure is limited time in the budget submission, the lack of preparation in the preparation of the budget, less than the maximum community participation, the limited ability of local budgets (Susetyo et al, 2014)
4. Development Economic ImpactAt the result expenditure quality has high
relation to development economic, this show in the construct variable effectivity. Indicators of effectivity consist of poverty, economic growth, GDP per capita and HDI. Each of these variables directly affects the expenditure quality. Poverty is one of indicator to measure local development which affects the quality of spending by 72%. If a region has a high expenditure quality will be able to reduce poverty in the region. At 2013 East Java reach the largest number of poor people in Indonesia, however, when seen from the changes in poverty in East Java experienced a decline in 2009 were 5,860,736 inhabitants by the year 2013 as many as 4.89301 million inhabitants. A poor person in East Java from year to year has decreased quite stable. However, it is when compared with other regions in Indonesia is an area that has the highest number of poor people. Poverty problem in East Java is the central issue, which means economic developments in East Java pay more attention to poverty reduction faster than the national.
Economic growth is also one of indicators that influence expenditure quality by 43%. This means that if high expenditure quality, economic growth will also increase. The national economy in 2014 reached 5.02%, lower than in 2013, which reached 5.58%. Meanwhile, East Java grows up 6.08% in 2013 and 5.86% in 2014. In the region level, the economic slowdown occurred in almost all regions,
Jurnal Ekonomi Pembangunan, ISSN 1411-6081190
Avalaible online at http://journals.ums.ac.id
Jurnal Ekonomi Pembangunan, 17 (2), December 2016, 176-192
except the seven regions that experienced an increase in economic growth. The region includes Ponorogo, Malang, Jember, Bojonegoro, Gresik, Bangkalan and Kediri. Economic growth the region varies between 0.07 to 7.19%. In 2014 economic growth was highest in Bangkalan, while economic growth was lowest in Sampang. Both of these areas are included in Madura Island region has a substantial contribution to East Java in the mining and quarrying sector, especially oil and gas mining.
Income per capita is often referred to as the GDP per capita is used to see if people’s income increases every year. The GDP per capita is one indicator that has the highest score in the outer loading variable construct of effectifity is 0.855 or 85%. GDP per capita East Java in 2014 occurred in the town of Kediri Rp 315 960 thousand and was followed by Surabaya Rp 128 820 thousand, Gresik Rp 67 048 thousand, Sidoarjo regency Rp 62 717 thousand and Pasuruan Rp 60 269 thousand. Economy is always growing during 2010-2014 followed by an increase in GDP per capita in all regions. Its growth varies between 5.16 to 38.89%. GDP per capita growth was highest in Sumenep (38.89%) while the lowest growth occurred in Bangkalan (5.16%). This condition proves that expenditure quality which high will be increase GDP per capita.
Human Development Index in East Java is still below the national HDI levels from year to year. East Java has a HDI level of 71.06 in 2009 and continued to increase until the year 2013 reached 73.54. An increase that occurred in East Java has yet to reach the level of HDI at the national level. This illustrates that the quality of the population in East Java is still below the average growth rate of the National IPM both in terms of productivity, equity, sustainability and empowerment. From the side it is expected that society can continue to produce so the development process continues to run smoothly. In addition it also followed by equalization indicating equitable access to economic and social resources for the entire population in East Java. One area that has a very
high HDI value in 2014 in the province of East Java city of Surabaya at 78.97 while the districts with the lowest HDI value is Sampang amounted to 62.39. Based on pre-defined categories that Surabaya among the regions with medium HDI category while Sampang including low category. So, human development index in East Java must be increased to get expenditure quality well. HDI give the second high score in construct effectivity is 82%. This important to increase three category like us health, education, and a decent life to support expenditure be efficiency. This result different with research before shows that there was no significant effect between spending allocations directly to the quality of human development as measured using the Human Development Index (HDI) (Vegirawati, 2012).
5. ConclusionExpenditure quality as expenditure
allocated by regional development priorities done efficiently and effectively, timely, transparent, and accountable. This research was conducted to look at the expenditure quality in East Java through the kinds of expenditure qualithy: personnel expenditure, capital expenditure, expenditure of goods and services, expenditure grants, social assistance expenditure, exenditure for the results, financial aid expenditure and expenditure was not unexpected. Expenditure quality is very important to know what potential or program has been implemented in an area. Measuring the quality of expenditure areas require particular model because it is an abstract concept or can not be measured directly.
This research aims to look at whether expenditure government has been targeted, timely and beneficial to society. This research also establish a model of expenditure quality from a wide range of variable indicator constructs. This research in East Java because it is one of province the best in Indonesia. thus aims to determine what indicators has a maximum score and need to be optimized while indicators that have lowscore will be increased. This research to measure indicators
Jurnal Ekonomi Pembangunan, ISSN 1411-6081 191
Avalaible online at http://journals.ums.ac.id
Jurnal Ekonomi Pembangunan, 17 (2), December 2016, 176-192
that affect the expenditure quality in East Java and knowing the performance of expenditure quality district. Benefit from this research is policy makers in this regard the government as policy makers in expenditure through the budget to improve the potential of the region and public services. Beside that, to know any district that has a very high capability in managing expenditure regional.
Local expenditure quality consist of five variables construct each have a number of different indicators. Based on the results obtained by processing 21 indicators that influence the expenditure quality in East Java. From five variables that have the highest influence on expenditure quality is effectivity. Effectivity has a value of more than 50% in describing variations of expenditure quality model in East Java. The path coefficients associated positively and significantly there are 4 of them accountability that influence significantly the local expenditure quality (0.21; 2.03), significantly influence the effectiveness of the allocation (0,47; 6,67), priorities which influence to accountability (0,37; 3,75) and the priorities that significantly influence the timeliness (0.34; 3.53). Besides map changes of expenditure quality from 2009 to 2012 has increased continuously. In 2009 the region has a low level of quality of spending by 37% and in 2014 there was no region that has a lower expenditure quality category. In 2014 only three categories (medium, high, very high). It shows that East Java every year has resulted of local government performance is better in order to have an positive impact on development conditions. Available with local expenditure quality of East Java can determine each district/city potential of what is supposed to allocate expenditure needs to be improved in the region targeted, accountable and effective.
Based on the research that East Java is supported by high effectivity consist of indicators poverty, economic growth, GDP per capita and Human Development Index. So, suggestion in this research is need a policy that give to increase
local expenditure quality, especially region that have growth rates below the national average on the timeliness of the budget. Suitability priority should also be improved better to be more in line with the development activities planned in each unit work. Available to need for alignment between the regulation of regional development planning, financial management and financial accounting systems and performance evaluation of regional development. It aims to improve the capacity of Government officials and active role society in development priorities through expenditure quality.
6. AcknowledgmentsThanks authors say to Mr. Prof. Dr. Ir
Bambang Juanda MS and Mrs. Dr. Ir Sri Mulatsih MSc Agr as a mentor who has given advice in this research. Thanks also goes to the author of the Ministry of Home Affairs, Department of Balancing General of Finance, Ministry of Finance, the Bureau of East Java who have provided information data collection for this research. Thanks also to the Education Fund Management Institution (LPDP) Ministry of Finance as the giver of scholarships to researchers until this research can be completed. This research as part of the learning process, the authors realized this research is still a lot of limitations, for it is expected to have the advice and input of various parties to be improved. Authors hope this work can be useful for the development of science and knowledge.
7. ReferencesAlkin, M.C. and Christie, C.A. (2004), “An
evaluation theory tree”, in Alkin, M.C. (Ed.), Evaluation Roots: Tracing Theorists’ Views and Influences, Sage, Thousand Oaks, CA, pp. 12‐65.
Asyraf, Wan Mohamad Bin Wan Afthanorhan. 2013. A Comparison Of Partial Least Square Structural Equation Modelling (PLS SEM) and Covariance Based Structural Equation Modelling (CB-SEM) for Confirmatory
Jurnal Ekonomi Pembangunan, ISSN 1411-6081192
Avalaible online at http://journals.ums.ac.id
Jurnal Ekonomi Pembangunan, 17 (2), December 2016, 176-192
Factor Analysis. International Journal of Engineering Science and Innovative Technology (IJESIT). Vol 2, Issue 5, September 2013.
Bagozzi, R.P., & Yi, Y. 1988. On the Evaluation of Structural Equation Models. Journal of the Academy of Marketing Science, 16 (1), 74-94.
Fornell, C., & Larcker, D.F. 1981.Evaluting Structural Equation Models With Unobservable Variables and Measurement Error. Journal of Marketing Research, 18 (1), 39-50.
Ghozali, Imam and Hengky Latan. 2015. Partial Least Squares: Concepts, Technique, and Application use SmartPLS 3.0 Program. Edition 2. Semarang: Undip.
Hair, Joe F. , Christian M. Ringle & Marko Sarstedt. 2011. PLS-SEM: Indeed a Silver Bullet, Journal of Marketing Theory and Practice, 19:2, 139-152.
Heriwibowo, Dedy, Bambang Juanda, Setia Hadi, Sapto Supono. 2016. The Measurement of Local Government Spending Quality with Indicators of Sustainable Local Development in Indonesia. Journal of Economics and Sustainable Development. Vol. 7, No. 4.
Hulland, J. 1999. Use of Partial Least Squares (PLS) in Strategic Management Research: a Review of Four Recent Studies. Strategic Management Journal, 20 (2), 195-204.
Juanda B, Halim A, Azis N, Kaiwai H, Heriwibowo D. 2013. Evaluation of Regulation Local Financial Management and It’s effect on Quality Efforts Local Expenditure. Jakarta. Ministry Financial.
Kay Wong, Ken Kwong. 2013. Partial Least Square Structural Equation Modeling (PLS-SEM) Techniques Using SmartPLS. Marketing Bulletin, 24 Technical Note 1.
Larengkum, Dirgahayu, Vecky Masinambow dan Krest Tolosang. 2014. The Influence Of The Local Government Budget To The Regional Gross Domestic Product In District Talaud Islands. Periodical Efficiency Journal. Manado: IEP – FEB Sam Ratulangi University.
Oktora, FE and Winston P. 2013. Relationship Analysis Of Revenue, General Allocation Of Funds, And Special Fund Allocation For Capital Expenditure On Local Government Tolitoli Central Sulawesi Province. Accountability Journal Vol 2 (1) Juni 2013.
Rustiadi E, Saefulhakim S, Panuju DR. 2011. Planning and Development Regional. Jakarta (ID): Crespent Press and Institutions of Pustaka Obor Indonesia.
Sholihin, M, Richard P, Musa M, Jing L. 2011. Goal-setting Participation and Goal Commitment: Examining the Mediating Roles of Procedural Fairness and Interpersonal Trust in a UK Financial Service Organisation. The British Accounting Review: Elsevier Journal 43, pp 135-146.
Susetyo, IB, Tjahjanulin D, Wima YP. 2014. Quality Budget and Regional Expenditure Provision of Public Services Acceleration in Encouraging development Backward Region (Study Case in Banten, Banten Province). Public Administration Journal (JAP), Vol. 2, No. 3, pp 511-517.
Todaro MP, Smith SC. 2006. Economic Development. Edition 09. Benardi J, Saat S, Hardani W, Editor. Jakarta (ID): Erlangga.
Vegirawati, Titin. 2012. Expenditure Direct Effect on The Allocation Quality Human Development (Study Case at Government District/City in South Sumatera). Economic and Accounting Information Journal (JENIUS). Vol 2 (1).


![Determinants of EU-28 Healthcare Expenditure · analyzing the drivers of personal health care expenditure through empirical studies [6]. The most important single determinant of cross-sectional](https://img.dokumen.tips/doc/110x75/60224e1eddf3460ce63d32bd/determinants-of-eu-28-healthcare-analyzing-the-drivers-of-personal-health-care-expenditure.jpg)