Embed Size (px)
Citation preview

sensors
Article
A Monitoring System for Laying Hens That Uses aDetection Sensor Based on Infrared Technology andImage Pattern Recognition
Mauro Zaninelli 1,*, Veronica Redaelli 2, Fabio Luzi 3, Valentino Bontempo 4, Vittorio Dell’Orto 4
and Giovanni Savoini 4
1 Department of Human Sciences and Quality of Life Promotion, Università Telematica San Raffaele Roma,Via di Val Cannuta 247, Rome 00166, Italy
2 Freelance Certified Infrared Thermal Technician, Oggiono (LC) 23848, Italy; [email protected] Department of Veterinary Medicine, Università degli Studi di Milano, Via Celoria 10, Milan 20133, Italy;
[email protected] Department of Health, Animal Science and Food Safety (VESPA), Università degli Studi di Milano, Via
Celoria 10, Milan 20133, Italy; [email protected] (V.B.); [email protected] (V.D.);[email protected] (G.S.)
* Correspondence: [email protected]; Tel.: +39-06-5225-2552
Academic Editor: A. G. Unil PereraReceived: 27 January 2017; Accepted: 20 May 2017; Published: 24 May 2017
Abstract: In Italy, organic egg production farms use free-range housing systems with a big outdoorarea and a flock of no more than 500 hens. With additional devices and/or farming procedures,the whole flock could be forced to stay in the outdoor area for a limited time of the day. As aconsequence, ozone treatments of housing areas could be performed in order to reduce the levels ofatmospheric ammonia and bacterial load without risks, due by its toxicity, both for hens and workers.However, an automatic monitoring system, and a sensor able to detect the presence of animals, wouldbe necessary. For this purpose, a first sensor was developed but some limits, related to the timenecessary to detect a hen, were observed. In this study, significant improvements, for this sensor,are proposed. They were reached by an image pattern recognition technique that was applied tothermografic images acquired from the housing system. An experimental group of seven laying henswas selected for the tests, carried out for three weeks. The first week was used to set-up the sensor.Different templates, to use for the pattern recognition, were studied and different floor temperatureshifts were investigated. At the end of these evaluations, a template of elliptical shape, and sizes of135 × 63 pixels, was chosen. Furthermore, a temperature shift of one degree was selected to calculate,for each image, a color background threshold to apply in the following field tests. Obtained resultsshowed an improvement of the sensor detection accuracy that reached values of sensitivity andspecificity of 95.1% and 98.7%. In addition, the range of time necessary to detect a hen, or classifya case, was reduced at two seconds. This result could allow the sensor to control a bigger area ofthe housing system. Thus, the resulting monitoring system could allow to perform the sanitarytreatments without risks both for animals and humans.
Keywords: infrared sensors; patterns matching; laying hens; organic egg production systems; ozone
1. Introduction
1.1. Housing System Management in Eggs Production Farms
Housing system management is a key factor for the welfare of hens and the productivity of eggproduction farms. Different indexes have to be monitored and maintained within specific ranges.
Sensors 2017, 17, 1195; doi:10.3390/s17061195 www.mdpi.com/journal/sensors

Sensors 2017, 17, 1195 2 of 17
For example, the internal temperature of housing systems should not exceed the 16–24 ◦C range [1];air humidity should be between 50% and 70% [1]; the concentration of atmospheric ammonia, causedby litter microbiological populations [2], should be limited to 20–25 ppm and not exceed this thresholdfor an interval of time of more than 8 h [3]; the concentration of carbon dioxide, caused by hens andheating systems [4], should be limited to 3000 ppm and this threshold should only be surpassed forintervals of time lower than 8 h [5]; the concentration of dust, that in different types of housing systemcan reach values of 6.5 mg/m3 and 80 mg/m3 (for respirable and inhalable dust, respectively) [6]should be limited to the lowest value that is achievable.
Through a correct ventilation, in terms of cycles and intensities, the indexes above reported canbe monitored and controlled. In fact, the temperature can be maintained within a specific range ofvalues, the air humidity can be reduced and the quality of air can be improved [7]. At the same time,the concentrations of atmospheric ammonia and bacterial population can be limited [7]. However,a decreased air humidity level could also bring about some other problems: higher concentrationsof dust could be observed and higher heating costs could be incurred during the winter periods [1].Thus, other procedures to be adopted in addition with those already used for the housing systemmanagement of egg production farms, could be useful. Ozone treatments could be one of theseadditional procedures. They could allow improving the air quality, limit odors, reduce levels ofatmospheric ammonia and bacterial load [8]. The application of these treatments has been alreadyinvestigated both for egg industry [9–11] and for egg production farms [12]. It has been proven that aconcentration of ozone of at least 1 ppm, is necessary to perform an effective bactericidal procedure but,in the same time, its toxicity has been demonstrated both for animals and humans [13,14]. Therefore,to evaluate and use these treatments in a real farming system, it is mandatory to avoid that hens andworkers be exposed to this chemical element [14].
1.2. Housing System Designs
Nowadays, in eggs production farms, hens can be housed in enriched cages or in free-rangesystems without cages. In this latter case, animals can use all the space available [15] and their welfaremay be improved. Free-range systems can also provide an outdoor area. With this additional space,a further improvement of the hens’ welfare may be achieved because a lower animal density canbe observed in the housing system during the daytime; resources may be more accessible and morechances, to carry out spatial behaviors can be provided for hens [16].
Dedicated free-range systems are generally adopted in organic egg production farms. Thesesystems have a particular design that is the result of the adoption of regulations that these farms havein common. In general, it is required to: (a) have a flock of no more than 500 hens; and (b) providean outdoor area, that can be partially covered, where plants, grasses, and abundant space per singlehen must be available. In these free-range systems it has been proven that the number of hens, thatcould be outside the housing system at any given time can be up to 30–40% of the whole flock [16].Furthermore, by using some specific devices (such as, providing feeders in the outdoor area andpop-holes that allow hens to move from the housing system to the outdoor area in only one directionfor a short time during the day) the number of hens in the outdoor area could increase and probablyincludes the whole flock.
In these kinds of housing systems, daily ozone treatments could be possible allowing one toachieve an improvement of the farm management. High concentrations of ozone (1 ppm, and above)could be used, when the hens are in the outdoor area, and a good efficiency could be reached [17].At the same time, the housing system could be opened again, to hens, only when concentrations arelow, and no longer dangerous, allowing one to ensure low risks for the animals. Of course, to reduce theworkers’ risks, the execution of these procedures should to be controlled by an automatic monitoringsystem and a sensor, able to detect the presence of animals in the housing system before the start ofozone treatments, as necessary in order to not expose the hens to this toxic agent.

Sensors 2017, 17, 1195 3 of 17
1.3. Systems for the Monitoring Laying Hens
Many systems have been developed for the monitoring of laying hens using different technologies.In studies focused on the behavior of hens, one of the most adopted is radio frequency identification(RFID) [15,18–21]. For this a transponder, is fastened on an animal’s leg or wing that is able totransmit a number when interrogated by a reader, connected to an antenna. The number transmitted isunique, therefore, each hen can be identified. More than one antenna can be used (and positioned in adifferent place of the housing system) and each transponder can be read, many times, by each antenna.The movements of each animal, inside the housing system, can be recorded linking the informationprovided by the transponder and the antenna that has made the reading. Of course, the accuracyof the resulting monitoring system depends on the number of antennas installed. These monitoringsystems have been developed, basically, to perform research activities. In production applications,they would be inadequate because: (1) all the hens of the flock need a transponder to be identified;(2) a lot of antennas would be necessary to control the whole area of the housing system; and (3) sometransponders could be lost by hens and they should be immediately substituted in order to maintainthe monitoring system operative. Therefore costs, system complexity and required managementprocedures would result to be expensive, not easy and time consuming.
For the detection of laying hen behaviors another technology that has been evaluated requires theuse of sensors that must be worn by animals [22–24]. These sensors create a wireless network with somenodes that are fixed. These nodes are radio beacons. Collecting data from these nodes, the position of ahen in the housing system can be calculated and recorded. Using this technology, the resulting monitoringsystem can overcome some of the limits reported above because less components could be necessary for thecontrolling of a big area. However, in production farms, also this technology could show some problems.In fact, the sensors worn by hens need a power supply that can limit the monitoring activity when carriedout for a long time. Furthermore, each hen has to wear its sensor in order to be detected. As a consequence,for a large flock, operative costs could also result excessive in this case.
Video surveillance is another technology that has been considered, many times, for thedevelopment of monitoring systems for poultry [1,25–31]. For example, Aydin et al. [26] testedan automatic monitoring system in order to measure the activity levels of broiler chickens withdifferent gait scores. Five chickens were placed in six cages on the basis of a gait score given by humanexperts. Images were collected by a camera, mounted perpendicular to the floor and above the centerof the cages. Images were analyzed by a dedicated software application that allowed to calculate,for each cage and over the time of observation, an activity index considering the intensity pixel changesbetween the collected frames. Dawkins et al. [27] evaluated the behavior of commercial broilers inorder to find a significant relationship between the general movements of the whole flock and thewelfare of chickens, measured in terms of rate of mortality, skin damage (hock burns) and poor gaits inwalking activity. For this purpose, web-cameras were installed in some chicken houses and analysis ofthe optical flows were performed. These analysis allowed detection of the changes of pixels’ brightnessin different parts of each frame. As a consequence, flow velocities were calculated and informationabout the behavior of animals were recorded and analyzed. Kashiha et al. [28], in a study on welfareof broilers reared in a commercial housing system, discussed a method for measuring a distributionindex using a real-time monitoring system. A set of cameras were installed to acquire images from thehouse interior and a dedicated software application was used to calculate the index during the time ofobservation. However, in all these studies, video surveillance was generally used to collect data aboutthe behavior of a group of animals. Therefore, a monitoring system based on this kind of elaborationwould not be able to reach a good accuracy in the detection of a single animal. On the contrary, usingan image pattern recognition technique applied to video surveillance, better results could be reachedin the monitoring of hens activities.
Image pattern recognition allows one to detect a model in a picture. It is generally adopted inindustrial processes to perform quality control of production cycles even though many other examplescan be found in a lot of applications of machine vision. To perform a pattern recognition, a template

Sensors 2017, 17, 1195 4 of 17
must be defined. It is a model of the physical object that has to be searched in an image. One ormore objects can be detected in the same picture even though they are rotated, partially distortedand/or they have different dimensions. The most important factors that can affect the results of apattern recognition are the template selection and the image pre-processing definition (that are alwaysapplication-dependent).
In poultry research, image pattern recognition tools have been investigated by many authors,with positive results [29–31]. For example, Nakarmi et al. [29] developed a system based on a 3Dvision camera and a grid made by twenty antennas installed in an experimental pen floor. The systemwas used to collect images and RFID data during the monitoring tests. In a following phase, off-line,image processing procedures were performed in order to identify and track animals. The systemallowed the authors to investigate the behavior of hens and to analyze the effects due by differenthousing designs and management schemas. Wang et al. [30] evaluated different software algorithmsto track a laying hen within a flock of hens. Tests were carried out in the laboratory and an initial step,necessary to identify a rectangle that included the target to track, was required. The results showedthat an algorithm, based on the Hybrid Support Vector Machine model, could be a valid tool in orderto study the behavior of hens without the need of additional sensors, such as RFID transponders.Kashiha et al. [31] investigated the performance of image analysis in the monitoring of laying hens.An experimental cage, made up by four interconnected compartments, was used for laboratory testsand controlled by four cameras (i.e., one for each compartment). Acquired images were elaborated,off-line, using a pattern recognition technique. An ellipse was used as template for the detection of ahen in a compartment of the cage. When compared with human observations, the image processingsystem showed good hen detection results and allowed to collect data about the hen’s navigationbetween the compartments of the experimental cage. However, all the studies above cited were mainlyfocused on assessing the behavior and/or the welfare of hens. They were carried out in a laboratory,using dedicated cages for the housing of hens and/or specific experimental conditions. Furthermore,the resulting monitoring systems often required significant processing, performed off-line after haveacquired some video recordings. Therefore, evaluations of a monitoring system in farm conditions(i.e., without the use of dedicated devices and/or set-ups such as cages, lights, etc.), able to performelaborations in real time (i.e., able to classify a case giving immediately a result) with a good accuracyalso for few hens can be considered as still lacking.
A partial answer to this need was given by our research group when it tested a monitoring systembased on the use of a dedicated sensor for hen detection [8]. The sensor used thermografic imagesacquired from the room interior of a housing system through a thermo-camera, mounted perpendicularto the floor. Each image was evaluated, in real-time, by a software algorithm that counted the numberof pixels with a higher temperature than a defined threshold. If the resulting value was higher thana specific reference, a hen was considered detected. This reference was proportional to the meanthermografic imprint of a hen. However, to achieve a good accuracy in the detection task, the resultingmonitoring system was set-up to evaluate ten images before classifying a case. As a consequence,the “monitoring window” (i.e., the range of time of the monitoring task) was divided into “monitoringslots” and each monitoring slot, as a result of the selected set-up, required twenty seconds to classifya case (since each thermografic image was acquired every two seconds). This result, itself, was notnegative because a sensitivity of 97.9%, and a specificity of 94.9%, were reached in the hens’ detection.Nevertheless, it could be a limit for the system use considering the field of view (FOV) shown by thesensor. This value didn’t allow one to control all the housing system area. A possible solution thisissue could be the movement of the sensor around one or two of its axes (i.e., through rotations ormovements parallel to the floor). In this way, a different area of the housing system could be controlledin a monitoring slot but to complete a full scan of the housing system, in a short time and in a reliableway, a short monitoring slot would be necessary. To reach this goal, different (and more advanced)elaborations of acquired thermografic images would be necessary.
Sensors 2017, 17, 1195 5 of 17
In this study we present a further improvement of the sensor for the monitoring of laying hens.To achieve better detection performances, advanced elaborations of acquired thermografic imageswere developed. They mainly consisted in the application of techniques of image pre-preprocessing,pattern recognition and post-processing of acquired data. The final target of the study was to reducethe time necessary to classify a case (i.e., the interval of time of a monitoring slot) in order to reacha better control of the housing system. This should allow, in a future step of our research, to studyand perform (automatically and daily) ozone treatments in a safe mode and consequently to achieve apossible reduction of levels of atmospheric ammonia and bacterial load in egg production farms, witha particular focus on those that produce organic eggs.
2. Materials and Methods
2.1. The Experimental Case
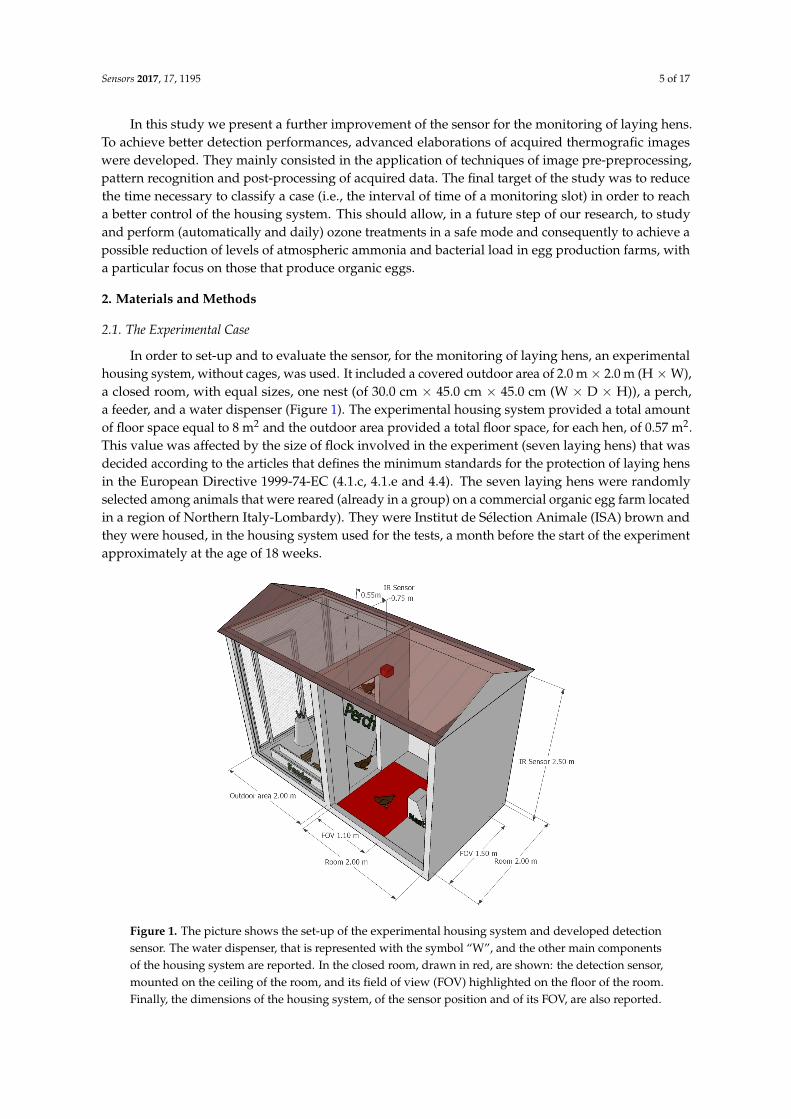
In order to set-up and to evaluate the sensor, for the monitoring of laying hens, an experimentalhousing system, without cages, was used. It included a covered outdoor area of 2.0 m× 2.0 m (H ×W),a closed room, with equal sizes, one nest (of 30.0 cm × 45.0 cm × 45.0 cm (W × D × H)), a perch,a feeder, and a water dispenser (Figure 1). The experimental housing system provided a total amountof floor space equal to 8 m2 and the outdoor area provided a total floor space, for each hen, of 0.57 m2.This value was affected by the size of flock involved in the experiment (seven laying hens) that wasdecided according to the articles that defines the minimum standards for the protection of laying hensin the European Directive 1999-74-EC (4.1.c, 4.1.e and 4.4). The seven laying hens were randomlyselected among animals that were reared (already in a group) on a commercial organic egg farm locatedin a region of Northern Italy-Lombardy). They were Institut de Sélection Animale (ISA) brown andthey were housed, in the housing system used for the tests, a month before the start of the experimentapproximately at the age of 18 weeks.
Sensors 2017, 17, 1195 5 of 17
necessary. To reach this goal, different (and more advanced) elaborations of acquired thermografic images would be necessary.
In this study we present a further improvement of the sensor for the monitoring of laying hens. To achieve better detection performances, advanced elaborations of acquired thermografic images were developed. They mainly consisted in the application of techniques of image pre-preprocessing, pattern recognition and post-processing of acquired data. The final target of the study was to reduce the time necessary to classify a case (i.e., the interval of time of a monitoring slot) in order to reach a better control of the housing system. This should allow, in a future step of our research, to study and perform (automatically and daily) ozone treatments in a safe mode and consequently to achieve a possible reduction of levels of atmospheric ammonia and bacterial load in egg production farms, with a particular focus on those that produce organic eggs.
2. Materials and Methods
2.1. The Experimental Case
In order to set-up and to evaluate the sensor, for the monitoring of laying hens, an experimental housing system, without cages, was used. It included a covered outdoor area of 2.0 m × 2.0 m (H × W), a closed room, with equal sizes, one nest (of 30.0 cm × 45.0 cm × 45.0 cm (W × D × H)), a perch, a feeder, and a water dispenser (Figure 1). The experimental housing system provided a total amount of floor space equal to 8 m2 and the outdoor area provided a total floor space, for each hen, of 0.57 m2. This value was affected by the size of flock involved in the experiment (seven laying hens) that was decided according to the articles that defines the minimum standards for the protection of laying hens in the European Directive 1999-74-EC (4.1.c, 4.1.e and 4.4). The seven laying hens were randomly selected among animals that were reared (already in a group) on a commercial organic egg farm located in a region of Northern Italy-Lombardy). They were Institut de Sélection Animale (ISA) brown and they were housed, in the housing system used for the tests, a month before the start of the experiment approximately at the age of 18 weeks.
Figure 1. The picture shows the set-up of the experimental housing system and developed detection sensor. The water dispenser, that is represented with the symbol “W”, and the other main components of the housing system are reported. In the closed room, drawn in red, are shown: the detection sensor, mounted on the ceiling of the room, and its field of view (FOV) highlighted on the floor of the room. Finally, the dimensions of the housing system, of the sensor position and of its FOV, are also reported.
Figure 1. The picture shows the set-up of the experimental housing system and developed detectionsensor. The water dispenser, that is represented with the symbol “W”, and the other main componentsof the housing system are reported. In the closed room, drawn in red, are shown: the detection sensor,mounted on the ceiling of the room, and its field of view (FOV) highlighted on the floor of the room.Finally, the dimensions of the housing system, of the sensor position and of its FOV, are also reported.

Sensors 2017, 17, 1195 6 of 17
The sensor for the monitoring of laying hens was installed in the closed room of the housingsystem, 2.5 m above the floor. The sensor was positioned immediately after the room entranceand pointed directly downwards. The scope of the sensor was to detect the presence of hens,inside the closed room, during some specific intervals of time. Its field of view (FOV) wasof circa 110.0 cm × 150.0 cm (H ×W) and lower than the inner area of the closing room. As aconsequence, a limitation of the hosing system floor space was necessary in order to allow, at thesensor, the monitoring of all the space available for hens.
2.2. The Layout of the Detection Sensor
A commercial thermografic camera (Thermo-GEAR-G120, AVIO, Nippon Avionics Co., Ltd.,Tokyo, Japan) was the main component of the detection sensor under study. It was an uncooled(microbolometer) focal plane array detector that had a resolution in pixels of 320 × 240. It had anaccuracy of ±2 ◦C; a sensitivity of 0.04 ◦C (at 30 ◦C) and sizes of 21.20 cm × 7.50 cm × 13.80 cm(H ×W × D). As many other commercial thermo-cameras, it had an analog video output in order tobe easily connected to an external monitor.
An acquisition board, for the analog/digital video conversion (ROXIO, Santa Clara, CA, USA),was also a part of the detection sensor. It received, through the analog video output of thethermo-camera, the grey-scale thermografic images acquired and it provided them, in a digital format,to a system for the monitoring of laying hens to which the sensor was linked (as it is shown in Figure 2).
ANALOG/DIGITAL VIDEO AQUISITION
BOARD
WEB-CAM
SOFTWARE
APPLICATION
MONITORING
SYSTEM
INFRARED
SENSOR
DETECTION SENSOR
Figure 2. Components and connections of the experimental monitoring system. In the figure, it is alsoreported a commercial web-cam. This component was added to the monitoring system in order tocollect, during the experiments, images of hens reared in the housing system. These images were usedto evaluate the performance achieved by the detection sensor under study.
2.3. The Layout and the Tasks of the Experimental Monitoring System
For the set-up of the detection sensor and to quantify its accuracy, a monitoring system wasdeveloped. It was principally composed by a software application, developed using: NI LabVIEW®
8.5 (National Instruments, Austin, TX, USA), NI Vision Acquisition Software® 2009, and NI VisionDevelopment Module® 2009. Figure 3 shows a flow diagram that describes the tasks performed by thesoftware application.
As reported in the flow diagram of Figure 3, when the “monitoring window” is active [32],a new “monitoring slot” starts and a new “monitoring record” is created [33]. In the steps that follow,the algorithm controls if at least one hen is detected. This control is done within a monitoring slot.When the monitoring slot is ended (i.e., after two seconds) the active monitoring record is closedand it is stored using an external memory. This storing is done by a text log-file that also includes:the time stamp of the slot start; the time stamp of the slot end; and some other data about the set-upof the detection sensor. When this step is concluded, a new “monitoring slot” is started and a new“monitoring record” is created. This tasks continue, with the same sequence, until the “monitoringwindow” is finished (i.e., when the monitoring system is switched-off).

Sensors 2017, 17, 1195 7 of 17
“END” OF MONITORING WINDOW
Set to 1 the field “Hens
detected” in the active
“monitoring record”
Count the number of
“Colored Pixels” (CP)
Is there a
positive
matching?
Set to 1 the flag
“Hens detected”
Set to 0 the flag
“Hens detected”
“START” OF DETECTION SUBROUTINE
Yes No
Perform a Pattern
Recognition
Is the value
CP > than the
CP
threshold?
template
matching?
Set to 1 the flag
“Hens detected”
Yes No
Initialize a new
“monitoring record“
Is the flag
“Hens
detected” set to
1?
Set to 0 the field “Hens
detected” in the active
“monitoring record”
Is the active
“monitoring
slot” ended?
Is the
“monitoring
window” ended?
Store the
“monitoring record”
Acquire a new image from
the thermo-camera
Yes No
Yes
Yes
No
No
Start a new “monitoring slot”
“START” OF MONITORING WINDOW
“END” OF DETECTION SUBROUTINE
Figure 3. Flow diagram of the software application of the monitoring system.
In order to detect a hen, the software application used a specific subroutine. This subroutine performedsome elaborations on each grey-scale image acquired by the thermo-camera (Figure 4). In details:
- it built an histogram with the frequency distribution of pixel intensities;- since the histogram generally has a normal distribution, where the mean value corresponds to the
background intensity, and considering that in a thermografic image to each intensity correspondsa specific measured temperature, it calculated the mean floor temperature of the closed room;
- it applied a defined shift to the mean floor temperature calculated and it converted the resultingvalue in a grey-scale color value (i.e., the “Background Color Threshold” or BCT);
- it applied the BCT to each grey-scale colored pixel in order to build a binary image (where a coloris given to all pixels that overcame the threshold);
- it applied an image filter to reduce the number of small “particles”;- on the resulting image, it calculated the total amount of “Colored Pixels” (CP);- on the resulting image, it performed a pattern recognition using a defined “hen template”;

Sensors 2017, 17, 1195 8 of 17
- in case of positive result, it set-up to 1 the flag “Hens Detected” (HD);- in case of negative result, it compared the CP value with a “Colored Pixels Threshold” (CPT),
that is proportional at the “visible” area of one hen (i.e., the case most restrictive);- when the value CP overcame the value CPT, it set-up to 1 the flag HD;- in the remaining cases, it set-up the flag HD to 0.
IT ACQUIRES AN
INPUT IMAGE
IT APPLIES A RELATIVE SHIFT TO THE
MEAN FLOOR TEMPERATURE AND IT
CALCULATES AND USES THE COLOR
BACKGROUND THRESHOLD.
IT PERFORMS A PATTERN
RECOGNITION.
THERMOGRAFIC IMAGE.
PIXEL HISTOGRAM
BINARY IMAGE
HEN TEMPLATE
HEN DETECTED
HEN NOT DETECTED
IT COMPARES THE NUMBER OF
COLORED PIXELS WITH A
COLORED PIXELS
THRESHOLD.
IT CALCULATES THE
TOTAL NUMBER OF
COLORED PIXELS
COLORED PIXELS
NUMBER (CP)
TEMPERATURE
SHIFT
COLORED PIXELS
THRESHOLD (CPT)
HEN DETECTED
HEN NOT DETECTED
IT APPLIES A FILTER TO
REDUCE SMALL PARTICLES
FILTERED IMAGE
START
IT BUILDS A PIXEL FREQUENCY
DISTRIBUTION HISTOGRAM AND IT
IDENTIFIES THE MEAN FLOOR
TEMPERATURE THROUGH THE
MAXIMUM PEAK OF THE HISTOGRAM
POSITIVE MATCHING
NEGATIVE MATCHING
POSITIVE COMPARISON
NEGATIVE COMPARISON
Figure 4. Flow diagram of the elaborations performed by the detection subroutine. The proceduresof image pre-processing, pattern recognition and post-processing of acquired data are explained indetail. Each blue rectangle describes an elaboration performed by the subroutine which is linked to thefollowing step of elaboration through a blue arrow. For some specific elaborations, with a grey arrow ishighlighted an input while with a red arrow is shown an output.

Sensors 2017, 17, 1195 9 of 17
For the detection of a hen in a thermografic image, a pattern recognition procedure was performedby the software application subroutine. This procedure evaluated the Normalized Cross-correlationbetween the image acquired and the “hen template” previously set-up [34–36]. The NormalizedCross-correlation is a specific case of correlation that can be defined according to the followingEquation (1):
C(i, j) =V−1
∑x=0
U−1
∑y=0
t(x, y)p(x + i, y + j) (1)
where p(x, y) is the image evaluated of sizes W × Z; t(x, y) is a template of sizes U × V with U ≤Wand V ≤ Z; i = 0, 1 . . . W − 1; j = 0, 1, . . . Z − 1; and the summation is calculated considering theoverlapping between the image p and the template t. In other words, the correlation procedure requiresto move the template t within the image p and it calculates the value C(i, j) considering the regionwhere the template t overlaps the image p. As a consequence, each pixel of the template t is multipliedfor the corresponding pixel of the picture p, that it overlaps. Each result is summed over the all pixelsof template t. The point where the function C(i, j) is maximum, is the place of the image evaluatedwhere the template t is found.
However, the correlation procedure can be sensitive to pixel intensity changes of the imagesevaluated. To overcome this sensitivity, a normalized cross-correlation can be used, as it was done inthis study, according to the following Equation (2):
R(i, j) =∑V−1
x=0 ∑U−1y=0
[t(x, y)− t
][p(x + i, y + j)− p(i, j)]{
∑V−1x=0 ∑U−1
y=0[t(x, y)− t
]2} 12{
∑V−1x=0 ∑U−1
y=0 [p(x + i, y + j)− p(i, j)]2} 1
2(2)
where: t (that is calculated only one time) is the mean value of the pixel intensities of the template t;and p is the mean value of the pixel intensities of a region determined by the position of the template t.The resulting value (R) is always in a range from −1 to 1 and is not affected by any changes of the pixelintensities of both images (p and t). In addition, in case the object to detect has a different orientationrespect the template t, the image template can be rotated and a new procedure can be carried out.
The monitoring system developed also collected images, in the visible spectrum, from the roominterior. These images were used to check the detection results of the sensor under study and to evaluateits accuracy. Even though the thermo-camera adopted in the tests allowed to collect conventionalpictures, a commercial web-cam was adopted to acquire these images (HAMA AC 150, Hama Gmbh &Co., Monheim, Germany). This technical solution was chosen in order to allow, in future experiments,the use of commercial thermo-cameras specifically developed for industrial applications that generallydon’t have this feature. They are ideal for applications of monitoring because they are robust, cheaperand allow the image transferring on standard networks and interfaces (such as GigE Vision) by low-coststandard cables.
The web cam was installed close to the thermo-camera in order to have a similar FOV of thedetection sensor. It worked with a sampling interval of one image for each cycle of the monitoringsystem (i.e., every two seconds). All collected images were saved as single snapshots using the“.bmp” extension and a pixel resolution of 320 × 240. The same images were also used to build videorecordings of the housing system. These video recordings had: one frame per second as a picturesampling rate; an “.avi” extension; and were highly compressed using the filter “Microsoft Video 1”.Snapshots and video recordings were collected every day (from the start to the end of the “monitoringwindow”). To each image and video recording, dates and time stamps were added and used to nameeach file [37] that was stored in an external memory.
2.4. Procedures for Data Collection and Processing
Experimental tests were carried out for three weeks (from 7 November to 25 November). In thefirst five days the sensor was set-up while in the other days, its accuracy was measured.

Sensors 2017, 17, 1195 10 of 17
When the sensor was set-up, a researcher performed a specific procedure that was repeated everyday (i.e., five times in total). The procedure required to: (a) force to get out possible hens that were inthe room; (b) randomly select one hen from the flock and move it inside the room; (c) close the roomand (d) start the monitoring window (at 11.00 a.m.) in order to acquire experimental data for 15 min.After this interval of time, the hen in the room was forced to go out and for another 15 min a newmonitoring window was started. After this further interval of time, the monitoring system was stoppedand each limitation inside the room was removed. This procedure was adopted in order to have, in awell-controlled scenario (such as one hen or no hens in the closed room) enough data for the set-up ofthe detection sensor and it was repeated, for some days, in order to acquire enough data from differentanimals. In future experiments (or field applications), carried out with the same hardware componentsand the same experimental set-up, this procedure could be not performed as it was done in the otherdays of this experiment when a researcher only switched-on the monitoring system (between 11.00 a.m.and 11.30 a.m.) without perform any action on hens that were in the closed room.
Using a version of the software application able to work off-line, on “.bmp” files, the data storedin the first days of the experiment were analyzed. A sub-set of thermografic images (1472), withinthose stored (4416), were evaluated in two phases. In the first one, three different shifts, of the meanfloor temperature, were investigated (i.e., the BCT that corresponded to a relative increment of 1, 2and 3 ◦C) and the geometric features, of the templates to use in the following pattern recognitions,were identified. These temperature shifts were chosen considering our previous experiences [8]and what scientific papers suggest [38–41] as body temperature ranges that should result from athermografic image of a hen. Considering each temperature shift, all “particles” that were in an imagewere identified and measured. For each particle, an equivalent ellipse, and rectangle, were identifiedand their minor and major axes, and long and short side, were calculated. However, in each shiftof the mean floor temperature, not all data were considered. Since with a shift of 1 ◦C almost thewhole hen can be “seen” in a thermografic image, while with the other shifts (2 or 3 ◦C) only the headof a hen can be well identified, in the case of a shift of one degree, only the data about equivalentellipses were studied while in the other cases, only the data about equivalent rectangles were evaluated.As a consequence, a template of elliptical shape, and sizes of the resulting mean values, was identifiedfor the temperature shift of 1 ◦C while for the other shifts, two different templates were selected.They had a triangular shape and sizes, in terms of bases and heights, equal to the mean values ofthe long and short sides of the equivalent rectangles calculated. In a following phase of the analysis,the same sub-set, of thermografic images, was elaborated. For each shift of the mean floor temperatureinvestigated, a specific template was used for the pattern recognitions. The results obtained wereanalyzed considering the experimental set-up and video recordings acquired from the room interior.From these analysis, the results were classified as: true positive (TP), when one hen that was in the roomwas correctly detected; false positive (FP), when one hen was detected but no hens were in the room;true negative (TN), when it was correctly detected that no hens were in the room; and false negative(FN), when the sensor did not detected a hen that was in the room. When all these classificationswere concluded, all the resulting data were organized in terms of: sensitivity, specificity, error rate,and accuracy according with the following Equations (3)–(6):
Sensitivity[%] =TP
FN + TP(3)
Specificity[%] =TN
FP + TN(4)
Error Rate[%] =FP
FP + TP(5)
Accuracy[%] =TP + TN
TP + TN + FP + FN(6)

Sensors 2017, 17, 1195 11 of 17
The resulting values, that were obtained, were considered as the detection performance achievedby the sensor and the set-up, that allowed to reach the best performance, was used in the following tests.
During field tests, no specific procedures were performed by a researcher on the experimentalhousing system and/or on the hens of the experimental group. Every day, the monitoring systemwas switched-on at 11.00 a.m. At the same hour, a “monitoring window” started and collected for30 min the experimental data. When the “monitoring window” was ended, a researcher switched-offthe monitoring system and started to evaluate data acquired. He/she compared the log-file stored bythe system and the video recording acquired from the closed room. On the basis of these comparisons,obtained results were classified in terms of: TP, FP, TN and FN; and subsequently in terms of sensitivityand specificity. In this way, the performance achieved by the detection sensor, under real workingconditions, was calculated. During all the testing phases, a researcher checked daily the lenses of thethermo-camera and web-cam. When necessary, they were cleaned in order to ensure that high qualityimages were acquired.
3. Results
During the experiments, room temperature ranged between 5 to 13 ◦C showing an average valueof 8 ◦C. In a first phase of elaborations, carried out on thermografic images acquired during the sensorset-up, three different shifts of the mean floor temperature (i.e., three BCT) were investigated and thegeometric features of the templates, to be used in the following pattern recognitions, were identified.For each temperature shift, a different template shape was studied. In details, for the shift of onedegree, an ellipse was selected while for the shifts of two or three degrees, a triangle was considered.The results that were obtained are reported in Table 1, in addition to their confidence intervals andsignificance of the means. These last values were calculated performing a t-Test of Student on collecteddata (procedure t-test, package stats, tool for statistical analysis: R—ver. 3.3.0 [42]).
Table 1. Templates shapes and geometric features for each floor temperature shift investigated (i.e.,1, 2 and 3 ◦C). Values of the means, of the standard error (S.E.), of the confidence intervals and ofsignificance of the means, obtained performing a Student’s t-Test procedure, are reported.
Floor TemperatureShift (∆t-◦C)
Shape of theTemplate
GeometricFuture
Mean and S.E.Values (Pixels)
Confidence Intervalsat 95% (Pixels) Significance
1 ellipse major axis 134.8 ± 1.3 132.2–137.4 p < 0.011 ellipse minor axis 62.6 ± 0.6 61.8–63.8 p < 0.012 triangle base 34.9 ± 1.5 31.8–38.0 p < 0.012 triangle height 16.4 ± 0.6 15.3–17.6 p < 0.013 triangle base 17.7 ± 0.3 17.1–18.2 p < 0.013 triangle height 11.2 ± 0.2 10.9–11.5 p < 0.01
In a following phase of elaborations, always performed on data acquired during the sensor set-up,sensitivity, specificity, error rate and accuracy, of the detection sensor, were calculated. For each floortemperature shift, a specific template was used in accordance with the results reported in Table 1.Obtained results of this phase of elaborations are shown in Table 2.
Table 2. Values of sensitivity, specificity, error rate and accuracy that the developed detection sensorshowed, during the set-up procedure, for each temperature shift investigated (i.e., 1, 2 and 3 ◦C).Furthermore, the geometric features of the templates used for the pattern recognitions are also reported.
Floor TemperatureShift (∆t-◦C) Sensitivity (%) Specificity (%) Error Rate (%) Accuracy (%)
Shape and GeometricFeatures of the
Template (Pixels)
1 80.4 92.5 8.5 86.4 ellipse (135 × 63)2 43.3 89.0 20.1 66.0 triangle (35 × 16)3 53.9 95.0 8.5 74.4 triangle (18 × 12)

Sensors 2017, 17, 1195 12 of 17
As reported in the table, the floor temperature shift that allowed the best performance, in terms oferror rate and accuracy, was a shift of one degree. Therefore, in the experimental days that followed,the parameters that were used for the set-up of the sensor were: (a) a CBT that corresponded to afloor temperature shift of 1 ◦C; (b) a template that had an elliptical shape and dimensions of 135 × 63pixels to perform the pattern recognitions; and (c) a CPT equal to 1736 pixels as required by thealgorithm of the software application. This last value was defined considering the results of ourprevious experiments [8].
In the final phase of the experiment, the accuracy of the detection sensor was evaluated throughthe sensitivity and specificity reached by the monitoring system under test. The log-files providedby the system, and the video recordings collected during the experiments from the room interior,were compared. Furthermore, a dedicated CPT was used to further investigate the cases that resultednegative in the pattern recognitions (Figure 5). The results that were obtained in these last evaluationsare shown in the Table 3.
Table 3. Accuracy showed by the detection sensor under test in field experimental conditions.
Positive Negative Total
True 9108 4283 13391False 222 118 340Total 9330 4401 13731
As reported in the table only in 118 cases (i.e., the 0.86% of the total number of cases evaluated)a hen that was in the room was not detected by the system during an active “monitoring slot” andthe final accuracy, reached in a real working condition, was a sensitivity of 98.7% and a specificity of95.1%. Examples of elaborations and classifications performed by the sensor are provided in Figure 5.
Sensors 2017, 17, 1195 12 of 17
As reported in the table, the floor temperature shift that allowed the best performance, in terms of error rate and accuracy, was a shift of one degree. Therefore, in the experimental days that followed, the parameters that were used for the set-up of the sensor were: (a) a CBT that corresponded to a floor temperature shift of 1 °C; (b) a template that had an elliptical shape and dimensions of 135 × 63 pixels to perform the pattern recognitions; and (c) a CPT equal to 1736 pixels as required by the algorithm of the software application. This last value was defined considering the results of our previous experiments [8].
In the final phase of the experiment, the accuracy of the detection sensor was evaluated through the sensitivity and specificity reached by the monitoring system under test. The log-files provided by the system, and the video recordings collected during the experiments from the room interior, were compared. Furthermore, a dedicated CPT was used to further investigate the cases that resulted negative in the pattern recognitions (Figure 5). The results that were obtained in these last evaluations are shown in the Table 3.
Table 3. Accuracy showed by the detection sensor under test in field experimental conditions.
Positive Negative TotalTrue 9108 4283 13391 False 222 118 340 Total 9330 4401 13731
As reported in the table only in 118 cases (i.e., the 0.86% of the total number of cases evaluated) a hen that was in the room was not detected by the system during an active “monitoring slot” and the final accuracy, reached in a real working condition, was a sensitivity of 98.7% and a specificity of 95.1%. Examples of elaborations and classifications performed by the sensor are provided in Figure 5.
Figure 5. Pictures (A–C) are thermografic images of a hen acquired by the detection sensor during field tests. Pictures (D–F) are the results of the elaborations performed by the sensor considering as input the pictures (A–C). Picture (F) is an example of positive pattern recognition while pictures (D,E) are examples of negative pattern recognitions. Nevertheless, in picture (E), the software application counted 2089 colored pixels while in picture (D), the total amount of colored pixels was 1525. Therefore, at the end of the elaborations performed by the software application, the case of picture (E) was classified as positive while the case of picture (D) was confirmed as negative. Thus, in picture (D) is shown a false negative case while in pictures (E,F) are reported two examples of cases correctly classified as positive by the detection sensor developed.
4. Discussion
The present study had, as its aim, the improvement of a sensor for the detection of a hen in a closed room of a housing system of an organic egg production farm. Furthermore, a reduction of the
Figure 5. Pictures (A–C) are thermografic images of a hen acquired by the detection sensor duringfield tests. Pictures (D–F) are the results of the elaborations performed by the sensor considering asinput the pictures (A–C). Picture (F) is an example of positive pattern recognition while pictures (D,E)are examples of negative pattern recognitions. Nevertheless, in picture (E), the software applicationcounted 2089 colored pixels while in picture (D), the total amount of colored pixels was 1525. Therefore,at the end of the elaborations performed by the software application, the case of picture (E) wasclassified as positive while the case of picture (D) was confirmed as negative. Thus, in picture (D)is shown a false negative case while in pictures (E,F) are reported two examples of cases correctlyclassified as positive by the detection sensor developed.

Sensors 2017, 17, 1195 13 of 17
4. Discussion
The present study had, as its aim, the improvement of a sensor for the detection of a hen in aclosed room of a housing system of an organic egg production farm. Furthermore, a reduction of thetime necessary to perform the detection task, using infrared technology and an advanced processingof acquired data, was its specific aim. The performance recorded in the present field tests showed animprovement when compared with the values of sensitivity and specificity achieved in a first iterationof the sensor (98.7% and 95.1% vs. 97.9% and 94.9%-[8]). Furthermore, the monitoring slot was reducedfrom 20 s to only 2 s. This value could allow one to scan the whole housing system area, throughrotations or movements of the sensor parallel to the floor, in a short time. In this way, possible limits ofthe sensor’ FOV should be overcome. However, this interval of time could be further reduced. In fact,the main result obtained in this study was to perform a detection task using only one thermograficimage. This means that the working rate of the sensor could be increased up to the computationalpower of the hardware used to build the monitoring system. As a consequence, the monitoring slotcould be further reduced to a value less than 2 s, allowing also a better managements of difficult casesdue to a rapid movement of a hen inside the room of the housing system. Thus, on the basis of theseresults, the specific aim of the study should be considered as reached considering the use of a patternrecognition technique as the main part of the elaborations performed on thermografic frames collected.
Nevertheless, some false negative cases were found during this experiment. These cases wererelated to some unfavorable events that can happen during a monitoring slot, that were: (a) a henwas in a part of the room not well controlled by the sensor, such as the nest; and (b) the imageprocessing performed was not corrected for the hen detection. For the first type of events, some possibleimprovements could be identified. The sensor’s FOV was principally affected by the dimensions ofthe room used for the experiments. In a bigger room, this value could be increased. The sensor couldbe mounted at a greater height and a thermo-camera, with a higher resolution and lens with a loweroptical length, could be adopted. This set-up should increase the FOV of the sensor without losing thepositive results achieved in these tests. In addition, other simple sensors could be coupled with thedetection sensor in order to improve the monitoring system used in these tests. For example, a coupleof photocells, mounted in the nests, could be adopted to detect a hen that is laying an egg. With theseadditional sensors, the monitoring system would be able to control all the areas generally includedin a housing system of a commercial organic egg production farm. As a consequence, all the spaceavailable for animals could be better controlled.
The second type of events, that affected the accuracy of the detection sensor, were related to thetransformations performed on thermografic images. These elaborations were mainly: a procedure ofimage pre-processing, a pattern recognition, and a post-processing of acquired data. For the patternrecognition, the selection of a template, in term of shape and sizes, is a key factor to reach good results.In this study, different shapes and sizes were studied considering the geometric features of the parts, ofa hen, that were “visible” in the thermografic images evaluated. Obtained results showed as the besttemplate to use, an ellipse with sizes of 135 × 63 pixels. However, some false negative cases were found.They were mainly due by the performing of the pattern recognition on animals, freely to move, and noton solid objects which shape is always well defined. A possible way to overcome this issue could be toallow a “scale” compensation. With this set-up, a greater number of particles could be identified by thetemplate matching. Nevertheless, in the same time, an increased number of false positive cases could befound because not all particles, of a thermografic image, could be related to a hen or a part of its body(as required when a template that does not include the whole hen, it is used). Therefore, for this kindof applications, a different strategy has to be found and the merging of different types of elaborationsmight be a way to reach a better detection accuracy without increasing too much the execution timerequired. For this reason, in this study, image pre-processing and a post-processing of acquired dataprocedures were performed. The image pre-processing procedure, carried out on acquired grey-scaleimages, included: (a) calculation of a histogram with the frequency distribution of pixel intensities;(b) the use of a relative shift of the mean floor temperature; and (c) the adoption of an image filter.

Sensors 2017, 17, 1195 14 of 17
All these steps improved the effectiveness of pattern recognitions and the accuracy of the detectionsensor. In fact, the histogram permitted us to compensate the automatic calibrations performed by thethermo-camera and the intrinsic error of the thermografic sensor in the measurement of an absolutetemperature (i.e., ±2 ◦C or 2% of the measured value). The relative shift, of the mean floor temperature,allowed us to build binary images using a specific CBT for each thermografic image. The image filterallowed us to reduce the number of small particles that were not related to a hen or a part of its body.These possible visual artifacts can happen for different reasons. For example: (a) if a hen remains in thesame place for few minutes, its feet can leave a thermal imprint on the floor that can become visible inthe following images; (b) if an egg is laid outside the nest, having the same body temperature of the hen,it can be visible in many subsequent images (on the basis of the atmospheric temperature and of therelative shift that has been used); and (c) a specific point of the floor can has an higher temperature thanthe mean floor value and thus it may result in the image being evaluated. The results of the performedprocedures were to obtain a more accurate set of binary images and less variability in the number ofcolored pixels. As a consequence, better shapes were available for the pattern recognitions and moreaccurate calculations, of the colored pixels of each image, were possible. This last result improved theperformance of the post-processing phase that was carried out in order to reduce the number of falsenegative case and, therefore, improve the accuracy of the detection sensor developed.
More in general, the obtained results showed that image analysis and pattern recognition was auseful technical solution that allowed us to detect a hen, in a small monitoring slot, with performancesin line with the results obtained in other studies. For example, Kashiha et al. [43] evaluated a methodbased on the use of pattern recognition to automatically identify marked pigs, in an experimentalpen, in order to perform behavioral researches. For each of the four pens, where a group of ten pigswere reared, one camera was mounted. Video recordings were acquired during the tests and patternrecognition techniques were used to localize the pigs. Also individual identification of pigs wasperformed through a set of basic patterns that were painted on their backs. The tests showed that in88.7% of the cases, a pig was automatically identified while in only 1% of the cases, a misidentificationoccurred (i.e., it was a false negative case). Poursaberi et al. [44] studied an algorithm to score differentbehaviors of turkeys confined in some cages. The aim of the research was to automatically collect dataabout the welfare of animals, especially during their transportation. One camera was mounted on eachcage. Acquired images were evaluated by an image pre-processing procedure and a pattern recognitionmethod. Having as reference the manual ability to classify the behavior performed the results of thestudy showed that the software application was able to correctly classify: 71% of standing, 83% of lying,94% of wing flapping, and 100% of turning. Kashiha et al. [31] developed a monitoring system to detecthens’ movements within four compartments of an experimental cage. One camera was mounted oneach compartment and acquired images were considered by a pattern recognition technique. Obtainedresults showed that compartment occupancies were correctly detected in 95.9% ± 2.6% of the casesand in only 4.2% ± 3.0% of the cases, a false occupation was recorded. More in general, the systemproved that image analysis could be an alternative to manual video analysis when it is compared withthe human ability to classify a case in the performing of monitoring activities.
Our results also confirmed that infrared technology is a valid way for the detection of hens insidea closed room. The good quality of acquired images was always guaranteed, even though no specificcontrols were applied to the light conditions inside the room. This feature pose, the developed sensorand the resulting monitoring system, as a device easily useable in a real commercial farm where aninfrared sensor could bring, also, some other benefits. In fact, it has been proven by some authors thatthermografic analysis could improve hens’ welfare [19,20,22]. Yahav et al. [38], for example, showedthat systems for the climate control, performances of flocks, and welfare of animals, could be improvedevaluating the physiological status of chickens through a thermografic camera that estimates the heatlost through radiation and convection. Baracho et al. [39], in a study aimed to identifying possiblethermal distress of broilers reared in a commercial farm, used infrared technology in order to measurethe broiler surface temperature as a result of the week of rearing and sector where the animals were

Sensors 2017, 17, 1195 15 of 17
housed. Ferreiera et al. [40], investigating broilers’ feeding, proved that a thermo-camera could be usedto measure the variations of the surface temperature of broilers and to improve the productivity of thefarm by the correct selection of feed energy levels. However, despite these positive results, the use ofthermo-cameras in commercial farms remains scarce presumably for the high costs of this device [1].Thus, a monitoring system based on infrared sensors could be an opportunity to bring in commercialfarms the results already reached in the research that applied this technology. Monitoring systemsable to analyze, and improve, the hens’ welfare could be developed. As a consequence, positive, andpractical, improvements could be reached because the farm management, and the eggs production,should result to be increased.
In this study, different floor temperature shifts were investigated during the set-up of the detectionsensor. The shift of one degree showed to be the better set-up in order to achieve the best accuracy. Thisresult was different from the result that we found in another study carried out during the summer time(i.e., a temperature shift of 3 ◦C [8]). Although the current elaborations, performed on thermograficimages, were different from those curried out in the other study, we think that the present resultconfirms that the mean atmospheric temperature can affect the selection of the floor temperature shiftto be applied. Thus, different temperature shifts should be identified, at least one for each season of theyear, in order to achieve the best monitoring accuracy. Further experiments will be useful to validatethis hypothesis and to build a formula in order to calculate, for each atmospheric temperature and/orseason of the year, the right temperature shift to use.
5. Conclusions
The obtained results proved that infrared technology, and an advanced elaboration of acquiredimages, could allow to detect a hen in a closed room of an housing system of a commercial farmthat produces organic eggs. Through techniques of image pre-preprocessing, pattern recognition andpost-processing of acquired data, the monitoring slot, necessary to perform the detection task, couldbe reduced to 2 s. This should allow one to build a monitoring system able to control a bigger areaof the closed room of the housing system. As a consequence, ozone treatments, that could reducebacterial load and atmospheric ammonia levels, could be performed without risk for the reared hensor for workers.
Acknowledgments: Authors want to thanks Enrico Rossetti (the owner of the farm) and Andrea Fumagalli(the farmer) for all of their help and support provided in the development of this study.
Author Contributions: The main contributions of each author of the manuscript were as follows:Mauro Zaninelli—hardware and software development, design and set-up of field experiment, collection, analysisand evaluation of data; Veronica Redaelli and Fabio Luzi—set-up of thermografic camera, field experiment andevaluation of data; Valentino Bontempo and Vittorio Dell’Orto—design of field experiment, selection/managementof the experimental group of animals; Giovanni Savoini—supervision of the whole study. All authors discussedthe results and implications, and everyone provided helpful feedback. The manuscript was written by MauroZaninelli and revised by all co-authors.
Conflicts of Interest: The authors declare no conflict of interest.
References
1. Corkery, G.; Ward, S.; Kenny, C.; Hemmingway, P. Incorporating smart sensing technologies into the poultryindustry. J. World’s Poult. Res. 2013, 3, 106–128.
2. Fairchild, B.D. Environmental Factors to Control When Brooding Chicks. 2009. Available online: http://extension.uga.edu/publications/detail.cfm?number=B1287 (accessed on 27 September 2016).
3. Miles, D.M.; Branton, S.L.; Lott, B.D. Atmospheric ammonia is detrimental to the performance of moderncommercial broilers. Poult. Sci. 2004, 83, 1650–1654. [CrossRef] [PubMed]
4. McGovern, R.H.; Feddes, J.J.R.; Zuidhof, M.J.; Hanson, J.A.; Robinson, F.E. Growth performance,heart characteristics and the incidence of ascites in broilers in response to carbon dioxide and oxygenconcentrations. Can. Biosyst. Eng. 2001, 43, 41–46.
5. Poultry Standards Producer Requirements-Revision 01; Bord Bia: Dublin, Ireland, 2008.

Sensors 2017, 17, 1195 16 of 17
6. Ellen, H.H.; Bottcher, R.W.; von Wachenfelt, E.; Takai, H. Dust levels and control methods in poultry houses.J. Agric. Saf. Health 2000, 6, 275–282. [CrossRef] [PubMed]
7. Chai, L.; Ni, J.-Q.; Diehl, C.A.; Kilic, I.; Heber, A.J.; Chen, Y.; Cortus, E.L.; Bogan, B.W.; Lim, T.T.;Ramirez-Dorronsoro, J.-C.; et al. Ventilation rates in large commercial layer hen houses with two-yearcontinuous monitoring. Br. Poult. Sci. 2012, 53, 19–31. [CrossRef] [PubMed]
8. Zaninelli, M.; Redaelli, V.; Tirloni, E.; Bernardi, C.; Dell’Orto, V.; Savoini, G. First results of a detection sensorfor the monitoring of laying hens reared in a commercial organic egg production farm based on the use ofinfrared technology. Sensors 2016, 16, 1757. [CrossRef] [PubMed]
9. Bailey, J.S.; Buhr, R.J.; Cox, N.A.; Berrang, M.E. Effect of hatching cabinet sanitation treatments on salmonellacross-contamination and hatchability of broiler eggs. Poult. Sci. 1996, 75, 191–196. [CrossRef] [PubMed]
10. Perry, J.J.; Rodriguez-Romo, L.A.; Yousef, A.E. Inactivation of Salmonella enterica serovar enteritidis inshell eggs by sequential application of heat and ozone. Lett. Appl. Microbiol. 2008, 46, 620–625. [CrossRef][PubMed]
11. Davies, R.H.; Breslin, M. Investigations into possible alternative decontamination methods for Salmonellaenteritidis on the surface of table eggs. J. Vet. Med. Ser. B 2003, 50, 38–41. [CrossRef]
12. Schwean-Lardner, K.; Dahiya, J.P.; Olkowski, A.A.; Barber, E.M.; Riddell, C.; Classen, H.L. Effect of addingozone into an intensive broiler production unit on performance, mortality, ammonia levels, and bacteriallevels as compared with a non-ozone-treated broiler unit. J. Appl. Poult. Res. 2009, 18, 649–657. [CrossRef]
13. Christian, D.L.; Chen, L.L.; Scannell, C.H.; Ferrando, R.E.; Welch, B.S.; Balmes, J.R. Ozone-inducedInflammation Is Attenuated with Multiday Exposure. Am. J. Respir. Crit. Care Med. 1998, 158, 532–537.[CrossRef] [PubMed]
14. Gong, H.; Wong, R.; Sarma, R.J.; Linn, W.S.; Sullivan, E.D.; Shamoo, D.A.; Anderson, K.R.; Prasad, S.B.Cardiovascular effects of ozone exposure in human volunteers. Am. J. Respir. Crit. Care Med. 1998, 158,538–546. [CrossRef] [PubMed]
15. Zaninelli, M.; Rossi, L.; Costa, A.; Tangorra, F.M.; Guarino, M.; Savoini, G. Performance of injected RFIDtransponders to collect data about laying performance and behaviour of hens. Large Anim. Rev. 2016, 22,77–82.
16. Hegelund, L.; Sørensen, J.T.; Kjaer, J.B.; Kristensen, I.S. Use of the range area in organic egg productionsystems: effect of climatic factors, flock size, age and artificial cover. Br. Poult. Sci. 2005, 46, 1–8. [CrossRef][PubMed]
17. Dyas, A.; Boughton, B.J.; Das, B.C. Ozone killing action against bacterial and fungal species; microbiologicaltesting of a domestic ozone generator. J. Clin. Pathol. 1983, 36, 1102–1104. [CrossRef] [PubMed]
18. Fröhlich, G.; Böck, S.; Thurner, S.; Weinfurtner, R.; Wend, G. Elektronisches Identifik Ationssystemzur Erfassung des Verhaltens von Legehennen. Available online: https://www.semanticscholar.org/paper/Elektronisches-Identifikationssystem-zur-Erfassung-Fr%C3%B6hlich-B%C3%B6ck/69eef94cf39869949a71434da25205d618d26f13 (accessed on 20 May 2017).
19. Icken, W.; Thurner, S.; Heinrich, A.; Kaiser, A.; Cavero, D.; Wendl, G.; Fries, R.; Schmutz, M.; Preisinger, R.Higher precision level at individual laying performance tests in noncage housing systems. Poult. Sci. 2013,92, 2276–2282. [CrossRef] [PubMed]
20. Pauli, S.; Heinrich, A.; Thurner, S.; Icken, W.; Erbe, M.; Wendl, G.; Preisinger, R. Comparative study onnesting behaviour with two different RFID based laying nest boxes. In Proceedings of the XIIIth EuropeanPoultry Conference, Tours, France, 23–27 August 2010; pp. 573–577.
21. Thurner, S.; Wendl, G.; Preisinger, R. Funnel nest box: A system for automatic recording of individualperformance and behaviour of laying hens in floor management. In Proceedings of the XII European PoultryConference, Verona, Italy, 10–14 September 2006; pp. 610–611.
22. Banerjee, D.; Daigle, C.L.; Dong, B.; Wurtz, K.; Newberry, R.C.; Siegford, J.M.; Biswas, S. Detection of jumpingand landing force in laying hens using wireless wearable sensors. Poult. Sci. 2014, 93, 2724–2733. [CrossRef][PubMed]
23. Daigle, C.L.; Banerjee, D.; Biswas, S.; Siegford, J.M. Noncaged laying hens remain unflappable while wearingbody-mounted sensors: Levels of agonistic behaviors remain unchanged and resource use is not reducedafter habituation. Poult. Sci. 2012, 91, 2415–2423. [CrossRef] [PubMed]
24. Daigle, C.L.; Banerjee, D.; Montgomery, R.A.; Biswas, S.; Siegford, J.M. Moving GIS research indoors:Spatiotemporal analysis of agricultural animals. PLoS ONE 2014, 9, e104002. [CrossRef] [PubMed]

Sensors 2017, 17, 1195 17 of 17
25. Zaninelli, M.; Costa, A.; Tangorra, F.M.; Rossi, L.; Agazzi, A.; Savoini, G. Preliminary evaluation of a nestusage sensor to detect double nest occupations of laying hens. Sensors 2015, 15, 2680–2693. [CrossRef][PubMed]
26. Aydin, A.; Cangar, O.; Ozcan, S.E.; Bahr, C.; Berckmans, D. Application of a fully automatic analysis tool toassess the activity of broiler chickens with different gait scores. Comput. Electron. Agric. 2010, 73, 194–199.[CrossRef]
27. Dawkins, M.S.; Cain, R.; Roberts, S.J. Optical flow, flock behaviour and chicken welfare. Anim. Behav. 2012,84, 219–223. [CrossRef]
28. Kashiha, M.; Pluk, A.; Bahr, C.; Vranken, E.; Berckmans, D. Development of an early warning system for abroiler house using computer vision. Biosyst. Eng. 2013, 116, 36–45. [CrossRef]
29. Nakarmi, A.D.; Tang, L.; Xin, H. Automated tracking and behavior quantification of laying hens using 3Dcomputer vision and radio frequency identification technologies. Trans. Asabe 2014, 57, 1455–1472.
30. Wang, C.; Chen, H.; Zhang, X.; Meng, C. Evaluation of a laying-hen tracking algorithm based on a hybridsupport vector machine. J. Anim. Sci. Biotechnol. 2016, 7, 60. [CrossRef] [PubMed]
31. Kashiha, M.A.; Green, A.R.; Sales, T.G.; Bahr, C.; Berckmans, D.; Gates, R.S. Performance of an image analysisprocessing system for hen tracking in an environmental preference chamber. Poult. Sci. 2014, 93, 2439–2448.[CrossRef] [PubMed]
32. Zaninelli, M.; Rossi, L.; Costa, A.; Tangorra, F.M.; Agazzi, A.; Savoini, G. Monitoraggio dello stato di salutedelle capre attraverso l′analisi on-line della conducibilità elettrica del latte. Large Anim. Rev. 2015, 21, 81–86.
33. Zaninelli, M.; Campagnoli, A.; Reyes, M.; Rojas, V. The O3-Vet project: Integration of a standard nomenclatureof clinical terms in a veterinary electronic medical record for veterinary hospitals. Comput. MethodsProgr. Biomed. 2012, 108, 760–772. [CrossRef] [PubMed]
34. Jain, A.K. Fundamentals of Digital Image Processing; Kailath, T., Ed.; Prentice-Hall Inc.: Englewood Cliffs, NJ,USA, 1989.
35. Klinger, T. Image Processing with LabVIEW and IMAQ Vision; Prentice Hall: Upper Saddle River, NJ, USA, 2003.36. Zhao, H.; Cheng, J.; Jin, J. NI vision based Automatic Optical Inspection (AOI) for surface mount devices:
Devices and method. In Proceedings of the International Conference on Applied Superconductivity andElectromagnetic Devices (ASEMD), Beijing, China, 25–27 October 2009; pp. 356–360.
37. Zaninelli, M.; Rossi, L.; Costa, A.; Tangorra, F.M.; Agazzi, A.; Savoini, G. Signal spectral analysis tocharacterize gland milk electrical conductivity in dairy goats. Ital. J. Anim. Sci. 2015, 14, 362–367. [CrossRef]
38. Yahav, S.; Giloh, M. Infrared thermography–Applications in poultry biological research. In InfraredThermography; Prakash, R.V., Ed.; InTech: Rijeka, Croatia, 2012; pp. 93–116.
39. Baracho, M.; Nääs, I.; Nascimento, G.; Cassiano, J.; Oliveira, K. Surface temperature distribution in broilerhouses. Rev. Bras. Ciência Avícola 2011, 13, 4–9. [CrossRef]
40. Ferreira, V.; Francisco, N.; Belloni, M.; Aguirre, G.; Caldara, F.; Nääs, I.; Garcia, R.; Almeida Paz, I.;Polycarpo, G. Infrared thermography applied to the evaluation of metabolic heat loss of chicks fed withdifferent energy densities. Rev. Bras. Ciência Avícola 2011, 13, 113–118. [CrossRef]
41. Steen, K.A.; Villa-Henriksen, A.; Therkildsen, O.R.; Green, O. Automatic detection of animals in mowingoperations using thermal cameras. Sensors 2012, 12, 7587–7597. [CrossRef] [PubMed]
42. Team R Core Development. R. A Language and Environment for Statistical Computing; R Foundation forStatistical Computing: Vienna, Austria, 2008.
43. Kashiha, M.; Bahr, C.; Ott, S.; Moons, C.P.H.; Niewold, T.A.; Ödberg, F.O.; Berckmans, D. Automaticidentification of marked pigs in a pen using image pattern recognition. Comput. Electron. Agric. 2013, 93,111–120. [CrossRef]
44. Poursaberi, A.; Wichman, A.; Bahr, C.; Hänninen, L.; Pastell, M.; Berckmans, D. Automatic monitoring ofturkeys: A vision-based approach to detect and analyse the behaviour of turkeys in transport cages based onellipse fitting. In Proceedings of the ASABE-7th World Congress on Computers in Agriculture and NaturalResources 2009, Reno, NV, USA, 22–24 June 2009.
© 2017 by the authors. Licensee MDPI, Basel, Switzerland. This article is an open accessarticle distributed under the terms and conditions of the Creative Commons Attribution(CC BY) license (http://creativecommons.org/licenses/by/4.0/).