Embed Size (px)
Citation preview
GENES, CHROMOSOMES & CANCER 16:12&.129 (1996)
Detection of Numerical Chromosome Anomalies in lnterphase Cells of Ovarian Carcinomas Using Fluorescence In Situ Hybridization
lo-Ann K. Brock, Wei-Hua Liu, S. Terrell Smith, and S. Robert Young
Department of Obstetrics and Gynecology, The University of South Carolina School of Medicine, Columbia, South Carolina
Fluorescence in situ hybridization was used in interphase cells of 30 ovarian carcinomas to detect numerical changes in copy number of I 3 different centromeres (I , 2.3,4,6.7,8, 10. I I , I 2, 17, 18, and X). Thirty-seven percent of samples ( I I /30) were near diploid and demonstrated only minor changes in centromere copy number, involving gain and/or IOU of one or a few centromeres. The most common changes included loss of centromeres 4,6, 17, and I8 and gain of centromere I. The remaining 63% of samples were hyperdiploid and demonstrated a general increase in copy number of most or all centromeres examined. Among these samples, the centromere of chromosome I was most often found to be at higher copy number. Centromeres that were less often at increased copy or deleted within the hyperdiploid samples include centromeres 4, 17, 18, and X. These results suggest that tumor-suppressor genes that are located on chromosomes 4, 6, 17, and 18 may be involved in the development and progression of ovarian cancer. Genes Chrornosorn Cancer 16:120-129 (1996). 0 1996 Wiley-Liss, Inc.
INTRODUCTION
Despite the fact that cancer of the ovary is the sixth most common cancer in women and that there is a 1.4% lifetime incidence of developing this disease, ovarian cancer has remained the most lethal of gynecologic malignancies. This is primar- ily because it is asymptomatic at its outset and typ- ically does not present until intraperitoneal me- tastasis has occurred. Identification of some of the underlying factors, especially molecular and cyto- genetic factors, which predispose to, or contribute to the progression of this disease, may ultimately play an important role in early detection and dis- ease treatment.
Identification of cytogenetic aberrations that are associated with neoplastic transformation have proven to be useful both in diagnosis of specific diseases and in identifying specific genes that are involved in the malignant process. Cytogenetic studies of ovarian cancer, however, have shown a diverse array of chromosome abnormalities, includ- ing gain of chromosomes 7, 12, and 14q; partial or complete loss of chromosomes 4, 6, 8, 13, 17, 22, and X; and rearrangements involving chromosomes 1, 3, 6, 7, 11, 14, and 19 (Wake et al., 1980; Atkin and Baker, 1987; Pejovic et al., 1990, 1992; Rob- erts and Tattersall, 1990; Jenkins et al., 1993; Thompson et al., 1994). Primary chromosome ab- normalities have been difficult to identify in ovar- ian carcinomas due to the numerical and structural complexity of karyotypes derived from these cells, the presence of unidentifiable marker chromo-
somes, and the difficulties in culturing and prepar- ing good-quality metaphase chromosomes from these tumors. In addition, ascertainment of chro- mosome anomalies may be obscured by selective growth of tumor variants.
Fluorescence in situ hybridization (FISH) offers an alternate approach to the analysis of chromo- some aberrations in solid tumor tissue (Pinkel et al., 1986; Nederlof et al., 1989) and can be used to examine interphase cells directly, obviating the need for cell culturing. In addition, because the technique does not require cell growth, it also al- lows analysis of archival or frozen tissue samples. FISH analysis using alpha satellite sequences for centromere enumeration has been demonstrated to be successful in detecting chromosome aberrations in a number of solid tumor types, including breast carcinomas (Devilee et al., 1988), thyroid tumors (Taruscio et al., 1994), and ovarian carcinomas (Persons et al., 1993; Liehr et al., 1994).
This study describes the analysis of 30 ovarian carcinoma samples by FISH, using a battery of al- pha satellite sequences specific to 13 different chromosomes, to assess whether specific numerical chromosome anomalies may be associated with ovarian carcinomas and to correlate these results with stage and grade of disease.
Received December 5, 1995; revision accepted February 5, 1996. Address correspondence to Jo-Ann K . Brock, Department of Ob-
stetrics and Gynecology, The University of South Carolina School of Medicine, Two Medical Park, Suite 301, Columbia, SC 29203.
0 I996 Wiley-Lirs. Inc
INTERPHASE FISH IN OVARIAN CARCINOMAS 121
MATERIALS AND METHODS
Sample Preparation
Specimens taken from the central portion of the tumor were received fresh from surgery or as frozen samples, minced mechanically into small pieces, then treated with either 1X trypsin ethylene di- aminetetraacetic acid (EDTA; 0.25% trypsin, 1 mM EDTA, Gibco-BRL; 1 hour at 37°C or over- night at 4°C) or collagenase Ia (250-300 units/ml in RPMI 1640 medium with L-glutamine, Gibco- BRL, 4-16 hours at 37°C) for disaggregation into single cells. After disaggregation, cells were spun down, resuspended in 0.075 M KCI hypotonic so- lution for 15 minutes, fixed in methano1:acetic acid (3:1), and dropped directly onto slides for inter- phase studies. Two normal ovarian tissues were obtained and processed in the same manner and used as control samples.
In Situ Hybridization of Interphase Nuclei
Slides were denatured in 70% formamide, 2x SSC (0.3M NaCI, 0.03M sodium citrate), pH 7.0, at 75°C for 3 minutes, followed by dehydration in a series of 70%, 80%, 90%, and 100% ethanol washes of 2 minutes each. Alpha satellite probes obtained from ONCOR (Gaithersburg, MD) were prepared according to manufacturer‘s specifica- tions, denatured in 70% formamide at 72°C for 5-10 minutes, and cooled on ice. Hybridization of probe to cells was allowed to proceed at 37°C for 4-16 hours. Slides were washed three times in 65% formamide, 2 X SSC, pH 7.0, at 43°C for 5 minutes each and two times in 2 X SSC, pH 7.0, at 37°C for 5 minutes each. Detection of biotin-labeled and digoxigenin-labeled probes was carried out by us- ing ONCOR reagents according to manufacturer’s specifications. Biotin was detected with fluores- cein isothyocyanate (FITCklabeled avidin, and digoxigenin was detected with rhodamine-labeled antidigoxigenin antibody. When necessary, signal in some samples was amplified by using appropri- ate ONCOR reagents. Slides were counterstained with either DAPI (4’,6-diamidino-2-phenylindole dihydrochloride) or propidium iodide and viewed with a Zeiss Axioskop fluorescence microscope us- ing either dual- or triple- excitation/emission band- pass filters (Chroma, Brattleboro, VT).
In Situ Hybridization Analysis
At least 200 single, nonoverlapping, intact nuclei of each sample were counted for each centromere probe tested. For analysis of signal, the following guidelines were followed: only nonoverlapping nu-
clei were counted, damaged nuclei were not in- cluded, signals had to be completely separated to be scored individually, and bilobed signals that were not completely separated were counted as one. Nuclei were counted in different quadrants of the slide to minimize problems resulting from vari- ation in hybridization efficiency and probe detec- tion, and only slides that displayed uniform signal intensity were scored.
RESULTS
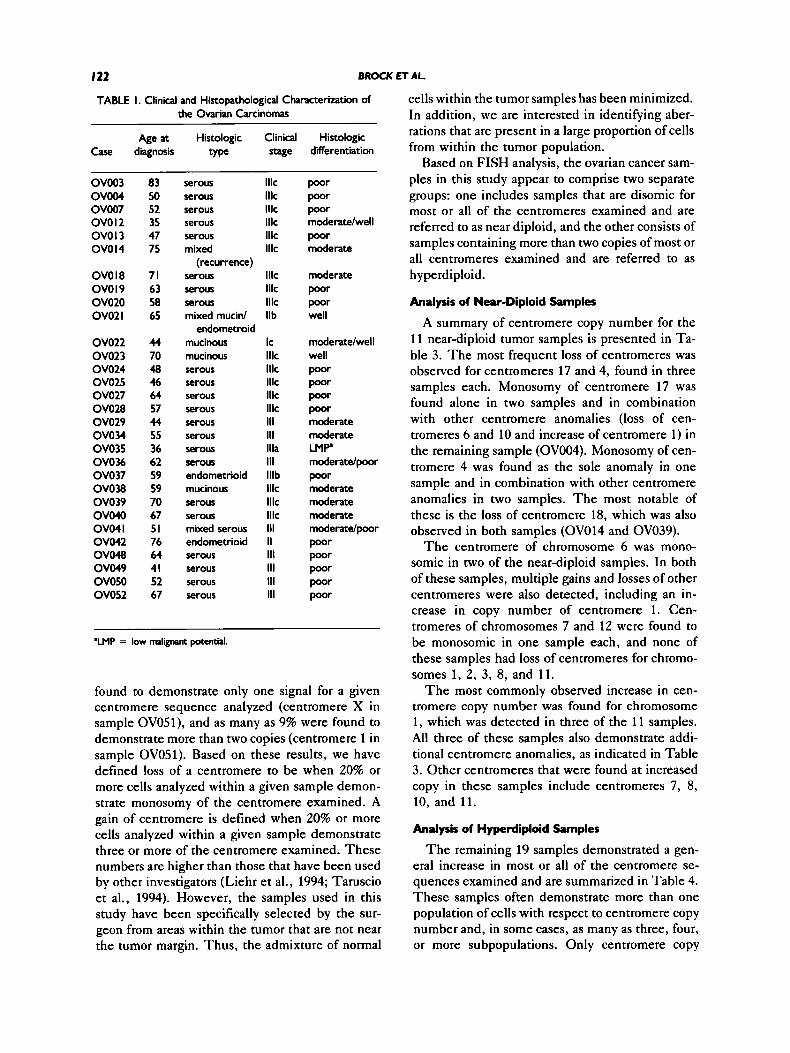
FISH was applied to 30 epithelial ovarian cancer samples to monitor changes in the centromere copy number of 13 different chromosomes (1, 2, 3, 4, 6, 7, 8, 10, 11, 12, 17, 18, and X). T h e histological types of each tumor sample, the stage and grade of disease, and the age of the patients at diagnosis are summarized in Table 1. A majority of samples (231 30) were serous in origin and presented at stage 111. Of the remainder, three were mucinous, two were endometrioid, and two were of mixed histologic origin. All but two of the samples were of advanced disease (FIG0 stage 111); one was stage I and one stage 11. Eighteen of the tumor samples were ei- ther poorly or moderately/poorly differentiated, seven were moderately differentiated, four were well or moderately/well differentiated, and one had low malignant potential. One sample (OV014) was obtained as recurrent disease, and the remainder were primary ovarian carcinomas.
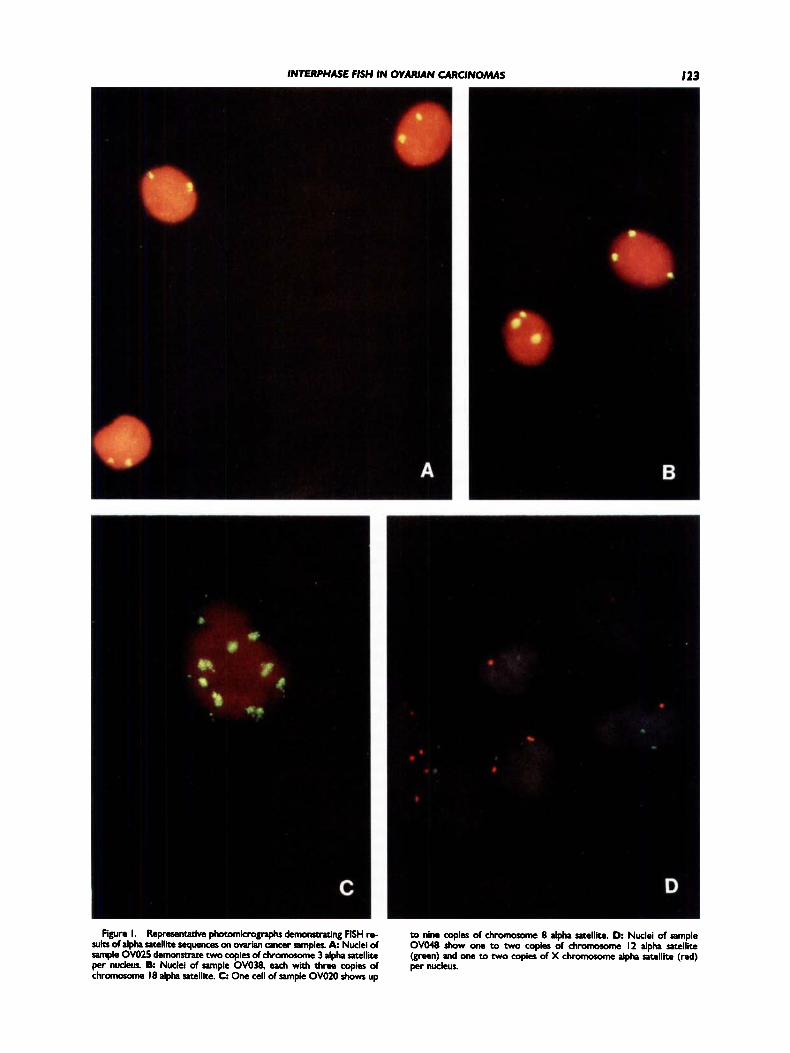
Figure 1 shows a series of nuclei, from different ovarian samples, to which various alpha satellite probes have been hybridized. In some cases, only a single centromere sequence is examined (Fig. 1A-C); in others, two centromere sequences are examined by using dual-color FISH analysis (Fig. 1D).
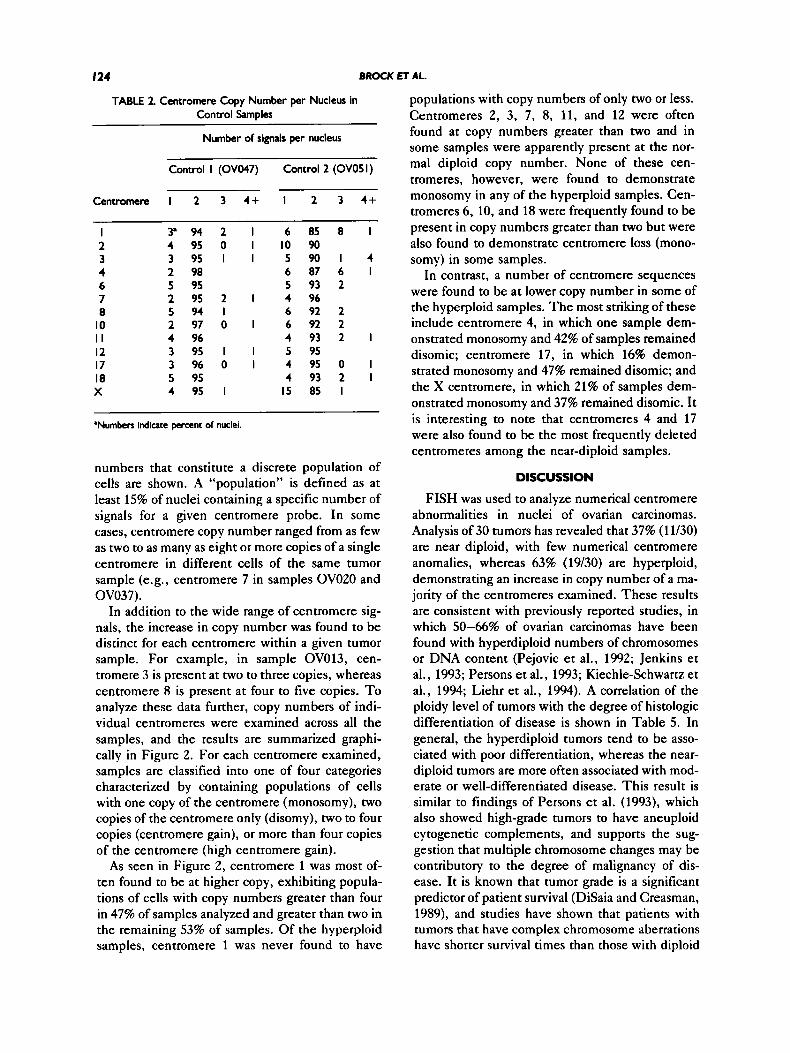
T h e results of two control samples (OV047 and OVO51) are tabulated and summarized in Table 2. For each satellite sequence examined, the percent- age of nuclei containing one, two, three, four, or more signals is indicated. As in other reported stud- ies (Liehr et al., 1994; Meisner et al., 1994), some heterogeneity was observed in the number of sig- nals within the nuclei of a given sample, even among the control samples. This heterogeneity may arise from one or more different sources, including underrepresentation due to overlapping signals, weak signal, or poor hybridization efficiency, and excess signals due to split signals, detection of cells in G2, high background-to-signal ratio, and loss of specificity due to cross hybridization of satellite sequences to more than one centromere. In the control samples, as many as 15% of nuclei were
I22 BROCK
TABLE I. Clinical and Histopathological Characterization of the Ovarian Carcinomas
~ ~~
Age at Histologic Clinical Histologic Case diagnosis type stage differentiation
OV003 O V W OV007 ovo I2 OVO I 3 OVO I4
OVO I8 OVO I 9 ov020 OV02 I
ov022 OV023 OV024 OV025 OV027 OV028 OV029 OVOU OV035 OV036 OV037 ovo38 OV039 ov040 ov04 I ov042 ovo48 OV049 OVOSO OV052
83 50 52 35 47 75
71 63 58 65
44 70 48 46 64 57 44 55 36 62 59 59 70 67 51 76 64 41 52 67
serous serous serous serous serous mixed
serous serous serous mixed mucid
mucinous mucinous serous serous serous serous serous serous serous serous endometrioid mucinous serous serous mixed serous endometrioid serous serous serous serous
(recurrence)
endometroid
Ilk Ilk lllc Ilk Ilk lllc
Ilk Ilk Ilk Ilb
Ic Ilk Ilk Ilk Ilk Ilk 111 111 llla 111 lllb Ilk Ilk Ilk 111 II 111 111 111 111
poor poor poor moderate/well poor moderate
moderate poor poor well
moderate/well well poor poor poor poor moderate moderate LMP moderate/poor poor moderate moderate moderate moderate/poor poor poor poor poor poor
'LMP = low malignam potential.
found to demonstrate only one signal for a given centromere sequence analyzed (centromere X in sample OVOSl), and as many as 9% were found to demonstrate more than two copies (centromere 1 in sample OVOSl). Based on these results, we have defined loss of a centromere to be when 20% or more cells analyzed within a given sample demon- strate monosomy of the centromere examined. A gain of centromere is defined when 20% or more cells analyzed within a given sample demonstrate three or more of the centromere examined. These numbers are higher than those that have been used by other investigators (Liehr et al., 1994; Taruscio et al., 1994). However, the samples used in this study have been specifically selected by the sur- geon from areas within the tumor that are not near the tumor margin. Thus, the admixture of normal
ET AL.
cells within the tumor samples has been minimized. In addition, we are interested in identifying aber- rations that are present in a large proportion of cells from within the tumor population.
Based on FISH analysis, the ovarian cancer sam- ples in this study appear to comprise two separate groups: one includes samples that are disomic for most or all of the centromeres examined and are referred to as near diploid, and the other consists of samples containing more than two copies of most or all centromeres examined and are referred to as hyperdiploid.
Analysis of Near-Diploid Samples
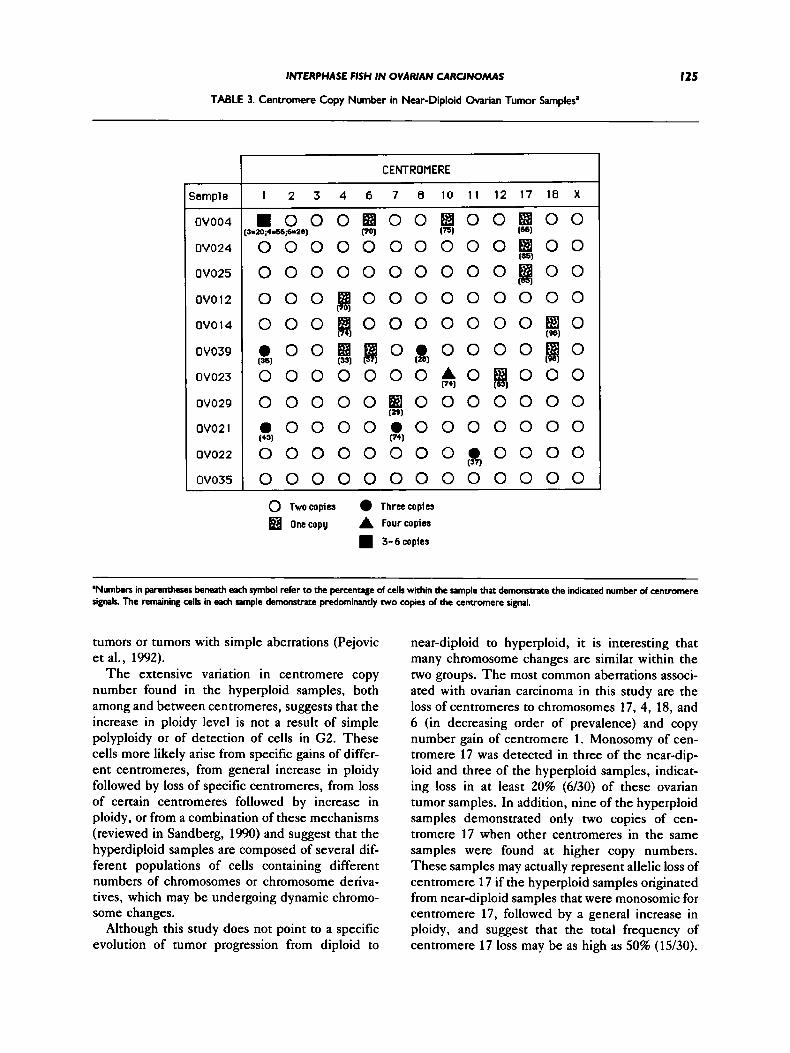
A summary of centromere copy number for the 11 near-diploid tumor samples is presented in Ta- ble 3. T h e most frequent loss of centromeres was observed for centromeres 17 and 4, found in three samples each. Monosomy of centromere 17 was found alone in two samples and in combination with other centromere anomalies (loss of cen- tromeres 6 and 10 and increase of centromere 1) in the remaining sample (OV004). Monosomy of cen- tromere 4 was found as the sole anomaly in one sample and in combination with other centromere anomalies in two samples. T h e most notable of these is the loss of centromere 18, which was also observed in both samples (OV014 and OV039).
T h e centromere of chromosome 6 was mono- somic in two of the near-diploid samples. In both of these samples, multiple gains and losses of other centromeres were also detected, including an in- crease in copy number of centromere 1. Cen- tromeres of chromosomes 7 and 12 were found to be monosomic in one sample each, and none of these samples had loss of centromeres for chromo- somes 1, 2, 3, 8, and 11.
T h e most commonly observed increase in cen- tromere copy number was found for chromosome 1, which was detected in three of the 11 samples. All three of these samples also demonstrate addi- tional centromere anomalies, as indicated in Table 3. Other centromeres that were found at increased copy in these samples include centromeres 7, 8, 10, and 11.
Analysis of Hyperdiploid Samples
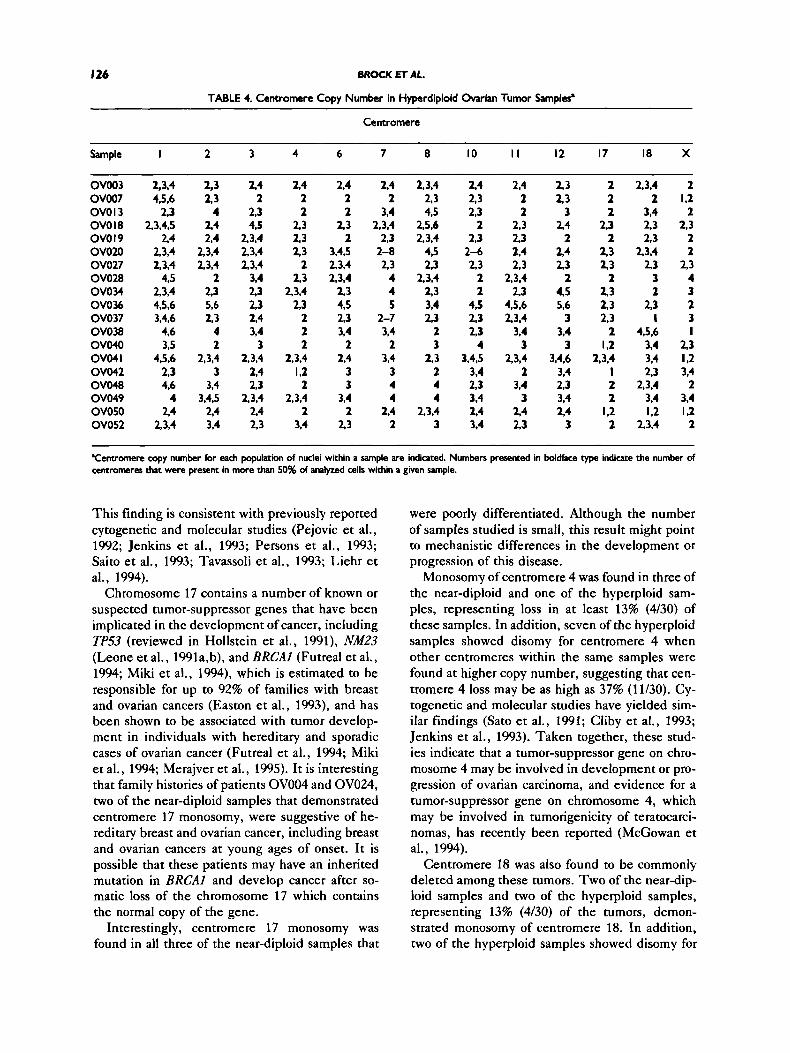
T h e remaining 19 samples demonstrated a gen- eral increase in most or all of the centromere se- quences examined and are summarized in Table 4. These samples often demonstrate more than one population of cells with respect to centromere copy number and, in some cases, as many as three, four, or more subpopulations. Only centromere copy
INTERPHASE FISH IN OVARIAN CARCINOMAS 123
Figure I. RepreKnttcivc photomkrognphs dcmomtruing FISH re- sub of alpha satellite sequencer on owian M c e r samples. A Nuclei of sample OVO25 demonstrate two copies of chromosome 3 alpha satellite per nucleus. 8: Nuclei of sample OVO38. each with three copies of chromosome 18 alpha satellite. C One cell of sample OVOZO shows up
to nine copies of chromoxnne 8 alpha satellite. D Nuclei of sample OVO48 show one to two copies of chromorome I2 alpha satellite (green) and one to two copies of X chromorome alpha satellite (red) per nucleus.
I24 BROCK ET AL.
TABLE 2. Centromere Copy Number per Nucleus in Control Samples
Number of signals per nucleus
Control I (OV047) Control 2 (OVO5I)
Centromere I 2 3 4 + I 2 3 4+
I 2 3 4 6 7 8
10 I I 12 17 18 X
3 ’ 9 4 2 I 6 8 5 8 I 4 9 5 0 I 1 0 9 0 3 9 5 1 I 5 9 0 1 4 2 98 6 8 7 6 I 5 95 5 93 2 2 9 5 2 1 4 9 6 5 94 I 6 92 2 2 9 7 0 I 6 9 2 2 4 96 4 9 3 2 I 3 9 5 1 I 5 9 5 3 9 6 0 I 4 9 5 0 I 5 95 4 9 3 2 I 4 95 I 15 85 I
’Numbers indicate percent of nuclei.
numbers that constitute a discrete population of cells are shown. A “population” is defined as at least 15% of nuclei containing a specific number of signals for a given centromere probe. In some cases, centromere copy number ranged from as few as two to as many as eight or more copies of a single centromere in different cells of the same tumor sample (e.g., centromere 7 in samples OV020 and OV037).
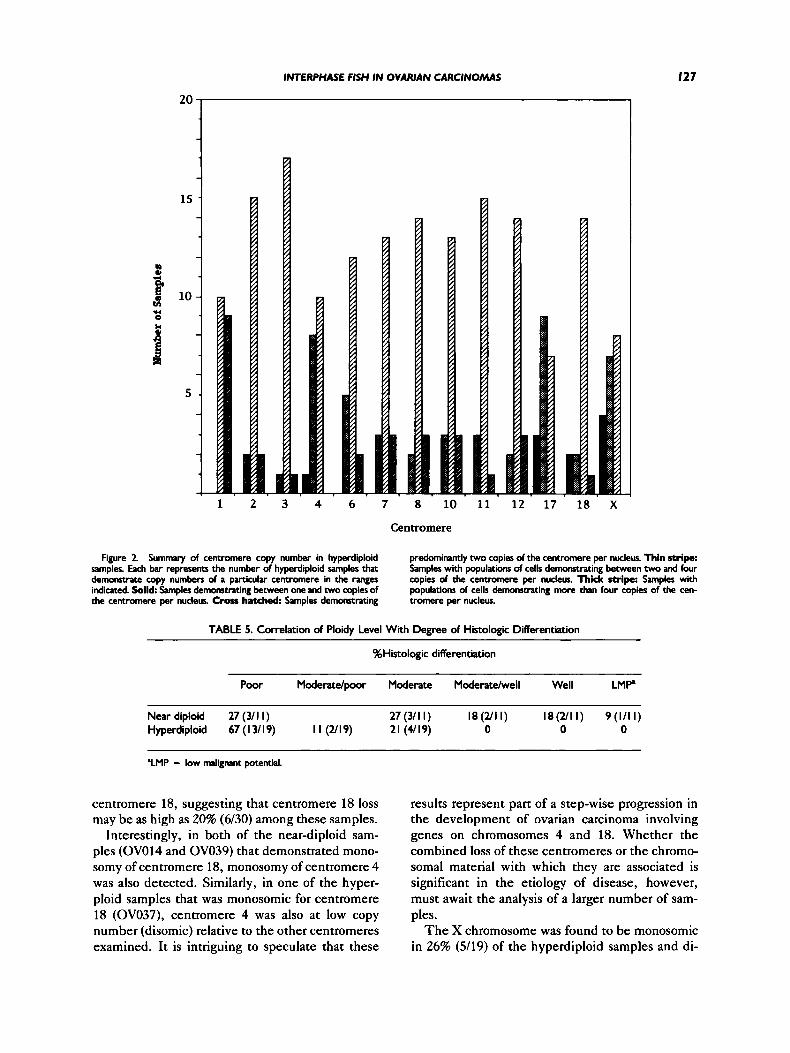
In addition to the wide range of centromere sig- nals, the increase in copy number was found to be distinct for each centromere within a given tumor sample. For example, in sample OV013, cen- tromere 3 is present at two to three copies, whereas centromere 8 is present at four to five copies. To analyze these data further, copy numbers of indi- vidual centromeres were examined across all the samples, and the results are summarized graphi- cally in Figure 2. For each centromere examined, samples are classified into one of four categories characterized by containing populations of cells with one copy of the centromere (monosomy), two copies of the centromere only (disomy), two to four copies (centromere gain), or more than four copies of the centromere (high centromere gain).
As seen in Figure 2, centromere 1 was most of- ten found to be at higher copy, exhibiting popula- tions of cells with copy numbers greater than four in 47% of samples analyzed and greater than two in the remaining 53% of samples. Of the hyperploid samples, centromere 1 was never found to have
populations with copy numbers of only two or less. Centromeres 2, 3, 7, 8, 11, and 12 were often found at copy numbers greater than two and in some samples were apparently present at the nor- mal diploid copy number. None of these cen- tromeres, however, were found to demonstrate monosomy in any of the hyperploid samples. Cen- tromeres 6, 10, and 18 were frequently found to be present in copy numbers greater than two but were also found to demonstrate centromere loss (mono- somy) in some samples.
In contrast, a number of centromere sequences were found to be at lower copy number in some of the hyperploid samples. The most striking of these include centromere 4, in which one sample dem- onstrated monosomy and 42% of samples remained disomic; centromere 17, in which 16% demon- strated monosomy and 47% remained disomic; and the X centromere, in which 21% of samples dem- onstrated monosomy and 37% remained disomic. It is interesting to note that centromeres 4 and 17 were also found to be the most frequently deleted centromeres among the near-diploid samples.
DISCUSSION
FISH was used to analyze numerical centromere abnormalities in nuclei of ovarian carcinomas. Analysis of 30 tumors has revealed that 37% (1 1/30) are near diploid, with few numerical centromere anomalies, whereas 63% (19/30) are hyperploid, demonstrating an increase in copy number of a ma- jority of the centromeres examined. These results are consistent with previously reported studies, in which 50-66% of ovarian carcinomas have been found with hyperdiploid numbers of chromosomes or DNA content (Pejovic et al., 1992; Jenkins et al., 1993; Persons et al., 1993; Kiechle-Schwartz et al., 1994; Liehr et al., 1994). A correlation of the ploidy level of tumors with the degree of histologic differentiation of disease is shown in Table 5. In general, the hyperdiploid tumors tend to be asso- ciated with poor differentiation, whereas the near- diploid tumors are more often associated with mod- erate or well-differentiated disease. This result is similar to findings of Persons et al. (1993), which also showed high-grade tumors to have aneuploid cytogenetic complements, and supports the sug- gestion that multiple chromosome changes may be contributory to the degree of malignancy of dis- ease. I t is known that tumor grade is a significant predictor of patient survival (DiSaia and Creasman, 1989), and studies have shown that patients with tumors that have complex chromosome aberrations have shorter survival times than those with diploid
INTERPHASE FISH IN OVARIAN CARCINOMAS
TABLE 3. Centromere Copy Number in Near-Diploid Ovarian Tumor Samples’
I25
Sample
OV004
OV024
OV025
ovo 12
OVO 14
OV039
OV023
OV029
ov02 1
ov022
OV035
CENTROMERE
1 2 3 4 6 7 8 1 0 1 1 1 2 1 7 1 8 X
m o o 0 0 0 0 0 0
0 0 0
0 0 0
a 0 0 0 0 0
0 0 0
3=l0;+=~6,+2q
(=I
m o o (43)
0 0 0 0 0 0
0 I B 0 0 B 0 0 B 0 0 0 0 0 0 0 0 0 8 0 0
Po) (75) (66)
(a51
0 0 0 0 0 0 0 ~ 0 0 ( 1
( ~ 0 0 0 0 0 0 0 0 0 ~ 0 0 0 0 0 0 0 ~ 0 [W
~ ~ 0 . 0 0 0 0 ~ 0 (331 (261
0 0 0 0 ~ 0 ~ 0 0 0
0 0 0 0 0 (g] 0 0 0 0
0 0 ~ 0 0 0 0 0 0 0 0 0 . 0 0 0 0 0 0 0
(291
PI1
0 0 0 0 0 0 0 0 0 0
0 Twocopies Threecopies
onecopy A Fourcopia
3-6copies
Wumbers in parentheses beneath each symbol refer to the percentage of cells within the sample that demomwate the indicated number of centromere signals. The remaining cells in each sample demonnace predominantly two copies of the cent rmre signal.
tumors or tumors with simple aberrations (Pejovic et al., 1992).
The extensive variation in centromere copy number found in the hyperploid samples, both among and between centromeres, suggests that the increase in ploidy level is not a result of simple polyploidy or of detection of cells in G2. These cells more likely arise from specific gains of differ- ent centromeres, from general increase in ploidy followed by loss of specific centromeres, from loss of certain centromeres followed by increase in ploidy, or from a combination of these mechanisms (reviewed in Sandberg, 1990) and suggest that the hyperdiploid samples are composed of several dif- ferent populations of cells containing different numbers of chromosomes or chromosome deriva- tives, which may be undergoing dynamic chromo- some changes.
Although this study does not point to a specific evolution of tumor progression from diploid to
near-diploid to hyperploid, it is interesting that many chromosome changes are similar within the two groups. T h e most common aberrations associ- ated with ovarian carcinoma in this study are the loss of centromeres to chromosomes 17, 4, 18, and 6 (in decreasing order of prevalence) and copy number gain of centromere 1. Monosomy of cen- tromere 17 was detected in three of the near-dip- loid and three of the hyperploid samples, indicat- ing loss in at least 20% (6130) of these ovarian tumor samples. In addition, nine of the hyperploid samples demonstrated only two copies of cen- tromere 17 when other centromeres in the same samples were found at higher copy numbers. These samples may actually represent allelic loss of centromere 17 if the hyperploid samples originated from near-diploid samples that were monosomic for centromere 17, followed by a general increase in ploidy, and suggest that the total frequency of centromere 17 loss may be as high as 50% (15/30).
I26 BROCK ET AL.
TABLE 4. Centromere Copy Number in Hyperdiploid Ovarian Tumor Sampler’
Centromere
Sample I 2 3 4 6 7 8 10 I I 12 17 18 X
OV003 2,3,4 OV007 4,5.6 OVOl3 2.3 OVO18 2,3,4,5 OVO I9 2.4 OVO20 2,3,4 OV027 2.3.4 OV028 4.5 OVOW 23,4 OVO36 4.5.6 OV037 3,4,6 ovo38 4.6 ov040 395 OV04I 4,5.6 OV042 2,3 ovo48 4.6 OW49 4 OV050 24 OV052 2,3,4
2.4 2,4 2 2
5 3 2 4,5 2.3
234 23 2,3,4 2,3 2.3,4 2
3,4 2,3 2,3 2,3,4 2,3 2,3 24 2 394 2
3 2 2.3,4 2.3.4
2,4 I,Z 23 2
2.3,4 2,3,4 2.4 2 2,3 3,4
2.4 2
3,4 2,3,4
2,3 2-8 2 3
4 4 5
2-7 3.4
2 3,4
3 4 4
2.4 2
2,4 2,3 2S
2 2 3
2-6 2.3
2 2
4,5 2.3 2.3
4 3,4,5
3.4 2 3 3,4 2.4 3.4
2,4 2 2
2 3 23 2 4 2.3
23.4 2.3
4% 2.3.4
3,4 3
53,4 2
394 3
2,4 2.3
23 2.3
3 2.4
2 2,4 2 3
2 4.5 56
3 3,4
3 34.6
3.4 2.3 3.4 2 4
3
2,3,4 2 2 I,2
3,4 2 2.3 2 3 2 3 2
23,4 2 2,3 2.3
3 4 2 3
2,3 2 1 3
4,5,6 I 3,4 2,3 3.4 1,2 2,3 3.4
2,3,4 2 3.4 3.4 1.2 1.2
2 1 4 2
‘Cenuomere copy number for each populatim of nuclei within a sample are indicated. Numbers presented in boldface type indicate the number of centromeres that were present in more than 50% of analyzed cells within a given sample.
This finding is consistent with previously reported cytogenetic and molecular studies (Pejovic et at., 1992; Jenkins et al., 1993; Persons et al., 1993; Saito et al., 1993; Tavassoli et al., 1993; Liehr et al., 1994).
Chromosome 17 contains a number of known or suspected tumor-suppressor genes that have been implicated in the development of cancer, including TP53 (reviewed in Hollstein et al., 1991), NM23 (Leone et al., 1991a,b), and BRCAl (Futreal et al., 1994; Miki et at., 1994), which is estimated to be responsible for up to 92% of families with breast and ovarian cancers (Easton et al., 1993), and has been shown to be associated with tumor develop- ment in individuals with hereditary and sporadic cases of ovarian cancer (Futreal et al., 1994; Miki et al., 1994; Merajver et al., 1995). It is interesting that family histories of patients OV004 and OV024, two of the near-diploid samples that demonstrated centromere 17 monosomy, were suggestive of he- reditary breast and ovarian cancer, including breast and ovarian cancers at young ages of onset. It is possible that these patients may have an inherited mutation in BRCAl and develop cancer after so- matic loss of the chromosome 17 which contains the normal copy of the gene.
Interestingly, centromere 17 monosomy was found in all three of the near-diploid samples that
were poorly differentiated. Although the number of samples studied is small, this result might point to mechanistic differences in the development or progression of this disease.
Monosomy of centromere 4 was found in three of the near-diploid and one of the hyperploid sam- ples, representing loss in at least 13% (4/30) of these samples. In addition, seven of the hyperploid samples showed disomy for centromere 4 when other centromeres within the same samples were found at higher copy number, suggesting that cen- tromere 4 loss may be as high as 37% (1 1/30). Cy- togenetic and molecular studies have yielded sim- ilar findings (Sato et al., 1991; Cliby et at., 1993; Jenkins et al., 1993). Taken together, these stud- ies indicate that a tumor-suppressor gene on chro- mosome 4 may be involved in development or pro- gression of ovarian carcinoma, and evidence for a tumor-suppressor gene on chromosome 4, which may be involved in tumorigenicity of teratocarci- nomas, has recently been reported (McGowan et al., 1994).
Centromere 18 was also found to be commonly deleted among these tumors. Two of the near-dip- loid samples and two of the hyperploid samples, representing 13% (4130) of the tumors, demon- strated monosomy of centromere 18. In addition, two of the hyperploid samples showed disomy for
INTERPHASE FISH IN OVARIAN CARCINOMAS
20
1 2 3 4 6 7 8 10 11 12 17 18 X
127
Centromere
Figure 2 Summar). of centromere copy number in hyperdiploid samples. Each bar represents the number of hyperdiploid samples that demonsvate copy numbers of a particular centmere in the tanges indicated. Solid Samples demonsttating between one and two copies of the centromere per nucleus. Cross hatched: Samples demonstrating
predominantly two copies of the centromere per nucleus. Thin stripe: Samples with populations of cells demonstrating between two and four copies of the centmmere per nucleus. Thick stripe: Samples with populations of cells demonstrating more than four copies of the cen- tromere per nucleus.
TABLE 5. Correlation of Ploidy Level With Degree of Histologic Differentiation
%Histologic differentiation
Poor Modera tdpr Moderate Moderatelwell Well LMP
Near diploid 27 (3/1 I) 27 (3/l I) I8 (2/1 I ) l8(2/l I ) 9( l / l I) Hyperdiploid 67 ( I 3/ 19) I I (2119) 21 (4/19) 0 0 0
'LMP = low malignant potential.
centromere 18, suggesting that centromere 18 loss may be as high as 20% (6/30) among these samples.
Interestingly, in both of the near-diploid sam- ples (OV014 and OV039) that demonstrated mono- somy of centromere 18, monosomy of centromere 4 was also detected. Similarly, in one of the hyper- ploid samples that was monosomic for centromere 18 (OV037), centromere 4 was also at low copy number (disomic) relative to the other centrorneres examined. It is intriguing to speculate that these
results represent part of a step-wise progression in the development of ovarian carcinoma involving genes on chromosomes 4 and 18. Whether the combined loss of these centromeres or the chromo- somal material with which they are associated is significant in the etiology of disease, however, must await the analysis of a larger number of sam- ples.
T h e X chromosome was found to be monosomic in 26% (5/19) of the hyperdiploid samples and di-
128 BROCK ET AL.
somic in 32% (6/19). This is in contrast to the near- diploid samples, in which loss of the X chromo- some was never observed. Previous cytogenetic studies have shown that loss of the X chromosome is a common finding in ovarian carcinomas (Trent, 1985; Roberts and Tattersall, 1990; Jenkins et al., 1993; Persons et al., 1993), although its signifi- cance in the neoplastic process is unclear. Other studies have shown that loss of the X chromosome occurs in peripheral blood lymphocytes as women age (Fitzgerald and McEwan, 1977; Galloway and Buckton, 1978), and the prevalence of loss of this centromere in only the hyperdiploid samples may relate to the fact that these cells are the result of multiple nondisjunction events.
T h e most common increase in centromere copy number was found for chromosome 1 among both the near-diploid and hyperploid tumors. A number of other studies have also shown that chromosome 1 aberrations commonly occur in ovarian cancer (Atkin and Baker, 1987), including chromosome 1 gain (Tanaka et al., 1989; Jenkins et al., 1993). In this study, elevation in the copy number of cen- tromere 1 was often accompanied by other cen- tromere anomalies, suggesting that gain of chromo- some 1 or chromosome 1 derivatives is a secondary event in the progression of ovarian cancer.
Based on the results of this study, we have found that loss of centromeres 4, 17, and 18 is common in ovarian carcinomas, and in some cases is found as the only detected centromere anomaly. This sug- gests that loss of these chromosomes or chromo- some derivatives containing these centromeres is an early event in development or progression of ovarian carcinomas. Other centromere anomalies, such as loss of centromere 6 and gain of centromere 1, are also common but are found to occur in asso- ciation with other centromere abnormalities (par- ticularly with loss of centromeres 17 and/or 4) and may represent secondary events in tumor progres- sion.
T h e results of this study support and strengthen previous reports of genetic alterations that occur in ovarian carcinoma. In addition, it reveals areas to be investigated in future studies, including possi- ble tumor suppressor gene(s) on chromosomes 4 and 18 that may be seminal in development of ovarian cancer. With future studies of these and other samples using additional probes, such as on- cogenes or tumor-suppressor genes, as well as con- tinued analysis of additional ovarian carcinomas to expand the sample size, it may be possible to iden- tify genetic changes that are recurrent in ovarian carcinomas. In addition, a long-term follow up of
the disease progression in these patients may re- veal a correlation between specific chromosome changes and disease outcome.
ACKNOWLEDGMENTS
We thank Mona Cantu, Angela Tutera, David Reisman, and Robert G. Best for helpful discus- sions and comments in the preparation of this manuscript. This work was supported in part by funding from the South Carolina Cancer Center.
REFERENCES Atkin NB, Baker MC (1987) Abnormal chromosomes including
small metacentrics in 14 ovarian cancers. Cancer Genet Cytoge- net 26355-361.
Cliby W, Ritland S, Hanmann L, Dodson M, Halling KC, Keeney G, Podratz KC, Jenkins RB (1993) Human epithelial ovarian can- cer allelotype. Cancer Res 532393-2398.
Devilee P, Thierry RF, Kievitis T , Kolluri R, Hopman AHN, Willard HF, Pearson PL, Corneliesse CJ (1988) Detection of chromosome aneuploidy in interphase nuclei from human primary breast tumors using chromosome-specific repetitive DNA probes. Cancer Res 48:5825-5830.
DiSaia PJ, Creasman W T (1989) Clinical Gynecologic Oncology. St. Louis, Mosby Year Book.
Easton DF, Bishop D, Ford D, Cmckford GP, the Breast Cancer Linkage Consortium (1993) Genetic linkage analysis in familial breast and ovarian cancer. Am J Hum Genet 52678-701.
Fitzgerald PH, McEwan CM (1977) Total aneuploidy and age-re- lated sex chromosome aneuploidy in cultured lymphocytes of nor- mal men and women. Hum Genet 39:329-337.
Futreal PA, Liu Q, Shattuck-Eidens D, Cochran C, Harshman K, Tavtigian S, Bennett LM, Haugen-Strano A, Swensen J, Miki Y, Eddington K, McClure M, Frye C, Weaver-Feldhaus J, Ding W, Gholami 2, Soderkvist P, Terry L, Jhanwar S, Berchuk A, Igle- hart JD, Marks J, Ballinger DG, Barrett JC, Skolnick MH, Kamb A, Wiseman R (1994) BRCAl mutations in primary breast and ovarian carcinomas. Science 266: 120-122.
Galloway SM, Buckton KE (1978) Aneuploidy and ageing: Chro- mosome studies on a random sample of the population using G-banding. Cytogenet Cell Genet 20:78-95.
Hollstein M, Sidransky D, Vogelstein B, Harris CC (1991) p53 mu- tations in human cancer. Science 253:49-53.
Jenkins RB, Banelt D Jr, Stalboerger P, Persons D, Dahl RJ, Po- dratz K, Keeney G, Hanmann L (1993) Cytogenetic studies of epithelial ovarian carcinoma. Cancer Genet Cytogenet 71:76-86.
Kiechle-Schwartz M, Bauknecht T, Karck U , Kommoss F, duBois A, Pfleiderer A (1994) Recurrent cytogenetic aberrations and loss of constitutional heterozygosity in ovarian carcinomas. Gynecol Oncol 55198-205.
Leone A, McBride OW, Weston A, Wang MG, Anglard P, Cropp C, Goepel JR, Lidereau R, Callahan R, Linehan WM, Rees RC, Harris CC, Liotta LA, Steeg PS (1991a) Somatic allelic deletion of nm23 in human cancer. Cancer Res 51:2490-2493.
Leone A, Flatow U, King CR, Sandeen MA, Margulies IMK, Liotta LA, Steeg PS (1991b) Reduced tumor incidence, metastatic po- tential and cytokine responsive of nm23 transfected melanoma cells. Cell 6525-35.
Liehr T , Stubinger A, Thoma K, Tulusan HA, Gebhart E (1994) Comparative interphase cytogenetics using FISH on human ovar- ian carcinomas. Anticancer Res 1 4 183-188.
McGowan JIJ, Speevak MD. Blakely D, Chevrette M (1994) Sup- pression of tumorigenicity in human teracocarcinoma cell line PA-1 by introduction of chromosome 4. Cancer Res 542568- 2572.
Meisner LF, Han K, Lee W, Harris CP (1994) Assessing aneuploidy in normal tissues with FISH: Pitfalls and insights. Cancer Genet Cytogenet 7278-80.
Merajver SD, Pham T, Caduff RF, Chen M, Pay EL, Cooney KA, Weber BL, Collins FS, Johnston C, Frank T S (1995) Somatic mutations in the BRCAI gene in sporadic ovarian tumours. Nature Genet 9439-443.
Miki Y, Swenson J, Shattuck-Eidens D, Futreal PA, Harshman K, Tavtigian S, Liu Q, Cochran C, Bennett LM, Ding W, Bell R, Rosenthal J, Hussey C, Tran T , McClure M, Frye C, Harrier T ,
INTERPHASE FISH IN OVARIAN CARCINOMAS 129
Phelps R, Haugen-Strano A, Katcher H, Yakumo K, Gholami Z, Shaffer D, Stone S, Bayer S, Wray C. Bogden R, Dayananth P, Ward J, Tonin P, Navod S, Bristow PK, Norris FH, Helvering L, Morrison P, Rosteck P, Lai M, Barrett JC, Lewis C, Neuhausen S, Cannon-Albright L, Goldgar D, Wiseman R, Kamb A, Skol- nick MH (1994) A strong candidate for the breast and ovarian cancer susceptibility gene BRCAl. Science 26666-72.
Nederlof PM, vanderFlier S, Rapp AK, Tanke HJ, vanderPloeg M, Kornips F, Geraedts J (1989) Detection of chromosome aberra- tions in interphase tumor nuclei by non-radioactive in siru hybrid- ization. Cancer Genet Cytogenet 4287-98.
Pejovic T , Heim S, Mandahl N, Elmfors B, Floderus UM, Furgyik S, Helm G, Willen H, Mitelman F (1990) Trisomy 12 is a con- sistent chromosome aberration in benign ovarian tumors. Genes Chromosom Cancer 2:48-52.
Pejovic T , Heim S, Mandahl N, Baldetorp B, Elmfohrs B, Floderus U, Furgyik S, Helm G, Himmelmann A, Willen H, Mitelman F (1992) Chromosome aberrations in 35 primary ovarian carcinomas. Genes Chromosom Cancer 4:58-68.
Persons DL, Hartmann LC, Herath JF, Borell TJ, Cliby WA, Keeney GL, Jenkins RB (1993) Interphase molecular cytogenetic analysis of epithelial ovarian carcinomas. Am J Pathol 142733- 741.
Pinkel D, Straume T , Gray JW (1986) Cytogenetic analysis using quantitative, high-sensitivity, fluorescence hybridization. Proc Natl Acad Sci USA 8329344938.
Roberts CG, Tattersall MHN (1990) Cytogenetic study of solid ovarian tumors. Cancer Genet Cytogenet 48:243-253.
Saito H, Inazawa J, Saito S, Kasumi F, Koi S, Sagae S, Kudo R,
Saito J, Noda K, Nakamura Y (1993) Detailed deletion mapping of chromosome 17q in ovarian and breast cancers: 2-cM region on 17q21.3 often and commonly deleted in tumors. Cancer Res 53:
Sandberg AA (1990) The Chromosomes in Human Cancer and Leu- kemia, 2nd ed. New York Elsevier Science, pp 839-846.
Sato T , Saito H, Morita R, Koi S, Lee JH, Nakamura Y (1991) Allelotype of human ovarian cancer. Cancer Res 5151 18-5122.
Tanaka K, Boice CR, Testa JR (1989) Chromosome aberrations in nine patients with ovarian cancer. Cancer Genet Cytogenet 43: 1-14.
Taruscio D, Carcangiu ML, Reid T, Ward DC (1994) Numerical chromosome aberrations in thyroid tumors detected by double fluorescence in situ hybridization. Genes Chromosom Cancer 9 180-189.
Tavassoli M, Ruhrberg C, Beaumont V, Reynolds K, Kirkham N, Collins WP, Fananeh F (1993) Whole chromosome 17 loss in ovarian cancer. Genes Chromosom Cancer 8 195-198.
Thompson FH, Liu Y, Emerson J, Weinstein R, Makar R, Trent JM, Taetle R, Alberts DS (1994) Simple numeric abnormalities as primary karyotype changes in ovarian carcinoma. Genes Chromo- som Cancer 10:262-266.
Trent JM (1985) Prevalence and clinical significance of cytogenetic abnormalities in ovarian cancer. In AIberts DS, Surwit EA (eds): Ovarian Cancer. New York Martinus Nijhoff, pp 1-21.
Wake N, Myroslaw M, Hreshchyshyn M, Piver SM, Matsui S, Sandberg AA (1980) Specific cytogenetic changes in ovarian can- cer involving chromosome 6 and 14. Cancer Res 40:4512-4518.
3382-3385.