Embed Size (px)
Citation preview
143
Volume-4, Issue-4, August-2014, ISSN No.: 2250-0758
International Journal of Engineering and Management Research Available at: www.ijemr.net
Page Number: 143-146
Detection of Defects in Printed Circuit Boards using Fuzzy Logic and
Correlation Coefficient Neha Koul
1, Dr. Gurmeet Kaur
2, Beant Kaur
3
1M.Tech student in Department of Electronics and Communication Engineering, Punjabi University, Patiala, INDIA
2Professor in Department of Electronics and Communication Engineering, Punjabi University, Patiala, INDIA
3Assistant Professor in Department of Electronics and Communication Engineering, Punjabi University, Patiala, INDIA
ABSTRACT
A Printed Circuit Board (PCB) is a card made
specifically for attaching electronic components on it.
Inspection of PCB is necessary in order to reduce the defects
otherwise it can lead to complete circuit failures. In this paper
we have presented a PCB Inspection System which involves
the use of correlation coefficient and fuzzy logic in order to
detect the defects and the inspection system is applied at the
time of manufacturing, i.e., the making of bare PCB. The
inspection system also gives the degree of defectiveness
present in the PCB. Typical defects that can be detected are
over etchings (opens), under-etchings (shorts), holes etc.
Keywords- correlation coefficient, fuzzy logic, fuzzy
image processing, membership functions.
I. INTRODUCTION
During the manufacturing of PCB there are some
defects commonly found on PCB. These defects are
broadly divided into two categories, potential and fatal
defects. Short-circuit and open-circuit defects are examples
of fatal defects category. Breakout, under etch, missing
hole, and wrong size hole fall in potential defects category.
Fatal defects are those defects in which the PCB does not
meet the objective for which it is designed, while the
potential defects are those which compromise the PCB
performance during utilization [1].
The detection of these defects at an early stage in the
production process is beneficial and avoids multiplication
of cost due to delayed detection of defects. Thus, it is
important to work out a reliable method to detect the
defects in the PCBs. There are many types of defects
which plague printed circuit boards (PCBs). The reason for
this is the immense complexity and miniaturization of
chips which are mass produced in the millions [2]. Each
chip contains thousands of individual systems all working
harmoniously to produce a certain output. Some defects are
caused by impure materials. Another defect is where there
are physical problems with the material [6]. Voids,
fractures, and de-lamination can all combine to reduce or
corrupt PCB performance .In this study correlation coefficient
is used to find whether the PCB is defective or not and if PCB is
found to be defective then its degree of defectiveness is calculated
using correlation coefficient.
II. METHODOLOGY
For the inspection of the printed circuit
boards we first need to have a reference image of a
PCB which is absolutely defect free i.e. defect less.
Then the correlation of the PCB image which is to be
inspected is found with respect to the reference
image. If correlation is found to be zero then PCB is
not defective otherwise PCB is defective.
Figure 1: Reference image
144
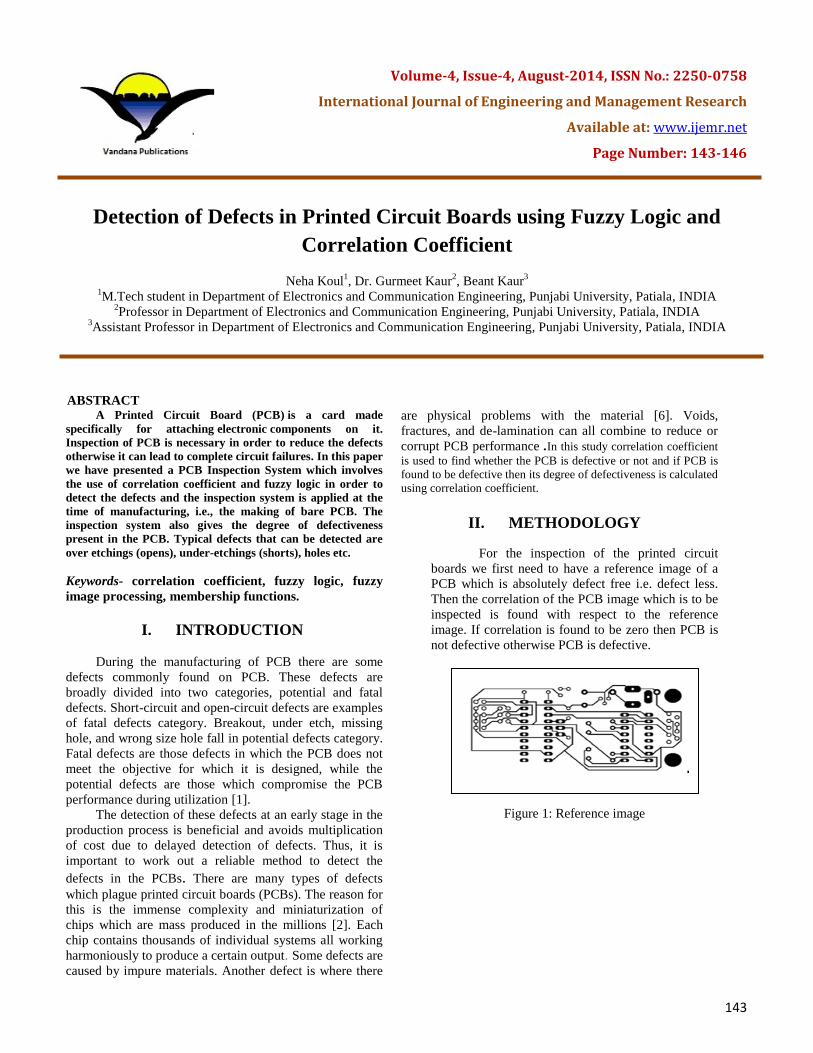
Figure 2: Test Image
Fig. 1 and 2 show the examples of reference
PCB image and test PCB image. The defective image
has a missing joint which is now to be detected [5].
A. Inspection Flow Chart
In our inspection system, we will first find
correlation between the image which is to be
inspected with the reference image. Then the value of
the correlation coefficient will be given to the fuzzy
system whose output will tell the degree of
defectiveness in the PCB.
Fig 3: Inspection Flow Chart
B. Correlation Coefficient Correlation is a measure of the strength and
direction of the linear relationship between two
variables that is defined as the (sample) covariance of
the variables divided by the product of their (sample)
standard deviations. The next step in the inspection
system will be the calculation of the correlation
coefficient. The value of the correlation coefficient
will give the amount of similarity between the
inspected image and the standard image [3]. This
value of correlation will be given input to the fuzzy
system on the basis of which we will calculate the
degree of extent of defectiveness. In the case of
above test PCB image correlation was found to be
0.96. This value is then fed to the fuzzy tool box
which calculates the degree of defectiveness present
in the PCB.
C. Design And Development Of Fuzzy Expert
System
Fuzzy comprises the process of transforming
crisp values into grades of membership functions
for linguistic terms of fuzzy sets. Steps in fuzzy logic
are fuzzification, evaluation of rules and finally
defuzzification. To design the system, the FIS tool in
MATLAB R2013a is used [4].
Fuzzy Image Processing is the collection of
all approaches that understand, represent and process
images, their segments and features as fuzzy sets
.The representation and processing depend on the
selected fuzzy technique and on the problem to be
solved [7]. First, the linguistic values and
corresponding membership functions of input and
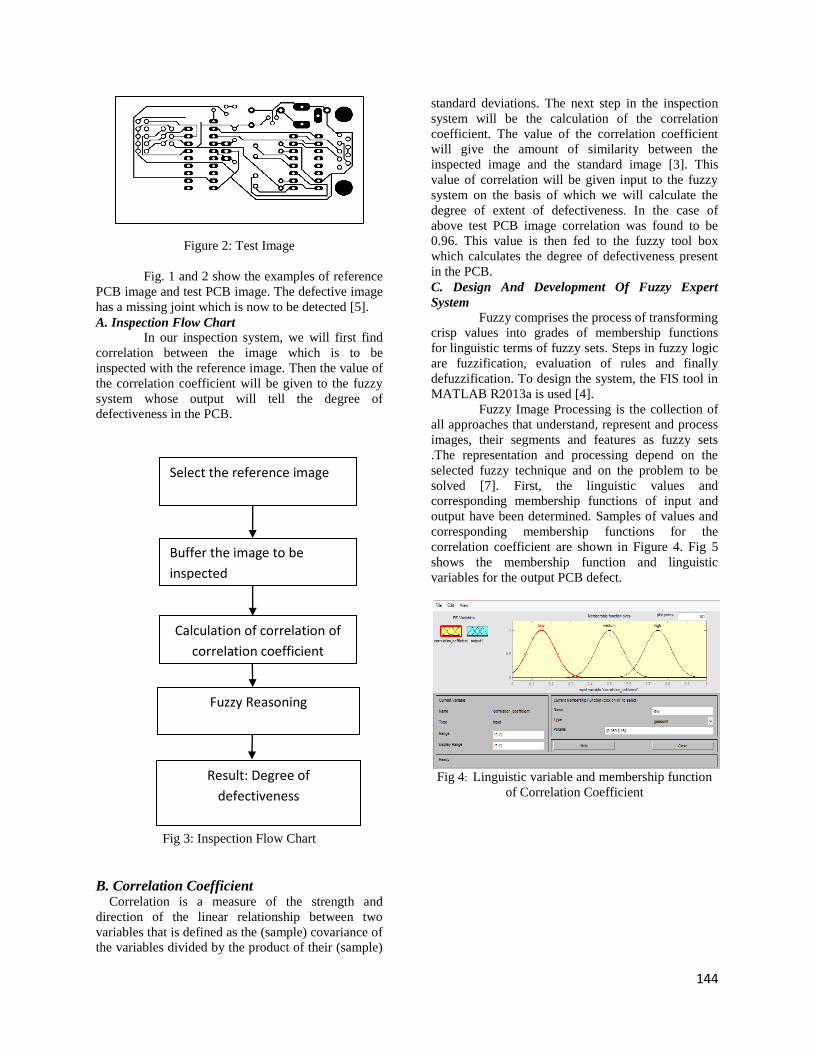
output have been determined. Samples of values and
corresponding membership functions for the
correlation coefficient are shown in Figure 4. Fig 5
shows the membership function and linguistic
variables for the output PCB defect.
Fig 4: Linguistic variable and membership function
of Correlation Coefficient
Select the reference image
Calculation of correlation of
correlation coefficient
Fuzzy Reasoning
Buffer the image to be
inspected
Result: Degree of
defectiveness

145
Fig 5: Linguistic variable and membership function
of PCB defect
The membership function for correlation coefficient
is low, medium and high. All are represented in
Gaussian waveforms. The range of values for low is taken
from 0 to 0.3, for medium it is taken from 0.4 to 0.7 and
for high it has sample values from 0.7 to 1.Then the
output variable and its corresponding membership
functions have been determined. Samples of values and
corresponding membership functions for output are
shown in Figure 5 above. The membership function for
output is low, medium and high [8]. All are represented in
Gaussian waveforms. The range of values for low is taken
from 0 to 0.3, for medium it is taken from 0.4 to 0.7 and
for high it has sample values from 0.7 to 1. Gaussian
waveforms are generally used in fuzzy because the input
is not exact so the range of input can be easily shown
using Gaussian waveform [9].
D. MATLAB 2013
Correlation coefficient is first calculated of the test
image with respect to the reference image and then this
value is fed to the fuzzy system whose output will give
the extent of defectiveness present in the PCB based on
the fuzzy rule base.
III. RESULTS
Fuzzy expert system is used to determine degree of
defectiveness present in the PCB. This design consists of
1input and 1 output. The inputs consist of correlation
coefficient while the output is the extent of defectiveness
present in the PCB. The variables are used like low,
medium and high for input and low, medium and high for
output. The outline of our proposed fuzzy expert system
can be shown in Fig.6. Mamdani method is used for
fuzzification.
Fig 6: Fuzzy Expert System
Rule base is shown in figure 7. Three rules
are used in this system. The rules have been
developed using if-then method. The rules have been
made on the basis of the FAM table given below.
Table 1 : Fuzzy Associative Memory Table
Correlation Defect
Low Highly defective
Medium Medium defective
High Less defective
One Not defective
Fig 7: Rule Base
Using these rules, the result risk in term of
percentage (%) has been computed. Figure 8 shows
the ruler view of the graph obtained between
defectiveness of the PCB against correlation
coefficient. Surface view of the resultant graph is
shown in figure 9.
Fig 8: The ruler view of result rules of fuzzy expert
system

146
Fig 9: Surface view of fuzzy expert system
It is clear from the graphs that as the correlation
coefficient increase the defect in Printed Circuit Board
decreases. As soon as the correlation coefficient becomes
zero the defect also reduces to zero. The PCB above was
found to be 20% defective.
IV. CONCLUSION
The PCB is analyzed and the defects of PCB are
calculated. Due to the use of correlation coefficient the
accuracy of the system is very high. By the use of the
above inspection method we come to know that whether
the PCB is defective or not and if the PCB is found to be
defective its degree of defectiveness is calculated.
V. FUTURE WORK
The proposed method can also be extended to
detection of defects in fabric; wood etc. The reference
image and the image to be tested should have same
alignment. So this alignment problem also has to be
worked upon
REFERENCES
[1] M. Moganti, F. Ercal, C. H. Dagli and S. Tsunekawa,
“Automatic PCB Inspection Algorithms: A Survey”,
Computer Vision and Image Understanding journal,
vol.63,1996. [2] J. F Canny, “A computational approach to edge
detection”, IEEE Transaction on Pattern Analysis and
Machine Intelligence, vol. 8, pp 679-698, 1997. [3] W.Y. Wu, M.J. Wang and C.M. Liu, “Automated
Inspection of Printed Circuit Boards through Machine
Vision”, Computers in Industry, vol.28, no.2, pp.103-
111,1998. [4] Jan Hanca, Adrian Munteanu and Peter Schelkens,
“Segmentation-based Intra Coding Of Depth Maps Using
Texture Information”, proceedings of IEEE conference on
Compression of depth information for 3D rendering , 2013.
[5] G. Rafiee, S.S. Dlay, and W.L. Woo,
“Unsupervised Segmentation of Focused Regions in
Images with Low Depth of Field”, International
Journal of Computer Vision, vol. 70, pp. 109-131,
2013. [6] I. Ibrahim, S.A.R Abu-Bakar, M.M. Mokji et al.
“Performance measurement of thresholding
algorithms in printed circuit board inspection
system”, proceedings of 3rd International Conference
on Computational Intelligence, Modeling and
Simulation,2012.
[7] I. Ibrahim, S. Rahman and Syed, “A Printed
Circuit Board Inspection System with Defect
Classification Capability”, International Journal of
Innovative Management, Information & Production,
Vol. 3, March 2012.
[8] D. Perng, C.Liu, Y. Chen, and C. Chou,
“Advanced PCB Vision Inspection Machine
Development”, Department of Industrial Engineering
and Management National Chiao-Tung University,
15th
IPPR Conference on Computer Vision, Graphics
and Image Processing, 2002. [9] Z.Ye , Prasad, S.Wei Li , “Classification Based
on 3-D DWT and Decision Fusion for Hyperspectral
Image Analysis Geoscience and Remote Sensing
Letters”, proceedings of IEEE conference , 2014.
Copyright © 2011-14. Vandana Publications. All Rights Reserved.

147
![Chapter 3: Fuzzy Rules & Fuzzy Reasoning513].pdf · CH. 3: Fuzzy rules & fuzzy reasoning 1 Chapter 3: Fuzzy Rules & Fuzzy Reasoning ... Application of the extension principle to fuzzy](https://img.dokumen.tips/doc/110x75/5b3ed7b37f8b9a3a138b5aa0/chapter-3-fuzzy-rules-fuzzy-513pdf-ch-3-fuzzy-rules-fuzzy-reasoning.jpg)