Embed Size (px)
Citation preview
Designing for Behavior Change: A Practical Field Guide
January 2017
Designing for Behavior Change: A Practical
Field Guide
The Technical and Operational Performance Support (TOPS) Program is the USAID/Food for Peace-funded learning mechanism that generates, captures, disseminates, and applies the highest quality information, knowledge, and promising practices in development food assistance programming, to ensure that more communities and households benefit from the U.S. Government’s investment in fighting global hunger. Through technical capacity building, a small grants program to fund research, documentation and innovation, and an in-person and online community of practice (the Food Security and Nutrition [FSN] Network), The TOPS Program empowers food security implementers and the donor community to make lasting impact for millions of the world’s most vulnerable people.
Led by Save the Children, The TOPS Program draws on the expertise of its consortium partners: CORE Group (knowledge management), Food for the Hungry (social and behavioral change), Mercy Corps (agriculture and natural resource management), and TANGO International (monitoring and evaluation). Save the Children brings its experience and expertise in commodity management, gender, and nutrition and food technology, as well as the management of this 7-year (2010–2017) US$30 million award.
Disclaimer:
The Technical and Operational Performance Support (TOPS) Program was made possible by the generous support and contribution of the American people through the U.S. Agency for International Development (USAID). The contents of this guide were created by The TOPS Program and do not necessarily reflect the views of USAID or the U.S. Government.
Recommended Citation:
The Technical and Operational Performance Support (TOPS) Technical and Operational Performance Support Program. 2017. Designing for Behavior Change: A Practical Field Guide. Washington, DC: The Technical and Operational Performance Support Program.
Contact:
The Technical and Operational Performance Support (TOPS) Program c/o Save the Children 899 N Capitol Street NE, Suite 900 Washington, DC 20002 [email protected] www.TheTOPSProgram.org
iv
Acknowledgements
This document was informed by Designing for Behavior Change: For Agriculture, Natural
Resource Management, Health and Nutrition, published by The Technical and Operational
Performance Support (TOPS) Program in 2013.
5
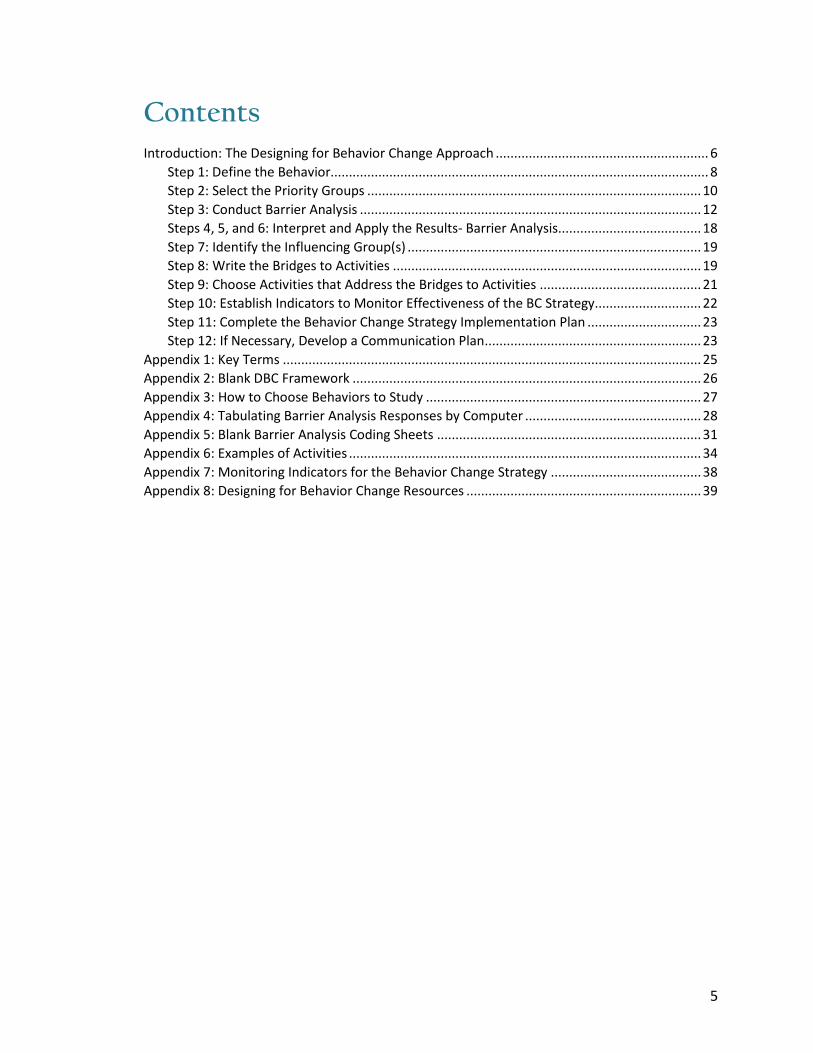
Contents Introduction: The Designing for Behavior Change Approach .......................................................... 6
Step 1: Define the Behavior....................................................................................................... 8 Step 2: Select the Priority Groups ........................................................................................... 10 Step 3: Conduct Barrier Analysis ............................................................................................. 12 Steps 4, 5, and 6: Interpret and Apply the Results- Barrier Analysis ....................................... 18 Step 7: Identify the Influencing Group(s) ................................................................................ 19 Step 8: Write the Bridges to Activities .................................................................................... 19 Step 9: Choose Activities that Address the Bridges to Activities ............................................ 21 Step 10: Establish Indicators to Monitor Effectiveness of the BC Strategy ............................. 22 Step 11: Complete the Behavior Change Strategy Implementation Plan ............................... 23 Step 12: If Necessary, Develop a Communication Plan ........................................................... 23
Appendix 1: Key Terms .................................................................................................................. 25 Appendix 2: Blank DBC Framework ............................................................................................... 26 Appendix 3: How to Choose Behaviors to Study ........................................................................... 27 Appendix 4: Tabulating Barrier Analysis Responses by Computer ................................................ 28 Appendix 5: Blank Barrier Analysis Coding Sheets ........................................................................ 31 Appendix 6: Examples of Activities ................................................................................................ 34 Appendix 7: Monitoring Indicators for the Behavior Change Strategy ......................................... 38 Appendix 8: Designing for Behavior Change Resources ................................................................ 39
6
Introduction: The Designing for Behavior Change Approach
This manual is a condensed reference guide. It is primarily intended for use by those who have been or are being trained in the Designing for Behavior Change (DBC) Approach. It is highly recommended users of this guide also familiarize themselves with the contents of this manual: Designing for Behavior Change: For Agriculture, Natural Resource Management, and Gender
Each step in the DBC process is detailed below, with additional examples and resources in the Annexes. There are five principles of Designing for Behavior Change.
The five principles of Designing for Behavior Change
1. Action/Behavior is what counts (not beliefs or knowledge).
2. Know exactly who your Priority Group is and look at everything from their point of view.
3. People take action when it benefits them; barriers keep people from acting.
4. Activities should reference the important benefits and minimize the most significant barriers.
5. Base all decisions on evidence, not conjecture, and keep checking.
The Designing for Behavior Change (DBC) Approach was developed to help designers think more critically when developing and reviewing a Behavior Change strategy. Using the Approach starts with developing a DBC Framework. It is commonly used in the design phase or during project start-up. The DBC Framework can also be used at midterm if the expected behavior(s) is not changing or not changing at the expected rate. In these cases, researching barriers to change can create greater understanding, and be used to adjust project strategies and activities. Using the DBC Framework at the end of a project can help develop behavior change strategies for the next project or next phase.
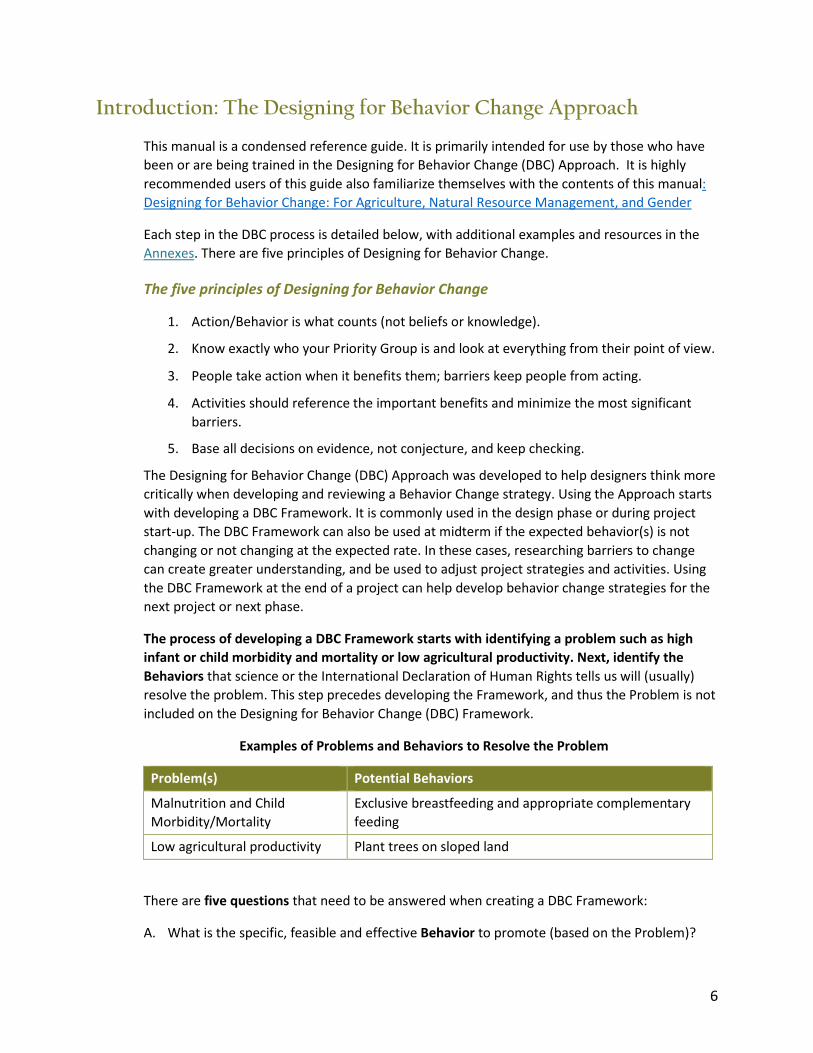
The process of developing a DBC Framework starts with identifying a problem such as high infant or child morbidity and mortality or low agricultural productivity. Next, identify the Behaviors that science or the International Declaration of Human Rights tells us will (usually) resolve the problem. This step precedes developing the Framework, and thus the Problem is not included on the Designing for Behavior Change (DBC) Framework.
Examples of Problems and Behaviors to Resolve the Problem
Problem(s) Potential Behaviors
Malnutrition and Child Morbidity/Mortality
Exclusive breastfeeding and appropriate complementary feeding
Low agricultural productivity Plant trees on sloped land
There are five questions that need to be answered when creating a DBC Framework:
A. What is the specific, feasible and effective Behavior to promote (based on the Problem)?
7
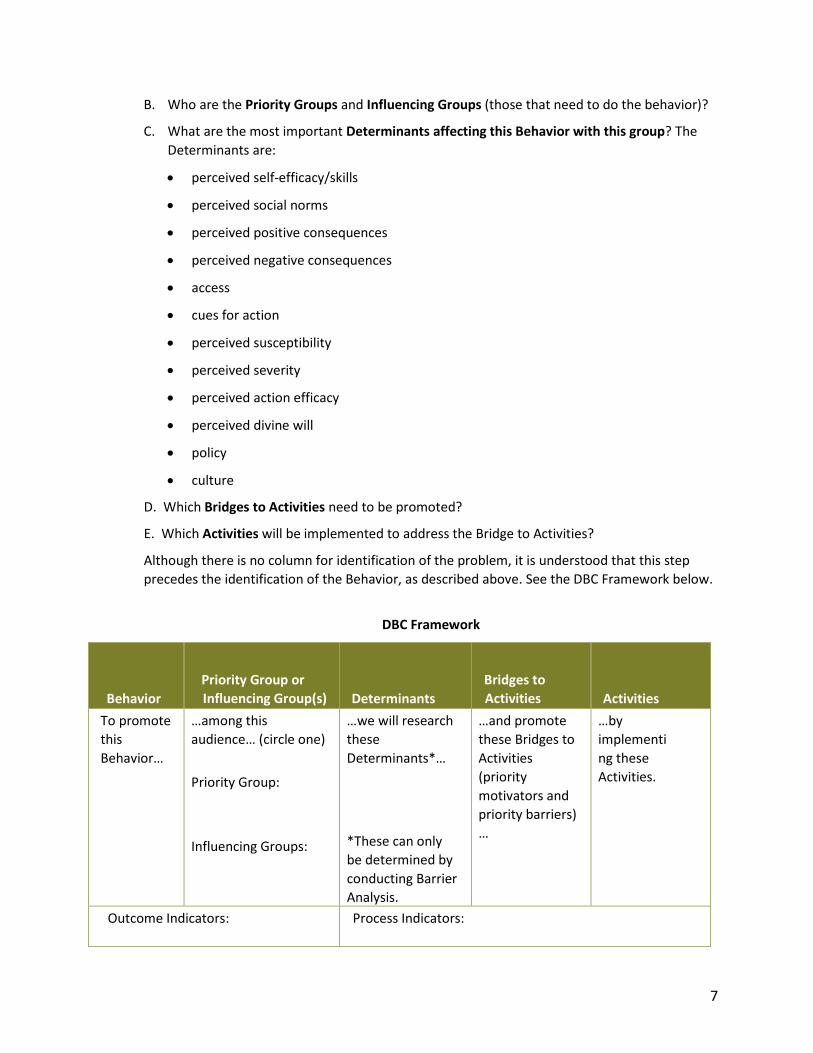
B. Who are the Priority Groups and Influencing Groups (those that need to do the behavior)?
C. What are the most important Determinants affecting this Behavior with this group? The Determinants are:
• perceived self-efficacy/skills
• perceived social norms
• perceived positive consequences
• perceived negative consequences
• access
• cues for action
• perceived susceptibility
• perceived severity
• perceived action efficacy
• perceived divine will
• policy
• culture
D. Which Bridges to Activities need to be promoted?
E. Which Activities will be implemented to address the Bridge to Activities?
Although there is no column for identification of the problem, it is understood that this step precedes the identification of the Behavior, as described above. See the DBC Framework below.
DBC Framework
Behavior Priority Group or Influencing Group(s) Determinants
Bridges to Activities Activities
To promote this Behavior…
…among this audience… (circle one)
Priority Group:
Influencing Groups:
…we will research these Determinants*…
*These can only be determined by conducting Barrier Analysis.
…and promote these Bridges to Activities (priority motivators and priority barriers) …
…by implementing these Activities.
Outcome Indicators: Process Indicators:
8
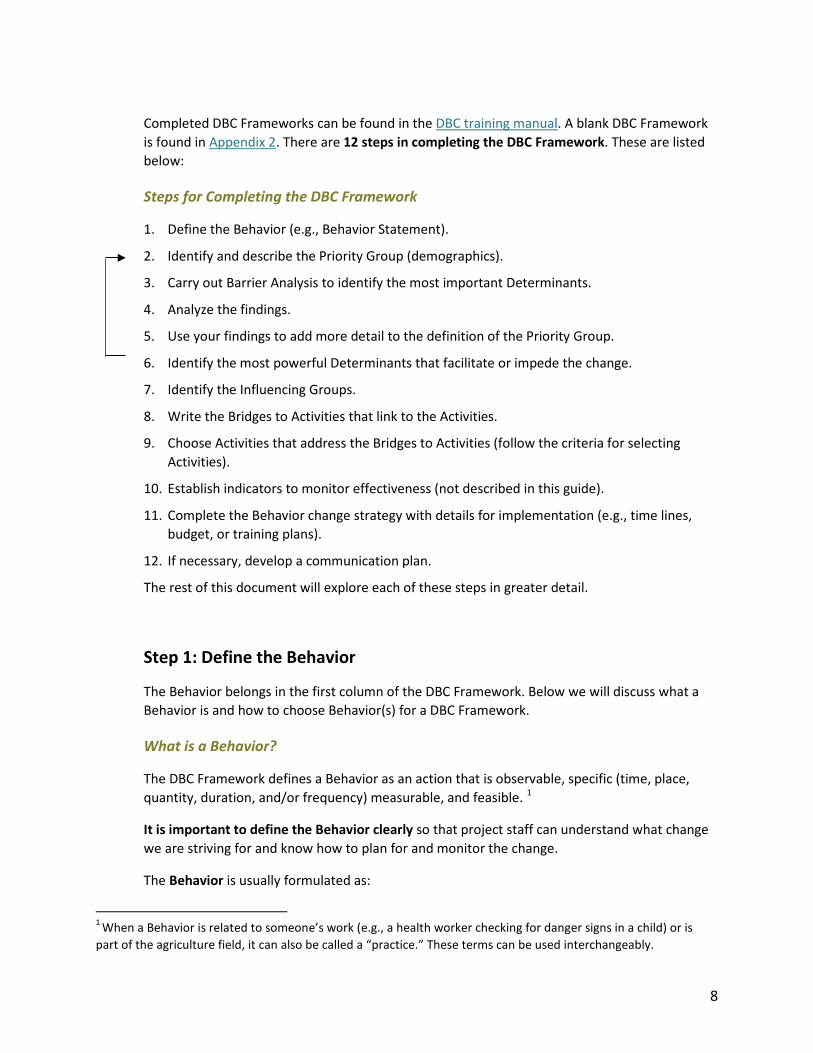
Completed DBC Frameworks can be found in the DBC training manual. A blank DBC Framework is found in Appendix 2. There are 12 steps in completing the DBC Framework. These are listed below:
Steps for Completing the DBC Framework
1. Define the Behavior (e.g., Behavior Statement).
2. Identify and describe the Priority Group (demographics).
3. Carry out Barrier Analysis to identify the most important Determinants.
4. Analyze the findings.
5. Use your findings to add more detail to the definition of the Priority Group.
6. Identify the most powerful Determinants that facilitate or impede the change.
7. Identify the Influencing Groups.
8. Write the Bridges to Activities that link to the Activities.
9. Choose Activities that address the Bridges to Activities (follow the criteria for selecting Activities).
10. Establish indicators to monitor effectiveness (not described in this guide).
11. Complete the Behavior change strategy with details for implementation (e.g., time lines, budget, or training plans).
12. If necessary, develop a communication plan.
The rest of this document will explore each of these steps in greater detail.
Step 1: Define the Behavior
The Behavior belongs in the first column of the DBC Framework. Below we will discuss what a Behavior is and how to choose Behavior(s) for a DBC Framework.
What is a Behavior?
The DBC Framework defines a Behavior as an action that is observable, specific (time, place, quantity, duration, and/or frequency) measurable, and feasible. 1
It is important to define the Behavior clearly so that project staff can understand what change we are striving for and know how to plan for and monitor the change.
The Behavior is usually formulated as:
1 When a Behavior is related to someone’s work (e.g., a health worker checking for danger signs in a child) or is part of the agriculture field, it can also be called a “practice.” These terms can be used interchangeably.
9
Examples of Behaviors
• Mothers of children under 5 years of age wash their hands with soap at the five critical times each day.
• Targeted male and female farmers farming on sloped land plant trees on the hillsides of their land.
How to Choose Behavior(s)
Because it is not practical to create a DBC Framework for all the Behaviors in a project, it is important to think about which Behaviors to study. Some criteria include choosing Behaviors that are particularly hard to change, that have not changed in the past despite promoting change, or whose determinants are unclear. You should always choose Behaviors that are directly linked to the resolution of the Problem (e.g., malnutrition).
Some Behaviors have characteristics that may make them more difficult to promote or adopt. We need to keep this in mind when we are choosing the Behaviors to promote. The harder the Behavior, the more challenging it can be to promote and the more time is needed for change to happen. Some characteristics that may make a Behavior harder to change can include:
• Ongoing or frequent
• Requires complex skills
• Delayed result (or immediate negative result)
• High cost
• Requires a lot of time
• Against social norms
• Resources seldom available
• Requires many people
• Requires many steps
• Requires technology
Appendix 3 has a suggested method for choosing Behaviors. You may find it may be worthwhile to study several Behaviors, and create a DBC Framework for each one.
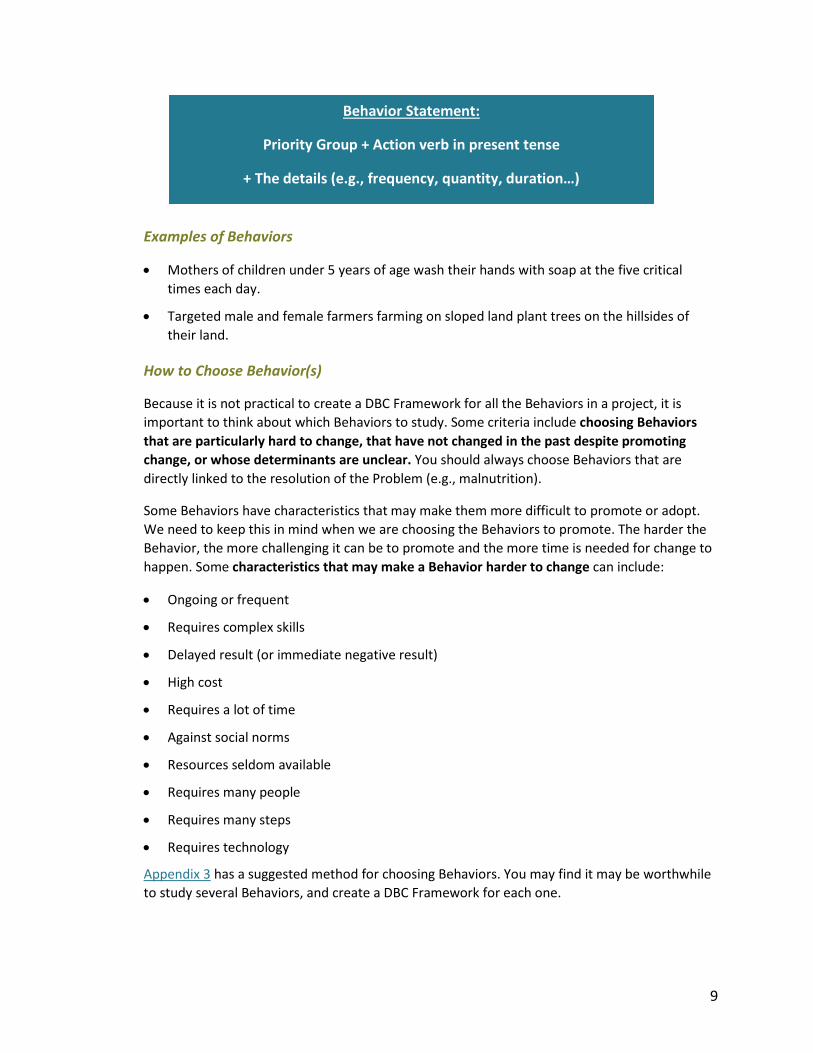
Behavior Statement:
Priority Group + Action verb in present tense
+ The details (e.g., frequency, quantity, duration…)
10
Note: Occasionally during the life of a program, program implementers may wish to get community input. This can be gathered from data collection methods such as focus groups, Positive Deviance Inquiries, or Trials of Improved Practices2 . .
Step 2: Select the Priority Groups
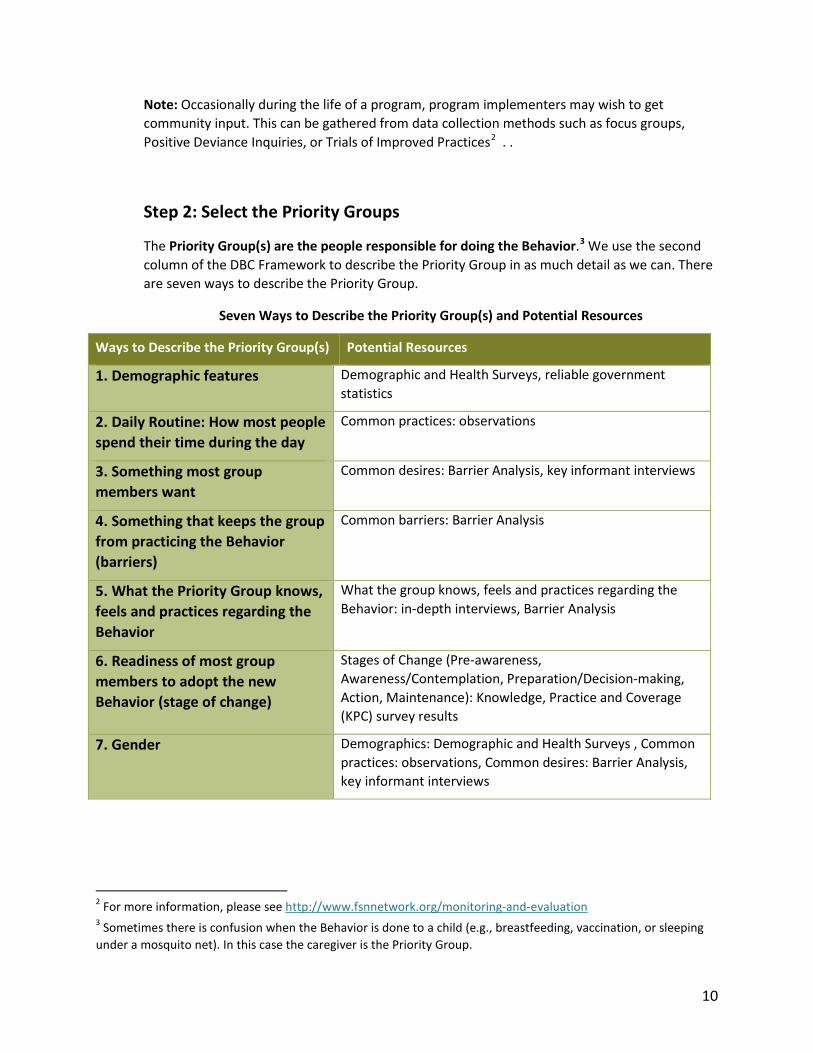
The Priority Group(s) are the people responsible for doing the Behavior.3 We use the second column of the DBC Framework to describe the Priority Group in as much detail as we can. There are seven ways to describe the Priority Group.
Seven Ways to Describe the Priority Group(s) and Potential Resources
Ways to Describe the Priority Group(s) Potential Resources
1. Demographic features Demographic and Health Surveys, reliable government statistics
2. Daily Routine: How most people spend their time during the day
Common practices: observations
3. Something most group members want
Common desires: Barrier Analysis, key informant interviews
4. Something that keeps the group from practicing the Behavior (barriers)
Common barriers: Barrier Analysis
5. What the Priority Group knows, feels and practices regarding the Behavior
What the group knows, feels and practices regarding the Behavior: in-depth interviews, Barrier Analysis
6. Readiness of most group members to adopt the new Behavior (stage of change)
Stages of Change (Pre-awareness, Awareness/Contemplation, Preparation/Decision-making, Action, Maintenance): Knowledge, Practice and Coverage (KPC) survey results
7. Gender Demographics: Demographic and Health Surveys , Common practices: observations, Common desires: Barrier Analysis, key informant interviews
2 For more information, please see http://www.fsnnetwork.org/monitoring-and-evaluation 3 Sometimes there is confusion when the Behavior is done to a child (e.g., breastfeeding, vaccination, or sleeping under a mosquito net). In this case the caregiver is the Priority Group.
11
It is important to look at everything from the Priority Group’s perspective and to have accurate information about the Priority Group. This helps to select the most effective Activities to promote the Behavior.
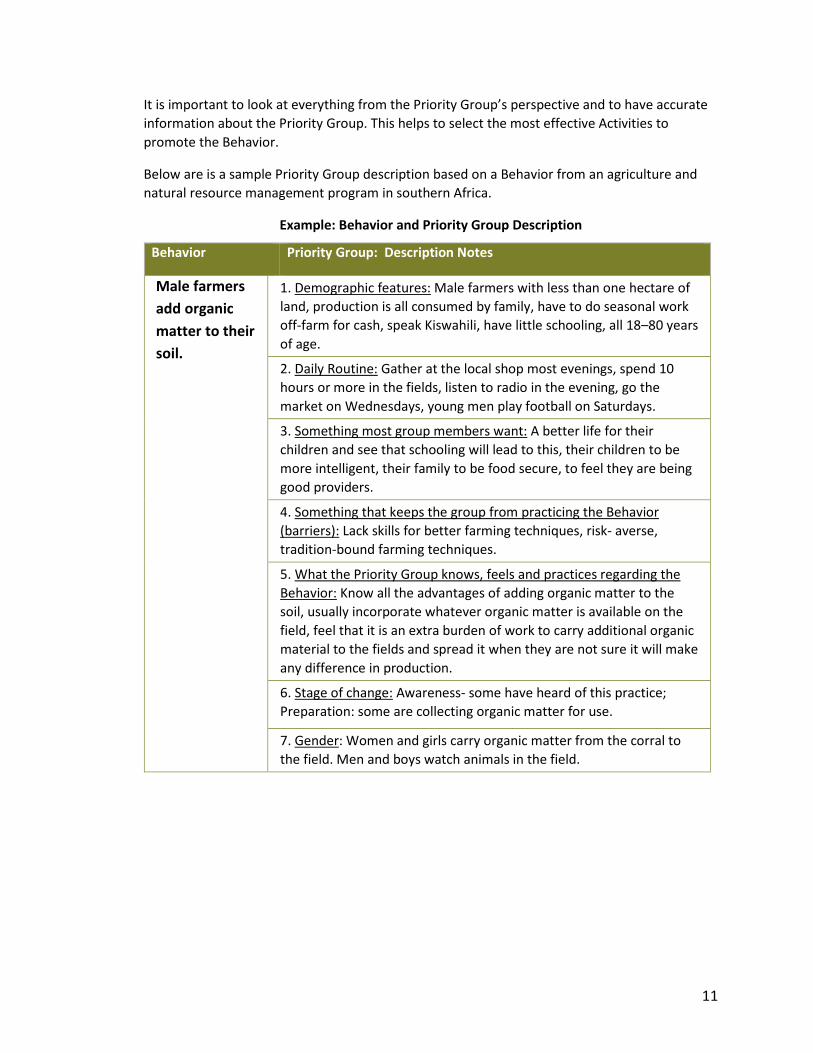
Below are is a sample Priority Group description based on a Behavior from an agriculture and natural resource management program in southern Africa.
Example: Behavior and Priority Group Description
Behavior Priority Group: Description Notes
Male farmers add organic matter to their soil.
1. Demographic features: Male farmers with less than one hectare of land, production is all consumed by family, have to do seasonal work off-farm for cash, speak Kiswahili, have little schooling, all 18–80 years of age.
2. Daily Routine: Gather at the local shop most evenings, spend 10 hours or more in the fields, listen to radio in the evening, go the market on Wednesdays, young men play football on Saturdays.
3. Something most group members want: A better life for their children and see that schooling will lead to this, their children to be more intelligent, their family to be food secure, to feel they are being good providers.
4. Something that keeps the group from practicing the Behavior (barriers): Lack skills for better farming techniques, risk- averse, tradition-bound farming techniques.
5. What the Priority Group knows, feels and practices regarding the Behavior: Know all the advantages of adding organic matter to the soil, usually incorporate whatever organic matter is available on the field, feel that it is an extra burden of work to carry additional organic material to the fields and spread it when they are not sure it will make any difference in production.
6. Stage of change: Awareness- some have heard of this practice; Preparation: some are collecting organic matter for use.
7. Gender: Women and girls carry organic matter from the corral to the field. Men and boys watch animals in the field.
12
Step 3: Conduct Barrier Analysis
There are five tenets of Barrier Analysis that lay the ground work for Step 3.
Five Tenets of Barrier Analysis
1. Just because a person knows what he or she should do does not mean that he or she will do it.
2. Just because a person wants to do a Behavior does not mean that he or she will do it.
3. Just because a person fears a given outcome, it does not mean he or she will take action to prevent it.
4. Many of the actions that people engage in to improve their lives are not necessarily done for the reasons that we promote.
5. If you do not choose the right Behavior to promote, increasing adoption will not make much difference.
A Barrier Analysis is a survey that identifies what is preventing the Priority Group from adopting the Behavior. 4 It also identifies the enablers of the Behavior Change. Responses to survey questionnaires are used to compare those in the Priority Group that do the Behavior (Doers) and those in the Priority Group that do not (Non-doers). It researches the Determinants to Behavior Change, or the reasons people do or do not do the Behavior. There are 12 Determinants in total, but 4 that social scientists have most frequently found to be significant, particularly in health and nutrition. These four Determinants (Determinants 1-4) should always be included in your Barrier Analysis and there are nine others (Determinants 5-13) that may be useful to explore in some contexts.
4 To review the more in-depth guide to Barrier Analysis, review the Practical Guide to Conducting Barrier Analysis.
13
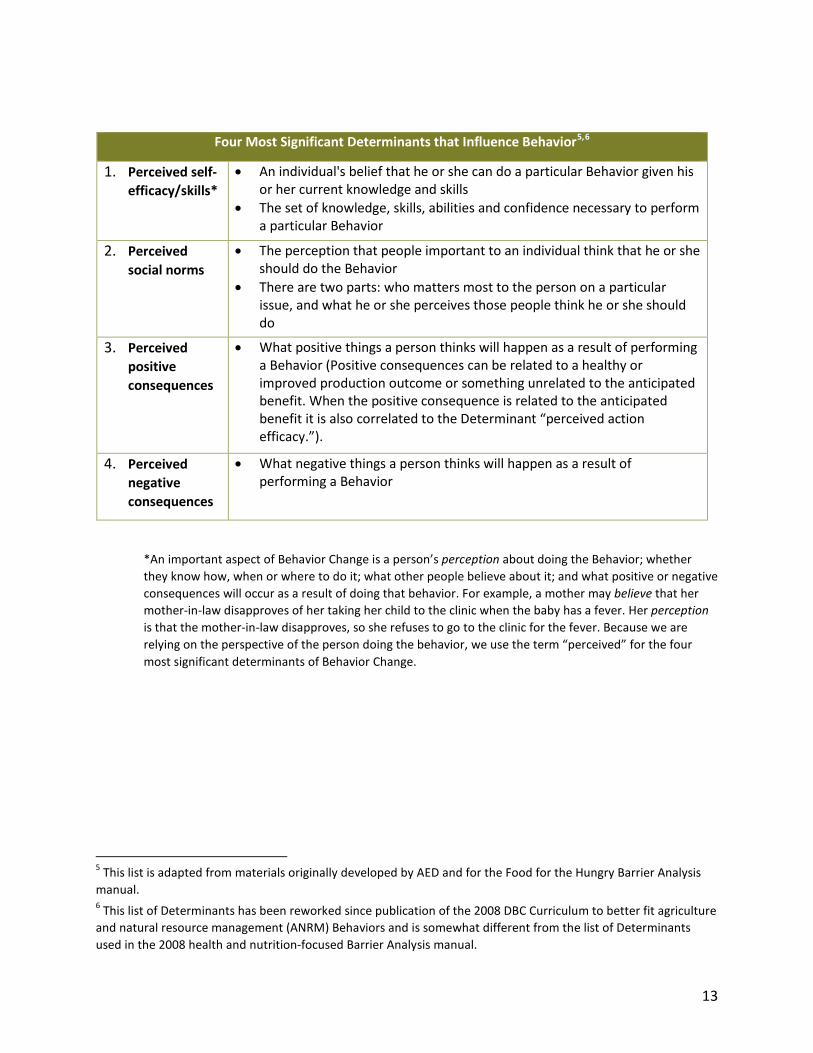
*An important aspect of Behavior Change is a person’s perception about doing the Behavior; whether they know how, when or where to do it; what other people believe about it; and what positive or negative consequences will occur as a result of doing that behavior. For example, a mother may believe that her mother-in-law disapproves of her taking her child to the clinic when the baby has a fever. Her perception is that the mother-in-law disapproves, so she refuses to go to the clinic for the fever. Because we are relying on the perspective of the person doing the behavior, we use the term “perceived” for the four most significant determinants of Behavior Change.
5 This list is adapted from materials originally developed by AED and for the Food for the Hungry Barrier Analysis manual. 6 This list of Determinants has been reworked since publication of the 2008 DBC Curriculum to better fit agriculture and natural resource management (ANRM) Behaviors and is somewhat different from the list of Determinants used in the 2008 health and nutrition-focused Barrier Analysis manual.
Four Most Significant Determinants that Influence Behavior5,6
1. Perceived self-efficacy/skills*
• An individual's belief that he or she can do a particular Behavior given his or her current knowledge and skills
• The set of knowledge, skills, abilities and confidence necessary to perform a particular Behavior
2. Perceived
social norms
• The perception that people important to an individual think that he or she should do the Behavior
• There are two parts: who matters most to the person on a particular issue, and what he or she perceives those people think he or she should do
3. Perceived
positive consequences
• What positive things a person thinks will happen as a result of performing a Behavior (Positive consequences can be related to a healthy or improved production outcome or something unrelated to the anticipated benefit. When the positive consequence is related to the anticipated benefit it is also correlated to the Determinant “perceived action efficacy.”).
4. Perceived negative consequences
• What negative things a person thinks will happen as a result of performing a Behavior
14
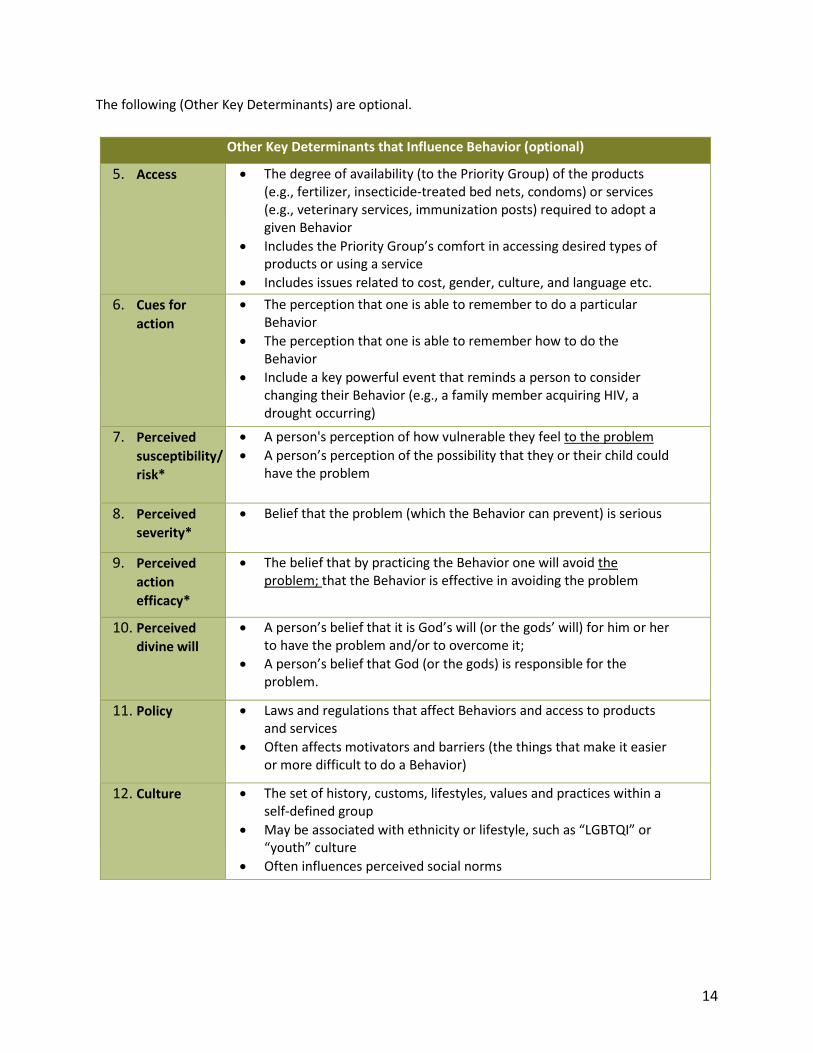
The following (Other Key Determinants) are optional.
Other Key Determinants that Influence Behavior (optional)
5. Access
• The degree of availability (to the Priority Group) of the products (e.g., fertilizer, insecticide-treated bed nets, condoms) or services (e.g., veterinary services, immunization posts) required to adopt a given Behavior
• Includes the Priority Group’s comfort in accessing desired types of products or using a service
• Includes issues related to cost, gender, culture, and language etc. 6. Cues for
action
• The perception that one is able to remember to do a particular Behavior
• The perception that one is able to remember how to do the Behavior
• Include a key powerful event that reminds a person to consider changing their Behavior (e.g., a family member acquiring HIV, a drought occurring)
7. Perceived susceptibility/ risk*
• A person's perception of how vulnerable they feel to the problem • A person’s perception of the possibility that they or their child could
have the problem
8. Perceived severity*
• Belief that the problem (which the Behavior can prevent) is serious
9. Perceived
action efficacy*
• The belief that by practicing the Behavior one will avoid the problem; that the Behavior is effective in avoiding the problem
10. Perceived
divine will
• A person’s belief that it is God’s will (or the gods’ will) for him or her to have the problem and/or to overcome it;
• A person’s belief that God (or the gods) is responsible for the problem.
11. Policy
• Laws and regulations that affect Behaviors and access to products and services
• Often affects motivators and barriers (the things that make it easier or more difficult to do a Behavior)
12. Culture
• The set of history, customs, lifestyles, values and practices within a self-defined group
• May be associated with ethnicity or lifestyle, such as “LGBTQI” or “youth” culture
• Often influences perceived social norms
15
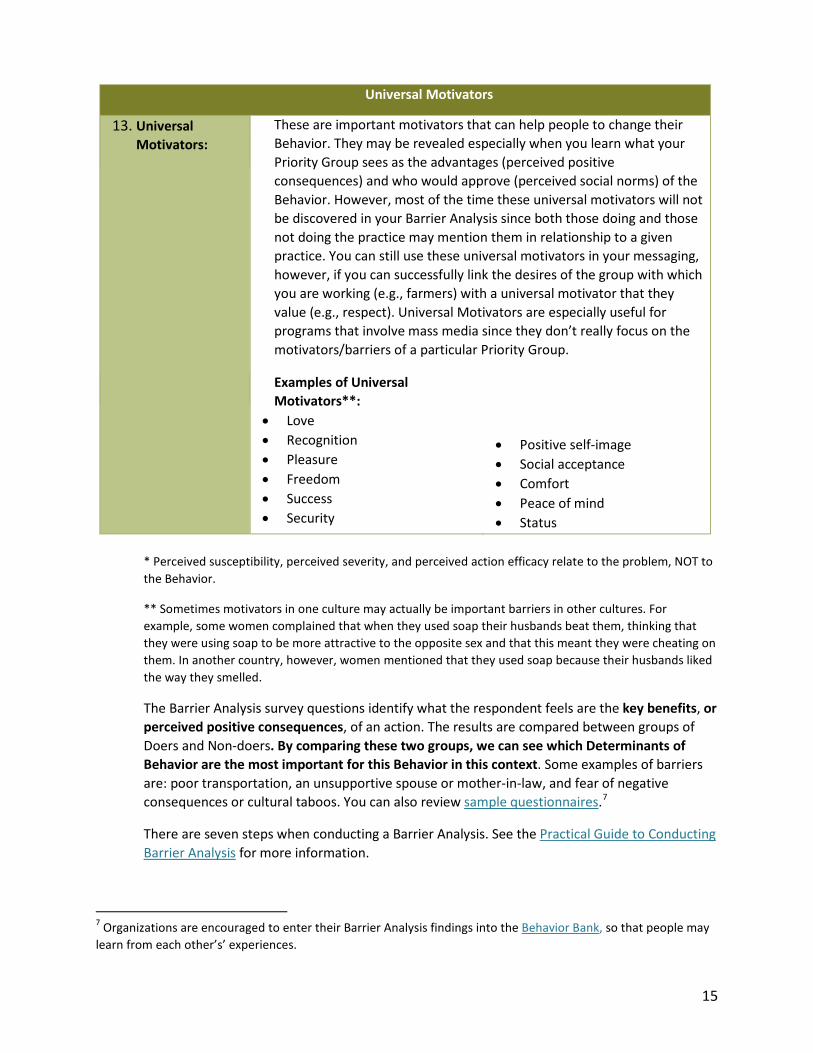
* Perceived susceptibility, perceived severity, and perceived action efficacy relate to the problem, NOT to the Behavior.
** Sometimes motivators in one culture may actually be important barriers in other cultures. For example, some women complained that when they used soap their husbands beat them, thinking that they were using soap to be more attractive to the opposite sex and that this meant they were cheating on them. In another country, however, women mentioned that they used soap because their husbands liked the way they smelled.
The Barrier Analysis survey questions identify what the respondent feels are the key benefits, or perceived positive consequences, of an action. The results are compared between groups of Doers and Non-doers. By comparing these two groups, we can see which Determinants of Behavior are the most important for this Behavior in this context. Some examples of barriers are: poor transportation, an unsupportive spouse or mother-in-law, and fear of negative consequences or cultural taboos. You can also review sample questionnaires.7
There are seven steps when conducting a Barrier Analysis. See the Practical Guide to Conducting Barrier Analysis for more information.
7 Organizations are encouraged to enter their Barrier Analysis findings into the Behavior Bank, so that people may learn from each other’s’ experiences.
Universal Motivators
13. Universal Motivators:
These are important motivators that can help people to change their Behavior. They may be revealed especially when you learn what your Priority Group sees as the advantages (perceived positive consequences) and who would approve (perceived social norms) of the Behavior. However, most of the time these universal motivators will not be discovered in your Barrier Analysis since both those doing and those not doing the practice may mention them in relationship to a given practice. You can still use these universal motivators in your messaging, however, if you can successfully link the desires of the group with which you are working (e.g., farmers) with a universal motivator that they value (e.g., respect). Universal Motivators are especially useful for programs that involve mass media since they don’t really focus on the motivators/barriers of a particular Priority Group.
Examples of Universal Motivators**:
• Love • Recognition • Pleasure • Freedom • Success • Security
• Positive self-image • Social acceptance • Comfort • Peace of mind • Status
16
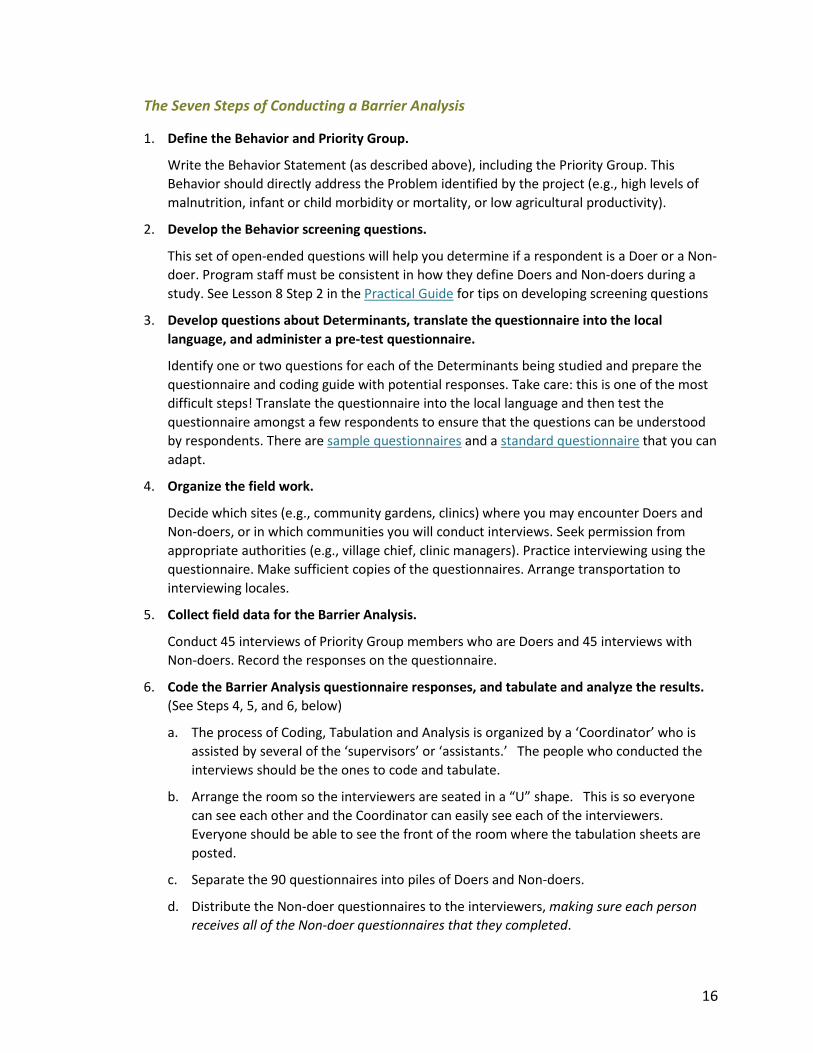
The Seven Steps of Conducting a Barrier Analysis
1. Define the Behavior and Priority Group.
Write the Behavior Statement (as described above), including the Priority Group. This Behavior should directly address the Problem identified by the project (e.g., high levels of malnutrition, infant or child morbidity or mortality, or low agricultural productivity).
2. Develop the Behavior screening questions.
This set of open-ended questions will help you determine if a respondent is a Doer or a Non-doer. Program staff must be consistent in how they define Doers and Non-doers during a study. See Lesson 8 Step 2 in the Practical Guide for tips on developing screening questions
3. Develop questions about Determinants, translate the questionnaire into the local language, and administer a pre-test questionnaire.
Identify one or two questions for each of the Determinants being studied and prepare the questionnaire and coding guide with potential responses. Take care: this is one of the most difficult steps! Translate the questionnaire into the local language and then test the questionnaire amongst a few respondents to ensure that the questions can be understood by respondents. There are sample questionnaires and a standard questionnaire that you can adapt.
4. Organize the field work.
Decide which sites (e.g., community gardens, clinics) where you may encounter Doers and Non-doers, or in which communities you will conduct interviews. Seek permission from appropriate authorities (e.g., village chief, clinic managers). Practice interviewing using the questionnaire. Make sufficient copies of the questionnaires. Arrange transportation to interviewing locales.
5. Collect field data for the Barrier Analysis.
Conduct 45 interviews of Priority Group members who are Doers and 45 interviews with Non-doers. Record the responses on the questionnaire.
6. Code the Barrier Analysis questionnaire responses, and tabulate and analyze the results. (See Steps 4, 5, and 6, below)
a. The process of Coding, Tabulation and Analysis is organized by a ‘Coordinator’ who is assisted by several of the ‘supervisors’ or ‘assistants.’ The people who conducted the interviews should be the ones to code and tabulate.
b. Arrange the room so the interviewers are seated in a “U” shape. This is so everyone can see each other and the Coordinator can easily see each of the interviewers. Everyone should be able to see the front of the room where the tabulation sheets are posted.
c. Separate the 90 questionnaires into piles of Doers and Non-doers.
d. Distribute the Non-doer questionnaires to the interviewers, making sure each person receives all of the Non-doer questionnaires that they completed.
17
e. Ask interviewers to place the questionnaires facing up and outward toward the middle of the “U.”
f. The Coordinator and Supervisors then counts all of the Non-Doer questionnaires (making sure they are all Non-doers) and marks this number on the top of the tally sheet where everyone can see it (e.g., Non- Doers = 47).
g. Collect all of the Non-doer questionnaires and distribute all the Doer questionnaires to the interviewer who completed them.
h. Repeat the counting process for the Doer questionnaires. These numbers will become the denominators used to calculate percentages.
i. There will be several questionnaires per interviewer.
j. Interviewers should place the questionnaires in front of them, flat on the table and not overlapping so it is easy to read the responses to the questions from each questionnaire at the same time.
Note: If there were only a few interviewers (optimal number is 15–20), each interviewer could have more than five Doer or Non-doer questionnaires. Since it may be difficult for one interviewer to work on more than three or four questionnaires at a time, the Coordinator may want to code in two rounds (two for the Doers and two for the Non-doers, depending on the total number of people coding and tabulating).
k. With each interviewer sitting with his/her questionnaires in front of him/her, the Coordinator looks around the room and identifies the people who have the greatest number of questionnaires. (Usually there will be a few interviewers who interviewed more respondents.) Starting with the first question in Section B of the questionnaire, the Coordinator asks them to look at the responses to the first question (Section B) and identify the responses that have similar/the same meaning. Ask all the interviewers to listen carefully to the others as they share the responses on their questionnaires. This will avoid repetition and make the process go faster.
l. When an interviewer with many questionnaires shares a common response found on 2–3 of his questionnaires, s/he will share that with the group and the Coordinator will ask the entire group if others have similar responses to this question on their questionnaires. If many people have similar responses, then the Coordinator will decide to make a code and s/he will suggest a few words – usually using words that are common to several responses - that represent the common meaning of those responses. This is the Code. The code will be written on the tabulation sheet under that question and labeled as “A.”
m. Everyone who has a response from the question being considered that falls into the category represented by the Code will mark that response as “A.” Once it is associated with a code it cannot be associated with any other Code (though it can be re-categorized later if another, more accurate code is created).
n. Each interviewer’s objective is to classify (associate with a Code) as many responses on his/her questionnaires as possible.
18
Note: For responses that are very similar in meaning, include them in the same code as other similar responses. For example, for the question “What are the advantages of exercise?” answers could be “being fit” and “staying in shape.” These are two different responses but they have the same meaning, so they both fit in one code. Only do this for responses where you are reasonably certain the respondents meant the same thing.
o. Repeat this process for each of the open-ended questions in Section B.
p. For the closed-ended questions the “codes” are already included on the questionnaire. Therefore, the Coordinator simply counts the number of responses for each “code” and marks this on the tabulation sheet. Keep in mind that for the closed-ended questions, the total need to add up to the total number of questionnaires for that type of respondent (Doer or Non-doer). To tabulate results by computer, see the instructions in Appendix 4.
Tabulating and Analyzing: See Steps 4, 5, and 6: Interpret and Apply the Results- Barrier Analysis, below.
7. Use the results to write Bridges to Activities in the DBC Framework.
See Step 8: Write the Bridges to Activities below.
Steps 4, 5, and 6: Interpret and Apply the Results- Barrier Analysis
Note that coding the responses (grouping similar responses into categories) is the first step before tabulation or analysis can take place; see Step 3 for Conducting a Barrier Analysis above.
Tabulating the Results
Looking at the Coding Sheet in Appendix 5, write the number of people and percentage of respondents (for Doers and Non-doers) who gave each response. These results can be entered into a computerized tabulation sheet using the instructions which will reveal statistically significant responses. If you do, you can skip to the next section, Apply the Results (see below). If you choose to analyze the results manually continue on with the section below.
Analyzing the Results, without Computerized Tabulation
Compare the answers of the Doers and Non-doers for each response. Look for differences that are 15 percentage points or more between Doers and Non-doers. These responses are statistically significant (and only these responses should be used to write Bridges to Activities; see Step 8, below). There are several things to consider:
• Doers may mention a barrier more than Non-doers; Doers may have only discovered that barrier once they began practicing the Behavior. This is helpful to know, not for how the Behavior is promoted, but for the counseling given to people who are recent adopters of the Behavior. Doers may mention barriers that did not keep them from adopting the practice.
• Non-doers may mention benefits that were not mentioned by Doers. They may imagine benefits of a Behavior that they have not yet adopted. These could be benefits that did not
19
materialize for Doers once they adopt the Behavior. They are also not important enough for the Non-doer to have adopted the Behavior. There is no need to create Bridges for these benefits, even if they are significant, since they did not lead to a change in Behavior for Non-doers.
• Not all 15 point differences between Doers and Non-doers are true differences; some are due to chance, while some differences of fewer than 15 points are true differences. Use the computerized tabulation worksheet and instructions to identify which responses are significant if you want to confirm the validity of your findings. The spread sheet tells you how much more likely a Doer or Non-doer is to give a particular response. Knowing that, it will be easier to decide which Determinants deserve more attention.
Apply the Results: Use the Findings to Add More Detail to the Priority Group Description- Barrier Analysis
Barrier Analysis findings are used to add more detail to the Priority Group in the DBC Framework. Recall that there are six ways to describe the Priority Group. Barrier Analysis can be used to augment points 3, 4 and 5 below .
1. Demographics: Demographic and Agricultural Surveys, reliable government statistics
2. Common practices: observations
3. Common desires: Barrier Analysis, key informant interviews
4. Common barriers: Barrier Analysis
5. What the group knows, feels and practices regarding the Behavior: in-depth interviews, Barrier Analysis
6. Stages of Change: Knowledge, Practice and Coverage (KPC) survey results
Step 7: Identify the Influencing Group(s)
In your Barrier Analysis, the responses to the questions “Who Approves?” and “Who Disapproves?” may reveal Influencing Group(s). The Influencing Group(s) influence the Priority Group regarding the Behavior and can either support or prevent the Priority Group from adopting Behaviors. They are usually very close to the Priority Group, such as someone’s mother-in-law, or spouse. If an Influencing Group was identified, this group should be written in the second column of the DBC Framework.
Step 8: Write the Bridges to Activities
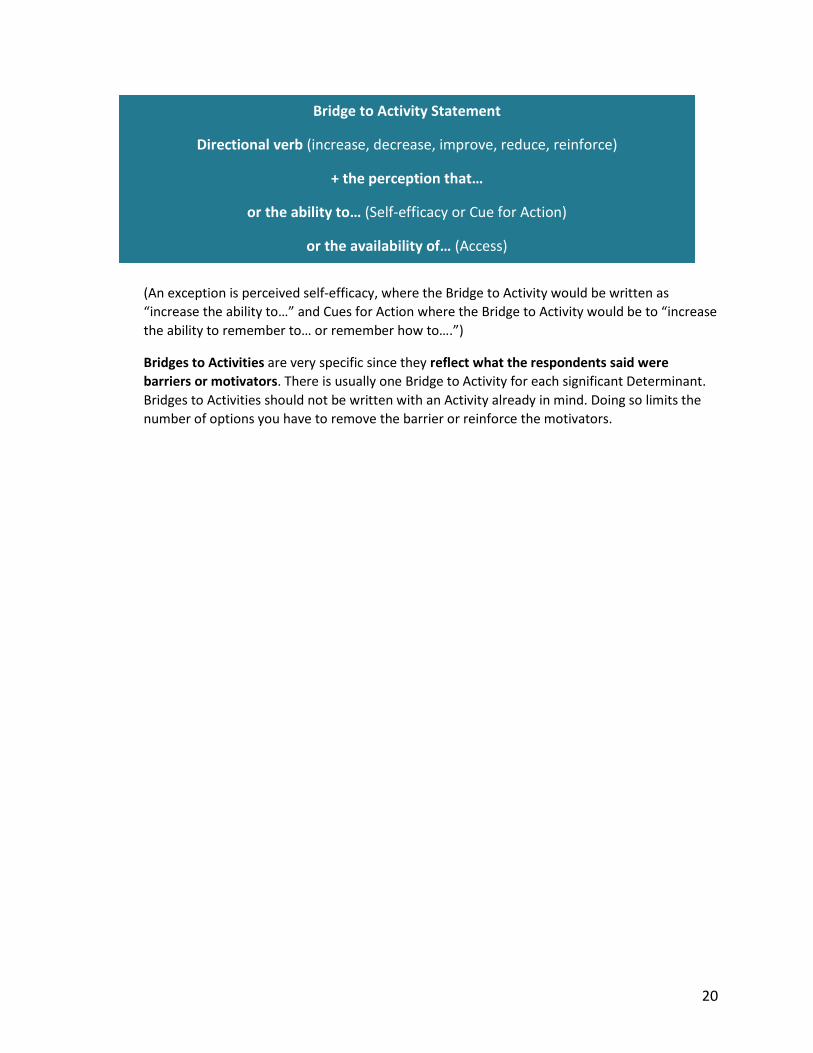
A Bridge to Activity usually begins with a directional verb (such as increase, decrease, improve, or reinforce) and often proposes to change the perception of the Priority Group, based on the Barrier Analysis results.
20
(An exception is perceived self-efficacy, where the Bridge to Activity would be written as “increase the ability to…” and Cues for Action where the Bridge to Activity would be to “increase the ability to remember to… or remember how to….”)
Bridges to Activities are very specific since they reflect what the respondents said were barriers or motivators. There is usually one Bridge to Activity for each significant Determinant. Bridges to Activities should not be written with an Activity already in mind. Doing so limits the number of options you have to remove the barrier or reinforce the motivators.
Bridge to Activity Statement
Directional verb (increase, decrease, improve, reduce, reinforce)
+ the perception that…
or the ability to… (Self-efficacy or Cue for Action)
or the availability of… (Access)
21
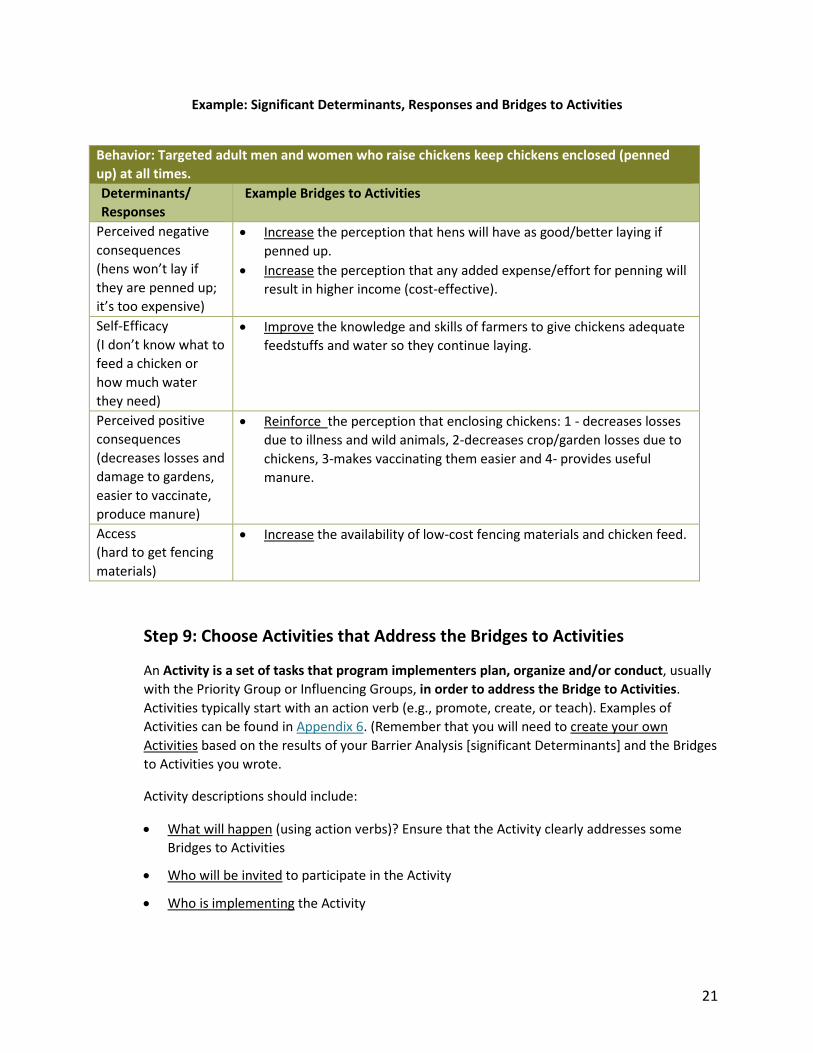
Example: Significant Determinants, Responses and Bridges to Activities
Step 9: Choose Activities that Address the Bridges to Activities
An Activity is a set of tasks that program implementers plan, organize and/or conduct, usually with the Priority Group or Influencing Groups, in order to address the Bridge to Activities. Activities typically start with an action verb (e.g., promote, create, or teach). Examples of Activities can be found in Appendix 6. (Remember that you will need to create your own Activities based on the results of your Barrier Analysis [significant Determinants] and the Bridges to Activities you wrote.
Activity descriptions should include:
• What will happen (using action verbs)? Ensure that the Activity clearly addresses some Bridges to Activities
• Who will be invited to participate in the Activity
• Who is implementing the Activity
Behavior: Targeted adult men and women who raise chickens keep chickens enclosed (penned up) at all times. Determinants/ Responses
Example Bridges to Activities
Perceived negative consequences (hens won’t lay if they are penned up; it’s too expensive)
• Increase the perception that hens will have as good/better laying if penned up.
• Increase the perception that any added expense/effort for penning will result in higher income (cost-effective).
Self-Efficacy (I don’t know what to feed a chicken or how much water they need)
• Improve the knowledge and skills of farmers to give chickens adequate feedstuffs and water so they continue laying.
Perceived positive consequences (decreases losses and damage to gardens, easier to vaccinate, produce manure)
• Reinforce the perception that enclosing chickens: 1 - decreases losses due to illness and wild animals, 2-decreases crop/garden losses due to chickens, 3-makes vaccinating them easier and 4- provides useful manure.
Access (hard to get fencing materials)
• Increase the availability of low-cost fencing materials and chicken feed.
22
• How frequently the Activity will be implemented with the priority group (and possibly others)
• Where the Activity will take place
• What follow-up will be needed
• What visual aids or tools will be needed
• Any opportunities to invite the Priority Group to make a commitment to trying out the Behavior
There are three must-have criteria for an Activity to succeed:
1. Relevance to the bridges to activities
• The activity directly addresses the bridges to activities for the desired Behavior change.
• It is possible, and in fact desirable, for an activity to address multiple bridges to activities.
• Example: If the Bridge to Activity is “Increase availability of quality seeds” but the Activity focus is on an increase in knowledge about fertilizers, Behavior change may not occur because the Bridge to Activity was not addressed by the Activity. Holding a seed fair, on the other hand, may address the Bridge to Activity (and the Determinant).
2. Feasibility
• The activity is capable of being implemented within the ecological and geographical context by most of the people in the priority group.
• Example: Daily meetings for people who live very far apart from each other may be inappropriate. Monthly meetings might be more feasible.
3. Receptivity of priority group
• The activity is appropriate within the cultural and social context.
As with any project, other criteria to consider when designing activities include cost-effectiveness, capacity, resources, scalability, and sustainability. In addition, it is important to consider the policy environment, existing infrastructure that could be built upon, and how the activity will reach or impact the most vulnerable among the Priority Group (mothers under the age of 18 with children under age 24 months of age).
Step 10: Establish Indicators to Monitor Effectiveness of the BC Strategy
A monitoring system allows you to monitor and evaluate the progress of a Behavior Change strategy. It is part of your overall monitoring system, not separate from it. So, to the extent possible, program designers should use methods of measurement that already exist, such as
23
Knowledge, Practice, and Coverage (KPC) surveys, mini-KPCs, Lot Quality Assurance Sampling (LQAS); agriculture extension records; and clinic records for health and nutrition.8
Not all Behaviors, Activities, outcomes and other aspects of a Behavior Change strategy need to be monitored at the same frequency. There are many factors that influence the timing of monitoring activities. Some of these include: correspondence with the program-wide monitoring system, the frequency of the planned Activity, how difficult it is to change the Behavior and the availability of staff.
If both the Priority Group and Influencing Groups are being reached and quality Activities (see the output indicators) are implemented but the Behavior is not changing, program planners should first reassess the appropriateness of the Activities selected, then reassess Bridges to Activities through Barrier Analysis.
See Appendix 7 to see a visual depiction of these concepts.
Step 11: Complete the Behavior Change Strategy Implementation Plan
A strategy is comprised of several Activities, each of which is designed to minimize barriers and maximize benefits. A strategy also takes into account the types of Priority Groups with which you will work, the set of Activities and any synergies between Activities. For example, if community theater is being used to address fear of side effects with family planning methods, it can also be used to reinforce other key messages, such as nutrition and women’s rights.
The strategy becomes an implementation plan when you add information, such as responsible parties, timeframes, resources, and monitoring and evaluation (M&E) methods and indicators. See Task 19 Day Six in the Designing for Behavior Change manual for a Framework for a Behavior change strategy implementation plan.
Step 12: If Necessary, Develop a Communication Plan
As we know, knowledge alone is not likely to result in behavior change. This is because most of the activities we currently use are designed to simply give people facts, such as the advantages of a Behavior.
Rather than focus on only one of the 12 Determinants, we can use the results of the Barrier Analysis to help us develop what we call Determinant-based messages. This means creating messages that address the barriers and motivators revealed by the study.
Messages should:
8 A discussion of monitoring and evaluation systems in general is beyond the scope of this document. For more information, please see www.fsnnetwork.org/monitoring-and-evaluation.
24
• Name the specific audience concerned by the message
• Be based on the formative research (significant Determinants and Bridges to Activities)
• Be short
• Use the imperative (command) form of the verb
• Not be too literal (not word-for-word or preachy)
• Not include basic information about advantages that the audience already knows (for example, do not say, “Use insecticide-treated bed nets to prevent malaria”)
• Address the significant findings of the formative research.
Example: “Mothers! All mothers have enough milk to give only breast milk to their baby until six months. Eat well and watch your baby grow!” (Self-efficacy/skills)
25
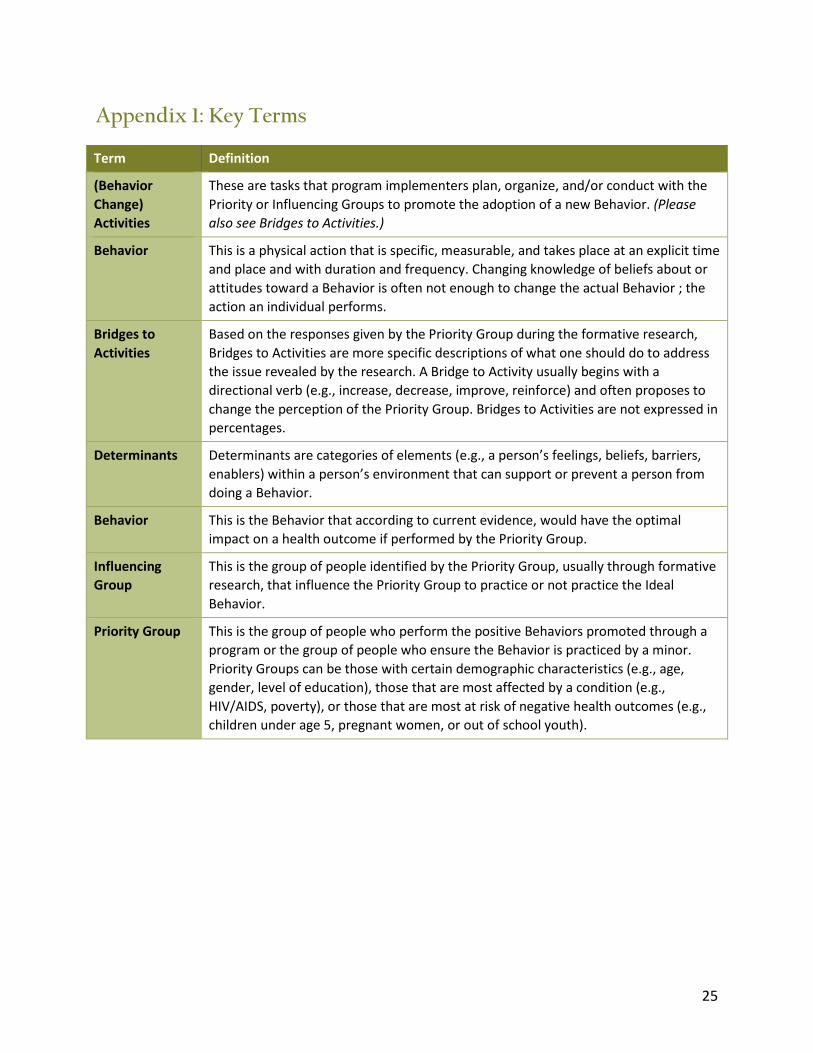
Appendix 1: Key Terms
Term Definition
(Behavior Change) Activities
These are tasks that program implementers plan, organize, and/or conduct with the Priority or Influencing Groups to promote the adoption of a new Behavior. (Please also see Bridges to Activities.)
Behavior This is a physical action that is specific, measurable, and takes place at an explicit time and place and with duration and frequency. Changing knowledge of beliefs about or attitudes toward a Behavior is often not enough to change the actual Behavior ; the action an individual performs.
Bridges to Activities
Based on the responses given by the Priority Group during the formative research, Bridges to Activities are more specific descriptions of what one should do to address the issue revealed by the research. A Bridge to Activity usually begins with a directional verb (e.g., increase, decrease, improve, reinforce) and often proposes to change the perception of the Priority Group. Bridges to Activities are not expressed in percentages.
Determinants Determinants are categories of elements (e.g., a person’s feelings, beliefs, barriers, enablers) within a person’s environment that can support or prevent a person from doing a Behavior.
Behavior This is the Behavior that according to current evidence, would have the optimal impact on a health outcome if performed by the Priority Group.
Influencing Group
This is the group of people identified by the Priority Group, usually through formative research, that influence the Priority Group to practice or not practice the Ideal Behavior.
Priority Group This is the group of people who perform the positive Behaviors promoted through a program or the group of people who ensure the Behavior is practiced by a minor. Priority Groups can be those with certain demographic characteristics (e.g., age, gender, level of education), those that are most affected by a condition (e.g., HIV/AIDS, poverty), or those that are most at risk of negative health outcomes (e.g., children under age 5, pregnant women, or out of school youth).
26
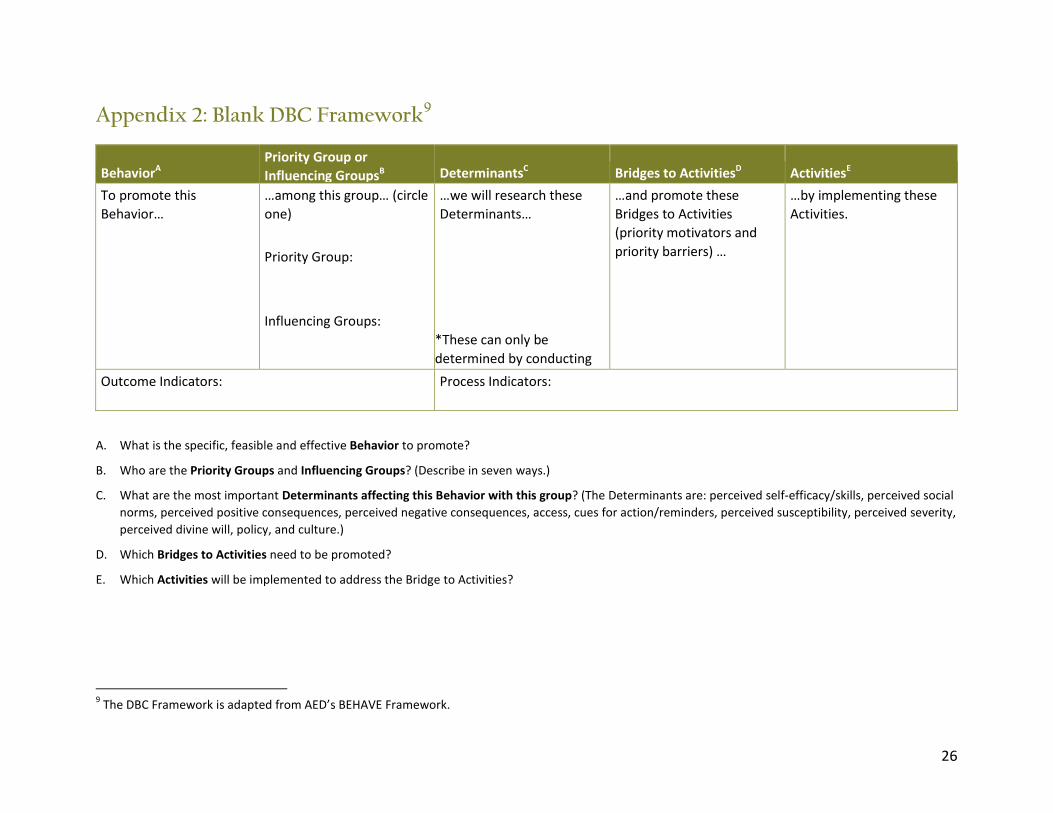
Appendix 2: Blank DBC Framework9
BehaviorA Priority Group or Influencing GroupsB DeterminantsC Bridges to ActivitiesD ActivitiesE
To promote this Behavior…
…among this group… (circle one) Priority Group: Influencing Groups:
…we will research these Determinants…
*These can only be determined by conducting
…and promote these Bridges to Activities (priority motivators and priority barriers) …
…by implementing these Activities.
Outcome Indicators: Process Indicators:
A. What is the specific, feasible and effective Behavior to promote?
B. Who are the Priority Groups and Influencing Groups? (Describe in seven ways.)
C. What are the most important Determinants affecting this Behavior with this group? (The Determinants are: perceived self-efficacy/skills, perceived social norms, perceived positive consequences, perceived negative consequences, access, cues for action/reminders, perceived susceptibility, perceived severity, perceived divine will, policy, and culture.)
D. Which Bridges to Activities need to be promoted?
E. Which Activities will be implemented to address the Bridge to Activities?
9 The DBC Framework is adapted from AED’s BEHAVE Framework.
27
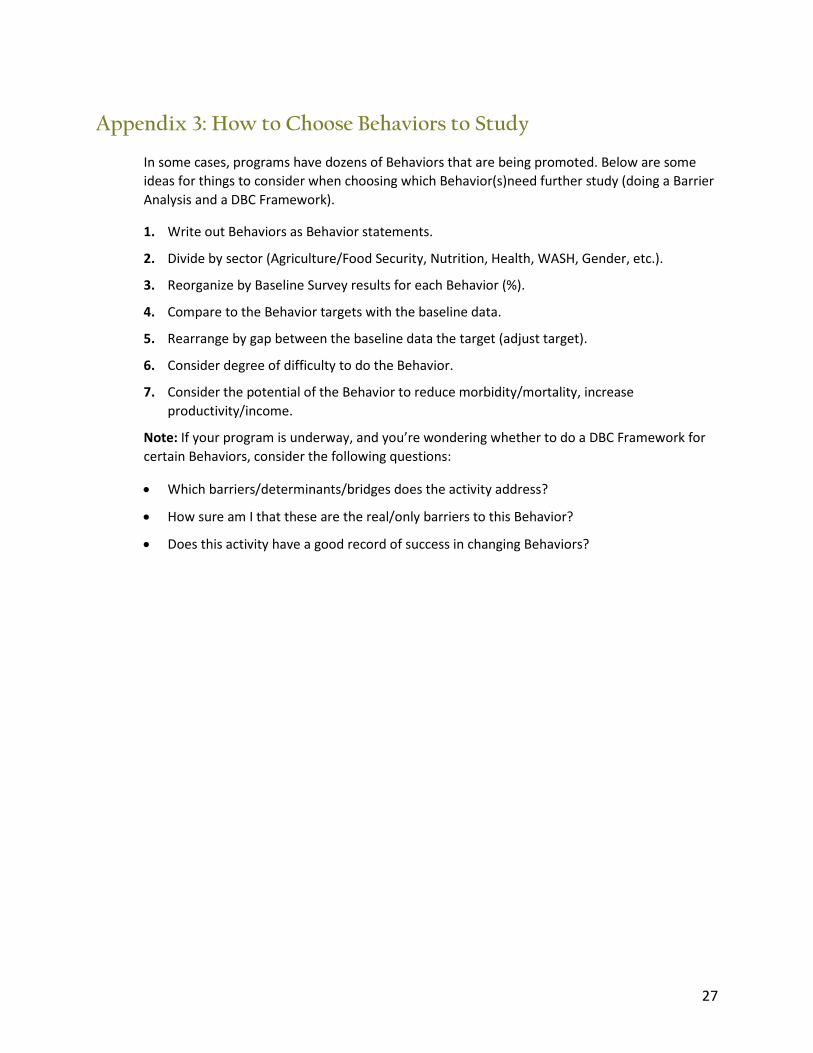
Appendix 3: How to Choose Behaviors to Study
In some cases, programs have dozens of Behaviors that are being promoted. Below are some ideas for things to consider when choosing which Behavior(s)need further study (doing a Barrier Analysis and a DBC Framework).
1. Write out Behaviors as Behavior statements.
2. Divide by sector (Agriculture/Food Security, Nutrition, Health, WASH, Gender, etc.).
3. Reorganize by Baseline Survey results for each Behavior (%).
4. Compare to the Behavior targets with the baseline data.
5. Rearrange by gap between the baseline data the target (adjust target).
6. Consider degree of difficulty to do the Behavior.
7. Consider the potential of the Behavior to reduce morbidity/mortality, increase productivity/income.
Note: If your program is underway, and you’re wondering whether to do a DBC Framework for certain Behaviors, consider the following questions:
• Which barriers/determinants/bridges does the activity address?
• How sure am I that these are the real/only barriers to this Behavior?
• Does this activity have a good record of success in changing Behaviors?
28
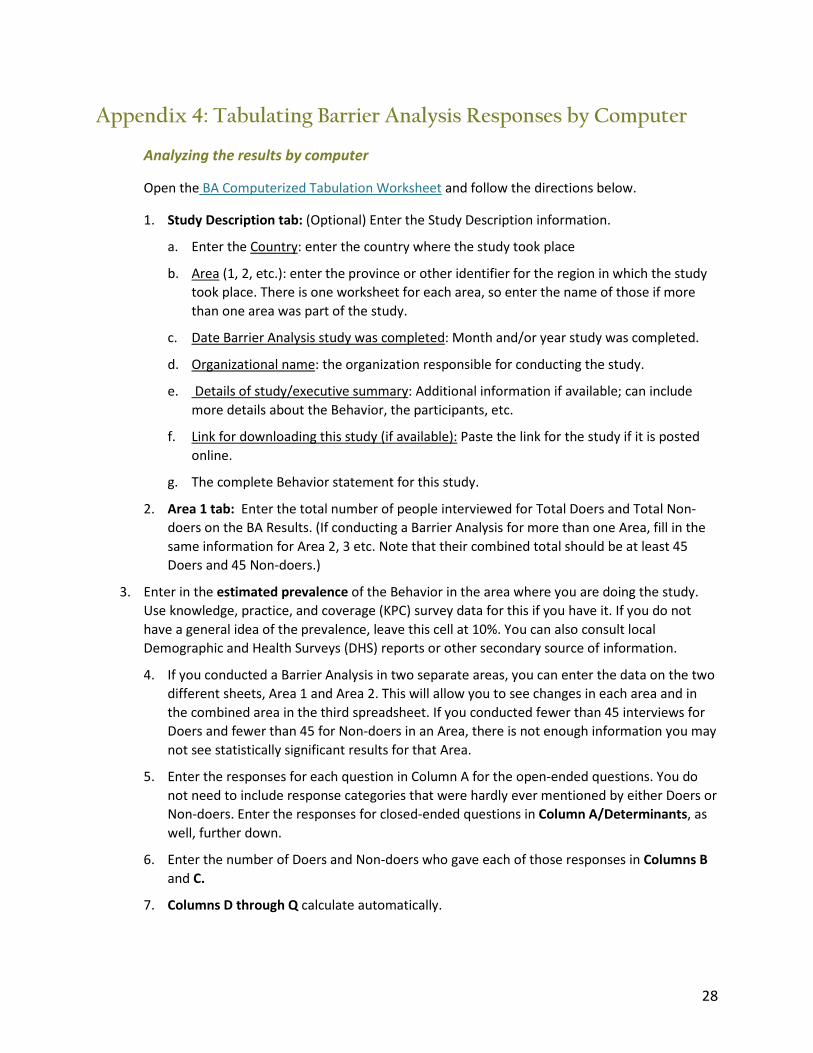
Appendix 4: Tabulating Barrier Analysis Responses by Computer
Analyzing the results by computer
Open the BA Computerized Tabulation Worksheet and follow the directions below.
1. Study Description tab: (Optional) Enter the Study Description information.
a. Enter the Country: enter the country where the study took place
b. Area (1, 2, etc.): enter the province or other identifier for the region in which the study took place. There is one worksheet for each area, so enter the name of those if more than one area was part of the study.
c. Date Barrier Analysis study was completed: Month and/or year study was completed.
d. Organizational name: the organization responsible for conducting the study.
e. Details of study/executive summary: Additional information if available; can include more details about the Behavior, the participants, etc.
f. Link for downloading this study (if available): Paste the link for the study if it is posted online.
g. The complete Behavior statement for this study.
2. Area 1 tab: Enter the total number of people interviewed for Total Doers and Total Non-doers on the BA Results. (If conducting a Barrier Analysis for more than one Area, fill in the same information for Area 2, 3 etc. Note that their combined total should be at least 45 Doers and 45 Non-doers.)
3. Enter in the estimated prevalence of the Behavior in the area where you are doing the study. Use knowledge, practice, and coverage (KPC) survey data for this if you have it. If you do not have a general idea of the prevalence, leave this cell at 10%. You can also consult local Demographic and Health Surveys (DHS) reports or other secondary source of information.
4. If you conducted a Barrier Analysis in two separate areas, you can enter the data on the two different sheets, Area 1 and Area 2. This will allow you to see changes in each area and in the combined area in the third spreadsheet. If you conducted fewer than 45 interviews for Doers and fewer than 45 for Non-doers in an Area, there is not enough information you may not see statistically significant results for that Area.
5. Enter the responses for each question in Column A for the open-ended questions. You do not need to include response categories that were hardly ever mentioned by either Doers or Non-doers. Enter the responses for closed-ended questions in Column A/Determinants, as well, further down.
6. Enter the number of Doers and Non-doers who gave each of those responses in Columns B and C.
7. Columns D through Q calculate automatically.
29
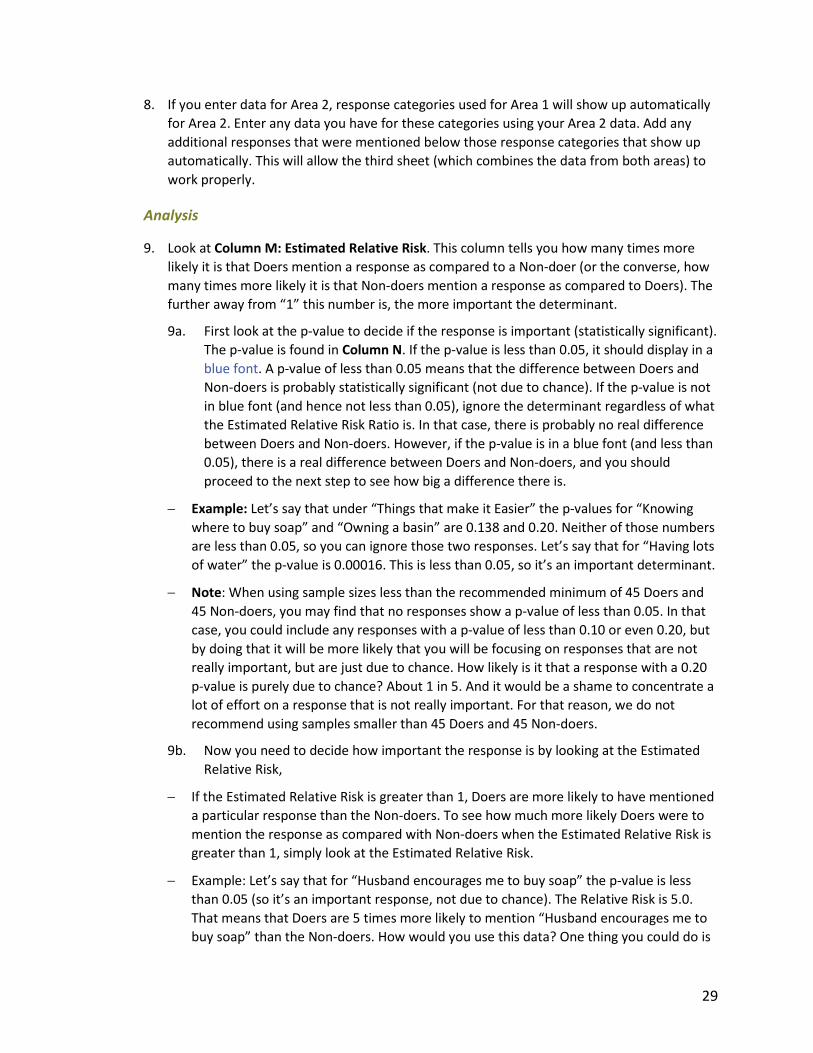
8. If you enter data for Area 2, response categories used for Area 1 will show up automatically for Area 2. Enter any data you have for these categories using your Area 2 data. Add any additional responses that were mentioned below those response categories that show up automatically. This will allow the third sheet (which combines the data from both areas) to work properly.
Analysis
9. Look at Column M: Estimated Relative Risk. This column tells you how many times more likely it is that Doers mention a response as compared to a Non-doer (or the converse, how many times more likely it is that Non-doers mention a response as compared to Doers). The further away from “1” this number is, the more important the determinant.
9a. First look at the p-value to decide if the response is important (statistically significant). The p-value is found in Column N. If the p-value is less than 0.05, it should display in a blue font. A p-value of less than 0.05 means that the difference between Doers and Non-doers is probably statistically significant (not due to chance). If the p-value is not in blue font (and hence not less than 0.05), ignore the determinant regardless of what the Estimated Relative Risk Ratio is. In that case, there is probably no real difference between Doers and Non-doers. However, if the p-value is in a blue font (and less than 0.05), there is a real difference between Doers and Non-doers, and you should proceed to the next step to see how big a difference there is.
− Example: Let’s say that under “Things that make it Easier” the p-values for “Knowing where to buy soap” and “Owning a basin” are 0.138 and 0.20. Neither of those numbers are less than 0.05, so you can ignore those two responses. Let’s say that for “Having lots of water” the p-value is 0.00016. This is less than 0.05, so it’s an important determinant.
− Note: When using sample sizes less than the recommended minimum of 45 Doers and 45 Non-doers, you may find that no responses show a p-value of less than 0.05. In that case, you could include any responses with a p-value of less than 0.10 or even 0.20, but by doing that it will be more likely that you will be focusing on responses that are not really important, but are just due to chance. How likely is it that a response with a 0.20 p-value is purely due to chance? About 1 in 5. And it would be a shame to concentrate a lot of effort on a response that is not really important. For that reason, we do not recommend using samples smaller than 45 Doers and 45 Non-doers.
9b. Now you need to decide how important the response is by looking at the Estimated Relative Risk,
− If the Estimated Relative Risk is greater than 1, Doers are more likely to have mentioned a particular response than the Non-doers. To see how much more likely Doers were to mention the response as compared with Non-doers when the Estimated Relative Risk is greater than 1, simply look at the Estimated Relative Risk.
− Example: Let’s say that for “Husband encourages me to buy soap” the p-value is less than 0.05 (so it’s an important response, not due to chance). The Relative Risk is 5.0. That means that Doers are 5 times more likely to mention “Husband encourages me to buy soap” than the Non-doers. How would you use this data? One thing you could do is
30
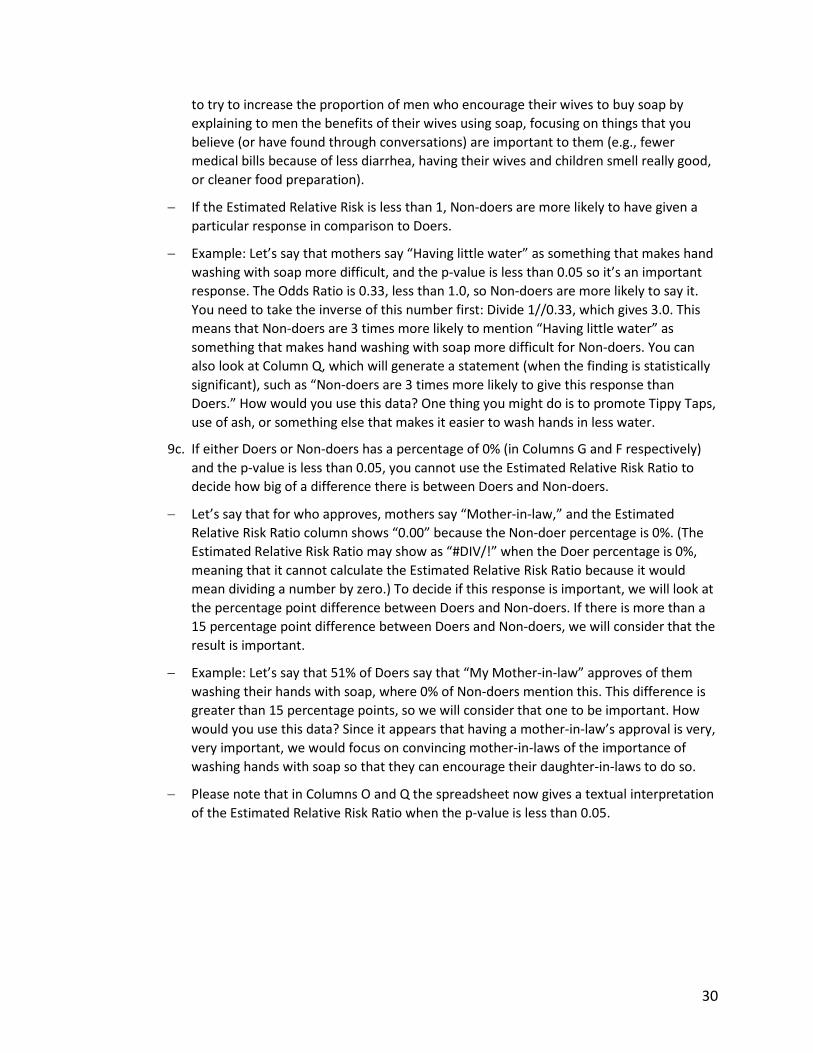
to try to increase the proportion of men who encourage their wives to buy soap by explaining to men the benefits of their wives using soap, focusing on things that you believe (or have found through conversations) are important to them (e.g., fewer medical bills because of less diarrhea, having their wives and children smell really good, or cleaner food preparation).
− If the Estimated Relative Risk is less than 1, Non-doers are more likely to have given a particular response in comparison to Doers.
− Example: Let’s say that mothers say “Having little water” as something that makes hand washing with soap more difficult, and the p-value is less than 0.05 so it’s an important response. The Odds Ratio is 0.33, less than 1.0, so Non-doers are more likely to say it. You need to take the inverse of this number first: Divide 1//0.33, which gives 3.0. This means that Non-doers are 3 times more likely to mention “Having little water” as something that makes hand washing with soap more difficult for Non-doers. You can also look at Column Q, which will generate a statement (when the finding is statistically significant), such as “Non-doers are 3 times more likely to give this response than Doers.” How would you use this data? One thing you might do is to promote Tippy Taps, use of ash, or something else that makes it easier to wash hands in less water.
9c. If either Doers or Non-doers has a percentage of 0% (in Columns G and F respectively) and the p-value is less than 0.05, you cannot use the Estimated Relative Risk Ratio to decide how big of a difference there is between Doers and Non-doers.
− Let’s say that for who approves, mothers say “Mother-in-law,” and the Estimated Relative Risk Ratio column shows “0.00” because the Non-doer percentage is 0%. (The Estimated Relative Risk Ratio may show as “#DIV/!” when the Doer percentage is 0%, meaning that it cannot calculate the Estimated Relative Risk Ratio because it would mean dividing a number by zero.) To decide if this response is important, we will look at the percentage point difference between Doers and Non-doers. If there is more than a 15 percentage point difference between Doers and Non-doers, we will consider that the result is important.
− Example: Let’s say that 51% of Doers say that “My Mother-in-law” approves of them washing their hands with soap, where 0% of Non-doers mention this. This difference is greater than 15 percentage points, so we will consider that one to be important. How would you use this data? Since it appears that having a mother-in-law’s approval is very, very important, we would focus on convincing mother-in-laws of the importance of washing hands with soap so that they can encourage their daughter-in-laws to do so.
− Please note that in Columns O and Q the spreadsheet now gives a textual interpretation of the Estimated Relative Risk Ratio when the p-value is less than 0.05.
31
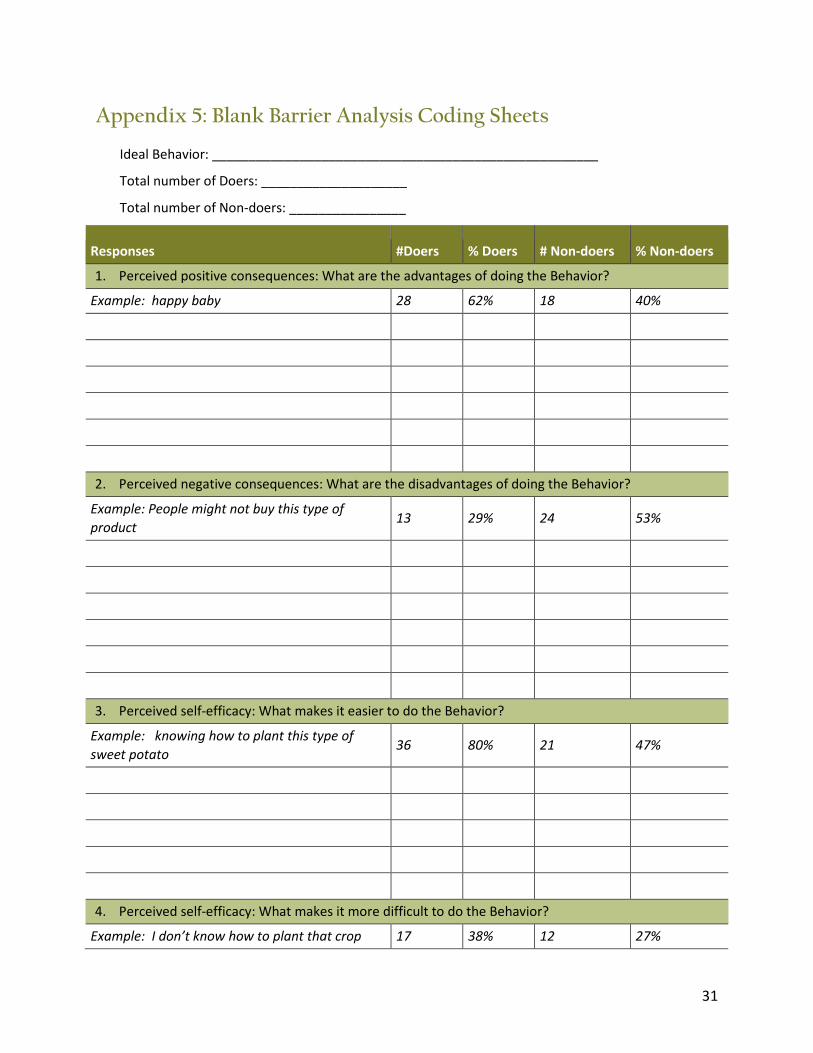
Appendix 5: Blank Barrier Analysis Coding Sheets
Ideal Behavior: _____________________________________________________
Total number of Doers: ____________________
Total number of Non-doers: ________________
Responses #Doers % Doers # Non-doers % Non-doers 1. Perceived positive consequences: What are the advantages of doing the Behavior?
Example: happy baby 28 62% 18 40%
2. Perceived negative consequences: What are the disadvantages of doing the Behavior?
Example: People might not buy this type of product 13 29% 24 53%
3. Perceived self-efficacy: What makes it easier to do the Behavior?
Example: knowing how to plant this type of sweet potato 36 80% 21 47%
4. Perceived self-efficacy: What makes it more difficult to do the Behavior?
Example: I don’t know how to plant that crop 17 38% 12 27%
32
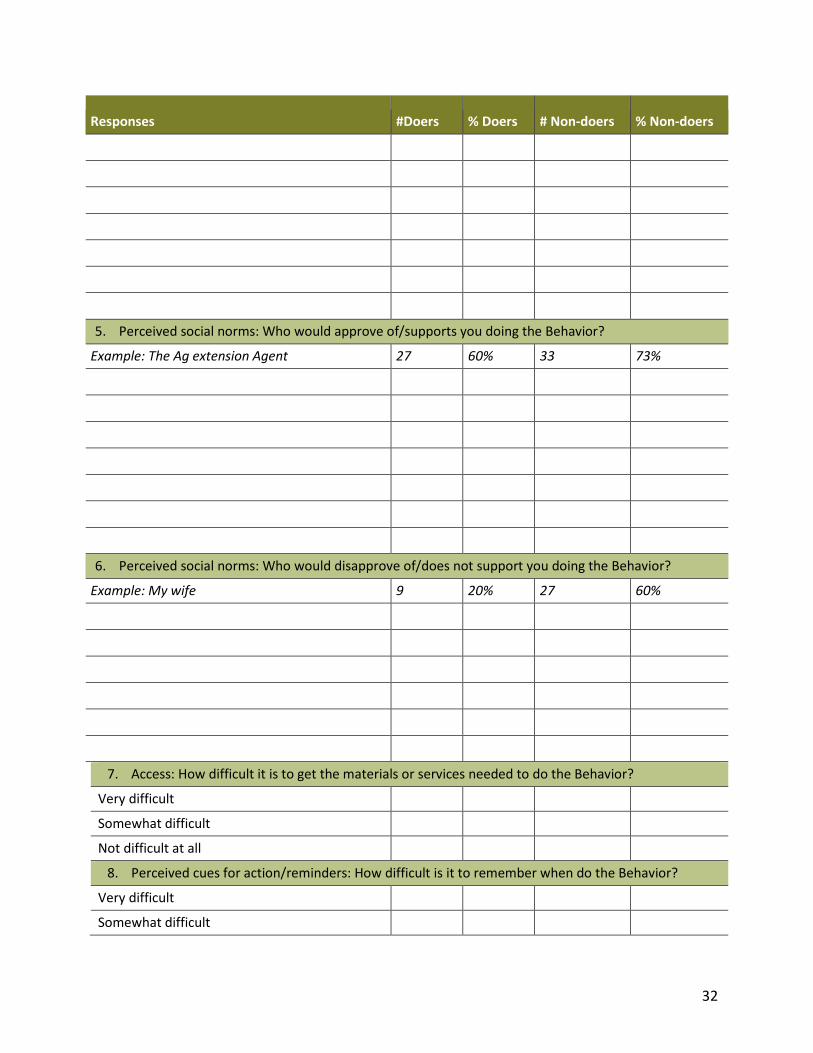
Responses #Doers % Doers # Non-doers % Non-doers
5. Perceived social norms: Who would approve of/supports you doing the Behavior?
Example: The Ag extension Agent 27 60% 33 73%
6. Perceived social norms: Who would disapprove of/does not support you doing the Behavior?
Example: My wife 9 20% 27 60%
7. Access: How difficult it is to get the materials or services needed to do the Behavior?
Very difficult
Somewhat difficult
Not difficult at all
8. Perceived cues for action/reminders: How difficult is it to remember when do the Behavior? Very difficult
Somewhat difficult
33
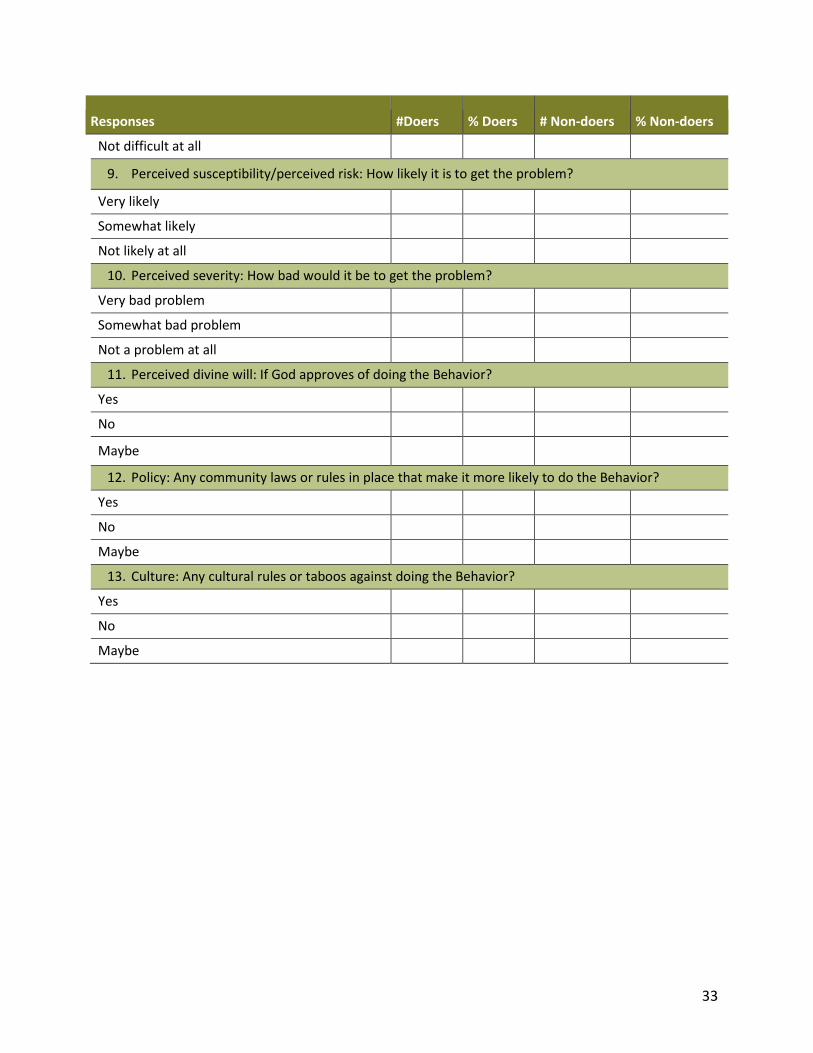
Responses #Doers % Doers # Non-doers % Non-doers Not difficult at all
9. Perceived susceptibility/perceived risk: How likely it is to get the problem?
Very likely
Somewhat likely
Not likely at all
10. Perceived severity: How bad would it be to get the problem? Very bad problem
Somewhat bad problem
Not a problem at all
11. Perceived divine will: If God approves of doing the Behavior? Yes
No
Maybe
12. Policy: Any community laws or rules in place that make it more likely to do the Behavior? Yes
No
Maybe
13. Culture: Any cultural rules or taboos against doing the Behavior? Yes
No
Maybe
34
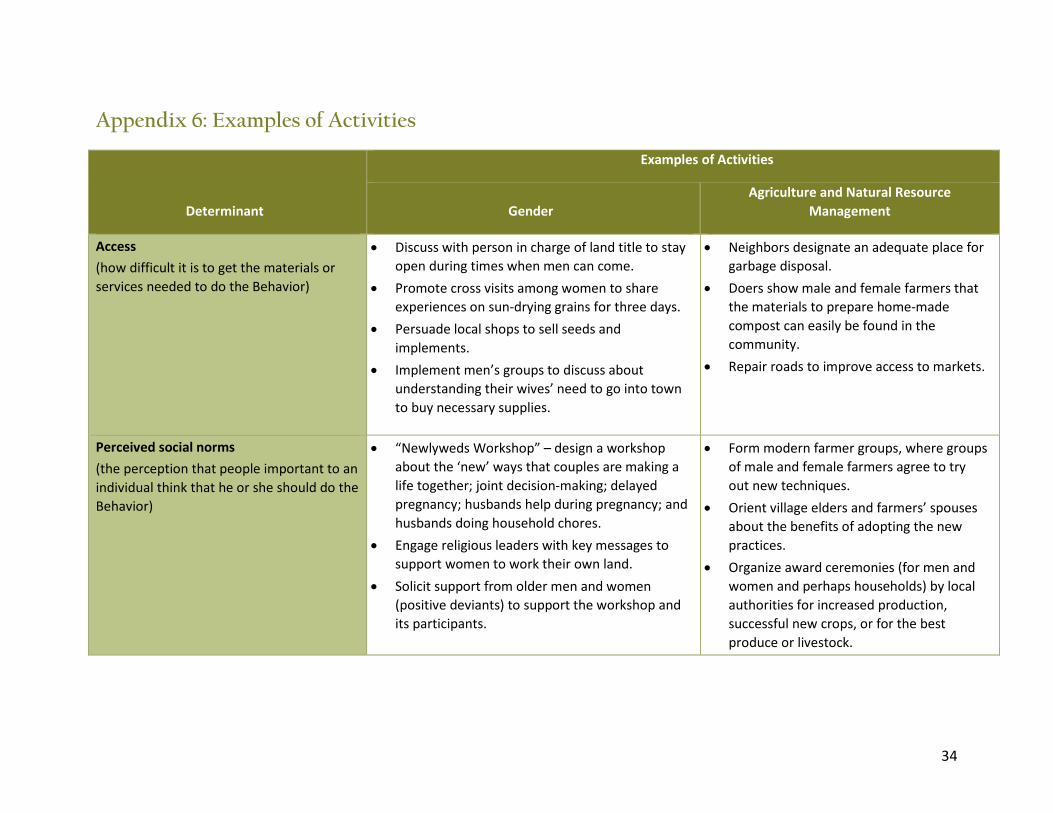
Appendix 6: Examples of Activities
Determinant
Examples of Activities
Gender Agriculture and Natural Resource
Management
Access (how difficult it is to get the materials or services needed to do the Behavior)
• Discuss with person in charge of land title to stay open during times when men can come.
• Promote cross visits among women to share experiences on sun-drying grains for three days.
• Persuade local shops to sell seeds and implements.
• Implement men’s groups to discuss about understanding their wives’ need to go into town to buy necessary supplies.
• Neighbors designate an adequate place for garbage disposal.
• Doers show male and female farmers that the materials to prepare home-made compost can easily be found in the community.
• Repair roads to improve access to markets.
Perceived social norms (the perception that people important to an individual think that he or she should do the Behavior)
• “Newlyweds Workshop” – design a workshop about the ‘new’ ways that couples are making a life together; joint decision-making; delayed pregnancy; husbands help during pregnancy; and husbands doing household chores.
• Engage religious leaders with key messages to support women to work their own land.
• Solicit support from older men and women (positive deviants) to support the workshop and its participants.
• Form modern farmer groups, where groups of male and female farmers agree to try out new techniques.
• Orient village elders and farmers’ spouses about the benefits of adopting the new practices.
• Organize award ceremonies (for men and women and perhaps households) by local authorities for increased production, successful new crops, or for the best produce or livestock.
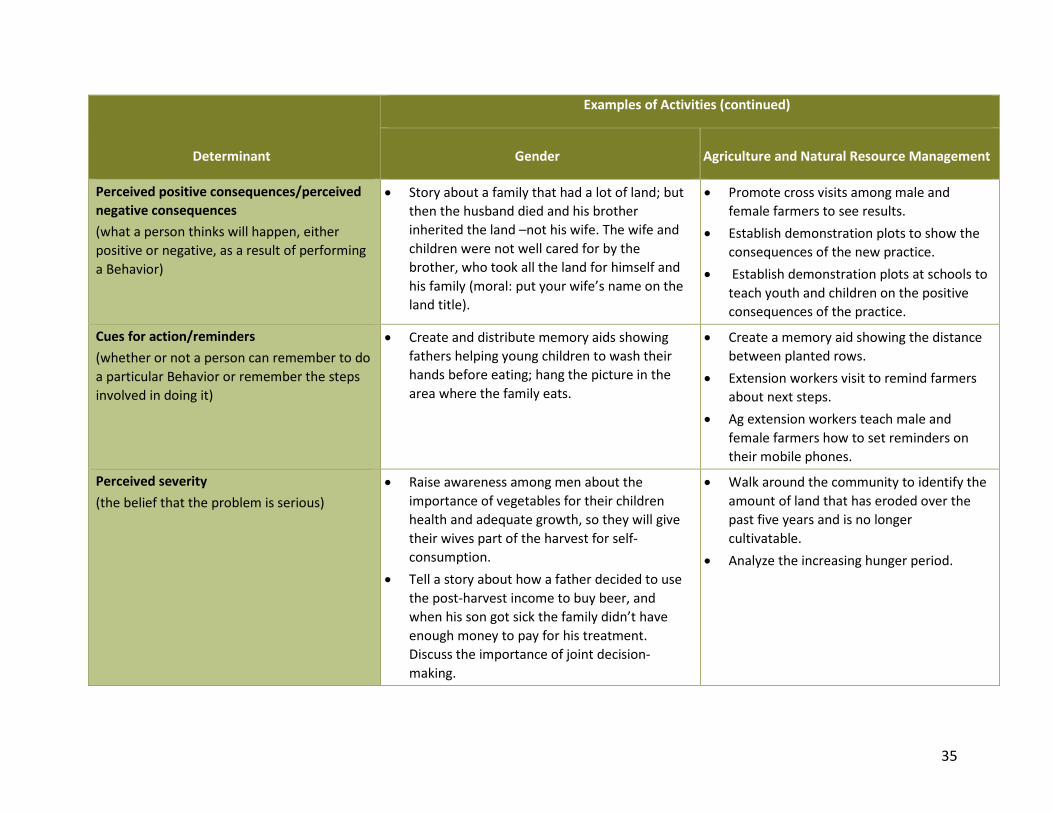
35
Determinant
Examples of Activities (continued)
Gender Agriculture and Natural Resource Management
Perceived positive consequences/perceived negative consequences (what a person thinks will happen, either positive or negative, as a result of performing a Behavior)
• Story about a family that had a lot of land; but then the husband died and his brother inherited the land –not his wife. The wife and children were not well cared for by the brother, who took all the land for himself and his family (moral: put your wife’s name on the land title).
• Promote cross visits among male and female farmers to see results.
• Establish demonstration plots to show the consequences of the new practice.
• Establish demonstration plots at schools to teach youth and children on the positive consequences of the practice.
Cues for action/reminders (whether or not a person can remember to do a particular Behavior or remember the steps involved in doing it)
• Create and distribute memory aids showing fathers helping young children to wash their hands before eating; hang the picture in the area where the family eats.
• Create a memory aid showing the distance between planted rows.
• Extension workers visit to remind farmers about next steps.
• Ag extension workers teach male and female farmers how to set reminders on their mobile phones.
Perceived severity (the belief that the problem is serious)
• Raise awareness among men about the importance of vegetables for their children health and adequate growth, so they will give their wives part of the harvest for self-consumption.
• Tell a story about how a father decided to use the post-harvest income to buy beer, and when his son got sick the family didn’t have enough money to pay for his treatment. Discuss the importance of joint decision-making.
• Walk around the community to identify the amount of land that has eroded over the past five years and is no longer cultivatable.
• Analyze the increasing hunger period.
36
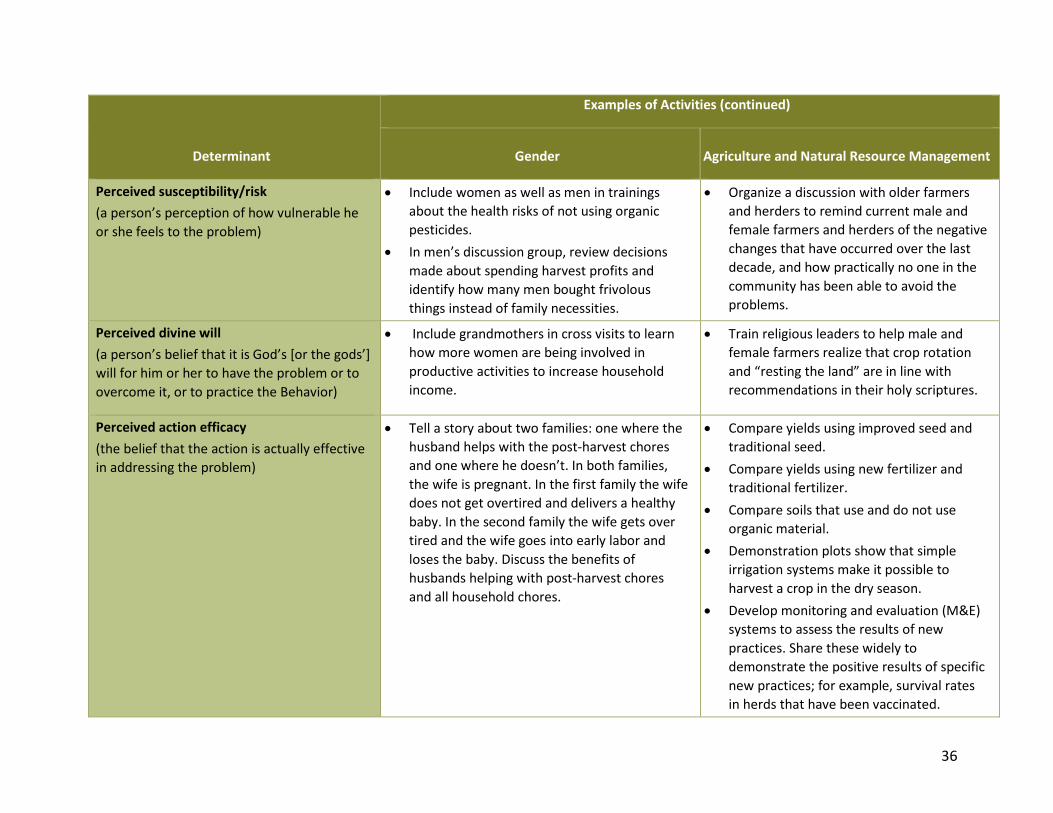
Determinant
Examples of Activities (continued)
Gender Agriculture and Natural Resource Management
Perceived susceptibility/risk (a person’s perception of how vulnerable he or she feels to the problem)
• Include women as well as men in trainings about the health risks of not using organic pesticides.
• In men’s discussion group, review decisions made about spending harvest profits and identify how many men bought frivolous things instead of family necessities.
• Organize a discussion with older farmers and herders to remind current male and female farmers and herders of the negative changes that have occurred over the last decade, and how practically no one in the community has been able to avoid the problems.
Perceived divine will (a person’s belief that it is God’s [or the gods’] will for him or her to have the problem or to overcome it, or to practice the Behavior)
• Include grandmothers in cross visits to learn how more women are being involved in productive activities to increase household income.
• Train religious leaders to help male and female farmers realize that crop rotation and “resting the land” are in line with recommendations in their holy scriptures.
Perceived action efficacy (the belief that the action is actually effective in addressing the problem)
• Tell a story about two families: one where the husband helps with the post-harvest chores and one where he doesn’t. In both families, the wife is pregnant. In the first family the wife does not get overtired and delivers a healthy baby. In the second family the wife gets over tired and the wife goes into early labor and loses the baby. Discuss the benefits of husbands helping with post-harvest chores and all household chores.
• Compare yields using improved seed and traditional seed.
• Compare yields using new fertilizer and traditional fertilizer.
• Compare soils that use and do not use organic material.
• Demonstration plots show that simple irrigation systems make it possible to harvest a crop in the dry season.
• Develop monitoring and evaluation (M&E) systems to assess the results of new practices. Share these widely to demonstrate the positive results of specific new practices; for example, survival rates in herds that have been vaccinated.
37
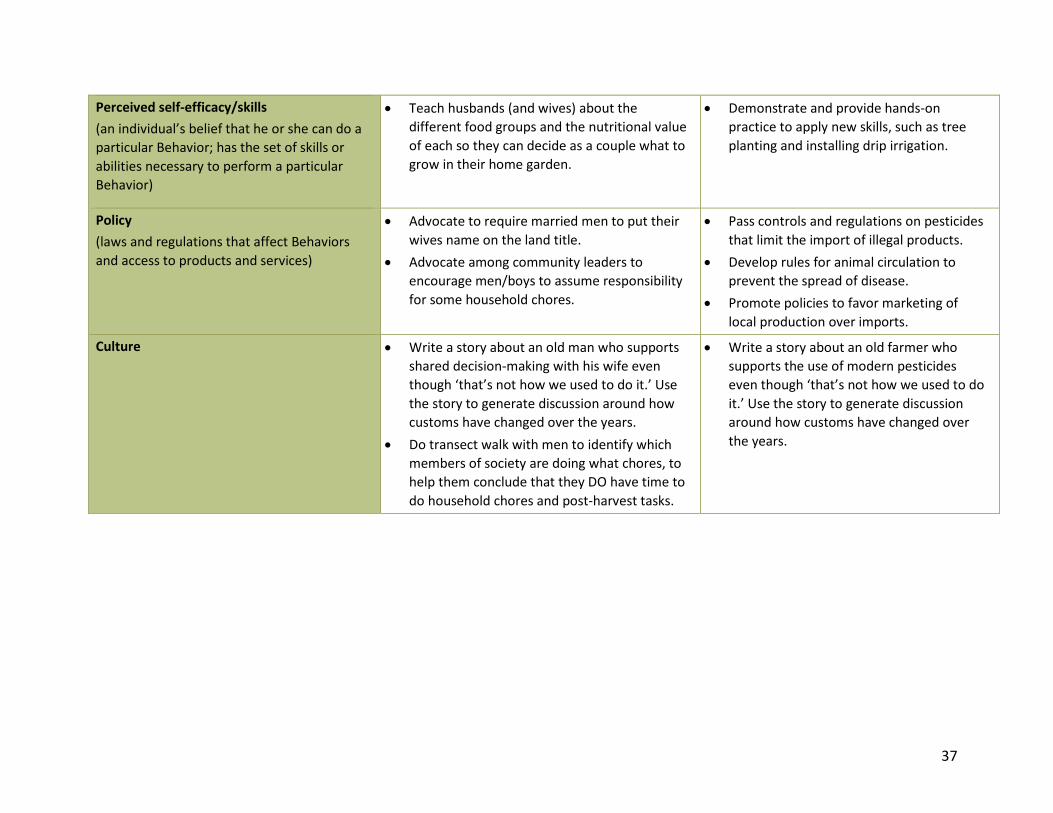
Perceived self-efficacy/skills (an individual’s belief that he or she can do a particular Behavior; has the set of skills or abilities necessary to perform a particular Behavior)
• Teach husbands (and wives) about the different food groups and the nutritional value of each so they can decide as a couple what to grow in their home garden.
• Demonstrate and provide hands-on practice to apply new skills, such as tree planting and installing drip irrigation.
Policy (laws and regulations that affect Behaviors and access to products and services)
• Advocate to require married men to put their wives name on the land title.
• Advocate among community leaders to encourage men/boys to assume responsibility for some household chores.
• Pass controls and regulations on pesticides that limit the import of illegal products.
• Develop rules for animal circulation to prevent the spread of disease.
• Promote policies to favor marketing of local production over imports.
Culture • Write a story about an old man who supports shared decision-making with his wife even though ‘that’s not how we used to do it.’ Use the story to generate discussion around how customs have changed over the years.
• Do transect walk with men to identify which members of society are doing what chores, to help them conclude that they DO have time to do household chores and post-harvest tasks.
• Write a story about an old farmer who supports the use of modern pesticides even though ‘that’s not how we used to do it.’ Use the story to generate discussion around how customs have changed over the years.
38
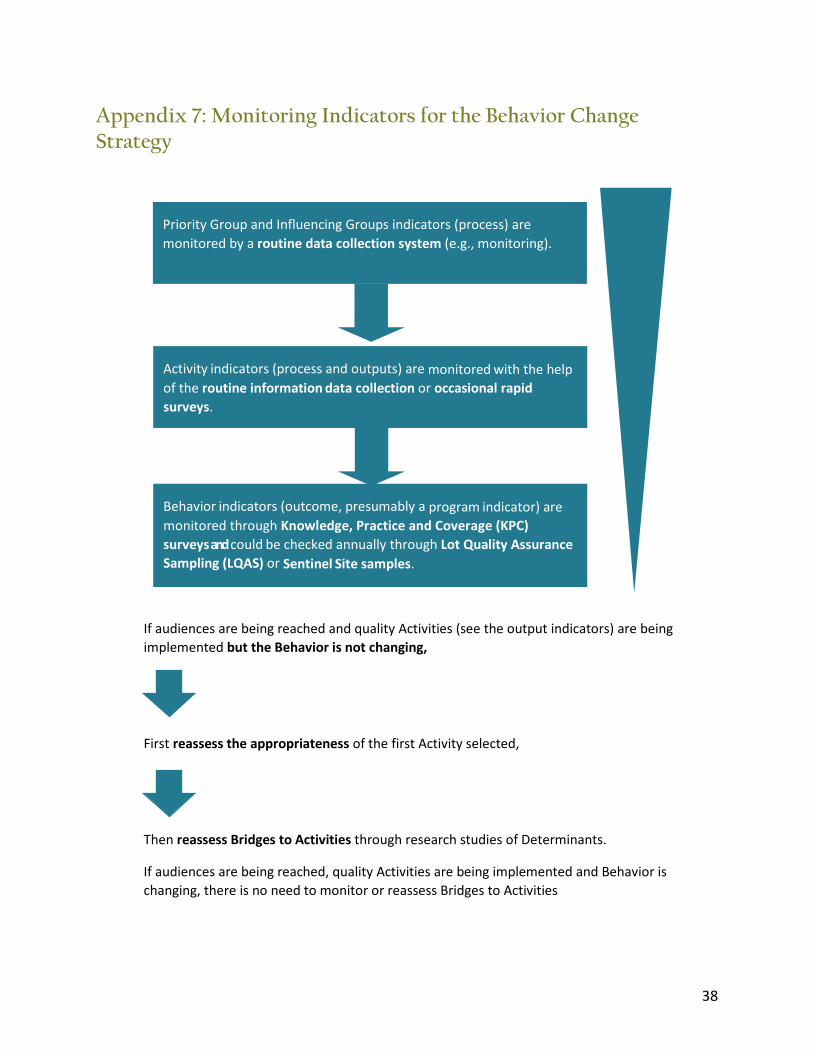
Appendix 7: Monitoring Indicators for the Behavior Change Strategy
If audiences are being reached and quality Activities (see the output indicators) are being implemented but the Behavior is not changing,
First reassess the appropriateness of the first Activity selected,
Then reassess Bridges to Activities through research studies of Determinants.
If audiences are being reached, quality Activities are being implemented and Behavior is changing, there is no need to monitor or reassess Bridges to Activities
Activity indicators (process and outputs) are monitored with the help of the routine information data collection or occasional rapid surveys.
Behavior indicators (outcome, presumably a program indicator) are monitored through Knowledge, Practice and Coverage (KPC) surveys and could be checked annually through Lot Quality Assurance Sampling (LQAS) or Sentinel Site samples.
Priority Group and Influencing Groups indicators (process) are monitored by a routine data collection system (e.g., monitoring).
39
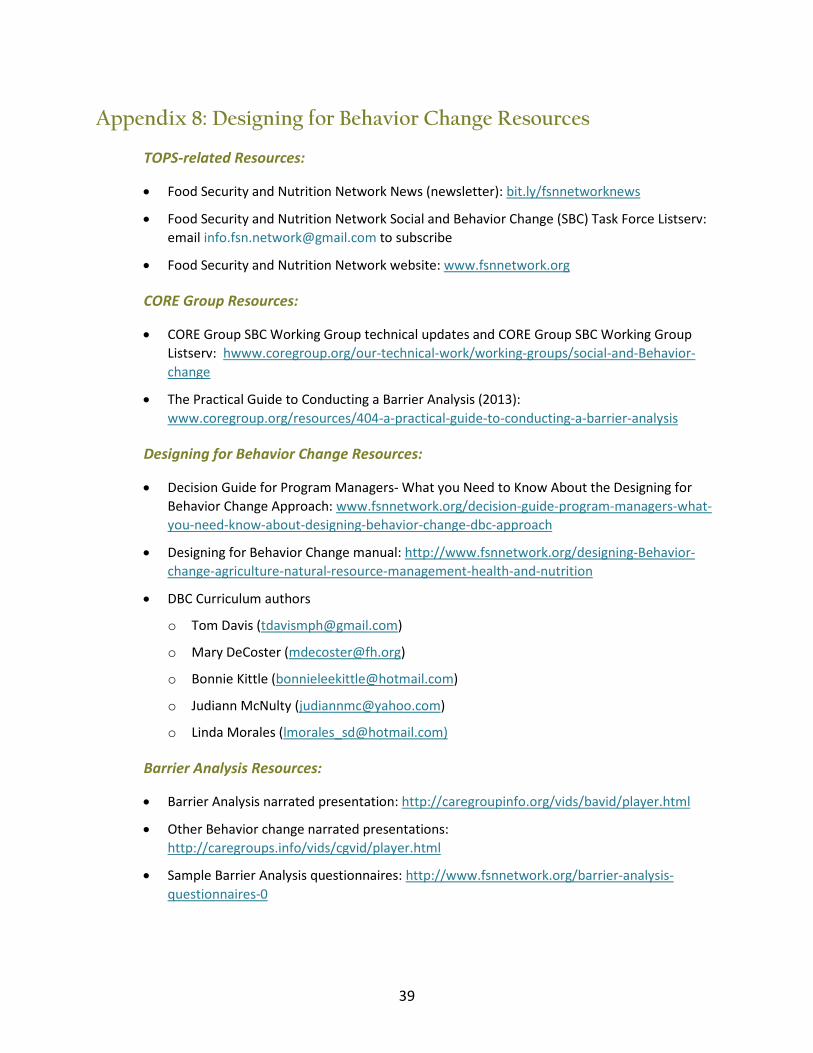
Appendix 8: Designing for Behavior Change Resources
TOPS-related Resources:
• Food Security and Nutrition Network News (newsletter): bit.ly/fsnnetworknews
• Food Security and Nutrition Network Social and Behavior Change (SBC) Task Force Listserv: email [email protected] to subscribe
• Food Security and Nutrition Network website: www.fsnnetwork.org
CORE Group Resources:
• CORE Group SBC Working Group technical updates and CORE Group SBC Working Group Listserv: hwww.coregroup.org/our-technical-work/working-groups/social-and-Behavior-change
• The Practical Guide to Conducting a Barrier Analysis (2013): www.coregroup.org/resources/404-a-practical-guide-to-conducting-a-barrier-analysis
Designing for Behavior Change Resources:
• Decision Guide for Program Managers- What you Need to Know About the Designing for Behavior Change Approach: www.fsnnetwork.org/decision-guide-program-managers-what-you-need-know-about-designing-behavior-change-dbc-approach
• Designing for Behavior Change manual: http://www.fsnnetwork.org/designing-Behavior-change-agriculture-natural-resource-management-health-and-nutrition
• DBC Curriculum authors
o Tom Davis ([email protected])
o Mary DeCoster ([email protected])
o Bonnie Kittle ([email protected])
o Judiann McNulty ([email protected])
o Linda Morales ([email protected])
Barrier Analysis Resources:
• Barrier Analysis narrated presentation: http://caregroupinfo.org/vids/bavid/player.html
• Other Behavior change narrated presentations: http://caregroups.info/vids/cgvid/player.html
• Sample Barrier Analysis questionnaires: http://www.fsnnetwork.org/barrier-analysis-questionnaires-0
40
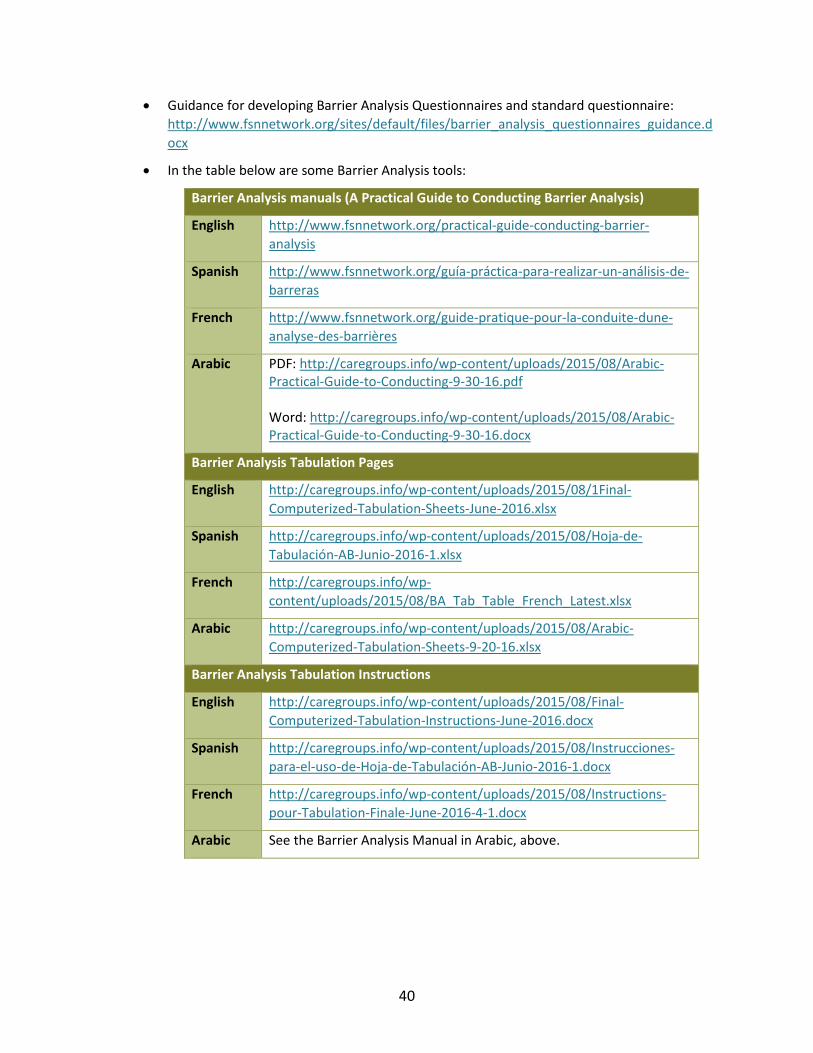
• Guidance for developing Barrier Analysis Questionnaires and standard questionnaire: http://www.fsnnetwork.org/sites/default/files/barrier_analysis_questionnaires_guidance.docx
• In the table below are some Barrier Analysis tools:
Barrier Analysis manuals (A Practical Guide to Conducting Barrier Analysis)
English http://www.fsnnetwork.org/practical-guide-conducting-barrier-analysis
Spanish http://www.fsnnetwork.org/guía-práctica-para-realizar-un-análisis-de-barreras
French http://www.fsnnetwork.org/guide-pratique-pour-la-conduite-dune-analyse-des-barrières
Arabic PDF: http://caregroups.info/wp-content/uploads/2015/08/Arabic-Practical-Guide-to-Conducting-9-30-16.pdf Word: http://caregroups.info/wp-content/uploads/2015/08/Arabic-Practical-Guide-to-Conducting-9-30-16.docx
Barrier Analysis Tabulation Pages
English http://caregroups.info/wp-content/uploads/2015/08/1Final-Computerized-Tabulation-Sheets-June-2016.xlsx
Spanish http://caregroups.info/wp-content/uploads/2015/08/Hoja-de-Tabulación-AB-Junio-2016-1.xlsx
French http://caregroups.info/wp-content/uploads/2015/08/BA_Tab_Table_French_Latest.xlsx
Arabic http://caregroups.info/wp-content/uploads/2015/08/Arabic-Computerized-Tabulation-Sheets-9-20-16.xlsx
Barrier Analysis Tabulation Instructions
English http://caregroups.info/wp-content/uploads/2015/08/Final-Computerized-Tabulation-Instructions-June-2016.docx
Spanish http://caregroups.info/wp-content/uploads/2015/08/Instrucciones-para-el-uso-de-Hoja-de-Tabulación-AB-Junio-2016-1.docx
French http://caregroups.info/wp-content/uploads/2015/08/Instructions-pour-Tabulation-Finale-June-2016-4-1.docx
Arabic See the Barrier Analysis Manual in Arabic, above.