Embed Size (px)
Citation preview

Design of Soil Nails for Upgrading Loose Fill Slopes
Geotechnical Engineering Office and
Hong Kong Institution of Engineers (Geotechnical Division)
October 2011
2
Disclaimer
This report makes recommendations to supplement the design guidance given in “Geoguide 7: Guide to Soil Nail Design and Construction” promulgated by the Geotechnical Engineering Office, and the 2003 report entitled “Soil Nails in Loose Fill Slopes – A Preliminary Study” promulgated by The Hong Kong Institution of Engineers, Geotechnical Division.
The Hong Kong Institution of Engineers and the Geotechnical Engineering Office do not accept any responsibility for the use or misuse of this report. A designer using the recommendations contained in this report shall retain total responsibility for the adequacy of the design.
3
Executive Summary
Since the publication of the report on “Soil Nails in Loose Fill Slopes” by the Geotechnical Division of The Hong Kong Institution of Engineer (HKIE-GD) in 2003, much experience has accrued in respect of the design and construction of soil nails for upgrading loose fill slopes. The present study, initiated by the Geotechnical Engineering Office (GEO), Civil Engineering and Development Department (CEDD), aims to consolidate the experience gained and explore possible improvements in the design methodology and enhancements in robustness and detailing. This report presents the findings of the study, together with a set of design recommendations which supplement the guidelines given in the HKIE-GD Report (HKIE, 2003).
In the HKIE-GD Report (HKIE, 2003), the strength of the fill at the onset of liquefaction is represented by an effective friction angle (φ'mob) of 26°, and the strength of the liquefied fill is represented by the lower bound steady state undrained shear strength of css/p'peak = 0.2 in the absence of site-specific laboratory data. An appraisal of the laboratory test data on local loose fills reveals that these prescribed design parameters are conservative and appropriate when site-specific laboratory test data are not available. However, it is strongly recommended that site-specific laboratory tests be carried out in order to reduce the unnecessary conservatism in the design parameters.
The present study has concluded that the overall design approach recommended by the HKIE-GD Report (HKIE, 2003) is adequate in principle. However, the current practice of installing the nails to an inclination of nearly perpendicular to the slope face could lead to significant slope movement especially when sliding failure prevails, for instance, due to interface liquefaction. Numerical analyses undertaken in the present study have demonstrated that a hybrid nail arrangement comprising nails at two different orientations (i.e. sub-horizontal nails at the upper part and steeply inclined at the low part) would limit slope movement and enhance the robustness of the system. Furthermore, if the hybrid nail arrangement is adopted, the vertical nails at the slope toe would not be required. It is recommended that the hybrid nail arrangement be adopted as far as possible.
The grillage facing is an important structural component of the entire stabilising system. The present study establishes that the current required grillage embedment of 0.5 m for the sake of maintaining a good contact between the grillage and the underlying fill is not necessary. It is therefore recommended that a nominal grillage embedment of 0.3 m be provided for both the steeply inclined nail arrangement and the hybrid nail arrangement to prevent the grillage from being undermined by erosion.
The earth pressure exerted on the grillage facing in the event of full liquefaction may in theory cause local squeezing out through the grillage openings. However, full liquefaction of the near-surface fill materials is unlikely due to the low stress levels near the slope surface and the short drainage path. Considering the relatively less significant consequence-to-life in comparison with an overall slope failure, the present practice of limiting the size of the grillage opening to avoid squeezing out is considered acceptable.
Loose fill at great depths has a lower chance of undergoing liquefaction, especially at

4
locations where the initial shear stress is low. The zone of non-liquefiable fill can be delineated using limit equilibrium analysis based on the initial shear stress and the mobilised friction angle at the onset of liquefaction. However, the bond strength (i.e. shear resistance) of soil nail embedded in this loose fill zone should not be relied on when the required nail lengths are determined.

5
Contents
Page No.
Title Page 1
Disclaimer 2
Executive Summary 3
Contents 5
List of Tables 7
List of Figures 8
1 Introduction 10
1.1 Background 10
1.2 Scope of the Study 10
2 Design Concept and Approach 12
2.1 Current Design Approach 12
2.2 Alternative Design Approach 13
3 Properties of Loose Fill Materials in Hong Kong 15
3.1 General Observations 15
3.2 Onset of Liquefaction 15
3.3 Steady State Undrained Shear Strength 18
4 Stabilising Mechanisms of Loose Fill Slopes Upgraded by Soil Nails 20
4.1 Overview 20
4.2 Influence of Nail Inclination on Stabilising Mechanisms 24
4.2.1 Steeply Inclined Nail Arrangement 24
4.2.2 Sub-horizontal Nail Arrangement 28
4.2.3 Hybrid Nail Arrangement 28
4.3 Influence of Fill Geometry 32
4.4 Local Stability at Grillage Openings 33
5 Design Recommendations 36
5.1 Shear Strength Parameters 36
6
Page No.
5.2 Limit Equilibrium Analyses 36
5.3 Fill Geometry 37
5.4 Nail Arrangement 38
5.5 Vertical Nails 39
5.6 Grillage Facing 39
6 Conclusions 41
7 References 43
Appendix A: Critical State of Loose Fill 44
Appendix B: Finite Difference Analysis of Loose Fill Slopes Upgraded by 52 Soil Nails
7
List of Tables
Table No.
Page No.
3.1 Laboratory Test Data Collected from Public Works Central Laboratory
17
8
List of Figures
Figure Page No. No.
2.1 Likely Stress Path of a Soil Element in a Loose Fill Slope 13 Subjected to Infiltration and Liquefaction
2.2 Influence of Initial Shear Stress on Brittleness of 14 Undrained Strain Softening Behaviour of Loose Fill (HKIE, 2003)
3.1 Stress State at the Onset of Liquefaction 16
3.2 Variation of the css/p'peak Ratio 18
4.1 Steeply Inclined Nails under Sliding Mode of Failure 20
4.2 Different Nail Arrangements Examined in the Numerical 22 Analyses
4.3 Two Different Scenarios Considered in the Numerical 23 Analyses
4.4 Earth Pressure Exerted on the Grillage Facing 25
4.5 Nail Force Distribution and Deformations of Steeply 26 Inclined Nail Arrangement under Full Liquefaction
4.6 Nail Force Distribution and Deformations of Steeply 27 Inclined Nail Arrangement under Interface Liquefaction
4.7 Uplift of Slope Cover of Sub-horizontal Nail Arrangement 29 under Full Liquefaction
4.8 Nail Force Distribution and Deformations of Hybrid Nail 30 Arrangement under Full Liquefaction
4.9 Nail Force Distribution and Deformations of Hybrid Nail 31 Arrangement under Interface Liquefaction
4.10 Shear Strain Distribution in Non-uniform (Tapered) Fill 32 Upgraded by Steeply Inclined Nails
4.11 Simplified Assessment of Local Stability at Grillage 34 Openings
4.12 Limiting Pressure at Grillage Openings 35
9
Figure No.
Page No.
5.1 Delineation of Non-liquefiable Loose Fill Zone 37
10
1 Introduction
1.1 Background
The use of soil nails to upgrade loose fill slopes that are prone to static liquefaction was a novelty and has been a subject of considerable debate locally. In 2003, a subcommittee appointed by the Geotechnical Division of The Hong Kong Institution of Engineers (HKIE-GD) put forward design guidelines based on a report entitled “Soil Nails in Loose Fill Slopes - A Preliminary Study” (HKIE, 2003). Subsequently, the Geotechnical Engineering Office (GEO) of the Civil Engineering and Development Department (CEDD) promulgated a recommended design methodology based on HKIE-GD’s design guidelines for upgrading sub-standard loose fill slopes using soil nails in Geoguide 7 (GEO, 2008).
Since 2003, experience has accrued in respect of the design and construction of soil nails for upgrading loose fill slopes. About one hundred loose fill slopes have been upgraded using soil nails under the LPM Programme. These slopes have performed satisfactorily to date. It is therefore timely to conduct a review of the current design methodology, with due regard to the experience gained and advances made in the technical understanding of the subject in recent years. In 2009, the GEO commissioned AECOM Asia Company Limited to undertake a study on the subject which is aimed at reviewing the current design practice and exploring possible improvements in the design methodology and enhancements in robustness and detailing.
A Working Group with representatives from the GEO (Ir Ken Ho, Ir Anthony Lam, Ir Dr Alex Li, Ir Patty Cheng and Ir Carie Lam) and HKIE-GD (Ir W K Pun and Ir Dr Eric Li) was formed to oversee the study. This report, with input principally by Dr Johnny Cheuk and Ir Dr John Endicott of AECOM, presents the findings of the study and recommendations to supplement the current design guidance given in Geoguide 7 and the HKIE-GD Report.
1.2 Scope of the Study
To facilitate mapping out the key direction and focus of the study, the GEO has solicited views/comments from practitioners/researchers in the local geotechnical profession on the following items in relation to the use of soil nails to upgrade loose fill slopes:
� Ground investigation and laboratory testing, � Design methodology, analyses, detailing, � Construction issues, � Geotechnical control, and � Field performance of loose fill slopes upgraded by means of soil nails.
The collected comments were used to define the scope of the study which covers the following key areas:
� Design concept and approach, � Design shear strength parameters of loose fill materials, � Effect of nail inclination on the stabilising mechanisms, � Role of vertical nails at the slope toe,

11
� Design approach for non-uniform or deep fill geometry, and � Detailing of the grillage facing structure (i.e. embedment depth and opening size).
The above areas have been addressed by (i) an appraisal of recent laboratory test data on local fill materials, and (ii) a numerical study on soil-nail-facing interaction. A review of the construction aspects of soil nails in loose fill was undertaken by Ng et al (2004). This aspect has been excluded from the present study.
12
2 Design Concept and Approach
2.1 Current Design Approach
Saturated loose fill is contractive under shearing and may exhibit significant strain softening upon shearing under undrained conditions (denoted as “liquefaction” in this report). The current design philosophy, as recommended in the HKIE-GD Report (HKIE, 2003), adopts the post-liquefaction steady state undrained shear strength by assuming that the loose fill has been subjected to sufficient straining and reached the steady state by the time nail forces are mobilised. With this assumption, it is not necessary to examine the rate of nail force mobilisation vis-à-vis the rate of strain softening. In other words, the design is based on the ultimate condition as far as the shear strength of the loose fill is concerned.
Under liquefaction, the earth pressure generated beneath the slope facing is due to a sudden generation of excess pore water pressure associated with the compressive behaviour of the loose fill. The adoption of a continuous slope facing, typically in the form of a reinforced concrete grillage, anchored by soil nails at regular spacing, reflects the intention to design an anchored structure resisting earth pressure normal, or nearly normal, to the slope face. The facing itself should be capable of safely spreading the nail forces into the retained ground.
The required stabilising pressure on the slope facing, which is assumed to be triangular in shape, is determined by limit equilibrium analyses. In these analyses, the loose fill is characterised by its large strain steady state undrained shear strength, which can be determined by isotropically consolidated undrained triaxial compression tests conducted on back-pressure saturated specimens of remoulded fill samples (GEO, 2004; Chung, 1999). If site-specific tests were not carried out, a conservative lower bound value of steady state strength equal to 0.2 times the mean effective stress at the onset of liquefaction could be assumed. Given the conservative assumptions of steady state shear strength as the operational shear strength and determination of shear strength parameters from remoulded fill specimens, a relatively low factor of safety of 1.1 is recommended.
The role of the grillage facing is to ensure that the loose fill is effectively retained. Structural supports in the form of vertical nails are normally provided at the slope toe to absorb any unbalanced forces arising from the possible construction deviation in the alignment of the soil nails. The current practice also requires a minimum grillage embedment of 0.5 m below the slope surface to ensure a good contact with the fill. Local instability involving the outflow of the saturated loose fill through the grillage openings is prevented by providing sufficient grillage coverage over the slope surface. A minimum coverage of 50% of the slope surface is commonly adopted in local practice.
13
Undrained Shear Stress (q)
φ' crit φ' mob
C
B A
Onset of static liquefaction
Steady state strength
Initial state
Drained
p'peak Mean Effective Stress (p')
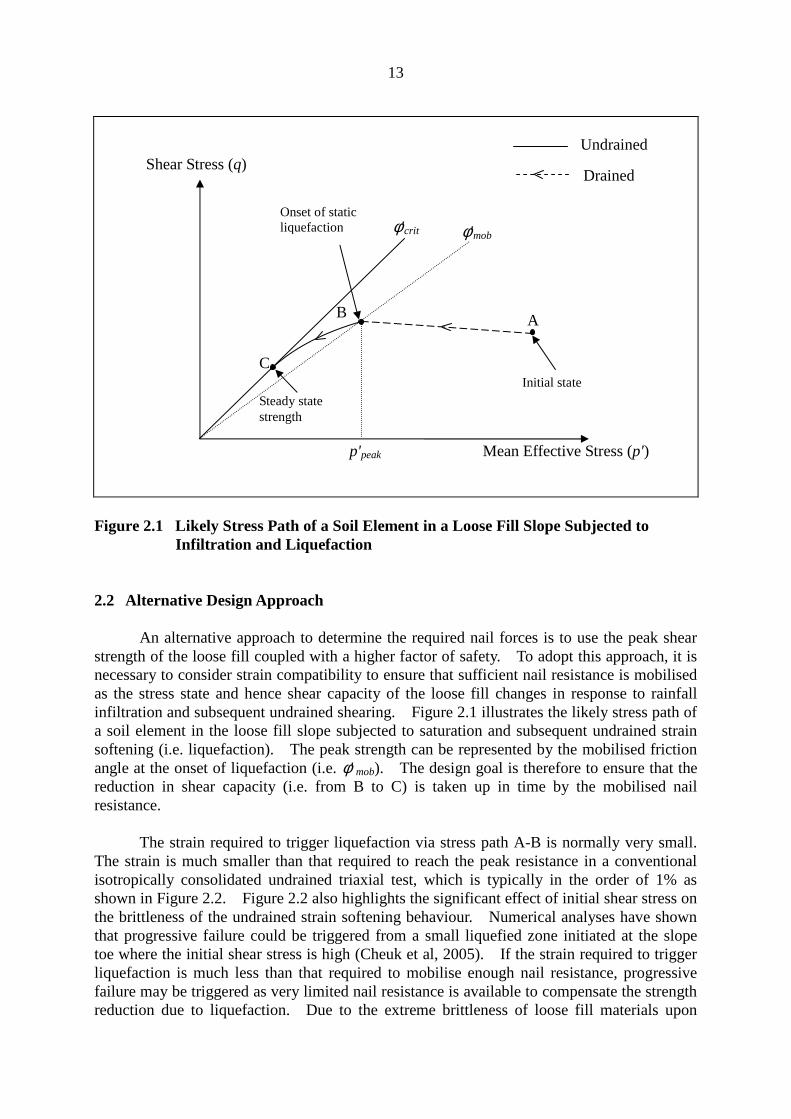
Figure 2.1 Likely Stress Path of a Soil Element in a Loose Fill Slope Subjected to Infiltration and Liquefaction
2.2 Alternative Design Approach
An alternative approach to determine the required nail forces is to use the peak shear strength of the loose fill coupled with a higher factor of safety. To adopt this approach, it is necessary to consider strain compatibility to ensure that sufficient nail resistance is mobilised as the stress state and hence shear capacity of the loose fill changes in response to rainfall infiltration and subsequent undrained shearing. Figure 2.1 illustrates the likely stress path of a soil element in the loose fill slope subjected to saturation and subsequent undrained strain softening (i.e. liquefaction). The peak strength can be represented by the mobilised friction angle at the onset of liquefaction (i.e. φ' mob). The design goal is therefore to ensure that the reduction in shear capacity (i.e. from B to C) is taken up in time by the mobilised nail resistance.
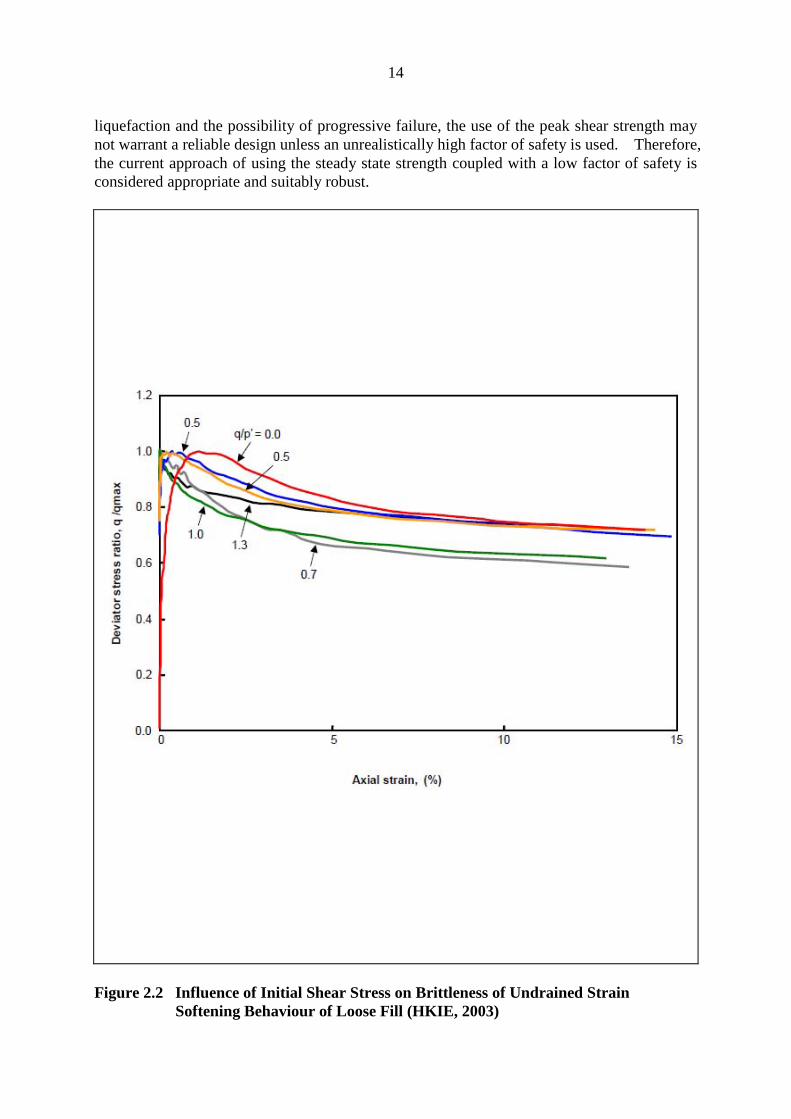
The strain required to trigger liquefaction via stress path A-B is normally very small. The strain is much smaller than that required to reach the peak resistance in a conventional isotropically consolidated undrained triaxial test, which is typically in the order of 1% as shown in Figure 2.2. Figure 2.2 also highlights the significant effect of initial shear stress on the brittleness of the undrained strain softening behaviour. Numerical analyses have shown that progressive failure could be triggered from a small liquefied zone initiated at the slope toe where the initial shear stress is high (Cheuk et al, 2005). If the strain required to trigger liquefaction is much less than that required to mobilise enough nail resistance, progressive failure may be triggered as very limited nail resistance is available to compensate the strength reduction due to liquefaction. Due to the extreme brittleness of loose fill materials upon
14
liquefaction and the possibility of progressive failure, the use of the peak shear strength may not warrant a reliable design unless an unrealistically high factor of safety is used. Therefore, the current approach of using the steady state strength coupled with a low factor of safety is considered appropriate and suitably robust.
Figure 2.2 Influence of Initial Shear Stress on Brittleness of Undrained Strain Softening Behaviour of Loose Fill (HKIE, 2003)
15
3 Properties of Loose Fill Materials in Hong Kong
3.1 General Observations
When designing soil nails in loose fill slopes, design parameters are normally derived from triaxial tests. Isotropically consolidated undrained triaxial tests are conducted on remoulded fill specimens to examine (i) the stress condition at the onset of liquefaction and (ii) the steady state undrained shear strength. In this study, recent laboratory test data have been reviewed to examine these two aspects of loose fill behaviour. The data were collected from the Public Works Central Laboratory (PWCL) for triaxial tests conducted on loose fill materials since 2003. The data set comprises 321 tests from 12 sites. The relevant soil parameters of these loose fill samples are summarised in Table 3.1. The following are general observations on the above laboratory test data:
(a) Based on the sample origin stated in the laboratory test reports, the majority of the loose fill samples are derived from completely decomposed granite (CDG). The only exception is the sample taken from Castle Peak Road, which is derived from completely decomposed volcanic (CDV). Due to insufficient data, the behaviour of fill derived from CDV should not be generalised. According to HKIE (2003), CDV is likely to be less susceptible to static liquefaction than CDG, hence the recommendations based on CDG could be applied to CDV as well.
(b) The minimum relative compaction of the test specimens that can practically be prepared in the laboratory is 75%. Even if a specimen of relative compaction lower than 75% could support itself at preparation, it would likely undergo partial collapse during the saturation stage of the triaxial test.
(c) The minimum confining pressure adopted in conventional triaxial testing is 20 kPa. This minimum value is dictated by the need to provide sufficient confinement during saturation. This requirement restricts the tests to be performed on samples taken from the top 1 m of the slope surface where the in-situ stress level is below 20 kPa.
3.2 Onset of Liquefaction
The onset of liquefaction is defined as the stress state at which the peak shear strength of the loose fill is mobilised (Figure 2.1). The mobilised friction angle at the onset of liquefaction is influenced by many factors, e.g. the degree of saturation of the soil, the effective stress path through which liquefaction is triggered, etc. The mobilised friction angle derived from a series of isotropically consolidated undrained triaxial tests is normally a conservative representation of the actual stress conditions at which liquefaction is triggered by rainfall infiltration.
To assess if a loose fill slope is vulnerable to global instability due to liquefaction, limit equilibrium analyses can be carried out to check if the conventional factor of safety can
Public Works Central Laborator Data
16
be achieved if the shear strength of the loose fill is characterised by the friction angle at the onset of liquefaction (φ'mob). In other words, if the mobilised friction angle of the loose fill, after accounting for worst possible groundwater conditions, is lower than the friction angle at the onset of liquefaction (φ'mob) with an adequate margin of safety, it can be assumed that the risk of liquefaction failure is adequately low.
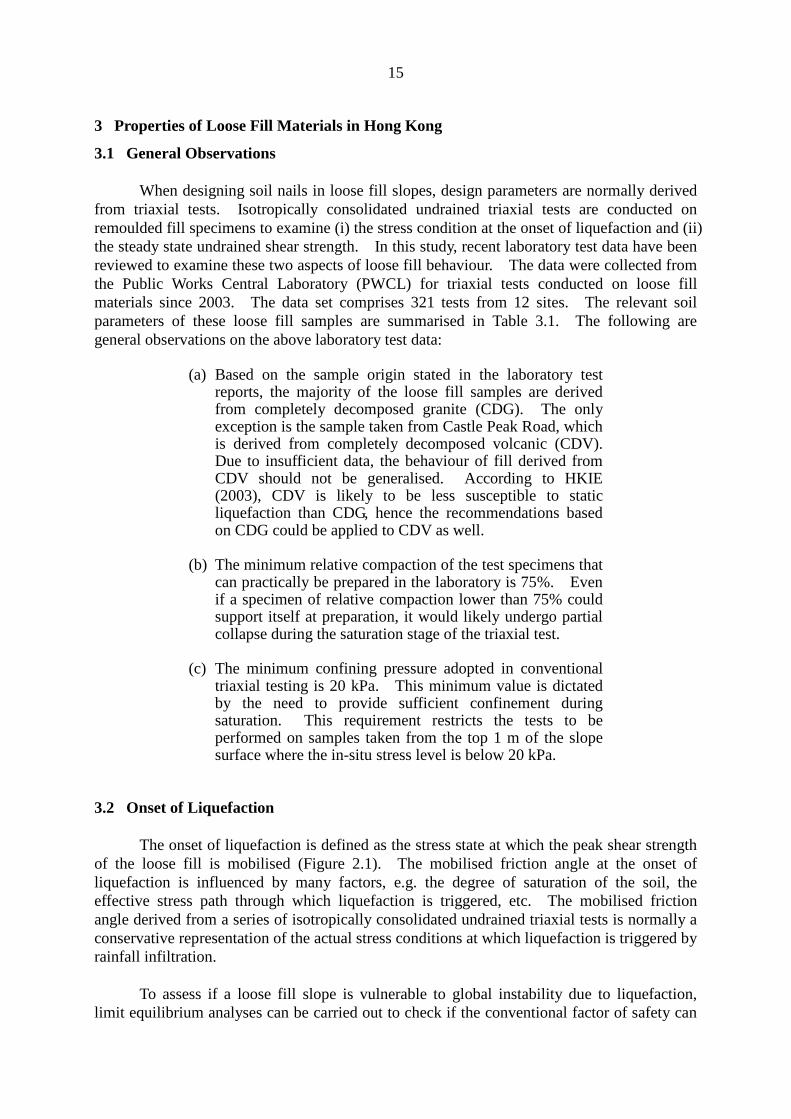
The HKIE-GD Report (HKIE, 2003) suggested that the lower bound shear strength of loose fill before the onset of liquefaction can be represented by φ'mob = 26°. Figure 3.1 plots the peak strength, qpeak, against the corresponding mean effective stress, p'peak for the recent data obtained from the PWCL. Most of the data points lie above the value of 26°, which is consistent with the test results presented in the HKIE-GD Report (HKIE, 2003). Therefore the use of this value as the lower bound shear strength before onset of liquefaction is considered conservative. The use of site-specific test results to justify a higher φ'mob may be considered. However, special attention should be paid to the stress range that the remoulded fill specimens are tested. Figure 3.1 shows that a general trend with the mobilised friction angle at the onset of liquefaction increases with confining pressure. Nonetheless, the behaviour of loose fill at these high stress levels is not relevant to loose fill slopes which typically involve shallow failures. The average φ'mob value for each loose fill sample is tabulated in Table 3.1.
y
0
50
100
150
200
250
300
350
400
450
500
0 50 100 150 200 250 300
p'peak (kPa)
qp
ea
k (k
Pa
)
CSD Training Centre
Tung Tau Wan Road
Shek On Road
HKU Research
Stubbs Road
Caine Lane
Castle Peak Road
Tai Lam Chung
Sui Wo Road
Choi Wan Road and Jordan Valley
Cafeteria Old Beach
Anderson Road
Friction angle = 26 degrees
Figure 3.1 Stress State at the Onset of Liquefaction
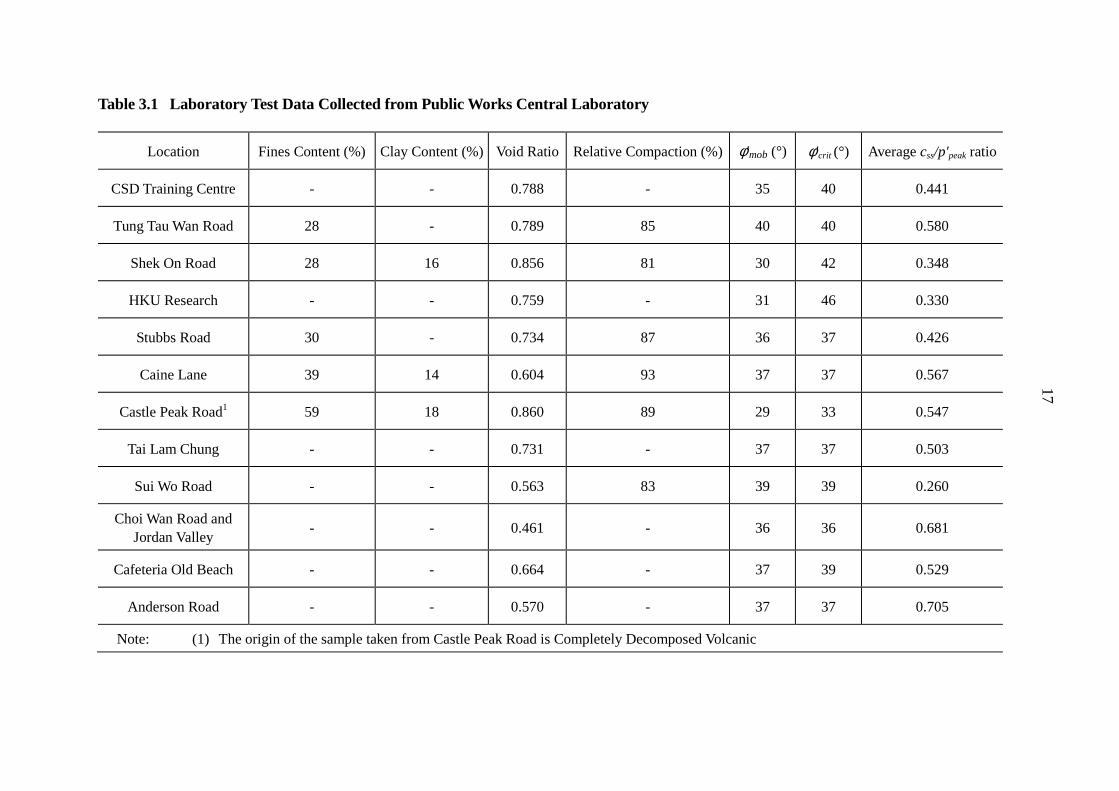
Table 3.1 Laboratory Test Data Collected from Public Works Central Laboratory
Location Fines Content (%) Clay Content (%) Void Ratio Relative Compaction (%) φ' mob (°) φ' crit (°) Average css/p'peak ratio
CSD Training Centre - - 0.788 - 35 40 0.441
Tung Tau Wan Road 28 - 0.789 85 40 40 0.580
Shek On Road 28 16 0.856 81 30 42 0.348
HKU Research - - 0.759 - 31 46 0.330
Stubbs Road 30 - 0.734 87 36 37 0.426
Caine Lane 39 14 0.604 93 37 37 0.567
Castle Peak Road1 59 18 0.860 89 29 33 0.547
Tai Lam Chung - - 0.731 - 37 37 0.503
Sui Wo Road - - 0.563 83 39 39 0.260
Choi Wan Road and Jordan Valley
- - 0.461 - 36 36 0.681
Cafeteria Old Beach - - 0.664 - 37 39 0.529
Anderson Road - - 0.570 - 37 37 0.705
17
Note: (1) The origin of the sample taken from Castle Peak Road is Completely Decomposed Volcanic
Triaxial tests conducted on very shallow samples
18
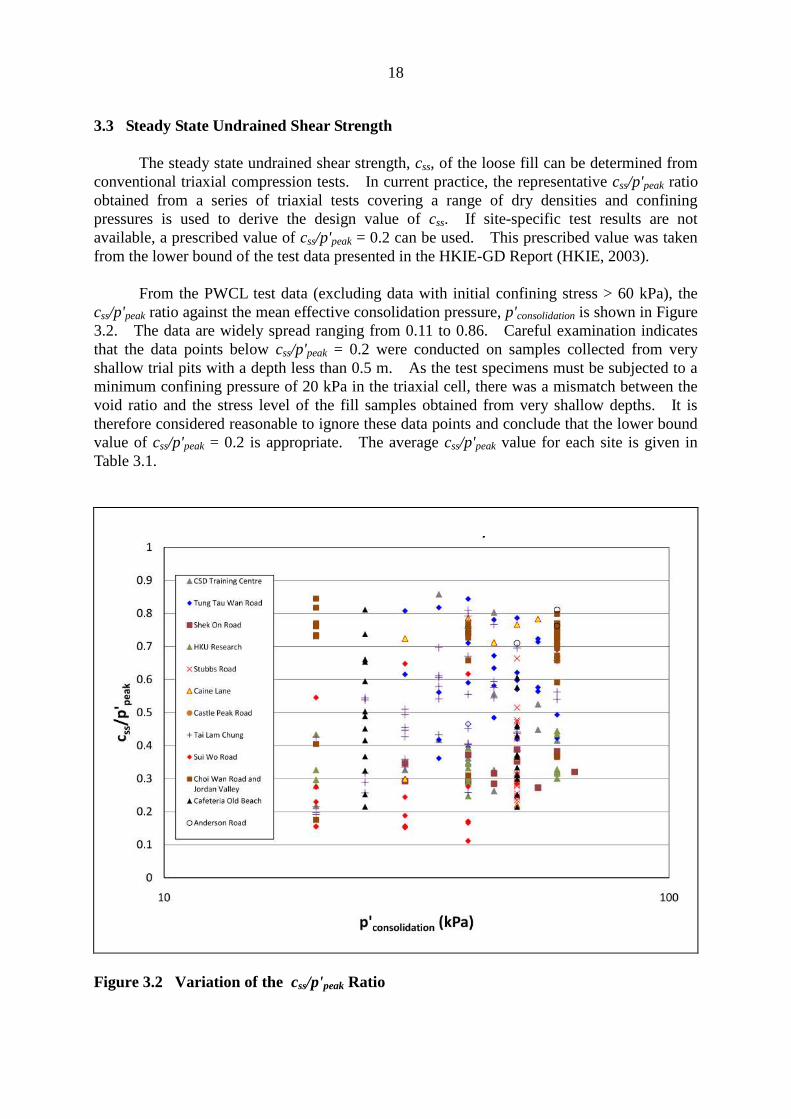
3.3 Steady State Undrained Shear Strength
The steady state undrained shear strength, css, of the loose fill can be determined from conventional triaxial compression tests. In current practice, the representative css/p'peak ratio obtained from a series of triaxial tests covering a range of dry densities and confining pressures is used to derive the design value of css. If site-specific test results are not available, a prescribed value of css/p'peak = 0.2 can be used. This prescribed value was taken from the lower bound of the test data presented in the HKIE-GD Report (HKIE, 2003).
From the PWCL test data (excluding data with initial confining stress > 60 kPa), the css/p'peak ratio against the mean effective consolidation pressure, p'consolidation is shown in Figure 3.2. The data are widely spread ranging from 0.11 to 0.86. Careful examination indicates that the data points below css/p'peak = 0.2 were conducted on samples collected from very shallow trial pits with a depth less than 0.5 m. As the test specimens must be subjected to a minimum confining pressure of 20 kPa in the triaxial cell, there was a mismatch between the void ratio and the stress level of the fill samples obtained from very shallow depths. It is therefore considered reasonable to ignore these data points and conclude that the lower bound value of css/p'peak = 0.2 is appropriate. The average css/p'peak value for each site is given in Table 3.1.
Figure 3.2 Variation of the css/p'peak Ratio
19
The test data collected from the PWCL were also analysed in the light of critical state soil mechanics in an attempt to establish the relationship between in-situ void ratio and critical state (steady state) shear strength. However, it was concluded that the critical state line is not unique on the e-ln p' plane, implying that no unique relationship exists between void ratio and steady state undrained shear strength. Law et al (1998) reported the same observation and suggested that the non-unique steady state lines can be normalised on the basis of the degree of compaction. Such soil behaviour is termed “transitional soil behaviour” in recent research (e.g. Mayne et al, 2009). The location of the critical state line is also affected by particle size distribution and mineralogy of the soil, as well as degree of saturation of the soil (Carrera et al, 2011). Details of the assessment on the PWCL data are presented in Appendix A.
20
4 Stabilising Mechanisms of Loose Fill Slopes Upgraded by Soil Nails
4.1 Overview
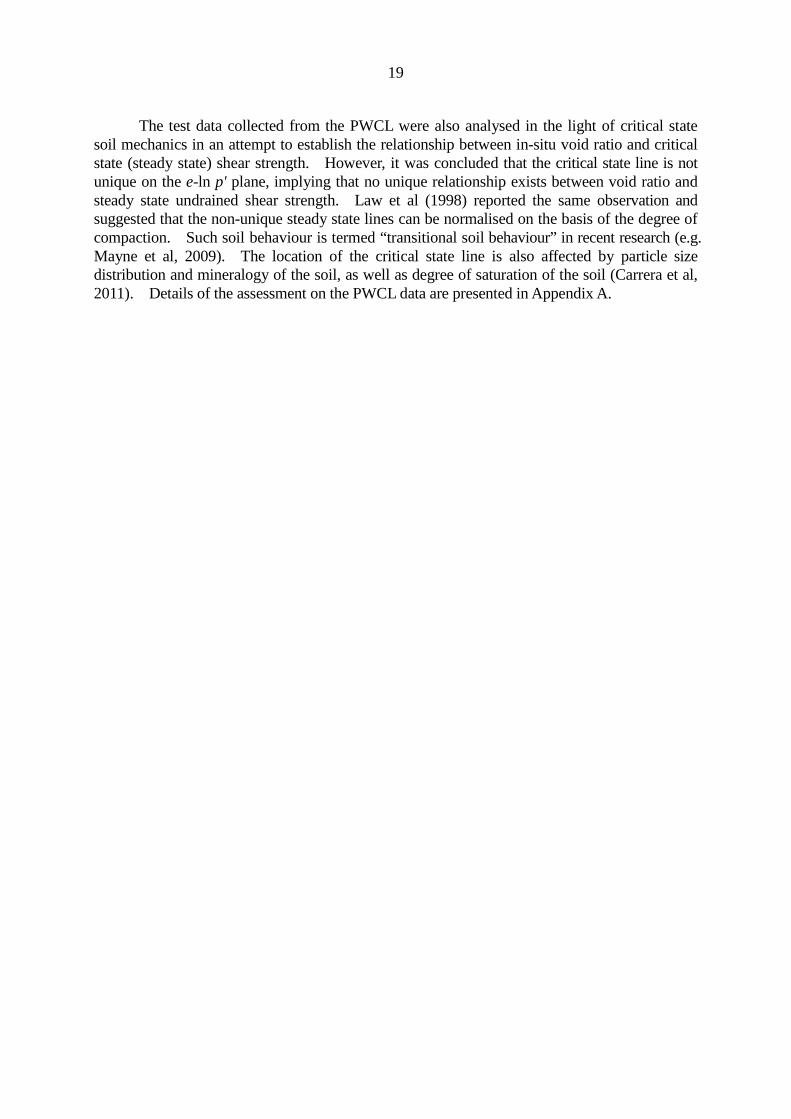
In current practice, soil nails in loose fill slopes are designed to sustain the earth pressure exerted on the concrete grillage facing upon the fill reaching full liquefaction (i.e. the entire loose fill body undergoes undrained strain-softening). The most efficient nail arrangement to resist the uplift earth pressure is to have the nails nearly perpendicular to the grillage facing, rendering the soil nails steeply inclined. Previous studies have revealed that an increase in soil nail inclination would decrease the tensile forces mobilised in the nails, and in turn reduce the stabilising effect and compressive forces may even be mobilised in steeply inclined nails (Jewell & Worth, 1987; Shiu & Chang, 2006).
There is also a concern that nail forces could not be mobilised effectively in the steeply inclined nails in the event of a sliding failure (e.g. interface liquefaction as discussed below) and that the orientation of the nails is not favourable for countering sliding failure. As illustrated in the Figure 4.1a, if the soil nails are perpendicular to the sliding motion, the driving force (grey arrow) is only resisted by the soil shear strength along the slip surface (red arrow); any mobilised tensile forces in the nails (black arrows) would not contribute to countering sliding failure under undrained conditions. The soil nails need to bend to such an extent that the component of the nail forces along the sliding direction (blue arrows) as shown in Figure 4.1(b) can be mobilised.
(a) Force Diagram for Original Nail Configuration
(b) Force Diagram for Deformed Nail Configuration
Figure 4.1 Steeply Inclined Nails under Sliding Mode of Failure
21
To examine the stabilising mechanisms of soil nails in loose fill slopes, a series of numerical analyses have been conducted using finite difference computer program FLAC (version 4.0). The objectives of these analyses are to examine the nail force mobilisation mechanisms for steeply inclined soil nails and to explore possible benefits by altering the inclinations of the soil nails. The analyses examine the behaviour of a 10 m high loose fill slope inclined at 34° to the horizontal (i.e. 1(V):1.5 (H)) with 3 m uniform depth of loose fill overlying completely decomposed granite. The assumed ground profile simplifies the highly variable nature of loose fill profile originated from end-tipping. Parametric studies have also been conducted to investigate the influence of slope height, slope angle and fill profile (i.e. uniform and tapered profiles).
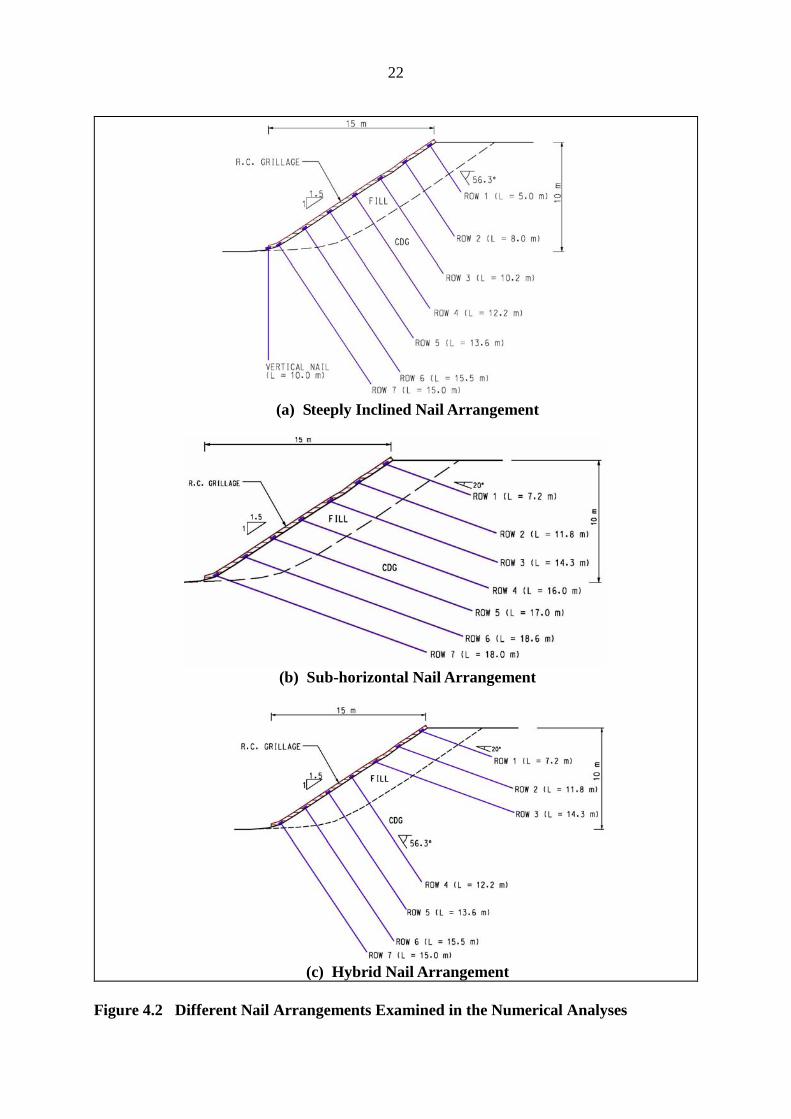
Three different nail arrangements as shown in Figure 4.2 have been examined. The first nail arrangement consists of seven rows of soil nails which are perpendicular to the slope surface. This represents the typical nail arrangement in current practice. In the second case, the nails are sub-horizontal (i.e. inclined at 20º to the horizontal), which is a typical nail inclination in cut slopes. The third nail arrangement adopts a combination of sub-horizontal and steeply inclined nails. To determine the nail lengths in each case, limit equilibrium analyses were first carried out to determine the required stabilising surface pressure to prevent overall instability of the slope, with a global safety factor of 1.1. The analyses assume that the entire loose fill has reached the steady state undrained shear strength of css = 0.13 σ'v
1, where σ'v is the in-situ vertical effective stress. No perched water table was assumed in the analysis. A small basal shear of 3 kPa was assumed at the interface between the base of the grillage facing and the surface of the fill slope. The required nail lengths were then calculated by transforming the triangular surface pressure to discrete line forces. This is essentially the current design method as described in HKIE-GD Report (HKIE, 2003). The adopted nail lengths are shown in Figure 4.2.
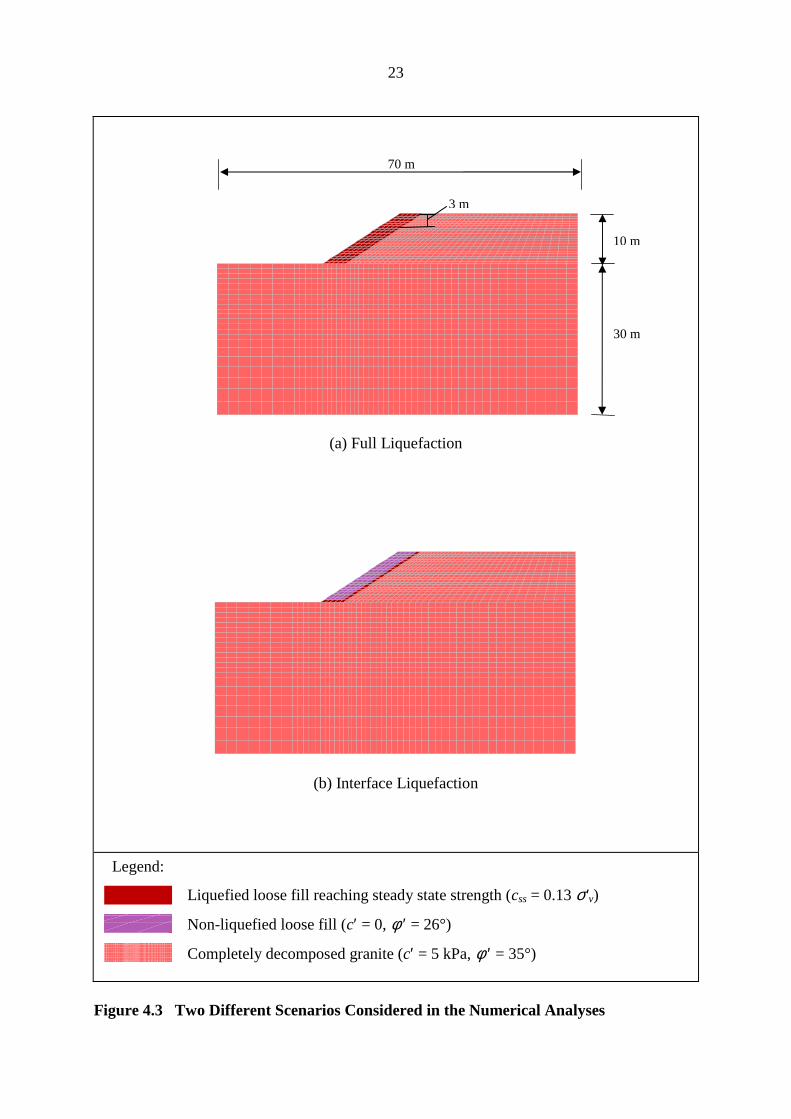
Two scenarios have been considered in the numerical analyses (Figure 4.3):
(a) Full liquefaction – the entire fill body liquefies and reaches the steady state undrained shear strength (css), where css = 0.13 σ'v, and
(b) Interface liquefaction – only a layer (0.5 m thick) of fill material at the base of the fill body liquefies and reaches the steady state undrained shear strength (css). The saturated fill above the liquefied layer is modelled by drained parameters (c′ = 0, φ ′ = 26). This is to simulate a sliding failure corresponding to liquefaction occurring within a relatively thin layer of loose fill.
Details of the numerical analyses, including the input parameters, modelling procedures and numerical results, are presented in Appendix B.
1 As css/p'peak = 0.2 and p'peak = 0.67σ'v (i.e. assuming K0 = 0.5), hence, css = 0.13 σ'v
22
(a) Steeply Inclined Nail Arrangement
(b) Sub-horizontal Nail Arrangement
(c) Hybrid Nail Arrangement
Figure 4.2 Different Nail Arrangements Examined in the Numerical Analyses
23
70 m 3 m
10 m
30 m
(a) Full Liquefaction
(b) Interface Liquefaction
Legend:
Liquefied loose fill reaching steady state strength (css = 0.13 σ'v)
Non-liquefied loose fill (c′ = 0, φ ′ = 26°)
Completely decomposed granite (c′ = 5 kPa, φ ′ = 35°)
Figure 4.3 Two Different Scenarios Considered in the Numerical Analyses
24
4.2 Influence of Nail Inclination on Stabilising Mechanisms
4.2.1 Steeply Inclined Nail Arrangement
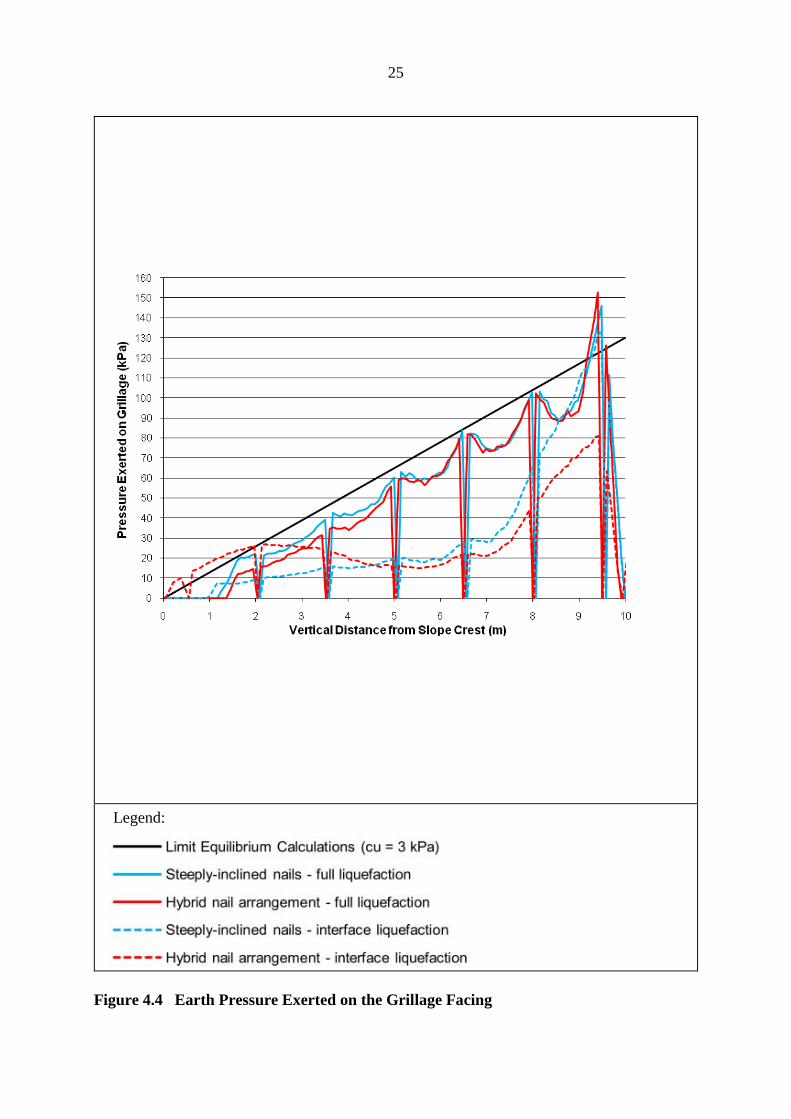
The numerical analyses show that, under full liquefaction, the unbalanced earth pressure acting on the slope cover (i.e. grillage facing) mobilises tensile forces in the steeply inclined nails. The nail arrangement therefore satisfies the design objective of sustaining the earth pressure exerted on the structural facing upon liquefaction of the loose fill. The distribution of earth pressure determined from the numerical analyses is triangular in shape (Figure 4.4), which is in agreement with the stabilising surface pressure assumed in the limit equilibrium analysis. This is a direct result of not including any nail-ground interaction within the fill layer (which is an assumption made in the numerical model – see Appendix B).
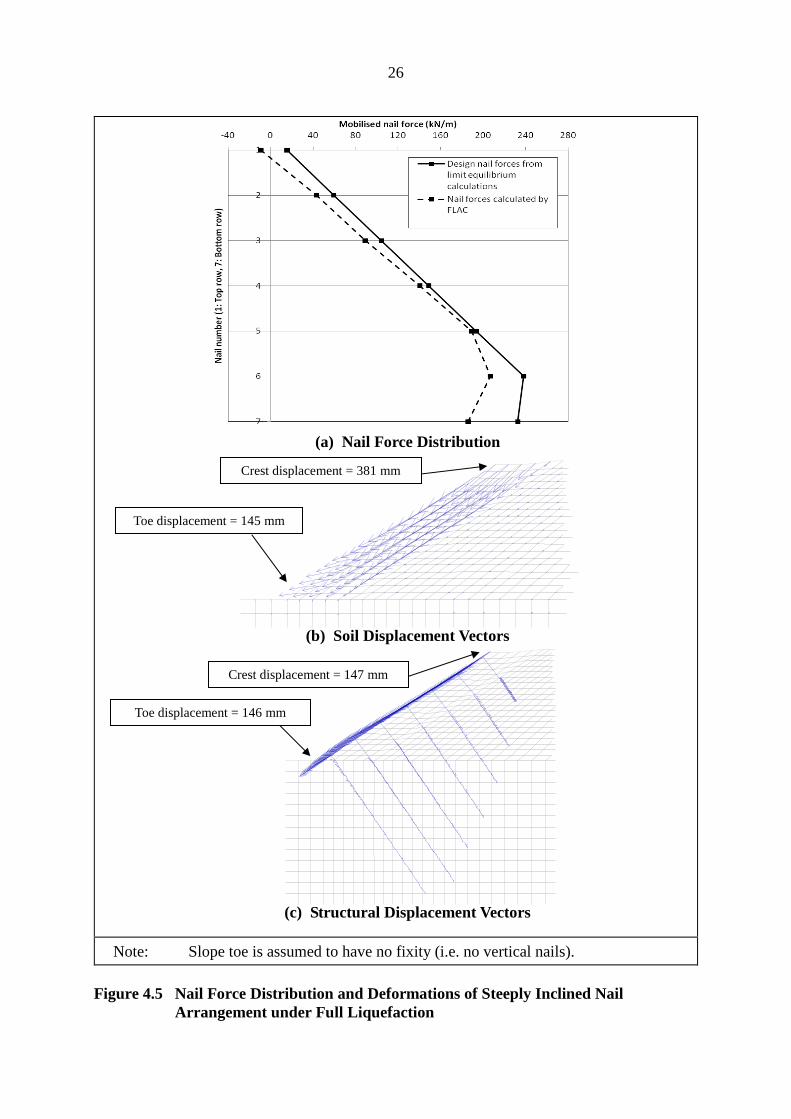
Under full liquefaction, the distribution of the mobilised nail forces predicted by FLAC is in agreement with the design nail force distribution determined by the limit equilibrium analyses (Figure 4.5(a)). Despite the effective mobilisation of nail forces, large slope and structural deformations (Figures 4.5(b) and 4.5(c)) are triggered. The deformation pattern suggests that the system has very limited structural rigidity along the potential sliding direction. Sensitivity analyses demonstrate that the deformation could be reduced, to some extent, by incorporating a structural element (e.g. vertical nails or embedded toe wall) at the slope toe. Details of the sensitivity study are presented in Appendix B.
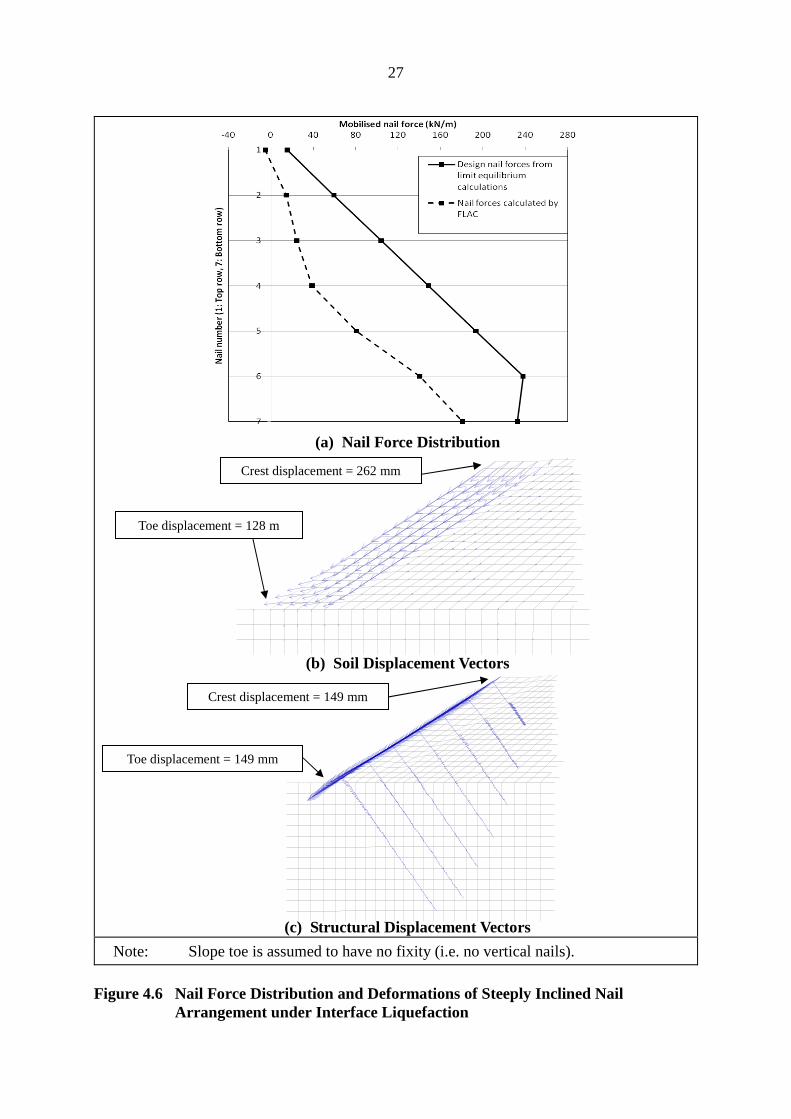
Under interface liquefaction, the unbalanced earth pressure acting on the grillage facing is reduced (Figure 4.4). The mobilised nail forces predicted by FLAC are much lower than the design nail force determined by the limit equilibrium analyses (Figure 4.6(a)). Although numerical convergence (i.e. overall system stability) could be achieved in the numerical model, the bending of the soil nails is prominent. As in the case of full liquefaction, large soil and structural deformations are triggered along the potential sliding direction due to limited structural rigidity. Whilst the unbalanced earth pressure acting on the grillage facing is reduced, the bending of the soil nails towards the sliding direction in order to gain sufficient stabilising force against sliding failure has given rise to large structural facing and soil deformations (Figures 4.6(b) and 4.6(c)).
Despite the large deformation, steeply inclined nails still serve to improve the stability of the system for the selected scenarios considered in the analyses. Since the instability condition in the event of interface liquefaction is less severe than that of full liquefaction, and given the reduced brittleness of the system, the risk of uncontrolled failure could be reduced even if steeply inclined soil nails are used, albeit the overall stability of the system has to rely on the large-strain behaviour of the system in the cases analysed. Given the low bending stiffness of the soil nails, the bending action may not affect the structural integrity of the system but may incur considerable structural facing movement, especially when the free lengths of the soil nails are large (i.e. in a thick fill deposit).
25
Legend:
Figure 4.4 Earth Pressure Exerted on the Grillage Facing
26
(a) Nail Force Distribution
Crest displacement = 381 mm
Toe displacement = 145 mm
(b) Soil Displacement Vectors
Crest displacement = 147 mm
Toe displacement = 146 mm
(c) Structural Displacement Vectors
Note: Slope toe is assumed to have no fixity (i.e. no vertical nails).
Figure 4.5 Nail Force Distribution and Deformations of Steeply Inclined Nail Arrangement under Full Liquefaction
27
(a) Nail Force Distribution
Crest displacement = 262 mm
Toe displacement = 128 m
(b) Soil Displacement Vectors
Crest displacement = 149 mm
Toe displacement = 149 mm
Note:
(c) Structural Displacement Vectors
Slope toe is assumed to have no fixity (i.e. no vertical nails).
Figure 4.6 Nail Force Distribution and Deformations of Steeply Inclined Nail Arrangement under Interface Liquefaction
28
4.2.2 Sub-horizontal Nail Arrangement
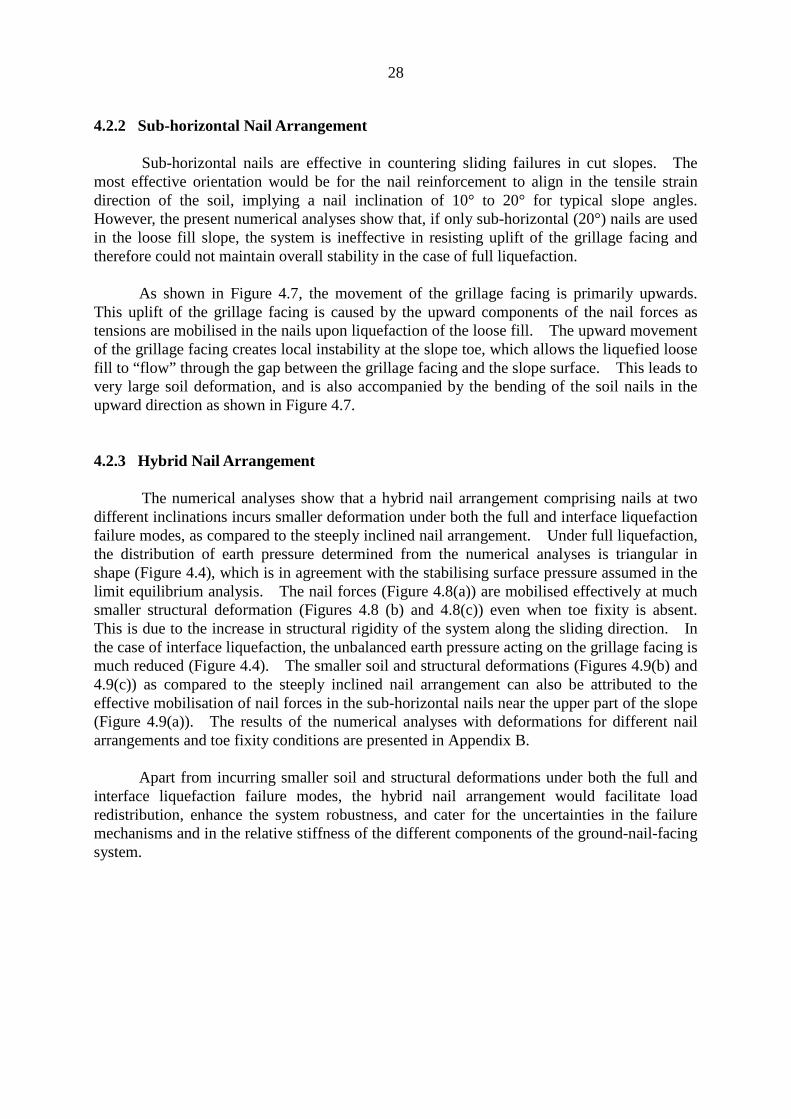
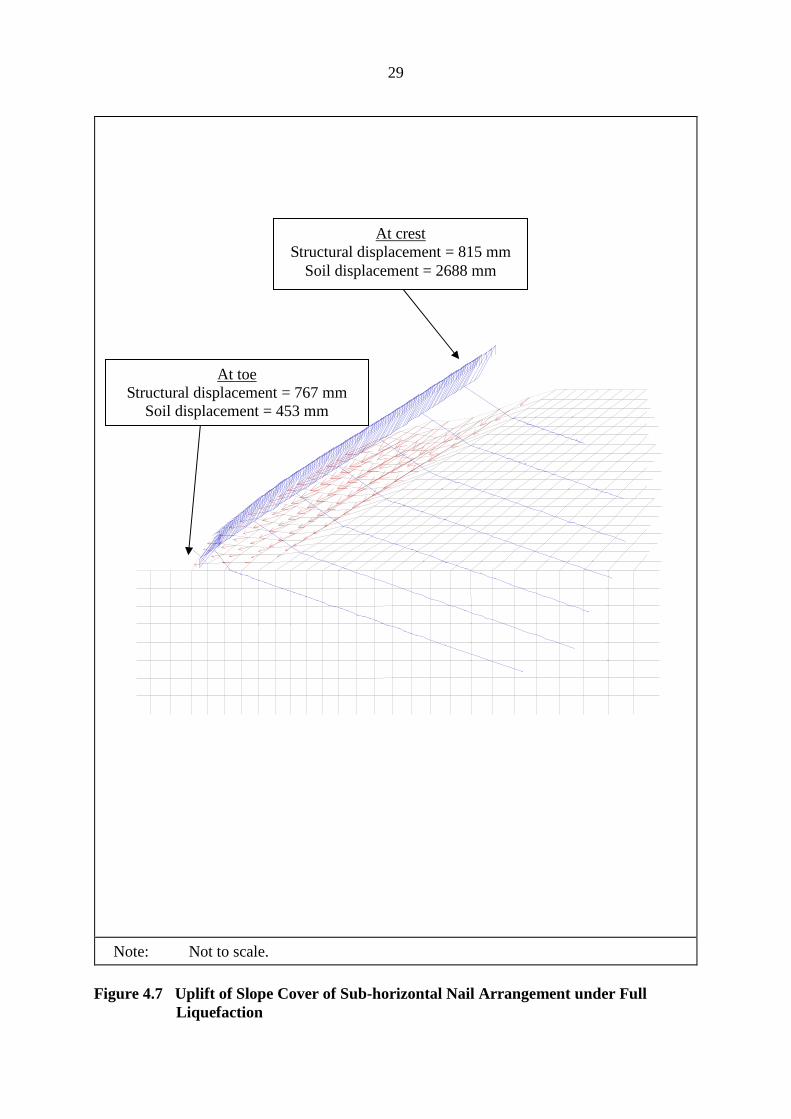
Sub-horizontal nails are effective in countering sliding failures in cut slopes. The most effective orientation would be for the nail reinforcement to align in the tensile strain direction of the soil, implying a nail inclination of 10° to 20° for typical slope angles. However, the present numerical analyses show that, if only sub-horizontal (20°) nails are used in the loose fill slope, the system is ineffective in resisting uplift of the grillage facing and therefore could not maintain overall stability in the case of full liquefaction.
As shown in Figure 4.7, the movement of the grillage facing is primarily upwards. This uplift of the grillage facing is caused by the upward components of the nail forces as tensions are mobilised in the nails upon liquefaction of the loose fill. The upward movement of the grillage facing creates local instability at the slope toe, which allows the liquefied loose fill to “flow” through the gap between the grillage facing and the slope surface. This leads to very large soil deformation, and is also accompanied by the bending of the soil nails in the upward direction as shown in Figure 4.7.
4.2.3 Hybrid Nail Arrangement
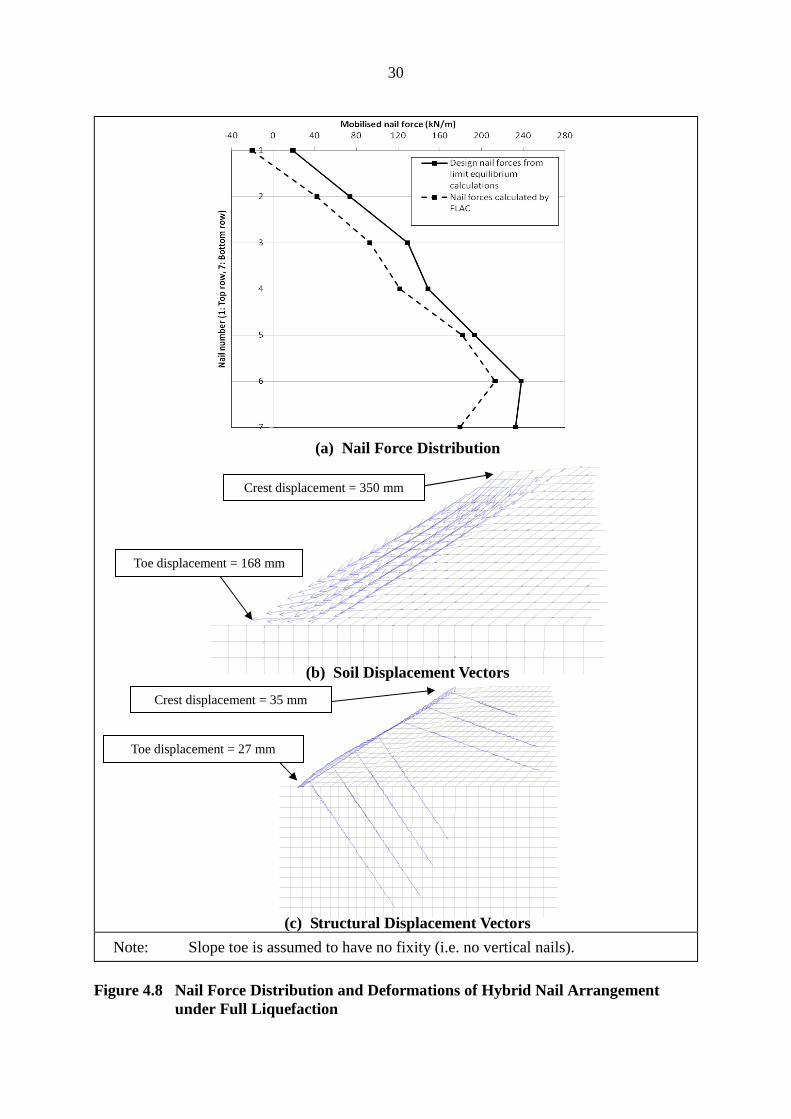
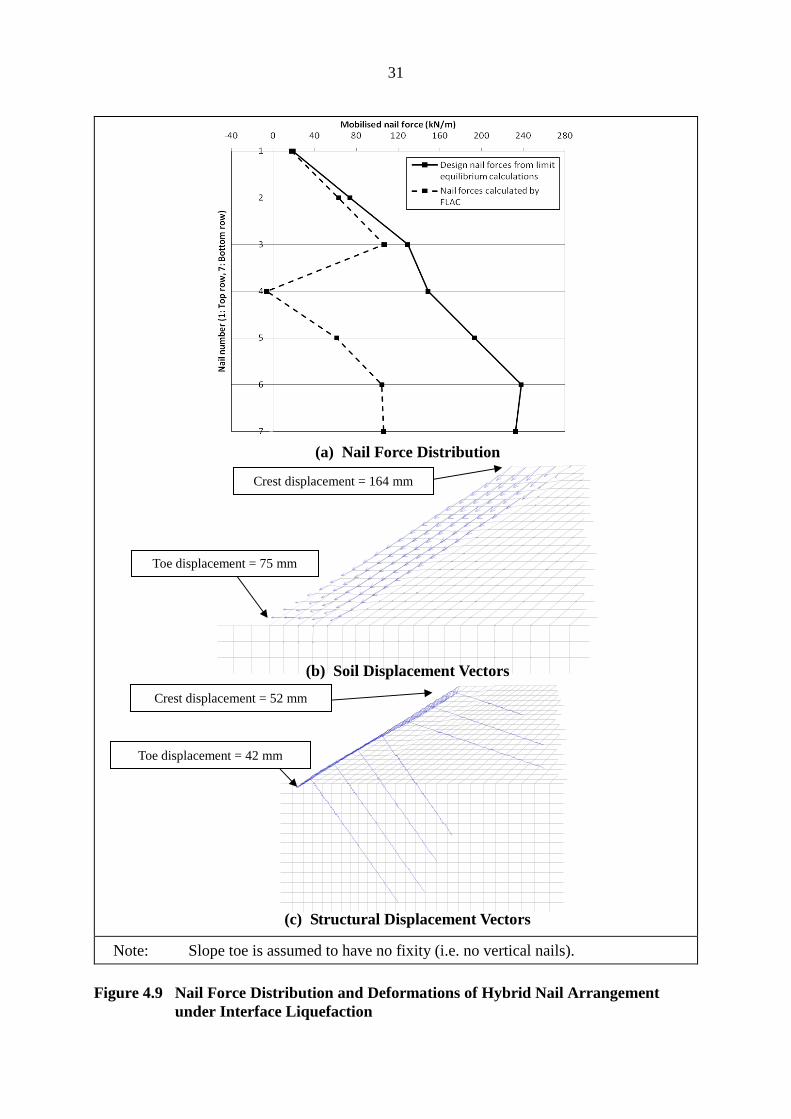
The numerical analyses show that a hybrid nail arrangement comprising nails at two different inclinations incurs smaller deformation under both the full and interface liquefaction failure modes, as compared to the steeply inclined nail arrangement. Under full liquefaction, the distribution of earth pressure determined from the numerical analyses is triangular in shape (Figure 4.4), which is in agreement with the stabilising surface pressure assumed in the limit equilibrium analysis. The nail forces (Figure 4.8(a)) are mobilised effectively at much smaller structural deformation (Figures 4.8 (b) and 4.8(c)) even when toe fixity is absent. This is due to the increase in structural rigidity of the system along the sliding direction. In the case of interface liquefaction, the unbalanced earth pressure acting on the grillage facing is much reduced (Figure 4.4). The smaller soil and structural deformations (Figures 4.9(b) and 4.9(c)) as compared to the steeply inclined nail arrangement can also be attributed to the effective mobilisation of nail forces in the sub-horizontal nails near the upper part of the slope (Figure 4.9(a)). The results of the numerical analyses with deformations for different nail arrangements and toe fixity conditions are presented in Appendix B.
Apart from incurring smaller soil and structural deformations under both the full and interface liquefaction failure modes, the hybrid nail arrangement would facilitate load redistribution, enhance the system robustness, and cater for the uncertainties in the failure mechanisms and in the relative stiffness of the different components of the ground-nail-facing system.
29
At crest Structural displacement = 815 mm
Soil displacement = 2688 mm
At toe Structural displacement = 767 mm
Soil displacement = 453 mm
Note: Not to scale.
Figure 4.7 Uplift of Slope Cover of Sub-horizontal Nail Arrangement under Full Liquefaction
30
(a) Nail Force Distribution
Crest displacement = 350 mm
Toe displacement = 168 mm
(b) Soil Displacement Vectors
Crest displacement = 35 mm
Toe displacement = 27 mm
Note:
(c) Structural Displacement Vectors
Slope toe is assumed to have no fixity (i.e. no vertical nails).
Figure 4.8 Nail Force Distribution and Deformations of Hybrid Nail Arrangement under Full Liquefaction
31
(a) Nail Force Distribution
Crest displacement = 164 mm
Toe displacement = 75 mm
(b) Soil Displacement Vectors
Crest displacement = 52 mm
Toe displacement = 42 mm
(c) Structural Displacement Vectors
Note: Slope toe is assumed to have no fixity (i.e. no vertical nails).
Figure 4.9 Nail Force Distribution and Deformations of Hybrid Nail Arrangement under Interface Liquefaction
32
4.3 Influence of Fill Geometry
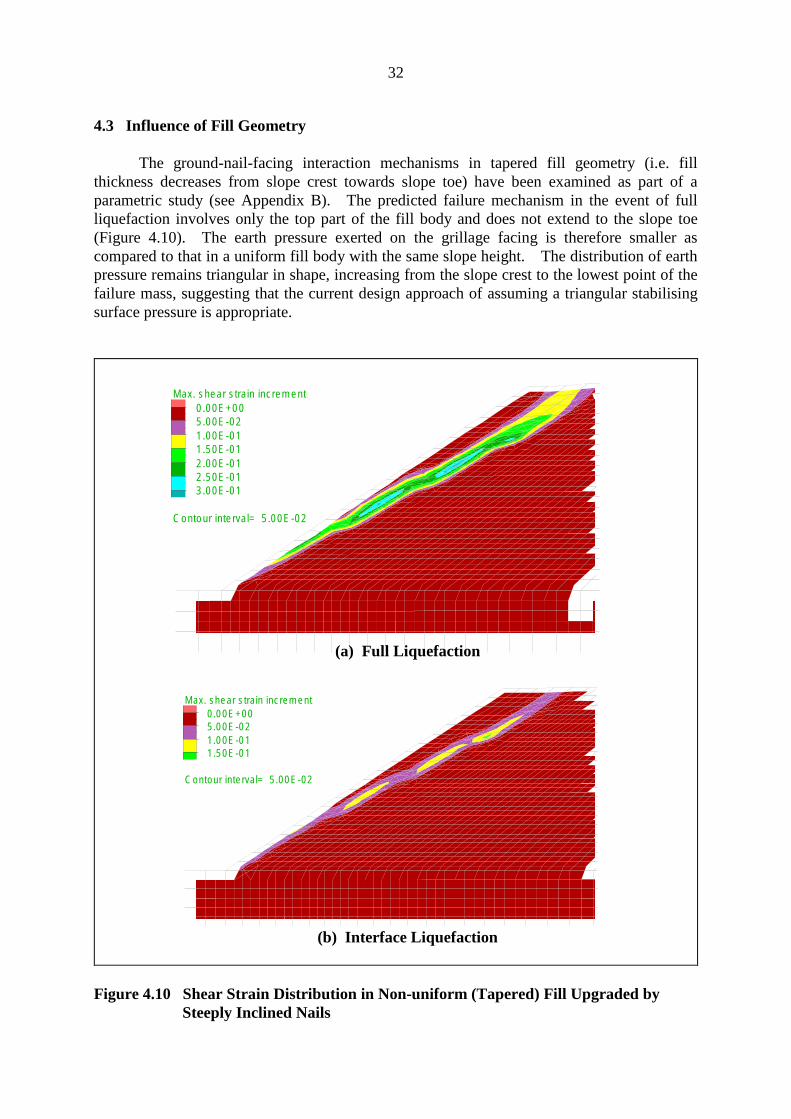
The ground-nail-facing interaction mechanisms in tapered fill geometry (i.e. fill thickness decreases from slope crest towards slope toe) have been examined as part of a parametric study (see Appendix B). The predicted failure mechanism in the event of full liquefaction involves only the top part of the fill body and does not extend to the slope toe (Figure 4.10). The earth pressure exerted on the grillage facing is therefore smaller as compared to that in a uniform fill body with the same slope height. The distribution of earth pressure remains triangular in shape, increasing from the slope crest to the lowest point of the failure mass, suggesting that the current design approach of assuming a triangular stabilising surface pressure is appropriate.
Max. shear strain increment 0.00E+00 5.00E-02 1.00E-01 1.50E-01 2.00E-01 2.50E-01 3.00E-01
Contour interval= 5.00E-02
(a) Full Liquefaction
Max. shear strain increment 0.00E+00 5.00E-02 1.00E-01 1.50E-01
Contour interval= 5.00E-02
(b) Interface Liquefaction
Figure 4.10 Shear Strain Distribution in Non-uniform (Tapered) Fill Upgraded by Steeply Inclined Nails
33
For interface liquefaction, the slip surface in a tapered fill body is gentler as compared to that in a uniform fill. The steeply inclined nails are not exactly perpendicular to the sliding direction, but contain a small component of nail force which directly resists the sliding motion. This is considered a less critical scenario as far as stability condition is concerned.
The numerical analyses show that the hybrid nail arrangement is more robust irrespective of the fill geometry. The numerical results of the steeply inclined nail arrangement in thin and thick tapered fill geometry under full and interface liquefaction are presented in Figures B.13, B.15, B.24 and B.26 respectively. The corresponding results for the hybrid nail arrangement are shown in Figures B.14, B.16, B.25 and B.27 respectively.
4.4 Local Stability at Grillage Openings
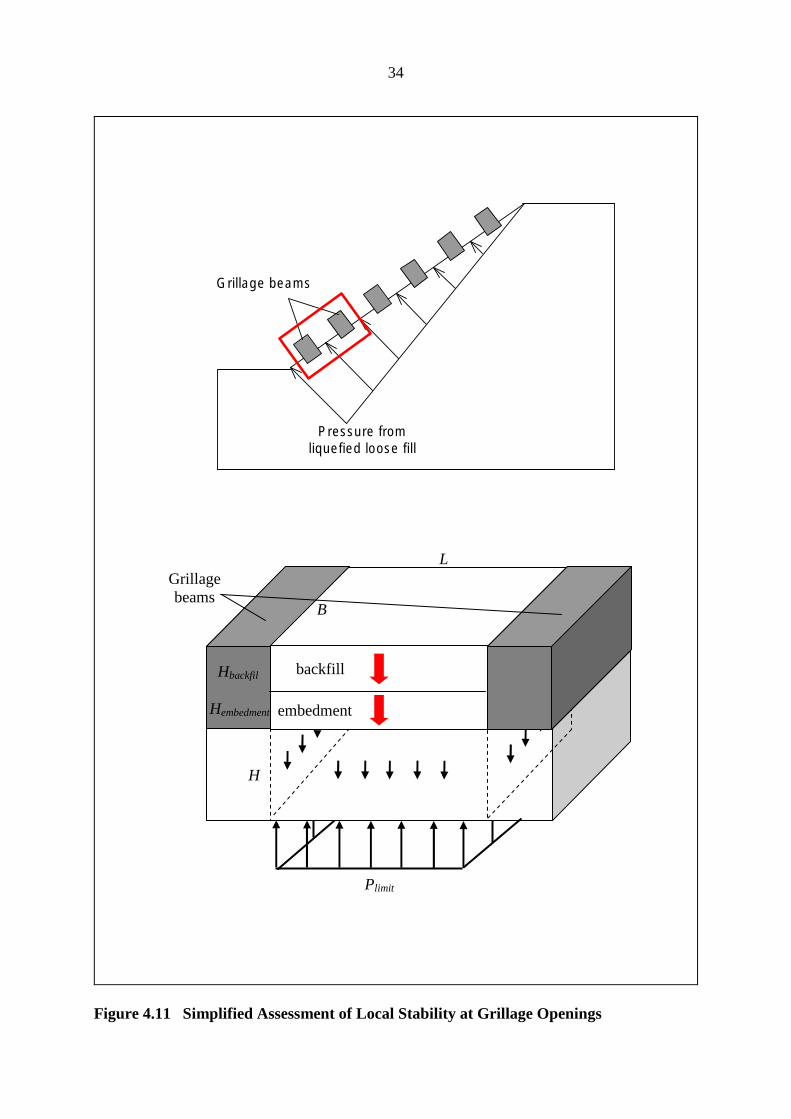
The limiting earth pressure that the grillage facing could sustain depends upon the size of the grillage openings and the shear strength of the loose fill. Two-dimensional analyses presented in Section 4.2 demonstrate that the earth pressure exerted on the grillage facing is governed by the extent of liquefaction within the loose fill body. By assuming the limiting earth pressure (Plimit) that the grillage facing could sustain is equal to the weight of the overburden (which include the backfill and the soil enclosed by the grillage embedment) plus the shear resistance available along the vertical sliding surfaces of the soil block (Figure 4.11), the upper bound Plimit can be represented by the following equation:
2cu (L + B) H + γ s cos β L B (Hbackfill + Hembedment )P = ..................... (4.1) limit L B
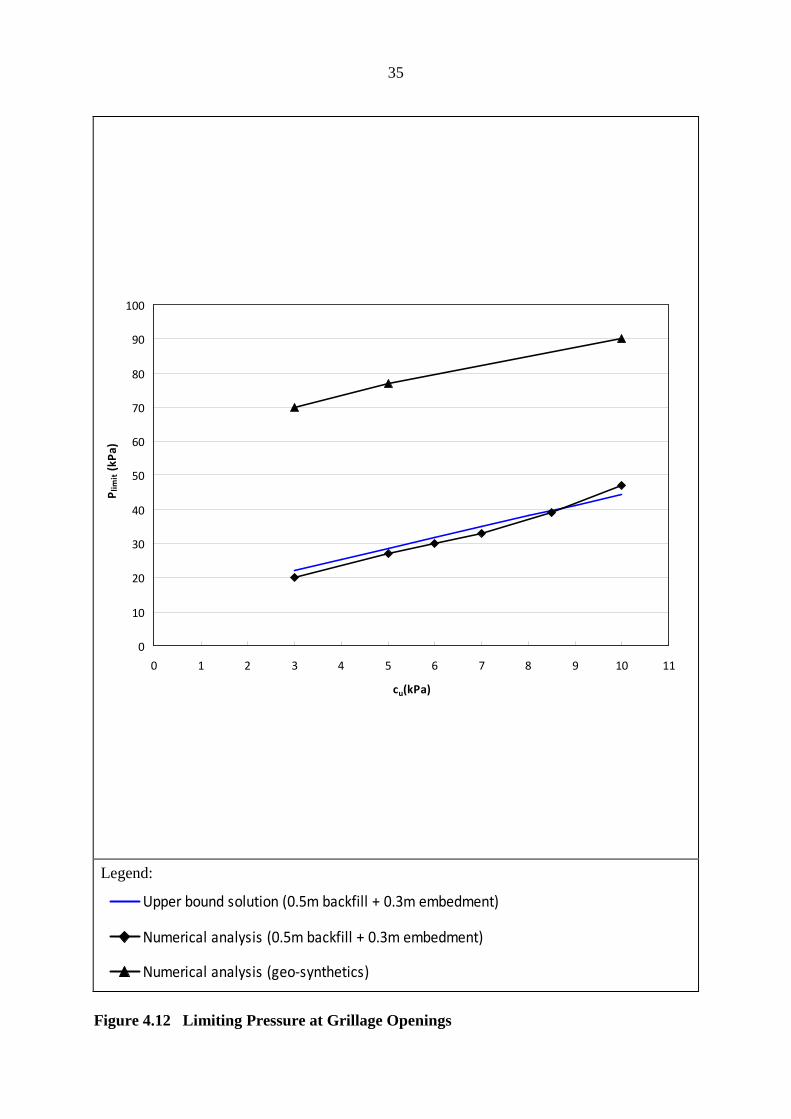
The current practice is to adopt a grillage facing with an opening area equivalent to 50% of the overall plan area. For a typical slope with a 34° slope angle (i.e. β = 34°), a nominal grillage embedment of 0.3 m (i.e. Hembedment = 0.3 m), a backfill depth of 0.5 m (i.e. Hbackfill = 0.5 m), and by assuming that the influence zone (H) is 1 m below the base of the grillage facing, the limiting pressure (Plimit) would be in the order of 20 to 45 kPa (Figure 4.12). This implies that the limiting pressure is less than the anticipated earth pressure in the event of full liquefaction (Figure 4.4).
FLAC3D analyses have been carried out to verify the upper bound solution represented by Eq. (4.1), and the results were found to compare well with the upper bound solution (Figure 4.12). In practice, Plimit can be further increased by providing a layer of geo-synthetics underneath the grillage facing. The increase in the limiting pressure predicted by the FLAC3D analysis is shown in Figure 4.12. The geo-synthetics assumed in the analysis have a Young’s modulus of 72 MPa and a tensile strength of 90 kN/m.
The simple upper bound solution and the numerical analyses consider the case of full liquefaction. This conservative assumption ignores the possibility of partially drained soil behaviour and the associated arching effects near the grillage opening where drainage distance is short. In addition, the low stress level near the slope surface would also reduce the likelihood of liquefaction. For interface liquefaction, the earth pressure exerted on the grillage facing would be much smaller and the risk of squeezing out is significantly reduced.
L
34
Grillage beams
Pressure from liquefied loose fill
L Grillage beams
B
backfill Hbackfil
Hembedment embedment
H
Plimit
Figure 4.11 Simplified Assessment of Local Stability at Grillage Openings
35
0
10
20
30
40
50
60
70
80
90
100
Pli
mit
(k
Pa
)
0 1 2 3 4 5 6 7 8 9 10 11
c (kPa) u
Legend:
Upper bound solution (0.5m backfill + 0.3m embedment)
Numerical analysis (0.5m backfill + 0.3m embedment)
Numerical analysis (geo-synthetics)
Figure 4.12 Limiting Pressure at Grillage Openings
36
5 Design Recommendations
5.1 Shear Strength Parameters
The HKIE-GD Report (HKIE, 2003) recommends a design steady state undrained shear strength of css = 0.2 × p′ peak if site-specific test data are not available. A review of about 50 numbers LPM Stage 3 Study Reports completed between 2003 and 2009 reveals that approximately 70% of the designs had adopted site-specific laboratory testing. The measured shear strength corresponds to a css/p′ peak ratio in the range of 0.24 to 0.50, except for one site which is up to 0.60. The higher values of the measured shear strength suggest that site-specific laboratory testing should be strongly encouraged to avoid the use of overly conservative lower bound design parameters. Also, it is noted that some designers opt to take the lower bound strength from the laboratory tests as the design strength. The guidance given in Sections 5.2 and 5.3 of Geoguide 1 (GEO, 1993) should be followed in the selection of design value, with due regard to the variability the fill materials and the strain-softening behaviour of loose fill.
When the design undrained shear strength of the loose fill is determined from a particular css/p′ peak ratio, the mean effective stress (p′) can be assumed to be equal to 0.67σ'v, where σ'v is the effective vertical stress. This implies an at-rest earth pressure coefficient (K0) of 0.5, which can be considered conservative unless a more representative estimate of the K0
value is available.
When soil samples are collected from the site for laboratory testing, samples from very shallow depths (<1 m) should be treated with caution. The minimum confining stress that can be practically applied in conventional triaxial tests is about 20 kPa. If the remoulded fill specimens are prepared to replicate the in-situ dry density at very shallow depths, the restrictions on the minimum stress level for triaxial tests may result in the “loose” fill specimens being tested at a higher stress level as compared to its in-situ stress state. The test results may overestimate the liquefaction potential of the soil, and hence may lead to over-conservative (i.e. unrealistically low) design strengths. Reference should be made to Section 10 of HKIE (2003) for other guidance on laboratory testing.
The present study has also established that the friction angle corresponding to the onset of liquefaction can be conservatively represented by φ' mob = 26°. The use of site-specific test results to justify a higher φ' mob value may be considered, subject to the consideration of variability of the fill materials.
5.2 Limit Equilibrium Analyses
An important step in the design procedure is to determine the required stabilising pressure on the slope facing, which is assumed to be triangular in shape upon liquefaction of the loose fill. This stabilising pressure could be determined by limit equilibrium analyses using available commercial computer programs. A minimum factor of safety of 1.1 should be ensured for the most critical slip surface. The shear strength of liquefiable loose fill may be represented by its steady state undrained shear strength determined in accordance with the guidance given in Section 5.1. As the soil models provided by some commercial computer programs (e.g. SLOPE/W) automatically calculate the undrained shear strength of the soil
37
based on a user-specified “undrained shear strength-to-vertical effective stress” (cu/σ'v) ratio, it is important to ensure that the stabilising pressure specified would not be treated as surcharge loading on the slope. Otherwise, the increase in vertical effective stress due to surcharge loading on the slope would lead to an increase in the undrained shear strength of the fill. It is therefore necessary to ensure that the shear strength of the loose fill remains constant, and equals to the steady state undrained shear strength of the liquefied fill.
5.3 Fill Geometry
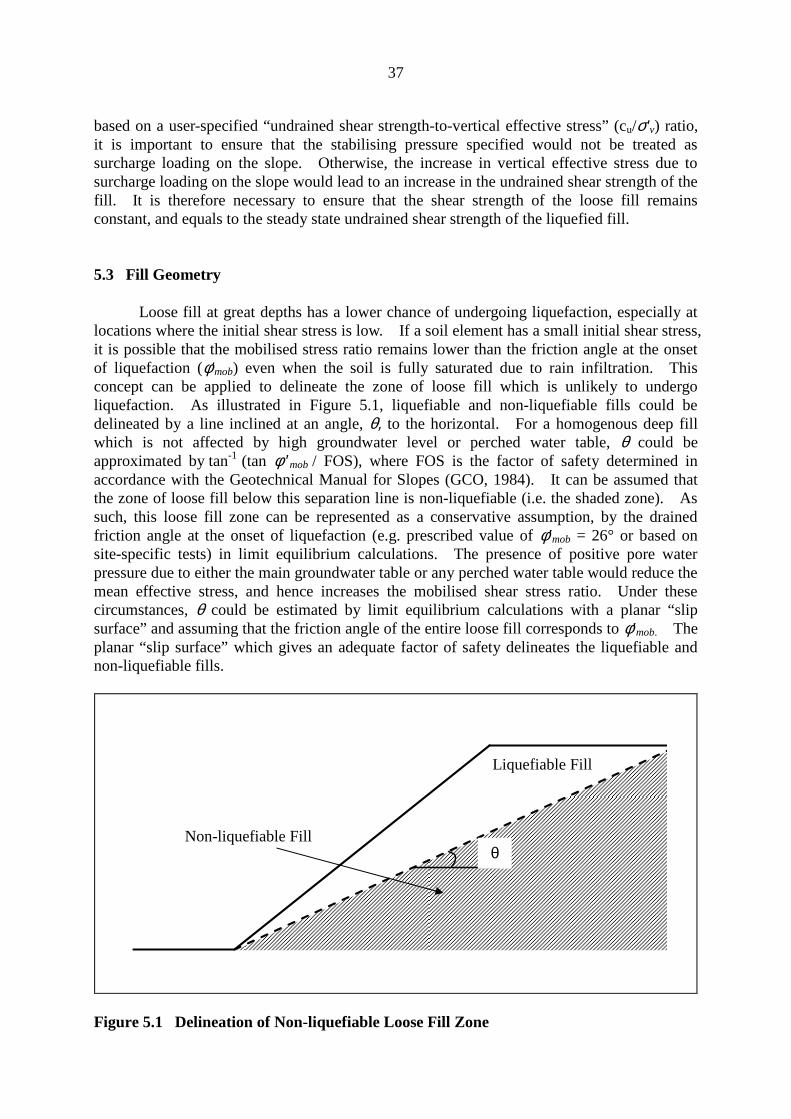
Loose fill at great depths has a lower chance of undergoing liquefaction, especially at locations where the initial shear stress is low. If a soil element has a small initial shear stress, it is possible that the mobilised stress ratio remains lower than the friction angle at the onset of liquefaction (φ'mob) even when the soil is fully saturated due to rain infiltration. This concept can be applied to delineate the zone of loose fill which is unlikely to undergo liquefaction. As illustrated in Figure 5.1, liquefiable and non-liquefiable fills could be delineated by a line inclined at an angle, θ, to the horizontal. For a homogenous deep fill which is not affected by high groundwater level or perched water table, θ could be approximated by tan-1 (tan φ ′ mob / FOS), where FOS is the factor of safety determined in accordance with the Geotechnical Manual for Slopes (GCO, 1984). It can be assumed that the zone of loose fill below this separation line is non-liquefiable (i.e. the shaded zone). As such, this loose fill zone can be represented as a conservative assumption, by the drained friction angle at the onset of liquefaction (e.g. prescribed value of φ' mob = 26° or based on site-specific tests) in limit equilibrium calculations. The presence of positive pore water pressure due to either the main groundwater table or any perched water table would reduce the mean effective stress, and hence increases the mobilised shear stress ratio. Under these circumstances, θ could be estimated by limit equilibrium calculations with a planar “slip surface” and assuming that the friction angle of the entire loose fill corresponds to φ' mob. The planar “slip surface” which gives an adequate factor of safety delineates the liquefiable and non-liquefiable fills.
Non-liquefiable Fill
Liquefiable Fill
θ
Figure 5.1 Delineation of Non-liquefiable Loose Fill Zone
38
Despite the fact that loose fill at greater depths has a lower chance of undergoing liquefaction, the bond strength (i.e. shear resistance) of the soil nail embedded in the “non-liquefiable” zone should not be relied on in the course of determining the required nail lengths. This is because the loose fill at deep depth, albeit the low mobilised stress ratio, may still exhibit volumetric contraction at the soil-nail interface when nail forces are being mobilised. The volumetric contraction may significantly reduce the effective confining stresses along the bond length of the nail.
For slopes with a thin fill layer (e.g. < 1 m), it is reasonable to assume that the loose fill would not undergo liquefaction. The short drainage path facilitates dissipation of excess pore water pressure and avoids undrained strain softening when the loose fill is subjected to shearing. In addition, the loose fill at low stress level may exhibit dilative behaviour which generates negative, instead of positive, excess pore water pressure during shearing. These two factors together reduce the likelihood of liquefaction for slopes with a thin fill layer.
5.4 Nail Arrangement
Designers should adopt a hybrid nail arrangement as far as possible in order to enhance the robustness of the system. The use of steeply inclined nail arrangement is a consequence of designing the slope primarily against the earth pressure generated from the liquefied loose fill. The limited structural stiffness of the steeply inclined nails along the potential sliding direction renders the system heavily reliant on the toe fixity to resist sliding failure and to limit overall deformation. This significantly reduces the system redundancy to cope with deviations of actual ground conditions from design assumptions. In the absence of toe fixity, large deformation might occur, especially when the failure mechanism is of a sliding type. The hybrid nail arrangement is a more robust system as the overall stiffness of the ground-nail-facing system along the potential sliding direction is enhanced. The need for toe fixity is also eliminated by the presence of sub-horizontal nails in the system.
The ratio of sub-horizontal nails to steeply inclined nails can be estimated by considering force equilibrium of the grillage facing. The number of sub-horizontal nails should be approximately 40% to 50% of the total number of soil nails to ensure sufficient sub-horizontal nails are present to counter sliding failure.
The use of some sub-horizontal nails in the hybrid system may incur a slight increase in cost. The increase in construction cost arises from the increase in nail lengths to compensate for the reduction in the overburden pressure acting on the sub-horizontal nails. The increased cost is partially compensated by the omission of the vertical nails. The overall cost can also be further reduced by optimisation of the nail arrangement in the hybrid system through numerical analysis.
If an alternative nail arrangement which deviates significantly from that illustrated in Figure 4.2(c) is intended to suit actual site conditions, the designer should demonstrate the effectiveness and robustness of the proposed nail arrangement using numerical analyses.
39
5.5 Vertical Nails
When steeply inclined nails are used, the vertical nails installed along the slope toe serve to counter the sliding of the grillage facing and their contribution to the overall stability of the slope is minimal. In the hybrid system, it is not necessary to provide any toe fixity as the sub-horizontal nails near the upper part of the slope would counter the sliding of the grillage facing. If it is not possible to incorporate sub-horizontal nails due to site constraints and the steeply inclined nail arrangement is preferred, it would be more appropriate to replace the vertical nails by an embedded concrete footing (where sufficiently competent ground is present at shallow depth) along the toe of the grillage facing such that its downslope movement upon fill liquefaction would be minimised. This is because the vertical nails are not effective in resisting bending and shear induced by the resultant movement of the grillage facing.
5.6 Grillage Facing
The provision of a strong grillage structure at the slope surface is essential to facilitate load transfer and reduction in slope deformation. For the steeply inclined nail arrangement, the current practice of designing the grillage facing as a series of simply supported beams to resist the earth pressure is adequate. For the hybrid nail arrangement, in addition to bending, the individual grillage beams would be subjected to axial tensile force, which needs to be taken into account in the design of the grillage facing.
The current required grillage embedment of 0.5 m for maintaining a good contact between the grillage facing and the underlying fill may not be necessary, as the current study has demonstrated that the principal operating mechanism with a liquefied fill involves the generation of earth pressure on the grillage facing. In order to prevent the grillage facing from being undermined by surface erosion, a minimum grillage embedment of 0.3 m is considered adequate.
Numerical (FLAC3D) analyses suggest that, when the entire fill body liquefies, the loose fill could in theory squeeze out through the grillage openings. However, the assumption of full liquefaction and a sudden reduction of shear strength to the lower bound value in an undrained manner occurring within the near-surface fill may be overly conservative, as far as the design against squeezing out of liquefied fill through the grillage structure is concerned, given the much less significant consequence-to-life involved in comparison with an overall slope failure. Furthermore, as the near-surface fill materials near the slope surface are subject to low stress levels, they may not be liquefiable as the material could be subject to dilation during shearing. Overall, it seems unnecessary to further tighten the present practice in respect of prevention of squeezing out of liquefied fill through containing the size of openings of the grillage facing.
Previous cases of loose fill slopes upgraded using soil nails are generally below 25 m, and they have performed satisfactorily to date. For more sizeable slopes (i.e. greater than 25 m), the earth pressure exerted on the grillage facing near the slope toe could become significant even for a sliding failure mode (e.g. interface liquefaction). The possible need for the reduction of the size of grillage openings or provision of geo-synthetics underneath the grillage facing should be considered on a site-specific basis in such cases.
40
In order to preserve existing trees, in some cases, the locations of the grillage beams might have to be adjusted and the size of the grillage opening increased locally. The presence of these existing trees may serve to reduce the likelihood of local instability through the grillage opening upon liquefaction of the underlying fill. Therefore the size of grillage openings where existing trees are present could be locally increased provided that the overall performance of the grillage as a monolithic structure to withstand the earth pressure from the liquefied loose fill is not compromised.
41
6 Conclusions
The design of soil nails to upgrade loose fill slopes is fundamentally different from the conventional application of soil nails in cut slopes. The overall design approach recommended by HKIE-GD (HKIE, 2003) is adequate in principle. The prescribed design values for the onset of liquefaction and steady state undrained shear strength are found to be conservative and appropriate when site-specific data are not available. However, site-specific testing is strongly encouraged to reduce the unnecessary conservatism in the design parameters.
The approach of designing soil nails to support the earth pressure generated by the liquefied loose fill has led to the use of steeply inclined nails. While the nail force can be mobilised by the unbalanced earth pressure acting on the grillage facing, the steep nail inclination results in significant slope movement especially when sliding failure prevails, for instance, due to liquefaction confined to a thin layer of loose fill at depth. The steeply inclined nail arrangement needs to be used in conjunction with vertical nails or other form of fixity (e.g. embedded concrete footing) at the slope toe and even with such provisions the slope movements that could develop in the event of an interface liquefaction failure could be considerable. By constructing a hybrid nail arrangement (i.e. sub-horizontal nails at the upper part and steeply inclined at the low part) slope movement could be reduced even when toe fixity is absent. Where the hybrid nail arrangement is adopted, vertical nails are not required at the slope toe. It is recommended that the hybrid nail arrangement be adopted as far as possible to enhance the robustness of the ground-nail-facing system.
The grillage facing is an important structural component of the entire system. Upon liquefaction, the loose fill exerts a large earth pressure on the grillage facing which facilitates nail force mobilisation in steeply inclined nails. Due to the earth pressure exerted on the grillage facing, a deep grillage embedment to ensure a good contact between the grillage facing and the underlying fill is not necessary. However, a small embedment would help prevent the grillage facing from being undermined by erosion. The earth pressure in the event of full liquefaction may in theory cause local squeezing out through the grillage openings. However, full liquefaction of the near-surface fill materials is unlikely due to the low stress levels near the slope surface. Considering the relatively less significant consequence-to-life, the present practice of limiting the grillage opening to avoid squeezing out is considered acceptable.
Loose fill at great depths has a lower chance of undergoing liquefaction, especially at locations where the initial shear stress is low. The zone of non-liquefiable fill can be delineated based on the initial shear stress using the friction angle at the onset of liquefaction. However, the bond strength (i.e. shear resistance) of the soil nail embedded in this loose fill zone should not be relied on in the course of determining the required nail lengths.
In summary, the following are recommended based on the findings of the present study:
(a) realistic design shear strength parameters derived from site-specific laboratory testing should be used;
(b) a hybrid nail arrangement should be adopted as far as
42
possible;
(c) a minimum grillage embedment of 0.3 m should be provided;
(d) where the hybrid nail arrangement cannot be adopted due to site constraints, an embedded concrete footing (where sufficiently competent ground is present at shallow depth) should be provided in lieu of vertical nails to provide toe fixity for the steeply inclined nail arrangement;
(e) in addition to bending, the individual grillage beams of a hybrid nail arrangement have to be designed to resist axial tensile force; and
(f) for deep fill, the zone of non-liquefiable fill may be delineated using limit equilibrium analysis based on the initial stress state and the mobilised friction angle at the onset of liquefaction.
43
7 References
Carrera, A., Coop, M.R. & Lancellotta, R. (2011). Influence of grading on the mechanicsal behaviour of Stava tailing. Géotechnique. [In press].
Cheuk, C.Y., Ng, C.W.W & Sun, H.W. (2005). Numerical experiments of soil nails in loose fill slopes subjected to rainfall infiltration effects. Computers and Geotechnics. 32, pp 290-303.
Chung, P.W.K. (1999). Some Aspects of Saturation of Soil Specimens in the Triaxial Test. Proceedings of the Second China-Japan Joint Symposium on Recent Development of Theory and Practice in Geotechnology, pp 101-110.
GCO (1984). Geotechnical Manual for Slopes. Second edition. Geotechnical Control Office, Civil Engineering Department, Hong Kong, 302 p.
GEO (1993). Guide to Retaining Wall Design (Geoguide 1). Second edition. Geotechnical Engineering Office, Civil Engineering Department, Hong Kong, 258 p.
GEO (2004). Fill Slope Recompaction – Investigation, Design and Construction Considerations (GEO Technical Guidance Note No. 7). Geotechnical Engineering Office, Civil Engineering Department, Hong Kong.
GEO (2008). Guide to Soil Nail Design and Construction (Geoguide 7). Geotechnical Engineering Office, Civil Engineering and Development Department, Hong Kong, 97 p.
HKIE (2003). Soil Nails in Loose Fill Slopes. A Preliminary Study - Final Report. The Hong Kong Institution of Engineers, Geotechnical Division, 88 p.
Jewell, R.A. & Worth, C.P. (1987). Direct shear tests on reinforced sand. Géotechnique, 37(1), pp 53-68.
Law, K.T., Lee, C.F., Luan M.T. & Zhai, Y. (1998). Laboratory Investigation of Fundamental Behaviour of Loose Fill under Shear (Report prepared under the Consultancy Agreement No. GEO 16/96). Department of Civil and Structural Engineering, The University of Hong Kong.
Mayne, P.W., Coop, M.R., Springman, S.M., Huang, A.-B. & Zornberg, J.G. (2009). Geomaterial Behaviour and Testing. Proceedings of the 17th International Conference on Soil Mechanics and Geotechnical Engineering, pp 2777-2872.
Ng, F.H., Sun, H.W. & Lam, J.S. (2004). Review of Cases with Problems Encountered during Soil Nail Construction (1993 - 2003) (Technical Note No. 1/2004). Geotechnical Engineering Office, Civil Engineering Department, Hong Kong, 112 p.
Shiu, Y.K. & Chang, G.W.K. (2006). Effects of Inclination, Length Pattern and Bending Stiffness of Soil Nails on Behaviour of Nailed Structures (GEO Report 197). Geotechnical Engineering Office, Civil Engineering Department, Hong Kong, 116 p.

44
Appendix A
Critical State of Loose Fill
45
Contents
Page No.
Contents 45
List of Figures 46
A.1 Undrained Shear Strength at Critical State 47
A.2 Non-uniqueness of Critical State Line 49
A.3 References 51
46
List of Figures
Figure Page No. No.
A.1 Relationship between Undrained Shear Strength and Void 48 Ratio at Critical State
A.2 Critical State Line on the p'-q Plane 48
A.3 Critical State Line on the e-ln p' Plane 49
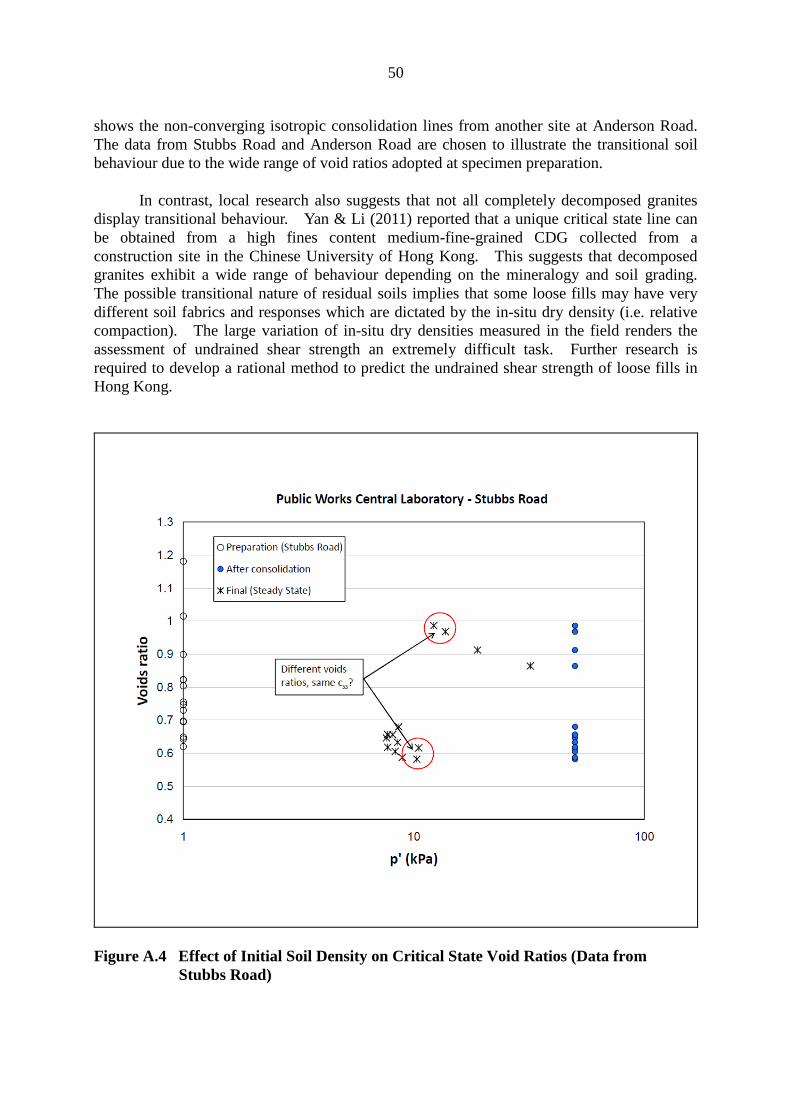
A.4 Effect of Initial Soil Density on Critical State Void Ratios 50 (Data from Stubbs Road)
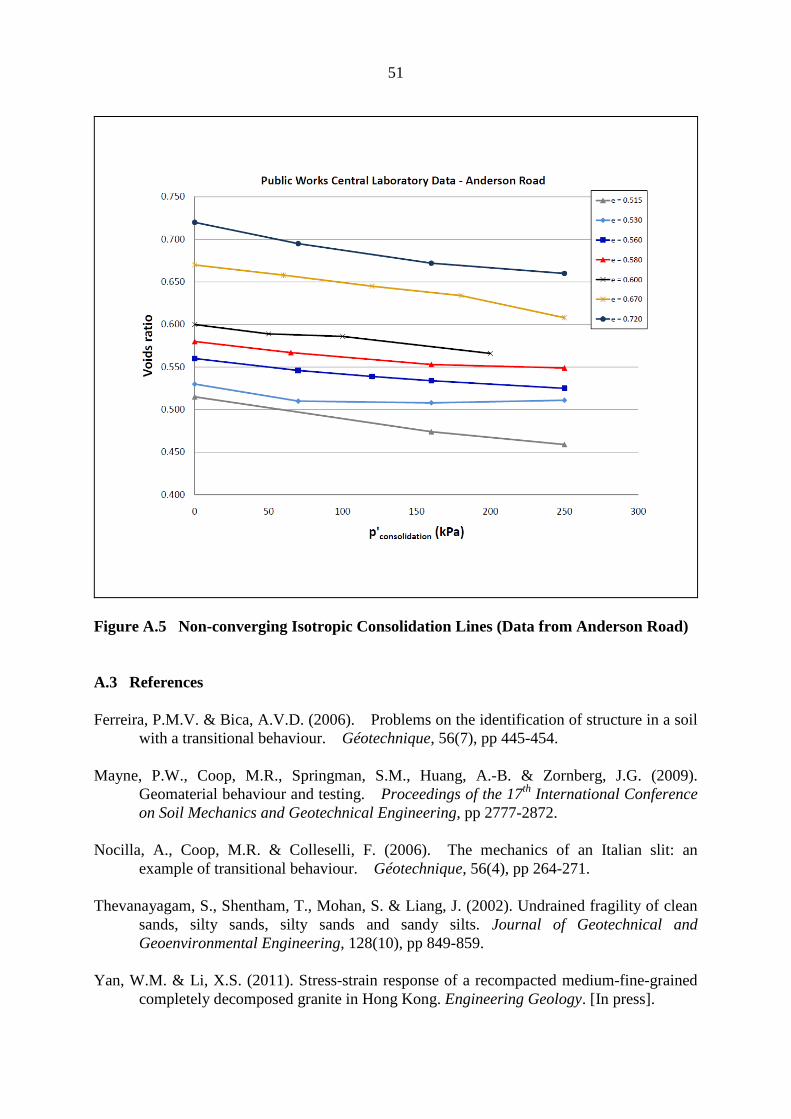
A.5 Non-converging Isotropic Consolidation Lines (Data from 51 Anderson Road)
47
A.1 Undrained Shear Strength at Critical State
In current practice, the undrained shear strength is determined by an empirical method. In this study a theoretical-based method adhering to the critical state soil mechanics framework has been explored as an alternative. Although there has been discussion on the difference between “steady state” and “critical state”, it is generally accepted that the two states are close enough to be considered as identical for engineering applications purposes. According to critical state soil mechanics, the critical state line is unique in the e-p'-q space. The projections of the critical state line on the p'-q and e-ln p' planes can be represented by the following equations:
q = Μ × p′ ...................................................... (A.1) ss ss
e = Γ − λ ln p′ −1 ............................................... (A.2) ss ss
where Μ and λ are the inclinations of the critical state line on the p'-q and e-ln p' planes respectively, Γ is the specific volume of the soil at p' = 1 kPa, and ess, p'ss, qss are respectively the void ratio, mean effective stress and deviator stress at critical state (or steady state).
Combining Equations (A.1) and (A.2) leads to a unique relationship between the undrained shear strength and void ratio at critical state:
Γ −e −1ss
qss Μ λ ........................................... (A.3) = = exp css 2 2
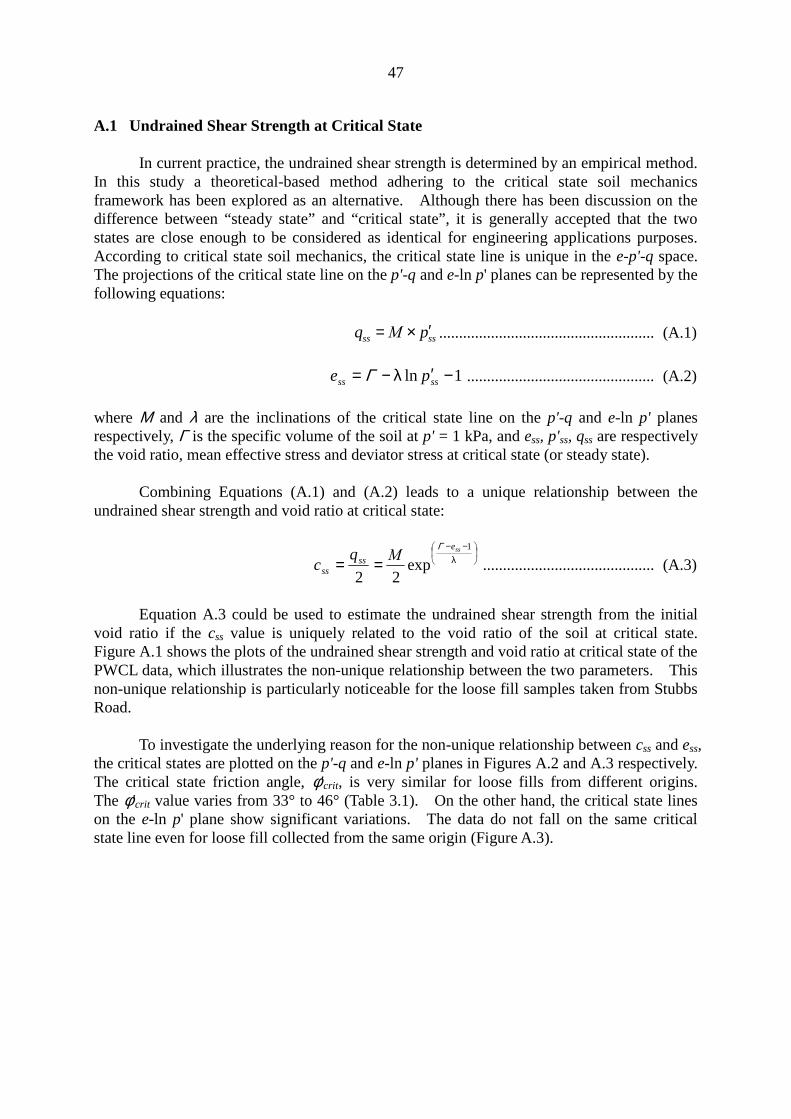
Equation A.3 could be used to estimate the undrained shear strength from the initial void ratio if the css value is uniquely related to the void ratio of the soil at critical state. Figure A.1 shows the plots of the undrained shear strength and void ratio at critical state of the PWCL data, which illustrates the non-unique relationship between the two parameters. This non-unique relationship is particularly noticeable for the loose fill samples taken from Stubbs Road.
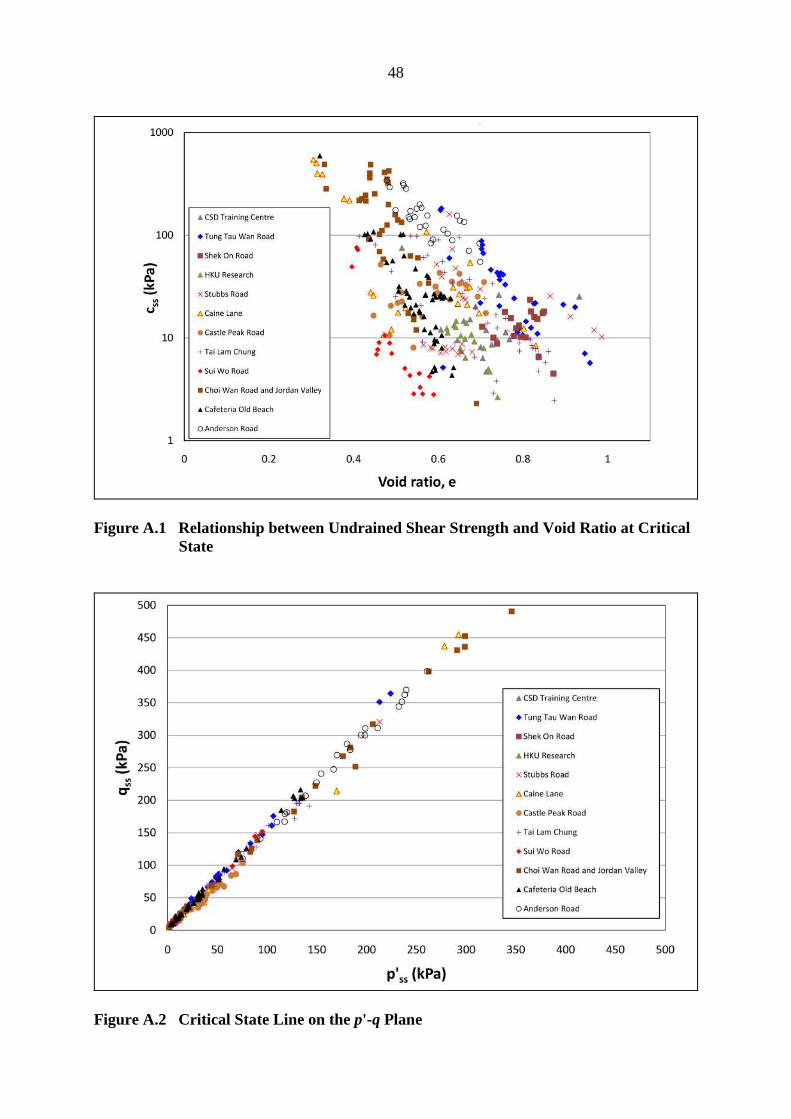
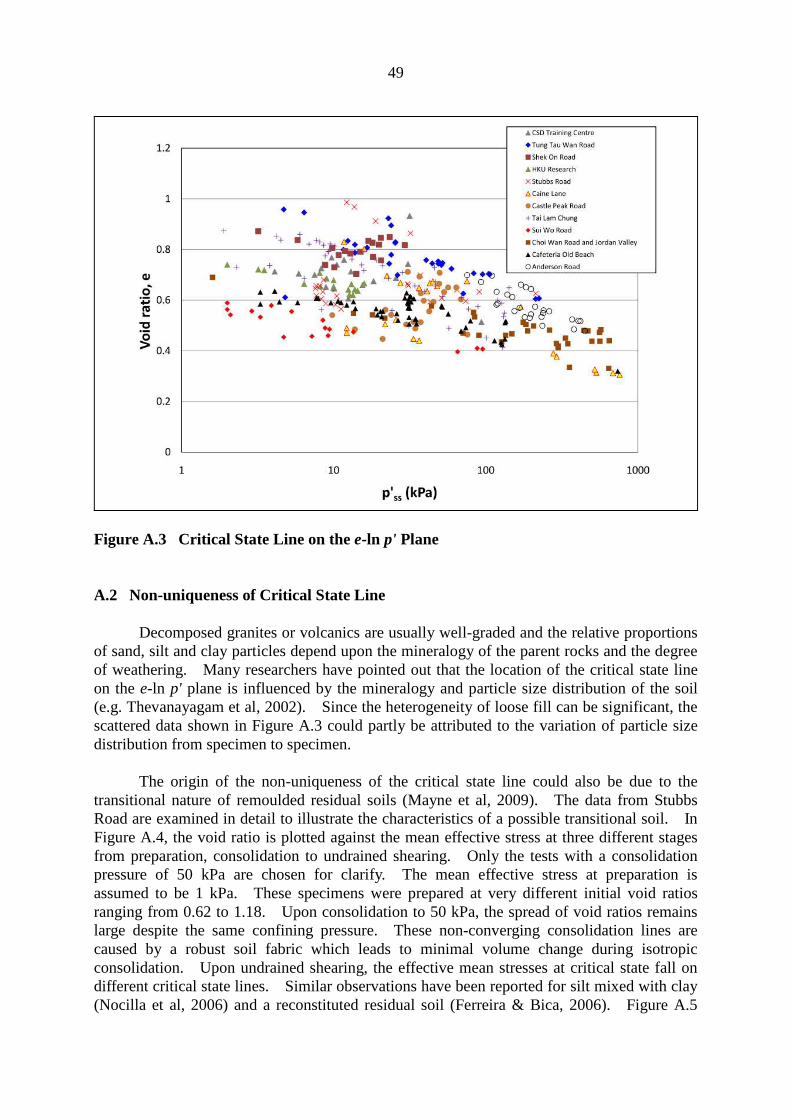
To investigate the underlying reason for the non-unique relationship between css and ess, the critical states are plotted on the p'-q and e-ln p' planes in Figures A.2 and A.3 respectively. The critical state friction angle, φ'crit, is very similar for loose fills from different origins. The φ'crit value varies from 33° to 46° (Table 3.1). On the other hand, the critical state lines on the e-ln p' plane show significant variations. The data do not fall on the same critical state line even for loose fill collected from the same origin (Figure A.3).
48
Figure A.1 Relationship between Undrained Shear Strength and Void Ratio at Critical State
Figure A.2 Critical State Line on the p'-q Plane
49
Figure A.3 Critical State Line on the e-ln p' Plane
A.2 Non-uniqueness of Critical State Line
Decomposed granites or volcanics are usually well-graded and the relative proportions of sand, silt and clay particles depend upon the mineralogy of the parent rocks and the degree of weathering. Many researchers have pointed out that the location of the critical state line on the e-ln p' plane is influenced by the mineralogy and particle size distribution of the soil (e.g. Thevanayagam et al, 2002). Since the heterogeneity of loose fill can be significant, the scattered data shown in Figure A.3 could partly be attributed to the variation of particle size distribution from specimen to specimen.
The origin of the non-uniqueness of the critical state line could also be due to the transitional nature of remoulded residual soils (Mayne et al, 2009). The data from Stubbs Road are examined in detail to illustrate the characteristics of a possible transitional soil. In Figure A.4, the void ratio is plotted against the mean effective stress at three different stages from preparation, consolidation to undrained shearing. Only the tests with a consolidation pressure of 50 kPa are chosen for clarify. The mean effective stress at preparation is assumed to be 1 kPa. These specimens were prepared at very different initial void ratios ranging from 0.62 to 1.18. Upon consolidation to 50 kPa, the spread of void ratios remains large despite the same confining pressure. These non-converging consolidation lines are caused by a robust soil fabric which leads to minimal volume change during isotropic consolidation. Upon undrained shearing, the effective mean stresses at critical state fall on different critical state lines. Similar observations have been reported for silt mixed with clay (Nocilla et al, 2006) and a reconstituted residual soil (Ferreira & Bica, 2006). Figure A.5
50
shows the non-converging isotropic consolidation lines from another site at Anderson Road. The data from Stubbs Road and Anderson Road are chosen to illustrate the transitional soil behaviour due to the wide range of void ratios adopted at specimen preparation.
In contrast, local research also suggests that not all completely decomposed granites display transitional behaviour. Yan & Li (2011) reported that a unique critical state line can be obtained from a high fines content medium-fine-grained CDG collected from a construction site in the Chinese University of Hong Kong. This suggests that decomposed granites exhibit a wide range of behaviour depending on the mineralogy and soil grading. The possible transitional nature of residual soils implies that some loose fills may have very different soil fabrics and responses which are dictated by the in-situ dry density (i.e. relative compaction). The large variation of in-situ dry densities measured in the field renders the assessment of undrained shear strength an extremely difficult task. Further research is required to develop a rational method to predict the undrained shear strength of loose fills in Hong Kong.
Figure A.4 Effect of Initial Soil Density on Critical State Void Ratios (Data from Stubbs Road)
51
Figure A.5 Non-converging Isotropic Consolidation Lines (Data from Anderson Road)
A.3 References
Ferreira, P.M.V. & Bica, A.V.D. (2006). Problems on the identification of structure in a soil with a transitional behaviour. Géotechnique, 56(7), pp 445-454.
Mayne, P.W., Coop, M.R., Springman, S.M., Huang, A.-B. & Zornberg, J.G. (2009). Geomaterial behaviour and testing. Proceedings of the 17th International Conference on Soil Mechanics and Geotechnical Engineering, pp 2777-2872.
Nocilla, A., Coop, M.R. & Colleselli, F. (2006). The mechanics of an Italian slit: an example of transitional behaviour. Géotechnique, 56(4), pp 264-271.
Thevanayagam, S., Shentham, T., Mohan, S. & Liang, J. (2002). Undrained fragility of clean sands, silty sands, silty sands and sandy silts. Journal of Geotechnical and Geoenvironmental Engineering, 128(10), pp 849-859.
Yan, W.M. & Li, X.S. (2011). Stress-strain response of a recompacted medium-fine-grained completely decomposed granite in Hong Kong. Engineering Geology. [In press].
52
Appendix B
Finite Difference Analysis of Loose Fill Slopes Upgraded by Soil Nails
53
Contents
Page No.
Contents 53
List of Tables 54
List of Figures 55
B.1 Geometry and Boundary Conditions 57
B.2 Constitutive Models and Parameters 57
B.3 Modelling Approach 64
B.4 Results of Numerical Analyses 65
B.5 Sensitivity Study 92
54
List of Tables
Table Page No. No.
B.1 Model Parameters for Soils 61
B.2 Model Parameters for Soil Nails 62
B.3 Model Parameters for Grillage Facing 62
B.4 Model Parameters for Embedded Toe Wall 63
B.5 Summary of Numerical Analyses for Full Liquefaction 65
B.6 Summary of Numerical Analyses for Interface Liquefaction 66

55
List of Figures
Figure Page No. No.
B.1 Finite Difference Grids of the Numerical Models 60
B.2 Modelling Approach for Soil Nails within Liquefied 61 Loose Fill
B.3 Results of Numerical Analysis No. 1 67
B.4 Results of Numerical Analysis No. 2 68
B.5 Results of Numerical Analysis No. 3 69
B.6 Results of Numerical Analysis No. 4 70
B.7 Results of Numerical Analysis No. 5 71
B.8 Results of Numerical Analysis No. 6 72
B.9 Results of Numerical Analysis No. 7 73
B.10 Results of Numerical Analysis No. 8 74
B.11 Results of Numerical Analysis No. 9 75
B.12 Results of Numerical Analysis No. 10 76
B.13 Results of Numerical Analysis No. 11 77
B.14 Results of Numerical Analysis No. 12 78
B.15 Results of Numerical Analysis No. 13 79
B.16 Results of Numerical Analysis No. 14 80
B.17 Results of Numerical Analysis No. 15 81
B.18 Results of Numerical Analysis No. 16 82
B.19 Results of Numerical Analysis No. 17 83
B.20 Results of Numerical Analysis No. 18 84
B.21 Results of Numerical Analysis No. 19 85
56
Figure Page No. No.
B.22 Results of Numerical Analysis No. 20 86
B.23 Results of Numerical Analysis No. 21 87
B.24 Results of Numerical Analysis No. 22 88
B.25 Results of Numerical Analysis No. 23 89
B.26 Results of Numerical Analysis No. 24 90
B.27 Results of Numerical Analysis No. 25 91
B.28 Effect of Toe Fixity and Nail Arrangement on Soil 93 Deformation under Full Liquefaction
B.29 Effect of Toe Fixity and Nail Arrangement on Structural 94 Deformation under Full Liquefaction
B.30 Effect of Toe Fixity and Nail Arrangement on Soil 95 Deformation under Interface Liquefaction
B.31 Effect of Toe Fixity and Nail Arrangement on Structural 96 Deformation under Interface Liquefaction
57
B.1 Geometry and Boundary Conditions
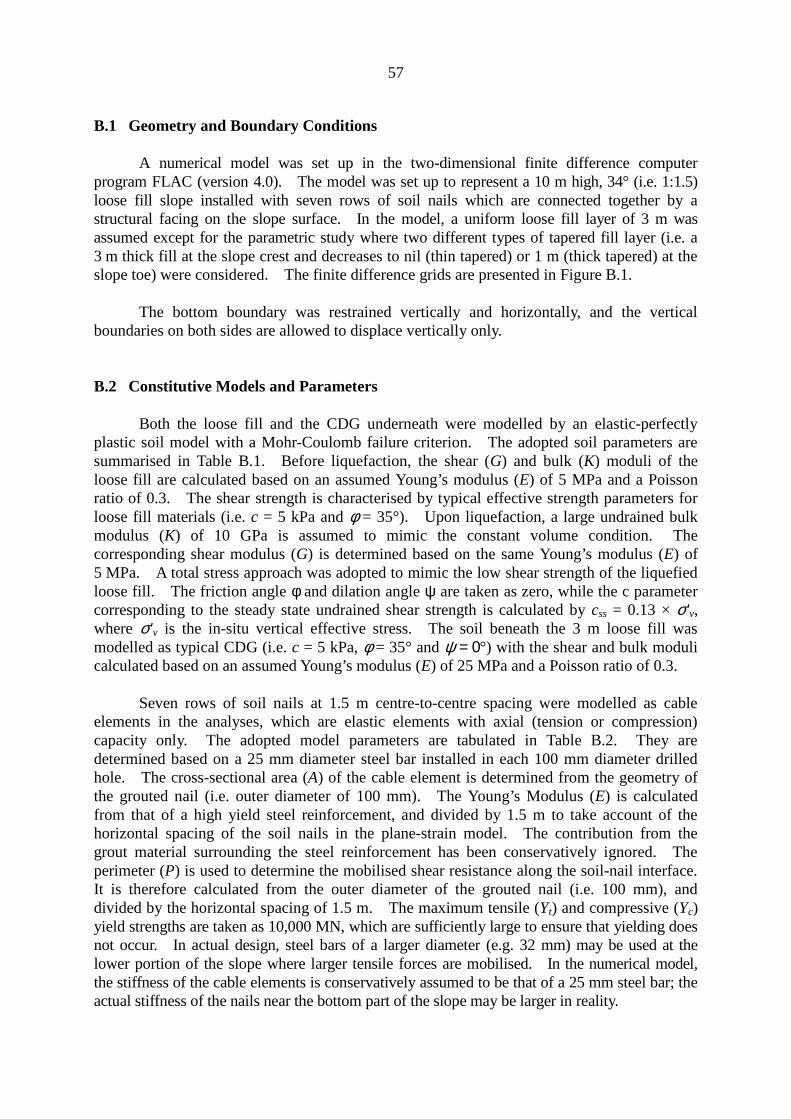
A numerical model was set up in the two-dimensional finite difference computer program FLAC (version 4.0). The model was set up to represent a 10 m high, 34° (i.e. 1:1.5) loose fill slope installed with seven rows of soil nails which are connected together by a structural facing on the slope surface. In the model, a uniform loose fill layer of 3 m was assumed except for the parametric study where two different types of tapered fill layer (i.e. a 3 m thick fill at the slope crest and decreases to nil (thin tapered) or 1 m (thick tapered) at the slope toe) were considered. The finite difference grids are presented in Figure B.1.
The bottom boundary was restrained vertically and horizontally, and the vertical boundaries on both sides are allowed to displace vertically only.
B.2 Constitutive Models and Parameters
Both the loose fill and the CDG underneath were modelled by an elastic-perfectly plastic soil model with a Mohr-Coulomb failure criterion. The adopted soil parameters are summarised in Table B.1. Before liquefaction, the shear (G) and bulk (K) moduli of the loose fill are calculated based on an assumed Young’s modulus (E) of 5 MPa and a Poisson ratio of 0.3. The shear strength is characterised by typical effective strength parameters for loose fill materials (i.e. c = 5 kPa and φ = 35°). Upon liquefaction, a large undrained bulk modulus (K) of 10 GPa is assumed to mimic the constant volume condition. The corresponding shear modulus (G) is determined based on the same Young’s modulus (E) of 5 MPa. A total stress approach was adopted to mimic the low shear strength of the liquefied loose fill. The friction angle φ and dilation angle ψ are taken as zero, while the c parameter corresponding to the steady state undrained shear strength is calculated by css = 0.13 × σ'v, where σ'v is the in-situ vertical effective stress. The soil beneath the 3 m loose fill was modelled as typical CDG (i.e. c = 5 kPa, φ = 35° and ψ = 0°) with the shear and bulk moduli calculated based on an assumed Young’s modulus (E) of 25 MPa and a Poisson ratio of 0.3.
Seven rows of soil nails at 1.5 m centre-to-centre spacing were modelled as cable elements in the analyses, which are elastic elements with axial (tension or compression) capacity only. The adopted model parameters are tabulated in Table B.2. They are determined based on a 25 mm diameter steel bar installed in each 100 mm diameter drilled hole. The cross-sectional area (A) of the cable element is determined from the geometry of the grouted nail (i.e. outer diameter of 100 mm). The Young’s Modulus (E) is calculated from that of a high yield steel reinforcement, and divided by 1.5 m to take account of the horizontal spacing of the soil nails in the plane-strain model. The contribution from the grout material surrounding the steel reinforcement has been conservatively ignored. The perimeter (P) is used to determine the mobilised shear resistance along the soil-nail interface. It is therefore calculated from the outer diameter of the grouted nail (i.e. 100 mm), and divided by the horizontal spacing of 1.5 m. The maximum tensile (Yt) and compressive (Yc) yield strengths are taken as 10,000 MN, which are sufficiently large to ensure that yielding does not occur. In actual design, steel bars of a larger diameter (e.g. 32 mm) may be used at the lower portion of the slope where larger tensile forces are mobilised. In the numerical model, the stiffness of the cable elements is conservatively assumed to be that of a 25 mm steel bar; the actual stiffness of the nails near the bottom part of the slope may be larger in reality.
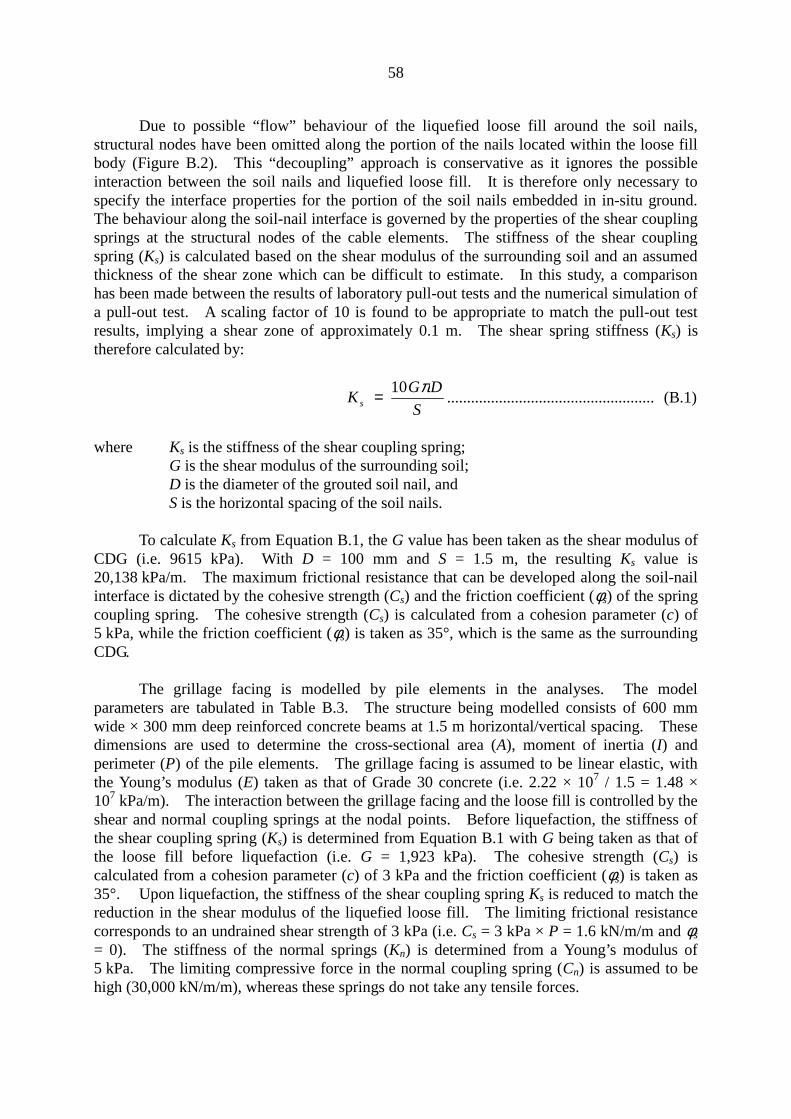
58
Due to possible “flow” behaviour of the liquefied loose fill around the soil nails, structural nodes have been omitted along the portion of the nails located within the loose fill body (Figure B.2). This “decoupling” approach is conservative as it ignores the possible interaction between the soil nails and liquefied loose fill. It is therefore only necessary to specify the interface properties for the portion of the soil nails embedded in in-situ ground. The behaviour along the soil-nail interface is governed by the properties of the shear coupling springs at the structural nodes of the cable elements. The stiffness of the shear coupling spring (Ks) is calculated based on the shear modulus of the surrounding soil and an assumed thickness of the shear zone which can be difficult to estimate. In this study, a comparison has been made between the results of laboratory pull-out tests and the numerical simulation of a pull-out test. A scaling factor of 10 is found to be appropriate to match the pull-out test results, implying a shear zone of approximately 0.1 m. The shear spring stiffness (Ks) is therefore calculated by:
10 GπDKs = .................................................... (B.1)
S
where Ks is the stiffness of the shear coupling spring; G is the shear modulus of the surrounding soil; D is the diameter of the grouted soil nail, and S is the horizontal spacing of the soil nails.
To calculate Ks from Equation B.1, the G value has been taken as the shear modulus of CDG (i.e. 9615 kPa). With D = 100 mm and S = 1.5 m, the resulting Ks value is 20,138 kPa/m. The maximum frictional resistance that can be developed along the soil-nail interface is dictated by the cohesive strength (Cs) and the friction coefficient (φs) of the spring coupling spring. The cohesive strength (Cs) is calculated from a cohesion parameter (c) of 5 kPa, while the friction coefficient (φs) is taken as 35°, which is the same as the surrounding CDG.
The grillage facing is modelled by pile elements in the analyses. The model parameters are tabulated in Table B.3. The structure being modelled consists of 600 mm wide × 300 mm deep reinforced concrete beams at 1.5 m horizontal/vertical spacing. These dimensions are used to determine the cross-sectional area (A), moment of inertia (I) and perimeter (P) of the pile elements. The grillage facing is assumed to be linear elastic, with the Young’s modulus (E) taken as that of Grade 30 concrete (i.e. 2.22 × 10⁷ / 1.5 = 1.48 × 10⁷ kPa/m). The interaction between the grillage facing and the loose fill is controlled by the shear and normal coupling springs at the nodal points. Before liquefaction, the stiffness of the shear coupling spring (Ks) is determined from Equation B.1 with G being taken as that of the loose fill before liquefaction (i.e. G = 1,923 kPa). The cohesive strength (Cs) is calculated from a cohesion parameter (c) of 3 kPa and the friction coefficient (φs) is taken as 35°. Upon liquefaction, the stiffness of the shear coupling spring Ks is reduced to match the reduction in the shear modulus of the liquefied loose fill. The limiting frictional resistance corresponds to an undrained shear strength of 3 kPa (i.e. Cs = 3 kPa × P = 1.6 kN/m/m and φs
= 0). The stiffness of the normal springs (Kn) is determined from a Young’s modulus of 5 kPa. The limiting compressive force in the normal coupling spring (Cn) is assumed to be high (30,000 kN/m/m), whereas these springs do not take any tensile forces.
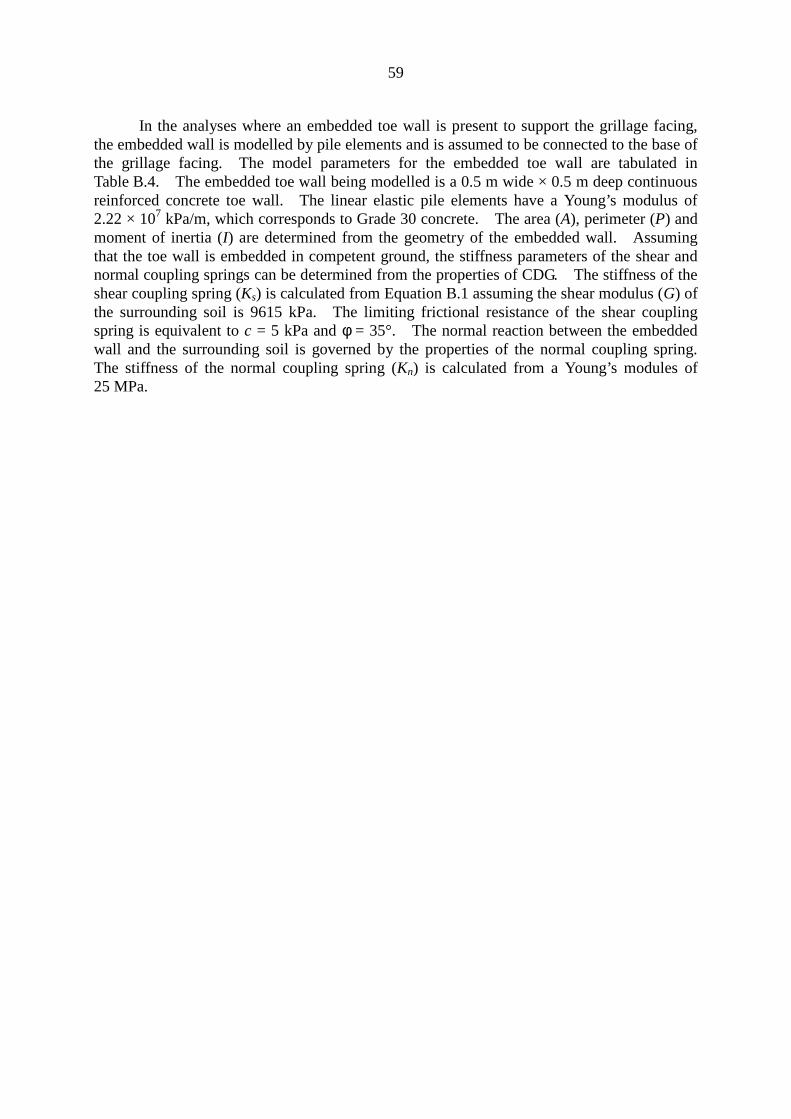
59
In the analyses where an embedded toe wall is present to support the grillage facing, the embedded wall is modelled by pile elements and is assumed to be connected to the base of the grillage facing. The model parameters for the embedded toe wall are tabulated in Table B.4. The embedded toe wall being modelled is a 0.5 m wide × 0.5 m deep continuous reinforced concrete toe wall. The linear elastic pile elements have a Young’s modulus of 2.22 × 10⁷ kPa/m, which corresponds to Grade 30 concrete. The area (A), perimeter (P) and moment of inertia (I) are determined from the geometry of the embedded wall. Assuming that the toe wall is embedded in competent ground, the stiffness parameters of the shear and normal coupling springs can be determined from the properties of CDG. The stiffness of the shear coupling spring (Ks) is calculated from Equation B.1 assuming the shear modulus (G) of the surrounding soil is 9615 kPa. The limiting frictional resistance of the shear coupling spring is equivalent to c = 5 kPa and φ = 35°. The normal reaction between the embedded wall and the surrounding soil is governed by the properties of the normal coupling spring. The stiffness of the normal coupling spring (Kn) is calculated from a Young’s modules of 25 MPa.
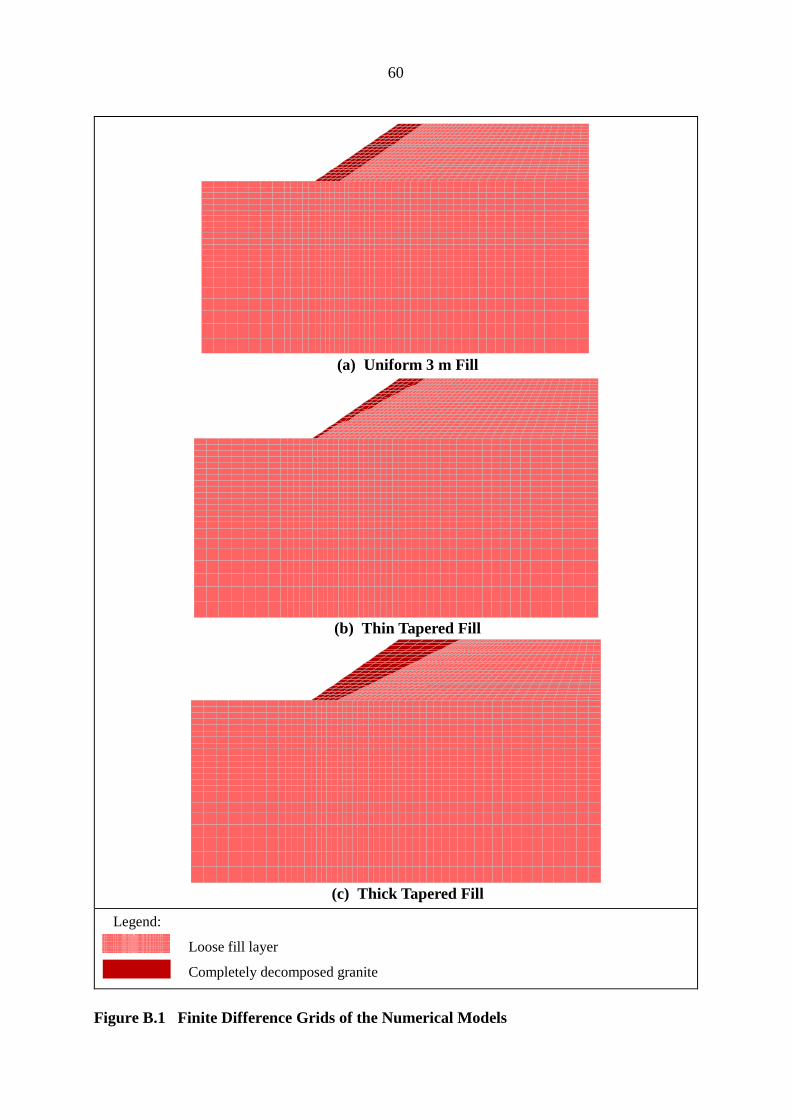
60
(a) Uniform 3 m Fill
(b) Thin Tapered Fill
(c) Thick Tapered Fill
Legend:
Loose fill layer
Completely decomposed granite
Figure B.1 Finite Difference Grids of the Numerical Models
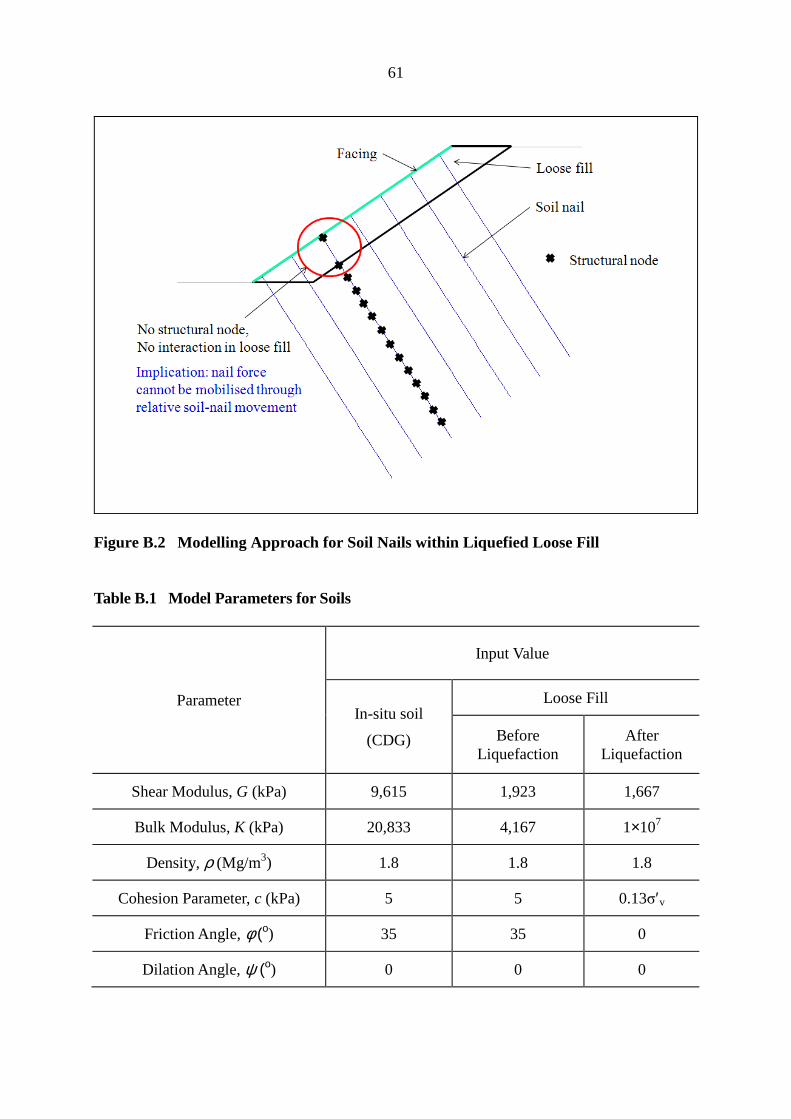
61
Figure B.2 Modelling Approach for Soil Nails within Liquefied Loose Fill
Table B.1 Model Parameters for Soils
Parameter
Input Value
In-situ soil
(CDG)
Loose Fill
Before Liquefaction
After Liquefaction
Shear Modulus, G (kPa) 9,615 1,923 1,667
Bulk Modulus, K (kPa) 20,833 4,167 1×10⁷
Density, ρ (Mg/m3) 1.8 1.8 1.8
Cohesion Parameter, c (kPa) 5 5 0.13σ′ v
Friction Angle, φ (ο) 35 35 0
Dilation Angle, ψ (ο) 0 0 0
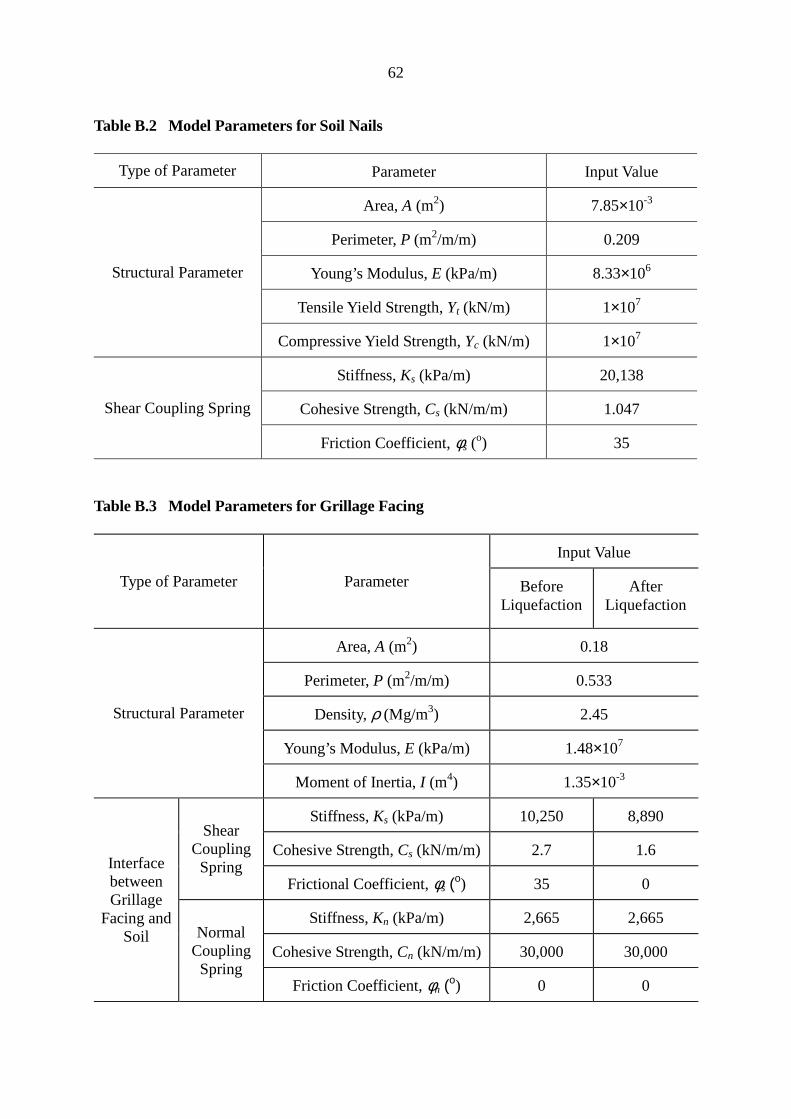
62
Table B.2 Model Parameters for Soil Nails
Type of Parameter Parameter Input Value
Area, A (m2) 7.85×10⁻³
Perimeter, P (m2/m/m) 0.209
Structural Parameter Young’s Modulus, E (kPa/m) 8.33×10⁶
Tensile Yield Strength, Yt (kN/m) 1×10⁷
Compressive Yield Strength, Yc (kN/m) 1×10⁷
Stiffness, Ks (kPa/m) 20,138
Shear Coupling Spring Cohesive Strength, Cs (kN/m/m) 1.047
Friction Coefficient, φs (o) 35
Table B.3 Model Parameters for Grillage Facing
Type of Parameter Parameter
Input Value
Before Liquefaction
After Liquefaction
Structural Parameter
Area, A (m2) 0.18
Perimeter, P (m2/m/m) 0.533
Density, ρ (Mg/m3) 2.45
Young’s Modulus, E (kPa/m) 1.48×10⁷
Moment of Inertia, I (m4) 1.35×10⁻³
Interface between Grillage
Facing and Soil
Shear Coupling
Spring
Stiffness, Ks (kPa/m) 10,250 8,890
Cohesive Strength, Cs (kN/m/m) 2.7 1.6
Frictional Coefficient, φs (ο) 35 0
Normal Coupling
Spring
Stiffness, Kn (kPa/m) 2,665 2,665
Cohesive Strength, Cn (kN/m/m) 30,000 30,000
Friction Coefficient, φn (ο) 0 0
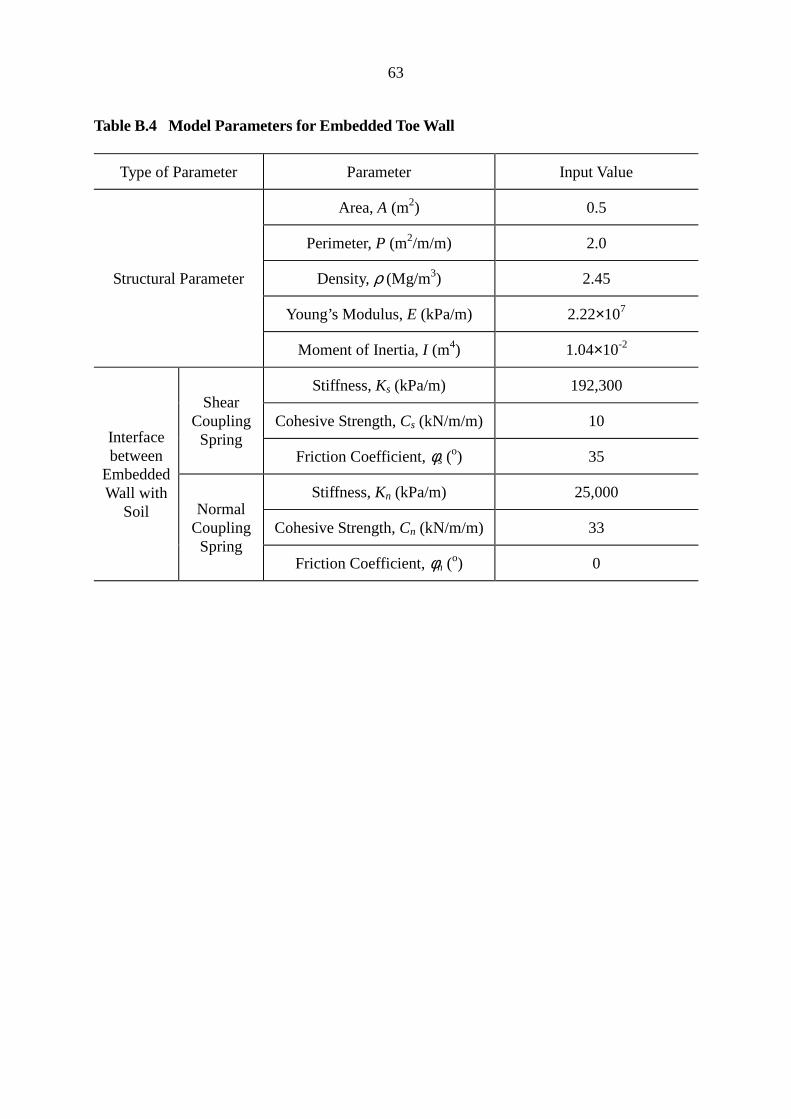
63
Table B.4 Model Parameters for Embedded Toe Wall
Type of Parameter Parameter Input Value
Structural Parameter
Area, A (m2)
Perimeter, P (m2/m/m)
Density, ρ (Mg/m3)
Young’s Modulus, E (kPa/m)
Moment of Inertia, I (m4)
0.5
2.0
2.45
2.22×10⁷
1.04×10⁻²
Interface between
Embedded Wall with
Soil
Shear Coupling
Spring
Stiffness, Ks (kPa/m)
Cohesive Strength, Cs (kN/m/m)
Friction Coefficient, φs (o)
192,300
10
35
Normal Coupling
Spring
Stiffness, Kn (kPa/m)
Cohesive Strength, Cn (kN/m/m)
Friction Coefficient, φn (o)
25,000
33
0
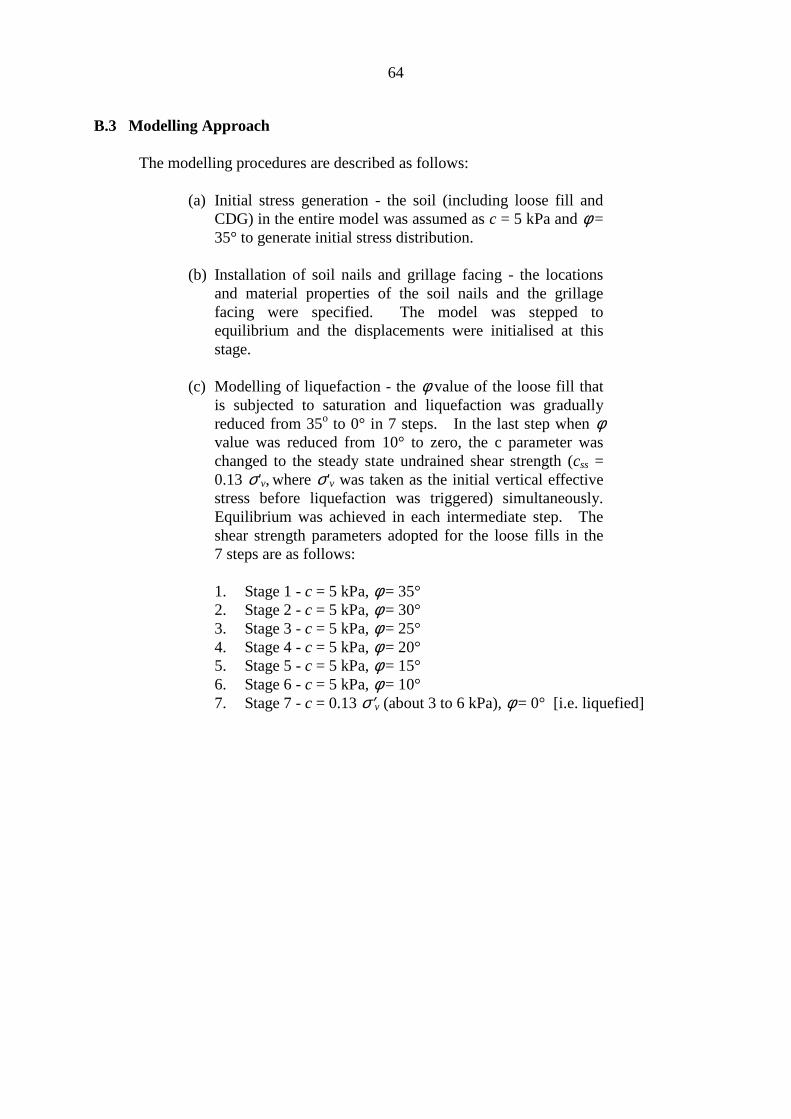
64
B.3 Modelling Approach
The modelling procedures are described as follows:
(a) Initial stress generation - the soil (including loose fill and CDG) in the entire model was assumed as c = 5 kPa and φ = 35° to generate initial stress distribution.
(b) Installation of soil nails and grillage facing - the locations and material properties of the soil nails and the grillage facing were specified. The model was stepped to equilibrium and the displacements were initialised at this stage.
(c) Modelling of liquefaction - the φ value of the loose fill that is subjected to saturation and liquefaction was gradually reduced from 35o to 0° in 7 steps. In the last step when φ value was reduced from 10° to zero, the c parameter was changed to the steady state undrained shear strength (css = 0.13 σ'v, where σ'v was taken as the initial vertical effective stress before liquefaction was triggered) simultaneously. Equilibrium was achieved in each intermediate step. The shear strength parameters adopted for the loose fills in the 7 steps are as follows:
1. Stage 1 - c = 5 kPa, φ = 35° 2. Stage 2 - c = 5 kPa, φ = 30° 3. Stage 3 - c = 5 kPa, φ = 25° 4. Stage 4 - c = 5 kPa, φ = 20° 5. Stage 5 - c = 5 kPa, φ = 15° 6. Stage 6 - c = 5 kPa, φ = 10° 7. Stage 7 - c = 0.13 σ′v (about 3 to 6 kPa), φ = 0° [i.e. liquefied]
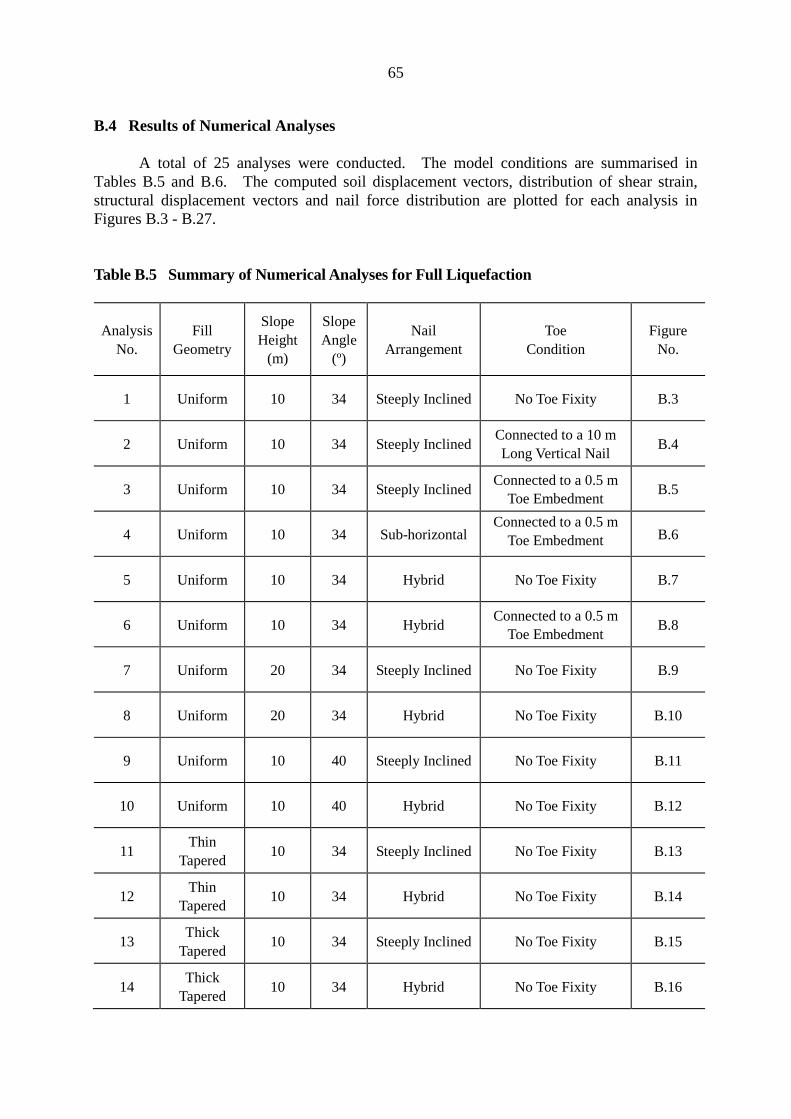
65
B.4 Results of Numerical Analyses
A total of 25 analyses were conducted. The model conditions are summarised in Tables B.5 and B.6. The computed soil displacement vectors, distribution of shear strain, structural displacement vectors and nail force distribution are plotted for each analysis in Figures B.3 - B.27.
Table B.5 Summary of Numerical Analyses for Full Liquefaction
Analysis No.
Fill Geometry
Slope Height
(m)
Slope Angle
(º)
Nail Arrangement
Toe Condition
Figure No.
1 Uniform 10 34 Steeply Inclined No Toe Fixity B.3
2 Uniform 10 34 Steeply Inclined Connected to a 10 m Long Vertical Nail
B.4
3 Uniform 10 34 Steeply Inclined Connected to a 0.5 m
Toe Embedment B.5
4 Uniform 10 34 Sub-horizontal Connected to a 0.5 m
Toe Embedment B.6
5 Uniform 10 34 Hybrid No Toe Fixity B.7
6 Uniform 10 34 Hybrid Connected to a 0.5 m
Toe Embedment B.8
7 Uniform 20 34 Steeply Inclined No Toe Fixity B.9
8 Uniform 20 34 Hybrid No Toe Fixity B.10
9 Uniform 10 40 Steeply Inclined No Toe Fixity B.11
10 Uniform 10 40 Hybrid No Toe Fixity B.12
11 Thin
Tapered 10 34 Steeply Inclined No Toe Fixity B.13
12 Thin
Tapered 10 34 Hybrid No Toe Fixity B.14
13 Thick
Tapered 10 34 Steeply Inclined No Toe Fixity B.15
14 Thick
Tapered 10 34 Hybrid No Toe Fixity B.16
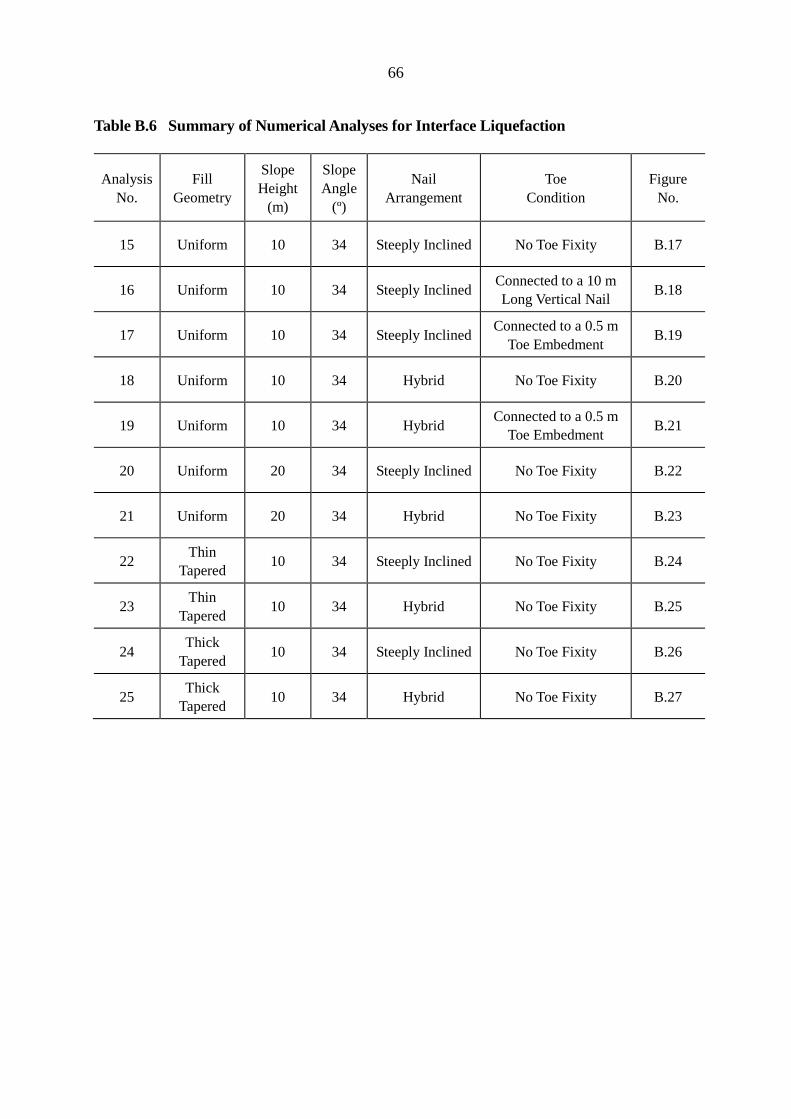
66
Table B.6 Summary of Numerical Analyses for Interface Liquefaction
Analysis No.
Fill Geometry
Slope Height
(m)
Slope Angle
(º)
Nail Arrangement
Toe Condition
Figure No.
15 Uniform 10 34 Steeply Inclined No Toe Fixity B.17
16 Uniform 10 34 Steeply Inclined Connected to a 10 m Long Vertical Nail
B.18
17 Uniform 10 34 Steeply Inclined Connected to a 0.5 m
Toe Embedment B.19
18 Uniform 10 34 Hybrid No Toe Fixity B.20
19 Uniform 10 34 Hybrid Connected to a 0.5 m
Toe Embedment B.21
20 Uniform 20 34 Steeply Inclined No Toe Fixity B.22
21 Uniform 20 34 Hybrid No Toe Fixity B.23
22 Thin
Tapered 10 34 Steeply Inclined No Toe Fixity B.24
23 Thin
Tapered 10 34 Hybrid No Toe Fixity B.25
24 Thick
Tapered 10 34 Steeply Inclined No Toe Fixity B.26
25 Thick
Tapered 10 34 Hybrid No Toe Fixity B.27
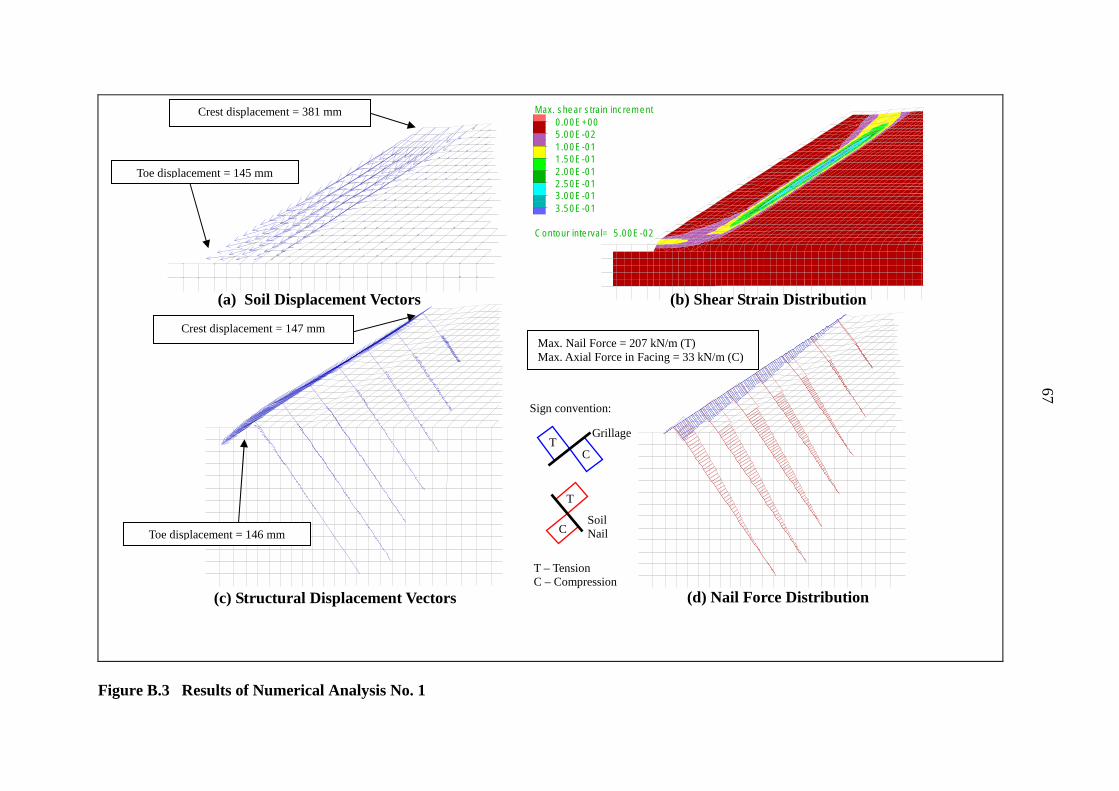
Crest displacement = 381 mm Max. shear strain increment 0.00E+00 5.00E-02 1.00E-01 1.50E-01 2.00E-01 2.50E-01 3.00E-01 3.50E-01
Toe displacement = 145 mm
Contour interval= 5.00E-02
(a) Soil Displacement Vectors (b) Shear Strain Distribution
Crest displacement = 147 mm Max. Nail Force = 207 kN/m (T) Max. Axial Force in Facing = 33 kN/m (C)
Sign convention:
T C
Grillage
T
Toe displacement = 146 mm C Soil Nail
(c) Structural Displacement Vectors
T – Tension C – Compression
(d) Nail Force Distribution
67
Figure B.3 Results of Numerical Analysis No. 1
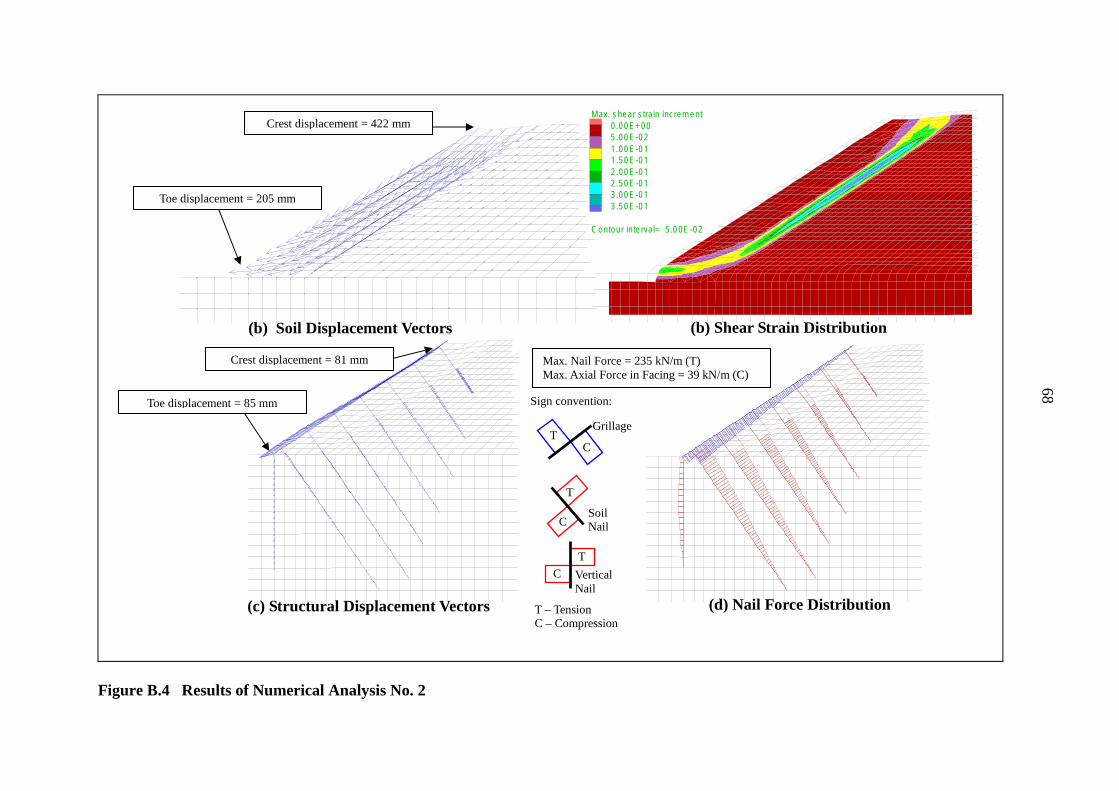
Max. shear strain increment
Crest displacement = 422 mm 0.00E+00 5.00E-02 1.00E-01 1.50E-01 2.00E-01 2.50E-01
Toe displacement = 205 mm 3.00E-01 3.50E-01
Contour interval= 5.00E-02
(b) Soil Displacement Vectors (b) Shear Strain Distribution
Crest displacement = 81 mm Max. Nail Force = 235 kN/m (T) Max. Axial Force in Facing = 39 kN/m (C)
Toe displacement = 85 mm Sign convention:
Grillage T
C
T
Soil C Nail
T
C Vertical Nail
(c) Structural Displacement Vectors T – Tension (d) Nail Force Distribution C – Compression
68
Figure B.4 Results of Numerical Analysis No. 2
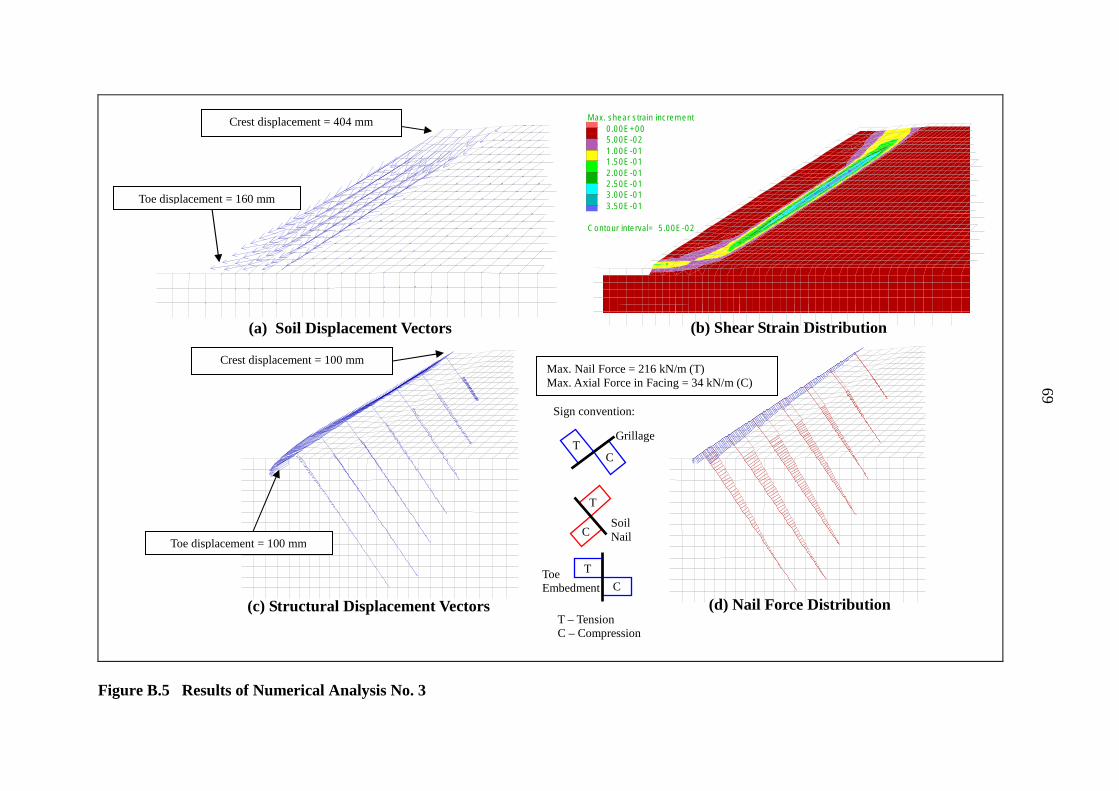
Crest displacement = 404 mm Max. shear strain increment
0.00E+00 5.00E-02 1.00E-01 1.50E-01 2.00E-01 2.50E-01
Toe displacement = 160 mm 3.00E-01 3.50E-01
Contour interval= 5.00E-02
(a) Soil Displacement Vectors (b) Shear Strain Distribution
Crest displacement = 100 mm Max. Nail Force = 216 kN/m (T) Max. Axial Force in Facing = 34 kN/m (C)
Sign convention:
Grillage T
C
T
Soil C Nail
Toe displacement = 100 mm
TToe Embedment C
(d) Nail Force Distribution (c) Structural Displacement Vectors T – Tension C – Compression
69
Figure B.5 Results of Numerical Analysis No. 3
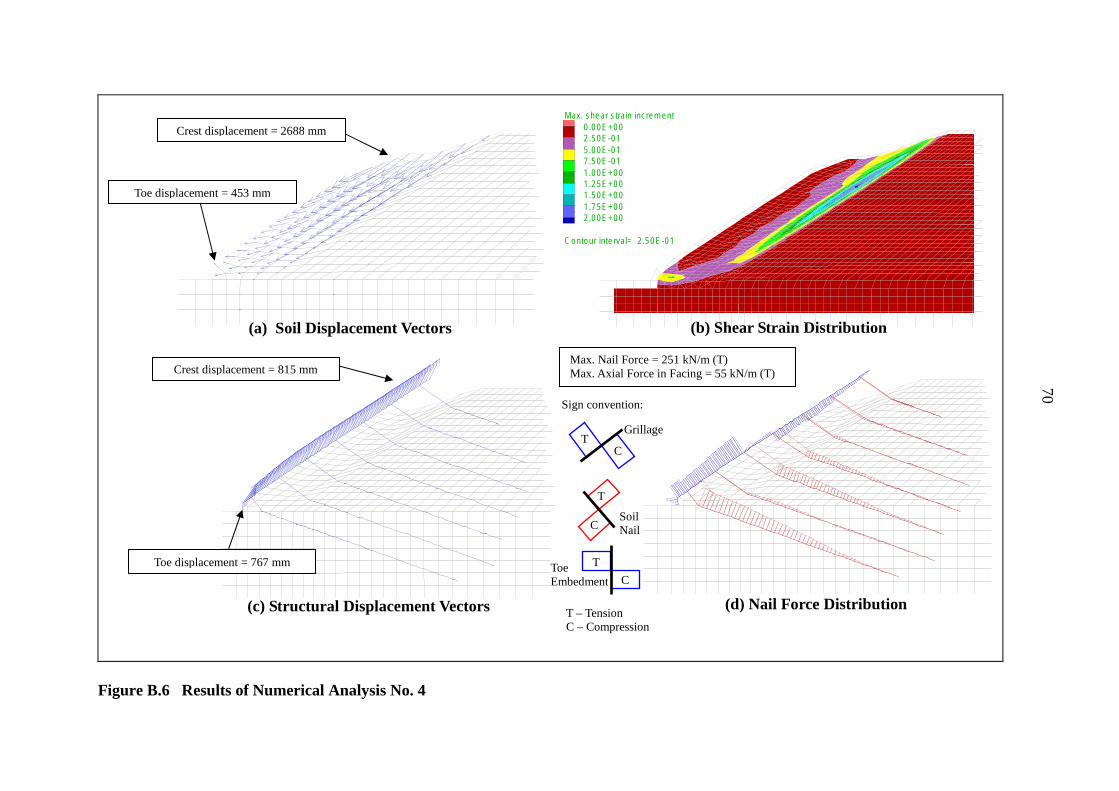
Max. shear strain increment 0.00E+00Crest displacement = 2688 mm 2.50E-01 5.00E-01 7.50E-01 1.00E+00 1.25E+00
Toe displacement = 453 mm 1.50E+00 1.75E+00 2.00E+00
Contour interval= 2.50E-01
(a) Soil Displacement Vectors (b) Shear Strain Distribution
Max. Nail Force = 251 kN/m (T) Crest displacement = 815 mm Max. Axial Force in Facing = 55 kN/m (T)
Sign convention:
Grillage T
C
T
Soil C Nail
Toe displacement = 767 mm TToe Embedment C
(c) Structural Displacement Vectors (d) Nail Force Distribution T – Tension C – Compression
70
Figure B.6 Results of Numerical Analysis No. 4
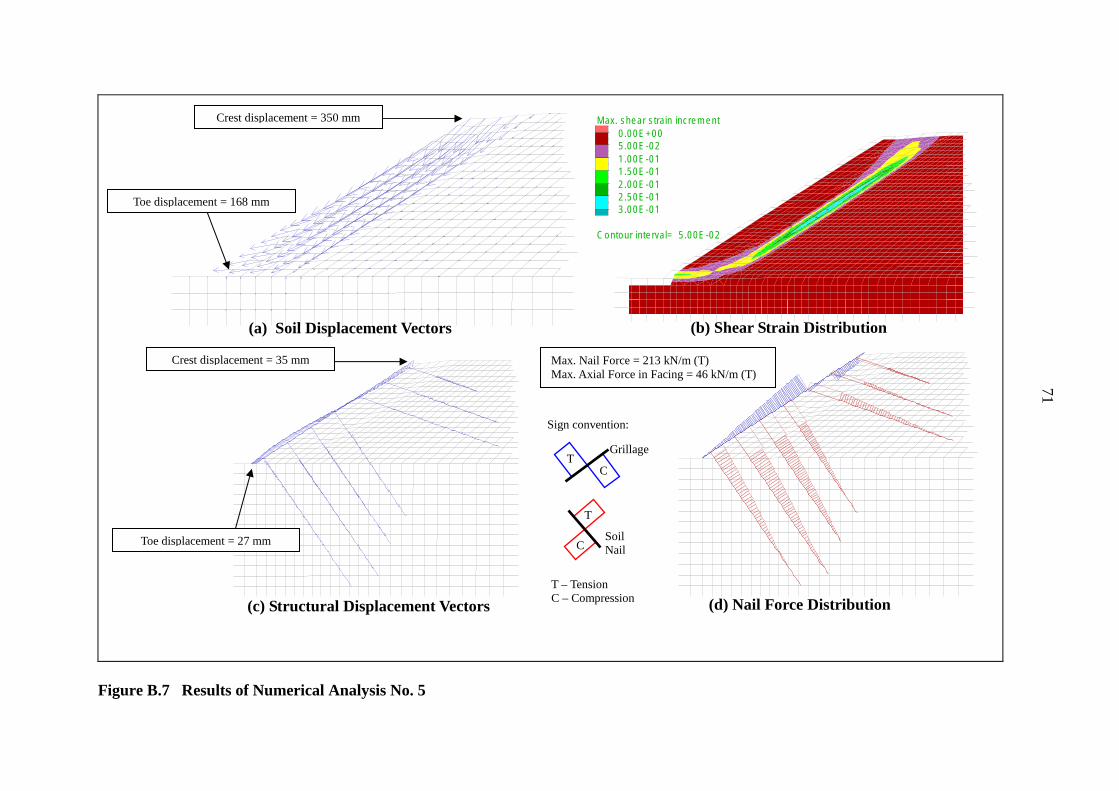
Grid plot
Crest displacement = 350 mm Max. shear strain increment
0.00E+00 5.00E-02 1.00E-01 1.50E-01 2.00E-01 2.50E-01Toe displacement = 168 mm 3.00E-01
Contour interval= 5.00E-02
(a) Soil Displacement Vectors (b) Shear Strain Distribution
Crest displacement = 35 mm Max. Nail Force = 213 kN/m (T) Max. Axial Force in Facing = 46 kN/m (T)
Sign convention:
T C
Grillage
Toe displacement = 27 mm
T
C Soil Nail
(c) Structural Displacement Vectors
T – Tension C – Compression (d) Nail Force Distribution
Figure B.7 Results of Numerical Analysis No. 5
71
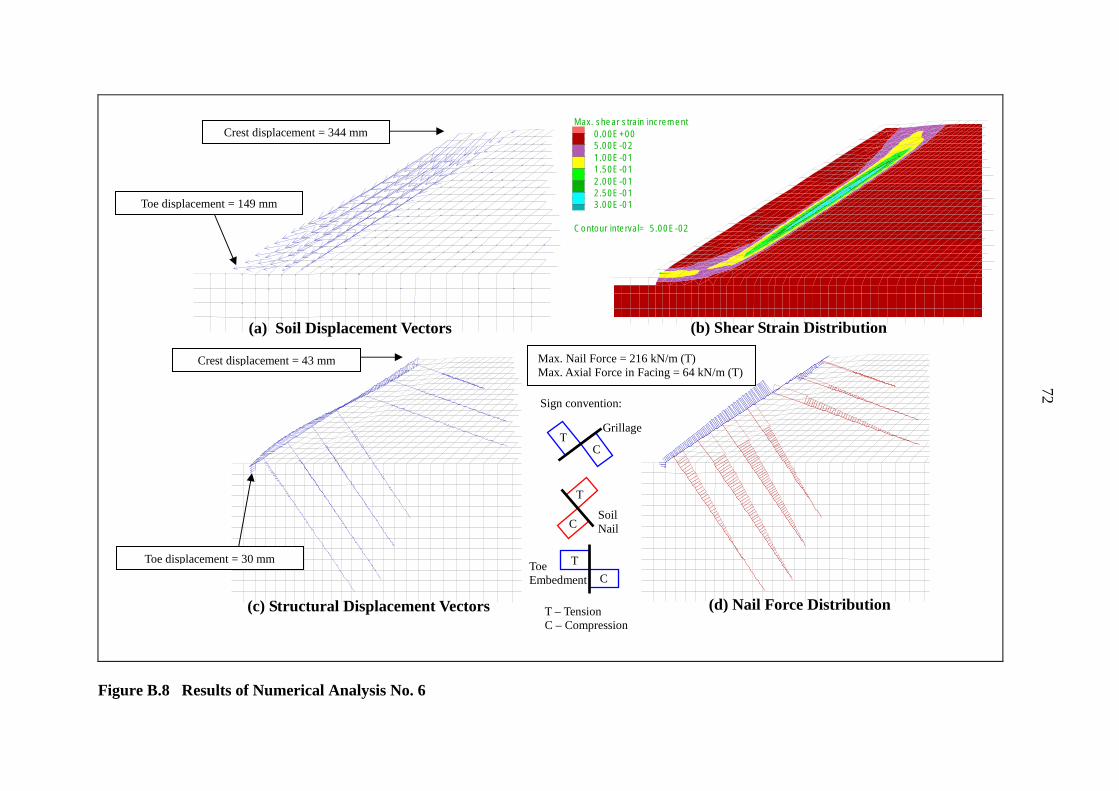
Grid plot
Max. shear strain increment
Crest displacement = 344 mm 0.00E+00 5.00E-02 1.00E-01 1.50E-01 2.00E-01 2.50E-01
Toe displacement = 149 mm 3.00E-01
Contour interval= 5.00E-02
(a) Soil Displacement Vectors (b) Shear Strain Distribution
Crest displacement = 43 mm Max. Nail Force = 216 kN/m (T) Max. Axial Force in Facing = 64 kN/m (T)
Sign convention:
Grillage T
C
T
Soil C Nail
Toe displacement = 30 mm TToe Embedment C
(c) Structural Displacement Vectors (d) Nail Force Distribution T – Tension C – Compression
72
Figure B.8 Results of Numerical Analysis No. 6
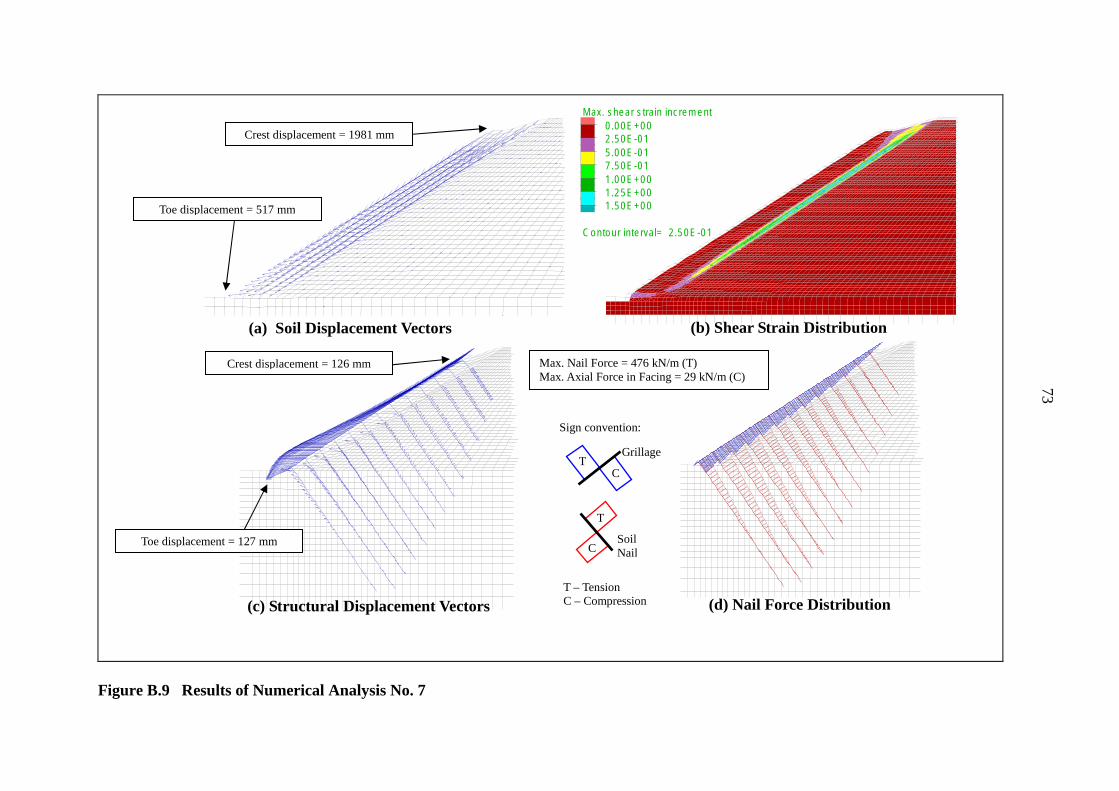
Crest displacement = 1981 mm
Toe displacement = 517 mm
(a) Soil Displacement Vectors
Crest displacement = 126 mm
Max. shear strain increment 0.00E+00 2.50E-01 5.00E-01 7.50E-01 1.00E+00 1.25E+00 1.50E+00
Contour interval= 2.50E-01
(b) Shear Strain Distribution
Max. Nail Force = 476 kN/m (T) Max. Axial Force in Facing = 29 kN/m (C)
Sign convention:
T C
Grillage
Toe displacement = 127 mm
T
C Soil Nail
(c) Structural Displacement Vectors T – Tension C – Compression (d) Nail Force Distribution
Figure B.9 Results of Numerical Analysis No. 7
73
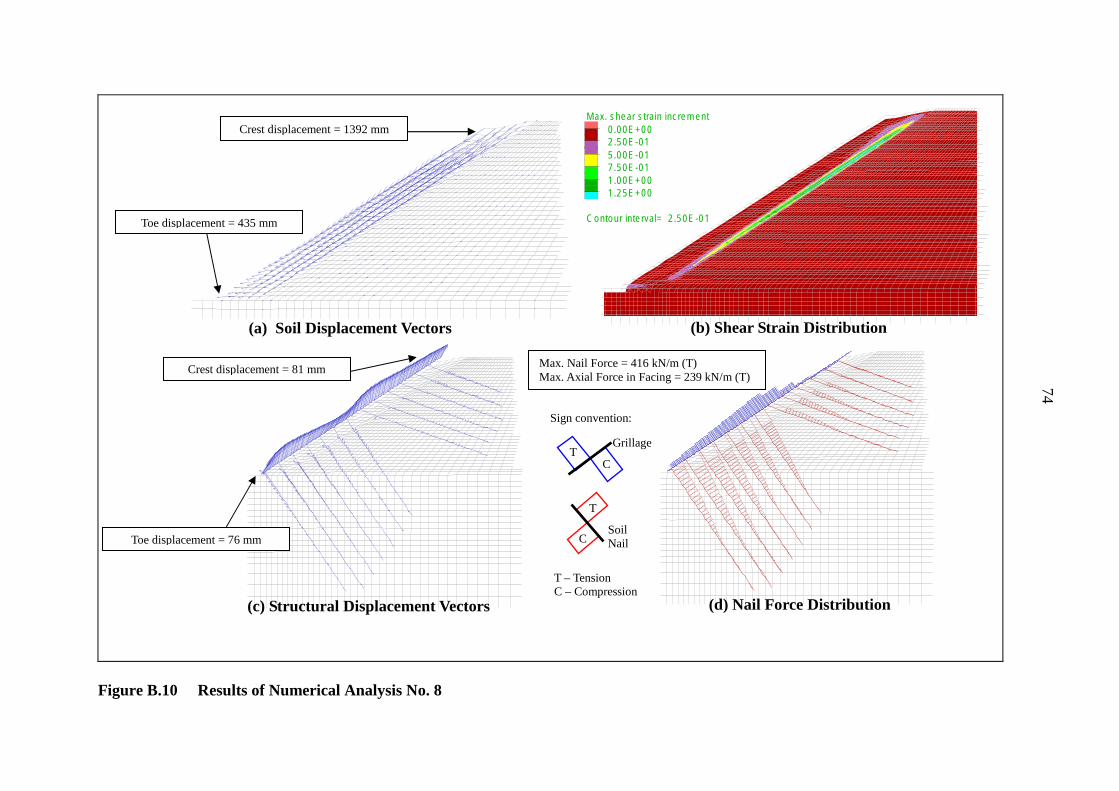
Crest displacement = 1392 mm
Toe displacement = 435 mm
(a) Soil Displacement Vectors
Crest displacement = 81 mm
Max. shear strain increment 0.00E+00 2.50E-01 5.00E-01 7.50E-01 1.00E+00 1.25E+00
Contour interval= 2.50E-01
(b) Shear Strain Distribution
Max. Nail Force = 416 kN/m (T) Max. Axial Force in Facing = 239 kN/m (T)
Sign convention:
T C
Grillage
Toe displacement = 76 mm
T
C Soil Nail
(c) Structural Displacement Vectors
T – Tension C – Compression
(d) Nail Force Distribution
Figure B.10 Results of Numerical Analysis No. 8
74
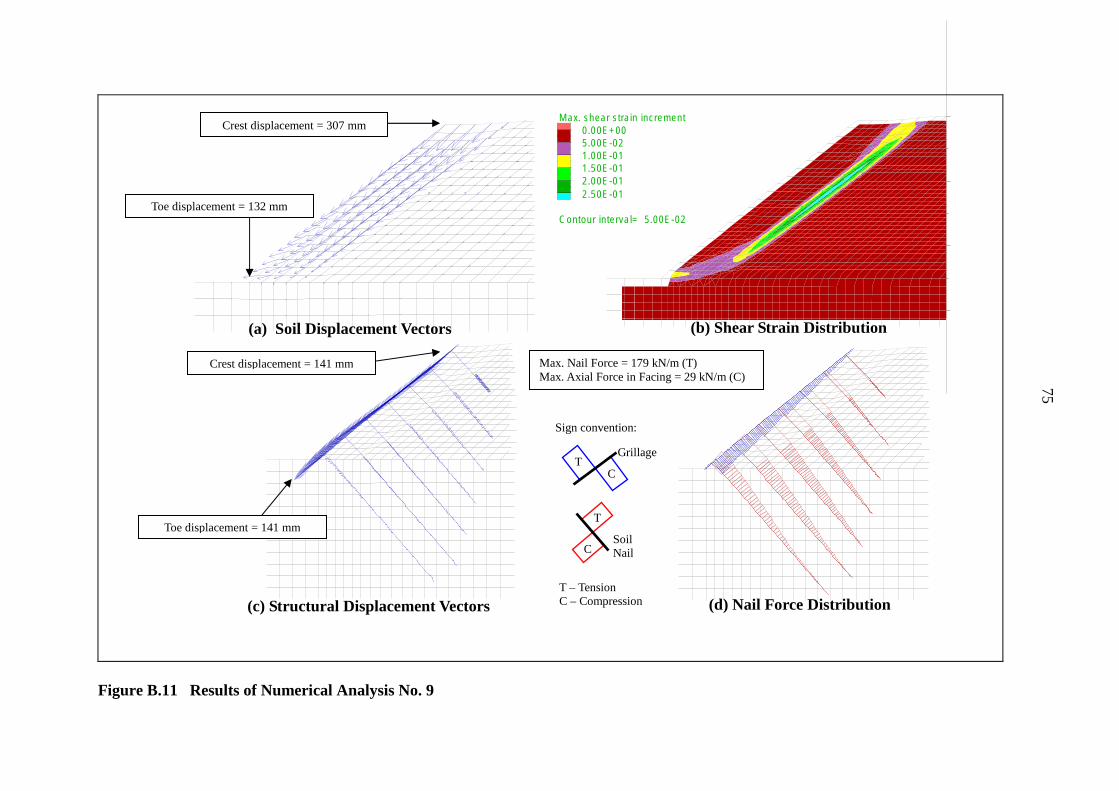
Max. shear strain increment
Crest displacement = 307 mm 0.00E+00 5.00E-02 1.00E-01 1.50E-01 2.00E-01 2.50E-01
Toe displacement = 132 mm Contour interval= 5.00E-02
(a) Soil Displacement Vectors (b) Shear Strain Distribution
Crest displacement = 141 mm Max. Nail Force = 179 kN/m (T) Max. Axial Force in Facing = 29 kN/m (C)
Sign convention:
T C
Grillage
Toe displacement = 141 mm T
C Soil Nail
(c) Structural Displacement Vectors T – Tension C – Compression (d) Nail Force Distribution
Figure B.11 Results of Numerical Analysis No. 9
75
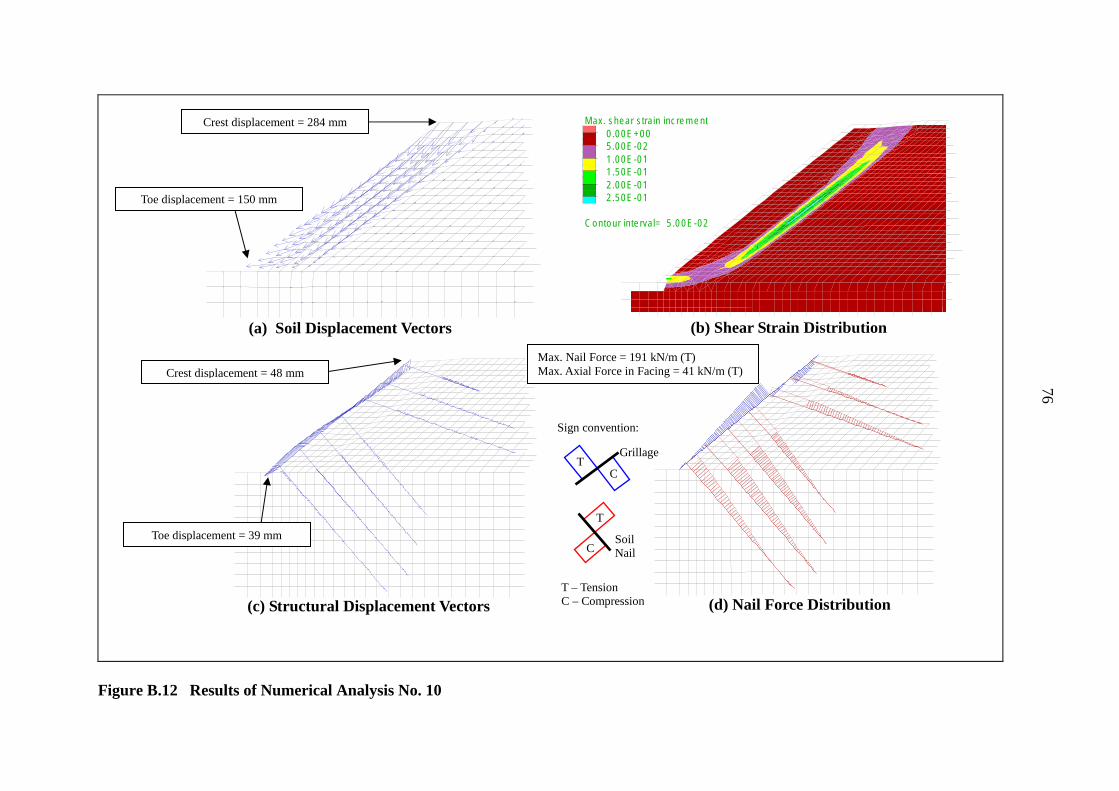
Crest displacement = 284 mm Max. shear strain increment
0.00E+00 5.00E-02 1.00E-01 1.50E-01 2.00E-01 2.50E-01 Toe displacement = 150 mm
Contour interval= 5.00E-02
(a) Soil Displacement Vectors (b) Shear Strain Distribution
Max. Nail Force = 191 kN/m (T) Crest displacement = 48 mm Max. Axial Force in Facing = 41 kN/m (T)
Sign convention:
T C
Grillage
Toe displacement = 39 mm
T
C Soil Nail
(c) Structural Displacement Vectors T – Tension C – Compression (d) Nail Force Distribution
Figure B.12 Results of Numerical Analysis No. 10
76
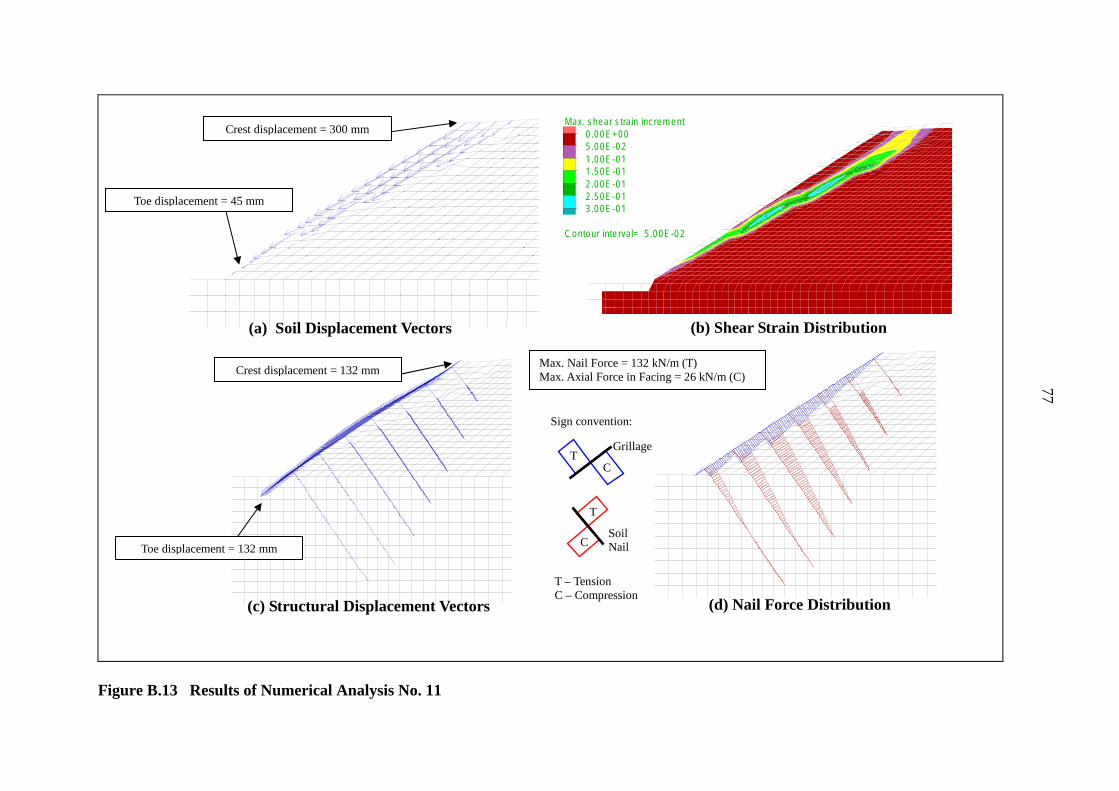
Max. shear strain increment
Crest displacement = 300 mm 0.00E+00 5.00E-02 1.00E-01 1.50E-01 2.00E-01 2.50E-01Toe displacement = 45 mm 3.00E-01
Contour interval= 5.00E-02
(a) Soil Displacement Vectors (b) Shear Strain Distribution
Max. Nail Force = 132 kN/m (T) Crest displacement = 132 mm Max. Axial Force in Facing = 26 kN/m (C)
Sign convention:
T C
Grillage
Toe displacement = 132 mm
T
C Soil Nail
(c) Structural Displacement Vectors
T – Tension C – Compression
(d) Nail Force Distribution
77
Figure B.13 Results of Numerical Analysis No. 11
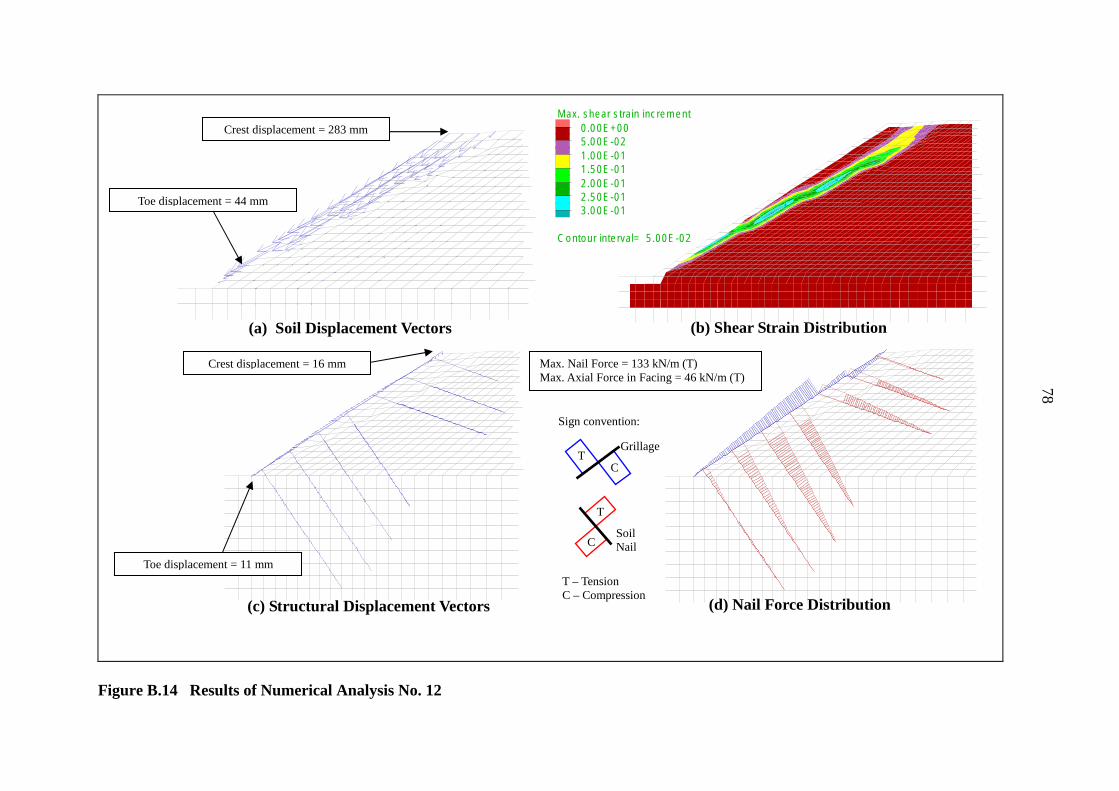
Crest displacement = 283 mm
Toe displacement = 44 mm
(a) Soil Displacement Vectors
Crest displacement = 16 mm
Max. shear strain increment 0.00E+00 5.00E-02 1.00E-01 1.50E-01 2.00E-01 2.50E-01 3.00E-01
Contour interval= 5.00E-02
(b) Shear Strain Distribution
Max. Nail Force = 133 kN/m (T) Max. Axial Force in Facing = 46 kN/m (T)
Sign convention:
T Grillage
C
T
Soil C Nail
Toe displacement = 11 mm
T – Tension
(c) Structural Displacement Vectors C – Compression
(d) Nail Force Distribution
Figure B.14 Results of Numerical Analysis No. 12
78
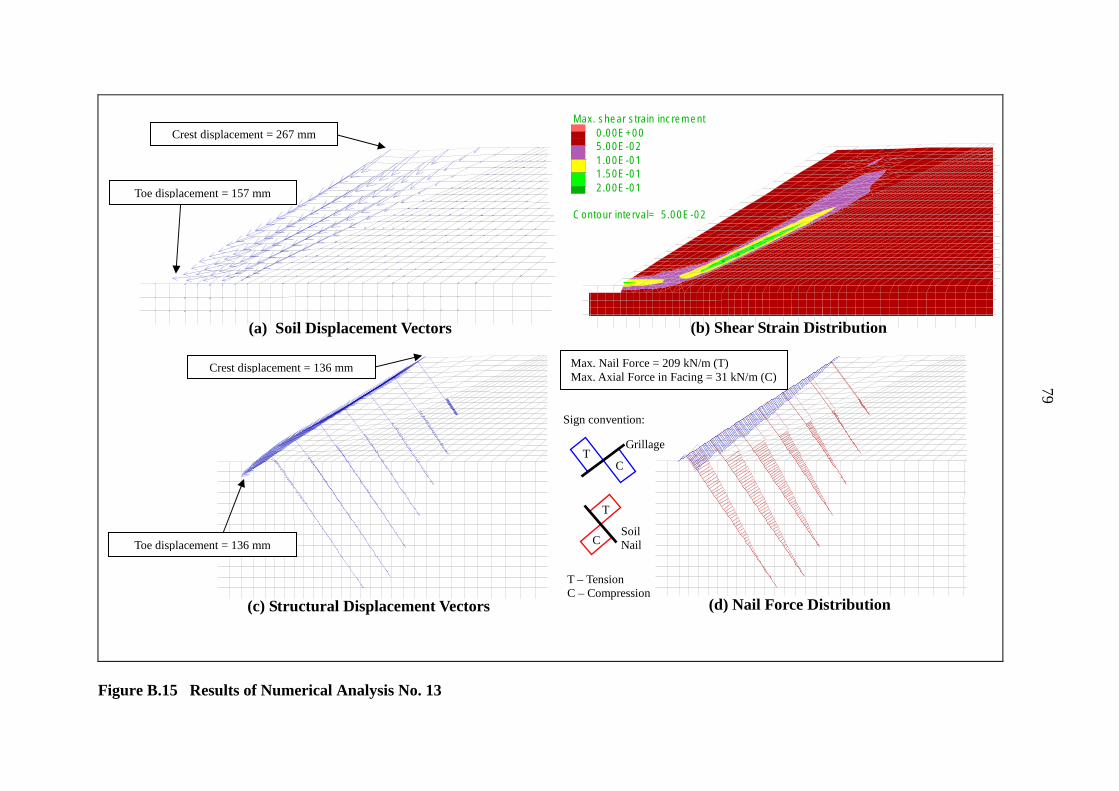
Crest displacement = 267 mm
Toe displacement = 157 mm
(a) Soil Displacement Vectors
Crest displacement = 136 mm
Max. shear strain increment 0.00E+00 5.00E-02 1.00E-01 1.50E-01 2.00E-01
Contour interval= 5.00E-02
(b) Shear Strain Distribution
Max. Nail Force = 209 kN/m (T) Max. Axial Force in Facing = 31 kN/m (C)
Sign convention:
T C
Grillage
Toe displacement = 136 mm
T
C Soil Nail
(c) Structural Displacement Vectors
T – Tension C – Compression
(d) Nail Force Distribution
Figure B.15 Results of Numerical Analysis No. 13
79
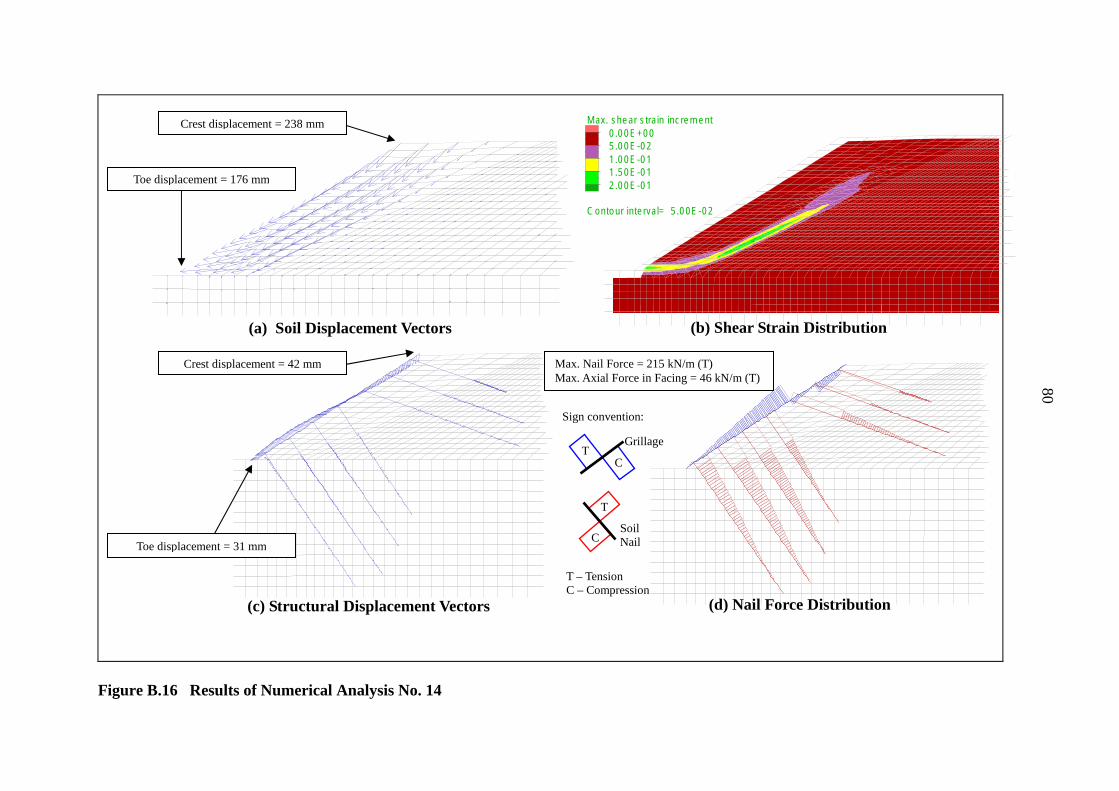
Max. shear strain incrementCrest displacement = 238 mm 0.00E+00 5.00E-02 1.00E-01 1.50E-01
Toe displacement = 176 mm 2.00E-01
Contour interval= 5.00E-02
(a) Soil Displacement Vectors (b) Shear Strain Distribution
Crest displacement = 42 mm Max. Nail Force = 215 kN/m (T) Max. Axial Force in Facing = 46 kN/m (T)
Sign convention:
T C
Grillage
T
Toe displacement = 31 mm C
Soil Nail
(c) Structural Displacement Vectors
T – Tension C – Compression
(d) Nail Force Distribution
80
Figure B.16 Results of Numerical Analysis No. 14
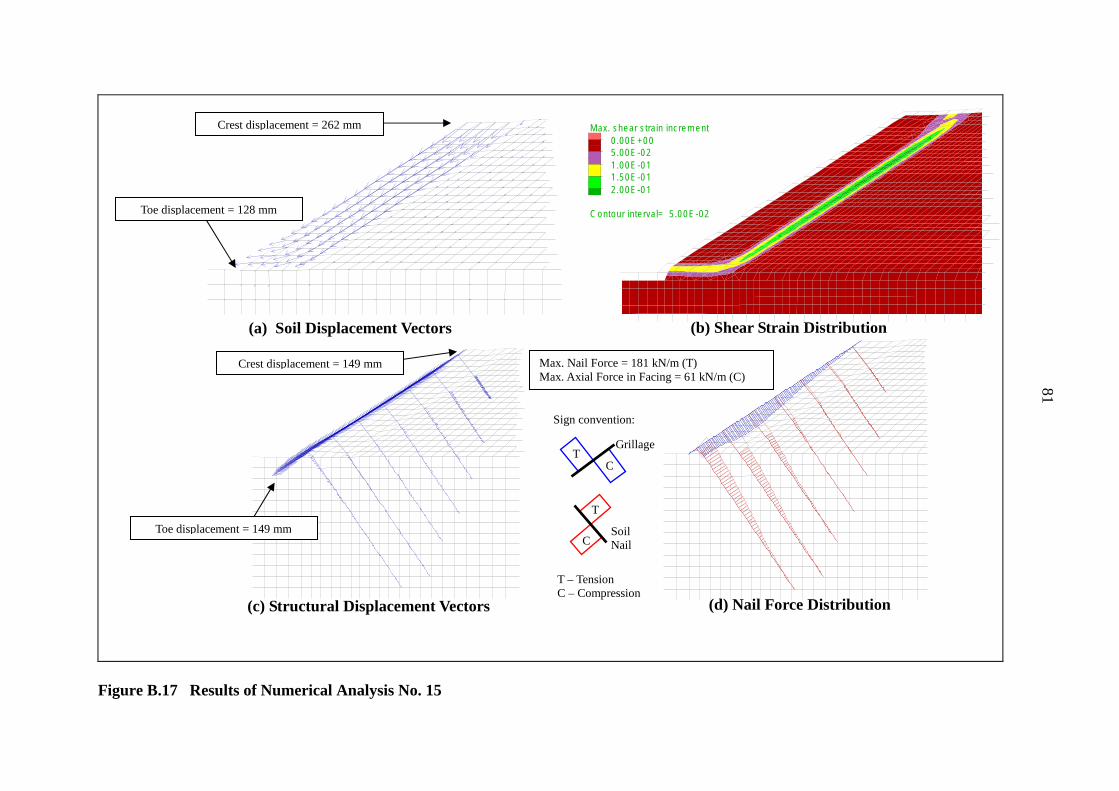
Crest displacement = 262 mm Max. shear strain increment
0.00E+00 5.00E-02 1.00E-01 1.50E-01 2.00E-01
Toe displacement = 128 mm Contour interval= 5.00E-02
(a) Soil Displacement Vectors (b) Shear Strain Distribution
Crest displacement = 149 mm Max. Nail Force = 181 kN/m (T) Max. Axial Force in Facing = 61 kN/m (C)
Sign convention:
T C
Grillage
Toe displacement = 149 mm
T
C Soil Nail
(c) Structural Displacement Vectors
T – Tension C – Compression
(d) Nail Force Distribution
Figure B.17 Results of Numerical Analysis No. 15
81

Crest displacement = 267 mm Max. shear strain increment
0.00E+00 5.00E-02 1.00E-01 1.50E-01 2.00E-01 2.50E-01
Toe displacement = 135 mm Contour interval= 5.00E-02
(a) Soil Displacement Vectors (b) Shear Strain Distribution
Crest displacement = 104 mm Max. Nail Force = 243 kN/m (T) Max. Axial Force in Facing = 76 kN/m (C)
Sign convention:
Grillage T
C
T
Soil Toe displacement = 110 mm C Nail
T
C Vertical Nail
(c) Structural Displacement Vectors (d) Nail Force Distribution T – Tension C – Compression
82
Figure B.18 Results of Numerical Analysis No. 16

Crest displacement = 286 mm
Max. shear strain increment 0.00E+00 5.00E-02 1.00E-01 1.50E-01 2.00E-01
Toe displacement = 122 mm Contour interval= 5.00E-02
(a) Soil Displacement Vectors (b) Shear Strain Distribution
Crest displacement = 110 mm Max. Nail Force = 164 kN/m (T) Max. Axial Force in Facing = 63 kN/m (C)
Sign convention:
Grillage T
C
T
Soil C Nail
Toe displacement = 110 mm
TToe Embedment C
(c) Structural Displacement Vectors (d) Nail Force Distribution T – Tension C – Compression
83
Figure B.19 Results of Numerical Analysis No. 17
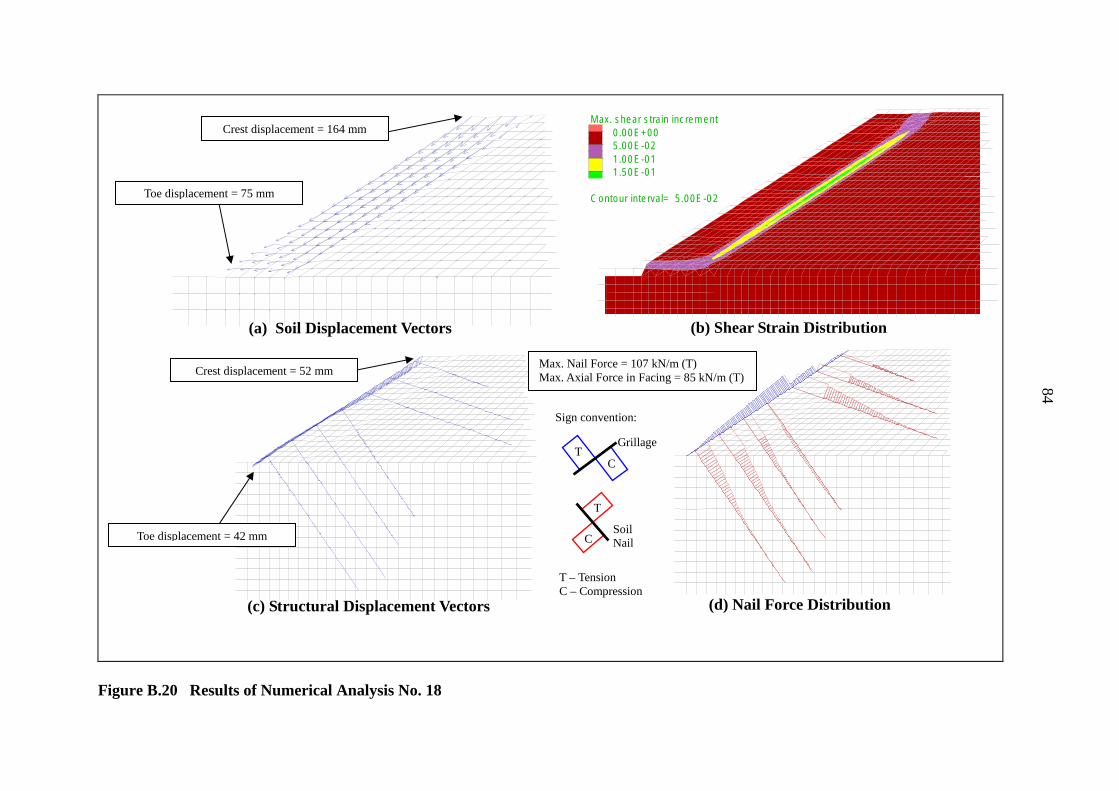
Grid plot
Crest displacement = 164 mm
Toe displacement = 75 mm
(a) Soil Displacement Vectors
Crest displacement = 52 mm
Max. shear strain increment 0.00E+00 5.00E-02 1.00E-01 1.50E-01
Contour interval= 5.00E-02
(b) Shear Strain Distribution
Max. Nail Force = 107 kN/m (T) Max. Axial Force in Facing = 85 kN/m (T)
Sign convention:
T C
Grillage
Toe displacement = 42 mm
T
C Soil Nail
(c) Structural Displacement Vectors
T – Tension C – Compression
(d) Nail Force Distribution
Figure B.20 Results of Numerical Analysis No. 18
84
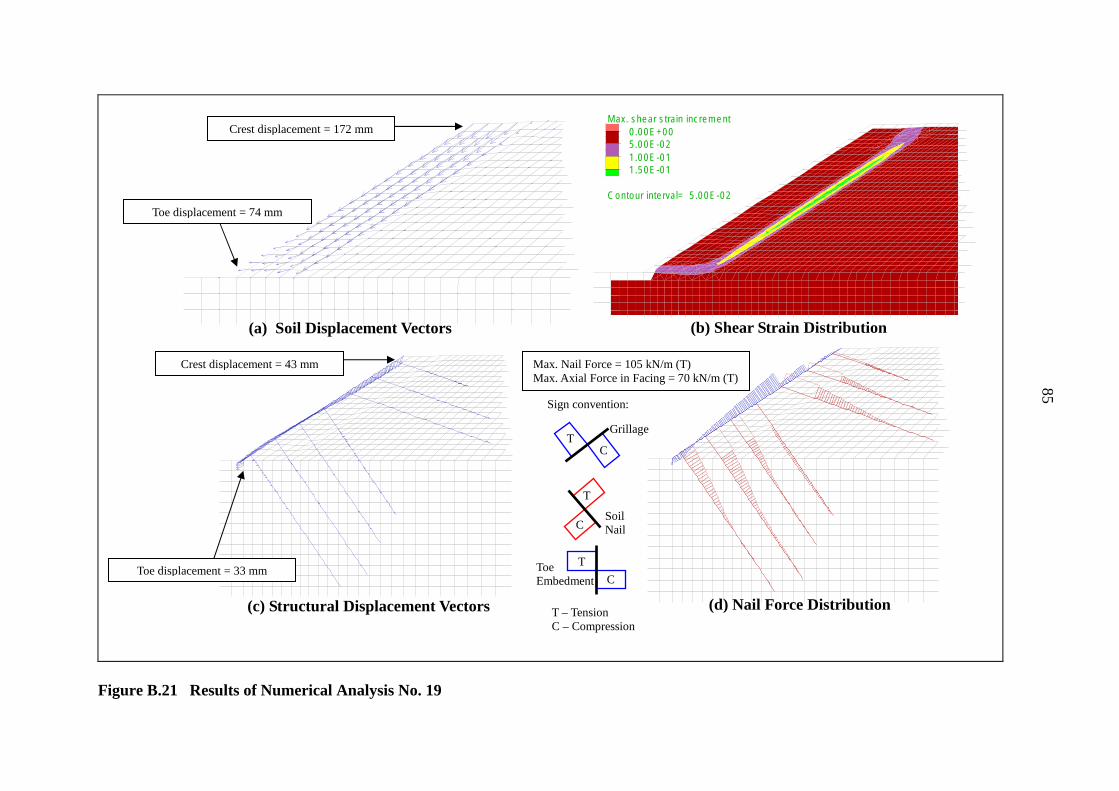
Grid plot
Crest displacement = 172 mm
Max. shear strain increment 0.00E+00 5.00E-02 1.00E-01 1.50E-01
Contour interval= 5.00E-02
Toe displacement = 74 mm
(b) Shear Strain Distribution (a) Soil Displacement Vectors
Crest displacement = 43 mm Max. Nail Force = 105 kN/m (T) Max. Axial Force in Facing = 70 kN/m (T)
Sign convention:
Grillage T
C
T
Soil C Nail
TToe Toe displacement = 33 mm Embedment C
(c) Structural Displacement Vectors (d) Nail Force Distribution T – Tension C – Compression
85
Figure B.21 Results of Numerical Analysis No. 19
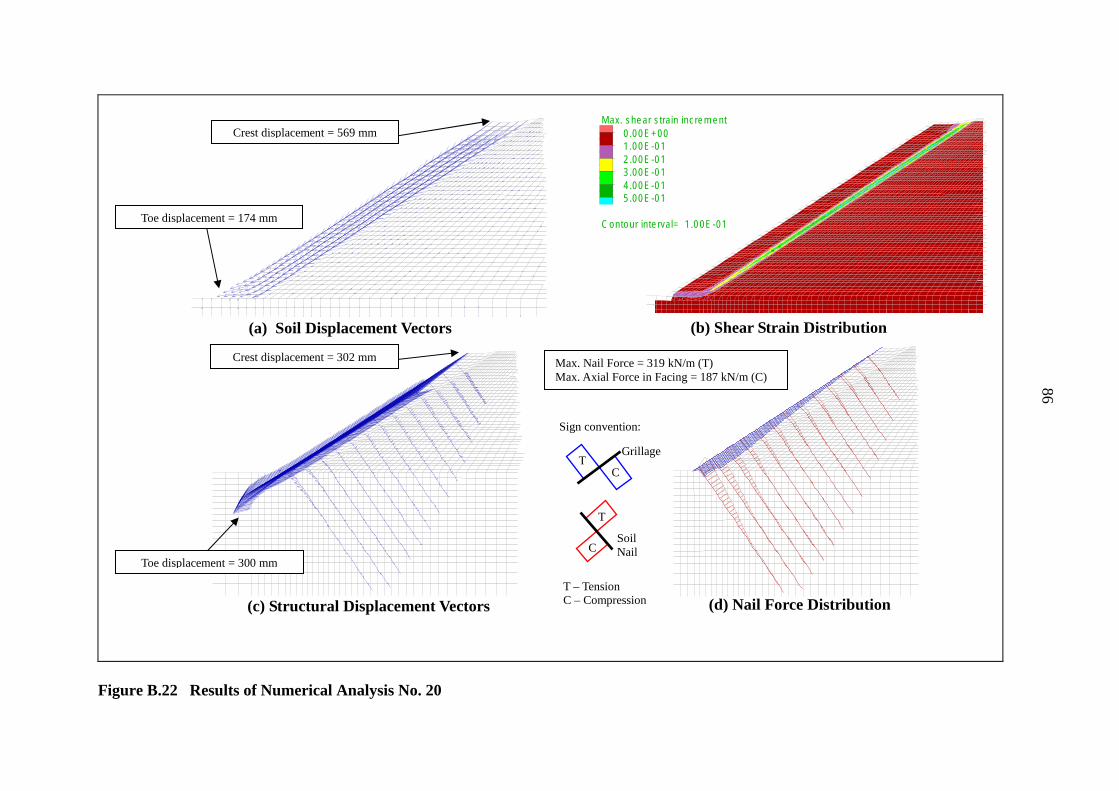
Max. shear strain increment
Crest displacement = 569 mm 0.00E+00 1.00E-01 2.00E-01 3.00E-01 4.00E-01 5.00E-01
Toe displacement = 174 mm Contour interval= 1.00E-01
(a) Soil Displacement Vectors (b) Shear Strain Distribution
Crest displacement = 302 mm Max. Nail Force = 319 kN/m (T) Max. Axial Force in Facing = 187 kN/m (C)
Sign convention:
T Grillage
C
T
Soil C Nail
Toe displacement = 300 mm
T – Tension
(c) Structural Displacement Vectors C – Compression (d) Nail Force Distribution
86
Figure B.22 Results of Numerical Analysis No. 20
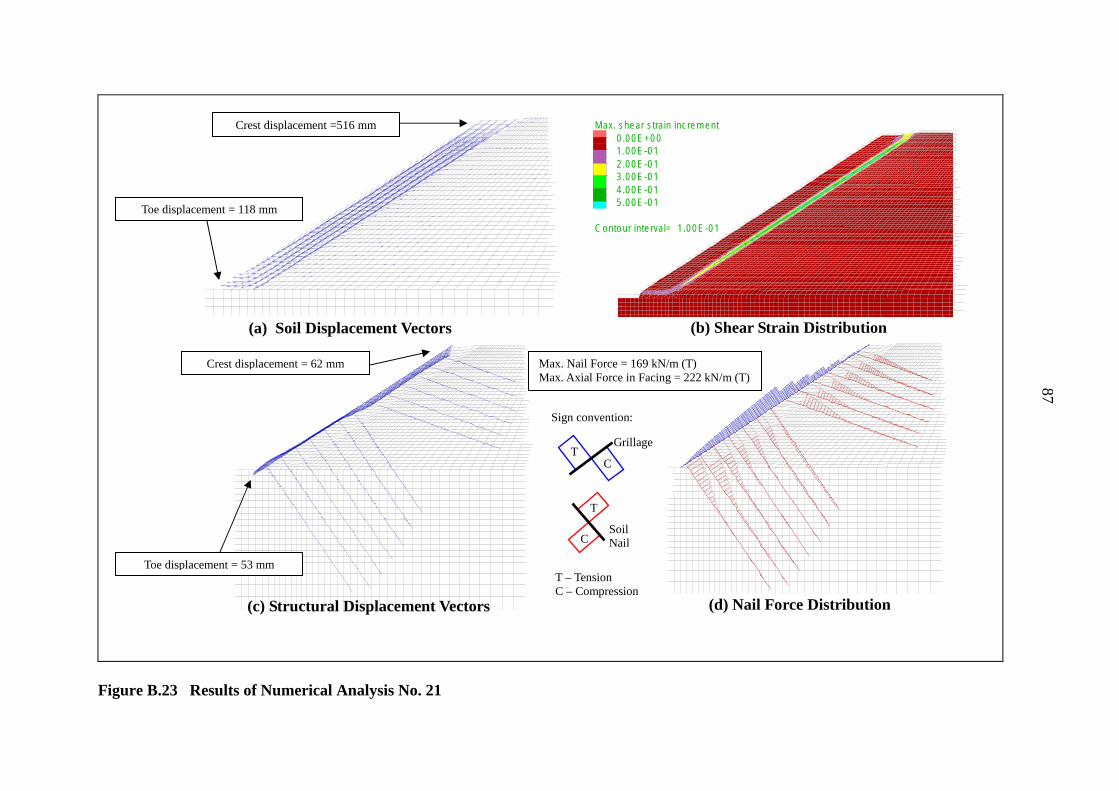
Crest displacement =516 mm Max. shear strain increment
0.00E+00 1.00E-01 2.00E-01 3.00E-01 4.00E-01 5.00E-01
Toe displacement = 118 mm
Contour interval= 1.00E-01
(a) Soil Displacement Vectors (b) Shear Strain Distribution
Max. Nail Force = 169 kN/m (T) Max. Axial Force in Facing = 222 kN/m (T)
Crest displacement = 62 mm
Sign convention:
T C
Grillage
T
C Soil Nail
(c) Structural Displacement Vectors
Toe displacement = 53 mm T – Tension C – Compression
(d) Nail Force Distribution
87
Figure B.23 Results of Numerical Analysis No. 21
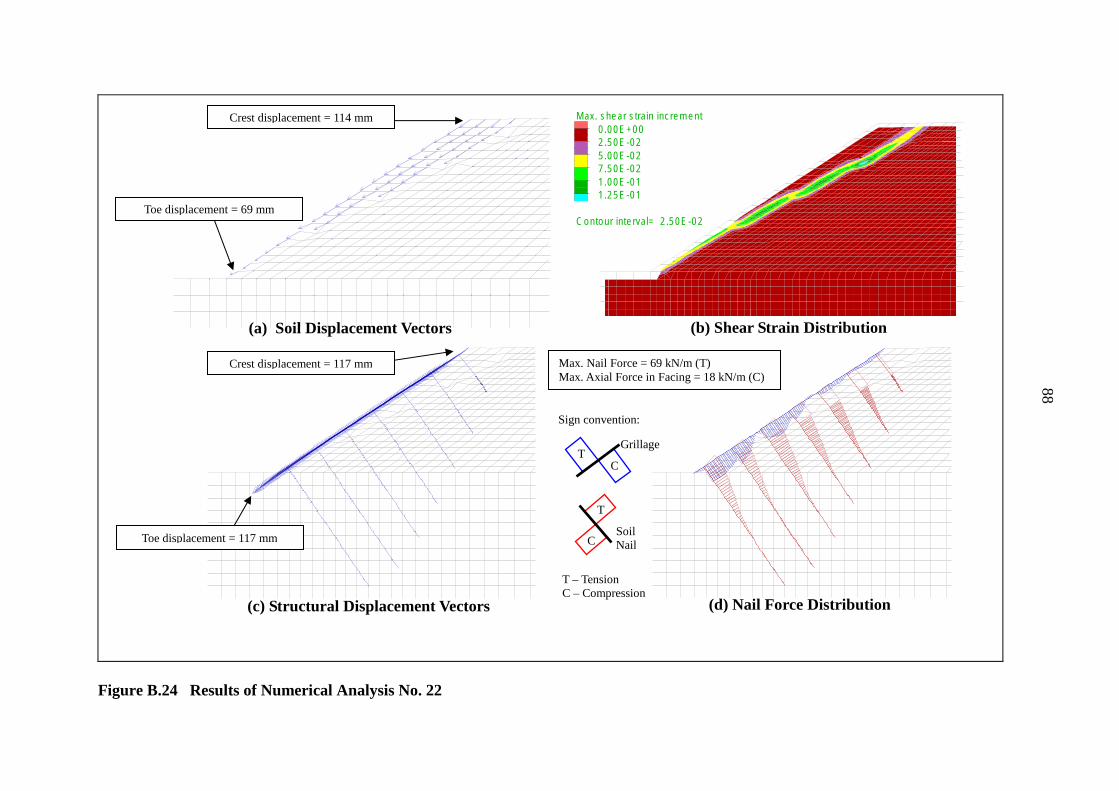
Crest displacement = 114 mm Max. shear strain increment
0.00E+00 2.50E-02 5.00E-02 7.50E-02 1.00E-01 1.25E-01
Toe displacement = 69 mm Contour interval= 2.50E-02
(a) Soil Displacement Vectors (b) Shear Strain Distribution
Crest displacement = 117 mm Max. Nail Force = 69 kN/m (T) Max. Axial Force in Facing = 18 kN/m (C)
Sign convention:
T C
Grillage
Toe displacement = 117 mm
T
C Soil Nail
(c) Structural Displacement Vectors
T – Tension C – Compression
(d) Nail Force Distribution
Figure B.24 Results of Numerical Analysis No. 22
88
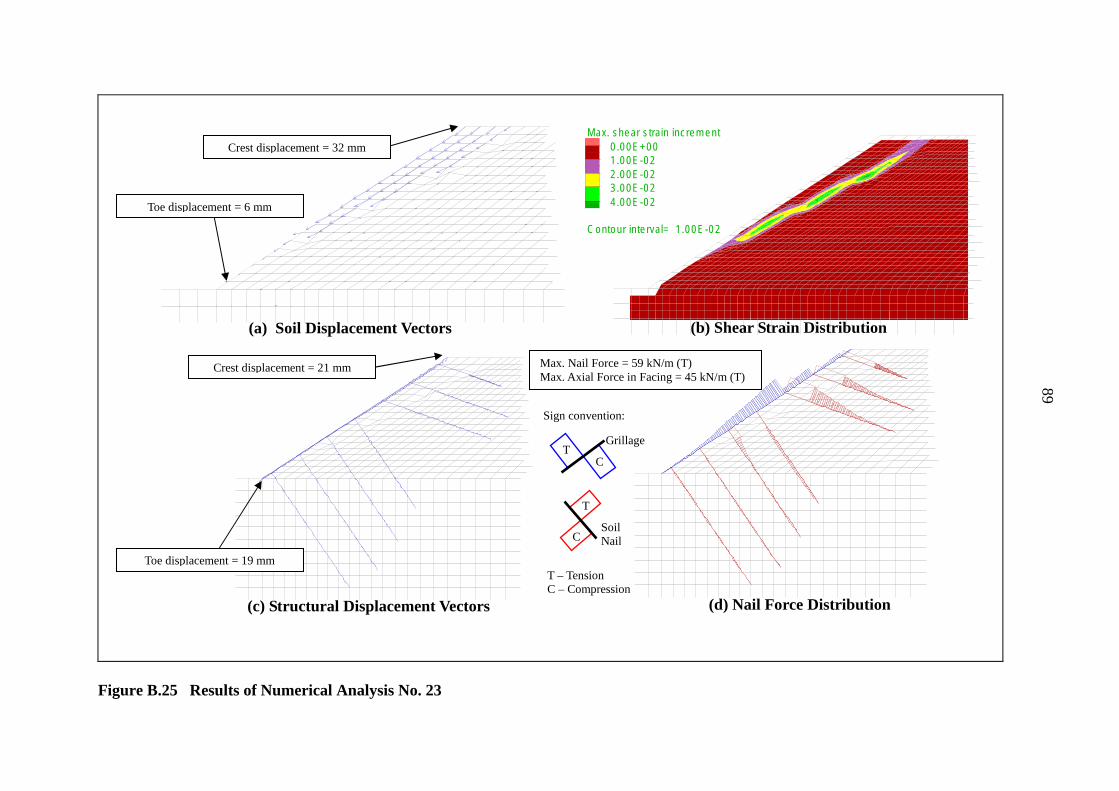
Crest displacement = 32 mm
Toe displacement = 6 mm
(a) Soil Displacement Vectors
Crest displacement = 21 mm
Max. shear strain increment 0.00E+00 1.00E-02 2.00E-02 3.00E-02 4.00E-02
Contour interval= 1.00E-02
(b) Shear Strain Distribution
Max. Nail Force = 59 kN/m (T) Max. Axial Force in Facing = 45 kN/m (T)
Sign convention:
T C
Grillage
T
C Soil Nail
(c) Structural Displacement Vectors
Toe displacement = 19 mm T – Tension C – Compression
(d) Nail Force Distribution
Figure B.25 Results of Numerical Analysis No. 23
89
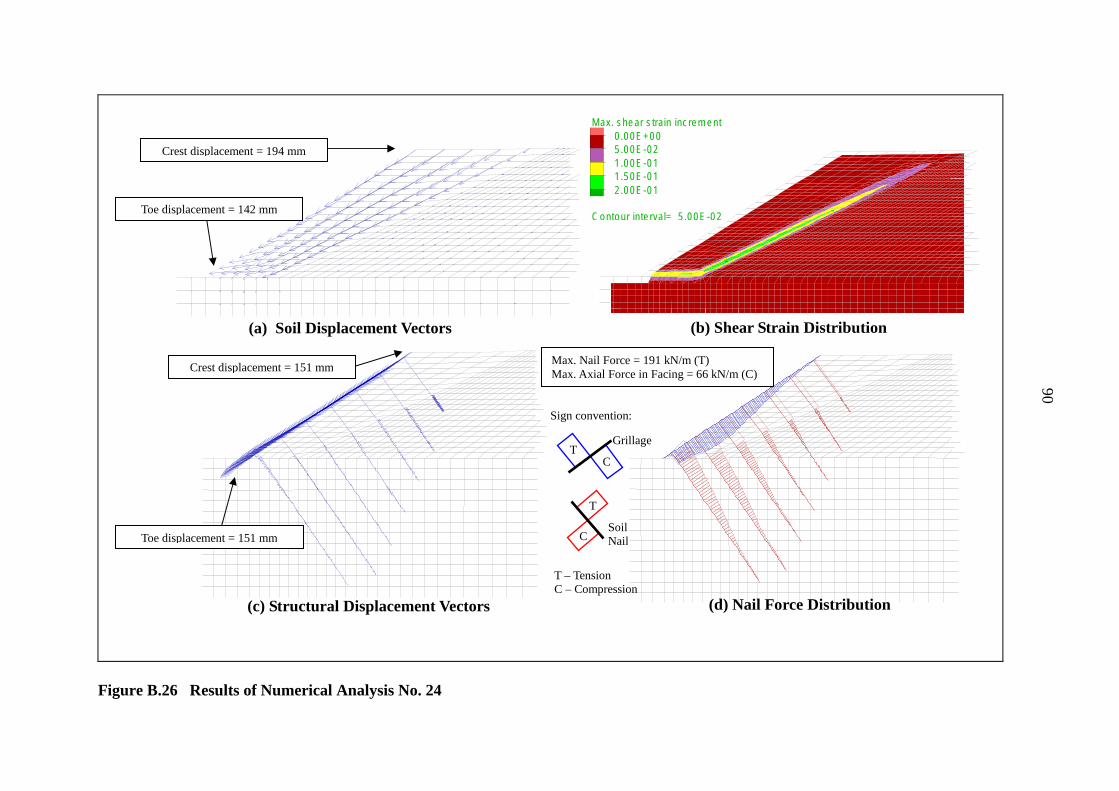
Crest displacement = 194 mm
Toe displacement = 142 mm
(a) Soil Displacement Vectors
Crest displacement = 151 mm
Max. shear strain increment 0.00E+00 5.00E-02 1.00E-01 1.50E-01 2.00E-01
Contour interval= 5.00E-02
(b) Shear Strain Distribution
Max. Nail Force = 191 kN/m (T) Max. Axial Force in Facing = 66 kN/m (C)
Sign convention:
T C
Grillage
Toe displacement = 151 mm
T
C Soil Nail
(c) Structural Displacement Vectors
T – Tension C – Compression
(d) Nail Force Distribution
Figure B.26 Results of Numerical Analysis No. 24
90
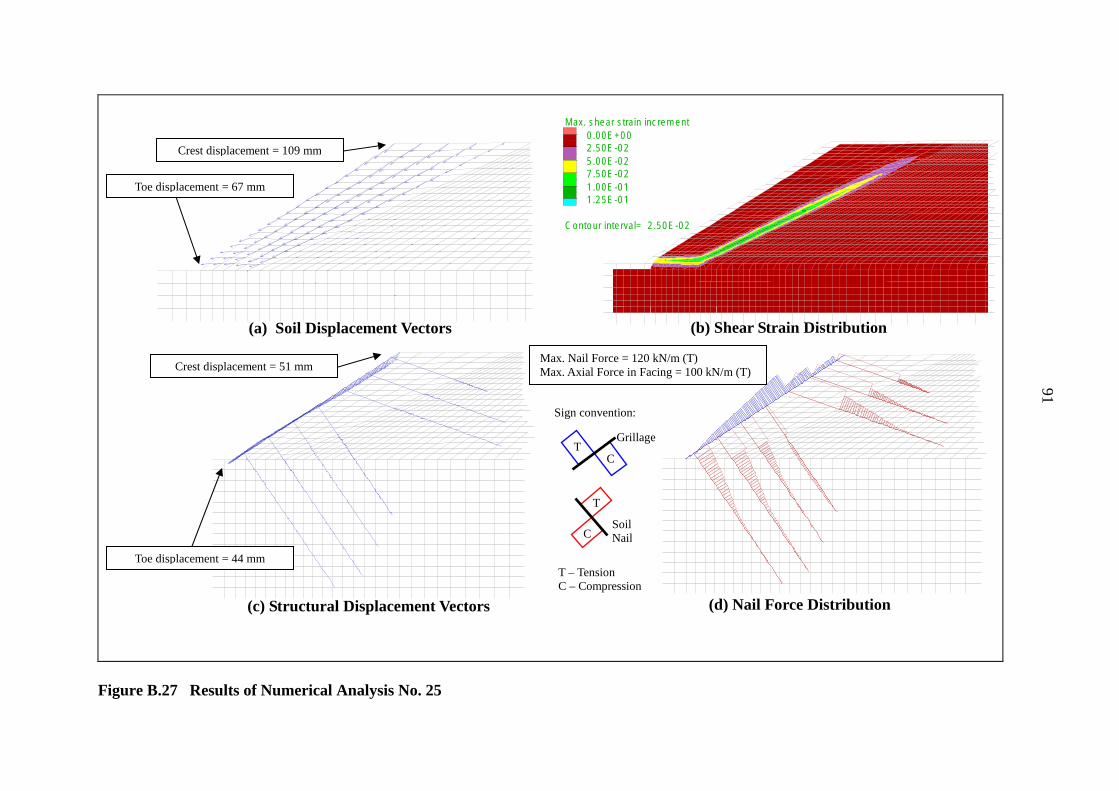
Crest displacement = 109 mm
Toe displacement = 67 mm
(a) Soil Displacement Vectors
Crest displacement = 51 mm
Max. shear strain increment 0.00E+00 2.50E-02 5.00E-02 7.50E-02 1.00E-01 1.25E-01
Contour interval= 2.50E-02
(b) Shear Strain Distribution
Max. Nail Force = 120 kN/m (T) Max. Axial Force in Facing = 100 kN/m (T)
Sign convention:
T C
Grillage
T
C Soil Nail
(c) Structural Displacement Vectors
Toe displacement = 44 mm T – Tension C – Compression
(d) Nail Force Distribution
Figure B.27 Results of Numerical Analysis No. 25
91
92
B.5 Sensitivity Study
A sensitivity study has been conducted to examine the development of structural (i.e. the grillage facing) and soil deformations from the working conditions to the ultimate liquefied state of the fill under full liquefaction and interface liquefaction respectively. In the numerical model, liquefaction was simulated by gradually reducing the friction angle of the loose fill. The development of soil and structural deformations throughout the simulated liquefaction process from c = 5 kPa and φ = 35° to the state of full liquefaction (i.e cu = css and φ = 0) are presented in Figures B.28 and B.29 respectively. Similar plots for interface liquefaction are presented in Figures B.30 and B.31.
As shown in the figures, the steeply-inclined nail system performs better with toe fixity either in the form of vertical nails or embedded toe wall. Without toe fixity, the structural rigidity of the entire system along the sliding direction is minimal given the negligible bending stiffness of soil nails. Together with the deformations required to mobilise sufficient nail forces (i.e. bending of the soil nails), large structural deformations are mobilised if the toe is free to move. The presence of toe fixity, in particular an embedded toe wall, significantly reduces the slope movement.
In contrast, the hybrid nail arrangement does not require toe fixity to limit the grillage facing displacement, and the resulting grillage facing displacements at the slope crest and slope toe are much less than those calculated for the steeply inclined nail arrangement even without the toe fixity.
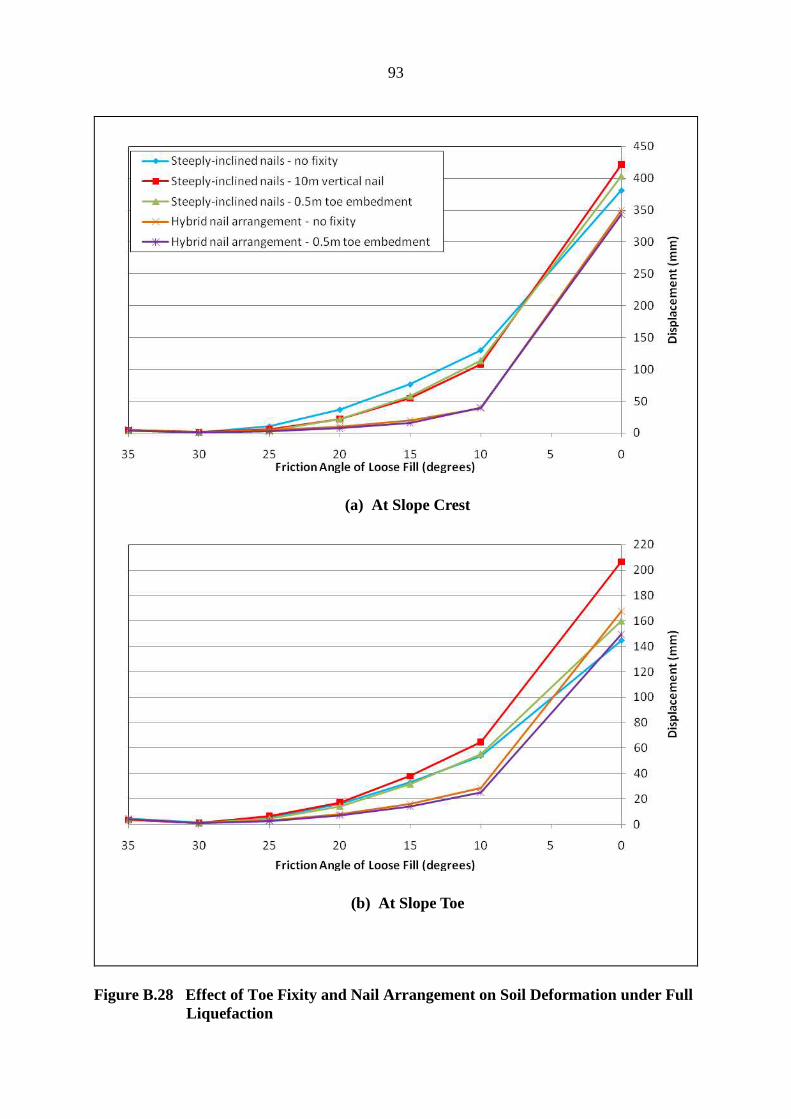
93
(a) At Slope Crest
(b) At Slope Toe
Figure B.28 Effect of Toe Fixity and Nail Arrangement on Soil Deformation under Full Liquefaction
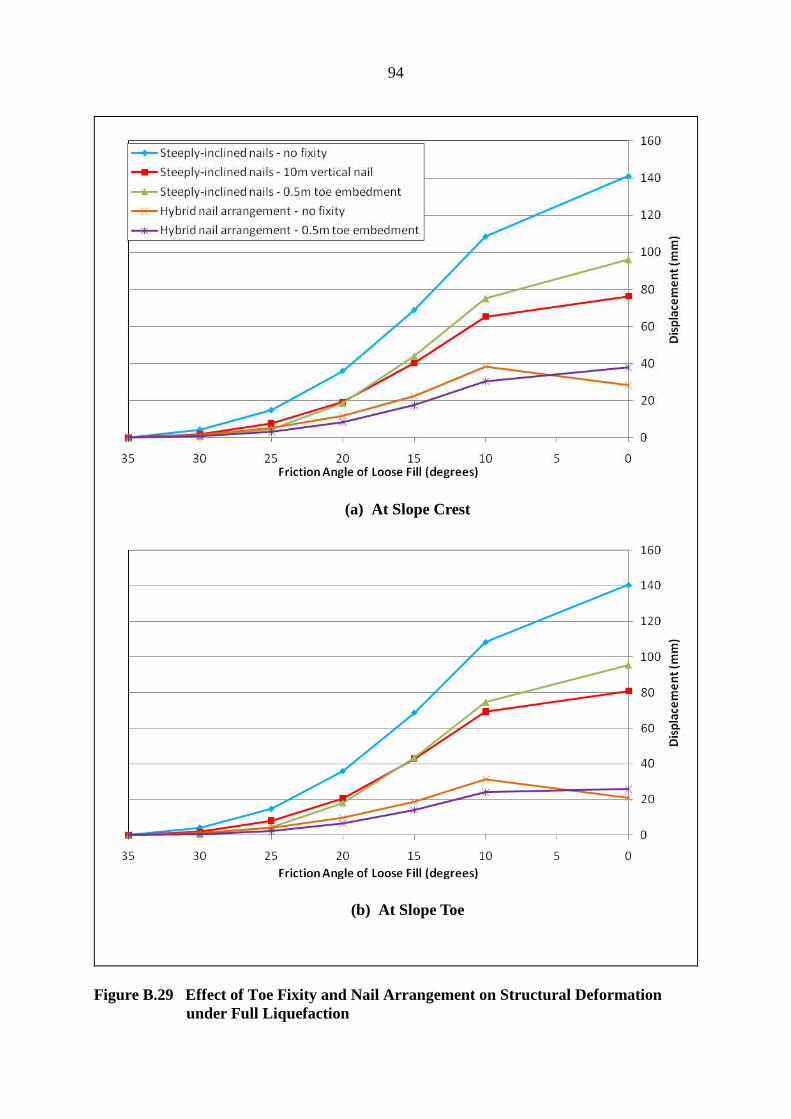
94
(a) At Slope Crest
(b) At Slope Toe
Figure B.29 Effect of Toe Fixity and Nail Arrangement on Structural Deformation under Full Liquefaction
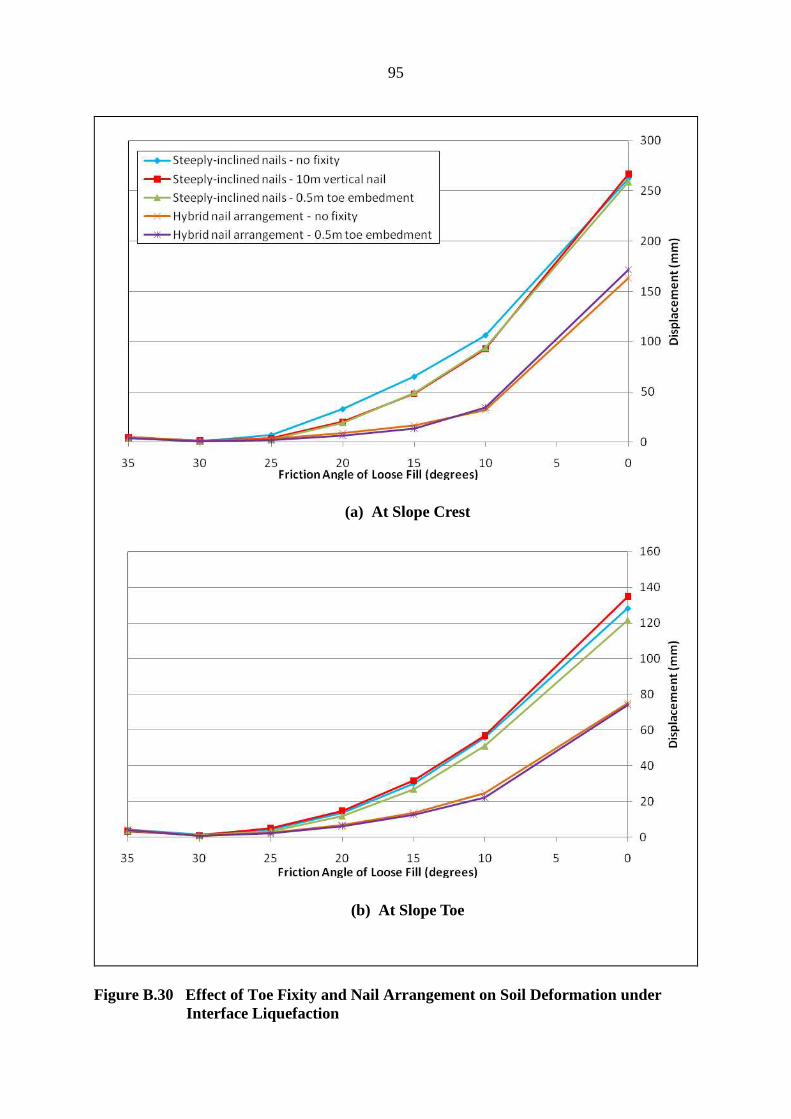
95
(a) At Slope Crest
(b) At Slope Toe
Figure B.30 Effect of Toe Fixity and Nail Arrangement on Soil Deformation under Interface Liquefaction
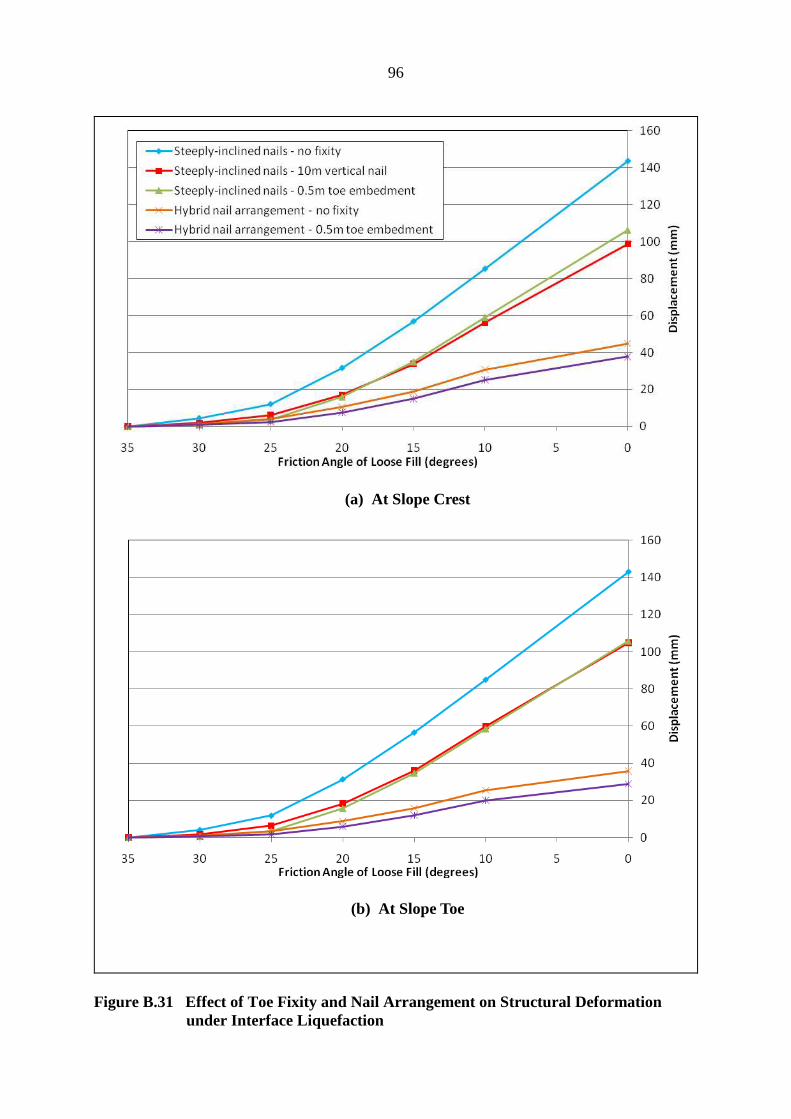
96
(a) At Slope Crest
(b) At Slope Toe
Figure B.31 Effect of Toe Fixity and Nail Arrangement on Structural Deformation under Interface Liquefaction