Embed Size (px)
Citation preview
Design of Flexible Pavements in Virginia Using AASHO Road Test Results N. K. V ASWAN!, Highway Research Engineer,
Virginia Highway Research Council, Charlottesville
A method based on the AASHO Road Test model equation and a theoretical equation for pavement deflection is presented for design of flexible pavements in Virginia. The independent variables evaluated are (a) the thickness of the layers of the pavement, (b) strength equivalencies of the materials in each layer of the pavement, (c) subgrade support value including the soil resiliency and the environmental conditions affecting it, and (d) traffic. The dependent variable is the deflections measured by Dynaflect in the spring of 1967 and 1968.
Thickness equivalencies of the materials used in the construction of flexible pavements in Virginia have been determined. A soil classification map of Virginia, based on about 200 projects (each with 2 to 30 soil samples) throughout the state, has been prepared. This map shows five soil classifications based on resiliency, the AASHO soil classification, and texture of the soils. A design method for Virginia in the form of a nomogram is proposed as a maintenance and design tool. Two additional methods are based on present design conceptions, standards, and practice in Virginia.
•THE MAIN objective of this investigation is to provide a pavement design method for Virginia that is based on the AASHO Road Test results in terms of thickness equivalencies of the materials, soil support values, and traffic and that does not alter the present design concepts in Vi.rgi.nia.
A Dynaflect, which is a dynamic load device for measuring deflections, was used to evaluate the structural performance of pavements. The performance of this equipment was also studied.
The soil support values were determined on the basis of resiliency properties and California bearing ratio (CBR) values.
Fifty-four projects with varying pavement structures throughout Virginia were chosen for a satellite study. All these projects are on primary or Interstate roads. Three design methods are recommended. One of these methods, based on soil support values (SSV), traffic, and thickness index, was further tested on 74 new projects.
A principal purpose of this study is to evaluate the performance of the satellite pave.ments, to determine the thickness-equivalency values of the different materials in the pavement, and to correlate these values, along with other variables such as soil support and traffic, with the pavement performance.
The climatic and regional factors were considered to affect the subgrade soil, and hence their effects were assumed to have been considered in evaluating the subgrade support value. Strengths of all materials-e. g., asphaltic concrete and stone subbase-are considered to be the same all over Virginia because they are as specified by the Virginia Highway Department. The pavement life before resurfacing was considered in the design.
Paper sponsored by Committee on Flexible Pavement Design.
89
90
VARIABLES
Deflections
The Dynaflect records dynamic deflections of a pavement at 5 points at 1-ft intervals along the path of travel. The maximum deflection recorded is midway between its two wheel loads. Dynaflect measurements were made during the spring in 1967 and 1968.
Soil Support Value
Investigations have shown that the subgrade support value depends on two important factors: (a) resistance to a single applied load, and (b) rebound due to soil resiliency. The pavement design recommended herein is based on these two factors.
Traffic
The total traffic up to June 1967 and the average annual daily traffic (AADT) on each project were evaluated.
To determine the 18-kip equivalent the method given in the AASHO Interim Guide (1) was modified. The modified method is given in the first interim report on flexible -pavement design (~. This modified method has been accepted by the Virginia Highway Department.
THICKNESS EQUIV ALENCY VALUES
The AASHO Road Test report (~ defined the strength of the pavement as
(1)
It then equated this strength with pavement deflections. This relationship for a given system of load when converted to thickness equivalencies could be written in the following form:
log d
where D is the strength or thickness index of the pavement; a 1, a
2, ••• , are strength coefficients;
hl' h2
, ••• , are thicknesses of the respective layers; a2 a3 - , - , ... , are the thickness equivalencies; and a1 a1 d is the Benkelman beam deflection of the pavement.
(2)
(3)
In this investigation d is taken as the deflection measured by the Dynaflect in the spring. The deflection of a pavement is the sum of the compressions of the different layers of the pavement, including the subgrade. Compression in any layer depends not only on the thickness and the strength of each laye1·, but also on the following factors: (a) the thickness of the overlying layer, (b) the thickness equivalency of the material of the overlying layers, and (c) the ratio of the strength of the overlying or underlying layer and the strength of the layer itself as given by Burmister's equation (4).
The AASHO equation does not include the effects of these three factors. -In this study the effects of factors a and b were investigated to a certain extent. The effect of factor c was not considered because of the lack of data.
To provide for factor a, the thickness of the overlying layers, the following general equation-based on Boussinesq and Westergaard-was adopted. The derivation of the equation is explained in Appendix A.
where
91
(4)
d = deflection of the pavement in inches; A deflection modulus, a function of Poisson's ratio, elastic modulus,
and a given system of loading; a, b, and c constants;
r = horizontal distance of the point where the deflection is to be determined from the load point in inches;
H = vertical distance of the point where the deflection is to be determined from the load point in inches;
H 1 = vertical distance of the top of a layer from the top of the pavement in inches; and
H2 vertical distance of the bottom of the same layer from the top of the pavement in inches.
The values of the constants a, b, and c were determined by use of a computer program with different values of H1 and H
2• The value of r was 10 in. for the Dynaflect.
The most suitable values that would give the maximum effect of the thickness of the layer under consideration were adopted. With the values of the constants so determined, Eq. 4 could be written as follows:
(5)
To provide for factor b, the thickness equivalency of the overlying layers, Eq. 5 was modified. The modification consisted of converting the thickness of any layer of material into the equivalent thickness of asphaltic concrete. Thus, in a multilayered pavement with layered thicknesses h1, h2, h
3, ••• from the top of the pavement and equiv
alency values a1
, a2
, a3 , ••• respectively, the equation for the pavement deflection will be as follows:
EVALUATION OF FACTORS
General Behavior of Pavements
Studies of the satellite pavements in Virginia have shown that in the spring deflecrtions for a given pavement remain almost constant (5), and if any decrease takes place, it is for a short duration immediately after construction. The duration of variation in deflection after construction depends on the pavement components. The satellite projects taken in this investigation were old enough not to provide variations. Deflection data were taken during the springs of 1967 and 1968, and both sets of data gave the same correlation with the structural components of the pavement.
Evaluation of Thickness Equivalencies
A multiple regression analysis of the data from the 54 satellite projects was carried out with a computer to determine the thickness equivalency by means of Eq. 2. Different combinations were tried. Later, the thickness equivalencies of the cementtreated base and cement-treated stone subgrade varied from 0.8 to 1.7 and 0.4 to 0.5, respectively.
The most suitable thickness equivalencies obtained by multiple regression analysis followed by simple regression analysis of these satellite projects are given in Table 1. The values given by the AASHO Committee are also given in the table for comparison.
92
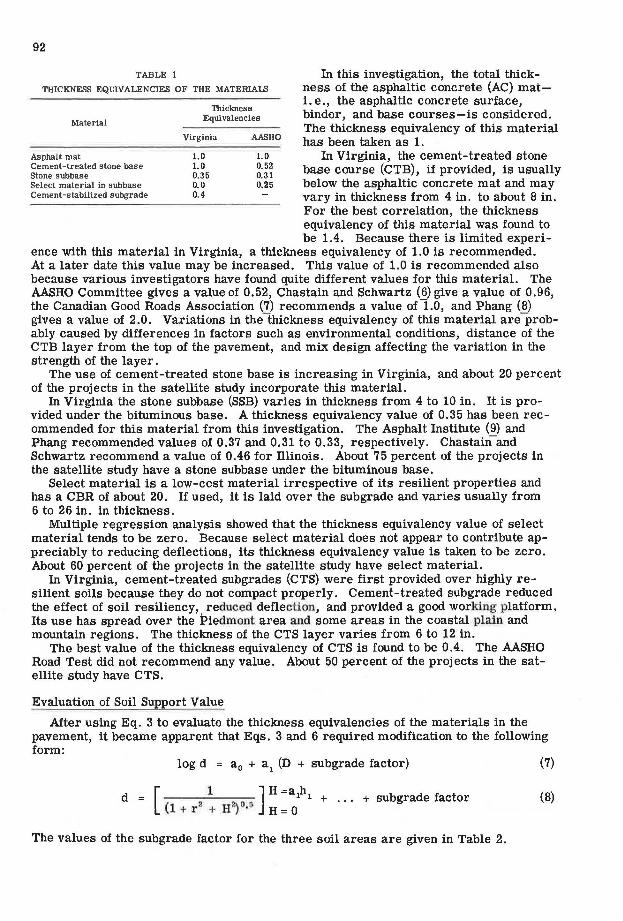
TABLE 1
THICKNESS EQillVALENCIES OF THE MATERIALS
Material
Asphalt mat Cement-treated stone base Stone subbase Select material in subbase Cement-stabilized subgrade
Thickness Equivalencles
Virginia
1.0 1.0 0.35 0.0 0.4
AASHO
1.0 0.52 0.31 0.25
In this investigation, the total thickness of the asphaltic concrete (AC) mati. e., the asphaltic concrete surface, binder, and base courses-is considered. The thickness equivalency of this material has been taken as 1.
In Virginia, the cement-treated stone base course (CTB), if provided, is usually below the asphaltic concrete mat and may vary in thickness from 4 in. to about 8 in. For the best correlation, the thickness equivalency of this material was found to be 1.4. Because there is limited experi-
ence with this material in Virginia, a thickness equivalency of 1.0 is recommended. At a later date this value may be increased. This value of 1.0 is recommended also because various investigators have found quite different values for this material. The AASHO Committee gives a value of 0.52, Chastain and Schwartz (6) give a value of 0.96, the Canadian Good Roads Association (7) recommends a value ofl.O, and Phang (8) gives a value of 2.0. Variations in thethickness equivalency of this material are-probably caused by differences in factors such as environmental conditions, distance of the CTB layer from the top of the pavement, and mix design affecting the variation in the strength of the layer.
The use of cement-treated stone base is increasing in Virginia, and about 20 percent of the projects in the satellite study incorporate this material.
In Virginia the stone subbase (SSB) varies in thickness from 4 to 10 in. It is provided under the bituminous base. A thickness equivalency value of 0.35 has been recommended for this material from this investigation. The Asphalt Institute (9) and Phang recommended values of 0.37 and 0.31 to 0.33, respectively. Chastain-and Schwartz recommend a value of 0.46 for Illinois. About 75 percent of the projects in the satellite study have a stone subbase under the bituminous base.
Select material is a low-cost material irrespective of its resilient properties and has a CBR of about 20. If used, it is laid over the subgrade and varies usually from 6 to 26 in. in thickness.
Multiple regression analysis showed that the thickness equivalency value of select material tends to be zero. Because select material does not appear to contribute appreciably to reducing deflections, its thickness equivalency value is taken to be zero. About 60 percent of the projects in the satellite study have select material.
In Virginia, cement-treated subgrades (CTS) were first provided over highly resilient soils because they do not compact properly. Cement-treated subgrade reduced the effect of soil resiliency, reduced deflection, and provided a good working platform. Its use has spread over the Piedmont area and some areas in the coastal plain and mountain regions. The thickness of the CTS layer varies from 6 to 12 in.
The best value of the thickness equivalency of CTS is found to be 0.4. The AASHO Road Test did not recommend any value. About 50 percent of the projects in the satellite study have CTS.
Evaluation of Soil Support Value
After using Eq. 3 to evaluate the thickness equivalencies of the materials in the pavement, it became apparent that Eqs. 3 and 6 required modification to the following form:
log d = a 0 + a1
(D + subgrade factor) (7)
d [
1 J H =ah 2
2\ 0
. 1 1 + . . . + subgrade factor
(1 + r + H I '5 H = 0
(8)
The values of the subgrade factor for the three soil areas are given in Table 2.
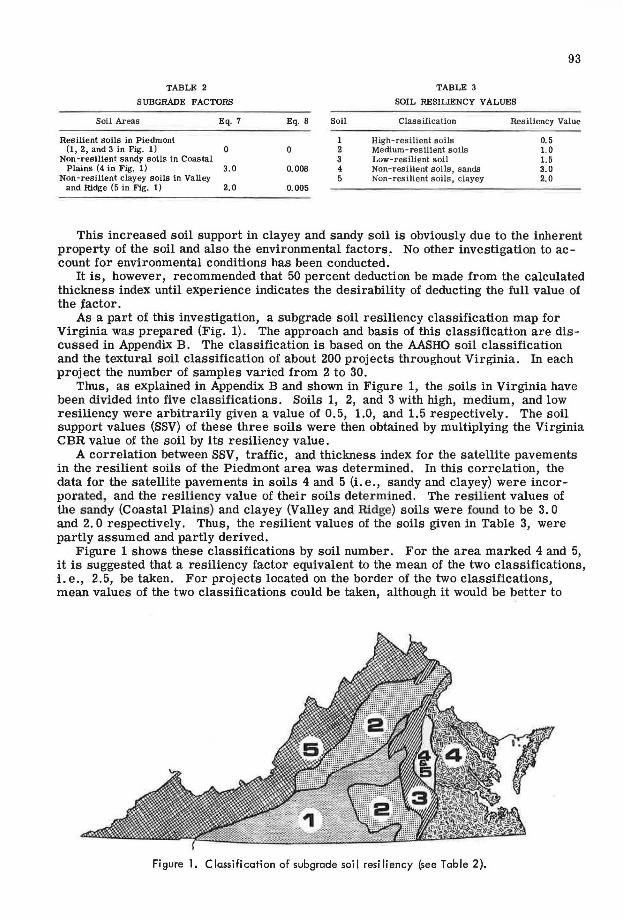
TABLE 2
SUBGRADE FACTORS
Soil Areas Eq. 7
Res llient soils in Piedmont (1, 2, and 3 in Fig. 1) 0
Non-resilient sandy soils in Coastal Plains (4 in Fig. 1) 3.0
Non-resilient clayey soils in Valley and Ridge (5 in Fig. 1) 2. 0
Eq. 8 Soil
1 0 2
3 0.008 4
5 0.005
93
TABLE 3
SOIL RESILIENCY VALUES
Classification Resiliency Value
High-resilient soils 0. 5 Medium-resilient soils 1.0 Low-resilient soil 1. 5 Non-resilient soils, sands 3.0 Non-resilient soils, clayey 2.0
This increased soil support in clayey and sandy soil is obviously due to the inherent property of the soil and also the environmental factors. No other investigation to account for environmental conditions has been conducted.
It is, however, recommended that 50 percent deduction be made from the calculated thickness index until experience indicates the desirability of deducting the full value of the tactor.
As a part of this investigation, a subgrade soil resiliency classification map for Virginia was prepared (Fig. 1). The approach and basis of this classification are discussed in Appendix B. The classification is based on the AASHO soil classification and the textural soil classification of about 200 projects throughout Virginia. In each project the number of samples varied from 2 to 30.
Thus, as explained in Appendix Band shown in Figure 1, the soils in Virginia have been divided into five classifications. Soils 1, 2, and 3 with high, medium, and low resiliency were arbitrarily given a value of 0. 5, 1.0, and 1.5 respectively. The soil support values (SSV) of these three soils were then obtained by multiplying the Virginia CBR value of the soil by its resiliency value.
A correlation between SSV, traffic, ani;i thickness index for the satellite pavements in the resilient soils of the Piedmont area was determined. In this correlation, the data for the satellite pavements in soils 4 and 5 (i.e., sandy and clayey) were incorporated, and the resiliency value of their soils determined. The resilient values of the sandy (Coastal Plains) and clayey (Valley and Ridge) soils were found to be 3. 0 and 2. 0 respectively. Thus, the resilient values of the soils given in Table 3, were partly assumed and partly derived.
Figure 1 shows these classifications by soil number. For the area marked 4 and 5, it is suggested that a resiliency factor equivalent to the mean of the two classifications, i.e., 2.5, be taken. For projects located on the border of the two classifications, mean values of the two classifications could be taken, although it would be better to
Figure 1. Classification of subgrade soil resi Ii ency (see Table 2).
94
2.0
1. 5
-6' ; 1,0 5 ~ 0,9
8 0, 8
,fl o. 7 ... -~ 0, 6
.!l
p
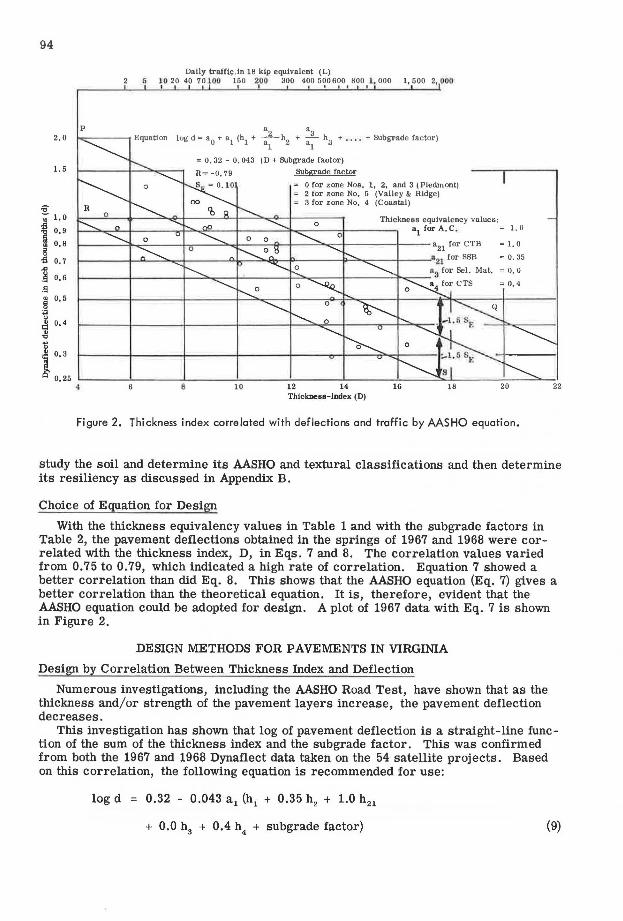
Daily traffic.In 18 kip equivalent (L) 5 10 20 40 70 100 150 200 300 400 500600 800 ! , 000 1, 500 2, 000
J • I I
a a3
log d = a 0 + a1 (bl + ~ h2 + ~ h3 + , , , , + Subgrade factor)
= O. 32 - O. 043 (D + SUbgrade factor) Subgrade factor
= 0 for zone Nos. 1, 2, and 3 (Piedmont) 2 for zone No, 5 (Valley & Ridge) 3 for zone No, 4 (Coastal)
Thickness equivalency values: a
1forA.C. 1.0
Thickness-index (D)
= 1. 0
= o. 35
= o. 0
= 0.4
Figure 2. Thickness index correlated with deflections and traffic by MSHO equation.
study the soil and determine its AASHO and textural classifications and then determine its resiliency as discussed in Appendix B.
Choice of Equation for Design
With the thickness equivalency values in Table 1 and with the subgrade factors in Table 2, the pavement deflections obtained in the springs of 1967 and 1968 were correlated with the thickness index, D, in Eqs. 7 and 8. The correlation values varied from 0.75 to 0.79, which indicated a high rate of correlation. Equation 7 showed a better correlation than did Eq. 8. This shows that the AASHO equation (Eq. 7) gives a better correlation than the theoretical equation. It is, therefore, evident that the AASHO equation could be adopted for design. A plot of 1967 data with Eq. 7 is shown in Figure 2.
DESIGN METHODS FOR PAVEMENTS IN VIRGINIA
Design by Correlation Between Thickness Index and Deflection
Numerous investigations, including the AASHO Road Test, have shown that as the thickness and/or strength of the pavement layers increase, the pavement deflection decreases.
This investigation has shown that log of pavement deflection is a straight-line function of the sum of the thickness index and the subgrade factor. This was confirmed from both the 1967 and 1968 Dynaflect data taken on the 54 satellite projects. Based on this correlation, the following equation is recommended for use:
log d = 0.32 - 0.043 a 1 (h1
+ 0.35 h2 + 1.0 h21
+ 0.0 h3
+ 0.4 h4
+ subgrade factor) (9)
95
TABLE 4
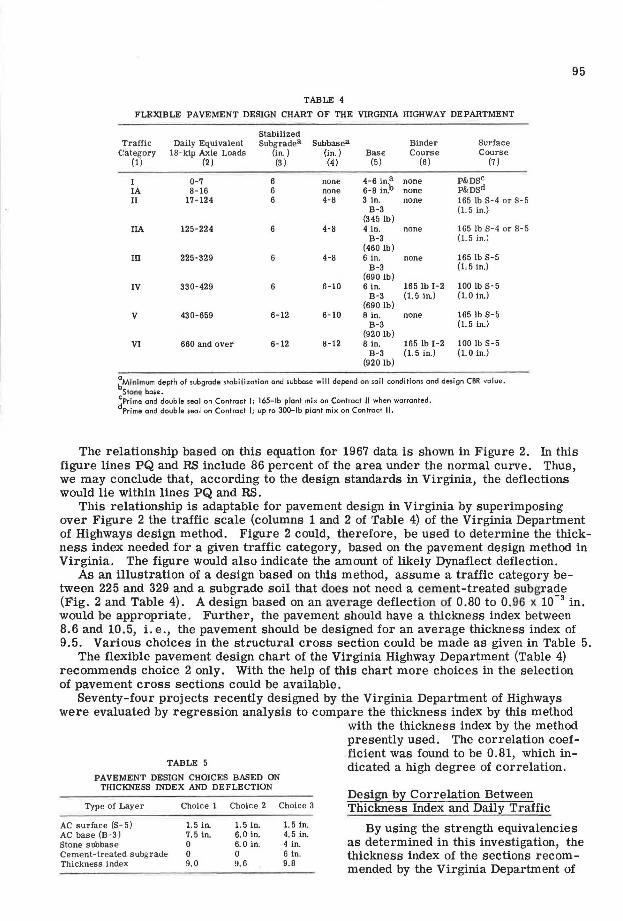
FLEXIBLE PAVEMENT DESIGN CHART OF THE VIRGINIA HIGHWAY DEPARTMENT
Stabilized Traffic Daily Equivalent Subgradea Subbasea Binder Surface
Category 18-klp Axle Loads (in.) (in.) Base Course Course (1) (2) (3) (4) (5) (6) (7)
I 0-7 6 none 4-6 in.a none P&Dsc IA 8-16 6 none 6-8 in,b none P&Dsd II 17-124 6 4-8 3 in. none 165 lb S-4 or S- 5
B-3 (1.5 in.) (345 lb)
IIA 125-224 4-8 4 in. none 165 lb S-4 or S-5 B-3 (1.5 in.)
(460 lb) lll 225-329 6 4-8 6 in. none 165 lb S-5
B-3 (1, 5 in.) (690 lb)
IV 330-429 6 6-10 6 in. 165 lb I-2 100 lb S-5 B-3 (1. 5 in.) (1.0 in.)
(690 lb) v 430-659 6-12 6-10 8 in. none 165 lb S-5
B-3 (1.5 in.) (920 lb)
V1 660 and over 6-12 8-12 8 in. 165 lb 1-2 100 lb S-5 B-3 (1.5 in.) (1.0 in.)
(920 lb)
~Minimum depth of subgrade stabilization and subbase will depend on soil conditions and design CBR value. Stone base.
'Prime and double seal on Contract I; 165-lb plant mix on Contract II when warranted. dPrime and double seal on Contract I; up to 300-lb plant mix on Contract II.
The relationship based on this equation for 1967 data is shown in Figure 2. In this figure lines PQ and RS include 86 percent of the area under the normal curve. Thus, we may conclude that, according to the design standards in Virginia, the deflections would lie within lines PQ and RS.
This relationship is adaptable for pavement design in Virginia by superimposing over Figure 2 the traffic scale (columns 1 and 2 of Table 4) of the Virginia Department of Highways design method. Figure 2 could, therefore, be used to determine the thickness index needed for a given traffic category, based on the pavement design method in Virginia. The figure would also indicate the amount of likely Dynaflect deflection.
As an illustration of a design based on this method, assume a traffic category between 225 and 329 and a subgrade soil that does not need a cement-treated subgrade (Fig. 2 and Table 4). A design based on an average deflection of 0.80 to 0.96 x 10⁻³ in. would be appropriate. Further, the pavement should have a thickness index between 8.6 and 10.5, i.e., the pavement should be designed for an average thickness index of 9.5. Various choices in the structural cross section could be made as given in Table 5.
The flexible pavement design chart of the Virginia Highway Department (Table 4) recommends choice 2 only. With the help of this chart more choices in the selection of pavement cross sections could be available.
Seventy-four projects recently designed by the Virginia Department of Highways were evaluated by regression analysis to compare the thickness index by this method
with the thickness index by the method presently used. The correlation coef
TABLE 5
PAVEMENT DESIGN CHOICES BASED ON THICKNESS INDEX AND DEFLECTION
Type of Layer Choice 1 Choice 2 Choice 3
AC surface (S-5) 1.5 In. 1.5 in. 1.5 in. AC base (B - 3) 7.5 in. 6.0 in. 4.5 in. Stone subbase 0 6.0 in. 4 in. Cement-treated subgrade 0 0 6 In. Thickness index 9. 0 9.6 9.8
ficient was found to be 0.81, which indicated a high degree of correlation.
Design by Correlation Between Thickness Index and Daily Traffic
By using the strength equivalencies as determined in this investigation, the thickness index of the sections recommended by the Virginia Department of
96
~ 0 - Pavemenls with soil stabiliz~d subgrad~ X - Pavements without soil stabi Ii zed suhf;!;rnde
30
20
li3
El ig " " 8 ~ 7
' G ::;
Lo~ D - 0, 60 + 0. 21 Log L ~ -~ ~ (for pavements with soil " treated subgrade) .JI - ~ -H = O. !17 ...---.; 1--"C .c -$)..-
-- ~ 0 ~ .....
x ........... i..-g "'
~i- .---()
-;: ... - - Log D- 0.33 + 0,27 Log L 0 ~ ....
(for pavements without soil -i...--,..... treated subgracte) ~ I~ - (:. !J9
1. ;)
0 II " l 0 20 40 60 80 100 200 400 600 8001 000 2000
Dally Traffic in 18 kip Equivalent ( L)
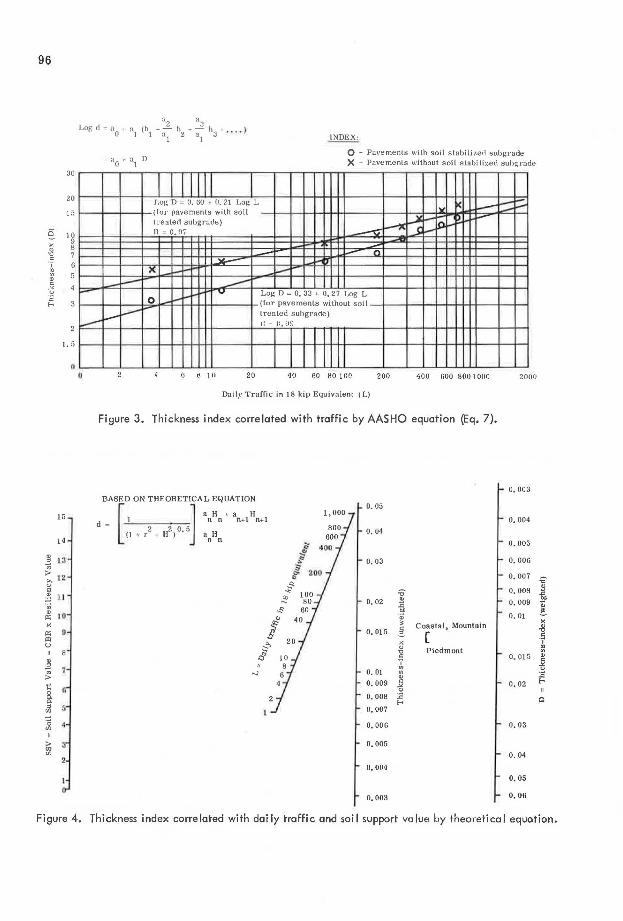
Figure 3. Thickness index correlated with traffic by AAS HO equation {Eq. 7).
o. 003 BASED ON THEORETICAL EQUATION
o. 05
15 a H + a H o. 004 [· l n n n+l n+l d =
2 2 o. 5 (l + r + H ) a H 0, 04
14 n n o. 005 '<!
"' .!f!
~ 13 ~ 0, 03 0. 006 -;;; f1. 200 > o. 007
"' 12 "' .;;-
" :ff o. 008 B " 100 :;;- "' ~ 11 "' B b£ ... 80 0. 02 "'
o. 009 . ., "' ·!l 60 .. ~ It: 10 " 40
·;;; o. 01 ~ 3: Coastal. Mountain
x
" ~ -8 It: G o. 015 [ " ~
~ " .,
l) "' Piedmont gi ,§1 "' " 0. 015 "' 1! ., " " -" gi ()
; ...:; 0, 01
"' :a o. 009 " ...
;; "" o. 02
" 0 o. 008 :a a. Cl a. ... t1l s o. 007
·s o. 006 o. 03 "' " ~ o. 005
"' 0. 04
o. 004
o. 05
o. 003 o. 06
Figure 4. Thickness index correlated with daily traffic and soi I support value by theoretica I equation.
14
BASED ON AASHO EQUATION
82
83
log d ~ a0
; a1 (\ + - h + - h + , ••• J
"1 2 "1 3
"22
20 !8
Lli
14
12
JO 8
97
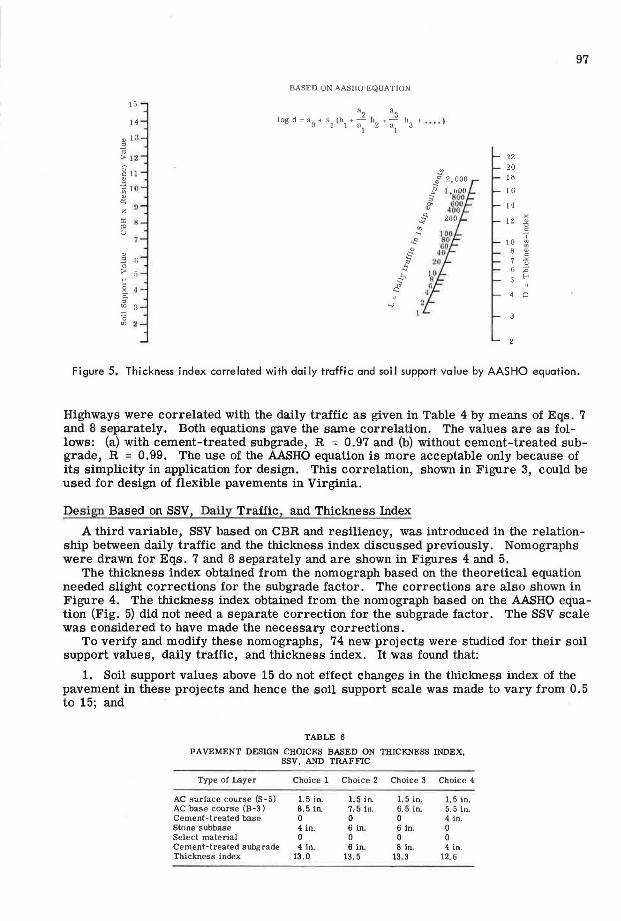
Figure 5. Thickness index corre lated with dai ly traffic and soi l support va lue by AASHO equation.
Highways were correlated with the daily traffic as given in Table 4 by means of Eqs. 7 and 8 separately. Both equations gave the same correlation. The values are as follows: (a) with cement-treated subgrade, R = 0.97 and (b) without cement-treated subgrade, R = 0.99. The use of the AASHO equation is more acceptable only because of its simplicity in application for design. This correlation, shown in Figure 3, could be used for design of flexible pavements in Virginia.
Design Based on SSV, Daily Traffic, and Thickness Index
A third variable, SSV based on CBR and resiliency, was introduced in the relationship between daily traffic and the thickness index discussed previously. Nomographs were drawn for Eqs. 7 and 8 separately and are shown in Figures 4 and 5.
The thickness index obtained from the nomograph based on the theoretical equation needed slight corrections for the subgrade factor. The corrections are also shown in Figure 4. The thickness index obtained from the nomograph based on the AASHO equation (Fig. 5) did not need a separate correction for the subgrade factor. The SSV scale was considered to have made the necessary corrections.
To verify and modify these nomographs, 74 new projects were studied for their soil support values, daily traffic, and thickness index. It was found that:
1. Soil support values above 15 do not effect changes in the thickness index of the pavement in these projects and hence the soil support scale was made to vary from 0.5 to 15; and
TABLE 6
PAVEMENT DESIGN CHOICES BASED ON THICKNESS INDEX, SSV, AND TRAFFIC
Type of Layer Choice 1 Choice 2 Choice 3 Choice 4
AC surface course (S-5) 1. 5 in. 1. 5 in. 1.5 In, 1.5 in. AC base course (B-3) 8. 5 in. 7. 5 in. 6.5 in. 5.5 In. Cement-treated base 0 0 0 4 in. Stone subbase 4 in. 6 in. 6 in. 0 Select material 0 0 0 0 Cement-treated subgrade 4 in. 6 in, 8 in. 4 in. Thickness index 13 . 0 13 . 5 13. 3 12. 6
98
2. The present pavement design method provides the same design for daily traffic of 660 18-kip equivalents and any value higher than this.
The traffic scales in Figures 4 and 5 have, therefore been extended up to 1,000 and 2,000 18-kip equivalents respectively. The higher values are extrapolated.
The nomograph in Figure 5 can be utilized for determining the thickness index required for the design of new pavements based on subgrade soil properties and traffic in terms of daily 18-kip equivalents, or it can be used for maintenance by evaluating the modified thickness for the revised traffic in terms of daily 18-kip equivalents. As a design example, consider a project that has a design CBR value of 7.1 and design daily traffic of 329 18-kip equivalents and that lies in a medium-resilient soil area of silts and clays in the Piedmont region. The SSV is, therefore, equal to 7.1x1.0 = 7.1 and, from the nomograph based on the AASHO equation in Figure 5, the thickness index of the pavement is 13.2. Design choices for this value of thickness index are given in Table 6.
Any one of these three methods could be adopted in Virginia without any change in the field and laboratory method of evaluation. The methods provide more choices in selection of materials and their thicknesses, as shownin Tables 5 and 6, than does the present method of design. They have been made more sophisticated by the use of thickness equivalency values. Of these three methods, the one with SSV and traffic is recommended for use.
CONCLUSIONS
Several conclusions drawn from this investigation of satellite study projects are applicable to paving materials and designs used in Virginia.
1. The following thickness equivalency values could be considered for design in Virginia, with the layers placed in the order described (any layer could be omitted but not interchanged):
Type of Layer
Asphalt mat Cement-treated stone base Stone subbase Select material Cement-treated subgrade
Thickness Equivalency
1. 0 1. 0 0.35 0.0 0.4
2. The deflection of a pavement is a function of its thickness index; the higher the thickness index, the lower the deflection.
3. Comparison of a theqretical equation and the AASHO Road Test equatioIJ. has shown that both give the same magnitude of evaluation and they are equally good for design purposes. Because application of the AASHO Road Test equation is much simpler, its use is recommended.
4. The recommended methods for design give more choices in the selection of materials and their thicknesses than does the present method of design in Virginia. Further, the recommended methods are more sophisticated through use of thickness equivalency values. One of the recommended design methods takes account of the soil support value, which includes the effect of environmental factors.
ACKNOWLEDGMENTS
It is a pleasure to acknowledge the help received from C. S. Hughes and the staff of the Pavement Section. Mr. Hughes was available at all times for free and open discussions and guided the study so that it would serve the best interests of the Virginia Department of Highways. He also offered helpful criticism of this paper. The author is also grateful for the encouragement and support given by the late Dr. Tilton E. Shelburne, State Highway Research Engineer.

99
REFERENCES
1. Interim Guide for Design of Flexible Pavement Structures. AASHO Committee on Design, Oct. 1962.
2. Vaswani, N. K. AASHO Road Test Findings Applied to Flexible Pavements in Virginia. Virginia Highway Research Council, Charlottesville.
3. The AASHO Road Test. HRB Spec. Rept. 61. 4. Burmister, D. M. Theory of Stresses and Displacements in a Layered System for
Application to the Design of Airport Runways. HRB Proc., Vol. 23, pp. 126-154, 1943.
5. Vaswani, N. K. Design of Pavements Using Deflection Equations From AASHO Road Test Results. Highway Research Record 239, pp. 76-94, 1968.
6. Chastain, W. E., and Schwartz, D.R. AASHO Road Test Equations Applied to the Design of Bituminous Pavements in Illinois. Highway Research Record 90, pp. 3-25, 1965.
7. A Guide to the Structural Design of Flexible and Rigid Pavements in Canada. Canadian Good Roads Association, Sept. 1965.
8. Phang, P. A. Interim Report for Full Scale Road Experiments. D. H. D. Report No. RR 136, Dept. of Highways, Ontario, May 1968.
9. Thickness Design-Asphalt Pavement Structures for Highways and Streets. 7th Ed., The Asphalt Institute, Sept. 1963 and March 1964.
if a, b, and c
A =
d E = H
H1 H2 =
p r
µ. = w
Aw
W1
w2 =
Appendix A BASIS OF THE GENERAL FORM OF EQUATION 4
Deflection d = A [ 1
b J H2
(1 + era + Ha) H 1
constants; deflection modulus, a function of Poisson's ratio, elastic modulus, and a given system of loading; pavement deflection; modulus of elasticity of the material; vertical distance of the point where the deflection is to be determined from the load point; vertical distance of the top of the layer from the top of pavement; vertical distance of the bottom of the same layer from the top of the pavement; load applied; horizontal distance of the point where the deflection is to be determined from the load points; Poisson's ratio of the material; deflection at a point under consideration; compression of a layer =difference between the deflection at top (i.e., at depth H1) and bottom (i.e., at depth HJ of the layer in inches; deflections at the top of a layer at a distance H1 from the top of the pavement; and deflection of the bottom of the same layer at distance H2 from the top of the pavement.
Compression of any layer in a homogeneous isotropic and semi-infinite elastic solid is given by the following equations:

100
Boussinesq 's equation
A [ 2(1 - µ.) r2
+ (33
- 2µ.) H2 J H2
(r2 + H2) /2 H1
(a)
Westergaard's equation
w (b)
The above two equations could be written in a general form as
(c)
and
(d)
To satisfy the following four boundaries
H Oandr 0 H ooandr 0 H Oandr "' H 00 andr ="'
the equation has been slightly modified as follows:
(e)
(f)
Appendix B CLASSIFICATION BASED ON RESILIENCY OF SOILS
The factors on which the degree of soil resiliency depends are as follows:
1. Amount and size of mica in the soil-The resiliency increases with an increase in size and quantity of mica.
2. Orientation of the mica flakes-Resiliency is greatest when the particle orientation is essentially perpendicular to the direction of the applied load.
3. Soils from the C-horizon are more resilient than soils from the B-horizon. Since subgrade cuts lie mostly in the C-horizon and the tops of fills consist of soils from this horizon, it is the one being considered for classification.
For the purpose of the design of pavements, Virginia soils have been divided as follows:
1. High- resilient soils-A-5 or A-4 (with G.1. of 5 and up). Both classifications should have a large percent passing No. 200 sieve and also high mica content.
101
2. Medium-resilient soils-(a) A-4 (with G. I. of 5 and up) having a large percent passing No. 200 sieve but with low mica content; (b) sandy silt with high mica content.
3. Low-resilient soils-A-7-5 or micaceous clay. 4. Non-resilient soils, sandy-A-1, A-2, A-3, or A-4 (with G.I. less than 5). 5. Non-resilient soils, heavy clay or organic-A-4-2, A-6, A-7-6, or A-8.
Generally, low-resilient soils do not contain mica and the resiliency is due to silt only.
Discussion F. P. NICHOLS, JR., National Crushed Stone Association-It may be of some help to the reader of the foregoing paper and another paper by the same author (5) to recall some of the background data that contributed to the development of the author's proposed flexible pavement design methods. This assumes, of course, that a reader some years hence is faced with the task of reviewing the literature on pavement design in the never-ending quest for a truly reliable method based either on elastic theory or pure empiricism.
Vaswani has not seen fit to refer to two readily available papers (10, 11) that describe the development of much of the data he has used. Nor does herefer to any of a number of unpublished progress reports that further amplify the data; Figure 4 of his 1968 paper (5) was lifted directly from one such report . Perhaps his reason for omitting these references is that his conclusions, based on elaborate statistical and mathematical analysis of the same or similar data, are diametrically opposed to those drawn by the author of the earlier papers.
The first omission, from HRB Bulletin 269, published in 1960 (10), traced the development of "black base" designs in Virginia beginning with a local aggregate job in an area where commercial aggregates were unavailable. That report also described the first experimental project on US 58, which was designed to determine if possible what thickness of "black base" might solve performance problems being experienced on other projects along this corridor built with lighter bituminous mat thicknesses. To summarize, the problem definitely was not solved by more than doubling the thickness of the bituminous-bound upper layers. Had the "thickness equivalency" concept been applied to these findings alone, stone base would have had to be assigned a higher value than black base in this experiment.
The 1960 report also mentioned the start that had been made toward "getting to the bottom of the problem" through other experimental installations. The approach here was to ensure more reliable support at the foundation level in areas of scarcity of stone or other acceptable subbase aggregates by means of subgrade stabilization with cement or lime.
A 1962 paper (11) demonstrated the obvious superiority of increasing the foundation support over increasing the thickness of surface type materials . Several projects, with and without subgrade stabilization, of similar age, and in similar soil areas, were compared. Results show the marked reduction in deflection values accomplished through improved foundation support.
A paper presented in 1963 (12) was listed in Vaswani's 1968 paper. However, the one mention of it presented an erroneous interpretation of what was actually stated therein with regard to excessive rather than tolerable deflections. This paper's summary showed that, except in the Piedmont section of Virginia, "the magnitude of deflection apparently has little to do with the problems of pavement behavior," because none was excessively high. Further, it showed that, of 24 pavements in the Piedmont built without stabilized subgrades, deflections measured on the 14 with black bases were not significantly different on the average from those on the 10 without. (Both averages were considered excessively high.) Similarly, of 16 that did have stabilized subgrades, there _were very minor differences between average deflection values on the 9 with black bases and on the 7 without (neither average was excessively high). The obviously significant differences were between the average deflections measured on the
102
pavements built on stabilized foundations and those on pavements not so well supported; stabilization at the bottom, rather than at the top, cut the deflections almost in half.
Vaswani 's design procedure is based on "thickness equivalencies" that are "determined" once and for all from deflections measured by the Dynaflect (13), a machine that measures a pavement's response to relatively light, pulsating loads. The paper's introduction indicates that performance equivalencies are directly related to the ability of materials inquestion to reducethese minute deflections. The author's Table 1 shows unique equivalency values for broad classes of material such as asphaltic mixtures, cement-treated stone bases, untreated stone subbases, select materials (worthless), and cement-stabilized subgrade soils, regardless of the material's thickness, quality, or position in the structure. In effect, he says that a pavement consisting of 7 in. of any combination of hot bituminous mixtures laid on any soil is equivalent to one consisting of 4 in. of the highest quality bi tuminous mixtw·es laid on better than 8% in. of the best graded, highest quality crushed stone, slag, or gravel that can be obtained. Further, one infers that any increase in bituminous base thickness, per inch, is equivalent to an increase of 2.86 in. of crushed aggregate.
This is in direct conflict with statements made by Foster (14), who has shown that beneath a 3-in. hot-mixed bituminous surface at the AASHO Road Test, a 4-in. highquality hot-mixed bituminous base performed about as well as slightly more than 3 times that thickness of the poorly compacted crushed limestone base used there, a thickness equivalency of about 3 to 1. However, Foster shows that an 8 in. thickness of the bituminous base was equivalent to 16 in. of the limestone, an average equivalency of only 2 to 1. Thus, if the first 4 in. had a 3 to 1 equivalency, the next 4 in. must have had an equivalency hardly more than 1 to 1 to produce the average value of 2 to 1.
Foster had stated earlier (15) that the Road Test subbases and bases were weaker than they would have been in an ormally built highway-that they should have been better compacted. He stated further that "the thickness differential between bituminoustreated and standard base course would be less in sections with standard base courses compacted to higher densities."
It is not the purpose of this discussion to describe fully a design approach better than that developed by Dr. Vaswani. Its primary purpose is to point out again the fallacy of a constant "thickness equivalency" concept.
But in addition, a major objection must be voiced against the nomograph (Fig. 5) recommended for determining total design strength in terms of thickness index D; the trifling difference of 2 or 3 in. in asphalt concrete thickness requirements for equal traffic but for soil support values differing from 1 to 15 cannot be supported by pavement performance records in Virginia. It is also in considerable conflict with the latest revision of the Virginia CBR design chart, originally described in 1954 by Woodson (16).
References
10. Nichols, F. P., Jr. Flexible Pavement Research in Virginia. HRB Bull. 269, pp. 35-50, 1960.
11. Nichols, F. P., Jr. Effect of Compaction and Subgrade Stabilization on Deflections and Performance of Virginia Pavements. Proc., Internat. Conf. on Structural Design of Asphalt Pavements, Univ. of Michigan, pp. 12-13, 1962.
12. Nichols, F. P., Jr. Deflections as an Indicator of Flexible Pavement Performance. Highway Research Record 13, pp. 46-65, 1963.
13. Scrivner, F. H., Swift, G., and Moore, W. M. A New Research Tool for Measuring Pavement Deflection. Highway Research Record 129, pp. 1-11, 1966.
14. Foster, Charles R. Prepared Discussion. Proc., Second Internat. Conf. on Structural Design of Asphalt Pavements, Univ. of Michigan, p. 657, and author's closure, p. 988.
15. Foster, Charles R. Prepared Discussion. Proc., First Internat. Conf. on Structural Design of Asphalt Pavements, Univ. of Michigan, pp. 12-13, 1962.
16. Woodson, D. D. Designing Flexible Pavements (Virginia). HRB Research Report 16-B, pp. 56-58, 1954.

103
N. K. VASWANI, Closure-I very much appreciate Mr. Nichols' comments. The 1968 paper was based on data most of which were collected under his direction, except those for the last two years. For the most part, I agree with the conclusions made in his reports prior to 1966. As a result of my mathematical and statistical analysis I, in fact, seem to have described his thinking in numerical values with some additional conclusions such as the one from Figure 3 of my paper.
The 1968 paper and the present one give a high strength equivalency value to soil cement, which agrees with Nichols' remarks that a strong foundation is necessary for weak resilient soils. The first project on US 58, sponsored by Nichols, clearly demonstrated the necessity for a strong foundation layer such as soil-cement, soil-lime, or cement-treated stone.
I would like to mention that the principle of thickness equivalency indicates the total pavement strength needed. After the strength is determined, the success of the design depends on the designer's making a proper choice of the materials.
Regarding tolerable deflections, Figure 5 of my 1968 paper clearly shows that tolerable or permissible deflection is a function of the strength or thickness index of the pavement and is not a fixed value. The tolerable or permissible deflection depends on the sum of the strengths of the individual layers and not on the thickness and strength of one particular layer.
In his discussion, Nichols seems to indicate that the value of the thickness equivalency of any material is a function not only of the strength of the material but also of the depth at which it is laid below the top of the pavement. This certainly is true. For example, a cement-treated aggregate base placed directly under an asphalt concrete mat has a thickness equivalency of 1 for pavements in Virginia. The same material when placed in the subbase instead of the base will have lower strength equivalency values. Foster's interpretation of the AASHO Road Test results (14) was applied to the pavement design chart in Virginia. It showed that the thicknessequivalency values reported in this paper give about the same thickness index values as given by Foster's curves.
Nichols states that the thickness equivalency value is a function of the quality of the material. This is also true. The thickness equivalency values determined in this investigation are for materials that satisfy the specifications of the Virginia Department of Highways.
Nichols states that the major objection in the design chart in Figure 5 is the difference of 2 to 3 in. in asphalt concrete thickness for soil support values differing from 1 to 15. This difference-if so-is the difference in the thickness index, which could be equivalent to 6 to 9 in. of stone aggregate base or 4 to 8 in. of soil cement.