Embed Size (px)
Citation preview
1
DESIGN OF A PIN-ON-DISK TRIBOMETER WITH IN SITU OPTICAL PROFILOMETRY
By
JAMES HARLEY KEITH
A THESIS PRESENTED TO THE GRADUATE SCHOOL OF THE UNIVERSITY OF FLORIDA IN PARTIAL FULFILLMENT
OF THE REQUIREMENTS FOR THE DEGREE OF MASTER OF SCIENCE
UNIVERSITY OF FLORIDA
2010

2
© 2010 James Harley Keith

3
DEDICATION
Here’s to you Jesus…one solid dude.
4
ACKNOWLEDGEMENTS
I would like to thank Dr. Richard Schulz, ‘Granddaddy’, for taking me fishing for the
first time and being a lifelong idol. He was the original mystery meat chef.
I would like to thank Dr. Sarah Schulz, ‘SaSa’, for her wisdom, patience and
financial support through college.
I would like to thank John and Carrie Keith for their continuing support. Thank you
for putting up with me and my mess in the driveway.
I would like to thank Mike Braddock for his guidance and enthusiasm.
I would like to thank Misti Keith for her love and support, while I lost sleep over the
stresses of this work.
I would like to thank Dr. Greg Sawyer for the adventures over the past three years.
He made me a better engineer and taught me to push life to the limits at every
opportunity. Granddaddy would have approved.
I would like to thank all of the members of the University of Florida Tribology Lab,
current and past for their efforts. Without their hard work to build upon, my success
would not have been possible. I would especially like to thank Ira Hill for helping me
automate the tribometer in this work.
5
TABLE OF CONTENTS page
ACKNOWLEDGEMENTS ............................................................................................... 4
LIST OF TABLES ............................................................................................................ 6
LIST OF FIGURES .......................................................................................................... 7
ABSTRACT ..................................................................................................................... 8
CHAPTER
1 INTRODUCTION ...................................................................................................... 9
2 REVIEW OF LITERATURE .................................................................................... 10
Optical Profilometry ............................................................................................. 10 Wear Rate and Coefficient of Friction .................................................................. 11 In Situ Wear Monitoring ....................................................................................... 11
3 PIN-ON-DISK APPARATUS ................................................................................... 13
Tribometer ........................................................................................................... 13 Linear Positioning Stages.............................................................................. 13 Cantilever ...................................................................................................... 14 Capacitance Probes ...................................................................................... 14 Rotary Positioning Stage ............................................................................... 14 Data Acquisition and User Interface .............................................................. 15 Force Measurement ...................................................................................... 15
Optical Profiler ..................................................................................................... 15
4 MEASUREMENT UNCERTAINTY ......................................................................... 17
Error Source Analysis .......................................................................................... 17 Mathematical Analysis ......................................................................................... 19
5 TEST RESUSLTS AND DISCUSSION ................................................................... 22
6 CONCLUSION ........................................................................................................ 25
APPENDIX
LIST OF REFERENCES ............................................................................................... 26
BIOGRAPHICAL SKETCH ............................................................................................ 27
6
LIST OF TABLES
Table page
4-1 Measurement uncertainty analysis results ............................................................. 21
7
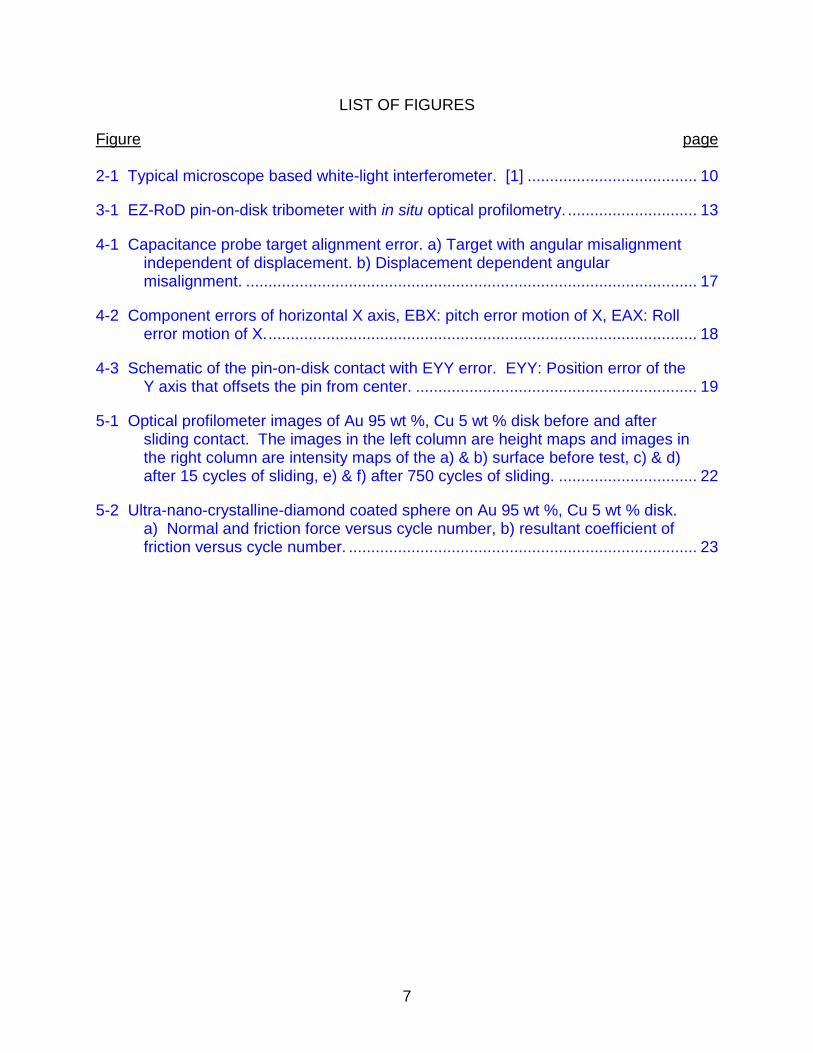
LIST OF FIGURES
Figure page 2-1 Typical microscope based white-light interferometer. [1] ...................................... 10
3-1 EZ-RoD pin-on-disk tribometer with in situ optical profilometry. ............................. 13
4-1 Capacitance probe target alignment error. a) Target with angular misalignment independent of displacement. b) Displacement dependent angular misalignment. ..................................................................................................... 17
4-2 Component errors of horizontal X axis, EBX: pitch error motion of X, EAX: Roll error motion of X. ................................................................................................ 18
4-3 Schematic of the pin-on-disk contact with EYY error. EYY: Position error of the Y axis that offsets the pin from center. ............................................................... 19
5-1 Optical profilometer images of Au 95 wt %, Cu 5 wt % disk before and after sliding contact. The images in the left column are height maps and images in the right column are intensity maps of the a) & b) surface before test, c) & d) after 15 cycles of sliding, e) & f) after 750 cycles of sliding. ............................... 22
5-2 Ultra-nano-crystalline-diamond coated sphere on Au 95 wt %, Cu 5 wt % disk. a) Normal and friction force versus cycle number, b) resultant coefficient of friction versus cycle number. .............................................................................. 23
8
Abstract of Thesis Presented to the Graduate School of the University of Florida in Partial Fulfillment of the Requirements for the Degree of Master of Science
DESIGN OF A PIN-ON-DISK TRIBOMETER WITH IN SITU OPTICAL
PROFILOMETRY
By
James H. Keith
August 2010
Chair: W. G. Sawyer Major: Mechanical Engineering
A pin-on-disk tribometer with in situ optical profilometry was constructed. The
tribometer is capable of loads up to 200 mN, 25 revolutions per minute and angular
positioning resolution of 50 µrad. An ultra-nano-crystalline-diamond coated sphere was
run on a 95 wt % Au and 5 wt. % Cu disk. Friction results and in situ wear track images
were presented. Measurement uncertainty analysis was performed for loads typical of
the test in this work and was shown to be less than 5%.
9
CHAPTER 1
INTRODUCTION
Tribology is the study of interacting surfaces in relative motion and encompasses
the fields of friction, lubrication and wear. To investigate the reaction of different
surfaces in contact, and the governing mechanisms of friction, lubrication and wear,
many test apparatuses have been conceived. These tribometers have taken many
forms; a common arrangement is the pin-on-disk, where a stationary pin is imposed on
a rotating disk. Typically, the apparatus will be instrumented with force or deflection
sensors to meter the friction force. Depending on the loading scheme, the normal force
may be instrumented as well. This work describes a pin-on-disk tribometer with in situ
optical profilometry designed for the University of Florida Tribology Lab and analyses its
ability to accurately measure normal and friction forces.

10
CHAPTER 2 REVIEW OF LITERATURE
Optical Profilometry
Optical profilometry is a method of non-contact surface height measurement
commonly used to quantify surface roughness. A type of optical profilometry of
particular interest to this work is interference microscopy. Interference microscopy
combines an interferometer and microscope into one instrument for surface
measurement. The objectives are either Michelson, Mirau or Linnik (all being
modifications of the Michelson interferometer)[1]. Figure 2-1 depicts the light path of a
Mirau interferometer similar to the profilometer used in this work.
The objective is vertically scanned to induce interference fringes on the surface.
The fringes are recorded by the charge coupled device and are used to generate a
surface height map.
Figure 2-1. Typical microscope based white-light interferometer. [1]

11
Wear Rate and Coefficient of Friction
Two bodies in contact moving with respect to one another may generate wear
debris. J. F. Archard developed the following relationship that aids in the prediction of
the rate of material loss to wear (equation 1).
m
KsPWp
= (1)
Where W is the worn volume, K a dimensionless constant related to the probability
of a wear particle, s is the sliding distance, P is the applied load and pm is the flow
pressure of the softer material [2]. A convenient modification of Archard’s equation is
W KsP= (2)
where K is a dimensional constant and the relation does not require knowledge of
material flow pressure.
The coefficient of friction, denoted as µ, is the ratio of the friction force on two
bodies in contact and the normal force applied to them as seen in equation 3.
f
n
FF
µ = (3)
In Situ Wear Monitoring
Wear mechanisms can be complex involving solid mechanic, thermodynamic and
chemical phenomenon, among others, and also be transient. For example, a lubricious
film could fatigue and delaminate from the substrate after a million loading cycles but
show negligible wear up until that point. To label that scenario with one wear rate could
be misrepresentative.
Measuring volume loss in situ can highlight wear trends that could otherwise be
lost in ex situ volume loss analysis. Bares et al studied copper-on-copper sliding
12
electrical contacts in a humid copper environment. The tribometer was designed for
linear reciprocation with in situ scanning white light interferometry. Wear rates were
associated with different current densities by measuring volume loss in situ [3].
13
CHAPTER 3 PIN-ON-DISK APPARATUS
Tribometer
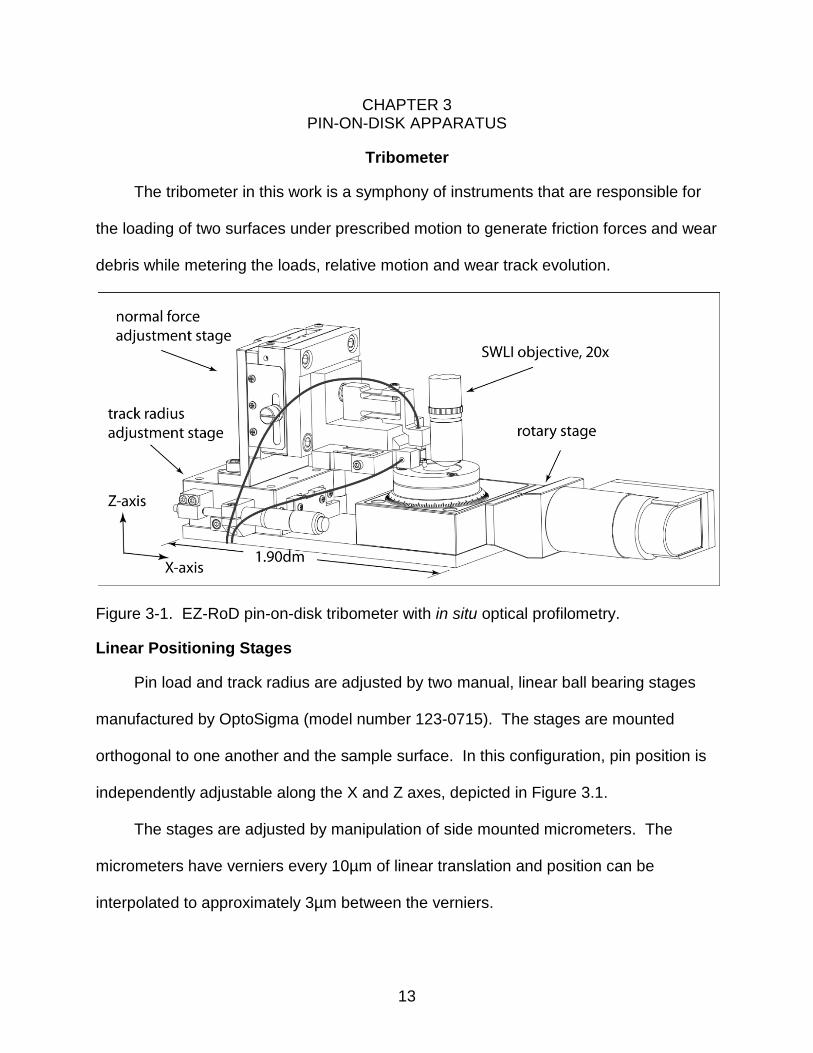
The tribometer in this work is a symphony of instruments that are responsible for
the loading of two surfaces under prescribed motion to generate friction forces and wear
debris while metering the loads, relative motion and wear track evolution.
Figure 3-1. EZ-RoD pin-on-disk tribometer with in situ optical profilometry.
Linear Positioning Stages
Pin load and track radius are adjusted by two manual, linear ball bearing stages
manufactured by OptoSigma (model number 123-0715). The stages are mounted
orthogonal to one another and the sample surface. In this configuration, pin position is
independently adjustable along the X and Z axes, depicted in Figure 3.1.
The stages are adjusted by manipulation of side mounted micrometers. The
micrometers have verniers every 10µm of linear translation and position can be
interpolated to approximately 3µm between the verniers.
14
Cantilever
The pin is mounted on a flexible member that is referred to as a cantilever. The
cantilever selection process suffers from a solid mechanic duality. It must be stiff whilst
compliant. Real surfaces are not flat or smooth and, as the disk rotates, the cantilever
must be compliant enough to follow the disk’s surface, but stiff enough to impart the
desired load onto the pin.
For this work, the stiffest cantilever available from CSM instruments was called into
service. Cantilever number ST-15 has a 2.367 mN/µm stiffness in the normal direction
and 5.217 mN/µm stiffness in the friction direction.
Capacitance Probes
Lion Precision Elite 3 mm capacitance probes measure the displacement of the
cantilever. They explicitly measure the capacitance between the probe and the target.
The change in dielectric constant of the atmosphere is neglected, so the only change in
capacitance is from the change in distance between the probe and the target. The
range of the capacitance probes used on this tribometer is 100µm. Combined with the
ST-15 cantilever, this tribometer can impart loads up to 200mN.
Rotary Positioning Stage
The disk is fixed to a Physik Instrumente (PI) M-060PD rotary positioning stage
that is driven by a PI C-863 Mercury Servo Controller. The stage is driven by a pre-
loaded worm gear-reduced direct current servo motor and has a maximum velocity of
90⁰/sec and a resolution of 50 µrad. The Wyko NT9100 optical profilometer as
configured has approximately 50 mm between the work table and the objective focal
point, so a criterion for stage selection was stage height. The M-060 series has a height
of 29 mm leaving 19 mm of vertical clearance for the sample and sample holder.
15
Data Acquisition and User Interface
A National Instruments PCI-6221 16 bit data acquisition card was use with
LabVIEW to record and organize the voltages from the capacitance probes. Virtual
instruments for LabVIEW, that aided in the motion commands for the rotary positioning
stage, were provided by Physic Instrumente.
The data acquisition card is set to sample the normal and friction force channels at
a rate of 1 kHz. In unison, the angular position of the stage is requested by means of
the Physic Instrumente position query virtual instrument. The 1kHz data is averaged
every second and stored in a cell next to the angular position of that data acquisition
cycle. Due to the overhead of the file save, screen update and other peripheral
operations, the code saves at a frequency of just over 10 Hz.
Force Measurement
Friction and normal force are measured via the equipment listed in the previous
subsection headings. The forces are calculated by the relations
n CLn CP nF C C V=
(4)
f CLf CP fF C C V=
(5)
where the subscript ‘n’ indicates the normal direction and the subscript ‘f’ indicates the
friction direction. CCL is the cantilever constant, CCP is the capacitance probe constant,
and VΔ is the change in the output voltage.
Optical Profiler
For surface profile characterization, the tribometer is affixed to the two-axis linear
motion table of a Wyko NT9100 Optical Profiler. By coherence scanning interferometry,
the NT9100 produces three-dimensional surface maps of the object under test with sub-
16
nanometer vertical resolution [1]. The NT9100 used in this work is equipped with a 20x
Mirau objective and field-of-view (FOV) multipliers of 0.55x, 1x and 2x. The test in this
work was performed under the 0.55x FOV multiplier resulting in an 11x magnification.
The measurement array is 640 x 480 pixels resulting in an analysis area of 437 µm x
583 µm.
17
CHAPTER 4 MEASUREMENT UNCERTAINTY
No measurement is without error and the first step towards precision is admitting
that there is a problem. The purpose of this chapter is to quantify the error in the force
measurements taken by the pin-on-disk tribometer.
Error Source Analysis
The tribometer has errors that stem from the electrical system and the
mechanical system. For this analysis, the electrical system includes the capacitance
probes and the data acquisition card and the mechanical system includes the cantilever
and cantilever alignment with respect to the disk surface.
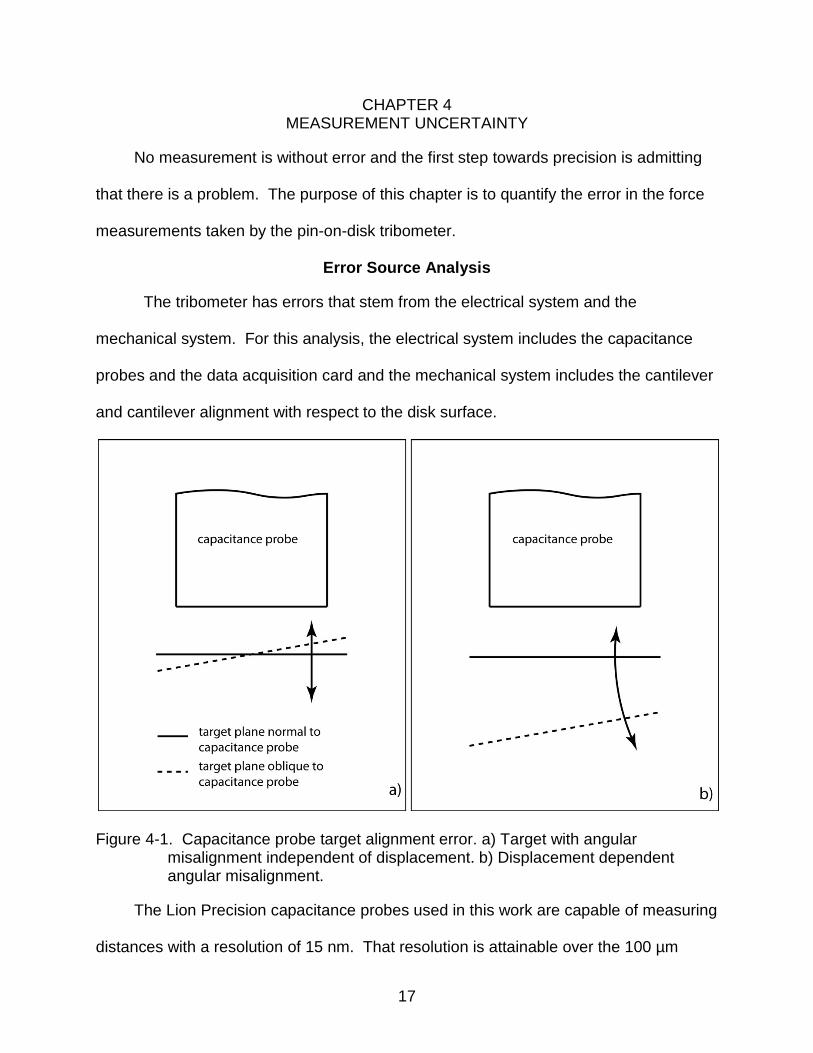
Figure 4-1. Capacitance probe target alignment error. a) Target with angular misalignment independent of displacement. b) Displacement dependent angular misalignment.
The Lion Precision capacitance probes used in this work are capable of measuring
distances with a resolution of 15 nm. That resolution is attainable over the 100 µm
18
range of the probes only if the target translates in an ideal manner. If the target surface
is not normal to the measuring face of the capacitance probe as in Figure 4-1-a, the
output signal will have an offset suggesting that the probe target is closer than it
appears. The tribometer uses a target that is affixed to a cantilever that displaces in an
arc. The arc motion imposes a displacement dependent zero offset as depicted in
Figure 4-1-b.
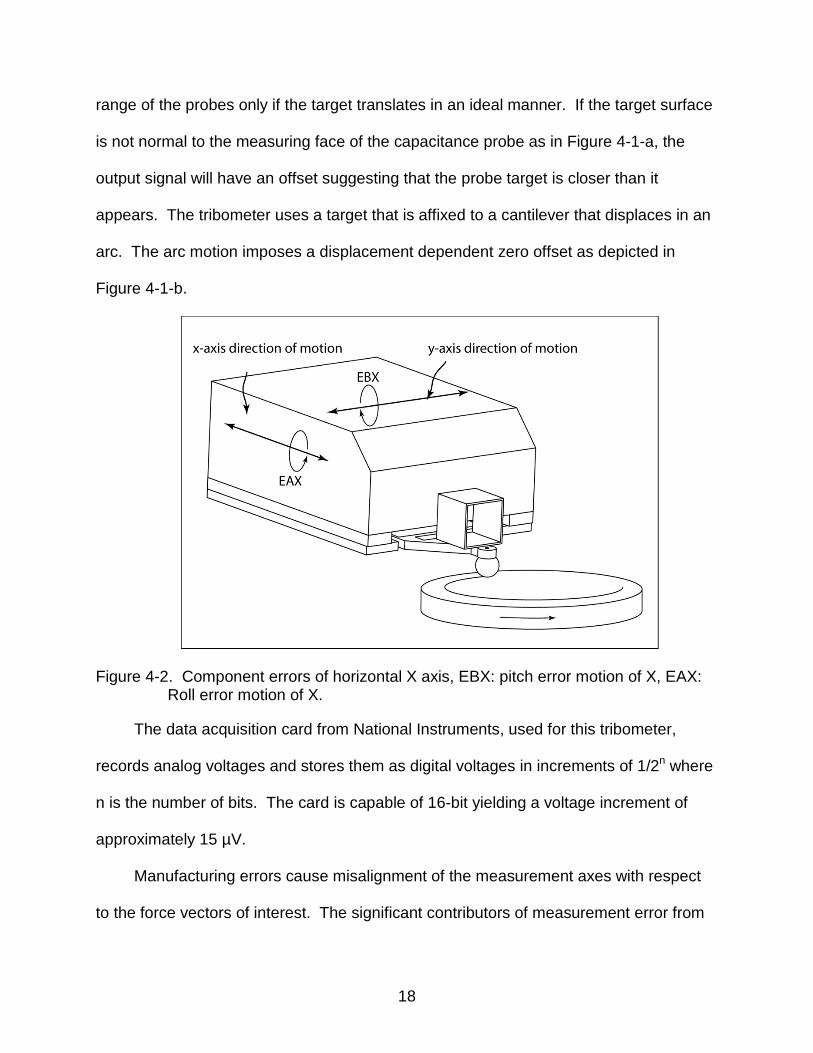
Figure 4-2. Component errors of horizontal X axis, EBX: pitch error motion of X, EAX: Roll error motion of X.
The data acquisition card from National Instruments, used for this tribometer,
records analog voltages and stores them as digital voltages in increments of 1/2n where
n is the number of bits. The card is capable of 16-bit yielding a voltage increment of
approximately 15 µV.
Manufacturing errors cause misalignment of the measurement axes with respect
to the force vectors of interest. The significant contributors of measurement error from
19
mechanical misalignment were determined to be EAX (roll error motion of X), EBX
(pitch error motion of X) and EYY (positioning error) [4]. The first two are depicted in
Figure 4-2 and the latter is depicted in Figure 4-3.
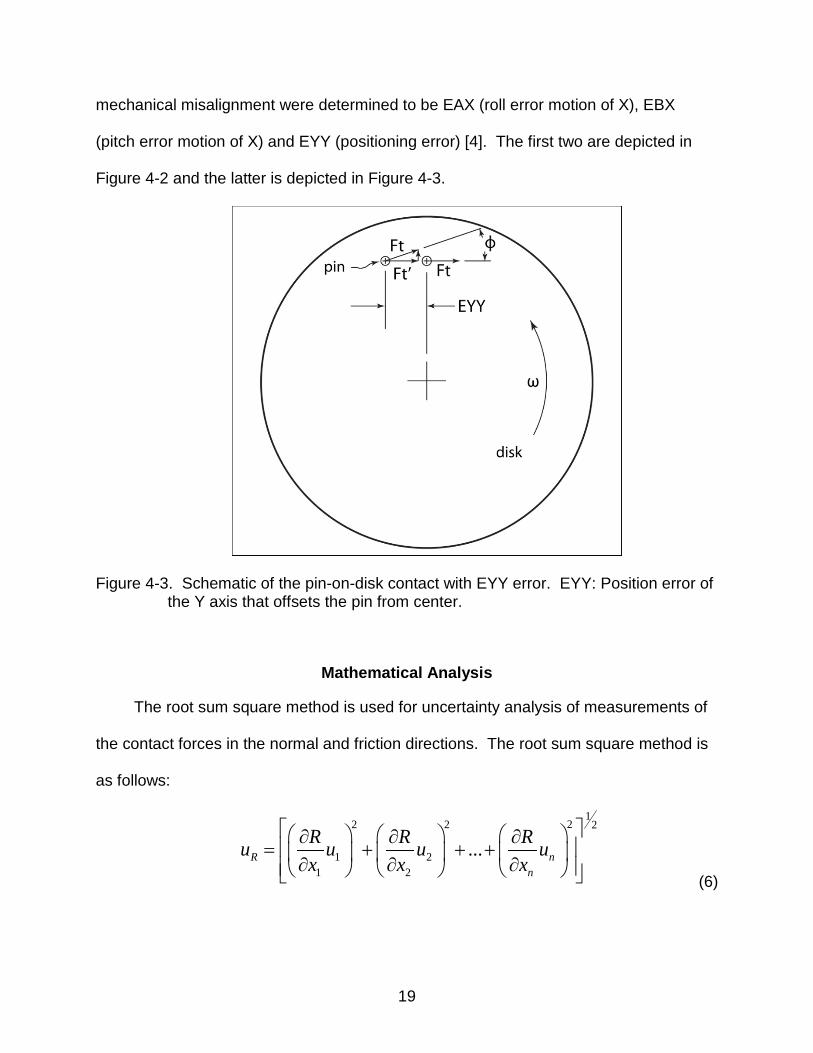
Figure 4-3. Schematic of the pin-on-disk contact with EYY error. EYY: Position error of the Y axis that offsets the pin from center.
Mathematical Analysis
The root sum square method is used for uncertainty analysis of measurements of
the contact forces in the normal and friction directions. The root sum square method is
as follows:
122 2 2
1 21 2
...R nn
R R Ru u u ux x x
∂ ∂ ∂ = + + + ∂ ∂ ∂ (6)
20
Simply explained, the uncertainty in R is the square root of the sum of the squares
of the partial derivative of R with respect to each variable in R multiplied by the
uncertainty in the variable.
Applying equation 6 to equation 3, 4 and 5 yields:
12 22
n fF Fn f
u u uF Fµµ µ ∂ ∂ = + ∂ ∂
(7)
12 2 2 2
n CLn CPn nF C C VCLn CPn n
u u u uC C Vµ µ µ
∆∆
∂ ∂ ∂ = + + ∂ ∂ ∂ (8)
12 2 2 2
f CLf CPf fF C C VCLf CPf f
u u u uC C Vµ µ µ
∆∆
∂ ∂ ∂ = + + ∂ ∂ ∂ (9)
With these equations, the uncertainty in precision was calculated for the normal
force, friction force and coefficient of friction. A nominal value of 50 mN was considered
for the normal force and a nominal value of 15 mN was considered for the friction force.
The normal force is typical for the test mentioned in this work and the friction force is a
worst-case friction value from said test. A high value of friction force would maximize
the capacitance probe error, the largest contributor of measurement error.
To appreciate the total uncertainty, bias errors are added to the precision errors
with the same root sum square method and are represented as:
12 2 2
T P Bu u u = + (10)
where the bias errors generate from the geometric errors depicted in figure 4-2 and 4-3.

21
The total calculated uncertainty for the friction force measurement, normal force
measurement and coefficient of friction calculation are presented in Table 4-1 below.
Table 4-1. Measurement uncertainty analysis results Measurand Nominal Value Uncertainty
Fn 50 mN ±1.12
Ff 15 mN ±0.30
µ 0.3 ±0.01
As tabulated, all of the calculated uncertainties are under 5 %. The largest
contributor to uncertainty is the cantilever stiffness coefficient provided by CSM
instruments.
22
CHAPTER 5 TEST RESUSLTS AND DISCUSSION
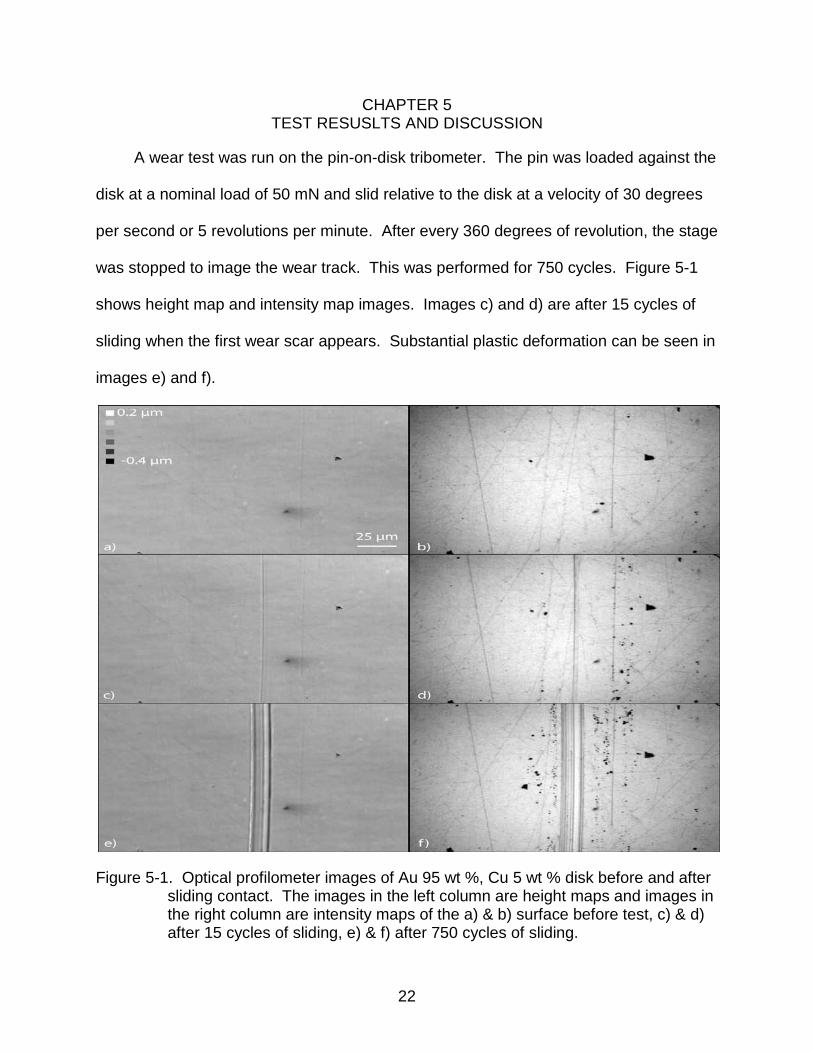
A wear test was run on the pin-on-disk tribometer. The pin was loaded against the
disk at a nominal load of 50 mN and slid relative to the disk at a velocity of 30 degrees
per second or 5 revolutions per minute. After every 360 degrees of revolution, the stage
was stopped to image the wear track. This was performed for 750 cycles. Figure 5-1
shows height map and intensity map images. Images c) and d) are after 15 cycles of
sliding when the first wear scar appears. Substantial plastic deformation can be seen in
images e) and f).
Figure 5-1. Optical profilometer images of Au 95 wt %, Cu 5 wt % disk before and after sliding contact. The images in the left column are height maps and images in the right column are intensity maps of the a) & b) surface before test, c) & d) after 15 cycles of sliding, e) & f) after 750 cycles of sliding.
23
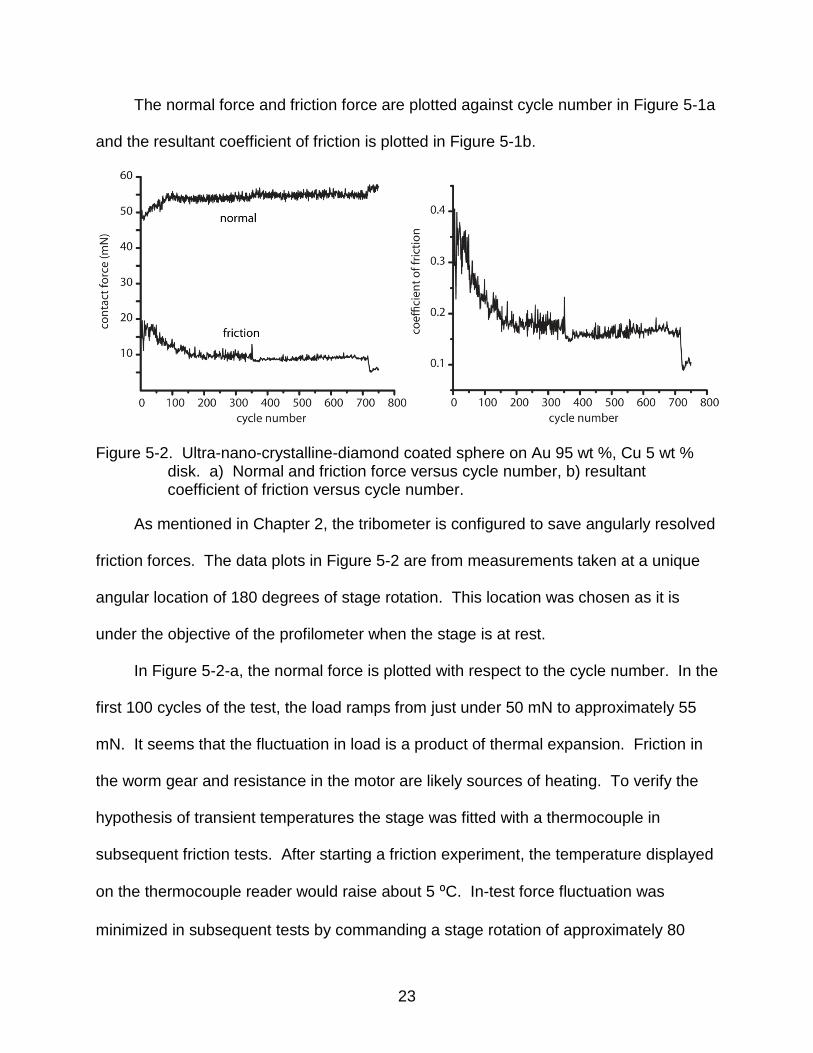
The normal force and friction force are plotted against cycle number in Figure 5-1a
and the resultant coefficient of friction is plotted in Figure 5-1b.
Figure 5-2. Ultra-nano-crystalline-diamond coated sphere on Au 95 wt %, Cu 5 wt % disk. a) Normal and friction force versus cycle number, b) resultant coefficient of friction versus cycle number.
As mentioned in Chapter 2, the tribometer is configured to save angularly resolved
friction forces. The data plots in Figure 5-2 are from measurements taken at a unique
angular location of 180 degrees of stage rotation. This location was chosen as it is
under the objective of the profilometer when the stage is at rest.
In Figure 5-2-a, the normal force is plotted with respect to the cycle number. In the
first 100 cycles of the test, the load ramps from just under 50 mN to approximately 55
mN. It seems that the fluctuation in load is a product of thermal expansion. Friction in
the worm gear and resistance in the motor are likely sources of heating. To verify the
hypothesis of transient temperatures the stage was fitted with a thermocouple in
subsequent friction tests. After starting a friction experiment, the temperature displayed
on the thermocouple reader would raise about 5 ⁰C. In-test force fluctuation was
minimized in subsequent tests by commanding a stage rotation of approximately 80
24
revolutions at 25 rpm before the friction test was begun. This quickly raised the
temperature of the stage to the steady state operating temperature that 5 rpm would
produce. Further rotation of the stage at 25 rpm would overheat the stage causing the
normal force to decrease during the test until the steady state temperature was
reached. The step increase in force at approximately 700 revolutions in Figure 5-2-a
was due to the building air conditioning shutting down for Christmas break.
As mentioned in Chapter 2, the sensitivity of adjustment for the manual stages is
50 µm per revolution, allowing for an accurate linear movement of approximately 3 µm
by interpolating between verniers. However, the smallest move between stick-slip
intervals of the micrometer head seems to be on the order of 1 µm. For this work, the
cantilever stiffness was 2.376 mN/ µm. Thus, the smallest single adjustment possible
was in excess of 2 mN. After multiple attempts, the stage could usually be adjusted to a
desired force value within 1 mN.
25
CHAPTER 6 CONCLUSION
A pin-on-disk tribometer with in situ optical profilometry was built for the University
of Florida Tribology Lab. The uncertainty was calculated. The applied normal force has
shown to drift approximately 1 µm per ⁰C in temperature change of the rotary stage.
Although this effect can be partially mitigated by bringing the rotary stage up to
temperature before the test, a more precise fix would be to add an active normal force
stage with feedback. The tribometer would, of course, need to be renamed from EZ-
RoD to Hard-RoD.
26
LIST OF REFERENCES
[1] A.G. Olszak, J. Schmit, M.G Heaton, Interferometry: Technology and Applications. (2001). Veeco Metrology Group. Retrieved Dec. 24, 2009, from http://www.veeco.com
[2] J.F. Archard, W. Hirst, The wear of metals under unlubricated conditions, Proc.
Royal Soc. of London. Ser. A, Mathematical and Physical Sciences, 236 (1956) 397-410.
[3] J.A. Bares, N. Argibay, N. Manutler, G.J. Dudder, S.S. Perry, G.R Bourne, W.G.
Sawyer, High current density copper-on-copper sliding electrical contacts at low sliding velocities, Wear 267(2009) 417-424.
[4] H. Schwenke, W. Knapp, H. Haitjema, A. Weckenmann, R. Schmitt, F. Delbressine,
Geometric error measurement and compensation of machines – An update, CIRP Annals – Manufacturing Technology 57 (2008) 660-675.
27
BIOGRAPHICAL SKETCH
The author is a lifelong Florida resident. His interests in mechanical engineering
were first realized in high school when he was working on trucks and Jeeps in his
parent’s driveway. In pursuit of a mechanical engineering degree, he received an
Associate of Arts from Okaloosa Walton Community College in Niceville, Florida in
2003. He received a Bachelor of Science in mechanical engineering from the University
of Florida in 2007. He married the love of his life, now Misti A. Keith, that following
summer.


![library.dip.go.thlibrary.dip.go.th/multim6/edoc/2556/21487.pdf · (F) anuaa ball-on-disk [1] Coefficient of friction (g) Tribometer ball-on-disk SPECIAL th EA URE anuaa Tribometer](https://img.dokumen.tips/doc/110x75/5e08e38a3bb35b4943166407/f-anuaa-ball-on-disk-1-coefficient-of-friction-g-tribometer-ball-on-disk-special.jpg)