Embed Size (px)
Citation preview

FINAL REPORT
For the Florida Department of Transportation
Design Highwater Clearances For Highway Pavements
Volume II: Appendix
FDOT Research Contract No.: BD-543-13
FSU Project No.: 017032
by
Principal Investigator: W. V. Ping, P.E.
Research Associate: Ching-Chin Ling
Research Assistants: Chaohan Zhang, Haitao Liu, Jian Lan
Department of Civil & Environmental Engineering
FAMU-FSU College of Engineering
Tallahassee, FL 32310
August 2008

i
TABLE OF CONTENTS
LIST OF TABLES ........................................................................................................... iii
LIST OF FIGURES ......................................................................................................... vi
APPENDIX A BASIC CONCEPT OF TIME DOMAIN REFLECTOMETRY ........ 1 A.1 Dielectric Constant and Moisture Content ....................................................................................... 1 A.2 TDR -- Equipment and its Approach ............................................................................................... 2 A.3 Other Factors Affecting Dielectric Constant .................................................................................... 4
A.3.1 Soil mineral dielectric constant variability ........................................................................... 4 A.3.2 Water Constant Variability Factor ........................................................................................ 5 A.3.3 Saline Conditions ................................................................................................................. 5 A.3.4 Temperature Effects ............................................................................................................. 5
A.4 Apparent Length and its Determination ........................................................................................... 6 A.5 Three Phase Approach for Modeling ............................................................................................... 6 A.6 Hierarchical Methodology for Estimating Volumetric Moisture Content ..................................... 10
APPENDIX B FIELD MONITORING PROGRAM .................................................. 12 B.1 General ........................................................................................................................................... 12 B.2 Field Installation ............................................................................................................................ 12 B.3 Field Instrumentation ..................................................................................................................... 13 B.4 Data Reduction ............................................................................................................................... 15
APPENDIX C FIELD MONITORING RESULTS ..................................................... 21 C.1 Presentation of Field Monitoring Results ....................................................................................... 21 C.2 Discussion on Field Monitoring Results ........................................................................................ 22
APPENDIX D LABORATORY RESILIENT MODULUS TEST RESULTS ......... 55 D.1 Levy County A-3 Soil .................................................................................................................... 55 D.2 SR70 A-3 8% Soil .......................................................................................................................... 70 D.3 A-2-4 12% Soil .............................................................................................................................. 87 D.4 SR 70 A-2-4 14% Soil ................................................................................................................. 100 D.5 A-2-4, 20% Soil ........................................................................................................................... 115 D.6 A-2-4, 24% Soil ........................................................................................................................... 128 D.7 A-2-4, 30% Soil ........................................................................................................................... 141 D.8 Oolite A-1 Soil ............................................................................................................................. 154 D.9 Spring Cemetery A-2-4, 15% Soil ............................................................................................... 167 D.10 Branch A-2-4, 23% Soil ............................................................................................................. 176 D.11 Iron Bridge A-2-6, 31% Soil ...................................................................................................... 189
APPENDIX E MOISTURE CHANGE VERSUS TIME IN TEST PIT .................. 198 E.1 Levy County A-3, 4% Soil ........................................................................................................... 199 E.2 SR70 A-3, 8% Soil ....................................................................................................................... 202 E.3 SR70 A-2-4, 14% Soil .................................................................................................................. 207 E.4 A-2-4, 12% Soil ............................................................................................................................ 212 E.5 A-2-4, 20% Soil ............................................................................................................................ 217 E.6 A-2-4, 24% Soil ............................................................................................................................ 222 E.7 A-2-4, 30% Soil ............................................................................................................................ 227 E.8 Oolite A-1 Soil ............................................................................................................................. 230 E.9 Spring Cemetery A-2-4, 15% Soil ................................................................................................ 233 E.10 Branch A-2-4, 23% Soil ............................................................................................................. 239 E.11 Iron Bridge A-2-6, 31% Soil ...................................................................................................... 245
APPENDIX F DEFORMATION DATA IN PLATE LOAD TEST ......................... 251 F.1 Levy County A-3, 4% Soil ........................................................................................................... 252

ii
F.2 SR70 A-3, 8% Soil ....................................................................................................................... 261 F.3 SR70 A-2-4, 14% Soil .................................................................................................................. 270 F.4 A-2-4, 12% Soil ............................................................................................................................ 279 F.5 A-2-4, 20% Soil ............................................................................................................................ 291 F.6 A-2-4, 24% Soil ............................................................................................................................ 303 F.7 A-2-4, 30% Soil ............................................................................................................................ 314 F.8 Oolite A-1 Soil ............................................................................................................................. 325 F.9 Spring Cemetery A-2-4, 15% Soil ................................................................................................ 336 F.10 Branch A-2-4, 23% Soil ............................................................................................................. 363 F.11 Iron Bridge A-2-6, 31% Soil ...................................................................................................... 391
APPENDIX G LAYERED SYSTEM THEORY ....................................................... 418 G.1 Layered System ............................................................................................................................ 418
G.1.1 Two-layer System Theory Assumptions and Conditions ................................................. 419 G.1.2 Mathematical Theory of Elasticity ................................................................................... 422 G.1.3 Three-layer System ........................................................................................................... 424
G.2 KENLAYER Program Theoretical Development ........................................................................ 424 G.2.1 Elastic Multilayer System ................................................................................................ 424 G.2.2 Nonlinear Layers .............................................................................................................. 426 G.2.3 Granular Materials ............................................................................................................ 427 G.2.4 Fine-Grained Soils ............................................................................................................ 428
G.3 KENLAYER Program Subroutines ............................................................................................. 429

iii
LIST OF TABLES
Table B.1 Summary of Soil Boring Results on Field Test Sites .................................................................... 17 Table C.1 Moisture Profile (%) for SR-70 Field Monitoring Program (Spring, 2000) ................................. 25 Table C.2 Moisture Profile of SR-70 Soils (Field Test No. 1) ...................................................................... 26 Table C.3 Moisture Profile of SR-70 Soils (Field Test Site No. 2) ............................................................... 29 Table C.4 Moisture Profile (%) for SR-70 Field Monitoring Program (Summer, 2000) .............................. 32 Table C.5 Moisture Profile of SR-70 Soils (Field Test No. 1) ...................................................................... 33 Table C.6 Moisture Profile of SR-70 Soils (Field Test No. 2) ...................................................................... 36 Table C.7 Moisture Profile (%) for SR-70 Field Monitoring Program (Fall, 2000) ...................................... 39 Table C.8 Moisture Profile of SR-70 Soils (Field Test No. 1) ...................................................................... 40 Table C.9 Moisture Profile of SR-70 Soils (Field Test Site No. 2) ............................................................... 43 Table C.10 Moisture Profile (%) for SR-70 Field Monitoring Program (Winter, 2000) ............................... 46 Table C.11 Moisture Profile of SR-70 Soils (Field Test No. 1) .................................................................... 47 Table C.12 Moisture Profile of SR-70 Soils (Field Test Site No. 1 Year 2001) ........................................... 48 Table C.13 Moisture Profile of SR-70 Soils (Field Test Site No. 2) ............................................................. 51 Table C.14 Moisture Profile of SR-70 Soils (Field Test Site No. 2 Year 2001) ........................................... 52 Table D.1 Triaxial test results A-3 Levy County after drying (Sample # A3LEVYD1) ............................... 56 Table D.2 Triaxial test results of A-3 Levy County after drying (Sample # A3LEVYD2) ........................... 58 Table D.3 Triaxial test results of A-3 Levy County at optimum condition (A3LEVYO1) ........................... 60 Table D.4 Triaxial test results of A-3 Levy County at optimum condition (Sample # A3LEVYO2) ........... 62 Table D.5 Triaxial test results of A-3 Levy County after soaking (Sample # A3LEVYS1) ......................... 64 Table D.6 Triaxial test results of A-3 Levy County after soaking (Sample # A3LEVYS2) ......................... 66 Table D.7 Triaxial test results of A-3 Levy County after soaking (Sample # A3LEVYS3) ......................... 68 Table D.8 Triaxial test results of A-3 SR70 after drying (Sample # A3SR70D1) ........................................ 71 Table D.9 Triaxial test results of A-3 SR70 after drying (Sample # A3SR70D2) ........................................ 73 Table D.10 Triaxial test results of A-3 SR70 after drying (Sample # A3SR70D3) ...................................... 75 Table D.11 Triaxial test results of A-3 SR70 after drying (Sample # A3LEVYD4) ..................................... 77 Table D.12 Triaxial test results of A-3 SR70 at optimum condition (Sample # A3SR70O1) ....................... 79 Table D.13 Triaxial test results at optimum condition for SR70, A-3 (Sample # A3SR70O2) ..................... 81 Table D.14 Triaxial test results of A-3 SR70 after soaking (Sample # A3SR70S1) ..................................... 83 Table D.15 Triaxial test results of A-3 SR70 after soaking (Sample # A3SR70S2) ..................................... 85 Table D.16 Triaxial test results of A-2-4 12% at optimum (Sample # A2412%O1) ..................................... 88 Table D.17 Triaxial test results of A-2-4 12% at optimum (Sample # A312%O2) ....................................... 90 Table D.18 Triaxial test results of A-2-4 12% after drying (Sample # A312%D1) ...................................... 92 Table D.19 Triaxial test results of A-2-4 12% after drying (Sample # A312%D2) ...................................... 94 Table D.20 Triaxial test results of A-2-4 12% after soaking (Sample # A312%S1) ..................................... 96 Table D.21 Resilient Modulus of A-2-4 12% after soaking (Sample # A2412%S2) .................................... 98 Table D.22 Triaxial test results of A-2-4, SR70 after drying (Sample #A24SR70D1) ............................... 101 Table D.23 Triaxial test results of A-2-4 SR70 after drying (Sample # A24SR70D2) ............................... 103 Table D.24 Triaxial test results of A-2-4 SR70 at optimum condition (Sample # A24SR70O1) ................ 105 Table D.25 Triaxial test results of A-2-4 SR70 at optimum condition (Sample # A24SR70O2) ................ 107 Table D.26 Triaxial test results of A-2-4 SR70 after soaking (Sample # A24SR70S1) .............................. 109 Table D.27 Triaxial test results of A-2-4 SR70 after soaking (Sample # A24SR70S2) .............................. 111 Table D.28 Triaxial test results of A-2-4 SR70 after drying (Sample # A24SR70D3) ............................... 113 Table D.29 Resilient Modulus of A-2-4, 20% at OMC (Sample # A2420%O1) ........................................ 116 Table D.30 Resilient Modulus of A-2-4, 20% at OMC (Sample # A2420%O2) ........................................ 118 Table D.31 Resilient Modulus of A-2-4 20% after drying (Sample # A2420%D1) ................................... 120 Table D.32 Resilient Modulus of A-2-4 20% after drying (Sample # A2420%D2) ................................... 122 Table D.33 Resilient Modulus of A-2-4 20% after soaking (Sample # A2420%S1) .................................. 124 Table D.34 Resilient Modulus of A-2-4 20% after soaking (Sample # A2420%S2) .................................. 126 Table D.35 Resilient Modulus of A-2-4 24% at OMC (Sample # A2424%O1) ......................................... 129

iv
Table D.36 Resilient Modulus of A-2-4 24% at OMC (Sample # A2424%O2) ......................................... 131 Table D.37 Resilient Modulus of A-2-4, 24% after drying (Sample # A2424%D1) .................................. 133 Table D.38 Resilient Modulus of A-2-4, 24% after drying (A2424%D2) .................................................. 135 Table D.39 Resilient Modulus of A-2-4, 24% after soaking (Sample # A2424%S1) ................................. 137 Table D.40 Resilient Modulus of A-2-4, 24% after soaking (Sample # A2424%S2) ................................. 139 Table D.41 Triaxial test results of A-2-4 30% fine after drying (A2430%D1) ........................................... 142 Table D.42 Triaxial test results of A-2-4 30% fine after drying (Sample # A2430%D2) ........................... 144 Table D.43 Triaxial test results of A-2-4 30% at optimum condition (Sample # A2430%O1) ................... 146 Table D.44 Triaxial test results of A-2-4 30% at optimum condition (Sample # A2430%O2) ................... 148 Table D.45 Triaxial test results of A-2-4 30% after soaking (Sample # A2430%S1) ................................. 150 Table D.46 Triaxial test results of A-2-4 30% after soaking (Sample # A2430%S2) ................................. 152 Table D.47 Triaxial test results of Oolite after drying (Sample # OOLITED1) .......................................... 155 Table D.48 Triaxial test results of Oolite (crushed) after drying (Sample # OOLITED2) .......................... 157 Table D.49 Triaxial test results of Oolite (crushed) at optimum condition (Sample # OOLITEO1) .......... 159 Table D.50 Triaxial test results of Oolite (crushed) at optimum condition (Sample # OOLITEO2) .......... 161 Table D.51 Triaxial test results of Oolite (crushed) after soaking (Sample # OOLITES1) ......................... 163 Table D.52 Triaxial test results of Oolite (crushed) after soaking (Sample # OOLITES2) ......................... 165 Table D.53 Triaxial test results of Spring Cemetery (Sample # SC001C1) ................................................ 168 Table D.54 Triaxial test results of Spring Cemetery (Sample # SC001D2) ................................................ 170 Table D.55 Triaxial test results of Spring Cemetery (Sample # SC001E1) ................................................ 172 Table D.56 Triaxial test results of Spring Cemetery (Sample # SC001F1) ................................................. 174 Table D.57 Triaxial test results of Branch (Sample # BH001C1) ............................................................... 177 Table D.58 Triaxial test results of Branch (Sample # BH001D2) ............................................................... 179 Table D.59 Triaxial test results of Branch (Sample # BH001E1) ............................................................... 181 Table D.60 Triaxial test results of Branch (Sample # BH001F1) ............................................................... 183 Table D.61 Triaxial test results of Branch (Sample # BH001G1) ............................................................... 185 Table D.62 Triaxial test results of Branch (Sample # BH001H1) ............................................................... 187 Table D.63 Triaxial test results of Iron Bridge (Sample # IB001C1) .......................................................... 190 Table D.64 Triaxial test results of Iron Bridge (Sample # IB001D1) ......................................................... 192 Table D.65 Triaxial test results of Iron Bridge (Sample # IB001E1) .......................................................... 194 Table D.66 Triaxial test results of Iron Bridge (Sample # IB001F1) .......................................................... 196 Table F.1 Levy County A-3 Soil Plate Load Test, 20 psi w/o Limerock .................................................... 253 Table F.2 Levy County A-3 Soil Plate Load Test, 20 psi w/ Limerock ...................................................... 254 Table F.3 Levy County A-3 Soil Plate Load Test, 50 psi w/ Limerock ...................................................... 254 Table F.4 Summary of Deformation for Levy County A-3 Soil Plate Load Test ........................................ 255 Table F.5 SR-70 A-3 Soil Plate Load Test, 20 psi w/o Limerock ............................................................... 262 Table F.6 SR-70 A-3 Soil Plate Load Test, 50 psi w/Limerock .................................................................. 262 Table F.7 Summary of Deformation for SR-70 A-3 Soil Plate Load Test .................................................. 264 Table F.8 SR-70 A-2-4 Soil Plate Load Test, 20 psi w/o Limerock ............................................................ 271 Table F.9 SR-70 A-2-4 Soil Plate Load Test, 50 psi w/ Limerock .............................................................. 271 Table F.10 Summary of Deformation for SR-70 A-2-4 Soil Plate Load Test ............................................. 273 Table F.11 A-2-4, 12% Soil Plate Load Test, 20 psi w/out Limerock ........................................................ 280 Table F.12 A-2-4, 12% Soil Plate Load Test, 50 psi w/ Limerock ............................................................. 282 Table F.13 Summary of Deformation for A-2-4 (12%) Soil Plate Load Test ............................................. 284 Table F.14 A-2-4, 20% Soil Plate Load Test, 20 psi w/out Limerock ........................................................ 292 Table F.15 A-2-4, 20% Soil Plate Load Test, 50 psi with Limerock .......................................................... 294 Table F.16 Summary of Deformation for A-2-4 (20%) Soil Plate Load Test ............................................. 296 Table F.17 A-2-4, 24% Soil Plate Load Test, 20 psi w/out Limerock ........................................................ 304 Table F.18 A-2-4, 24% Soil Plate Load Test, 50 psi with Limerock .......................................................... 306 Table F.19 Summary of Deformation for A-2-4 (24%) Soil Plate Load Test ............................................. 307 Table F.20 A-2-4, 30% Soil Plate Load Test, 20 psi without Limerock ..................................................... 315 Table F.21 A-2-4, 30% Soil Plate Load Test, 50 psi with Limerock .......................................................... 317 Table F.22 Summary of Deformation for A-2-4 (30%) Soil Plate Load Test ............................................. 318 Table F.23 Oolite A-1 Soil Plate Load Test, 50 psi without Limerock ....................................................... 326 Table F.24 Oolite A-1 Soil Plate Load Test, 50 psi with Limerock ............................................................ 328
v
Table F.25 Summary of Deformation for Oolite A-1 Soil Plate Load Test ................................................ 329 Table F.26 Spring Cemetery A-2-4 Soil Plate Load Test, 20 psi w/o Limerock ......................................... 337 Table F.27 Spring Cemetery A-2-4 Soil Plate Load Test, 50 psi w/ Limerock ........................................... 340 Table F.28 Summary of Deformation for Spring Cemetery A-2-4 (15%) Soil Plate Load Test, 20 psi Plate
Load .......................................................................................................................................... 346 Table F.29 Summary of Deformation for Spring Cemetery A-2-4 (15%) Soil Plate Load Test, 50 psi Plate
Load .......................................................................................................................................... 347 Table F.30 Branch A-2-4 Soil Plate Load Test, 20 psi w/o Limerock ........................................................ 364 Table F.31 Branch A-2-4 Soil Plate Load Test, 50 psi w/ Limerock .......................................................... 367 Table F.32 Summary of Deformation for Branch A-2-4 (23%) Soil, 20 psi Plate Load ............................. 373 Table F.33 Summary of Deformation for Branch A-2-4 (23%) Soil, 50 psi Plate Load with Limerock Base
Layer ......................................................................................................................................... 374 Table F.34 Iron Bridge A-2-6 Soil Plate Load Test, 20 psi w/o Limerock ................................................. 392 Table F.35 Iron Bridge A-2-6 Soil Plate Load Test, 50 psi w/ Limerock ................................................... 395 Table F.36 Summary of Deformation for Iron Bridge A-2-6 (31%) Soil, 20 psi Plate Load w/o Limerock
Base Layer ................................................................................................................................ 401 Table F.37 Summary of Deformation for Iron Bridge A-2-6 (31%) Soil, 50 psi Plate Load w/ Limerock
Base Layer ................................................................................................................................ 402

vi
LIST OF FIGURES
Figure B.1 Cross Sectional Sketch of Field Installation ................................................................................ 18 Figure B.2 Plan View of Field Installation near Fort Pierce, Florida ............................................................ 18 Figure B.3 Cross Sectional View of the TDR Installation in Field Test Pit .................................................. 19 Figure B.4 Rain Gauge Installation in Field Test Sites ................................................................................. 20
Figure C.1 Degree of Saturation vs. Date and Precipitation (Field Test Site No.1 -- Spring 2000) .............. 27 Figure C.2 Degree of Saturation vs. Depth (Field Test Site No.1 -- Spring 2000) ........................................ 28 Figure C.3 Degree of Saturation vs. Date and Precipitation (Field Test Site No.2 -- Spring 2000) .............. 30 Figure C.4 Degree of Saturation vs. Depth (Field Test Site No.2 --Spring 2000) ......................................... 31 Figure C.5 Degree of Saturation vs. Date and Precipitation (Field Test Site No.2 -- Summer 2000) ........... 34 Figure C.6 Degree of Saturation vs. Depth (Field Test Site No.1 -- Summer 2000) .................................... 35 Figure C.7 Degree of Saturation vs. Date and Precipitation (Field Test Site No.2 -- Summer 2000) ........... 37 Figure C.8 Degree of Saturation vs. Depth (Field Test Site No.2 -- Summer 2000) ..................................... 38 Figure C.9 Degree of Saturation vs. Date and Precipitation (Field Test Site No.1 -- Fall 2000) .................. 41 Figure C.10 Degree of Saturation vs. Depth (Field Test Site No.1, -- Fall 2000) ......................................... 42 Figure C.11 Degree of Saturation vs. Date and Precipitation (Field Test Site No.2 -- Fall 2000) ................ 44 Figure C.12 Degree of Saturation vs. Depth (Field Test Site No.2 -- Fall 2000) ......................................... 45 Figure C.13 Degree of Saturation vs. Date and Precipitation (Field Test Site No.1 -- Winter 2000/2001) .. 49 Figure C.14 Degree of Saturation vs. Depth (Field Test Site No.1 -- Winter 2000/2001) ........................... 50 Figure C.15 Degree of Saturation vs. Date and Precipitation (Field Test Site No.2 -- Winter 2000/2001) .. 53 Figure C.16 Degree of Saturation vs. Depth (Field Test Site No.2 -- Winter 2000/2001) ............................ 54
Figure D.1 Resilient Modulus vs. Bulk Stress for A-3 Levy County after drying (Sample # A3LEVYD1) . 57 Figure D.2 Resilient Modulus vs. Confining Stress for A-3 Levy County after drying (Sample #
A3LEVYD1) ........................................................................................................................... 57 Figure D.3 Resilient Modulus vs. Bulk Stress for A-3 Levy County after drying (Sample # A3LEVYD2) . 59 Figure D.4 Resilient Modulus vs. Confining Stress for A-3 Levy County after drying (Sample #
A3LEVYD2) ........................................................................................................................... 59 Figure D.5 Resilient Modulus vs. Bulk Stress for A-3 Levy County at optimum moisture (Sample #
A3LEVYO1) ........................................................................................................................... 61 Figure D.6 Resilient Modulus vs. Confining Stress for A-3 Levy County at optimum moisture (Sample #
A3LEVYO1) ........................................................................................................................... 61 Figure D.7 Resilient Modulus vs. Bulk Stress for A-3 Levy County at optimum moisture (Sample #
A3LEVYO2) ........................................................................................................................... 63 Figure D.8 Resilient Modulus vs. Confining Stress for A-3 Levy County at optimum moisture (Sample #
A3LEVYO2) ........................................................................................................................... 63 Figure D.9 Resilient Modulus vs. Bulk Stress for A-3 Levy County after soaking (Sample # A3LEVYS1)65 Figure D.10 Resilient Modulus vs. Confining Stress for A-3 Levy County after soaking (Sample #
A3LEVYS1) ........................................................................................................................... 65 Figure D.11 Resilient Modulus vs. Bulk Stress for A-3 Levy County after soaking (Sample # A3LEVYS2)
................................................................................................................................................ 67 Figure D.12 Resilient Modulus vs. Confining Stress for A-3 Levy County after soaking (Sample #
A3LEVYS2) ........................................................................................................................... 67 Figure D.13 Resilient Modulus vs. Bulk Stress for A-3 Levy County after soaking (Sample # A3LEVYS3)
................................................................................................................................................ 69 Figure D.14 Resilient Modulus vs. Confining Stress for A-3 Levy County after soaking (Sample #
A3LEVYS3) ........................................................................................................................... 69 Figure D.15 Resilient Modulus vs. Bulk Stress for A-3 SR70 after drying (Sample # A3SR70D1) ............ 72 Figure D.16 Resilient Modulus vs. Confining Stress for A-3 SR70 after drying (Sample # A3SR70D1) .... 72 Figure D.17 Resilient Modulus vs. Bulk Stress for A-3 SR70 after drying (Sample # A3SR70D2) ............ 74 Figure D.18 Resilient Modulus vs. Confining Stress for A-3 SR70 after drying (Sample # A3SR70D2) .... 74

vii
Figure D.19 Resilient Modulus vs. Bulk Stress for A-3 SR70 after drying (Sample # A3SR70D3) ............ 76 Figure D.20 Resilient Modulus vs. Confining Stress for A-3 SR70 after drying (Sample # A3SR70D3) .... 76 Figure D.21 Resilient Modulus vs. Bulk Stress for A-3 SR70 after drying (Sample # A3SR70D4) ............ 78 Figure D.22 Resilient Modulus vs. Confining Stress for A-3 SR70 after drying (Sample # A3SR70D4) .... 78 Figure D.23 Resilient Modulus vs. Bulk Stress for A-3 SR70 at optimum moisture (Sample # A3SR70O1)
................................................................................................................................................ 80 Figure D.24 Resilient Modulus vs. Confining Stress for A-3 SR70 at optimum moisture (Sample #
A3SR70O1) ............................................................................................................................ 80 Figure D.25 Resilient Modulus vs. Bulk Stress for A-3 SR70 at optimum moisture (Sample # A3SR70O2)
................................................................................................................................................ 82 Figure D.26 Resilient Modulus vs. Confining Stress for A-3 SR70 at optimum moisture (Sample #
A3SR70O2) ............................................................................................................................ 82 Figure D.27 Resilient Modulus vs. Bulk Stress for A-3 SR70 after soaking (Sample # A3SR70S1) ........... 84 Figure D.28 Resilient Modulus vs. Confining Stress for A-3 SR70 after soaking (Sample # A3SR70S1) ... 84 Figure D.29 Resilient Modulus vs. Bulk Stress for A-3 SR70 after soaking (Sample # A3SR70S2) ........... 86 Figure D.30 Resilient Modulus vs. Confining Stress for A-3 SR70 after soaking (Sample # A3SR70S2) ... 86 Figure D.31 Resilient Modulus vs. Bulk Stress for A-2-4 12% at optimum moisture (Sample # A2412%O1)
................................................................................................................................................ 89 Figure D.32 Resilient Modulus vs. Confining Stress for A-2-4 12% at optimum moisture (Sample #
A2412%O1) ............................................................................................................................ 89 Figure D.33 Resilient Modulus vs. Bulk Stress for A-2-4 12% at optimum moisture (Sample # A2412%O2)
................................................................................................................................................ 91 Figure D.34 Resilient Modulus vs. Confining Stress for A-2-4 24% at optimum moisture (Sample #
A2412%O2) ............................................................................................................................ 91 Figure D.35 Resilient Modulus vs. Bulk Stress for A-2-4 12% after drying (Sample # A2412%D1) .......... 93 Figure D.36 Resilient Modulus vs. Confining Pressure for A-2-4 12% after drying (Sample # A2412%D1)
................................................................................................................................................ 93 Figure D.37 Resilient Modulus vs. Bulk Stress for A-2-4 12% after drying (Sample # A2412%D2) .......... 95 Figure D.38 Resilient Modulus vs. Confining Pressure for A-2-4 12% after drying (Sample # A2412%D2)
................................................................................................................................................ 95 Figure D.39 Resilient Modulus vs. Bulk Stress for A-2-4 12% after soaking) (Sample # A2412%S1) ....... 97 Figure D.40 Resilient Modulus vs. Confining Stress for A-2-4 12% after soaking (Sample # A2412%S1) 97 Figure D.41 Resilient Modulus vs. Bulk Stress for A-2-4 12% (Sample # A2412%S2) ............................. 99 Figure D.42 Resilient Modulus vs. Confining Pressure for A-2-4 12% after soaking (Sample # A2412%S2)
................................................................................................................................................ 99 Figure D.43 Resilient Modulus vs. Bulk Stress for A-2-4 SR70 after drying (Sample # A24SR70D1) ..... 102 Figure D.44 Resilient Modulus vs. Confining Stress for A-2-4 SR70 after drying (Sample # A24SR70D1)
.............................................................................................................................................. 102 Figure D.45 Resilient Modulus vs. Bulk Stress for A-2-4 SR70 after drying (Sample # A24SR70D2) ..... 104 Figure D.46 Resilient Modulus vs. Confining Stress for A-2-4 SR70 after drying (Sample # A24SR70D2)
.............................................................................................................................................. 104 Figure D.47 Resilient Modulus vs. Bulk Stress for A-2-4 SR70 at optimum moisture (Sample #
A24SR70O1) ........................................................................................................................ 106 Figure D.48 Resilient Modulus vs. Confining Stress for A-2-4 SR70 at optimum moisture (Sample #
A24SR70O1) ........................................................................................................................ 106 Figure D.49 Resilient Modulus vs. Bulk Stress for A-2-4 SR70 at optimum moisture (Sample #
A24SR70O2) ........................................................................................................................ 108 Figure D.50 Resilient Modulus vs. Confining Stress for A-2-4 SR70 at optimum moisture (Sample #
A24SR70O2) ........................................................................................................................ 108 Figure D.51 Resilient Modulus vs. Bulk Stress for A-2-4 SR70 after soaking (Sample # A24SR70S1) .... 110 Figure D.52 Resilient Modulus vs. Confining Stress for A-2-4 SR70 after soaking (Sample # A24SR70S1)
.............................................................................................................................................. 110 Figure D.53 Resilient Modulus vs. Bulk Stress for A-2-4 SR70 after soaking (Sample # A24SR70S2) .... 112 Figure D.54 Resilient Modulus vs. Confining Stress for A-2-4 SR70 after soaking (Sample # A24SR70S2)
.............................................................................................................................................. 112 Figure D.55 Resilient Modulus vs. Bulk Stress for A-2-4 SR70 after drying (Sample # A24SR70D3) ..... 114

viii
Figure D.56 Resilient Modulus vs. Confining Stress for A-2-4 SR70 after drying (Sample # A24SR70D3) .............................................................................................................................................. 114
Figure D.57 Resilient Modulus vs. Bulk Stress for A-2-4 20% at OMC (Sample # A2420%O1) .............. 117 Figure D.58 Resilient Modulus vs. Confining Stress for A-2-4 20% at OMC (Sample # A2420%O1) ..... 117 Figure D.59 Resilient Modulus vs. Bulk Stress for A-2-4 20% at OMC (Sample # A2420%O2) .............. 119 Figure D.60 Resilient Modulus vs. Confining Stress for A-2-4 20% at OMC (Sample # A2420%O2) ..... 119 Figure D.61 Resilient Modulus vs. Bulk Stress for A-2-4 20% after drying (Sample # A2420%D1) ........ 121 Figure D.62 Resilient Modulus vs. Confining Stress for A-2-4 20% after drying (Sample # A2420%D1) 121 Figure D.63 Resilient Modulus vs. Bulk Stress for A-2-4 20% after drying (Sample # A2420%D2) ........ 123 Figure D.64 Resilient Modulus vs. Confining Pressure for A-2-4 20% after drying (Sample # A2420%D2)
.............................................................................................................................................. 123 Figure D.65 Resilient Modulus vs. Bulk Stress for A-2-4 20% after soaking (Sample# A2420%S1) ........ 125 Figure D.66 Resilient Modulus vs. Confining Pressure for A-2-4 20% after soaking (Sample # A2420%S1)
.............................................................................................................................................. 125 Figure D.67 Resilient Modulus vs. Bulk Stress for A-2-4 20% after soaking (Sample # A2420%S2) ....... 127 Figure D.68 Resilient Modulus vs. Confining Pressure for A-2-4 20% after soaking (Sample # A2420%S2)
.............................................................................................................................................. 127 Figure D.69 Resilient Modulus vs. Bulk Stress for A-2-4 24% at OMC (Sample # A2424%O1) .............. 130 Figure D.70 Resilient Modulus vs. Confining Pressure for A-2-4 24% at OMC (Sample # A2424%O1) .. 130 Figure D.71 Resilient Modulus vs. Bulk Stress for A-2-4 24% at OMC (Sample # A2424%O2) .............. 132 Figure D.72 Resilient Modulus vs. Confining Pressure for A-2-4 24% at OMC (Sample # A2424%O2) .. 132 Figure D.73 Resilient Modulus vs. Bulk Stress for A-2-4, 24% after drying (Sample # A2424%D1) ....... 134 Figure D.74 Resilient Modulus vs. Confining Pressure for A-2-4, 24% after drying (Sample # A2424%D1)
.............................................................................................................................................. 134 Figure D.75 Resilient Modulus vs. Bulk Stress for A-2-4, 24% (Sample # A24224%D2) ......................... 136 Figure D.76 Resilient Modulus vs. Confining Pressure for A-2-4, 24% (A2424%D2) .............................. 136 Figure D.77 Resilient Modulus vs. Bulk Stress for A-2-4, 24% after soaking (A2424%S1) ...................... 138 Figure D.78 Resilient Modulus vs. Confining Pressure for A-2-4, 24% after soaking (A2424%S1) ......... 138 Figure D.79 Resilient Modulus vs. Bulk Stress for A-2-4, 24% (Sample # A2424%S2) ........................... 140 Figure D.80 Resilient Modulus vs. Confining Pressure for A-2-4, 24% (Sample # A2424%S2) ............... 140 Figure D.81 Resilient Modulus vs. Bulk Stress for A-2-4 30% after drying (Sample # A2430%D1) ........ 143 Figure D.82 Resilient Modulus vs. Confining Stress for A-2-4 30% fine after drying (Sample #
A2430%D1) .......................................................................................................................... 143 Figure D.83 Resilient Modulus vs. Bulk Stress for A-2-4 30% after drying (Sample # A2430%D2) ........ 145 Figure D.84 Resilient Modulus vs. Confining Stress for A-2-4 30% fine after drying (Sample #
A2430%D2) .......................................................................................................................... 145 Figure D.85 Resilient Modulus vs. Bulk Stress for A-2-4 30% at optimum moisture (Sample # A2430%O1)
.............................................................................................................................................. 147 Figure D.86 Resilient Modulus vs. Confining Stress for A-2-4 30% at optimum moisture (Sample #
A2430%O1) .......................................................................................................................... 147 Figure D.87 Resilient Modulus vs. Bulk Stress for A-2-4 30% at optimum moisture (Sample # A2430%O2)
.............................................................................................................................................. 149 Figure D.88 Resilient Modulus vs. Confining Stress for A-2-4 30% at optimum moisture (Sample #
A2430%O2) .......................................................................................................................... 149 Figure D.89 Resilient Modulus vs. Bulk Stress for A-2-4 30% after soaking (Sample # A2430%S1) ....... 151 Figure D.90 Resilient Modulus vs. Confining Stress for A-2-4 30% after soaking (Sample # A2430%S1)
.............................................................................................................................................. 151 Figure D.91 Resilient Modulus vs. Bulk Stress for A-2-4 30% after soaking (Sample # A2430%S2) ....... 153 Figure D.92 Resilient Modulus vs. Confining Stress for A-2-4 30% after soaking (Sample # A2430%S2)
.............................................................................................................................................. 153 Figure D.93 Resilient Modulus vs. Bulk Stress for Oolite (crushed) after drying (OOLITED1) ................ 156 Figure D.94 Resilient Modulus vs. Confining Stress for Oolite (crushed) after drying (Sample #
OOLITED1) .......................................................................................................................... 156 Figure D.95 Resilient Modulus vs. Bulk Stress for Oolite (crushed) after drying (OOLITED2) ................ 158 Figure D.96 Resilient Modulus vs. Confining Stress for Oolite (crushed) after drying (Sample #
OOLITED2) .......................................................................................................................... 158

ix
Figure D.97 Resilient Modulus vs. Bulk Stress for Oolite (crushed) at optimum moisture(Sample # OOLITEO1) .......................................................................................................................... 160
Figure D.98 Resilient Modulus vs. Confining Stress for Oolite (crushed) after drying (Sample # OOLITEO1) .......................................................................................................................... 160
Figure D.99 Resilient Modulus vs. Bulk Stress for Oolite (crushed) at optimum moisture (Sample # OOLITEO2) .......................................................................................................................... 162
Figure D.100 Resilient Modulus vs. Confining Stress for Oolite (crushed) after drying (Sample # OOLITEO1) .......................................................................................................................... 162
Figure D.101 Resilient Modulus vs. Bulk Stress for Oolite (crushed) after soaking (Sample # OOLITES1) .............................................................................................................................................. 164
Figure D.102 Resilient Modulus vs. Confining Stress for Oolite (crushed) after soaking (Sample # OOLITES1) .......................................................................................................................... 164
Figure D.103 Resilient Modulus vs. Bulk Stress for Oolite (crushed) after soaking (Sample # OOLITES2) .............................................................................................................................................. 166
Figure D.104 Resilient Modulus vs. Confining Stress for Oolite (crushed) after soaking (Sample # OOLITES2) .......................................................................................................................... 166
Figure D.105 Resilient Modulus vs. Bulk Stress for Spring Cemetery at Optimum Condition (Sample #SC001C1) ............................................................................................................................ 169
Figure D.106 Resilient Modulus vs. Confining Stress for Spring Cemetery at Optimum Condition (Sample #SC001C1) ............................................................................................................................ 169
Figure D.107 Resilient Modulus vs. Bulk Stress for Spring Cemetery at Optimum Condition (Sample #SC001D2) ........................................................................................................................... 171
Figure D.108 Resilient Modulus vs. Confining Stress for Spring Cemetery at Optimum Condition (Sample #SC001D2) ........................................................................................................................... 171
Figure D.109 Resilient Modulus vs. Bulk Stress for Spring Cemetery at Optimum Condition (Sample #SC001E1) ............................................................................................................................ 173
Figure D.110 Resilient Modulus vs. Confining Stress for Spring Cemetery at Optimum Condition (Sample #SC001E1) ............................................................................................................................ 173
Figure D.111 Resilient Modulus vs. Bulk Stress for Spring Cemetery at Optimum Condition (Sample #SC001F1) ............................................................................................................................ 175
Figure D.112 Resilient Modulus vs. Confining Stress for Spring Cemetery at Optimum Condition (Sample #SC001F1) ............................................................................................................................ 175
Figure D.113 Resilient Modulus vs. Bulk Stress for Branch at Optimum Condition (Sample #BH001C1) .............................................................................................................................................. 178
Figure D.114 Resilient Modulus vs. Confining Stress for Branch at Optimum Condition (Sample #BH001C1) ........................................................................................................................... 178
Figure D.115 Resilient Modulus vs. Bulk Stress for Branch at Optimum Condition (Sample #BH001D2) .............................................................................................................................................. 180
Figure D.116 Resilient Modulus vs. Confining Stress for Branch at Optimum Condition (Sample #BH001D2) ........................................................................................................................... 180
Figure D.117 Resilient Modulus vs. Bulk Stress for Branch at Optimum Condition (Sample #BH001E1)182 Figure D.118 Resilient Modulus vs. Confining Stress for Branch at Optimum Condition (Sample
#BH001E1) ........................................................................................................................... 182 Figure D.119 Resilient Modulus vs. Bulk Stress for Branch at Optimum Condition (Sample #BH001F1) 184 Figure D.120 Resilient Modulus vs. Confining Stress for Branch at Optimum Condition (Sample
#BH001F1) ........................................................................................................................... 184 Figure D.121 Resilient Modulus vs. Bulk Stress for Branch at Optimum Condition (Sample #BH001G1)
.............................................................................................................................................. 186 Figure D.122 Resilient Modulus vs. Confining Stress for Branch at Optimum Condition (Sample
#BH001G1) ........................................................................................................................... 186 Figure D.123 Resilient Modulus vs. Bulk Stress for Branch at Optimum Condition (Sample #BH001H1)
.............................................................................................................................................. 188 Figure D.124 Resilient Modulus vs. Confining Stress for Branch at Optimum Condition (Sample
#BH001H1) ........................................................................................................................... 188 Figure D.125 Resilient Modulus vs. Bulk Stress for Iron Bridge at Optimum Condition (Sample #IB001C1)
.............................................................................................................................................. 191

x
Figure D.126 Resilient Modulus vs. Confining Stress for Iron Bridge at Optimum Condition (Sample #IB001C1) ............................................................................................................................ 191
Figure D.127 Resilient Modulus vs. Bulk Stress for Iron Bridge at Optimum Condition (Sample #IB001D1) .............................................................................................................................................. 193
Figure D.128 Resilient Modulus vs. Confining Stress for Iron Bridge at Optimum Condition (Sample #IB001D1) ............................................................................................................................ 193
Figure D.129 Resilient Modulus vs. Bulk Stress for Iron Bridge at Optimum Condition (Sample #IB001E1) .............................................................................................................................................. 195
Figure D.130 Resilient Modulus vs. Confining Stress for Iron Bridge at Optimum Condition (Sample #IB001E1) ............................................................................................................................. 195
Figure D.131 Resilient Modulus vs. Bulk Stress for Iron Bridge at Optimum Condition (Sample #IB001F1) .............................................................................................................................................. 197
Figure D.132 Resilient Modulus vs. Confining Stress for Iron Bridge at Optimum Condition (Sample #IB001F1) ............................................................................................................................. 197
Figure E.1 Moisture Profile versus Time for Levy County A-3 Soil (W.T. from -20 in. to +0 in. above
Embankment) .......................................................................................................................... 200 Figure E.2 Moisture Profile versus Time for Levy County A-3 Soil (W.T. from +0 in. to +12 in. above
Embankment) .......................................................................................................................... 200 Figure E.3 Moisture Profile versus Time for Levy County A-3 Soil (W.T. from +12 in. to +36 in. above
Embankment) .......................................................................................................................... 201 Figure E.4 Moisture Profile versus Time for Levy County A-3 Soil (W.T. from +36 in. to -20 in. above
Embankment) .......................................................................................................................... 201 Figure E.5 Moisture Profile versus Time for SR70 A-3 Soil (W.T. from -24 in. to -12 in. above
Embankment) .......................................................................................................................... 203 Figure E.6 Moisture Profile versus Time for SR70 A-3 Soil (W.T. from -12 in. to +0 in. above
Embankment) .......................................................................................................................... 203 Figure E.7 Moisture Profile versus Time for SR70 A-3 Soil (W.T. from +0 in. to +12 in. above
Embankment) .......................................................................................................................... 204 Figure E.8 Moisture Profile versus Time for SR70 A-3 Soil (W.T. from +12 in. to +36 in. above
Embankment) .......................................................................................................................... 204 Figure E.9 Moisture Profile versus Time for SR70 A-3 Soil (W.T. from +36 in. to -24 in. above
Embankment) .......................................................................................................................... 205 Figure E.10 Moisture Profile versus Time for SR70 A-3 Soil (W.T. from -24 in. to +36 in. above
Embankment) .......................................................................................................................... 205 Figure E.11 Moisture Profile versus Time for SR70 A-3 Soil (W.T. from +36 in. to +41 in. above
Embankment) .......................................................................................................................... 206 Figure E.12 Moisture Profile versus Time for SR70 A-2-4 Soil (W.T. from -24 in. to -12 in. above
Embankment) .......................................................................................................................... 208 Figure E.13 Moisture Profile versus Time for SR70 A-2-4 Soil (W.T. from -12 in. to 0 in. above
Embankment) .......................................................................................................................... 208 Figure E.14 Moisture Profile versus Time for SR70 A-2-4 Soil (W.T. from 0 in. to +12 in. above
Embankment) .......................................................................................................................... 209 Figure E.15 Moisture Profile versus Time for SR70 A-2-4 Soil (W.T. from +12 in. to +36 in. above
Embankment) .......................................................................................................................... 209 Figure E.16 Moisture Profile versus Time for SR70 A-2-4 Soil (W.T. from +36 in. to -24 in. above
Embankment) .......................................................................................................................... 210 Figure E.17 Moisture Profile versus Time for SR70 A-2-4 Soil (W.T. from -24 in. to +36 in. above
Embankment) .......................................................................................................................... 210 Figure E.18 Moisture Profile versus Time for SR70 A-2-4 Soil (W.T. from +36 in. to +41 in. above
Embankment) .......................................................................................................................... 211 Figure E.19 Moisture Profile versus Time for A-2-4, 12% Soil (W.T. from -24 in. to 0 in. above
Embankment) .......................................................................................................................... 213 Figure E.20 Moisture Profile versus Time for A-2-4, 12% Soil (W.T. from 0 in. to +12 in. above
Embankment) .......................................................................................................................... 213

xi
Figure E.21 Moisture Profile versus Time for A-2-4, 12% Soil (W.T. from +12 in. to +36 in. above Embankment) .......................................................................................................................... 214
Figure E.22 Moisture Profile versus Time for A-2-4, 12% Soil (W.T. from +36 in. to +41 in. above Embankment) .......................................................................................................................... 214
Figure E.23 Moisture Profile versus Time for A-2-4, 12% Soil (W.T. from +41 in. to +30 in. above Embankment) .......................................................................................................................... 215
Figure E.24 Moisture Profile versus Time for A-2-4, 12% Soil (W.T. from +30 in. to +12 in. above Embankment) .......................................................................................................................... 215
Figure E.25 Moisture Profile versus Time for A-2-4, 12% Soil (W.T. from +12 in. to +36 in. above Embankment, Reflood) ........................................................................................................... 216
Figure E.26 Moisture Profile versus Time for A-2-4, 12% Soil (W.T. from +36 in. to +12 in. above Embankment) .......................................................................................................................... 216
Figure E.27 Moisture Profile versus Time for A-2-4, 20% Soil (W.T. from -24 in. to 0 in. above Embankment) .......................................................................................................................... 218
Figure E.28 Moisture Profile versus Time for A-2-4, 20% Soil (W.T. from +0 in. to +12 in. above Embankment) .......................................................................................................................... 218
Figure E.29 Moisture Profile versus Time for A-2-4, 20% Soil (W.T. from +12 in. to +36 in. above Embankment) .......................................................................................................................... 219
Figure E.30 Moisture Profile versus Time for A-2-4, 20% Soil (W.T. from +36 in. to +41 in. above Embankment) .......................................................................................................................... 219
Figure E.31 Moisture Profile versus Time for A-2-4, 20% Soil (W.T. from +41 in. to +30 in. above Embankment) .......................................................................................................................... 220
Figure E.32 Moisture Profile versus Time for A-2-4, 20% Soil (W.T. from +30 in. to +12 in. above Embankment) .......................................................................................................................... 220
Figure E.33 Moisture Profile versus Time for A-2-4, 20% Soil (W.T. from +12 in. to +36 in. above Embankment, Reflood) ........................................................................................................... 221
Figure E.34 Moisture Profile versus Time for A-2-4, 20% Soil (W.T. from +36 in. to +41 in. above Embankment) .......................................................................................................................... 221
Figure E.35 Moisture Profile versus Time for A-2-4, 24% Soil (W.T. from -24 in. to 0 in. above Embankment) .......................................................................................................................... 223
Figure E.36 Moisture Profile versus Time for A-2-4, 24% Soil (W.T. from +0 in. to +12 in. above Embankment) .......................................................................................................................... 223
Figure E.37 Moisture Profile versus Time for A-2-4, 24% Soil (W.T. from +12 in. to +36 in. above Embankment) .......................................................................................................................... 224
Figure E.38 Moisture Profile versus Time for A-2-4, 24% Soil (W.T. from +36 in. to +41 in. above Embankment) .......................................................................................................................... 224
Figure E.39 Moisture Profile versus Time for A-2-4, 24% Soil (W.T. from +41 in. to +30 in. above Embankment) .......................................................................................................................... 225
Figure E.40 Moisture Profile versus Time for A-2-4, 24% Soil (W.T. from +30 in. to +12 in. above Embankment) .......................................................................................................................... 225
Figure E.41 Moisture Profile versus Time for A-2-4, 24% Soil (W.T. from +12 in. to +36 in. above Embankment, Reflood) ........................................................................................................... 226
Figure E.42 Moisture Profile versus Time for A-2-4, 24% Soil (W.T. from +36 in. to +41 in. above Embankment) .......................................................................................................................... 226
Figure E.43 Moisture Profile versus Time for A-2-4, 30% Soil (W.T. from -24 in. to +0 in. above Embankment) .......................................................................................................................... 228
Figure E.44 Moisture Profile versus Time for A-2-4, 30% Soil (W.T. from +0 in. to +12 in. above Embankment) .......................................................................................................................... 228
Figure E.45 Moisture Profile versus Time for A-2-4, 30% Soil (W.T. from +12 in. to +36 in. above Embankment) .......................................................................................................................... 229
Figure E.46 Moisture Profile versus Time for A-2-4, 30% Soil (W.T. from +36 in. to -20 in. above Embankment) .......................................................................................................................... 229
Figure E.47 Moisture Profile versus Time for Oolite A-1 Soil (W.T. from -24 in. to +0 in. above Embankment) .......................................................................................................................... 231
Figure E.48 Moisture Profile versus Time for Oolite A-1 Soil (W.T. from +0 in. to +12 in. above Embankment) .......................................................................................................................... 231

xii
Figure E.49 Moisture Profile versus Time for Oolite A-1 Soil (W.T. from +12 in. to +36 in. above Embankment) .......................................................................................................................... 232
Figure E.50 Moisture Profile versus Time for Oolite A-1 Soil (W.T. from +36 in. to -20 in. above Embankment) .......................................................................................................................... 232
Figure E.51 Moisture Profile versus Time for Spring Cemetery A-2-4 Soil (W.T. from -24 in. to 0 in. above Embankment) .......................................................................................................................... 234
Figure E.52 Moisture Profile versus Time for Spring Cemetery A-2-4 Soil (W.T. from +0 in. to +12 in. above Embankment) ................................................................................................................ 234
Figure E.53 Moisture Profile versus Time for Spring Cemetery A-2-4 Soil (W.T. from +12 in. to +24 in. above Embankment) ................................................................................................................ 235
Figure E.54 Moisture Profile versus Time for Spring Cemetery A-2-4 Soil (W.T. from +24 in. to 0 in. above Embankment) ................................................................................................................ 235
Figure E.55 Moisture Profile versus Time for Spring Cemetery A-2-4 Soil (W.T. from 0 in. to +12 in. above Embankment, Reflood) ................................................................................................. 236
Figure E.56 Moisture Profile versus Time for Spring Cemetery A-2-4 Soil (W.T. from +12 in. to +24 in. above Embankment, Reflood) ................................................................................................. 236
Figure E.57 Moisture Profile versus Time for Spring Cemetery A-2-4 Soil (W.T. from +24 in. to +36 in. above Embankment) ................................................................................................................ 237
Figure E.58 Moisture Profile versus Time for Spring Cemetery A-2-4 Soil (W.T. from +36 in. to +24 in. above Embankment) ................................................................................................................ 237
Figure E.59 Moisture Profile versus Time for Spring Cemetery A-2-4 Soil (W.T. from +24 in. to +12 in. above Embankment) ................................................................................................................ 238
Figure E.60 Moisture Profile versus Time for Branch A-2-4 Soil (W.T. from -24 in. to 0 in. above Embankment) .......................................................................................................................... 240
Figure E.61 Moisture Profile versus Time for Branch A-2-4 Soil (W.T. from +0 in. to +12 in. above Embankment) .......................................................................................................................... 240
Figure E.62 Moisture Profile versus Time for Branch A-2-4 Soil (W.T. from +12 in. to +24 in. above Embankment) .......................................................................................................................... 241
Figure E.63 Moisture Profile versus Time for Branch A-2-4 Soil (W.T. from +24 in. to 0 in. above Embankment) .......................................................................................................................... 241
Figure E.64 Moisture Profile versus Time for Branch A-2-4 Soil (W.T. from 0 in. to +12 in. above Embankment, Reflood) ........................................................................................................... 242
Figure E.65 Moisture Profile versus Time for Branch A-2-4 Soil (W.T. from +12 in. to +24 in. above Embankment, Reflood) ........................................................................................................... 242
Figure E.66 Moisture Profile versus Time for Branch A-2-4 Soil (W.T. from +24 in. to +36 in. above Embankment) .......................................................................................................................... 243
Figure E.67 Moisture Profile versus Time for Branch A-2-4 Soil (W.T. from +36 in. to +24 in. above Embankment) .......................................................................................................................... 243
Figure E.68 Moisture Profile versus Time for Branch A-2-4 Soil (W.T. from +24 in. to +12 in. above Embankment) .......................................................................................................................... 244
Figure E.69 Moisture Profile versus Time for Iron Bridge A-2-6 Soil (W.T. from -24 in. to 0 in. above Embankment) .......................................................................................................................... 246
Figure E.70 Moisture Profile versus Time for Iron Bridge A-2-6 Soil (W.T. from +0 in. to +12 in. above Embankment) .......................................................................................................................... 246
Figure E.71 Moisture Profile versus Time for Iron Bridge A-2-6 Soil (W.T. from +12 in. to +24 in. above Embankment) .......................................................................................................................... 247
Figure E.72 Moisture Profile versus Time for Iron Bridge A-2-6 Soil (W.T. from +24 in. to 0 in. above Embankment) .......................................................................................................................... 247
Figure E.73 Moisture Profile versus Time for Iron Bridge A-2-6 Soil (W.T. from 0 in. to +12 in. above Embankment, Reflood) ........................................................................................................... 248
Figure E.74 Moisture Profile versus Time for Iron Bridge A-2-6 Soil (W.T. from +12 in. to +24 in. above Embankment, Reflood) ........................................................................................................... 248
Figure E.75 Moisture Profile versus Time for Iron Bridge A-2-6 Soil (W.T. from +24 in. to +36 in. above Embankment) .......................................................................................................................... 249
Figure E.76 Moisture Profile versus Time for Iron Bridge A-2-6 Soil (W.T. from +36 in. to +24 in. above Embankment) .......................................................................................................................... 249

xiii
Figure E.77 Moisture Profile versus Time for Iron Bridge A-2-6 Soil (W.T. from +24 in. to +12 in. above Embankment) .......................................................................................................................... 250
Figure F.1 Levy County A-3 Soil, Deformation under 20 psi Plate Load (Water Table at –20 in., without Limerock, Test 1-1) ..................................................................................................................................... 256 Figure F.2 Levy County A-3 Soil, Deformation under 20 psi Plate Load (Water Table at 0.0 in., without Limerock, Test 1-2) ..................................................................................................................................... 256 Figure F.3 Levy County A-3 Soil, Deformation under 20 psi Plate Load (Water Table at 12 in., without Limerock, Test 1-3) ..................................................................................................................................... 257 Figure F.4 Levy County A-3 Soil, Deformation under 20 psi Plate Load (Water Table at 12 in., with Limerock, Test 1-4) ..................................................................................................................................... 257 Figure F.5 Levy County A-3 Soil, Deformation under 20 psi Plate Load (Water Table at 36 in., with Limerock, Test 1-5) ..................................................................................................................................... 258 Figure F.6 Levy County A-3 Soil, Deformation under 50 psi Plate Load (Water Table at 36 in., with Limerock, Test 1-6) ..................................................................................................................................... 258 Figure F.7 Levy County A-3 Soil, Deformation under 50 psi Plate Load (Water Table at 36 in., with Limerock, Test 1-7) ..................................................................................................................................... 259 Figure F.8 Levy County A-3 Soil, Deformation Summary under 20 psi Plate Load at Different Water Table Level ............................................................................................................................................................ 259 Figure F.9 Levy County A-3 Soil, Deformation Summary under 50 psi Plate Load at Different Water Table Level ............................................................................................................................................................ 260 Figure F.10 SR-70 A-3 Soil, Deformation under 20 psi Plate Load (Water Table at 0.0 in., without Limerock, Test 2-1) ..................................................................................................................................... 265 Figure F.11 SR-70 A-3 Soil, Deformation under 20 psi Plate Load (Water Table at 12 in., without Limerock, Test 2-2) ..................................................................................................................................... 265 Figure F.12 SR-70 A-3 Soil, Deformation under 50 psi Plate Load (Water Table at +12 in., with Limerock, Test 2-3) ...................................................................................................................................................... 266 Figure F.13 SR-70 A-3 Soil, Deformation under 50 psi Plate Load (Water Table at +36 in., with Limerock, Test 2-4) ...................................................................................................................................................... 266 Figure F.14 SR-70 A-3 Soil, Deformation under 50 psi Plate Load (Water Table at +36 in., with Limerock, Test 2-5) ...................................................................................................................................................... 267 Figure F.15 SR-70 A-3 Soil, Deformation under 50 psi Plate Load (Water Table at –24 in., with Limerock, Test 2-6) ...................................................................................................................................................... 267 Figure F.16 SR-70 A-3 Soil, Deformation under 50 psi Plate Load (Water Table at –24 in., with Limerock, Test 2-7) ...................................................................................................................................................... 268 Figure F.17 SR-70 A-3 Soil, Deformation under 50 psi Plate Load (Water Table at +36 in., with Limerock, Test 2-8) ...................................................................................................................................................... 268 Figure F.18 SR70 A-3 Soil, Deformation Summary under 20 psi Plate Load at Different Water Table Level ..................................................................................................................................................................... 269 Figure F.19 SR70 A-3 Soil, Deformation Summary under 50 psi Plate Load at Different Water Table Level ..................................................................................................................................................................... 269 Figure F.20 SR-70 A-2-4 Soil, Deformation under 20 psi Plate Load (Water Table at 0.0 in., without Limerock, Test 3-1) ..................................................................................................................................... 274 Figure F.21 SR-70 A-2-4 Soil, Deformation under 20 psi Plate Load (Water Table at +12 in., without Limerock, Test 3-2) ..................................................................................................................................... 274 Figure F.22 SR-70 A-2-4 Soil, Deformation under 50 psi Plate Load (Water Table at +12 in., with Limerock, Test 3-3) ..................................................................................................................................... 275 Figure F.23 SR-70 A-2-4 Soil, Deformation under 50 psi Plate Load (Water Table at +36 in., with Limerock, Test 3-4) ..................................................................................................................................... 275 Figure F.24 SR-70 A-2-4 Soil, Deformation under 50-psi Plate Load (Water Table at –24 in., with Limerock, Test 3-5) ..................................................................................................................................... 276 Figure F.25 SR-70 A-2-4 Soil, Deformation under 50 psi Plate Load (Water Table at –24 in., with Limerock, Test 3-6) ..................................................................................................................................... 276 Figure F.26 SR-70 A-2-4 Soil, Deformation under 50 psi Plate Load (Water Table at +36 in., with Limerock, Test 3-7) ..................................................................................................................................... 277

xiv
Figure F.27 SR70 A-2-4 Soil, Deformation Summary under 20 psi Plate Load at Different Water Table Level ............................................................................................................................................................ 277 Figure F.28 SR70 A-2-4 Soil, Deformation Summary under 50 psi Plate Load at Different Water Table Level ............................................................................................................................................................ 278 Figure F.29 A-2-4 (12%) Soil, Deformation under 20 psi Plate Load (Water Table at -24.0 in., w/out Limerock, Test 4-1) ..................................................................................................................................... 285 Figure F.30 A-2-4 (12%) Soil, Deformation under 20 psi Plate Load (Water Table at -24.0 in., w/out Limerock, Test 4-2) ..................................................................................................................................... 285 Figure F.31 A-2-4 (12%) Soil, Deformation under 20 psi Plate Load (Water Table at 0.0 in., w/out Limerock, Test 4-3) ..................................................................................................................................... 286 Figure F.32 A-2-4 (12%) Soil, Deformation under 20 psi Plate Load (Water Table at 0.0 in., w/out Limerock, Test 4-4) ..................................................................................................................................... 286 Figure F.33 A-2-4 (12%) Soil, Deformation under 20 psi Plate Load (Water Table at +12.0 in., no Limerock, Test 4-5) ..................................................................................................................................... 287 Figure F.34 A-2-4 (12%) Soil, Deformation under 20 psi Plate Load (Water Table at +12.0 in., no Limerock, Test 4-6) ..................................................................................................................................... 287 Figure F.35 A-2-4 (12%) Soil, Deformation under 50 psi Plate Load (Water Table at +12.0 in., with Limerock, Test 4-7) ..................................................................................................................................... 288 Figure F.36 A-2-4 (12%) Soil, Deformation under 50 psi Plate Load (Water Table at +12.0 in., with Limerock, Test 4-8) ..................................................................................................................................... 288 Figure F.37 A-2-4 (12%) Soil, Deformation under 50 psi Plate Load (Water Table at +36.0 in., with Limerock, Test 4-9) ..................................................................................................................................... 289 Figure F.38 A-2-4 (12%) Soil, Deformation under 50 psi Plate Load (Water Table at +36.0 in., with Limerock, Test 4-10) ................................................................................................................................... 289 Figure F.39 A-2-4 (12%) Soil, Deformation Summary under 20 psi Plate Load at Different Water Table Level ............................................................................................................................................................ 290 Figure F.40 A-2-4 (12%) Soil, Deformation Summary under 50 psi Plate Load at Different Water Table Level ............................................................................................................................................................ 290 Figure F.41 A-2-4 (20%) Soil, Deformation under 20 psi Plate Load (Water Table at -24 in., no Limerock, Test 5-1) ...................................................................................................................................................... 297 Figure F.42 A-2-4 (20%) Soil, Deformation under 20 psi Plate Load (Water Table at -24 in., no Limerock, Test 5-2) ...................................................................................................................................................... 297 Figure F.43 A-2-4 (20%) Soil, Deformation under 20 psi Plate Load (Water Table at +0 in., no Limerock, Test 5-3) ...................................................................................................................................................... 298 Figure F.44 A-2-4 (20%) Soil, Deformation under 20 psi Plate Load (Water Table at +0 in., no Limerock, Test 5-4) ...................................................................................................................................................... 298 Figure F.45 A-2-4 (20%) Soil, Deformation under 20 psi Plate Load (Water Table at +12.0 in., no Limerock, Test 4-5) ..................................................................................................................................... 299 Figure F.46 A-2-4 (20%) Soil, Deformation under 20 psi Plate Load (Water Table at +12.0 in., no Limerock, Test 4-6) ..................................................................................................................................... 299 Figure F.47 A-2-4 (20%) Soil, Deformation under 50 psi Plate Load (Water Table at +12.0 in., w/ Limerock, Test 4-7) ..................................................................................................................................... 300 Figure F.48 A-2-4 (20%) Soil, Deformation under 50 psi Plate Load (Water Table at +12.0 in., w/ Limerock, Test 4-8) ..................................................................................................................................... 300 Figure F.49 A-2-4 (20%) Soil, Deformation under 50 psi Plate Load (Water Table at +36.0 in., w/ Limerock, Test 4-9) ..................................................................................................................................... 301 Figure F.50 A-2-4 (20%) Soil, Deformation under 50 psi Plate Load (Water Table at +36.0 in., w/ Limerock, Test 4-10) ................................................................................................................................... 301 Figure F.51 A-2-4 (20%) Soil, Deformation Summary under 20 psi Plate Load at Different Water Table Level ............................................................................................................................................................ 302 Figure F.52 A-2-4 (20%) Soil, Deformation Summary under 50 psi Plate Load at Different Water Table Level ............................................................................................................................................................ 302 Figure F.53 A-2-4 (24%) Soil, Deformation under 20 psi Plate Load (Water Table at -24 in., no Limerock, Test 6-1) ...................................................................................................................................................... 308 Figure F.54 A-2-4 (24%) Soil, Deformation under 20 psi Plate Load (Water Table at -24 in., no Limerock, Test 6-2) ...................................................................................................................................................... 308

xv
Figure F.55 A-2-4 (24%) Soil, Deformation under 20 psi Plate Load (Water Table at +0.0 in., no Limerock, Test 6-3) ...................................................................................................................................................... 309 Figure F.56 A-2-4 (24%) Soil, Deformation under 20 psi Plate Load (Water Table at +0.0 in., no Limerock, Test 6-4) ...................................................................................................................................................... 309 Figure F.57 A-2-4 (24%) Soil, Deformation under 20 psi Plate Load (Water Table at +12.0 in., no Limerock, Test 6-5) ..................................................................................................................................... 310 Figure F.58 A-2-4 (24%) Soil, Deformation under 20 psi Plate Load (Water Table at +12.0 in., no Limerock, Test 6-6) ..................................................................................................................................... 310 Figure F.59 A-2-4 (24%) Soil, Deformation under 50 psi Plate Load (Water Table at +12.0 in., with Limerock, Test 6-7) ..................................................................................................................................... 311 Figure F.60 A-2-4 (24%) Soil, Deformation under 50 psi Plate Load (Water Table at +12.0 in., with Limerock, Test 6-8) ..................................................................................................................................... 311 Figure F.61 A-2-4 (24%) Soil, Deformation under 50 psi Plate Load (Water Table at +36.0 in., with Limerock, Test 6-9) ..................................................................................................................................... 312 Figure F.62 A-2-4 (24%) Soil, Deformation under 50 psi Plate Load (Water Table at +36.0 in., with Limerock, Test 6-10) ................................................................................................................................... 312 Figure F.63 A-2-4 (24%) Soil, Deformation Summary under 20 psi Plate Load at Different Water Table Level ............................................................................................................................................................ 313 Figure F.64 A-2-4 (24%) Soil, Deformation Summary under 50 psi Plate Load at Different Water Table Level ............................................................................................................................................................ 313 Figure F.65 A-2-4 (30%) Soil, Deformation under 20 psi Plate Load (Water Table at -24 in., no Limerock, Test 7-1) ...................................................................................................................................................... 319 Figure F.66 A-2-4 (30%) Soil, Deformation under 20 psi Plate Load (Water Table at +0 in., no Limerock, Test 7-2) ...................................................................................................................................................... 319 Figure F.67 A-2-4 (30%) Soil, Deformation under 20 psi Plate Load (Water Table at +0 in., no Limerock, Test 7-3) ...................................................................................................................................................... 320 Figure F.68 A-2-4 (30%) Soil, Deformation under 20 psi Plate Load (Water Table at +12.0 in., no Limerock, Test 7-4) ..................................................................................................................................... 320 Figure F.69 A-2-4 (30%) Soil, Deformation under 20 psi Plate Load (Water Table at +12.0 in., no Limerock, Test 7-5) ..................................................................................................................................... 321 Figure F.70 A-2-4 (30%) Soil, Deformation under 20 psi Plate Load (Water Table at +12.0 in., no Limerock, Test 7-6) ..................................................................................................................................... 321 Figure F.71 A-2-4 (30%) Soil, Deformation under 50 psi Plate Load (Water Table at +12.0 in., with Limerock, Test 7-7) ..................................................................................................................................... 322 Figure F.72 A-2-4 (30%) Soil, Deformation under 50 psi Plate Load (Water Table at +12.0 in., with Limerock, Test 7-8) ..................................................................................................................................... 322 Figure F.73 A-2-4 (30%) Soil, Deformation under 50 psi Plate Load (Water Table at +36.0 in., with Limerock, Test 7-9) ..................................................................................................................................... 323 Figure F.74 A-2-4 (30%) Soil, Deformation under 50 psi Plate Load (Water Table at +36.0 in., with Limerock, Test 7-10) ................................................................................................................................... 323 Figure F.75 SR70 A-3 Soil, Deformation Summary under 20 psi Plate Load at Different Water Table Level ..................................................................................................................................................................... 324 Figure F.76 SR70 A-3 Soil, Deformation Summary under 50 psi Plate Load at Different Water Table Level ..................................................................................................................................................................... 324 Figure F.77 Oolite Soil, Deformation under 50 psi Plate Load (Water Table at -24 in., w/out Limerock, Test 8-1) .............................................................................................................................................................. 330 Figure F.78 Oolite Soil, Deformation under 50 psi Plate Load (Water Table at +0 in., w/out Limerock, Test 8-2) .............................................................................................................................................................. 330 Figure F.79 Oolite Soil, Deformation under 50 psi Plate Load (Water Table at +0 in., w/out Limerock, Test 8-3) .............................................................................................................................................................. 331 Figure F.80 Oolite Soil, Deformation under 50 psi Plate Load (Water Table at +12.0 in., w/out Limerock, Test 8-4) ...................................................................................................................................................... 331 Figure F.81 Oolite Soil, Deformation under 50 psi Plate Load (Water Table at +12.0 in., w/out Limerock, Test 8-5) ...................................................................................................................................................... 332 Figure F.82 Oolite Soil, Deformation under 50 psi Plate Load (Water Table at +12.0 in., w/out Limerock, Test 8-6) ...................................................................................................................................................... 332

xvi
Figure F.83 Oolite Soil, Deformation under 50 psi Plate Load (Water Table at +12.0 in., w/out Limerock, Test 8-7) ...................................................................................................................................................... 333 Figure F.84 Oolite Soil, Deformation under 50 psi Plate Load (Water Table at +12.0 in., w/ Limerock, Test 8-8) .............................................................................................................................................................. 333 Figure F.85 Oolite Soil, Deformation under 50 psi Plate Load (Water Table at +12.0 in., w/ Limerock, Test 8-9) .............................................................................................................................................................. 334 Figure F.86 Oolite Soil, Deformation under 50 psi Plate Load (Water Table at +36.0 in., w/ Limerock, Test 8-10) ............................................................................................................................................................ 334 Figure F.87 Oolite Soil, Deformation under 50 psi Plate Load (Water Table at +36.0 in., w/ Limerock, Test 8-11) ............................................................................................................................................................ 335 Figure F.88 Oolite A-1 Soil, Deformation Summary under 50 psi Plate Load at Different Water Table Level ............................................................................................................................................................ 335 Figure F.89 Spring Cemetery A-2-4 (15%) Soil, Deformation under 20 psi Plate Load (Water Table at 0.0 in., w/out Limerock, Test 9-1) ..................................................................................................................... 348 Figure F.90 Spring Cemetery A-2-4 (15%) Soil, Deformation under 20 psi Plate Load (Water Table at 0.0 in., w/out Limerock, Test 9-2) ..................................................................................................................... 348 Figure F.91 Spring Cemetery A-2-4 (15%) Soil, Deformation under 20 psi Plate Load (Water Table at 0.0 in., w/out Limerock, Test 9-3) ..................................................................................................................... 349 Figure F.92 Spring Cemetery A-2-4 (15%) Soil, Deformation under 20 psi Plate Load (Water Table at 12 in., w/out Limerock, Test 9-4) ..................................................................................................................... 349 Figure F.93 Spring Cemetery A-2-4 (15%) Soil, Deformation under 20 psi Plate Load (Water Table at 12 in., w/out Limerock, Test 9-5) ..................................................................................................................... 350 Figure F.94 Spring Cemetery A-2-4 (15%) Soil, Deformation under 20 psi Plate Load (Water Table at 12 in., w/out Limerock, Test 9-6) ..................................................................................................................... 350 Figure F.95 Spring Cemetery A-2-4 (15%) Soil, Deformation under 20 psi Plate Load (Water Table at 24 in., w/out Limerock, Test 9-7) ..................................................................................................................... 351 Figure F.96 Spring Cemetery A-2-4 (15%) Soil, Deformation under 20 psi Plate Load (Water Table at 24 in., w/out Limerock, Test 9-8) ..................................................................................................................... 351 Figure F.97 Spring Cemetery A-2-4 (15%) Soil, Deformation under 20 psi Plate Load (Water Table at 24 in., w/out Limerock, Test 9-9) ..................................................................................................................... 352 Figure F.98 Spring Cemetery A-2-4 (15%) Soil, Deformation under 50 psi Plate Load (Water Table at 0.0 in., w/ Limerock, Test 9-10) ........................................................................................................................ 352 Figure F.99 Spring Cemetery A-2-4 (15%) Soil, Deformation under 50 psi Plate Load (Water Table at 0.0 in., w/ Limerock, Test 9-11) ........................................................................................................................ 353 Figure F.100 Spring Cemetery A-2-4 (15%) Soil, Deformation under 50 psi Plate Load (Water Table at 0.0 in., w/ Limerock, Test 9-12) ........................................................................................................................ 353 Figure F.101 Spring Cemetery A-2-4 (15%) Soil, Deformation under 50 psi Plate Load (Water Table at 0.0 in., w/ Limerock, Test 9-13) ........................................................................................................................ 354 Figure F.102 Spring Cemetery A-2-4 (15%) Soil, Deformation under 50 psi Plate Load (Water Table at 0.0 in., w/ Limerock, Test 9-14) ........................................................................................................................ 354 Figure F.103 Spring Cemetery A-2-4 (15%) Soil, Deformation under 50 psi Plate Load (Water Table at 0.0 in., w/ Limerock, Test 9-15) ........................................................................................................................ 355 Figure F.104 Spring Cemetery A-2-4 (15%) Soil, Deformation under 50 psi Plate Load (Water Table at 0.0 in., w/ Limerock, Test 9-16) ........................................................................................................................ 355 Figure F.105 Spring Cemetery A-2-4 (15%) Soil, Deformation under 50 psi Plate Load (Water Table at 0.0 in., w/ Limerock, Test 9-17) ........................................................................................................................ 356 Figure F.106 Spring Cemetery A-2-4 (15%) Soil, Deformation under 50 psi Plate Load (Water Table at 0.0 in., w/ Limerock, Test 9-18) ........................................................................................................................ 356 Figure F.107 Spring Cemetery A-2-4 (15%) Soil, Deformation under 50 psi Plate Load (Water Table at 0.0 in., w/ Limerock, Test 9-19) ........................................................................................................................ 357 Figure F.108 Spring Cemetery A-2-4 (15%) Soil, Deformation under 50 psi Plate Load (Water Table at 0.0 in., w/ Limerock, Test 9-20) ........................................................................................................................ 357 Figure F.109 Spring Cemetery A-2-4 (15%) Soil, Deformation under 50 psi Plate Load (Water Table at 0.0 in., w/ Limerock, Test 9-21) ........................................................................................................................ 358 Figure F.110 Spring Cemetery A-2-4 (15%) Soil, Deformation under 50 psi Plate Load (Water Table at 0.0 in., w/ Limerock, Test 9-22) ........................................................................................................................ 358

xvii
Figure F.111 Spring Cemetery A-2-4 (15%) Soil, Deformation under 50 psi Plate Load (Water Table at 0.0 in., w/ Limerock, Test 9-23) ........................................................................................................................ 359 Figure F.112 Spring Cemetery A-2-4 (15%) Soil, Deformation under 50 psi Plate Load (Water Table at 0.0 in., w/ Limerock, Test 9-24) ........................................................................................................................ 359 Figure F.113 Spring Cemetery A-2-4 (15%) Soil, Deformation under 50 psi Plate Load (Water Table at 0.0 in., w/ Limerock, Test 9-25) ........................................................................................................................ 360 Figure F.114 Spring Cemetery A-2-4 (15%) Soil, Deformation under 50 psi Plate Load (Water Table at 0.0 in., w/ Limerock, Test 9-26) ........................................................................................................................ 360 Figure F.115 Spring Cemetery A-2-4 (15%) Soil, Deformation under 50 psi Plate Load (Water Table at 0.0 in., w/ Limerock, Test 9-27) ........................................................................................................................ 361 Figure F.116 Spring Cemetery A-2-4 Soil, Deformation Summary under 20 psi Plate Load at Different Water Table Level ....................................................................................................................................... 361 Figure F.117 Spring Cemetery A-2-4 Soil, Deformation Summary under 50 psi Plate Load at Different Water Table Level ....................................................................................................................................... 362 Figure F.118 Branch A-2-4 (23%) Soil, Deformation under 20 psi Plate Load (Water Table at 0.0 in., w/out Limerock, Test 10-1) ......................................................................................................................... 375 Figure F.119 Branch A-2-4 (23%) Soil, Deformation under 20 psi Plate Load (Water Table at 0.0 in., w/out Limerock, Test 10-2) ......................................................................................................................... 375 Figure F.120 Branch A-2-4 (23%) Soil, Deformation under 20 psi Plate Load (Water Table at 0.0 in., w/out Limerock, Test 10-3) ......................................................................................................................... 376 Figure F.121 Branch A-2-4 (23%) Soil, Deformation under 20 psi Plate Load (Water Table at 0.0 in., w/out Limerock, Test 10-4) ......................................................................................................................... 376 Figure F.122 Branch A-2-4 (23%) Soil, Deformation under 20 psi Plate Load (Water Table at 12 in., w/out Limerock, Test 10-5) ................................................................................................................................... 377 Figure F.123 Branch A-2-4 (23%) Soil, Deformation under 20 psi Plate Load (Water Table at 12 in., w/out Limerock, Test 10-6) ................................................................................................................................... 377 Figure F.124 Branch A-2-4 (23%) Soil, Deformation under 20 psi Plate Load (Water Table at 12 in., w/out Limerock, Test 10-7) ................................................................................................................................... 378 Figure F.125 Branch A-2-4 (23%) Soil, Deformation under 20 psi Plate Load (Water Table at 12 in., w/out Limerock, Test 10-8) ................................................................................................................................... 378 Figure F.126 Branch A-2-4 (23%) Soil, Deformation under 20 psi Plate Load (Water Table at 24 in., w/out Limerock, Test 10-9) ................................................................................................................................... 379 Figure F.127 Branch A-2-4 (23%) Soil, Deformation under 20 psi Plate Load (Water Table at 24 in., w/out Limerock, Test 10-10) ................................................................................................................................. 379 Figure F.128 Branch A-2-4 (23%) Soil, Deformation under 20 psi Plate Load (Water Table at 24 in., w/out Limerock, Test 10-11) ................................................................................................................................. 380 Figure F.129 Branch A-2-4 (23%) Soil, Deformation under 50 psi Plate Load (Water Table at 0.0 in., w/ Limerock, Test 10-12) ................................................................................................................................. 380 Figure F.130 Branch A-2-4 (23%) Soil, Deformation under 50 psi Plate Load (Water Table at 0.0 in., w/out Limerock, Test 10-13) ....................................................................................................................... 381 Figure F.131 Branch A-2-4 (23%) Soil, Deformation under 50 psi Plate Load (Water Table at 0.0 in., w/ Limerock, Test 10-14) ................................................................................................................................. 381 Figure F.132 Branch A-2-4 (23%) Soil, Deformation under 50 psi Plate Load (Water Table at 12 in., w/out Limerock, Test 10-15) ................................................................................................................................. 382 Figure F.133 Branch A-2-4 (23%) Soil, Deformation under 50 psi Plate Load (Water Table at 12 in., w/ Limerock, Test 10-16) ................................................................................................................................. 382 Figure F.134 Branch A-2-4 (23%) Soil, Deformation under 50 psi Plate Load (Water Table at 12 in., w/out Limerock, Test 10-17) ................................................................................................................................. 383 Figure F.135 Branch A-2-4 (23%) Soil, Deformation under 50 psi Plate Load (Water Table at 24 in., w/ Limerock, Test 10-18) ................................................................................................................................. 383 Figure F.136 Branch A-2-4 (23%) Soil, Deformation under 50 psi Plate Load (Water Table at 24 in., w/out Limerock, Test 10-19) ................................................................................................................................. 384 Figure F.137 Branch A-2-4 (23%) Soil, Deformation under 50 psi Plate Load (Water Table at 24 in., w/ Limerock, Test 10-20) ................................................................................................................................. 384 Figure F.138 Branch A-2-4 (23%) Soil, Deformation under 50 psi Plate Load (Water Table at 24 in., w/out Limerock, Test 10-21) ................................................................................................................................. 385

xviii
Figure F.139 Branch A-2-4 (23%) Soil, Deformation under 50 psi Plate Load (Water Table at 36 in., w/ Limerock, Test 10-22) ................................................................................................................................. 385 Figure F.140 Branch A-2-4 (23%) Soil, Deformation under 50 psi Plate Load (Water Table at 36 in., w/out Limerock, Test 10-23) ................................................................................................................................. 386 Figure F.141 Branch A-2-4 (23%) Soil, Deformation under 50 psi Plate Load (Water Table at 36 in, w/ Limerock, Test 10-24) ................................................................................................................................. 386 Figure F.142 Branch A-2-4 (23%) Soil, Deformation under 50 psi Plate Load (Water Table at 24 in. (Drawdown), w/out Limerock, Test 10-25) ................................................................................................. 387 Figure F.143 Branch A-2-4 (23%) Soil, Deformation under 50 psi Plate Load (Water Table at 24 in. Drawdown), w/ Limerock, Test 10-26) ....................................................................................................... 387 Figure F.144 Branch A-2-4 (23%) Soil, Deformation under 50 psi Plate Load (Water Table at 24 in. (Drawdown), w/out Limerock, Test 10-27) ................................................................................................. 388 Figure F.145 Branch A-2-4 (23%) Soil, Deformation under 50 psi Plate Load (Water Table at 12 in. (Drawdown), w/ Limerock, Test 10-28) ...................................................................................................... 388 Figure F.146 Branch A-2-4 (23%) Soil, Deformation under 50 psi Plate Load (Water Table at 24 in. (Drawdown), w/out Limerock, Test 10-27) ................................................................................................. 389 Figure F.147 Branch A-2-4 (23%) Soil, Deformation under 50 psi Plate Load (Water Table at 12 in. (Drawdown), w/ Limerock, Test 10-28) ...................................................................................................... 389 Figure F.148 Branch A-2-4 Soil, Deformation Summary under 20 psi Plate Load at Different Water Table Level ............................................................................................................................................................ 390 Figure F.149 Branch A-2-4 Soil, Deformation Summary under 50 psi Plate Load at Different Water Table Level ............................................................................................................................................................ 390 Figure F.150 Iron Bridge A-2-6 (31%) Soil, Deformation under 20 psi Plate Load (Water Table at 0.0 in., w/out Limerock, Test 11-1) ......................................................................................................................... 403 Figure F.151 Iron Bridge A-2-6 (31%) Soil, Deformation under 20 psi Plate Load (Water Table at 0.0 in., w/out Limerock, Test 11-2) ......................................................................................................................... 403 Figure F.152 Iron Bridge A-2-6 (31%) Soil, Deformation under 20 psi Plate Load (Water Table at 0.0 in., w/out Limerock, Test 11-3) ......................................................................................................................... 404 Figure F.153 Iron Bridge A-2-6 (31%) Soil, Deformation under 20 psi Plate Load (Water Table at 0.0 in., w/out Limerock, Test 11-4) ......................................................................................................................... 404 Figure F.154 Iron Bridge A-2-6 (31%) Soil, Deformation under 20 psi Plate Load (Water Table at 12 in., w/out Limerock, Test 11-5) ......................................................................................................................... 405 Figure F.155 Iron Bridge A-2-6 (31%) Soil, Deformation under 20 psi Plate Load (Water Table at 12 in., w/out Limerock, Test 11-6) ......................................................................................................................... 405 Figure F.156 Iron Bridge A-2-6 (31%) Soil, Deformation under 20 psi Plate Load (Water Table at 12 in., w/out Limerock, Test 11-7) ......................................................................................................................... 406 Figure F.157 Iron Bridge A-2-6 (31%) Soil, Deformation under 20 psi Plate Load (Water Table at 24 in., w/out Limerock, Test 11-8) ......................................................................................................................... 406 Figure F.158 Iron Bridge A-2-6 (31%) Soil, Deformation under 20 psi Plate Load (Water Table at 24 in., w/out Limerock, Test 11-9) ......................................................................................................................... 407 Figure F.159 Iron Bridge A-2-6 (31%) Soil, Deformation under 20 psi Plate Load (Water Table at 24 in., w/out Limerock, Test 11-10) ....................................................................................................................... 407 Figure F.160 Iron Bridge A-2-6 (31%) Soil, Deformation under 50 psi Plate Load (Water Table at 0.0 in., w/ Limerock, Test 11-11) ............................................................................................................................ 408 Figure F.161 Iron Bridge A-2-6 (31%) Soil, Deformation under 50 psi Plate Load (Water Table at 0.0 in., w/ Limerock, Test 11-12) ............................................................................................................................ 408 Figure F.162 Iron Bridge A-2-6 (31%) Soil, Deformation under 50 psi Plate Load (Water Table at 0.0 in., w/ Limerock, Test 11-13) ............................................................................................................................ 409 Figure F.163 Iron Bridge A-2-6 (31%) Soil, Deformation under 50 psi Plate Load (Water Table at 12 in., w/ Limerock, Test 11-14) ............................................................................................................................ 409 Figure F.164 Iron Bridge A-2-6 (31%) Soil, Deformation under 50 psi Plate Load (Water Table at 12 in., w/ Limerock, Test 11-15) ............................................................................................................................ 410 Figure F.165 Iron Bridge A-2-6 (31%) Soil, Deformation under 50 psi Plate Load (Water Table at 12 in., w/ Limerock, Test 11-16) ............................................................................................................................ 410 Figure F.166 Iron Bridge A-2-6 (31%) Soil, Deformation under 50 psi Plate Load (Water Table at 24 in., w/ Limerock, Test 11-17) ............................................................................................................................ 411

xix
Figure F.167 Iron Bridge A-2-6 (31%) Soil, Deformation under 50 psi Plate Load (Water Table at 24 in., w/ Limerock, Test 11-18) ............................................................................................................................ 411 Figure F.168 Iron Bridge A-2-6 (31%) Soil, Deformation under 50 psi Plate Load (Water Table at 24 in., w/ Limerock, Test 11-19) ............................................................................................................................ 412 Figure F.169 Iron Bridge A-2-6 (31%) Soil, Deformation under 50 psi Plate Load (Water Table at 36 in., w/ Limerock, Test 11-20) ............................................................................................................................ 412 Figure F.170 Iron Bridge A-2-6 (31%) Soil, Deformation under 50 psi Plate Load (Water Table at 36 in., w/ Limerock, Test 11-21) ............................................................................................................................ 413 Figure F.171 Iron Bridge A-2-6 (31%) Soil, Deformation under 50 psi Plate Load (Water Table at 36 in., w/ Limerock, Test 11-22) ............................................................................................................................ 413 Figure F.172 Iron Bridge A-2-6 (31%) Soil, Deformation under 50 psi Plate Load (Water Table at 24 in. (Drawdown), w/ Limerock, Test 11-23) ...................................................................................................... 414 Figure F.173 Iron Bridge A-2-6 (31%) Soil, Deformation under 50 psi Plate Load (Water Table at 24 in. (Drawdown), w/ Limerock, Test 11-24) ...................................................................................................... 414 Figure F.174 Iron Bridge A-2-6 (31%) Soil, Deformation under 50 psi Plate Load (Water Table at 24 in. (Drawdown), w/ Limerock, Test 11-25) ...................................................................................................... 415 Figure F.175 Iron Bridge A-2-6 (31%) Soil, Deformation under 50 psi Plate Load (Water Table at 12 in. (Drawdown), w/ Limerock, Test 11-26) ...................................................................................................... 415 Figure F.176 Iron Bridge A-2-6 (31%) Soil, Deformation under 50 psi Plate Load (Water Table at 12 in. (Drawdown), w/ Limerock, Test 11-27) ...................................................................................................... 416 Figure F.177 Iron Bridge A-2-6 (31%) Soil, Deformation under 50 psi Plate Load (Water Table at 12 in. (Drawdown), w/ Limerock, Test 11-28) ...................................................................................................... 416 Figure F.178 Iron Bridge A-2-6 Soil, Deformation Summary under 20 psi Plate Load at Different Water Table Level .................................................................................................................................................. 417 Figure F.179 Iron Bridge A-2-6 Soil, Deformation Summary under 50 psi Plate Load at Different Water Table Level .................................................................................................................................................. 417 Figure G.1 Two-layer System ..................................................................................................................... 431 Figure G.2 An n-layer System in Cylindrical Coordinates .......................................................................... 431
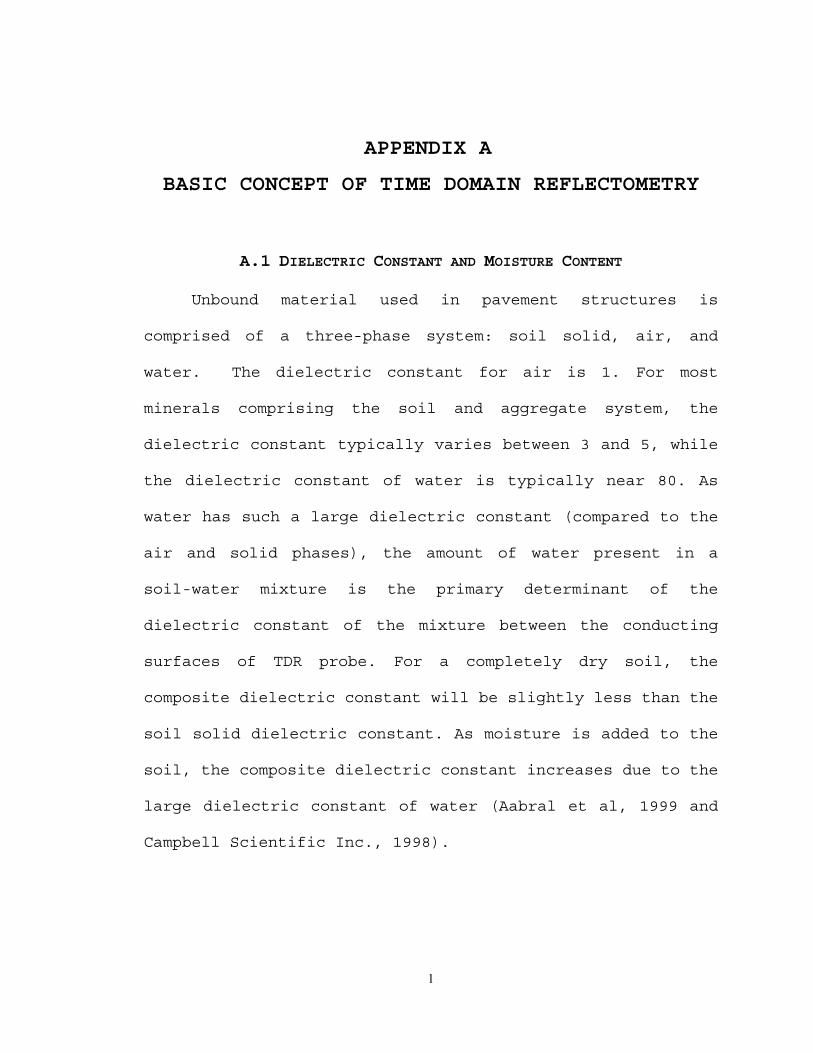
1
APPENDIX A
BASIC CONCEPT OF TIME DOMAIN REFLECTOMETRY
A.1 DIELECTRIC CONSTANT AND MOISTURE CONTENT
Unbound material used in pavement structures is
comprised of a three-phase system: soil solid, air, and
water. The dielectric constant for air is 1. For most
minerals comprising the soil and aggregate system, the
dielectric constant typically varies between 3 and 5, while
the dielectric constant of water is typically near 80. As
water has such a large dielectric constant (compared to the
air and solid phases), the amount of water present in a
soil-water mixture is the primary determinant of the
dielectric constant of the mixture between the conducting
surfaces of TDR probe. For a completely dry soil, the
composite dielectric constant will be slightly less than the
soil solid dielectric constant. As moisture is added to the
soil, the composite dielectric constant increases due to the
large dielectric constant of water (Aabral et al, 1999 and
Campbell Scientific Inc., 1998).
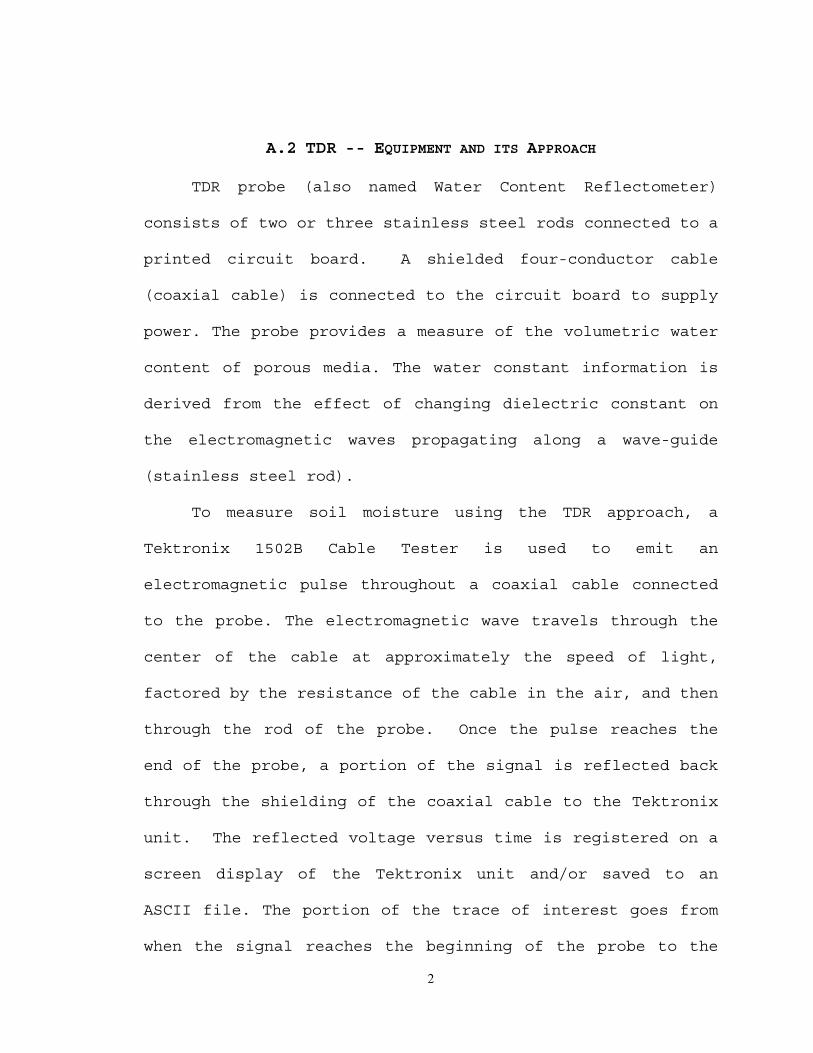
2
A.2 TDR -- EQUIPMENT AND ITS APPROACH
TDR probe (also named Water Content Reflectometer)
consists of two or three stainless steel rods connected to a
printed circuit board. A shielded four-conductor cable
(coaxial cable) is connected to the circuit board to supply
power. The probe provides a measure of the volumetric water
content of porous media. The water constant information is
derived from the effect of changing dielectric constant on
the electromagnetic waves propagating along a wave-guide
(stainless steel rod).
To measure soil moisture using the TDR approach, a
Tektronix 1502B Cable Tester is used to emit an
electromagnetic pulse throughout a coaxial cable connected
to the probe. The electromagnetic wave travels through the
center of the cable at approximately the speed of light,
factored by the resistance of the cable in the air, and then
through the rod of the probe. Once the pulse reaches the
end of the probe, a portion of the signal is reflected back
through the shielding of the coaxial cable to the Tektronix
unit. The reflected voltage versus time is registered on a
screen display of the Tektronix unit and/or saved to an
ASCII file. The portion of the trace of interest goes from
when the signal reaches the beginning of the probe to the

3
point when the signal reaches the end of the probe. A drop
in reflected voltage is seen on the display of the Tektronix
unit when the signal reaches the beginning of TDR probe, due
to the increased resistance of the smaller path in the
printed circuit board, and a significant rise in the
reflected voltage is noticed when the signal reaches the end
of the probe.
The horizontal distance between the initial and final
inflection points of the TDR trace response, as measured by
an oscilloscope, is the travel time of the signal (as the
probe CS615 used in the DHW research). This travel time
represents the apparent length (La) of the TDR response.
Knowledge of the actual probe length and signal speed
permits a calculation of an "apparent dielectric constant"
(Ka) of the media into which the TDR probe is inserted.
The computed dielectric constant is referred to as the
"apparent dielectric constant" (Ka) and is defined as
follows:
Ka=((La)/(L)(Vp))2 =((B-A)/(L)(Vp))
2 (A-1)
Where,
Ka: dielectric constant
La: (B-A) =apparent length of the probe (m)
B = final inflection point
A = initial inflection point

4
L = actual length of probe (m)
Vp = the ratio of the actual propagation
velocity to the speed of light
On TDR cable tester, the phase velocity setting is
usually 0.99 for maximum resolution. Once the Ka is computed
for a specific soil mixture, a correlation equation is used
to predict the volumetric content (Campbell Scientific Inc.,
1998).
A.3 OTHER FACTORS AFFECTING DIELECTRIC CONSTANT
Although volumetric water content exerts a dominant
influence upon the dielectric constant, still there are
other factors that can affect Ka value. They are:
A.3.1 Soil mineral dielectric constant variability
Generally, fine- and coarse-grained soils have
distinctly different mineral compositions. Fine-grained
soils are primarily comprised of magnesium and calcium,
while coarse-grained soil predominately contains silica and
quartz. With fine-grained soils’ dielectric constant being 4
and coarse-grained soils’ being 8, this generates a
relatively large variation in dielectric value.

5
A.3.2 Water Constant Variability Factor
This includes the influence of free versus bound water
in soil. In some cases this is important because absorbed
water has a lower dielectric constant than free water. For
example, when volumetric moisture content falls below 5
percent, the dielectric constant is increasingly influenced
by the soil type and mineralogy (in this case, bound water
constitutes a big part of total volumetric water content).
A.3.3 Saline Conditions
This is another key factor in establishing the
dielectric constant. When a saline solution is added in the
area where the TDR probe is located, a short-circuiting
occurs to the probe, thus making the final TDR response
difficult to interpret.
A.3.4 Temperature Effects
Some research found that when water content is very
high and the electromagnetic wave travels in a higher
frequency, the difference in temperature can generate a big
difference for the test results (Campbell Scientific Inc.,
1998).
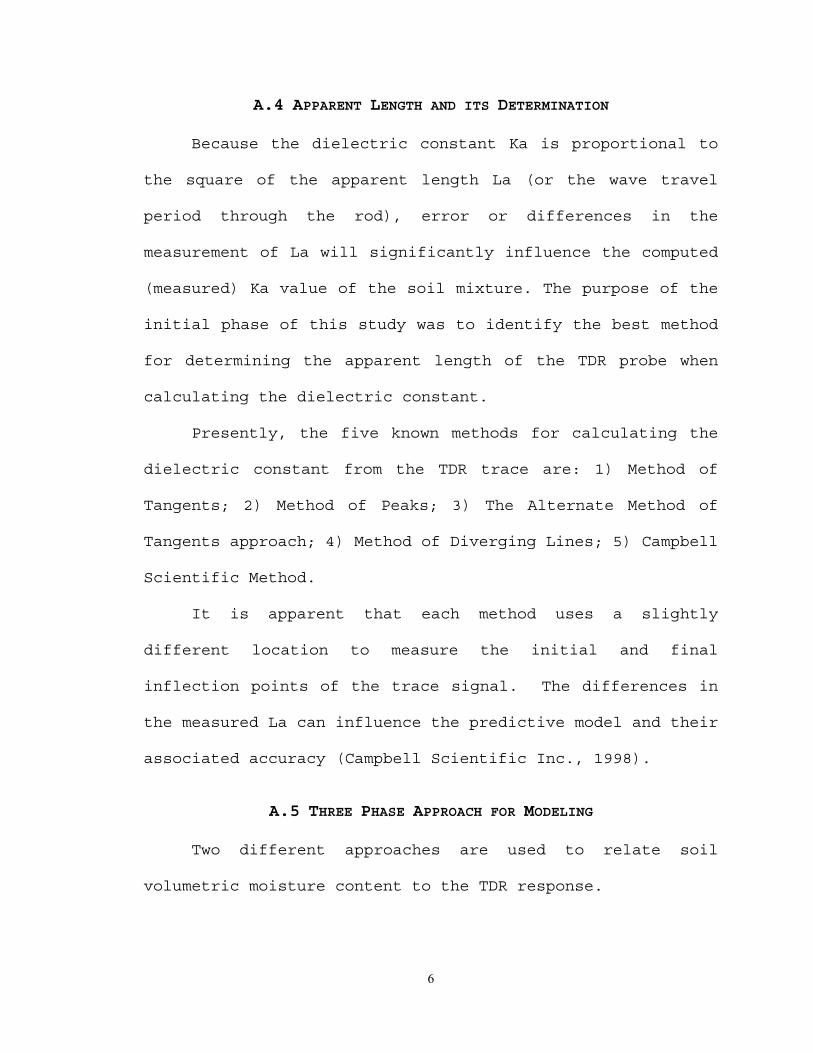
6
A.4 APPARENT LENGTH AND ITS DETERMINATION
Because the dielectric constant Ka is proportional to
the square of the apparent length La (or the wave travel
period through the rod), error or differences in the
measurement of La will significantly influence the computed
(measured) Ka value of the soil mixture. The purpose of the
initial phase of this study was to identify the best method
for determining the apparent length of the TDR probe when
calculating the dielectric constant.
Presently, the five known methods for calculating the
dielectric constant from the TDR trace are: 1) Method of
Tangents; 2) Method of Peaks; 3) The Alternate Method of
Tangents approach; 4) Method of Diverging Lines; 5) Campbell
Scientific Method.
It is apparent that each method uses a slightly
different location to measure the initial and final
inflection points of the trace signal. The differences in
the measured La can influence the predictive model and their
associated accuracy (Campbell Scientific Inc., 1998).
A.5 THREE PHASE APPROACH FOR MODELING
Two different approaches are used to relate soil
volumetric moisture content to the TDR response.

7
(1) The first approach is empirical. It selects
functional relationships based on their mathematical
flexibility to fit the experimental data points. This
modeling approach is used for the TDR probes equipped in
research work of Design Highwater Clearances.
(2) The second approach derives a mechanistic of
fundamental equation from the dielectric mixing models. The
fundamental equation relates the composite dielectric number
of a multiphase mixture to the dielectric numbers and volume
fractions of its constituents. In this approach, the soil is
considered to be a three-phase mixture of soil, water, and
air. Using the volumetric properties of the soil, such as
dry density and specific gravity, in addition to the
dielectric values of water and air, a mixing model can be
derived. The following derivation separates the soil’s
elements to assume a mixing/composite model of the form:
∑∑=
i
iia V
Vk
αα ε
(A-2)
Where:
Vi = Volume of the ith Material Phase.
εi = Dielectric Constant of the ith Material.
a = Assumed Power Coefficient.
Letting Vt =ΣVi
Kaα =(Vs/Vt)εsα+(Va/Vt)εaα+(Vw/Vt)εwα

8
For a soil mixture: ‘s’=Solid, ‘a’=Air, ‘w’=Water)
Vs/Vt = Ws/GsγwVt = γd/Gsγw = Vs (%)
Since, εa = 1 (Dielectric Constant of Air)
ααα εεγ
γwwas
ws
da VV
GK (%)(%) ++= (A-3)
Where,
Va(%) = Va/Vt (Volumetric Air Content)
Vw(%) = Vw/Vt (Volumetric Water Content)
Also, [ ](%)(%)1(%) wsa VVV +−= (A-4)
ααα εεγ
γwwwss
ws
da VVV
GK (%)(%)(%)1 +−−+= (A-5)
1)1(%)()1( +−+−= ααα εεγ
γwws
ws
da V
GK (A-6)
2
⎟⎟⎠
⎞⎜⎜⎝
⎛=
pp
aa VL
LK (A-7)
Assume α = 0.5; Use FHWA standard TDR length Lp = 0.203m,
Vp = Velocity of Propagation (0.99). Then:
( ) ( )( )1
115(%)
−
−−−=
w
ws
dsa
wG
LV
εγ
γε (A-8)
Or:
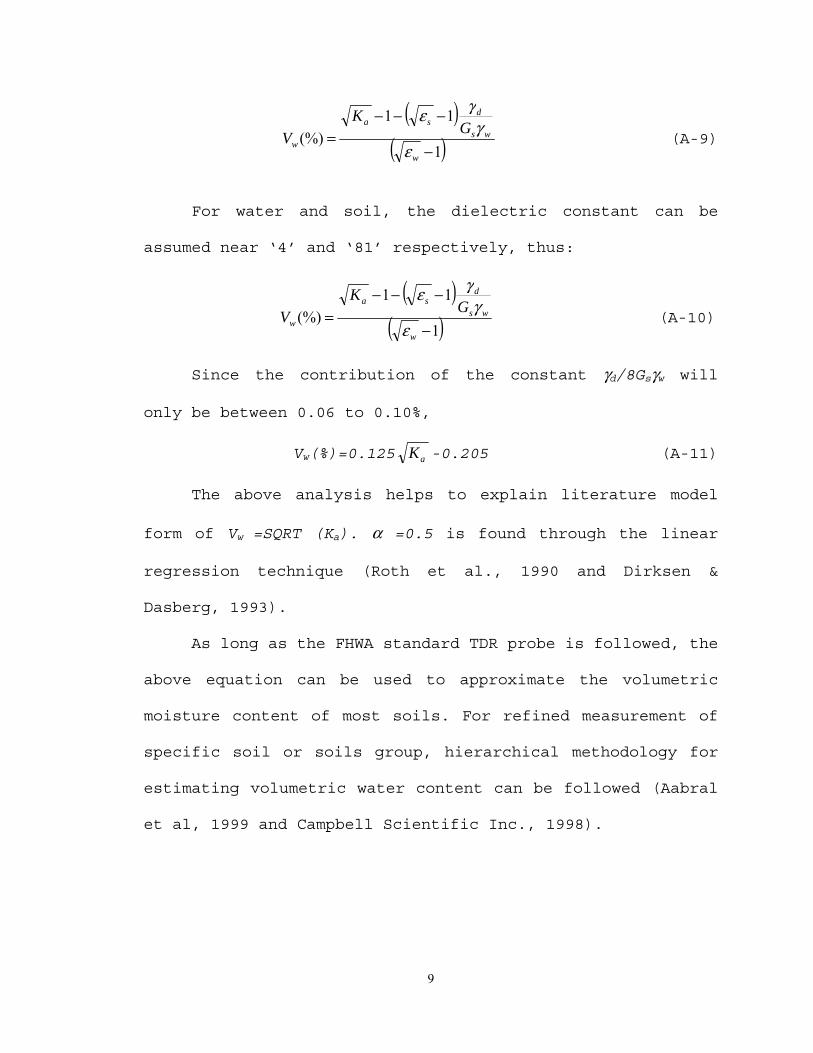
9
( )( )1
11(%)
−
−−−=
w
ws
dsa
wG
KV
εγ
γε (A-9)
For water and soil, the dielectric constant can be
assumed near ‘4’ and ‘81’ respectively, thus:
( )( )1
11(%)
−
−−−=
w
ws
dsa
wG
KV
εγ
γε (A-10)
Since the contribution of the constant γd/8Gsγw will
only be between 0.06 to 0.10%,
Vw(%)=0.125 aK -0.205 (A-11)
The above analysis helps to explain literature model
form of Vw =SQRT (Ka). α =0.5 is found through the linear
regression technique (Roth et al., 1990 and Dirksen &
Dasberg, 1993).
As long as the FHWA standard TDR probe is followed, the
above equation can be used to approximate the volumetric
moisture content of most soils. For refined measurement of
specific soil or soils group, hierarchical methodology for
estimating volumetric water content can be followed (Aabral
et al, 1999 and Campbell Scientific Inc., 1998).

10
A.6 HIERARCHICAL METHODOLOGY FOR ESTIMATING VOLUMETRIC MOISTURE
CONTENT
According to the 28 soils tested covering most of the
groupings of the AASHTO classification, these hierarchical
levels were defined by:
Each individual soil (level 1);
Each soil classification (level 2);
Coarse- and fine-grained group (level 3);
All soils grouped together to develop a universal model
for all application (level 4).
Level 1: This is the most accurate level. This approach
is based on a site-specific calibrated soil. A calibration
curve would be developed using varying moisture levels for
each soil for which volumetric moisture is needed. Once the
apparent length of TDR response (or travel time on the TDR
guide rod in our case) is measured, the predicted volumetric
moisture can be calculated.
Level 2: This is more specific and detailed in that the
volumetric moisture content is based on the AASHTO soil
classification.
Level 3: Approach adopted in this level could determine
the volumetric moisture content when soil can be defined as

11
either coarse- or fine-grained. For granular soil, this
estimation can generate considerable accuracy.
Level 4: This approach is recommended as it is suitable
for measuring the volumetric moisture content of a soil in
just about any circumstance. When no information is
available for a specific soil calibration, a close
approximation is all that is needed in many applications.
The modeling approach of the granular subgrade soils in
design high water clearance research work rests upon Level
3. For those sandy soils in Florida, this can produce
enough accuracy (Aabral et al, 1999 and Campbell Scientific
Inc., 1998).
12
APPENDIX B
FIELD MONITORING PROGRAM
B.1 GENERAL
The main purpose for the implementation of a field
monitoring test on SR-70 is to evaluate the capillary
behavior and moisture variation within SR-70 subgrades (A-3,
A-2-4) under actual field geologic strata. Being exposed to
the open environment, environmental factors such as
precipitation and atmospheric temperature will be introduced
into the moisture data measurement of SR-70 subgrades for
the design highwater research.
Two test sites were selected with SR-70 A-2-4 and A-3
subgrade soils present at both pavement profiles. The close
proximity of the test sites (300 ft. apart) helped achieve
an easy deployment of test equipment and communication.
B.2 FIELD INSTALLATION
The field installation began on March 7, 2000, and was
accomplished within a three-day period. After the excavation
of the field test pit, CS615 TDR probes were inserted into

13
the pit walls in a manner shown in Figure B.1. A plan view
of the equipment layout in the test area is illustrated in
Figure B.2. The photo view of the TDR probe installation
together with the pavement profile is shown in Figure B.3.
The pits were back filled and compacted in accordance with
its original geologic strata after the TDR probes were put
in place. A small amount of porous concrete was mixed into
the backfill to ensure the original subgrade compacted-
consolidated situation.
Upon completion of field installation, subsoil
exploration was conducted near the pit sites. The results of
the soil boring adjacent to both pits’ location are
summarized in Table B.1.
B.3 FIELD INSTRUMENTATION
The instruments for field monitoring consisted of a
Campbell Scientific CS615 water content reflectometer (TDR
probe), a Campbell Scientific CR10x datalogger (measurement
and control unit), a rain gauge, a SC12R cable, and an in-
lab remote control terminal. The Campbell Scientific CS615
water content reflectometer (TDR probe) provides a measure
of the volumetric water content for porous media like sandy
soil. The output of an on-site installed CS615 reflectometer

14
is a square wave and can be connected to the Campbell
Scientific CR10x datalogger. A more detailed description of
this equipment can be found in Chapter 3 and Appendix A.
The Campbell Scientific CR10x Datalogger (measurement
and control unit) powered by a solar power system, is the
major part of the field instrumentation. It consists of a
measurement and control module and a detachable wiring
panel. Protected in a sealed stainless steel box, this data
logger functioned as a measurement and control unit for the
sensor measurement, communication, data reduction,
data/program storage and control. The maximum rate for the
unit to execute its program is 64 times per second (enough
for a 15-minute interval data acquisition period in a field
test). The wiring panel consisted of a baseplate, an end
bracket, and a top panel. The top panel provided screw
terminals for the sensor connection.
A rain gauge installed near the test site facilitated
the precipitation record for the evaluation of moisture
variation within the subgrade. The data acquisition interval
was also 15 minutes and activated in synchrony with the data
logger. Its photo illustration is shown in Figure B.4.
The SC12R is a rugged, temperature-resistant cable that
connects peripherals to the CR10X measurement and control
unit.

15
The in-lab remote control terminal installed with
PC208W2.3 software has the remote access to the data storage
unit on the test site (non-volatile flash memory or battery-
backed RAM for CR10X) through a public-telephone
communication system. PC208W2.3 software can initiate
connection, data transfer, data display, data storage from
CR10X on the test site to a remote control computer in the
lab. It also facilitates the re-programming of the
datalogger (CR10X) from the terminal. The in-lab data
acquisition was performed once a week.
B.4 DATA REDUCTION
Moisture data in each elevation of the pits were
acquired weekly from the datalogger (CR10X) on site through
a telephone line by activating PC208W2.3 software. The
initial moisture data were recorded by the TDR probe in the
form of volumetric water content (θ ). With the dry density
( dγ ) acquired in corresponding layers through the site
exploration, it was converted into gravimetric water content
through the following equation:
d
w
d
ww
s
w
VV
MMw
γθγ
γγ ×=
××==(%) (B-1)
Where,

16
Mw = Mass of Water
Ms = Mass of Soil Solid
γw = Density of Water
γd = Dry Density of Soil
The above moisture result can be converted further into
degrees of saturation (S) through the equation below:
dsw
ds
GwG
Sγγ
γ−
=(%) (B-2)
Where,
Gs = Specific Gravity of Soil Solid
W = Moisture Content
For the moisture analysis on a daily basis, moisture
and precipitation data were recorded every 15 minutes in the
field and were then averaged to present data on a 24-hour
basis.
The timing of the datalogger is not in the form of a
calendar, rather it was demonstrated through a three-digit
number. This can be translated into a specific date
(Mo./Date/Yr.) by referring to the CR10X manual. The data
reduction process of the field test correlated the date of
the season and the precipitation with the moisture profile
obtained by TDR probes in the pavement of the test sites.

17
Table B.1 Summary of Soil Boring Results on Field Test Sites SR-70 West Site (Pit No.1)
Depth (ft)
SPT Blows (Dry density, pcf)
Material Description
-200% Passing
AASHTO Classifica-
tion Remarks
0.5 3
Gray Sand 8 A-3 0-0.3 Asphalt
0.3-2.7 Gray Sand
1.0 4 (87.4)
1.5 6 (86.2)
2.0 6 (82.1) Gray Sand
into Hardpan 6 A-3 2.5 7 (89.8)
3.0 8 (82.6)
3.5 5 (79.3) Hardpan into Tan sand
9 A-3 2.7-4.1 Hardpan
& Organic Material
4.0 4 (89.6)
4.5 5 (94.5)
5.0 7 (87.2) Tan Sand into Gray Slightly Silty Sand
16 A-2-4 4.1-5.7 Slightly
Silty Sand 5.5 5 (100.4)
6.0 4 (96.7)
6.5 7 (87.6) Gray Slightly Silty Sand
13 A-2-4
5.7-10.0 Tan Sand
7.0 6 (88.9)
7.5 7 (87.6)
8.0 4
Tan Sand 5 A-3 8.5 5
9.0 6
SR-70 West Site (Pit No.2)
Depth (ft)
SPT Blows (Dry density, pcf)
Material Description
-200% Passing
AASHTO Classifica-
tion Remarks
0.5
Gray Sand 8 A-3 0-0.3 Asphalt 0.3-3.3 Dark to Light Gray Sand
1.0 14 (102.3)
1.5 11 (94.6)
2.0 11 (85.1) Gray Sand 7 A-3 2.5 13 (83.8)
3.0 15 (79.8) 3.5 9 (100)
Light Gray Sand into Hardpan
12 A-2-4 3.3-4.8 Hardpan
4.0 9 (92.8)
4.5 10 (99.9)
5.0 5 (81.1) Hardpan into Tan Sand
8 A-3
4.8-8.0 Tan Sand
5.5 8 (85.8)
6.0 8 (100.6)
6.5 6 (91.4)
Tan Sand into Slightly Silty Sand
8 A-3 7.0 7 (91.5)
7.5 8 (89.6)
8.0 9
16 A-2-4 8.5 10 8.0-10.0 Tan Silty Sand 9.0 12

18
Figure B.1 Cross Sectional Sketch of Field Installation
Figure B.2 Plan View of Field Installation near Fort Pierce, Florida
12∗6” = 72”
Pit No.1
TDR Probe
Asphalt Concrete
12∗6” = 72”
Pit No.2
TDR Probe
Asphalt Concrete
300 ft
State Road 70 (SR-70)
SC12R Cable
BrookPond
Pit No.1
Pit No.2
Measurement & Control Unit
Rain Gauge
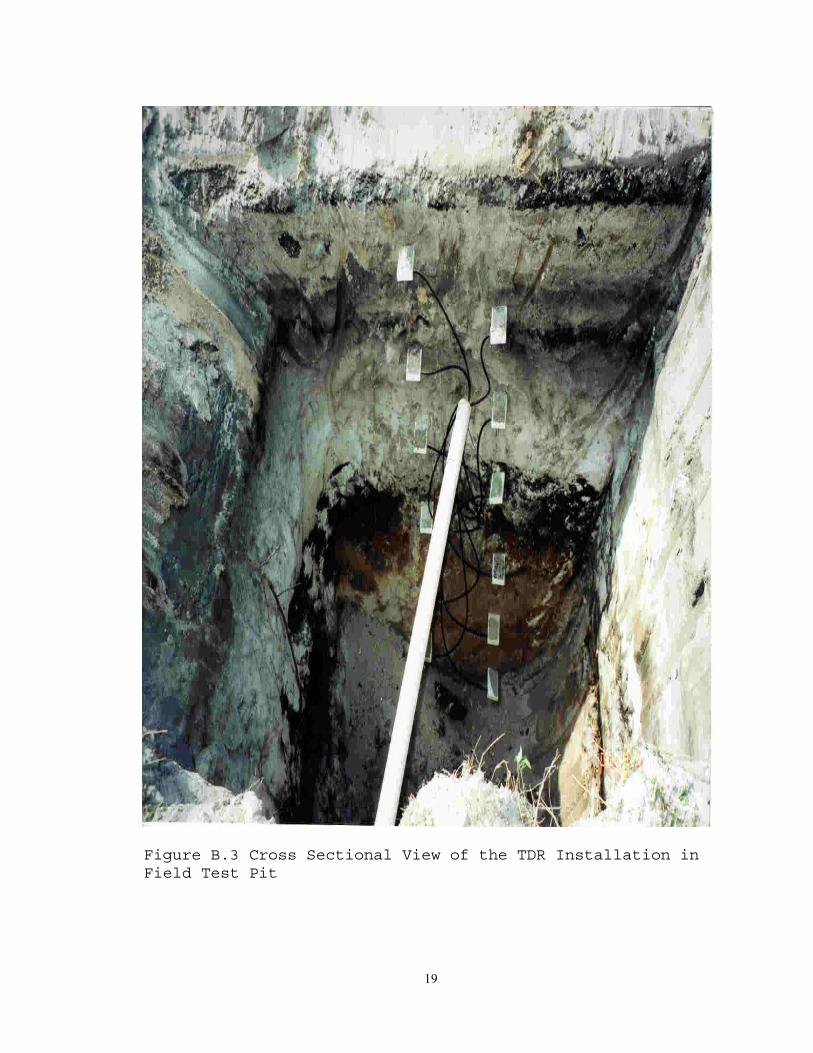
19
Figure B.3 Cross Sectional View of the TDR Installation in Field Test Pit

20
Figure B.4 Rain Gauge Installation in Field Test Sites

21
APPENDIX C
FIELD MONITORING RESULTS
C.1 PRESENTATION OF FIELD MONITORING RESULTS
The moisture and precipitation data were acquired
through the remote control system (PC208) and reprocessed
for analysis. The presentation of the test results was
separated into four seasonal groups representing moisture
variations for the past year. Within each season (from
spring 2000 to winter 2000/2001), the test results were then
grouped together according to different test sites. Since
the moisture profile of the SR-70 subgrade materials was the
main concern of the field test, the presentation of the test
results from field monitoring program was focused on two
main categories:
(1) The influence of rainfall upon the moisture within
each layer of the subgrade for a specific season. These are
illustrated in the figures denoted as “Degree of Saturation
versus Date and Precipitation”.
(2) A continuous moisture variation below the asphalt
concrete pavement for a designated time period. These are
presented in the figures denoted as “Degree of Saturation
versus Depth”, which is in the form of an envelope
encompassing the maximum and minimum degree of saturation

22
along the depth of the subgrade layer for the season in
consideration.
All of the test results are presented in the tables and
figures at the end of Appendix C.
C.2 DISCUSSION ON FIELD MONITORING RESULTS
The following observations were made by evaluating the
field monitoring results:
(1) The moisture change in each soil layer resulting
from temperature variation within a 24-hour period was not
significant.
(2) The A-3 soil with a small percentage of passing
#200 fines was more sensitive to change of precipitation.
The degree of saturation increased significantly with the
rain. It also exhibited faster moisture dissipation after
the rain.
(3) Light rains (with daily precipitation less than 0.7
in.) had no significant effect on the moisture content of
deep soils (i.e., deeper than three feet below the asphalt
concrete layer)
(4) For the deeper A-3 soil above the groundwater
table, there would be an appreciable amount of increase in
moisture content due to heavy rains (with daily
precipitation more than 1.2 in.). The level of moisture

23
increment exceeded all the soil layers above the deep A-3
soil.
(5) The response of moisture increase due to
precipitation was instant but limited for the topsoil, and
slower for deeper soils (with a 24-hour time lag). The
accumulation of moisture was observed to be continuing even
10 days after a heavy rain for deep soils (i. e., the A-3
soil, 6 ft. below the asphalt concrete layer) on test site
No.2.
(6) Precipitation had no significant impact upon the
degree of saturation for the A-2-4 soil.
(7) The hardpan layer and A-2-4 soil layer could
impeded the quick accumulation of moisture for the soil
layer within its adjacent area, but could not stop it from
gaining moisture after 24 hours.
(8) With the exception of heavy rain, the moisture in
hardpan layer was kept stable (degree of saturation about
45%) is spite of the moisture fluctuation in the adjacent
soil layers.
Overall the moisture content within the A-2-4 soil for
a given layer was relatively stable under the climatic
change. However, the moisture content within the A-3 soil
was volatile in response to the climatic change, with a

24
rapid change in moisture variation for the top layer (Liu,
2001).
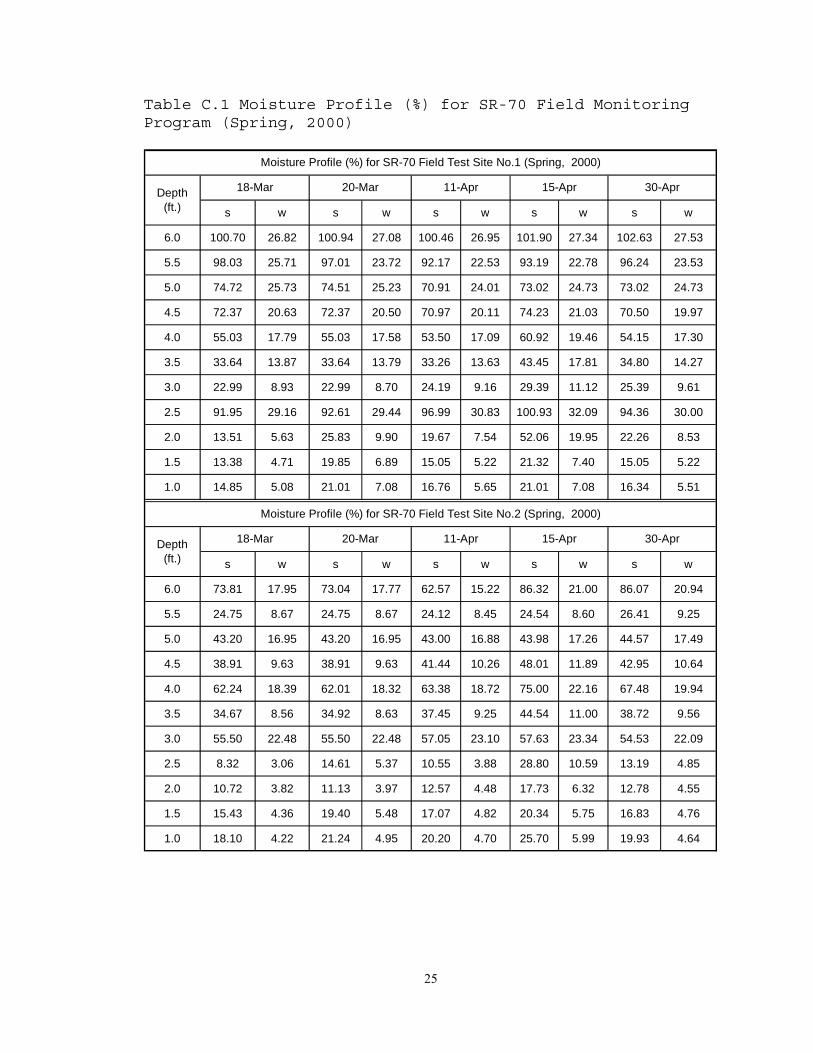
25
Table C.1 Moisture Profile (%) for SR-70 Field Monitoring Program (Spring, 2000)
s w s w s w s w s w
6.0 100.70 26.82 100.94 27.08 100.46 26.95 101.90 27.34 102.63 27.53
5.5 98.03 25.71 97.01 23.72 92.17 22.53 93.19 22.78 96.24 23.53
5.0 74.72 25.73 74.51 25.23 70.91 24.01 73.02 24.73 73.02 24.73
4.5 72.37 20.63 72.37 20.50 70.97 20.11 74.23 21.03 70.50 19.97
4.0 55.03 17.79 55.03 17.58 53.50 17.09 60.92 19.46 54.15 17.30
3.5 33.64 13.87 33.64 13.79 33.26 13.63 43.45 17.81 34.80 14.27
3.0 22.99 8.93 22.99 8.70 24.19 9.16 29.39 11.12 25.39 9.61
2.5 91.95 29.16 92.61 29.44 96.99 30.83 100.93 32.09 94.36 30.00
2.0 13.51 5.63 25.83 9.90 19.67 7.54 52.06 19.95 22.26 8.53
1.5 13.38 4.71 19.85 6.89 15.05 5.22 21.32 7.40 15.05 5.22
1.0 14.85 5.08 21.01 7.08 16.76 5.65 21.01 7.08 16.34 5.51
s w s w s w s w s w
6.0 73.81 17.95 73.04 17.77 62.57 15.22 86.32 21.00 86.07 20.94
5.5 24.75 8.67 24.75 8.67 24.12 8.45 24.54 8.60 26.41 9.25
5.0 43.20 16.95 43.20 16.95 43.00 16.88 43.98 17.26 44.57 17.49
4.5 38.91 9.63 38.91 9.63 41.44 10.26 48.01 11.89 42.95 10.64
4.0 62.24 18.39 62.01 18.32 63.38 18.72 75.00 22.16 67.48 19.94
3.5 34.67 8.56 34.92 8.63 37.45 9.25 44.54 11.00 38.72 9.56
3.0 55.50 22.48 55.50 22.48 57.05 23.10 57.63 23.34 54.53 22.09
2.5 8.32 3.06 14.61 5.37 10.55 3.88 28.80 10.59 13.19 4.85
2.0 10.72 3.82 11.13 3.97 12.57 4.48 17.73 6.32 12.78 4.55
1.5 15.43 4.36 19.40 5.48 17.07 4.82 20.34 5.75 16.83 4.76
1.0 18.10 4.22 21.24 4.95 20.20 4.70 25.70 5.99 19.93 4.64
Moisture Profile (%) for SR-70 Field Test Site No.2 (Spring, 2000)
Depth(ft.)
18-Mar 20-Mar 11-Apr 15-Apr 30-Apr
Moisture Profile (%) for SR-70 Field Test Site No.1 (Spring, 2000)
Depth(ft.)
18-Mar 20-Mar 11-Apr 15-Apr 30-Apr

26
Table C.2 Moisture Profile of SR-70 Soils (Field Test No. 1)
6.0 ft. 5.0 ft. 4.0 ft 3.0 ft. 2.0 ft. 1.0 ft.3-13 99.98 75.99 55.68 23.59 14.70 15.07 0.613-14 99.98 75.56 55.46 23.39 14.31 15.07 0.003-15 100.22 75.35 55.46 23.39 14.11 15.07 0.003-16 100.46 75.14 55.24 23.19 13.71 15.07 0.053-17 100.46 74.93 55.24 23.19 13.51 14.85 0.053-18 100.70 74.72 55.03 22.99 13.51 14.85 0.023-19 100.70 74.51 55.03 22.99 13.31 14.85 0.673-20 100.94 74.51 55.03 22.99 25.83 21.01 0.013-21 100.94 74.29 55.03 23.19 25.83 19.74 0.003-22 101.18 74.08 54.81 23.39 25.04 18.89 0.003-23 101.18 74.08 54.81 23.79 24.44 18.46 0.043-24 101.42 72.81 54.81 23.99 23.85 18.25 0.013-25 101.42 73.66 54.81 23.99 23.45 18.04 0.003-26 101.42 73.66 54.81 24.19 23.05 17.83 0.003-27 101.42 73.45 54.59 24.39 22.65 17.61 0.233-28 101.42 73.24 54.59 24.39 22.45 17.61 0.003-29 101.66 73.24 54.59 24.39 23.05 18.89 0.003-30 100.94 73.02 54.37 24.39 23.25 18.46 0.003-31 100.94 72.81 54.37 24.59 23.05 18.04 0.014-1 100.70 72.60 54.37 24.59 22.65 17.83 0.004-2 101.18 72.60 54.15 24.59 22.45 17.61 0.004-3 100.94 72.39 54.15 24.59 22.06 17.40 0.004-4 100.94 72.18 53.93 24.59 21.86 17.19 0.004-5 100.94 71.97 53.93 24.59 21.46 16.98 0.004-6 100.70 71.75 53.93 24.39 21.06 16.98 0.004-7 100.70 71.54 53.72 24.39 20.86 16.98 0.004-8 100.46 71.33 53.72 24.39 20.47 16.98 0.004-9 100.46 71.33 53.72 24.39 20.27 16.98 0.00
4-10 100.46 71.12 53.50 24.19 20.07 16.98 0.004-11 100.46 70.91 53.50 24.19 19.67 16.76 0.004-12 99.74 70.91 53.50 24.19 19.47 16.76 0.884-13 100.22 70.91 53.50 24.19 24.64 22.49 0.414-14 100.22 70.91 53.50 24.39 37.16 22.92 1.904-15 101.90 73.02 60.92 29.39 52.06 21.01 0.394-16 102.39 74.08 59.61 28.79 48.88 21.43 0.294-17 102.39 75.14 59.18 28.19 41.73 20.16 0.004-18 102.15 76.20 58.74 27.79 36.17 19.31 0.004-19 102.39 76.41 58.30 27.39 32.99 18.67 0.004-20 102.39 76.41 57.65 26.99 30.80 18.25 0.004-21 102.39 76.20 57.21 26.79 29.41 17.83 0.004-22 102.39 75.78 56.77 26.59 28.02 17.61 0.004-23 102.39 75.35 56.34 26.39 26.83 17.40 0.004-24 102.39 74.93 55.90 26.19 26.03 17.19 0.004-25 102.39 74.51 55.46 25.99 25.04 16.98 0.004-26 102.39 74.08 55.24 25.99 24.44 16.76 0.004-27 102.39 73.87 55.03 25.79 23.85 16.76 0.004-28 102.39 73.66 54.59 25.59 23.25 16.55 0.004-29 102.39 73.24 54.37 25.59 22.65 16.34 0.004-30 102.63 73.02 54.15 25.39 22.26 16.34 0.00
Date( Mon/Day)
Degree of Saturation (%) (Below the Ground Surface) Rainfall(inch)

27
Figure C.1 Degree of Saturation vs. Date and Precipitation (Field Test Site No.1 -- Spring 2000)
Degree of Saturation vs. Date & Precipitation ( Field Test Site No.1)
0
10
20
30
40
50
60
70
80
90
100
110
3/10 3/20 3/30 4/9 4/19 4/29
Date, Mon./Day/2000
Deg
ree
of S
atur
atio
n, %
6 ft.
5 ft.
4 ft.
3 ft.
2 ft.
Rain
2.0
1.2
1.6
0.8
0.4

28
Figure C.2 Degree of Saturation vs. Depth (Field Test Site No.1 -- Spring 2000)
Depth vs. Degree of Saturation (Field Test Site No.1)
0
1
2
3
4
5
6
7
0 10 20 30 40 50 60 70 80 90 100 110
Degee of Saturation, %D
epth
, ft.
18-Mar
20-Mar
11-Apr
15-Apr
30-Apr

29
Table C.3 Moisture Profile of SR-70 Soils (Field Test Site No. 2)
6.0 ft 5.0 ft 4.0 ft 3.0 ft 2.0 ft 1.0 ft3/13 78.41 43.79 63.38 55.50 11.13 18.10 0.613/14 77.39 43.59 62.92 55.50 11.13 18.10 0.003/15 76.36 43.59 62.69 55.69 10.92 18.10 0.003/16 75.60 43.39 62.47 55.50 10.92 18.10 0.053/17 74.58 43.39 62.24 55.50 10.92 18.10 0.053/18 73.81 43.20 62.24 55.50 10.72 18.10 0.023/19 73.55 43.20 62.01 55.50 10.72 18.10 0.673/20 73.04 43.20 62.01 55.50 11.13 21.24 0.013/21 72.79 43.20 62.01 56.47 14.22 22.29 0.003/22 72.53 43.20 62.24 57.24 14.43 21.77 0.003/23 72.02 43.00 62.24 57.63 14.22 21.51 0.043/24 71.77 43.00 62.47 57.82 14.02 21.51 0.013/25 71.26 43.00 62.69 58.01 13.81 21.24 0.003/26 70.75 43.00 62.92 57.82 13.60 20.98 0.003/27 70.49 43.00 63.15 57.82 13.40 20.72 0.233/28 69.98 43.00 63.15 57.82 13.40 20.72 0.003/29 69.72 43.00 63.38 57.82 13.40 20.98 0.003/30 69.21 43.00 63.38 57.82 13.60 20.98 0.003/31 68.70 43.00 63.61 57.82 13.60 20.72 0.014/1 68.45 43.00 63.61 57.63 13.40 20.72 0.004/2 67.94 43.00 63.61 57.63 13.40 20.46 0.004/3 67.43 43.00 63.61 57.63 13.19 20.46 0.004/4 66.91 43.00 63.83 57.43 13.19 20.20 0.004/5 66.15 43.00 63.61 57.43 12.99 20.20 0.004/6 65.64 43.00 63.61 57.24 12.99 20.20 0.004/7 65.13 43.00 63.61 57.24 12.78 20.20 0.004/8 64.36 43.00 63.61 57.24 12.78 20.20 0.004/9 63.85 43.00 63.61 57.05 12.78 20.20 0.00
4/10 63.08 43.00 63.61 57.05 12.78 20.20 0.004/11 62.57 43.00 63.38 57.05 12.57 20.20 0.004/12 62.32 43.00 63.38 56.85 12.57 20.20 0.884/13 62.06 43.00 63.38 57.05 15.67 25.70 0.414/14 62.06 43.00 63.38 57.43 17.52 27.80 1.904/15 86.32 43.98 75.00 57.63 17.73 25.70 0.394/16 89.90 47.13 74.32 57.24 17.31 26.23 0.294/17 91.18 47.71 73.64 56.85 16.49 24.65 0.004/18 92.71 47.52 72.95 56.27 15.67 23.34 0.004/19 92.96 47.13 71.81 55.89 15.05 22.56 0.004/20 93.73 46.73 71.13 55.69 14.64 22.03 0.004/21 93.73 46.34 70.45 55.31 14.22 21.51 0.004/22 92.96 46.14 69.99 55.11 14.02 21.24 0.004/23 92.45 45.95 69.53 55.11 13.81 20.98 0.004/24 90.92 41.82 68.85 53.76 13.60 20.72 0.004/25 90.67 45.36 68.85 54.92 13.40 20.72 0.004/26 89.90 45.36 68.62 54.73 13.19 20.46 0.004/27 87.86 45.16 68.17 54.73 13.19 20.46 0.004/28 88.11 44.97 67.94 54.53 12.99 20.20 0.004/29 87.09 44.77 67.71 54.53 12.78 20.20 0.004/30 86.07 44.57 67.48 54.53 12.78 19.93 0.00
( )
Date (Mon/Day)
Degree of Saturation (%) (Below the Ground Surface) Rainfall (inch)

30
Figure C.3 Degree of Saturation vs. Date and Precipitation (Field Test Site No.2 -- Spring 2000)
Degree of Saturation vs. Date & Precipitation (Field Test Site No.2)
0
10
20
30
40
50
60
70
80
90
100
3/10 3/20 3/30 4/9 4/19 4/29
Date, Mon./Day/2000
Deg
ree
of S
atur
atio
n,
%
6 ft.5 ft.4 ft.3 ft.2 ft.Rain
1.6
2.0
1.2
0.8
0.4

31
Figure C.4 Degree of Saturation vs. Depth (Field Test Site No.2 --Spring 2000)
Degree of Saturation vs. Depth (Field Test Site No.2)
0
1
2
3
4
5
6
7
0 10 20 30 40 50 60 70 80 90 100 110
Degree of Saturation, %D
epth
, ft
.
18-Mar
20-Mar
11-Apr
15-Apr
30-Apr

32
Table C.4 Moisture Profile (%) for SR-70 Field Monitoring Program (Summer, 2000)
s w s w s w s w
6.0 93.95 25.21 91.79 24.63 80.22 21.52 81.91 21.98
5.5 86.82 21.23 86.06 21.04 84.53 20.67 85.04 20.79
5.0 68.37 23.15 68.16 23.08 67.73 22.94 67.94 23.01
4.5 67.23 19.05 67.00 18.98 66.76 18.92 67.00 18.98
4.0 51.10 16.32 51.10 16.32 50.88 16.25 51.31 16.39
3.5 31.72 13.00 31.53 12.93 31.72 13.00 32.11 13.16
3.0 22.39 8.47 22.19 8.40 23.59 8.93 25.39 9.61
2.5 91.95 29.23 92.17 29.30 93.70 29.79 95.89 30.48
2.0 13.11 5.02 27.62 10.58 19.08 7.31 40.34 15.45
1.5 11.91 4.13 19.44 6.74 13.79 4.79 21.74 7.54
1.0 12.94 4.36 19.95 6.72 14.85 5.01 21.01 7.08
s w s w s w s w
6.0 53.12 12.92 52.36 12.74 50.82 12.36 63.08 15.35
5.5 23.29 8.16 23.08 8.09 23.91 8.38 25.58 8.96
5.0 42.22 16.57 42.02 16.49 42.61 16.72 43.79 17.19
4.5 39.67 9.82 39.42 9.76 42.20 10.45 83.38* 20.65
4.0 61.33 18.12 60.64 17.91 64.29 18.99 67.48 19.94
3.5 34.42 8.50 34.92 8.63 37.71 9.31 39.98 9.88
3.0 53.37 21.62 54.53 22.09 54.34 22.01 55.11 22.32
2.5 8.52 3.13 17.44 6.41 11.97 4.40 24.34 8.95
2.0 10.92 3.89 16.08 5.73 12.37 4.41 17.73 6.32
1.5 15.43 4.36 19.87 5.62 16.36 4.62 21.04 5.95
1.0 17.83 4.15 25.97 6.05 19.41 4.52 26.75 6.23
Moisture Profile (%) for SR-70 Field Test Site No.1 (Summer,2000)
Depth(ft.)
4-Jun 8-Jun 24-Jun 8-Jul
* Reading Jumped from 43% to 82% within 15 Min. upon 16:30, July 6th.
Moisture Profile (%) for SR-70 Field Test Site No.2 (Summer,2000)
Depth(ft.)
4-Jun 8-Jun 24-Jun 8-Jul

33
Table C.5 Moisture Profile of SR-70 Soils (Field Test No. 1)
6.0 ft 5.0 ft 4.0 ft 3.0 ft 2.0 ft 1.0 ft5-30 96.36 68.79 51.31 22.99 14.11 13.37 0.005-31 95.88 68.58 51.31 22.79 13.91 13.37 0.006-1 95.64 68.58 51.31 22.79 13.71 13.16 0.006-2 94.92 68.58 51.31 22.59 13.51 13.16 0.006-3 94.44 68.37 51.10 22.59 13.31 12.94 0.006-4 93.95 68.37 51.10 22.39 13.11 12.94 0.136-5 93.23 68.37 51.10 22.39 13.11 12.94 0.006-6 85.28 68.16 51.10 22.39 12.92 12.94 0.366-7 0.686-8 91.79 68.16 51.10 22.19 27.62 19.95 0.006-9 91.30 68.16 51.10 22.39 26.43 18.89 0.00
6-10 91.06 68.16 51.10 22.79 25.43 18.25 0.006-11 90.82 68.16 51.10 23.19 24.84 17.83 0.356-12 90.82 68.16 51.10 23.39 26.43 20.16 0.106-13 90.82 68.16 51.10 23.59 27.22 19.31 0.006-14 90.10 68.16 51.10 23.79 26.23 18.46 0.006-15 89.14 67.94 51.10 23.99 25.24 17.83 0.006-16 88.41 67.94 51.10 23.99 24.44 17.19 0.006-17 87.93 67.94 51.10 23.99 23.85 16.76 0.006-18 86.97 67.94 51.10 23.99 23.05 16.55 0.006-19 86.00 67.73 50.88 23.99 22.26 16.13 0.006-20 84.80 67.73 51.10 23.99 21.66 15.70 0.006-21 83.60 67.73 50.88 23.79 20.86 15.49 0.006-22 82.15 67.73 50.88 23.79 20.27 15.28 0.006-23 81.19 67.73 50.88 23.59 19.67 14.85 0.016-24 80.22 67.73 50.88 23.59 19.08 14.85 0.196-25 79.98 67.52 50.88 23.39 18.88 14.64 0.386-26 79.74 67.52 50.88 23.59 22.06 18.25 0.006-27 79.50 67.52 50.88 23.59 21.66 17.61 0.736-28 79.98 67.52 50.88 23.59 36.76 20.58 0.546-29 79.98 67.73 50.88 23.99 37.36 19.95 0.006-30 80.22 67.73 51.10 24.39 34.77 19.10 0.257-1 80.22 67.73 51.10 24.59 34.58 19.52 0.327-2 80.46 67.73 51.10 24.79 36.76 20.37 0.157-3 80.70 67.73 51.10 24.99 34.77 19.31 0.007-4 80.95 67.73 51.31 24.99 32.79 18.46 0.267-5 80.95 67.73 51.31 24.99 32.79 19.31 0.597-6 81.43 67.73 51.31 25.19 37.36 19.74 0.007-7 81.67 67.94 51.31 25.39 34.18 18.67 0.777-8 81.91 67.94 51.31 25.39 40.34 21.01 0.427-9 83.84 68.16 51.53 25.79 38.95 20.16 0.01
7-10 86.00 68.37 51.75 25.99 35.17 18.89 0.007-11 86.97 68.58 51.97 25.79 32.39 18.25 0.13
( )Date
(Mon/Day)Degree of Saturation (%) (Below the Ground Surface) Rainfall
(inch)

34
Figure C.5 Degree of Saturation vs. Date and Precipitation (Field Test Site No.2 -- Summer 2000)
Degree of Saturation vs. Date & Precipitation ( Field Test Site No.1)
0
10
20
30
40
50
60
70
80
90
100
5/24 6/3 6/13 6/23 7/3 7/13
Date, Mon./Day/2000
Deg
ree
of S
atur
atio
n,
%
6 ft.
5 ft.
4 ft.
3 ft.
2 ft.
Rain
0.8
1.0
0.6
0.4
0.2
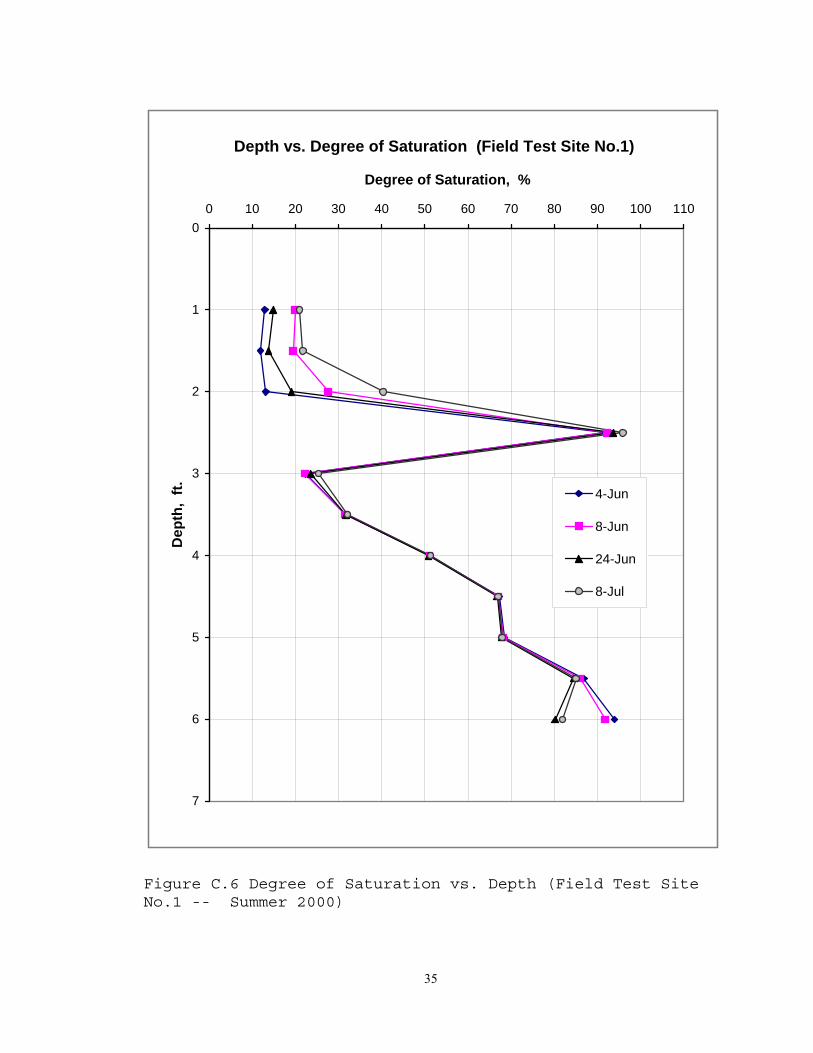
35
Figure C.6 Degree of Saturation vs. Depth (Field Test Site No.1 -- Summer 2000)
Depth vs. Degree of Saturation (Field Test Site No.1)
0
1
2
3
4
5
6
7
0 10 20 30 40 50 60 70 80 90 100 110
Degree of Saturation, %D
epth
, ft. 4-Jun
8-Jun
24-Jun
8-Jul

36
Table C.6 Moisture Profile of SR-70 Soils (Field Test No. 2)
6.0 ft 5.0 ft 4.0 ft 3.0 ft 2.0 ft 1.0 ft5-30 54.91 42.61 62.47 53.56 11.13 18.10 0.005-31 54.40 42.41 62.24 53.56 11.13 18.10 0.006-1 54.14 42.41 62.01 53.56 10.92 18.10 0.006-2 53.89 42.41 61.78 53.37 10.92 17.83 0.006-3 53.38 42.22 61.55 53.37 10.92 17.83 0.006-4 53.12 42.22 61.33 53.37 10.92 17.83 0.136-5 52.87 42.22 61.10 53.37 10.72 17.83 0.006-6 52.61 42.02 60.87 53.37 10.72 17.83 0.366-7 52.61 42.02 60.87 53.37 10.72 21.24 0.686-8 52.36 42.02 60.64 54.53 16.08 25.97 0.006-9 52.36 42.02 61.10 54.73 15.25 24.13 0.006-10 52.36 42.02 61.55 54.73 14.64 22.82 0.006-11 52.10 42.02 62.01 54.73 14.22 22.29 0.356-12 52.10 42.22 62.69 54.73 15.46 25.97 0.106-13 52.10 41.82 62.92 54.73 15.25 24.39 0.006-14 52.10 42.22 63.38 54.92 14.84 23.34 0.006-15 51.85 42.41 63.83 54.92 14.43 22.29 0.006-16 51.85 42.41 64.06 54.92 14.02 21.77 0.006-17 51.85 41.82 64.29 54.53 13.81 21.24 0.006-18 51.59 42.61 64.29 54.73 13.40 20.72 0.006-19 51.59 42.61 64.52 54.73 13.19 20.46 0.006-20 51.34 42.61 64.52 54.73 12.99 20.20 0.006-21 51.34 42.61 64.52 54.53 12.78 19.93 0.006-22 51.08 42.61 64.29 54.53 12.57 19.67 0.006-23 51.08 42.61 64.29 54.53 12.57 19.67 0.016-24 50.82 42.61 64.29 54.34 12.37 19.41 0.196-25 50.82 42.61 64.06 54.34 12.37 19.41 0.386-26 52.87 42.61 64.06 54.53 15.87 24.92 0.006-27 52.10 42.61 64.29 54.73 15.05 23.87 0.736-28 52.10 42.61 64.52 54.92 17.93 27.80 0.546-29 55.17 42.61 64.97 54.92 17.11 26.49 0.006-30 55.17 42.81 65.66 54.92 16.08 25.18 0.257-1 55.42 43.00 66.11 54.92 16.08 25.70 0.327-2 55.42 43.20 66.34 54.92 16.70 26.75 0.157-3 55.68 43.20 66.57 54.92 16.08 25.18 0.007-4 55.68 43.39 66.57 54.92 15.46 23.87 0.267-5 55.93 43.39 66.80 54.92 16.08 25.97 0.597-6 62.83 43.59 66.80 55.11 16.70 25.44 0.007-7 63.08 43.59 67.25 54.92 15.87 23.87 0.777-8 63.08 43.79 67.48 55.11 17.73 26.75 0.427-9 63.85 43.79 67.71 55.11 17.11 25.44 0.017-10 64.62 43.98 68.17 55.11 15.87 23.87 0.007-11 64.87 44.18 67.94 54.92 15.25 22.82 0.13
Date(Mon/Day)
Degree of Saturation (%) (Below the Ground Surface) Rainfall(inch)

37
Figure C.7 Degree of Saturation vs. Date and Precipitation (Field Test Site No.2 -- Summer 2000)
Degree of Saturation vs. Date & Precipitation (Field Test Site No. 2)
0
10
20
30
40
50
60
70
80
90
5/24 6/3 6/13 6/23 7/3 7/13
Date, Mon./Day/2000
Deg
ree
of S
atur
atio
n,
%
6 ft.
5 ft.
4 ft.
3 ft.
2 ft.
Rain
0.8
0.6
0.4
0.2

38
Figure C.8 Degree of Saturation vs. Depth (Field Test Site No.2 -- Summer 2000)
Depth vs. Degree of Saturation (Field Test Site No.2)
0
1
2
3
4
5
6
7
0 10 20 30 40 50 60 70 80 90 100 110
Degree of Saturation, %D
epth
, ft
4-Jun
8-Jun
24-Jun
8-Jul

39
Table C.7 Moisture Profile (%) for SR-70 Field Monitoring Program (Fall, 2000)
s w s w s w s w s w
6.0 97.30 26.07 98.98 26.52 97.30 26.07
5.5 94.95 23.18 94.95 23.18 99.28 24.24 100.80 24.61 99.02 24.18
5.0 73.20 24.76 75.95 25.69 87.38 29.55 83.99 28.41 82.09 27.77
4.5
4.0 55.12 17.76 55.55 17.90 64.85 20.89 76.52 24.65 65.49 21.10
3.5 33.63 13.77 40.16 16.45 39.01 15.97 83.01 33.99 41.70 17.08
3.0 24.78 9.37 29.17 11.03 26.77 10.12 70.73 26.74 27.77 10.50
2.5 93.67 29.74 99.79 31.69 96.29 30.57 103.73 32.94 101.33 32.17
2.0 19.07 7.30 57.20 21.89 28.40 10.87 57.40 21.97 32.97 12.62
1.5 13.58 4.71 45.12 15.64 16.29 5.65 31.96 11.08 17.96 6.23
1.0 14.21 4.78 41.79 14.06 16.54 5.57 26.30 8.85 18.24 6.14
s w s w s w s w s w
6.0
5.5 25.56 8.95 25.36 8.87 55.29 19.35 75.45 26.40 74.62 26.11
5.0 43.17 16.93 42.98 16.85 53.58 21.01 77.52 30.39 78.30 30.70
48.75 12.06 56.80 13.87 82.35 20.36
4.0 64.95 19.16 64.95 19.16 68.82 20.31 72.47 21.38 74.75 22.06
3.5 37.19 9.17 39.72 9.80 39.72 9.80 41.74 10.30 41.24 10.17
3.0
2.5 10.95 4.02 27.57 10.13 16.42 6.03 30.82 11.32 18.45 6.78
2.0 12.16 4.33 22.25 7.92 13.80 4.91 19.98 7.11 14.63 5.21
1.5 16.83 4.75 26.87 7.59 17.53 4.95 22.20 6.27 18.46 5.21
1.0 19.40 4.51 26.75 6.22 20.98 4.88 26.48 6.16 22.55 5.25
TDR Probe out of order upon 7/27 Volumetric Moisture Content >1.0 to 6999
4.5TDR Probe out of order upon 9/19 Volumetric Moisture Content >1.0 to 6999
TDR Probe out of order upon 7/27 Volumetric Moisture Content >1.0 to 6999
TDR Probe out of order upon 9/8 Volumetric Moisture Content 6999
Moisture Profile (%) for SR-70 Field Test Site No.2 (Fall,2000)
Depth(ft.)
31-Aug 4-Sep 16-Sep 19-Sep 26-Sep
Moisture Profile (%) for SR-70 Field Test Site No.1 (Fall,2000)
Depth(ft.)
31-Aug 4-Sep 16-Sep 19-Sep 26-Sep

40
Table C.8 Moisture Profile of SR-70 Soils (Field Test No. 1)
6.0 ft. 5.0 ft. 4.0 ft. 3.0 ft. 2.0 ft. 1.0 ft.8-28 74.05 55.55 24.98 20.26 14.64 0.008-29 73.62 55.34 24.78 19.86 14.64 0.008-30 73.41 55.34 24.78 19.46 14.42 0.008-31 73.20 55.12 24.78 19.07 14.21 0.009-1 72.78 55.12 24.58 18.87 21.64 0.549-2 72.57 55.55 24.78 20.26 25.45 0.509-3 72.36 55.55 24.78 28.40 25.45 0.019-4 75.95 55.55 29.17 57.20 41.79 1.719-5 103.08 75.74 55.34 29.77 50.45 23.54 0.019-6 100.19 76.38 55.34 28.57 41.91 19.94 0.009-7 100.19 77.43 55.34 27.57 39.32 26.94 0.619-8 100.19 86.74 60.96 32.37 62.76 39.45 1.359-9 97.30 87.17 65.93 32.37 59.38 33.30 0.80
9-10 97.54 87.17 71.33 31.77 56.21 25.88 0.009-11 97.54 87.17 71.33 30.77 49.25 20.57 0.009-12 97.54 87.17 70.47 29.37 39.13 19.09 0.009-13 97.30 87.17 69.17 28.37 34.16 18.24 0.009-14 97.30 87.38 67.66 27.77 31.78 17.39 0.009-15 97.30 87.38 66.14 27.17 29.79 16.97 0.009-16 97.30 87.38 64.85 26.77 28.40 16.54 0.009-17 97.30 87.38 63.77 26.57 27.21 16.12 0.059-18 99.23 87.80 76.52 60.94 58.99 39.24 2.899-19 98.98 83.99 76.52 70.73 57.40 26.30 0.059-20 97.54 83.15 75.00 44.96 53.62 22.27 0.129-21 97.06 82.30 71.33 28.97 41.31 20.36 0.009-22 97.30 82.30 68.74 28.17 49.06 30.54 0.699-23 97.78 82.51 70.90 30.97 45.88 24.18 0.069-24 97.30 82.09 69.60 29.57 40.71 20.57 0.009-25 97.30 82.09 68.30 28.37 35.75 19.09 0.009-26 97.30 82.09 65.49 27.77 32.97 18.24 0.009-27 97.30 81.45 60.09 27.37 31.18 17.61 0.269-28 97.30 81.45 58.15 27.17 29.79 19.09 0.009-29 97.54 81.45 58.15 27.17 51.84 35.00 0.889-30 97.54 82.09 62.25 27.77 46.87 23.54 0.0010-1 97.54 82.09 59.87 27.77 38.13 20.15 0.0010-2 97.54 82.09 58.58 27.57 33.96 18.88 0.0010-3 97.54 82.09 58.58 27.37 31.38 18.03 0.0310-4 98.50 82.72 68.30 27.37 57.60 34.36 1.7310-5 99.47 83.36 69.82 60.74 57.60 31.18 0.2210-6 99.47 83.36 69.82 60.74 56.01 26.09 0.0010-7 98.26 82.93 68.74 43.36 52.63 22.70 0.1110-8 98.02 82.72 68.09 29.97 44.09 20.36 0.0010-9 98.02 82.72 65.71 28.97 38.73 19.51 0.00
Date(Mon./day)
Degree of Saturation (%) (Below the Ground Surface) Rainfall(inch)

41
Figure C.9 Degree of Saturation vs. Date and Precipitation (Field Test Site No.1 -- Fall 2000)
Degree of Saturation vs. Date & Precipitation (Field Test Site No.1)
0
10
20
30
40
50
60
70
80
90
100
110
8/22 9/1 9/11 9/21 10/1 10/11
Date, Mon./Day/2000
Deg
ree
of S
atur
atio
n, %
6 ft.
5 ft.
4 ft.
3 ft.
2 ft.
Rain
1.16
1.73
2.31
2.89
0.58

42
Figure C.10 Degree of Saturation vs. Depth (Field Test Site No.1, -- Fall 2000)
Depth vs. Degree of Saturation (Field Test Site No.1)
0
1
2
3
4
5
6
7
0 10 20 30 40 50 60 70 80 90 100 110
Degree of Saturation, %D
epth
, ft
31-Aug
4-Sep
16-Sep
19-Sep
26-Sep

43
Table C.9 Moisture Profile of SR-70 Soils (Field Test Site No. 2)
5.5 ft. 5.0 ft. 4.0 ft. 3.5 ft. 2.5 ft. 2.0 ft. 1.5 ft.8-28 25.98 43.37 65.41 37.70 11.56 12.36 17.06 0.008-29 25.77 43.17 65.41 37.44 11.35 12.36 17.06 0.008-30 25.77 43.17 65.18 37.44 11.15 12.16 16.83 0.008-31 25.56 43.17 64.95 37.19 10.95 12.16 16.83 0.009-1 25.36 43.17 64.95 37.19 10.75 12.16 19.86 0.549-2 25.36 42.98 64.72 37.70 15.81 12.57 22.90 0.509-3 25.15 42.98 64.72 38.71 17.64 15.25 22.90 0.019-4 25.36 42.98 64.95 39.72 27.57 22.25 26.87 1.719-5 26.40 43.37 65.86 39.97 25.34 18.54 21.73 0.019-6 27.64 43.57 66.32 39.97 22.30 16.07 19.16 0.009-7 27.02 43.76 66.55 39.97 22.30 16.69 23.14 0.619-8 28.06 47.49 67.23 41.24 34.67 25.14 28.04 1.359-9 34.50 48.47 68.60 41.74 32.44 21.02 25.00 0.809-10 46.76 51.42 69.51 42.00 31.63 20.19 23.14 0.009-11 53.83 53.97 69.74 41.49 26.56 17.10 19.40 0.009-12 57.36 54.95 69.74 40.99 22.30 15.66 18.70 0.009-13 57.99 54.95 69.74 40.48 19.87 14.83 18.23 0.009-14 58.20 54.95 69.51 40.23 18.45 14.42 17.99 0.009-15 57.16 54.36 69.28 39.97 17.23 14.01 17.76 0.009-16 55.29 53.58 68.82 39.72 16.42 13.80 17.53 0.009-17 53.42 52.79 68.37 39.47 15.61 13.60 17.29 0.059-18 65.05 54.95 67.91 40.99 33.66 25.14 28.51 2.899-19 75.45 77.52 72.47 41.74 30.82 19.98 22.20 0.059-20 75.86 77.91 74.52 41.74 26.36 17.10 19.63 0.129-21 76.07 78.11 74.98 41.74 22.91 15.86 19.40 0.009-22 76.90 79.68 74.98 41.74 21.29 17.31 23.14 0.699-23 75.03 78.30 75.21 41.74 21.29 17.31 22.67 0.069-24 74.82 78.50 75.43 41.74 20.27 15.66 20.10 0.009-25 74.82 78.30 75.21 41.49 19.67 15.04 19.16 0.009-26 74.62 78.30 74.75 41.24 18.45 14.63 18.46 0.009-27 74.41 78.11 73.84 40.73 17.44 14.22 18.23 0.269-28 73.99 78.11 72.93 40.23 16.63 14.01 20.33 0.009-29 73.58 78.11 72.24 40.48 23.72 18.95 26.17 0.889-30 73.58 78.11 72.70 40.73 22.30 17.72 22.20 0.0010-1 73.78 78.11 72.70 40.73 19.26 15.66 19.86 0.0010-2 73.78 78.11 72.70 40.73 18.04 14.83 18.93 0.0010-3 73.37 78.11 72.70 40.23 17.03 14.42 18.46 0.0310-4 73.37 78.11 71.79 40.99 34.67 24.31 28.74 1.7310-5 74.82 79.09 76.57 43.01 34.47 23.49 26.41 0.2210-6 74.82 79.68 79.54 43.77 29.40 18.54 21.73 0.0010-7 75.03 79.87 80.67 43.77 26.15 17.10 19.86 0.1110-8 75.24 79.87 80.67 43.77 23.11 15.86 19.40 0.0010-9 75.45 79.68 80.45 43.01 21.09 15.25 18.93 0.00
Date(Mon./Day)
Degree of Saturation (%) (Below the Ground Surface) Rainfall(inch)

44
Figure C.11 Degree of Saturation vs. Date and Precipitation (Field Test Site No.2 -- Fall 2000)
Degree of Saturation vs. Date & Precipitation (Field Test Site No.2)
0
10
20
30
40
50
60
70
80
90
100
8/22 9/1 9/11 9/21 10/1 10/11
Date, Mon./Day/2000
Deg
ree
of S
atur
atio
n,
%
5.5 ft.
5 ft.
3.5 ft.
2.5 ft.
1.5 ft.
Rain
3.0
2.4
1.8
1.2
0.6

45
Figure C.12 Degree of Saturation vs. Depth (Field Test Site No.2 -- Fall 2000)
Depth vs. Degree of Saturation (Field Test Site No.2)
0
1
2
3
4
5
6
7
0 10 20 30 40 50 60 70 80 90 100 110
Degree of Saturation, %D
epth
, ft
.
31-Aug
4-Sep
16-Sep
19-Sep
26-Sep

46
Table C.10 Moisture Profile (%) for SR-70 Field Monitoring Program (Winter, 2000)
s w s w s w s w
6.0 101.15 27.10 102.12 27.36 102.84 27.55 102.84 27.55
5.5 95.20 23.24 92.15 22.50 91.39 22.31 91.39 22.31
5.0 71.51 24.19 70.45 23.83 70.24 23.76 70.24 23.76
4.5
4.0 53.04 16.92 52.60 16.78 52.60 16.78 52.60 16.78
3.5 32.86 13.46 32.47 13.30 32.47 13.30 32.66 13.38
3.0 22.18 8.39 21.78 8.23 21.78 8.23 22.78 8.61
2.5
2.0 11.72 4.48 11.32 4.33 11.12 4.26 25.02 9.58
1.5 10.86 3.76 17.76 6.15 14.20 4.92 19.64 6.80
1.0 12.09 4.07 13.15 4.43 14.21 4.78 20.57 6.93
s w s w s w s w
6.0
5.5 28.06 9.82 27.44 9.60 27.23 9.53 27.23 9.53
5.0 45.92 18.00 45.53 17.85 45.14 17.70 45.14 17.70
38.14 9.43 36.63 9.06 35.62 8.81 37.39 9.24
4.0 60.39 17.82 59.48 17.55 59.25 17.48 60.16 17.75
3.5 33.90 8.36 33.65 8.30 34.15 8.42 37.44 9.24
3.0
2.5 8.31 3.05 11.35 4.17 11.56 4.24 17.23 6.33
2.0 9.68 3.45 9.89 3.52 10.30 3.67 13.60 4.84
1.5 15.19 4.29 20.10 5.67 17.06 4.82 21.03 5.94
1.0 16.26 3.78 17.04 3.96 17.83 4.15 22.03 5.12
Moisture Profile (%) for SR-70 Field Test Site No.1 (Winter,2000/2001)
Depth (ft.)
13-Dec 30-Dec 19-Jan 24-Jan
TDR Probe Failed upon 9/8 Volumetric Water Content 6999
Converted Degree of Saturation from 100% to 391% According to TDR Reading
Moisture Profile (%) for SR-70 Field Test Site No.2 (Winter,2000/2001)
TDR Probe Failed upon 7/27 Volumetric Water Content >1.0 to 6999
24-Jan
TDR Probe Failed upon 7/27 Volumetric Water Content >1.0 to 6999
4.5TDR Probe Back to normal upon 10/17
Depth (ft.) 13-Dec 30-Dec 19-Jan
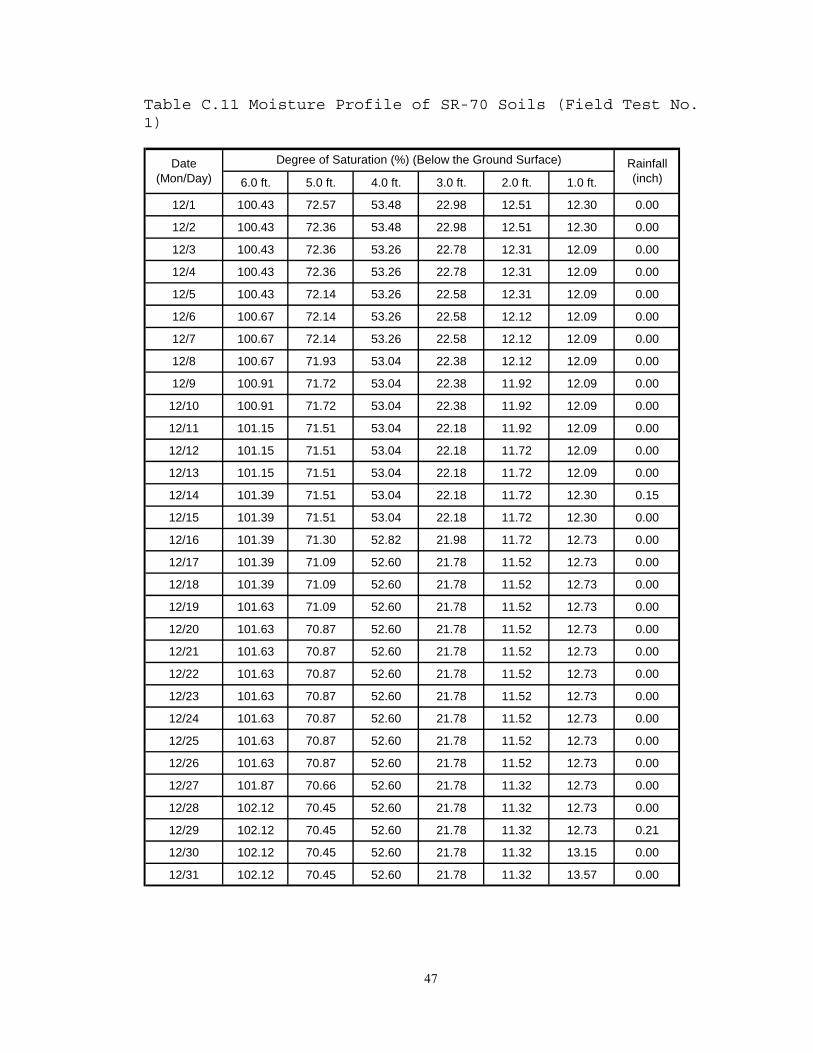
47
Table C.11 Moisture Profile of SR-70 Soils (Field Test No. 1)
6.0 ft. 5.0 ft. 4.0 ft. 3.0 ft. 2.0 ft. 1.0 ft.
12/1 100.43 72.57 53.48 22.98 12.51 12.30 0.00
12/2 100.43 72.36 53.48 22.98 12.51 12.30 0.00
12/3 100.43 72.36 53.26 22.78 12.31 12.09 0.00
12/4 100.43 72.36 53.26 22.78 12.31 12.09 0.00
12/5 100.43 72.14 53.26 22.58 12.31 12.09 0.00
12/6 100.67 72.14 53.26 22.58 12.12 12.09 0.00
12/7 100.67 72.14 53.26 22.58 12.12 12.09 0.00
12/8 100.67 71.93 53.04 22.38 12.12 12.09 0.00
12/9 100.91 71.72 53.04 22.38 11.92 12.09 0.00
12/10 100.91 71.72 53.04 22.38 11.92 12.09 0.00
12/11 101.15 71.51 53.04 22.18 11.92 12.09 0.00
12/12 101.15 71.51 53.04 22.18 11.72 12.09 0.00
12/13 101.15 71.51 53.04 22.18 11.72 12.09 0.00
12/14 101.39 71.51 53.04 22.18 11.72 12.30 0.15
12/15 101.39 71.51 53.04 22.18 11.72 12.30 0.00
12/16 101.39 71.30 52.82 21.98 11.72 12.73 0.00
12/17 101.39 71.09 52.60 21.78 11.52 12.73 0.00
12/18 101.39 71.09 52.60 21.78 11.52 12.73 0.00
12/19 101.63 71.09 52.60 21.78 11.52 12.73 0.00
12/20 101.63 70.87 52.60 21.78 11.52 12.73 0.00
12/21 101.63 70.87 52.60 21.78 11.52 12.73 0.00
12/22 101.63 70.87 52.60 21.78 11.52 12.73 0.00
12/23 101.63 70.87 52.60 21.78 11.52 12.73 0.00
12/24 101.63 70.87 52.60 21.78 11.52 12.73 0.00
12/25 101.63 70.87 52.60 21.78 11.52 12.73 0.00
12/26 101.63 70.87 52.60 21.78 11.52 12.73 0.00
12/27 101.87 70.66 52.60 21.78 11.32 12.73 0.00
12/28 102.12 70.45 52.60 21.78 11.32 12.73 0.00
12/29 102.12 70.45 52.60 21.78 11.32 12.73 0.21
12/30 102.12 70.45 52.60 21.78 11.32 13.15 0.00
12/31 102.12 70.45 52.60 21.78 11.32 13.57 0.00
Date (Mon/Day)
Degree of Saturation (%) (Below the Ground Surface) Rainfall (inch)

48
Table C.12 Moisture Profile of SR-70 Soils (Field Test Site No. 1 Year 2001)
6.0 ft. 5.0 ft. 4.0 ft. 3.0 ft. 2.0 ft. 1.0 ft.
1-1 102.36 70.45 52.60 21.78 11.32 14.21 0.00
1-2 102.36 70.45 52.60 21.78 11.32 14.21 0.00
1-3 102.36 70.45 52.60 21.78 11.32 14.42 0.00
1-4 102.36 70.45 52.60 21.78 11.32 14.42 0.00
1-5 102.60 70.45 52.60 21.78 11.32 14.42 0.00
1-6 102.60 70.45 52.60 21.78 11.32 14.42 0.00
1-7 102.60 70.45 52.60 21.78 11.32 14.42 0.00
1-8 102.84 70.45 52.60 21.98 11.32 14.42 0.00
1-9 102.84 70.45 52.60 21.98 11.32 14.42 0.00
1-10 102.84 70.45 52.60 21.98 11.32 14.42 0.00
1-11 102.84 70.45 52.60 21.98 11.32 14.42 0.00
1-12 102.84 70.45 52.60 21.98 11.32 14.42 0.00
1-13 102.84 70.45 52.60 21.98 11.32 14.42 0.00
1-14 103.08 70.24 52.60 21.78 11.32 14.42 0.00
1-15 103.08 70.24 52.60 21.78 11.32 14.21 0.00
1-16 103.08 70.24 52.60 21.78 11.32 14.21 0.00
1-17 102.84 70.24 52.60 21.78 11.32 14.21 0.00
1-18 102.84 70.24 52.60 21.78 11.32 14.21 0.00
1-19 102.84 70.24 52.60 21.78 11.12 14.21 0.00
1-20 102.84 70.03 52.38 21.78 22.64 23.54 0.54
1-21 102.84 70.24 52.38 21.98 24.63 21.85 0.00
1-22 102.84 70.24 52.38 21.98 24.63 20.79 0.17
1-23 102.84 70.24 52.38 22.38 25.02 20.79 0.00
1-24 102.84 70.24 52.60 22.78 25.02 20.57 0.00
1-25 102.84 70.24 52.60 22.78 24.63 20.15 0.00
1-26 102.84 70.24 52.60 23.18 24.23 19.51 0.00
1-27 102.84 70.24 52.60 23.38 23.83 19.30 0.00
1-28 102.84 70.24 52.60 23.58 23.44 18.88 0.00
1-29 102.84 70.45 52.82 23.58 23.04 18.67 0.00
1-30 103.08 70.45 53.69 23.98 27.61 18.45 0.00
1-31 103.08 70.45 52.82 23.78 22.44 18.24 0.00
Date(Mon/Day)
Degree of Saturation (%) (Below the Ground Surface) Rainfall(inch)

49
Figure C.13 Degree of Saturation vs. Date and Precipitation (Field Test Site No.1 -- Winter 2000/2001)
Degree of Saturation vs. Date & Precipitation (Field Test Site No.1)
0
10
20
30
40
50
60
70
80
90
100
110
11/25 12/5 12/15 12/25 1/4 1/14 1/24 2/3 2/13
Date, Mon./Day/2000(2001)
Deg
ree
of S
atur
atio
n, %
6 ft.
5 ft.
4 ft.
3 ft.
2 ft.
Rain
0.6
0.4
0.5
0.3
0.2
1.0
0.9
0.8
0.7
1.1
0.1

50
Figure C.14 Degree of Saturation vs. Depth (Field Test Site No.1 -- Winter 2000/2001)
Depth vs. Degree of Saturation (Field Test Site No.1)
0
1
2
3
4
5
6
7
0 10 20 30 40 50 60 70 80 90 100 110
Degree of Saturation, %D
epth
, ft.
13-Dec
30-Dec
19-Jan
24-Jan

51
Table C.13 Moisture Profile of SR-70 Soils (Field Test Site No. 2)
5.5 ft. 5.0 ft. 4.0 ft. 3.5 ft. 2.5 ft. 1.5 ft.
12-1 28.89 46.51 61.08 34.15 8.52 15.66 0.00
12-2 28.68 46.51 60.85 34.15 8.52 15.66 0.00
12-3 28.68 46.31 60.85 34.15 8.52 15.42 0.00
12-4 28.47 46.31 60.85 34.15 8.52 15.42 0.00
12-5 28.47 46.31 60.62 34.15 8.52 15.42 0.00
12-6 28.27 46.12 60.62 33.90 8.52 15.42 0.00
12-7 28.27 46.12 60.62 33.90 8.52 15.42 0.00
12-8 28.27 46.12 60.39 33.90 8.52 15.42 0.00
12-9 28.06 46.12 60.39 33.90 8.31 15.42 0.00
12-10 29.31 48.28 60.39 33.90 8.31 15.42 0.00
12-11 28.06 45.92 60.39 33.90 8.31 15.19 0.00
12-12 28.06 45.92 60.39 33.90 8.31 15.19 0.00
12-13 28.06 45.92 60.39 33.90 8.31 15.19 0.00
12-14 27.85 45.92 59.94 33.65 8.31 18.46 0.15
12-15 27.85 45.92 59.94 33.65 8.31 18.70 0.00
12-16 27.64 45.73 59.94 33.65 8.72 18.70 0.00
12-17 27.64 45.73 59.71 33.65 9.53 18.23 0.00
12-18 27.64 45.73 59.71 33.65 9.93 18.23 0.00
12-19 27.64 45.73 59.71 33.65 10.14 17.99 0.00
12-20 27.64 45.73 59.71 33.65 10.34 17.76 0.00
12-21 27.44 45.53 59.71 33.65 10.34 17.76 0.00
12-22 27.44 45.53 59.48 33.65 10.54 17.76 0.00
12-23 27.44 45.53 59.48 33.65 10.54 17.53 0.00
12-24 27.44 45.53 59.48 33.65 10.54 17.53 0.00
12-25 27.44 45.53 59.48 33.65 10.54 17.53 0.00
12-26 27.44 45.53 59.48 33.65 10.54 17.53 0.00
12-27 27.44 45.53 59.48 33.65 10.34 17.29 0.00
12-28 27.44 45.53 59.48 33.65 10.34 17.06 0.00
12-29 27.44 45.53 59.48 33.65 10.34 18.23 0.21
12-30 27.44 45.53 59.48 33.65 11.35 20.10 0.00
12-31 27.23 45.33 59.25 34.15 12.16 20.10 0.00
( )
Date(Mon/Day)
Degree of Saturation (%) (Below the Ground Surface) Rainfall(inch)

52
Table C.14 Moisture Profile of SR-70 Soils (Field Test Site No. 2 Year 2001)
Permanent Total Resilient Permanent Total Resilient
(mm) (mm) (mm) (mm) (mm) (mm)
1 0.1721 0.3599 0.1879 1 0.1528 0.3090 0.1562
4 0.2503 0.4608 0.2105 4 0.2066 0.3580 0.1514
5 0.2875 0.4880 0.2004 5 0.2258 0.3733 0.1475
10 0.3777 0.5676 0.1899 10 0.3252 0.4477 0.1225
25 0.5125 0.6954 0.1829 25 0.4788 0.6057 0.1269
50 0.6254 0.8039 0.1785 50 0.6144 0.7444 0.1300
100 0.7475 0.9234 0.1759 100 0.7698 0.9531 0.1834
200 0.8892 1.0647 0.1755 200 0.9216 1.1221 0.2004
500 1.1378 1.3133 0.1755 1000 1.2940 1.4980 0.2039
1000 1.3168 1.4892 0.1724 2000 1.4516 1.6699 0.2184
2000 1.5255 1.6962 0.1707 10000 1.8839 2.0927 0.2087
5000 1.7185 1.8918 0.1733 25000 2.1972 2.3902 0.1930
10000 1.8857 2.0533 0.1676 30000
15000 2.0253 2.1894 0.1641
20000 2.1246 2.2865 0.1619
25000 2.2086 2.3710 0.1624
30000 2.2795 2.4388 0.1593
Permanent Total Resilient
(mm) (mm) (mm)
1 0.0591 0.2683 0.2092
4 0.0591 0.2814 0.2223
5 0.0569 0.2797 0.2227
10 0.0652 0.2889 0.2236
25 0.0714 0.2902 0.2188
50 0.0775 0.2906 0.2131
100 0.0845 0.3002 0.2157
200 0.0906 0.3059 0.2153
500 0.1016 0.3199 0.2184
1000 0.1278 0.3514 0.2236
2000 0.1585 0.3860 0.2276
5000 0.2398 0.4648 0.2249
30000 0.6626 0.8831 0.2206
Deformation with W.T. at +12 in., 1-L3
LoadCycles
Deformation at Drained Condition, 1-L1 Deformation with W.T. at 0.0 in., 1-L2
LoadCycles
LoadCycles

53
Figure C.15 Degree of Saturation vs. Date and Precipitation (Field Test Site No.2 -- Winter 2000/2001)
Degree of Saturation vs. Date & Precipitation (Field Test Site No.2)
0
10
20
30
40
50
60
11/25 12/5 12/15 12/25 1/4 1/14 1/24 2/3
Date, Mon/Day/2000(2001)
Deg
ree
of S
atur
atio
n,
%
5.5 ft.
5 ft.
3.5 ft.
2.5 ft.
1.5 ft.
Rain
0.3
0.6
0.5
0.4
0.2
0.1

54
Figure C.16 Degree of Saturation vs. Depth (Field Test Site No.2 -- Winter 2000/2001)
Depth vs. Degree of Saturation (Field Test Site No.2)
0
1
2
3
4
5
6
7
0 10 20 30 40 50 60 70 80 90 100 110
Degree of Saturation, %D
epth
, ft
.
13-Dec
30-Dec
19-Jan
24-Jan
55
APPENDIX D
LABORATORY RESILIENT MODULUS TEST RESULTS
D.1 LEVY COUNTY A-3 SOIL
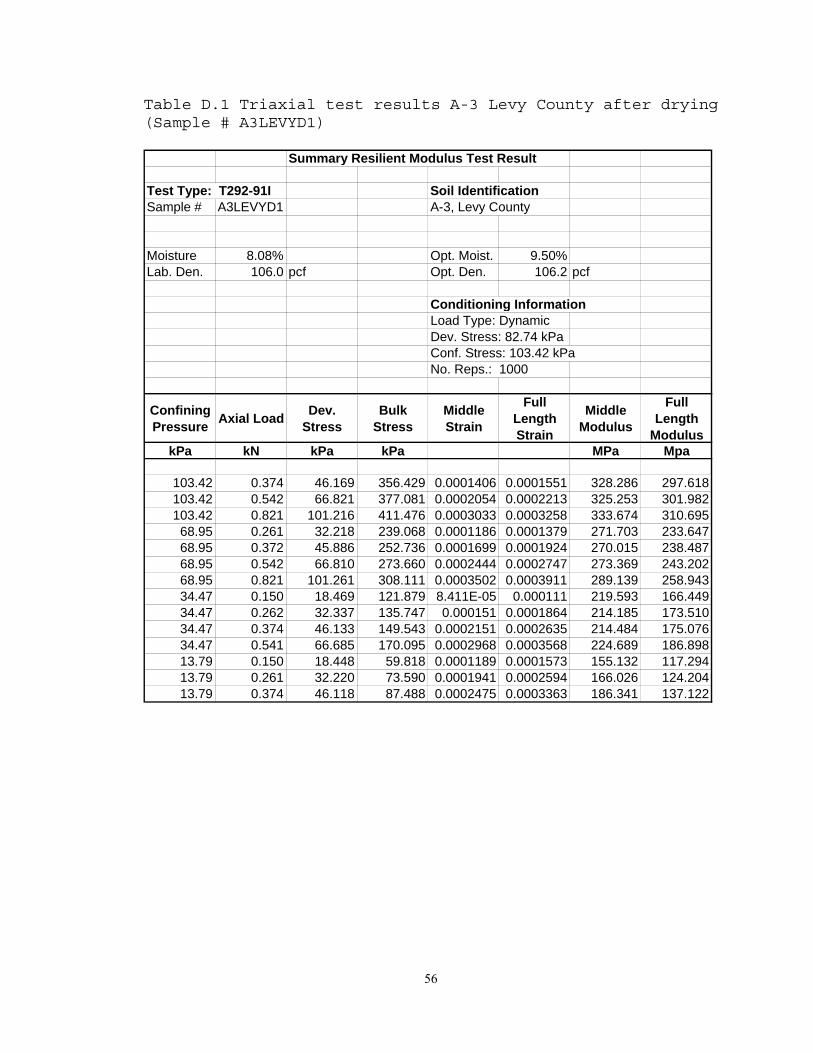
56
Table D.1 Triaxial test results A-3 Levy County after drying (Sample # A3LEVYD1)
Summary Resilient Modulus Test Result
Test Type: T292-91I Soil IdentificationSample # A3LEVYD1 A-3, Levy County
Moisture 8.08% Opt. Moist. 9.50%Lab. Den. 106.0 pcf Opt. Den. 106.2 pcf
Conditioning InformationLoad Type: DynamicDev. Stress: 82.74 kPaConf. Stress: 103.42 kPaNo. Reps.: 1000
Confining Pressure Axial Load Dev.
StressBulk
StressMiddle Strain
Full Length Strain
Middle Modulus
Full Length
ModuluskPa kN kPa kPa MPa Mpa
103.42 0.374 46.169 356.429 0.0001406 0.0001551 328.286 297.618103.42 0.542 66.821 377.081 0.0002054 0.0002213 325.253 301.982103.42 0.821 101.216 411.476 0.0003033 0.0003258 333.674 310.695
68.95 0.261 32.218 239.068 0.0001186 0.0001379 271.703 233.64768.95 0.372 45.886 252.736 0.0001699 0.0001924 270.015 238.48768.95 0.542 66.810 273.660 0.0002444 0.0002747 273.369 243.20268.95 0.821 101.261 308.111 0.0003502 0.0003911 289.139 258.94334.47 0.150 18.469 121.879 8.411E-05 0.000111 219.593 166.44934.47 0.262 32.337 135.747 0.000151 0.0001864 214.185 173.51034.47 0.374 46.133 149.543 0.0002151 0.0002635 214.484 175.07634.47 0.541 66.685 170.095 0.0002968 0.0003568 224.689 186.89813.79 0.150 18.448 59.818 0.0001189 0.0001573 155.132 117.29413.79 0.261 32.220 73.590 0.0001941 0.0002594 166.026 124.20413.79 0.374 46.118 87.488 0.0002475 0.0003363 186.341 137.122

57
1025 6 7 8 9 2 3 4 5
B UL K S T RE S S , kP a
102
103
2
3
4
5
6
789
RE
SIL I
EN
T M
OD
ULU
S, M
Pa
FRO M L V DT A T M IDDL E HA L FFRO M L V DT A T FUL L L E NG T H
y=13 .35x0 .5 2 1 5
R 2=0 .994
y=31 .24x0 .3 4 2 5
R 2=0 .9836
Figure D.1 Resilient Modulus vs. Bulk Stress for A-3 Levy County after drying (Sample # A3LEVYD1) Figure D.2 Resilient Modulus vs. Confining Stress for A-3 Levy County after drying (Sample # A3LEVYD1)
101 1022 3 4 5 6 7 8 9
CONFINING PRESSURE, kPa
102
5
6
7
89
2
3
4
RE
SIL
IEN
T M
OD
ULU
S, M
Pa
FROM LVDT AT MIDDLE HALFFROM LVDT AT FULL LENGTH
y = 39.488 x0.4331
R2=0.9921
y=70.596x0.3262
R2=0.9921

58
Table D.2 Triaxial test results of A-3 Levy County after drying (Sample # A3LEVYD2)
Summary Resilient Modulus Test Result
Test Type: T292-91I Soil IdentificationSample No. A3LEVYD2 Levy A-3
Moisture 4.30% Opt. Moist. 9.60%Lab. Den. 105.8 pcf Opt. Den. 106.2 pcf
Conditioning InformationLoad Type: DynamicDev. Stress: 82.74 kPaConf. Stress: 103.42 kPaNo. Reps.: 1000
Confining Pressure Axial Load Dev.
StressBulk
StressMiddle Strain
Full Length Strain
Middle Modulus
Full Length
ModuluskPa kN kPa kPa MPa Mpa
103.42 0.373 46.046 356.306 0.0001396 0.0001629 329.813 282.690103.42 0.541 66.768 377.028 0.0002011 0.0002277 331.936 293.178103.42 0.820 101.187 411.447 0.000293 0.0003316 345.332 305.159
68.95 0.262 32.292 239.142 0.0001194 0.0001495 270.343 215.95868.95 0.374 46.148 252.998 0.0001663 0.0002088 277.453 221.04068.95 0.541 66.787 273.637 0.0002429 0.0002885 275.003 231.49968.95 0.821 101.210 308.060 0.0003442 0.0004014 294.037 252.14434.47 0.150 18.507 121.917 8.997E-05 0.0001273 205.695 145.34034.47 0.261 32.220 135.630 0.0001579 0.0002135 204.073 150.90034.47 0.374 46.150 149.560 0.0002234 0.0002889 206.598 159.72934.47 0.541 66.715 170.125 0.0003023 0.0003775 220.674 176.73713.79 0.149 18.394 59.764 0.0001213 0.0002083 151.583 88.28313.79 0.261 32.190 73.560 0.0002005 0.0003081 160.581 104.47713.79 0.374 46.124 87.494 0.0002587 0.0003753 178.280 122.890

59
1025 6 7 8 9 2 3 4 5
BULK ST RESS, kPa
102
7
89
2
3
4
5
RES
ILIE
NT
MO
DU
L US,
MP
a
FROM LVDT AT M IDDLE HALFFROM LVDT AT FULL LENGT H
y=7.1728x0.6227
R2=0.9967
y=25.178x0.4316
R2=0.9877
Figure D.3 Resilient Modulus vs. Bulk Stress for A-3 Levy County after drying (Sample # A3LEVYD2)
Figure D.4 Resilient Modulus vs. Confining Stress for A-3 Levy County after drying (Sample # A3LEVYD2)
101 1022 3 4 5 6 7 8 9
CONFINING PRESSURE, kPa
102
5
6
7
89
2
3
4
RES
ILIE
NT
MO
DU
LUS,
MPa
FROM LVDT AT MIDDLE HALFFROM LVDT AT FULL LENGTH
y = 27.188 x0.5074
R2=0.9958
y=62.277x0.3566
R2=0.9853

60
Table D.3 Triaxial test results of A-3 Levy County at optimum condition (A3LEVYO1)
Summary Resilient Modulus Test Result
Test Type: T292-91I Soil IdentificationSample No: A3LEVYO1 A-3
levy county
Lab. Moist. 9.50% Opt. Moist. 9.50%Lab. Den. 105.6 pcf Opt. Den. 106.2 pcf
Conditioning InformationLoad Type: DynamicDev. Stress: 82.74 kPaConf. Stress: 103.42 kPaNo. Reps.: 1000
Confining Pressure Axial Load Dev.
StressBulk
StressMiddle Strain
Full Length Strain
Middle Modulus
Full Length
ModuluskPa kN kPa kPa MPa Mpa
103.42 0.375 46.219 356.479 0.0001553 0.000178 297.523 259.624103.42 0.542 66.792 377.052 0.0002251 0.0002551 296.728 261.841103.42 0.822 101.449 411.709 0.0003338 0.0003769 303.951 269.150
68.95 0.262 32.314 239.164 0.0001319 0.000149 244.945 216.92868.95 0.375 46.205 253.055 0.000191 0.0002159 241.919 214.00568.95 0.543 66.945 273.795 0.0002737 0.0003115 244.627 214.92268.95 0.822 101.392 308.242 0.0003877 0.0004402 261.540 230.32634.47 0.152 18.774 122.184 9.851E-05 0.0001169 190.577 160.61834.47 0.263 32.460 135.870 0.000177 0.0002045 183.340 158.72634.47 0.377 46.440 149.850 0.0002537 0.000293 183.060 158.51234.47 0.544 67.121 170.531 0.0003395 0.0003959 197.732 169.55313.79 0.151 18.685 60.055 0.0001448 0.0001761 129.007 106.11613.79 0.265 32.673 74.043 0.0002299 0.0002822 142.107 115.77613.79 0.382 47.058 88.428 0.0003069 0.0003771 153.331 124.775

61
1025 6 7 8 9 2 3 4 5
BULK ST RESS, kPa
102
89
2
3
4
5
RE
SILI
ENT
MO
DU
LUS
, MPa
FROM LVDT AT M IDDLE HALFFROM LVDT AT FULL LENGT H
y=14.163x0.4911
R2=0.9894
y=20.788x0.4434
R2=0.9856
Figure D.5 Resilient Modulus vs. Bulk Stress for A-3 Levy County at optimum moisture (Sample # A3LEVYO1)
101 1022 3 4 5 6 7 8 9
CO NFINING P RE S S URE , kP a
102
5
6
7
89
2
3
4
RES
ILIE
NT
MO
DU
L US,
MP
a
FRO M L V DT A T M IDDL E HA L FFRO M L V DT A T FUL L L E NG T H
y = 38.978 x0.4089
R2=0.9975
y=52.603x0.3696
R 2=0.9934
Figure D.6 Resilient Modulus vs. Confining Stress for A-3 Levy County at optimum moisture (Sample # A3LEVYO1)

62
Table D.4 Triaxial test results of A-3 Levy County at optimum condition (Sample # A3LEVYO2)
Summary Resilient Modulus Test Result
Test Type: T292-91I Soil IdentificationSample No. A3LEVYO2 Levy County A-3
Lab. Moist. 9.60% Opt. Moist. 9.60%Lab. Den. 105.8 Opt. Den. 106.2
Conditioning InformationLoad Type: DynamicDev. Stress: 82.74 kPaConf. Stress: 103.42 kPaNo. Reps.: 1000
Confining Pressure Axial Load Dev.
StressBulk
StressMiddle Strain
Full Length Strain
Middle Modulus
Full Length
ModuluskPa kN kPa kPa MPa Mpa
103.42 0.373 46.022 356.282 0.0001398 0.0001569 329.230 293.408103.42 0.541 66.772 377.032 0.0002034 0.0002217 328.300 301.173103.42 0.822 101.390 411.650 0.0003034 0.0003312 334.226 306.167
68.95 0.262 32.320 239.170 0.0001227 0.0001381 263.360 234.02068.95 0.373 46.048 252.898 0.0001753 0.0001987 262.694 231.80468.95 0.541 66.791 273.641 0.0002498 0.0002829 267.427 236.09668.95 0.822 101.363 308.213 0.0003599 0.0004029 281.649 251.58134.47 0.150 18.494 121.904 9.687E-05 0.0001349 190.917 137.11734.47 0.262 32.309 135.719 0.0001687 0.000226 191.466 142.95034.47 0.374 46.111 149.521 0.0002379 0.0003053 193.856 151.03234.47 0.542 66.813 170.223 0.0003161 0.0003969 211.359 168.35013.79 0.150 18.535 59.905 0.0001401 0.0002271 132.273 81.62113.79 0.262 32.294 73.664 0.0002149 0.0003322 150.248 97.20113.79 0.374 46.101 87.471 0.0002846 0.0004204 162.003 109.671

63
Figure D.7 Resilient Modulus vs. Bulk Stress for A-3 Levy County at optimum moisture (Sample # A3LEVYO2)
Figure D.8 Resilient Modulus vs. Confining Stress for A-3 Levy County at optimum moisture (Sample # A3LEVYO2)
1025 6 7 8 9 2 3 4 5
BULK STRESS, kPa
102
6
7
89
2
3
4
5
6R
ESIL
IEN
T M
OD
ULU
S, M
PaFROM LVDT AT MIDDLE HALFFROM LVDT AT FULL LENGTH
y=4.7729x0 .6 9 7 2
R 2=0.9952
y=18.461x0.3966
R 2=0.9877
101 1022 3 4 5 6 7 8 9
CONFINING PRESSURE, kPa
102
5
6
7
89
2
3
4
RES
ILIE
NT
MO
DU
LUS,
MP a
FROM LVDT AT MIDDLE HALFFROM LVDT AT FULL LENGTH
y = 20.896 x0.5717
R2=0.9949
y=50.813x0.3966
R2=0.9877

64
Table D.5 Triaxial test results of A-3 Levy County after soaking (Sample # A3LEVYS1)
Note: soaked one month, three times conditioning
Summary Resilient Modulus Test Result
Test Type: T292-91I Soil IdentificationSample No. A3LEVYS1 A-3
Levy county
Moisture 13.47% Opt. Moist. 9.50%Lab. Den. 105.8 pcf Opt. Den. 106.2 pcf
Conditioning InformationLoad Type: DynamicDev. Stress: 82.74 kPaConf. Stress: 103.42 kPaNo. Reps.: 1000
Confining Pressure Axial Load Dev.
StressBulk
StressMiddle Strain
Full Length Strain
Middle Modulus
Full Length
ModuluskPa kN kPa kPa MPa Mpa
103.42 0.373 46.058 356.318 7.842E-05 0.0001538 587.313 299.393103.42 0.542 66.804 377.064 0.0001415 0.0002172 472.092 307.595103.42 0.821 101.295 411.555 0.0002346 0.0003247 431.812 311.971
68.95 0.261 32.228 239.078 5.446E-05 0.000128 591.726 251.81368.95 0.374 46.130 252.980 0.0001112 0.0001851 414.943 249.24468.95 0.542 66.808 273.658 0.0001899 0.0002652 351.730 251.88768.95 0.822 101.333 308.183 0.0003027 0.0003949 334.802 256.58234.47 0.150 18.467 121.877 3.654E-05 0.0001019 505.423 181.20934.47 0.261 32.152 135.562 0.0001069 0.0001769 300.873 181.76134.47 0.373 45.988 149.398 0.0001743 0.0002512 263.910 183.05534.47 0.541 66.726 170.136 0.0002663 0.0003542 250.572 188.38013.79 0.150 18.441 59.811 7.67E-05 0.0001472 240.431 125.31313.79 0.262 32.290 73.660 0.0001686 0.0002512 191.554 128.53113.79 0.374 46.111 87.481 0.0002408 0.0003404 191.499 135.451

65
1025 6 7 8 9 2 3 4 5
BULK ST RESS, kPa
102
103
2
3
4
5
6789
RE
SILI
ENT
MO
DU
L US,
MPa
FROM LVDT AT MIDDLE HALFFROM LVDT AT FULL LENGT H
y=15.076x0.5043
R2=0.9819
y=25.178x0.4246
R2=0.9932
Figure D.9 Resilient Modulus vs. Bulk Stress for A-3 Levy County after soaking (Sample # A3LEVYS1)
101 1022 3 4 5 6 7 8 9
CO NFINING P RE S S URE , kP a
102
5
6
789
2
3
4
5
6
RES
ILIE
NT
MO
DU
LUS,
MPa
FRO M L V DT A T M IDDL E HA L FFRO M L V DT A T FUL L L E NG T H
y = 41.749 x0.4261
R2=0.997
y=68.959x0.4246
R 2=0.9932
Figure D.10 Resilient Modulus vs. Confining Stress for A-3 Levy County after soaking (Sample # A3LEVYS1)

66
Table D.6 Triaxial test results of A-3 Levy County after soaking (Sample # A3LEVYS2)
Summary Resilient Modulus Test Result
Test Type: T292-91I Soil IdentificationSample No. A3LEVYS2 Levy County A-3
Moisture 15% Opt. Moist. 9.60%Lab. Den. 105.4 pcf Opt. Den. 106.2 pcf
Conditioning InformationLoad Type: DynamicDev. Stress: 82.74 kPaConf. Stress: 103.42 kPaNo. Reps.: 1000
Confining Pressure Axial Load Dev.
StressBulk
StressMiddle Strain
Full Length Strain
Middle Modulus
Full Length
ModuluskPa kN kPa kPa MPa Mpa
103.42 0.375 46.200 356.460 0.0001441 0.000189 320.620 244.499103.42 0.541 66.736 376.996 0.0002055 0.000268 324.819 248.987103.42 0.821 101.257 411.517 0.0003016 0.0003908 335.697 259.076
68.95 0.261 32.233 239.083 0.0001224 0.0001732 263.396 186.07468.95 0.374 46.126 252.976 0.0001774 0.000243 260.070 189.79068.95 0.541 66.709 273.559 0.0002539 0.0003411 262.751 195.58968.95 0.821 101.254 308.104 0.0003714 0.0004891 272.598 207.02534.47 0.150 18.551 121.961 0.0001005 0.0001497 184.604 123.88234.47 0.261 32.229 135.639 0.0001732 0.0002549 186.057 126.44634.47 0.373 45.990 149.400 0.0002442 0.000351 188.300 131.03234.47 0.541 66.777 170.187 0.0003308 0.0004697 201.890 142.17113.79 0.151 18.577 59.947 0.0001579 0.0002635 117.663 70.50013.79 0.261 32.222 73.592 0.0002391 0.0003842 134.783 83.87613.79 0.375 46.201 87.571 0.0003497 0.000516 132.109 89.534

67
1025 6 7 8 9 2 3 4 5
BULK STRESS, kPa
102
5
6
789
2
3
4
5
RE
SILI
ENT
MO
DU
LUS
, MP
a
FROM LVDT AT MIDDLE HALFFROM LVDT AT FULL LENGTH
y=4.6188x0.6708
R2=0.9954
y=12.224x0.5512
R2=0.9864
Figure D.11 Resilient Modulus vs. Bulk Stress for A-3 Levy County after soaking (Sample # A3LEVYS2)
101 1022 3 4 5 6 7 8 9
CONFINING PRESSURE, kPa
102
5
6
7
89
2
3
4
RES
ILIE
NT
MO
DU
LUS
, MPa
FROM LVDT AT M IDDLE HALFFROM LVDT AT FULL LENGT H
y = 18.598 x0.5571
R2=0.9986
y=37.59x0.4631
R2=0.9985
Figure D.12 Resilient Modulus vs. Confining Stress for A-3 Levy County after soaking (Sample # A3LEVYS2)

68
Table D.7 Triaxial test results of A-3 Levy County after soaking (Sample # A3LEVYS3)
Summary Resilient Modulus Test Result
Test Type: T292-91I Soil IdentificationSample No. A3LEVYS3 Levy County, A-3
Moisture 15.27% Opt. Moist. 9.60%Lab. Den. 105.1 pcf Opt. Den. 106.2 pcf
Conditioning InformationLoad Type: DynamicDev. Stress: 82.74 kPaConf. Stress: 103.42 kPaNo. Reps.: 1000
Confining Pressure Axial Load Dev.
StressBulk
StressMiddle Strain
Full Length Strain
Middle Modulus
Full Length
ModuluskPa kN kPa kPa MPa Mpa
103.42 0.373 46.067 356.327 0.0001275 0.000187 361.171 246.326103.42 0.542 66.914 377.174 0.0001925 0.0002639 347.549 253.523103.42 0.822 101.365 411.625 0.0002928 0.0003861 346.138 262.536
68.95 0.263 32.454 239.304 0.0001039 0.000178 312.254 182.36168.95 0.375 46.264 253.114 0.0001619 0.0002501 285.844 184.94768.95 0.543 66.933 273.783 0.0002427 0.0003465 275.799 193.19268.95 0.823 101.475 308.325 0.0003542 0.0004854 286.486 209.04334.47 0.151 18.596 122.006 7.205E-05 0.0001627 258.100 114.31734.47 0.263 32.413 135.823 0.0001524 0.0002719 212.727 119.20634.47 0.374 46.183 149.593 0.0002234 0.0003723 206.743 124.04334.47 0.542 66.885 170.295 0.0003111 0.0004947 214.985 135.20613.79 0.151 18.569 59.939 0.0001193 0.0002648 155.685 70.12713.79 0.262 32.354 73.724 0.000207 0.0004197 156.294 77.08713.79 0.375 46.262 87.632 0.0002789 0.0005343 165.883 86.579

69
1025 6 7 8 9 2 3 4 5
BULK ST RESS, kPa
102
4
5
6789
2
3
4
5
RE
SILI
EN
T M
OD
ULU
S, M
Pa
FROM LVDT AT M IDDLE HALFFROM LVDT AT FULL LENGT H
y=3.717x0.7073
R2=0.9965
y=56.975x0.3884
R2=0.9978
Figure D.13 Resilient Modulus vs. Bulk Stress for A-3 Levy County after soaking (Sample # A3LEVYS3)
101 1022 3 4 5 6 7 8 9
CO NFINING P RE S S URE , kP a
102
5
6
7
89
2
3
4
RES
ILIE
NT
MO
DU
LUS,
MPa
FRO M L V DT A T M IDDL E HA L FFRO M L V DT A T FUL L L E NG T H
y = 16.271 x0.3854
R2=0.9946
y=56.975x0.3884
R2=0.9978
Figure D.14 Resilient Modulus vs. Confining Stress for A-3 Levy County after soaking (Sample # A3LEVYS3)

70
D.2 SR70 A-3 8% SOIL
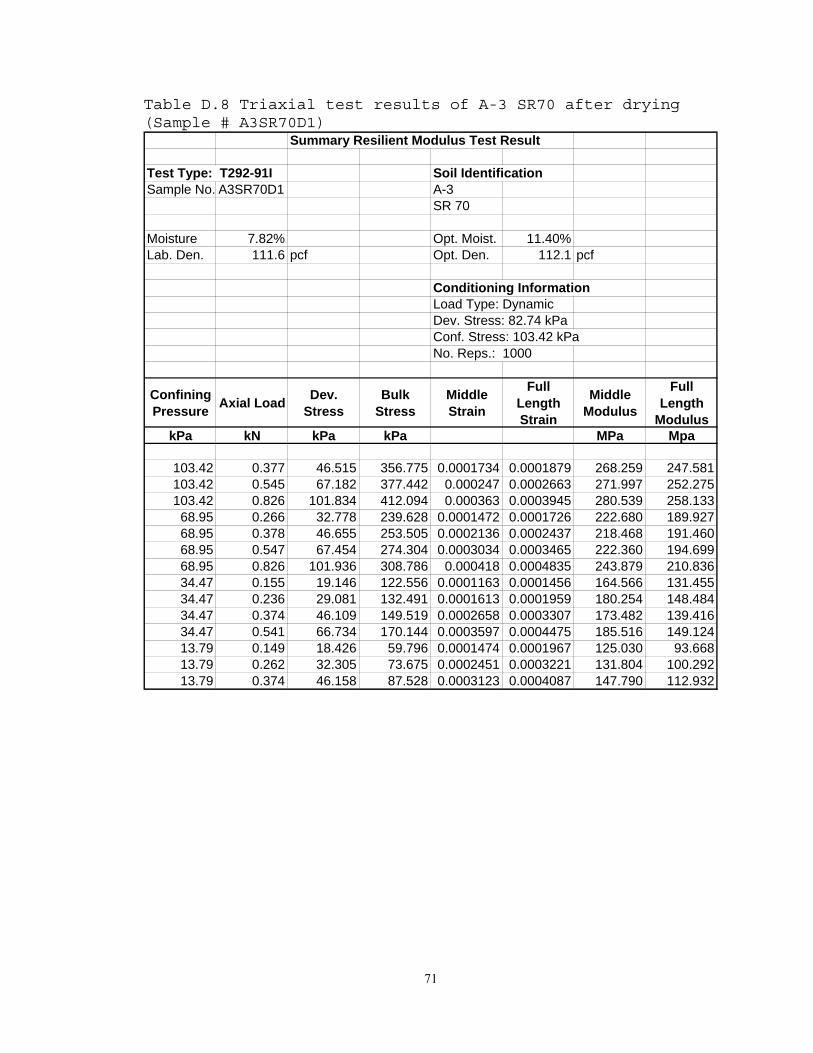
71
Table D.8 Triaxial test results of A-3 SR70 after drying (Sample # A3SR70D1)
Summary Resilient Modulus Test Result
Test Type: T292-91I Soil IdentificationSample No. A3SR70D1 A-3
SR 70
Moisture 7.82% Opt. Moist. 11.40%Lab. Den. 111.6 pcf Opt. Den. 112.1 pcf
Conditioning InformationLoad Type: DynamicDev. Stress: 82.74 kPaConf. Stress: 103.42 kPaNo. Reps.: 1000
Confining Pressure Axial Load Dev.
StressBulk
StressMiddle Strain
Full Length Strain
Middle Modulus
Full Length
ModuluskPa kN kPa kPa MPa Mpa
103.42 0.377 46.515 356.775 0.0001734 0.0001879 268.259 247.581103.42 0.545 67.182 377.442 0.000247 0.0002663 271.997 252.275103.42 0.826 101.834 412.094 0.000363 0.0003945 280.539 258.133
68.95 0.266 32.778 239.628 0.0001472 0.0001726 222.680 189.92768.95 0.378 46.655 253.505 0.0002136 0.0002437 218.468 191.46068.95 0.547 67.454 274.304 0.0003034 0.0003465 222.360 194.69968.95 0.826 101.936 308.786 0.000418 0.0004835 243.879 210.83634.47 0.155 19.146 122.556 0.0001163 0.0001456 164.566 131.45534.47 0.236 29.081 132.491 0.0001613 0.0001959 180.254 148.48434.47 0.374 46.109 149.519 0.0002658 0.0003307 173.482 139.41634.47 0.541 66.734 170.144 0.0003597 0.0004475 185.516 149.12413.79 0.149 18.426 59.796 0.0001474 0.0001967 125.030 93.66813.79 0.262 32.305 73.675 0.0002451 0.0003221 131.804 100.29213.79 0.374 46.158 87.528 0.0003123 0.0004087 147.790 112.932

72
1025 6 7 8 9 2 3 4 5
B UL K S T RE S S , kP a
102
7
8
9
2
3
4
RES
ILIE
NT
MO
DU
LUS ,
MPa
FRO M L V DT A T M IDDL E HA L FFRO M L V DT A T FUL L L E NG T H
y=10.287x0.532
R 2=0.9853
y=22.126x0.4192
R 2=0.9881
Figure D.15 Resilient Modulus vs. Bulk Stress for A-3 SR70 after drying (Sample # A3SR70D1)
101 1022 3 4 5 6 7 8 9
CO NFINING P RE S S URE , kP a
102
5
6
7
89
2
3
4
RES
ILIE
NT
MO
DU
LUS,
MPa
FRO M L V DT A T M IDDL E HA L FFRO M L V DT A T FUL L L E NG T H
y = 31.058 x0.4426
R2=0.9877
y=53.132x0.3471
R2=0.991
Figure D.16 Resilient Modulus vs. Confining Stress for A-3 SR70 after drying (Sample # A3SR70D1)

73
Table D.9 Triaxial test results of A-3 SR70 after drying (Sample # A3SR70D2)
Summary Resilient Modulus Test Result
Test Type: T292-91I Soil IdentificationSample No. A3SR70D2 A-3
SR 70
Lab. Moist. 5.31% Opt. Moist. 11.40%Lab. Den. 110.7 pcf Opt. Den. 112.1 pcf
Conditioning InformationLoad Type: DynamicDev. Stress: 82.74 kPaConf. Stress: 103.42 kPaNo. Reps.: 1000
Confining Pressure Axial Load Dev.
StressBulk
StressMiddle Strain
Full Length Strain
Middle Modulus
Full Length
ModuluskPa kN kPa kPa MPa Mpa
103.42 0.374 46.080 356.340 0.0001365 0.0001558 337.563 295.812103.42 0.539 66.541 376.801 0.0001943 0.0002254 342.553 295.254103.42 0.821 101.214 411.474 0.0002828 0.0003359 357.843 301.323
68.95 0.260 32.040 238.890 0.0001113 0.0001237 287.755 259.07468.95 0.376 46.417 253.267 0.0001651 0.0001892 281.108 245.37068.95 0.540 66.660 273.510 0.0002325 0.0002721 286.691 244.96368.95 0.820 101.102 307.952 0.0003361 0.0003971 300.807 254.60934.47 0.151 18.643 122.053 8.067E-05 9.868E-05 231.118 188.92634.47 0.261 32.182 135.592 0.000145 0.0001773 222.013 181.49034.47 0.374 46.077 149.487 0.000213 0.0002553 216.283 180.46834.47 0.542 66.815 170.225 0.0002932 0.000359 227.893 186.14013.79 0.150 18.471 59.841 0.0001072 0.000156 172.289 118.41113.79 0.261 32.224 73.594 0.0001932 0.0002682 166.774 120.12813.79 0.373 46.058 87.428 0.0002615 0.0003622 176.147 127.167

74
1025 6 7 8 9 2 3 4 5
B UL K S T RE S S , kP a
102
103
2
3
4
5
6789
RES
ILIE
NT
MO
DU
LUS ,
MPa
FRO M L V DT A T M IDDL E HA L FFRO M L V DT A T FUL L L E NG T H
y=13.622x0.5195
R 2=0.9654
y=30.211x0.4057
R 2=0.9652
Figure D.17 Resilient Modulus vs. Bulk Stress for A-3 SR70 after drying (Sample # A3SR70D2)
101 1022 3 4 5 6 7 8 9
CONFINING PRESSURE, kPa
102
5
6
7
89
2
3
4
RES
ILIE
NT
MO
DU
LUS,
MPa
FROM LVDT AT M IDDLE HALFFROM LVDT AT FULL LENGT H
y = 38.13 x0.444
R2=0.9998
y=68.22x0.3446
R2=0.9925
Figure D.18 Resilient Modulus vs. Confining Stress for A-3 SR70 after drying (Sample # A3SR70D2)

75
Table D.10 Triaxial test results of A-3 SR70 after drying (Sample # A3SR70D3)
Summary Resilient Modulus Test Result
Test Type: T292-91I Soil IdentificationSample No. A3SR70D3 A-3, SR70
Lab. Moist. 4.48% Opt. Moist. 11.40%Lab. Den. 108.8 pcf Opt. Den. 112.1 pcf
Conditioning InformationLoad Type: DynamicDev. Stress: 82.74 kPaConf. Stress: 103.42 kPaNo. Reps.: 1000
Confining Pressure Axial Load Dev.
StressBulk
StressMiddle Strain
Full Length Strain
Middle Modulus
Full Length
ModuluskPa kN kPa kPa MPa Mpa
103.42 0.374 46.114 356.374 0.0001136 0.0001284 405.987 359.112103.42 0.541 66.757 377.017 0.0001705 0.0001859 391.616 359.023103.42 0.821 101.206 411.466 0.000258 0.0002807 392.235 360.497
68.95 0.262 32.301 239.151 8.98E-05 0.0001105 359.705 292.24068.95 0.374 46.109 252.959 0.0001305 0.0001532 353.386 300.99068.95 0.542 66.838 273.688 0.0001963 0.0002249 340.459 297.14068.95 0.821 101.282 308.132 0.0002982 0.0003344 339.660 302.88634.47 0.149 18.367 121.777 5.808E-05 8.942E-05 316.212 205.41434.47 0.262 32.320 135.730 0.0001126 0.000151 287.160 213.99134.47 0.374 46.135 149.545 0.0001603 0.0002124 287.815 217.16734.47 0.541 66.724 170.134 0.0002384 0.0002995 279.915 222.79713.79 0.150 18.475 59.845 7.704E-05 0.0001747 239.797 105.73113.79 0.262 32.267 73.637 0.0001463 0.0003066 220.508 105.24313.79 0.374 46.131 87.501 0.0002104 0.000396 219.204 116.490

76
1025 6 7 8 9 2 3 4 5
BULK STRESS, kPa
102
89
2
3
4
5
6
7
RES
ILIE
NT
MO
DU
LUS
, MPa
FROM LVDT AT MIDDLE HALFFROM LVDT AT FULL LENGTH
y=6.3577x0.6873
R2=0.9482
y=61.92x0.3097
R2=0.8779
Figure D.19 Resilient Modulus vs. Bulk Stress for A-3 SR70 after drying (Sample # A3SR70D3)
101 1022 3 4 5 6 7 8 9
CO NFINING P RE S S URE , kP a
102
5
6
789
2
3
4
5
RES
ILIE
NT
MO
DU
L US
, MPa
FRO M L V DT A T M IDDL E HA L FFRO M L V DT A T FUL L L E NG T H
y = 24.396 x0.5898
R2=0.9852
y=110.3x0.2744
R2=0.9988
Figure D.20 Resilient Modulus vs. Confining Stress for A-3 SR70 after drying (Sample # A3SR70D3)

77
Table D.11 Triaxial test results of A-3 SR70 after drying (Sample # A3LEVYD4)
Summary Resilient Modulus Test Result
Test Type: T292-91I Soil IdentificationSample No. A3LEVYD4 A-3
SR 70
Moisture 4.00% Opt. Moist. 11.40%Lab. Den. 110.63 pcf Opt. Den. 112.1 pcf
Conditioning InformationLoad Type: DynamicDev. Stress: 82.74 kPaConf. Stress: 103.42 kPaNo. Reps.: 1000
Confining Pressure Axial Load Dev.
StressBulk
StressMiddle Strain
Full Length Strain
Middle Modulus
Full Length
ModuluskPa kN kPa kPa MPa Mpa
103.42 0.373 45.997 356.257 7.084E-05 0.0001461 649.281 314.876103.42 0.541 66.706 376.966 0.0001305 0.0002124 511.226 313.996103.42 0.822 101.446 411.706 0.0002286 0.00032 443.857 317.065
68.95 0.262 32.277 239.127 5.637E-05 0.0001344 572.625 240.07468.95 0.373 45.999 252.849 0.0001041 0.0001874 441.831 245.39768.95 0.542 66.813 273.663 0.0001787 0.00027 373.796 247.48668.95 0.819 101.051 307.901 0.0002875 0.0003956 351.477 255.45134.47 0.150 18.494 121.904 3.844E-05 0.0001051 481.124 175.89234.47 0.262 32.315 135.725 9.084E-05 0.0001864 355.742 173.38834.47 0.373 46.029 149.439 0.0001562 0.0002648 294.753 173.82934.47 0.541 66.753 170.163 0.0002439 0.000368 273.694 181.39313.79 0.150 18.534 59.904 5.206E-05 0.0001637 356.019 113.18413.79 0.262 32.279 73.649 0.0001325 0.0002665 243.520 121.11113.79 0.374 46.148 87.518 0.0002062 0.0003583 223.858 128.796

78
1025 6 7 8 9 2 3 4 5
B UL K S T RE S S , kP a
102
89
2
3
4
5
6
7
RES
ILIE
NT
MO
DU
LUS ,
MPa
FRO M L V DT A T M IDDL E HA L FFRO M L V DT A T FUL L L E NG T H
y=11.063x0.5585
R 2=0.9829
y=69.883x0.3252
R2=0.4158
Figure D.21 Resilient Modulus vs. Bulk Stress for A-3 SR70 after drying (Sample # A3SR70D4)
101 1022 3 4 5 6 7 8 9CO NFINING P RE S S URE , kP a
102
5
6
789
2
3
4
5
6
RES
ILIE
NT
MO
DU
LUS,
MPa
FRO M L V DT A T M IDDL E HA L FFRO M L V DT A T FUL L L E NG T H
y = 34.433 x0.4705
R2=0.9941
y=69.883x0.3252
R2=0.4158
Figure D.22 Resilient Modulus vs. Confining Stress for A-3 SR70 after drying (Sample # A3SR70D4)

79
Table D.12 Triaxial test results of A-3 SR70 at optimum condition (Sample # A3SR70O1)
Summary Resilient Modulus Test Result
Test Type: T292-91I Soil IdentificationSample No. A3SR70O1 A-3, SR70
Lab. Moist. 11.40% Opt. Moist. 11.40%Lab. Den. 111 pcf Opt. Den. 112.1 pcf
Conditioning InformationLoad Type: DynamicDev. Stress: 82.74 kPaConf. Stress: 103.42 kPaNo. Reps.: 1000
Confining Pressure Axial Load Dev.
StressBulk
StressMiddle Strain
Full Length Strain
Middle Modulus
Full Length
ModuluskPa kN kPa kPa MPa Mpa
103.42 0.376 46.353 356.613 0.0001462 0.0001638 317.011 282.956103.42 0.545 67.200 377.460 0.0002105 0.0002338 319.306 287.454103.42 0.826 101.857 412.117 0.0003066 0.0003464 332.264 294.080
68.95 0.264 32.520 239.370 0.0001226 0.0001468 265.203 221.51068.95 0.377 46.544 253.394 0.0001776 0.0002105 262.125 221.08168.95 0.546 67.325 274.175 0.0002532 0.0002971 265.930 226.63468.95 0.826 101.876 308.726 0.0003651 0.0004243 279.027 240.11334.47 0.153 18.882 122.292 9.627E-05 0.0001223 196.132 154.42934.47 0.265 32.626 136.036 0.0001638 0.0002105 199.202 154.97134.47 0.377 46.476 149.886 0.0002328 0.0002936 199.599 158.28534.47 0.545 67.204 170.614 0.0003198 0.000401 210.132 167.57513.79 0.153 18.863 60.233 0.0001269 0.000175 148.612 107.78313.79 0.264 32.586 73.956 0.0002106 0.000291 154.710 111.96613.79 0.377 46.440 87.810 0.0002768 0.0003836 167.797 121.062
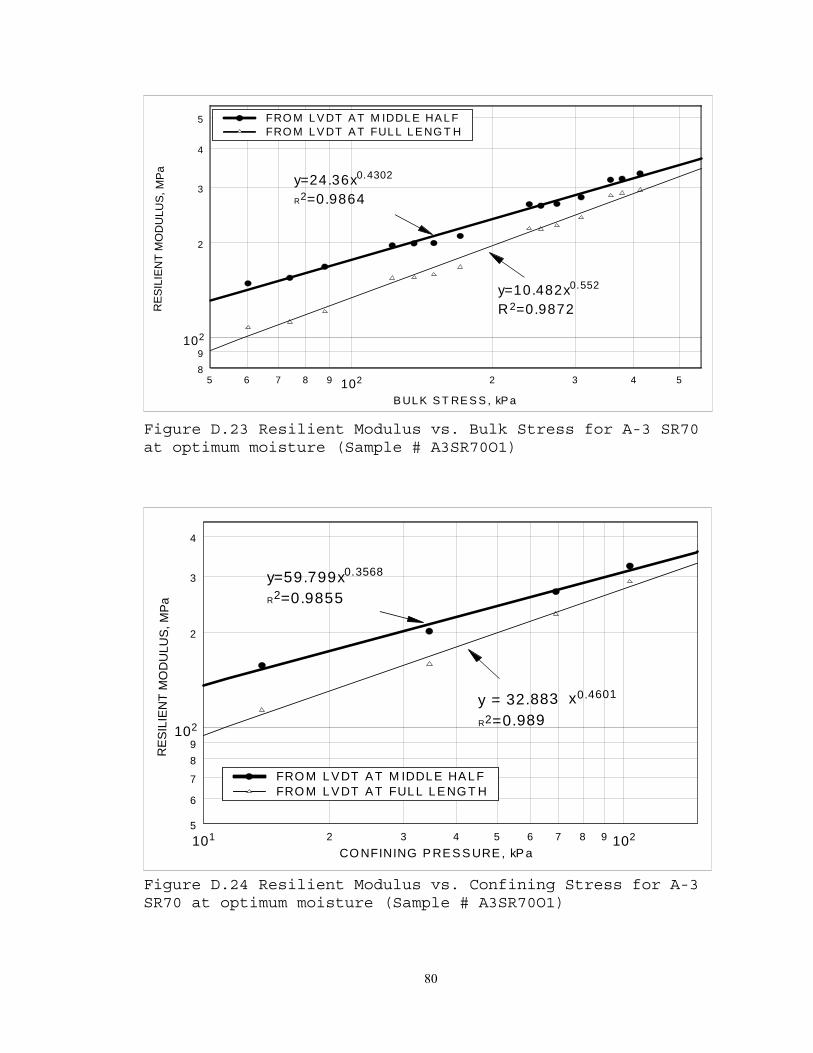
80
1025 6 7 8 9 2 3 4 5
B UL K S T RE S S , kP a
102
89
2
3
4
5
RE
SILI
EN
T M
OD
UL U
S , M
Pa
FRO M L V DT A T M IDDL E HA L FFRO M L V DT A T FUL L L E NG T H
y=10.482x0.552
R 2=0.9872
y=24.36x0.4302
R2=0.9864
Figure D.23 Resilient Modulus vs. Bulk Stress for A-3 SR70 at optimum moisture (Sample # A3SR70O1)
101 1022 3 4 5 6 7 8 9CO NFINING P RE S S URE , kP a
102
5
6
7
89
2
3
4
RES
ILIE
NT
MO
DU
LUS
, MPa
FRO M L V DT A T M IDDL E HA L FFRO M L V DT A T FUL L L E NG T H
y = 32.883 x0.4601
R2=0.989
y=59.799x0.3568
R2=0.9855
Figure D.24 Resilient Modulus vs. Confining Stress for A-3 SR70 at optimum moisture (Sample # A3SR70O1)

81
Table D.13 Triaxial test results at optimum condition for SR70, A-3 (Sample # A3SR70O2)
Summary Resilient Modulus Test Result
Test Type: T292-91I Soil IdentificationDate: 9/21/99 A-3Mold#: 1 SR 70Sample#: 2Lab. Moist. 11.40% Opt. Moist. 11.40%Lab. Den. 110.8 pcf Opt. Den. 112.1 pcf
Conditioning InformationLoad Type: DynamicDev. Stress: 82.74 kPaConf. Stress: 103.42 kPaNo. Reps.: 1000
Confining Pressure Axial Load Dev.
StressBulk
StressMiddle Strain
Full Length Strain
Middle Modulus
Full Length
ModuluskPa kN kPa kPa MPa Mpa
103.42 0.376 46.358 356.618 0.0001431 0.0001593 323.918 291.023103.42 0.542 66.832 377.092 0.000207 0.0002297 322.841 290.970103.42 0.822 101.349 411.609 0.0003045 0.0003369 332.851 300.841
68.95 0.263 32.433 239.283 0.0001173 0.0001369 276.536 236.89968.95 0.375 46.279 253.129 0.0001736 0.0001961 266.582 235.99268.95 0.543 67.015 273.865 0.0002477 0.0002822 270.597 237.46568.95 0.824 101.614 308.464 0.0003591 0.0004079 282.981 249.10034.47 0.152 18.716 122.126 8.801E-05 0.0001109 212.665 168.82134.47 0.263 32.499 135.909 0.0001595 0.0001974 203.785 164.64034.47 0.375 46.294 149.704 0.0002289 0.0002805 202.261 165.04934.47 0.544 67.160 170.570 0.0003145 0.0003842 213.562 174.78613.79 0.151 18.587 59.957 0.0001259 0.0001584 147.641 117.31813.79 0.262 32.358 73.728 0.0002108 0.0002723 153.499 118.82713.79 0.376 46.330 87.700 0.0002795 0.000361 165.751 128.340
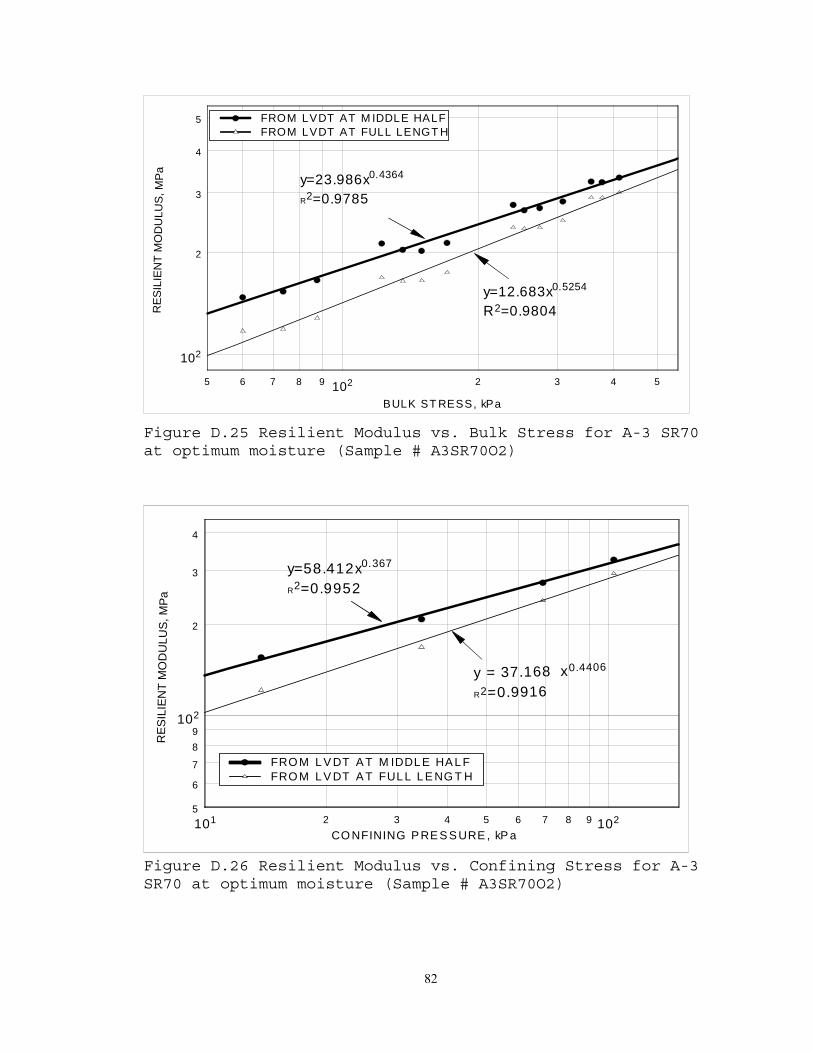
82
1025 6 7 8 9 2 3 4 5
BULK ST RESS, kPa
102
2
3
4
5
RES
ILIE
NT
MO
DU
LUS ,
MPa
FROM LVDT AT M IDDLE HALFFROM LVDT AT FULL LENGT H
y=12.683x0.5254
R2=0.9804
y=23.986x0.4364
R2=0.9785
Figure D.25 Resilient Modulus vs. Bulk Stress for A-3 SR70 at optimum moisture (Sample # A3SR70O2)
101 1022 3 4 5 6 7 8 9CO NFINING P RE S S URE , kP a
102
5
6
7
89
2
3
4
RES
ILIE
NT
MO
DU
L US
, MPa
FRO M L V DT A T M IDDL E HA L FFRO M L V DT A T FUL L L E NG T H
y = 37.168 x0.4406
R2=0.9916
y=58.412x0.367
R2=0.9952
Figure D.26 Resilient Modulus vs. Confining Stress for A-3 SR70 at optimum moisture (Sample # A3SR70O2)

83
Table D.14 Triaxial test results of A-3 SR70 after soaking (Sample # A3SR70S1)
Summary Resilient Modulus Test Result
Test Type: T292-91I Soil IdentificationSample No. A3SR70S1 A-3
SR 70
Lab. Moist. 13.41% Opt. Moist. 11.40%Lab. Den. 109.67 pcf Opt. Den. 112.1 pcf
Conditioning InformationLoad Type: DynamicDev. Stress: 82.74 kPaConf. Stress: 103.42 kPaNo. Reps.: 1000
Confining Pressure Axial Load Dev.
StressBulk
StressMiddle Strain
Full Length Strain
Middle Modulus
Full Length
ModuluskPa kN kPa kPa MPa Mpa
103.42 0.377 46.455 356.715 8.629E-05 0.0001782 538.348 260.634103.42 0.545 67.209 377.469 0.000149 0.0002575 451.128 261.054103.42 0.825 101.797 412.057 0.0002642 0.0003819 385.306 266.570
68.95 0.265 32.656 239.506 7.355E-05 0.0001582 444.023 206.39968.95 0.376 46.349 253.199 0.0001304 0.0002237 355.494 207.23168.95 0.544 67.143 273.993 0.0002163 0.0003175 310.393 211.46768.95 0.824 101.676 308.526 0.0003648 0.0004598 278.738 221.13034.47 0.151 18.587 121.997 7.199E-05 0.0001358 258.188 136.84134.47 0.265 32.628 136.038 0.0001486 0.0002323 219.521 140.47534.47 0.378 46.570 149.980 0.0002279 0.0003222 204.386 144.51634.47 0.546 67.347 170.757 0.0003288 0.0004331 204.843 155.49813.79 0.151 18.576 59.946 0.0001149 0.0002082 161.703 89.23913.79 0.264 32.526 73.896 0.0002101 0.0003309 154.800 98.30713.79 0.380 46.850 88.220 0.0003026 0.0004421 154.825 105.959

84
1025 6 7 8 9 2 3 4 5
BULK ST RESS, kPa
102
6789
2
3
4
5
67
RES
ILIE
NT
MO
DU
LUS,
MP
a
FROM LVDT AT M IDDLE HALFFROM LVDT AT FULL LENGT H
y=7.6672x0.5929
R2=0.9937
y=12.284x0.5942
R2=0.7924
Figure D.27 Resilient Modulus vs. Bulk Stress for A-3 SR70 after soaking (Sample # A3SR70S1)
101 1022 3 4 5 6 7 8 9CONFINING PRESSURE, kPa
102
5
6
789
2
3
4
5
6
RE
SILI
EN
T M
OD
ULU
S, M
Pa
FROM LVDT AT M IDDLE HALFFROM LVDT AT FULL LENGT H
y = 26.299 x0.4923
R2=0.9957
y=36.934x0.532
R2=0.9798
Figure D.28 Resilient Modulus vs. Confining Stress for A-3 SR70 after soaking (Sample # A3SR70S1)

85
Table D.15 Triaxial test results of A-3 SR70 after soaking (Sample # A3SR70S2)
Summary Resilient Modulus Test Result
Test Type: T292-91I Soil IdentificationDate: A-3Mold#: SR 70
Moisture 13.69% Opt. Moist. 11.40%Lab. Den. 109.7 pcf Opt. Den. 112.1 pcf
Conditioning InformationLoad Type: DynamicDev. Stress: 82.74 kPaConf. Stress: 103.42 kPaNo. Reps.: 1000
Confining Pressure Axial Load Dev.
StressBulk
StressMiddle Strain
Full Length Strain
Middle Modulus
Full Length
ModuluskPa kN kPa kPa MPa Mpa
103.42 0.391 48.255 358.515 0.0001553 0.000178 310.725 271.145103.42 0.559 68.914 379.174 0.0002244 0.0002452 307.080 281.065103.42 0.837 103.202 413.462 0.0003342 0.0003587 308.790 287.680
68.95 0.362 44.707 251.557 0.0001918 0.000229 233.044 195.20268.95 0.388 47.875 254.725 0.0002055 0.0002424 233.017 197.51368.95 0.556 68.542 275.392 0.0002916 0.0003325 235.023 206.17168.95 0.835 103.001 309.851 0.0004245 0.0004697 242.623 219.29234.47 0.457 56.397 47.013 0.0003599 0.0004395 156.703 128.31134.47 0.335 41.381 144.791 0.0002461 0.0003156 168.121 131.09934.47 0.388 47.860 151.270 0.0002847 0.0003529 168.080 135.61234.47 0.556 68.534 171.944 0.0003932 0.0004731 174.316 144.84913.79 0.392 48.380 7.010 0.0004183 0.0005498 115.651 87.98813.79 0.336 41.404 82.774 0.000309 0.0004199 133.971 98.59713.79 0.388 47.835 89.205 0.0003458 0.0004641 138.347 103.072

86
1025 6 7 8 9 2 3 4 5
BULK ST RESS, kPa
102
7
8
9
2
3
4
RE
SIL I
EN
T M
OD
ULU
S, M
Pa
FROM LVDT AT M IDDLE HALFFROM LVDT AT FULL LENGT H
y=35.233x0.3086
R2=0.7065
y=54.498x0.2584
R2=0.7318
Figure D.29 Resilient Modulus vs. Bulk Stress for A-3 SR70 after soaking (Sample # A3SR70S2)
101 1022 3 4 5 6 7 8 9CONFINING PRESSURE, kPa
102
5
6
7
89
2
3
4
RES
ILIE
NT
MO
DU
LUS,
MPa
FROM LVDT AT M IDDLE HALFFROM LVDT AT FULL LENGT H
y = 23.221 x0.5221
R2=0.9746
y=40.116x0.4262
R2=0.9661
Figure D.30 Resilient Modulus vs. Confining Stress for A-3 SR70 after soaking (Sample # A3SR70S2)

87
D.3 A-2-4 12% SOIL

88
Table D.16 Triaxial test results of A-2-4 12% at optimum (Sample # A2412%O1)
Summary Resilient Modulus Test Result
Test Type: T292-91I Soil IdentificationSample No. A2412%O1 A-2-4, 12%
Lab Moist. 12.10% Opt. Moist. 12.10%Lab Den. 109.3 lb/ft^3 Opt. Den. 110.6 lb/ft^3
Conditioning InformationLoad Type: DynamicDev. Stress: 82.74 kPaConf. Stress: 103.42 kPaNo. Reps.: 1000
Confining Pressure Axial Load Dev. Stress Bulk Stress Middle
StrainFull Length
StrainMiddle
ModulusFull Length
Modulus
kPa kN kPa kPa MPa Mpa
103.42 0.375 46.211 356.471 0.0001646 0.00018422 280.737 250.852103.42 0.541 66.717 376.977 0.0002353 0.00025747 283.571 259.123103.42 0.821 101.225 411.485 0.0003452 0.00038028 293.202 266.184
68.95 0.262 32.296 239.146 0.000146 0.00016483 221.219 195.93968.95 0.374 46.114 252.964 0.0002043 0.00023162 225.775 199.09868.95 0.542 66.838 273.688 0.0002922 0.00032448 228.776 205.98568.95 0.822 101.411 308.261 0.0004204 0.0004656 241.228 217.80434.47 0.152 18.709 122.119 0.0001124 0.0001366 166.483 136.96534.47 0.262 32.301 135.711 0.0001956 0.00022623 165.113 142.78134.47 0.375 46.237 149.647 0.0002706 0.00031565 170.863 146.48534.47 0.542 66.810 170.220 0.0003704 0.00042402 180.367 157.56213.79 0.150 18.496 59.866 0.0001763 0.00022472 104.895 82.30513.79 0.262 32.309 73.679 0.0002656 0.00035723 121.641 90.44313.79 0.375 46.198 87.568 0.0003883 0.00051408 118.965 89.864

89
Figure D.31 Resilient Modulus vs. Bulk Stress for A-2-4 12% at optimum moisture (Sample # A2412%O1)
Figure D.32 Resilient Modulus vs. Confining Stress for A-2-4 12% at optimum moisture (Sample # A2412%O1)
1025 6 7 8 9 2 3 4 5
BULK STRESS, kPa
102
6
789
2
3
4
5
RES
ILIE
NT
MO
DU
LUS,
MPa
FROM LVDT AT MIDDLE HALFFROM LVDT AT FULL LENGTH
y=6.0838x0.6311
R2=0.9852
y=12.034x0.5303
R2=0.9875
101 1022 3 4 5 6 7 8 9
CONFINING PRESSURE, kPa
102
5
6789
2
3
4
5
67
RES
ILIE
NT
MO
DU
LUS,
MPa
FROM LVDT AT MIDDLE HALFFROM LVDT AT FULL LENGTH
y= 3 5 .5 1 5 x0 .4 4 5 4
R 2 = 0 .9 9 8
y = 21.762 x0.5328
R2=0.9992
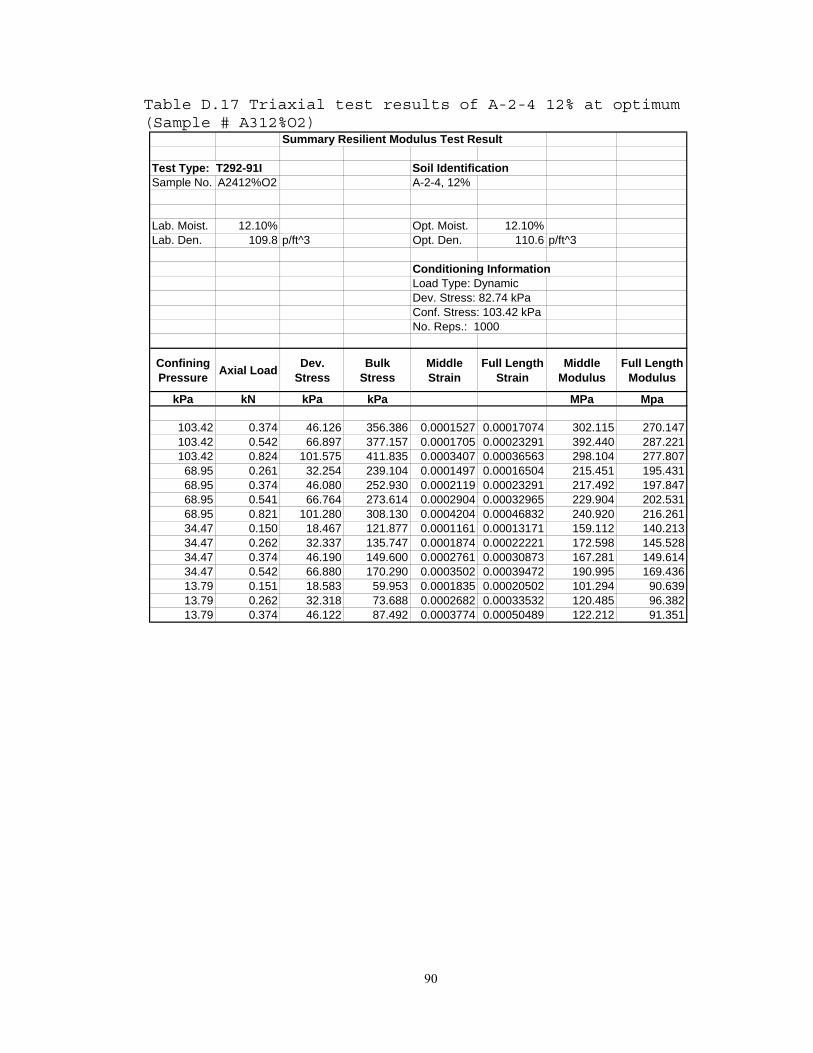
90
Table D.17 Triaxial test results of A-2-4 12% at optimum (Sample # A312%O2)
Summary Resilient Modulus Test Result
Test Type: T292-91I Soil IdentificationSample No. A2412%O2 A-2-4, 12%
Lab. Moist. 12.10% Opt. Moist. 12.10%Lab. Den. 109.8 p/ft^3 Opt. Den. 110.6 p/ft^3
Conditioning InformationLoad Type: DynamicDev. Stress: 82.74 kPaConf. Stress: 103.42 kPaNo. Reps.: 1000
Confining Pressure Axial Load Dev.
StressBulk
StressMiddle Strain
Full Length Strain
Middle Modulus
Full Length Modulus
kPa kN kPa kPa MPa Mpa
103.42 0.374 46.126 356.386 0.0001527 0.00017074 302.115 270.147103.42 0.542 66.897 377.157 0.0001705 0.00023291 392.440 287.221103.42 0.824 101.575 411.835 0.0003407 0.00036563 298.104 277.807
68.95 0.261 32.254 239.104 0.0001497 0.00016504 215.451 195.43168.95 0.374 46.080 252.930 0.0002119 0.00023291 217.492 197.84768.95 0.541 66.764 273.614 0.0002904 0.00032965 229.904 202.53168.95 0.821 101.280 308.130 0.0004204 0.00046832 240.920 216.26134.47 0.150 18.467 121.877 0.0001161 0.00013171 159.112 140.21334.47 0.262 32.337 135.747 0.0001874 0.00022221 172.598 145.52834.47 0.374 46.190 149.600 0.0002761 0.00030873 167.281 149.61434.47 0.542 66.880 170.290 0.0003502 0.00039472 190.995 169.43613.79 0.151 18.583 59.953 0.0001835 0.00020502 101.294 90.63913.79 0.262 32.318 73.688 0.0002682 0.00033532 120.485 96.38213.79 0.374 46.122 87.492 0.0003774 0.00050489 122.212 91.351

91
Figure D.33 Resilient Modulus vs. Bulk Stress for A-2-4 12% at optimum moisture (Sample # A2412%O2)
Figure D.34 Resilient Modulus vs. Confining Stress for A-2-4 24% at optimum moisture (Sample # A2412%O2)
101 1022 3 4 5 6 7 8 9
CONFINING PRESSURE, kPa
102
5
6789
2
3
4
5
67
RES
ILIE
NT
MO
DU
LUS,
MP
a
FROM LVDT AT MIDDLE HALFFROM LVDT AT FULL LENGTH
y = 21.134 x0.5271
R2=0.9916
y=30.083x0.4987
R2=0.9700
1025 6 7 8 9 2 3 4 5
BULK STRESS, kPa
102
6
789
2
3
4
5
RES
ILIE
NT
MO
DU
LUS,
MPa
FROM LVDT AT MIDDLE HALFFROM LVDT AT FULL LENGTH
y=6.6733x0.6202
R2=0.9700
y=9.0054x0.5911
R2=0.9407

92
Table D.18 Triaxial test results of A-2-4 12% after drying (Sample # A312%D1)
Summary Resilient Modulus Test Result
Test Type: T292-91I Soil IdentificationSample No. A2412%D1 A-2-4, 12%
SR 70
Lab. Moist. 12.10% Opt. Moist. 12.10%Lab. Den. 110.69 pcf Opt. Den. 110.6 pcf
After Drying 7.10% Conditioning InformationLoad Type: DynamicDev. Stress: 82.74 kPaConf. Stress: 103.42 kPaNo. Reps.: 1000
Confining Pressure Axial Load Dev. Stress Bulk Stress Middle
StrainFull Length
StrainMiddle
ModulusFull Length
ModuluskPa kN kPa kPa MPa Mpa
103.42 0.374 46.109 356.369 0.000153058 0.000179045 301.251 257.526103.42 0.541 66.740 377.000 0.000228209 0.000252086 292.450 264.750103.42 0.821 101.265 411.525 0.000331625 0.00036003 305.360 281.26868.95 0.262 32.279 239.129 0.000127377 0.000168273 253.410 191.82368.95 0.373 45.993 252.843 0.000190289 0.000231833 241.702 198.39068.95 0.542 66.815 273.665 0.000276124 0.000319309 241.975 209.25068.95 0.820 101.142 307.992 0.000394367 0.000442766 256.467 228.43234.47 0.149 18.418 121.828 9.72128E-05 0.000145219 189.462 126.83134.47 0.262 32.258 135.668 0.000186325 0.000244329 173.126 132.02634.47 0.374 46.145 149.555 0.000259579 0.000329866 177.768 139.88934.47 0.541 66.740 170.150 0.000351792 0.000427252 189.713 156.20713.79 0.150 18.467 59.837 0.000138752 0.000215457 133.096 85.71213.79 0.261 32.243 73.613 0.000235966 0.000327495 136.641 98.45213.79 0.374 46.086 87.456 0.000316804 0.000407861 145.472 112.995

93
Figure D.35 Resilient Modulus vs. Bulk Stress for A-2-4 12% after drying (Sample # A2412%D1)
Figure D.36 Resilient Modulus vs. Confining Pressure for A-2-4 12% after drying (Sample # A2412%D1)
101 1022 3 4 5 6 7 8 9
CONFINING PRESSURE, kPa
102
5
6789
2
3
4
5
67
RE
SILI
ENT
MO
DU
LUS,
MPa
FROM LVDT AT MIDDLE HALFFROM LVDT AT FULL LENGTH
y = 26.057 x0.4928
R2=0.9841
y=49.19x0.3839
R2=0.9892
1025 6 7 8 9 2 3 4 5
BULK STRESS, kPa
102
6
789
2
3
4
5
RES
ILIE
NT
MO
DU
LUS
, MP
a
FROM LVDT AT MIDDLE HALFFROM LVDT AT FULL LENGTH
y=7.0555x0.6066
R2=0.9924
y=19.413x0.4562
R2=0.9686
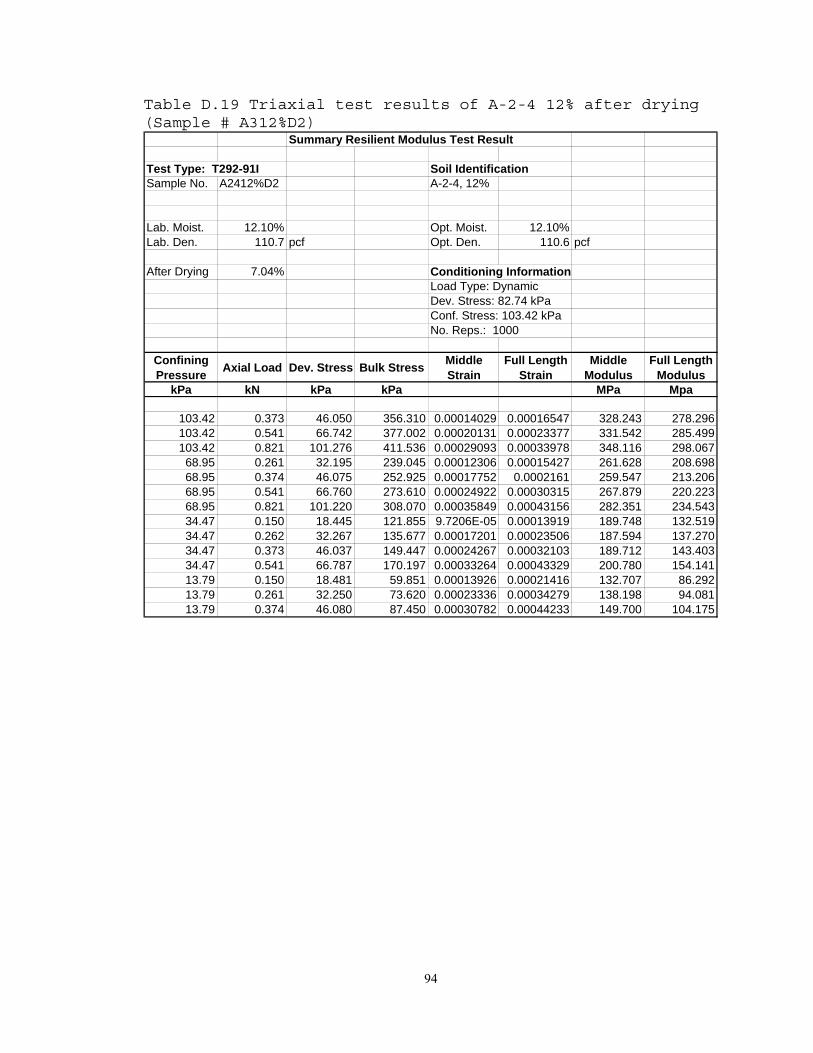
94
Table D.19 Triaxial test results of A-2-4 12% after drying (Sample # A312%D2)
Summary Resilient Modulus Test Result
Test Type: T292-91I Soil IdentificationSample No. A2412%D2 A-2-4, 12%
Lab. Moist. 12.10% Opt. Moist. 12.10%Lab. Den. 110.7 pcf Opt. Den. 110.6 pcf
After Drying 7.04% Conditioning InformationLoad Type: DynamicDev. Stress: 82.74 kPaConf. Stress: 103.42 kPaNo. Reps.: 1000
Confining Pressure Axial Load Dev. Stress Bulk Stress Middle
StrainFull Length
StrainMiddle
ModulusFull Length
ModuluskPa kN kPa kPa MPa Mpa
103.42 0.373 46.050 356.310 0.00014029 0.00016547 328.243 278.296103.42 0.541 66.742 377.002 0.00020131 0.00023377 331.542 285.499103.42 0.821 101.276 411.536 0.00029093 0.00033978 348.116 298.06768.95 0.261 32.195 239.045 0.00012306 0.00015427 261.628 208.69868.95 0.374 46.075 252.925 0.00017752 0.0002161 259.547 213.20668.95 0.541 66.760 273.610 0.00024922 0.00030315 267.879 220.22368.95 0.821 101.220 308.070 0.00035849 0.00043156 282.351 234.54334.47 0.150 18.445 121.855 9.7206E-05 0.00013919 189.748 132.51934.47 0.262 32.267 135.677 0.00017201 0.00023506 187.594 137.27034.47 0.373 46.037 149.447 0.00024267 0.00032103 189.712 143.40334.47 0.541 66.787 170.197 0.00033264 0.00043329 200.780 154.14113.79 0.150 18.481 59.851 0.00013926 0.00021416 132.707 86.29213.79 0.261 32.250 73.620 0.00023336 0.00034279 138.198 94.08113.79 0.374 46.080 87.450 0.00030782 0.00044233 149.700 104.175

95
Figure D.37 Resilient Modulus vs. Bulk Stress for A-2-4 12% after drying (Sample # A2412%D2)
Figure D.38 Resilient Modulus vs. Confining Pressure for A-2-4 12% after drying (Sample # A2412%D2)
1025 6 7 8 9 2 3 4 5
BULK STRESS, kPa
102
6
789
2
3
4
5
RES
ILIE
NT
MO
DU
LUS,
MPa
FROM LVDT AT MIDDLE HALFFROM LVDT AT FULL LENGTH
y=5.3978x0.6638
R2=0.994
y=15.139x0.5161
R2=0.9859
101 1022 3 4 5 6 7 8 9
CONFINING PRESSURE, kPa
102
5
6789
2
3
4
5
67
RES
ILIE
NT
MO
DU
LUS,
MPa
FROM LVDT AT MIDDLE HALFFROM LVDT AT FULL LENGTH
y=43.856x0.4312
R2=0.9886
y = 21.594 x0.5499
R2=0.9902
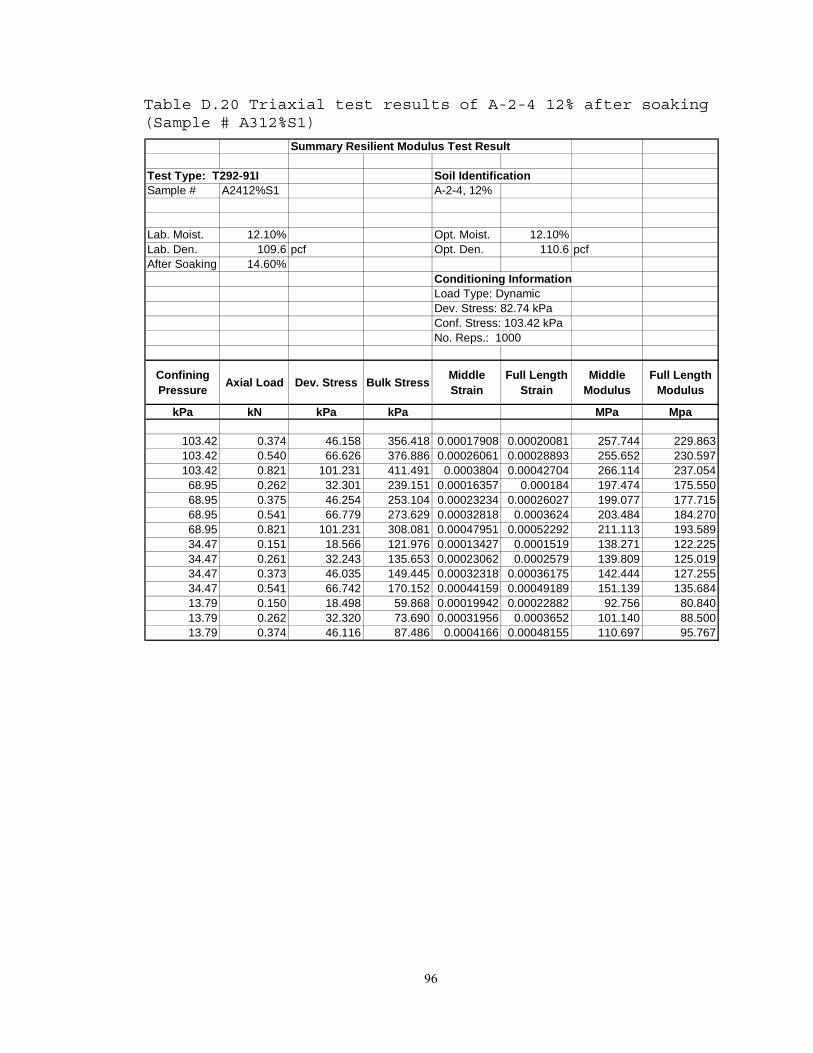
96
Table D.20 Triaxial test results of A-2-4 12% after soaking (Sample # A312%S1)
Summary Resilient Modulus Test Result
Test Type: T292-91I Soil IdentificationSample # A2412%S1 A-2-4, 12%
Lab. Moist. 12.10% Opt. Moist. 12.10%Lab. Den. 109.6 pcf Opt. Den. 110.6 pcfAfter Soaking 14.60%
Conditioning InformationLoad Type: DynamicDev. Stress: 82.74 kPaConf. Stress: 103.42 kPaNo. Reps.: 1000
Confining Pressure Axial Load Dev. Stress Bulk Stress Middle
StrainFull Length
StrainMiddle
ModulusFull Length
Modulus
kPa kN kPa kPa MPa Mpa
103.42 0.374 46.158 356.418 0.00017908 0.00020081 257.744 229.863103.42 0.540 66.626 376.886 0.00026061 0.00028893 255.652 230.597103.42 0.821 101.231 411.491 0.0003804 0.00042704 266.114 237.05468.95 0.262 32.301 239.151 0.00016357 0.000184 197.474 175.55068.95 0.375 46.254 253.104 0.00023234 0.00026027 199.077 177.71568.95 0.541 66.779 273.629 0.00032818 0.0003624 203.484 184.27068.95 0.821 101.231 308.081 0.00047951 0.00052292 211.113 193.58934.47 0.151 18.566 121.976 0.00013427 0.0001519 138.271 122.22534.47 0.261 32.243 135.653 0.00023062 0.0002579 139.809 125.01934.47 0.373 46.035 149.445 0.00032318 0.00036175 142.444 127.25534.47 0.541 66.742 170.152 0.00044159 0.00049189 151.139 135.68413.79 0.150 18.498 59.868 0.00019942 0.00022882 92.756 80.84013.79 0.262 32.320 73.690 0.00031956 0.0003652 101.140 88.50013.79 0.374 46.116 87.486 0.0004166 0.00048155 110.697 95.767

97
Figure D.39 Resilient Modulus vs. Bulk Stress for A-2-4 12% after soaking) (Sample # A2412%S1)
Figure D.40 Resilient Modulus vs. Confining Stress for A-2-4 12% after soaking (Sample # A2412%S1)
1025 6 7 8 9 2 3 4 5
BULK STRESS, kPa
102
6
7
89
2
3
4
RES
ILIE
NT
MO
DU
LUS
, MP
a
FROM LVDT AT MIDDLE HALFFROM LVDT AT FULL LENGTH
y=7.4721x0.574
R2=0.9931
y=9.235x0.5557
R2=0.9893
101 1022 3 4 5 6 7 8 9
CONFINING PRESSURE, kPa
102
5
6
7
8
9
2
3
RES
ILIE
NT
MO
DU
LUS,
MPa
FROM LVDT AT MIDDLE HALFFROM LVDT AT FULL LENGTH
y = 24.566 x0.4776
R2=0.9928
y=29.235x0.4624
R2=0.9891

98
Table D.21 Resilient Modulus of A-2-4 12% after soaking (Sample # A2412%S2)
Summary Resilient Modulus Test Result
Test Type: T292-91I Soil IdentificationSample #: A2412%S2 A-2-4, 12%
Lab. Moist. 12.10% Opt. Moist. 12.10%Lab. Den. 110.3 pcf Opt. Den. 110.6 pcfAfer Soaking 13.60%
Conditioning InformationLoad Type: DynamicDev. Stress: 82.74 kPaConf. Stress: 103.42 kPaNo. Reps.: 1000
Confining Pressure Axial Load Dev.
StressBulk
StressMiddle Strain
Full Length Strain
Middle Modulus
Full Length Modulus
kPa kN kPa kPa MPa Mpa
103.42 0.374 46.130 356.390 0.0001732 0.0001879 266.345 245.529103.42 0.542 66.808 377.068 0.000252 0.0002717 265.147 245.896103.42 0.823 101.539 411.799 0.0003701 0.0003992 274.378 254.32968.95 0.262 32.335 239.185 0.0001555 0.0001704 207.987 189.73268.95 0.374 46.088 252.938 0.0002121 0.0002409 217.321 191.33168.95 0.541 66.787 273.637 0.0003073 0.0003419 217.312 195.32368.95 0.820 101.201 308.051 0.0004492 0.0004843 225.312 208.94234.47 0.150 18.513 121.923 0.0001248 0.0001467 148.312 126.17134.47 0.261 32.231 135.641 0.0002203 0.0002484 146.311 129.74434.47 0.374 46.116 149.526 0.0003044 0.0003413 151.522 135.12634.47 0.542 66.796 170.206 0.0003995 0.0004602 167.212 145.14113.79 0.150 18.517 59.887 0.0001728 0.0002288 107.130 80.92313.79 0.261 32.245 73.615 0.0002902 0.0003544 111.123 90.97613.79 0.375 46.205 87.575 0.0003917 0.0004643 117.971 99.513

99
Figure D.41 Resilient Modulus vs. Bulk Stress for A-2-4 12% (Sample # A2412%S2)
Figure D.42 Resilient Modulus vs. Confining Pressure for A-2-4 12% after soaking (Sample # A2412%S2)
1025 6 7 8 9 2 3 4 5
BULK STRESS, kPa
102
6
7
89
2
3
4
RES
ILIE
NT
MO
DU
LUS,
MPa
FROM LVDT AT MIDDLE HALFFROM LVDT AT FULL LENGTH
y=6.7001x0.6053
R2=0.9961
y=11.829x0.5211R2=0.9869
101 1022 3 4 5 6 7 8 9
CONFINING PRESSURE, kPa
102
5
6
7
89
2
3
4
RES
ILIE
NT
MO
DU
LUS,
MPa
FROM LVDT AT MIDDLE HALFFROM LVDT AT FULL LENGTH
y=34 .795x0 .4344
R2=0 .9893
y = 23.699 x0.5013
R2=0.9949

100
D.4 SR 70 A-2-4 14% SOIL

101
Table D.22 Triaxial test results of A-2-4, SR70 after drying (Sample #A24SR70D1)
Summary Resilient Modulus Test Result
Test Type: T292-91I Soil IdentificationSample No. A24SR70D1 A-2-4, SR70
Lab. Moist. 8.41% Opt. Moist. 10.60%Lab. Den. 120.3 pcf Opt. Den. 122.4 pcf
Conditioning InformationLoad Type: DynamicDev. Stress: 82.74 kPaConf. Stress: 103.42 kPaNo. Reps.: 1000
Confining Pressure Axial Load Dev.
StressBulk
StressMiddle Strain
Full Length Strain
Middle Modulus
Full Length
ModuluskPa kN kPa kPa MPa Mpa
103.42 0.373 45.971 356.231 7.273E-05 7.692E-05 632.065 597.661103.42 0.541 66.751 377.011 0.0001113 0.0001196 599.534 558.219103.42 0.822 101.333 411.593 0.0001755 0.0001874 577.551 540.59268.95 0.260 32.108 238.958 5.102E-05 6.227E-05 629.370 515.64868.95 0.374 46.103 252.953 7.79E-05 8.597E-05 591.806 536.28768.95 0.542 66.838 273.688 0.0001182 0.0001377 565.313 485.46868.95 0.822 101.371 308.221 0.0001875 0.0002124 540.591 477.17134.47 0.150 18.460 121.870 2.896E-05 4.503E-05 637.513 409.94234.47 0.262 32.326 135.736 5.86E-05 7.864E-05 551.648 411.04834.47 0.374 46.131 149.541 8.859E-05 0.0001155 520.741 399.45434.47 0.541 66.753 170.163 0.0001289 0.0001724 517.797 387.27313.79 0.150 18.558 59.928 3.171E-05 6.593E-05 585.207 281.48213.79 0.261 32.243 73.613 6.308E-05 0.000111 511.143 290.57913.79 0.374 46.092 87.462 9.204E-05 0.0001584 500.806 291.055

102
1025 6 7 8 9 2 3 4 5
B UL K S T RE S S , kP a
102
103
2
3
4
5
6
789
RES
ILIE
NT
MO
DU
LUS ,
MPa
FRO M L V DT A T M IDDL E HA L FFRO M L V DT A T FUL L LE NG T H
y=57.467x0.3861
R2=0.9121y=427.89x0.054
R2=0.1721
Figure D.43 Resilient Modulus vs. Bulk Stress for A-2-4 SR70 after drying (Sample # A24SR70D1)
101 1022 3 4 5 6 7 8 9
CONFINING PRESSURE, kPa
102
5
6789
2
3
4
5
67
RES
ILIE
NT
MO
DU
LUS,
MPa
FROM LVDT AT MIDDLE HALFFROM LVDT AT FULL LENGTH
y = 120.04 x0.3369
R2=0.9978y=451.98x0.0607
R2=0.9849
Figure D.44 Resilient Modulus vs. Confining Stress for A-2-4 SR70 after drying (Sample # A24SR70D1)

103
Table D.23 Triaxial test results of A-2-4 SR70 after drying (Sample # A24SR70D2)
Summary Resilient Modulus Test Result
Test Type: T292-91I Soil IdentificationSample No. A24SR70D2 A-2-4
SR 70
Lab. Moist. 7.76% Opt. Moist. 10.60%Lab. Den. 120.6 pcf Opt. Den. 122.1 pcf
Conditioning InformationLoad Type: DynamicDev. Stress: 82.74 kPaConf. Stress: 103.42 kPaNo. Reps.: 1000
Confining Pressure Axial Load Dev.
StressBulk
StressMiddle Strain
Full Length Strain
Middle Modulus
Full Length
ModuluskPa kN kPa kPa MPa Mpa
103.42 0.376 46.334 356.594 6.36E-05 8.748E-05 728.479 529.675103.42 0.543 66.946 377.206 0.0001017 0.0001269 658.291 527.527103.42 0.823 101.552 411.812 0.0001675 0.0002008 606.150 505.721
68.95 0.262 32.349 239.199 3.775E-05 8.704E-05 856.956 371.63368.95 0.374 46.082 252.932 6.378E-05 0.0001215 722.562 379.22068.95 0.543 66.993 273.843 0.0001003 0.0001683 667.815 398.12468.95 0.822 101.433 308.283 0.0001765 0.0002433 574.691 416.98934.47 0.151 18.592 122.002 2.086E-05 0.0001034 891.496 179.77534.47 0.263 32.405 135.815 4.206E-05 0.0001668 770.532 194.31934.47 0.375 46.290 149.700 6.86E-05 0.0002174 674.774 212.93034.47 0.543 67.001 170.411 0.0001096 0.0002713 611.184 246.99713.79 0.150 18.520 59.890 1.999E-05 0.0001924 926.316 96.25813.79 0.262 32.337 73.707 4.637E-05 0.0002926 697.430 110.52013.79 0.374 46.082 87.452 7.325E-05 0.0003641 629.069 126.557

104
1025 6 7 8 9 2 3 4 5
BULK ST RESS, kPa
102
103
5678
2
3
45678
2
RE
SILI
EN
T M
OD
UL U
S, M
Pa
FROM LVDT AT M IDDLE HALFFROM LVDT AT FULL LENGT H
y=1.9460x0.9431
R2=0.9922
y=1211.8x-0.1032
R2=0.1929
Figure D.45 Resilient Modulus vs. Bulk Stress for A-2-4 SR70 after drying (Sample # A24SR70D2)
1 0 1 1 0 22 3 4 5 6 7 8 9
CONFINING PRESSURE, kPa
1 0 2
5
6789
2
3
4
5
67
RES
ILIE
NT
MO
DU
LUS,
MPa
FROM LV DT A T MIDDLE HA LFFROM LV DT A T FULL LENGTH
y = 14.031 x0.7789
R2=0.9964
y= 884.49x -0 .0 5 7 1
R2 = 0.8558
Figure D.46 Resilient Modulus vs. Confining Stress for A-2-4 SR70 after drying (Sample # A24SR70D2)

105
Table D.24 Triaxial test results of A-2-4 SR70 at optimum condition (Sample # A24SR70O1)
Summary Resilient Modulus Test Result
Test Type: T292-91I Soil IdentificationSample # A24SR70O1 A-2-4
SR 70
Lab. Moist. 10.80% Opt. Moist. 10.60%Lab. Den. 120.4 pcf Opt. Den. 122.09 pcf
Conditioning InformationLoad Type: DynamicDev. Stress: 82.74 kPaConf. Stress: 103.42 kPaNo. Reps.: 1000
Confining Pressure Axial Load Dev.
StressBulk
StressMiddle Strain
Full Length Strain
Middle Modulus
Full Length
ModuluskPa kN kPa kPa MPa Mpa
103.42 0.376 46.415 356.675 0.0001078 0.0001429 430.511 324.730103.42 0.545 67.243 377.503 0.0001777 0.0002172 378.332 309.592103.42 0.824 101.591 411.851 0.0002838 0.0003302 357.937 307.653
68.95 0.262 32.257 239.107 7.63E-05 0.0001076 422.781 299.69868.95 0.375 46.296 253.146 0.0001314 0.0001662 352.308 278.58468.95 0.544 67.047 273.897 0.0002108 0.0002564 318.055 261.51668.95 0.823 101.557 308.407 0.0003345 0.0003892 303.646 260.94134.47 0.150 18.525 121.935 5.301E-05 7.384E-05 349.487 250.89334.47 0.261 32.218 135.628 0.0001008 0.0001447 319.770 222.71734.47 0.375 46.275 149.685 0.000171 0.0002228 270.588 207.70134.47 0.543 66.932 170.342 0.000273 0.0003369 245.195 198.67713.79 0.152 18.753 60.123 5.89E-05 0.0001053 318.385 178.15713.79 0.266 32.836 74.206 0.0001211 0.00019 271.177 172.86413.79 0.376 46.417 87.787 0.0001939 0.0002762 239.356 168.067

106
Figure D.47 Resilient Modulus vs. Bulk Stress for A-2-4 SR70 at optimum moisture (Sample # A24SR70O1)
101 1022 3 4 5 6 7 8 9
C O N F IN IN G P R E S S U R E , kP a
102
5
6789
2
3
4
5
67
RES
ILIE
NT
MO
DU
L US,
MPa
F R O M L V D T A T M ID D L E H A L FF R O M L V D T A T F U L L L E N G T H
R 2 = 0 . 9 3 1 1
y = 171.51 x 0.1698
y = 78.652 x 0.2962
R2 = 0.9969
Figure D.48 Resilient Modulus vs. Confining Stress for A-2-4 SR70 at optimum moisture (Sample # A24SR70O1)
1025 6 7 8 9 2 3 4 5
BULK STRESS, kPa
102
103
2
3
4
5
6789
RE
SILI
EN
T M
OD
ULU
S, M
Pa
FROM LVDT AT MIDDLE HALFFROM LVDT AT FULL LENGTH
y=132.94x0.1698
R2=0.3393
y = 42.315 x0.3332
R2=0.8241
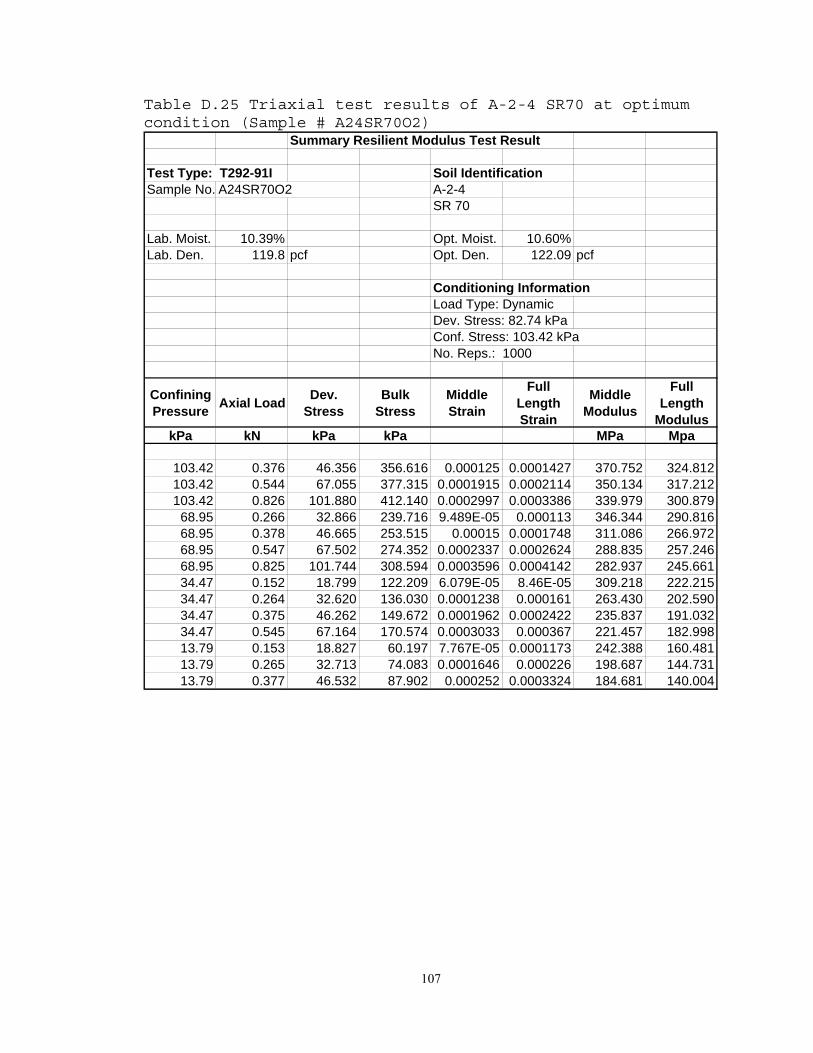
107
Table D.25 Triaxial test results of A-2-4 SR70 at optimum condition (Sample # A24SR70O2)
Summary Resilient Modulus Test Result
Test Type: T292-91I Soil IdentificationSample No. A24SR70O2 A-2-4
SR 70
Lab. Moist. 10.39% Opt. Moist. 10.60%Lab. Den. 119.8 pcf Opt. Den. 122.09 pcf
Conditioning InformationLoad Type: DynamicDev. Stress: 82.74 kPaConf. Stress: 103.42 kPaNo. Reps.: 1000
Confining Pressure Axial Load Dev.
StressBulk
StressMiddle Strain
Full Length Strain
Middle Modulus
Full Length
ModuluskPa kN kPa kPa MPa Mpa
103.42 0.376 46.356 356.616 0.000125 0.0001427 370.752 324.812103.42 0.544 67.055 377.315 0.0001915 0.0002114 350.134 317.212103.42 0.826 101.880 412.140 0.0002997 0.0003386 339.979 300.879
68.95 0.266 32.866 239.716 9.489E-05 0.000113 346.344 290.81668.95 0.378 46.665 253.515 0.00015 0.0001748 311.086 266.97268.95 0.547 67.502 274.352 0.0002337 0.0002624 288.835 257.24668.95 0.825 101.744 308.594 0.0003596 0.0004142 282.937 245.66134.47 0.152 18.799 122.209 6.079E-05 8.46E-05 309.218 222.21534.47 0.264 32.620 136.030 0.0001238 0.000161 263.430 202.59034.47 0.375 46.262 149.672 0.0001962 0.0002422 235.837 191.03234.47 0.545 67.164 170.574 0.0003033 0.000367 221.457 182.99813.79 0.153 18.827 60.197 7.767E-05 0.0001173 242.388 160.48113.79 0.265 32.713 74.083 0.0001646 0.000226 198.687 144.73113.79 0.377 46.532 87.902 0.000252 0.0003324 184.681 140.004
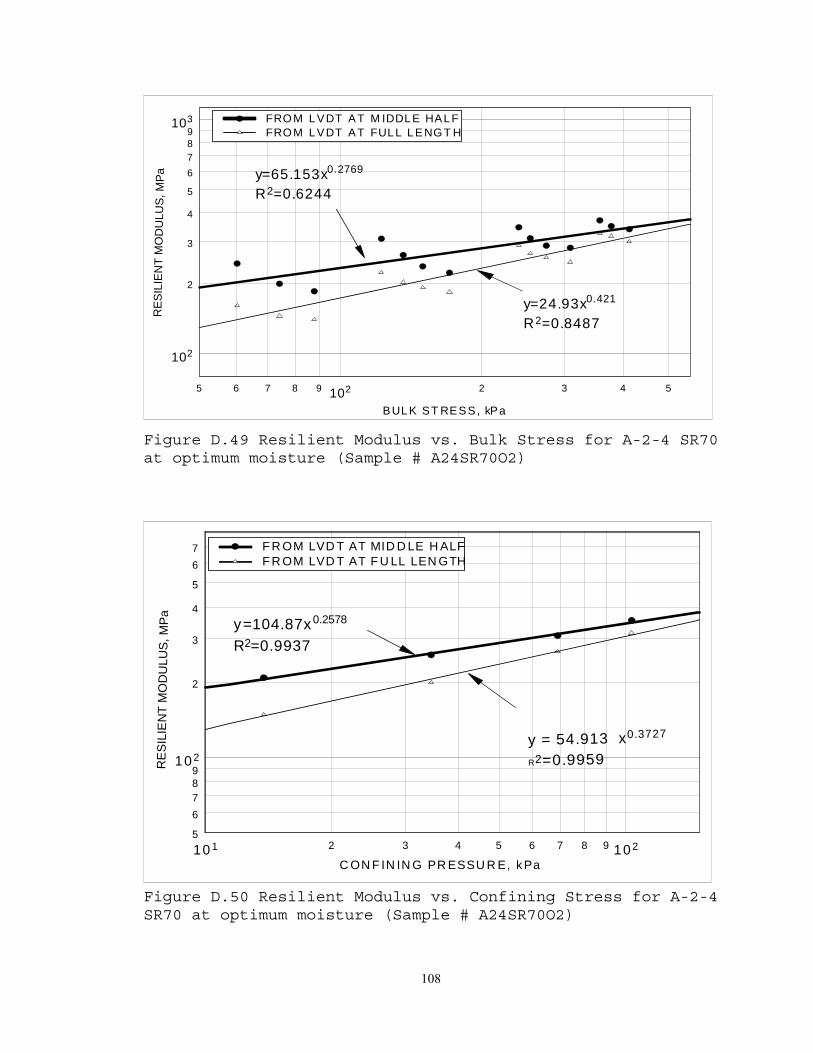
108
1025 6 7 8 9 2 3 4 5
BULK ST RESS, kPa
102
103
2
3
4
5
6789
RES
ILIE
NT
MO
DU
LUS,
MPa
FROM LVDT AT M IDDLE HALFFROM LVDT AT FULL LENGT H
y=24.93x0.421
R2=0.8487
y=65.153x0.2769
R2=0.6244
Figure D.49 Resilient Modulus vs. Bulk Stress for A-2-4 SR70 at optimum moisture (Sample # A24SR70O2)
10 1 1022 3 4 5 6 7 8 9
C ON F IN IN G PR ESSU R E, kPa
10 2
5
6789
2
3
4
5
67
RE
SIL
IEN
T M
OD
ULU
S, M
Pa
F R OM LVD T AT MID D LE H ALFF R OM LVD T AT F U LL LEN GTH
y = 54.913 x0.3727
R2=0.9959
y=104.87x0.2578
R2=0.9937
Figure D.50 Resilient Modulus vs. Confining Stress for A-2-4 SR70 at optimum moisture (Sample # A24SR70O2)

109
Table D.26 Triaxial test results of A-2-4 SR70 after soaking (Sample # A24SR70S1)
Summary Resilient Modulus Test Result
Test Type: T292-91I Soil IdentificationSample No. A24SR70S1 A-2-4
SR 70
Moisture 11.23% Opt. Moist. 10.60%Lab. Den. 121.4 pcf Opt. Den. 122.4 pcf
Conditioning InformationLoad Type: DynamicDev. Stress: 82.74 kPaConf. Stress: 103.42 kPaNo. Reps.: 1000
Confining Pressure Axial Load Dev.
StressBulk
StressMiddle Strain
Full Length Strain
Middle Modulus
Full Length
ModuluskPa kN kPa kPa MPa Mpa
103.42 0.373 46.056 356.316 0.0001413 0.0001681 325.882 274.049103.42 0.542 66.863 377.123 0.0002089 0.0002424 320.088 275.847103.42 0.821 101.267 411.527 0.000314 0.0003665 322.481 276.313
68.95 0.262 32.360 239.210 0.0001089 0.0001403 297.084 230.70968.95 0.374 46.126 252.976 0.0001648 0.0002075 279.946 222.30868.95 0.541 66.781 273.631 0.0002478 0.0003053 269.452 218.73768.95 0.821 101.246 308.096 0.000373 0.000455 271.461 222.49634.47 0.150 18.549 121.959 7.79E-05 0.0001071 238.102 173.21934.47 0.262 32.260 135.670 0.0001468 0.000204 219.690 158.10634.47 0.374 46.073 149.483 0.0002247 0.0002997 205.001 153.72934.47 0.540 66.658 170.068 0.0003309 0.0004335 201.437 153.76813.79 0.150 18.473 59.843 0.0001138 0.0001719 162.396 107.44113.79 0.262 32.263 73.633 0.0002241 0.0003212 143.997 100.43213.79 0.374 46.105 87.475 0.0003206 0.0004566 143.821 100.985

110
1025 6 7 8 9 2 3 4 5
BULK ST RESS, kPa
102
7
89
2
3
4
5
RES
ILIE
NT
MO
DU
LUS,
MPa
FROM LVDT AT M IDDLE HALFFROM LVDT AT FULL LENGT H
y=9.6913x0.5608
R2=0.932
y=24.822x0.431
R2=0.877
Figure D.51 Resilient Modulus vs. Bulk Stress for A-2-4 SR70 after soaking (Sample # A24SR70S1)
101 1022 3 4 5 6 7 8 9
CONFINING PRESSURE, kPa
102
5
6789
2
3
4
5
67
RES
ILIE
NT
MO
DU
LUS,
MPa
FROM LVDT AT MIDDLE HALFFROM LVDT AT FULL LENGTH
y = 28.595 x0.487
R2=0.9998
y=55.6x0.3807
R2=0.9994
Figure D.52 Resilient Modulus vs. Confining Stress for A-2-4 SR70 after soaking (Sample # A24SR70S1)

111
Table D.27 Triaxial test results of A-2-4 SR70 after soaking (Sample # A24SR70S2)
Summary Resilient Modulus Test Result
Test Type: T292-91I Soil IdentificationSample No. A24SR70S2 A-2-4
SR 70
Lab. Moist. 11.70% Opt. Moist. 10.60%Lab. Den. 120 pcf Opt. Den. 122.1 pcf
Conditioning InformationLoad Type: DynamicDev. Stress: 82.74 kPaConf. Stress: 103.42 kPaNo. Reps.: 1000
Confining Pressure Axial Load Dev.
StressBulk
StressMiddle Strain
Full Length Strain
Middle Modulus
Full Length
ModuluskPa kN kPa kPa MPa Mpa
103.42 0.376 46.438 356.698 8.239E-05 0.0001922 563.602 241.627103.42 0.542 66.874 377.134 0.000167 0.0002816 400.387 237.476103.42 0.823 101.473 411.733 0.000286 0.0004176 354.858 243.016
68.95 0.262 32.367 239.217 6.809E-05 0.0001685 475.379 192.10668.95 0.374 46.094 252.944 0.0001041 0.0002499 442.730 184.42668.95 0.541 66.751 273.601 0.0002201 0.0003605 303.261 185.18368.95 0.821 101.231 308.081 0.0003554 0.0005139 284.825 196.99834.47 0.150 18.556 121.966 4.844E-05 0.0001478 383.102 125.54634.47 0.261 32.211 135.621 0.0001064 0.000265 302.868 121.54334.47 0.374 46.113 149.523 0.0002115 0.0003833 218.035 120.30434.47 0.541 66.711 170.121 0.0003242 0.0005221 205.762 127.78613.79 0.150 18.522 59.892 6.826E-05 0.0002299 271.350 80.56913.79 0.261 32.197 73.567 0.0002115 0.0003958 152.239 81.34813.79 0.374 46.099 87.469 0.0003094 0.0005458 148.999 84.469

112
1025 6 7 8 9 2 3 4 5
BULK ST RESS, kPa
102
5
6789
2
3
4
5
6
RES
ILIE
NT
MO
DU
LUS,
MPa
FROM LVDT AT M IDDLE HALFFROM LVDT AT FULL LENGT H
y=5.40516x0.6335
R2=0.9716
y=31.562x0.4321
R2=0.4503
Figure D.53 Resilient Modulus vs. Bulk Stress for A-2-4 SR70 after soaking (Sample # A24SR70S2)
1025 6 7 8 9CONFINING PRESSURE, kPa
101
102
2
3
45678
2
3
4567
RES
ILIE
NT
MO
DU
LUS,
MPa
FROM LVDT AT M IDDLE HALFFROM LVDT AT FULL LENGT H
y = 19.528 x0.5366
R2=0.9936
y=63.758x0.4172
R2=0.9996
Figure D.54 Resilient Modulus vs. Confining Stress for A-2-4 SR70 after soaking (Sample # A24SR70S2)

113
Table D.28 Triaxial test results of A-2-4 SR70 after drying (Sample # A24SR70D3)
Summary Resilient Modulus Test Result
Test Type: T292-91I Soil IdentificationSample No. A24SR70D3 (without mold) A-2-4
SR 70
Lab. Moist. 10.60% Opt. Moist. 10.60%Lab. Den. 120.9 pcf Opt. Den. 122.1 pcf
After Dying 3.12% Conditioning InformationLoad Type: DynamicDev. Stress: 82.74 kPaConf. Stress: 103.42 kPaNo. Reps.: 1000
Confining Pressure Axial Load Dev.
StressBulk
StressMiddle Strain
Full Length Strain
Middle Modulus
Full Length
ModuluskPa kN kPa kPa MPa Mpa
103.42 0.374 46.130 356.390 9.48E-06 4.762E-05 4866.117 968.775103.42 0.541 66.723 376.983 1.344E-05 6.334E-05 4963.279 1053.331103.42 0.821 101.250 411.510 2.396E-05 8.941E-05 4226.182 1132.36568.95 0.260 32.101 238.951 4.827E-06 5.58E-05 6650.954 575.24868.95 0.374 46.114 252.964 1.155E-05 7.95E-05 3993.025 580.02868.95 0.541 66.687 273.537 1.534E-05 0.0001015 4347.028 657.13868.95 0.819 101.042 307.892 2.43E-05 0.0001241 4157.499 814.17434.47 0.150 18.473 121.883 8.617E-07 6.571E-05 21436.627 281.11234.47 0.262 32.301 135.711 7.754E-06 0.0001079 4165.625 299.24234.47 0.374 46.088 149.498 8.964E-06 0.0001332 5141.738 346.12834.47 0.542 66.827 170.237 9.826E-06 0.0001599 6801.172 418.00813.79 0.150 18.462 59.832 5.17E-06 0.0001161 3570.749 158.97213.79 0.262 32.273 73.643 6.894E-06 0.0001713 4681.476 188.41213.79 0.374 46.145 87.515 1.172E-05 0.0002058 3937.261 224.262

114
1025 6 7 8 9 2 3 4 5
BULK ST RESS, kPa
102
103
104
2
34568
2
34568
2
3
RE
SILI
EN
T M
OD
UL U
S, M
Pa
FROM LVDT AT M IDDLE HALFFROM LVDT AT FULL LENGT H
y=2.1067x0.0322
R2=0.9874y=6737.1x-0.0504R2=0.005
Figure D.55 Resilient Modulus vs. Bulk Stress for A-2-4 SR70 after drying (Sample # A24SR70D3)
101 1022 3 4 5 6 7 8 9
CO NFINING P RE S S URE , kP a
102
103
104
567
2
34567
2
34567
RES
ILIE
NT
MO
DU
L US,
MPa
FRO M L V DT A T M IDDL E HA L FFRO M L V DT A T FUL L L E NG T H
y = 19.391 x0.8415
R2=0.9813
y=5238.8x0.0045
R2=0.004
Figure D.56 Resilient Modulus vs. Confining Stress for A-2-4 SR70 after drying (Sample # A24SR70D3)

115
D.5 A-2-4, 20% SOIL

116
Table D.29 Resilient Modulus of A-2-4, 20% at OMC (Sample # A2420%O1)
Summary Resilient Modulus Test Result
Test Type: T292-91I Soil IdentificationSample # A2420%O1 A-2-4, 20%
Lab. Moist. 10% Opt. Moist. 10%Lab. Den. 117.9 pcf Opt. Den. 124.4 pcf
Conditioning InformationLoad Type: DynamicDev. Stress: 82.74 kPaConf. Stress: 103.42 kPaNo. Reps.: 1000
Confining Pressure
Axial Load
Dev. Stress
Bulk Stress
Middle Strain
Full Length Strain
Middle Modulus
Full Length
ModuluskPa kN kPa kPa MPa Mpa
103.42 0.373 46.065 356.325 0.0001448 0.000158 318.213 291.681103.42 0.540 66.656 376.916 0.0002072 0.000225 321.635 296.617103.42 0.819 101.076 411.336 0.0003021 0.000335 334.532 301.686
68.95 0.263 32.420 239.270 0.0001275 0.000144 254.234 224.58568.95 0.374 46.073 252.923 0.0001764 0.000205 261.236 224.38368.95 0.541 66.707 273.557 0.0002647 0.000293 251.982 227.48668.95 0.822 101.395 308.245 0.0003839 0.000419 264.135 241.95634.47 0.150 18.467 121.877 0.0001125 0.000123 164.210 149.58534.47 0.262 32.292 135.702 0.0001896 0.000216 170.290 149.72634.47 0.374 46.086 149.496 0.0002662 0.0003 173.140 153.77334.47 0.541 66.681 170.091 0.0003526 0.000405 189.130 164.62013.79 0.149 18.369 59.739 0.0001492 0.000185 123.103 99.13413.79 0.263 32.396 73.766 0.0002489 0.000308 130.153 105.14613.79 0.374 46.103 87.473 0.0003279 0.000401 140.592 115.104

117
Figure D.57 Resilient Modulus vs. Bulk Stress for A-2-4 20% at OMC (Sample # A2420%O1)
Figure D.58 Resilient Modulus vs. Confining Stress for A-2-4 20% at OMC (Sample # A2420%O1)
1025 6 7 8 9 2 3 4 5
BULK STRESS, kPa
102
7
89
2
3
4
5
RES
ILIE
NT
MO
DU
LUS ,
MPa
FROM LVDT AT MIDDLE HALFFROM LVDT AT FULL LENGTH
y=7.7395x0.608
R2=0.9881
y=12.206x0.5459
R2=0.9793
101 1022 3 4 5 6 7 8 9CONFINING PRESSURE, kPa
102
5
6789
2
3
4
5
67
RES
ILIE
NT
MO
DU
LUS,
MPa
FROM LVDT AT MIDDLE HALFFROM LVDT AT FULL LENGTH
y=38.273x0.4519
R2=0.9881
y = 27.173 x0.5073
R2=0.9899
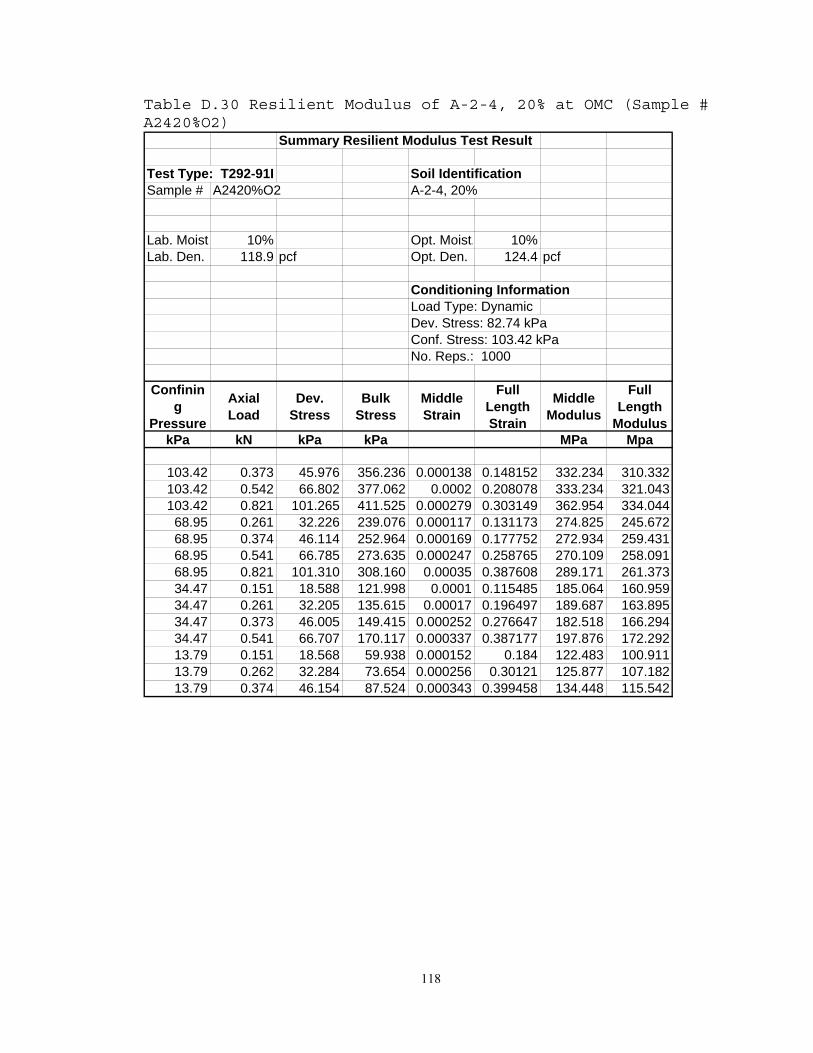
118
Table D.30 Resilient Modulus of A-2-4, 20% at OMC (Sample # A2420%O2)
Summary Resilient Modulus Test Result
Test Type: T292-91I Soil IdentificationSample # A2420%O2 A-2-4, 20%
Lab. Moist. 10% Opt. Moist. 10%Lab. Den. 118.9 pcf Opt. Den. 124.4 pcf
Conditioning InformationLoad Type: DynamicDev. Stress: 82.74 kPaConf. Stress: 103.42 kPaNo. Reps.: 1000
Confining
Pressure
Axial Load
Dev. Stress
Bulk Stress
Middle Strain
Full Length Strain
Middle Modulus
Full Length
ModuluskPa kN kPa kPa MPa Mpa
103.42 0.373 45.976 356.236 0.000138 0.148152 332.234 310.332103.42 0.542 66.802 377.062 0.0002 0.208078 333.234 321.043103.42 0.821 101.265 411.525 0.000279 0.303149 362.954 334.044
68.95 0.261 32.226 239.076 0.000117 0.131173 274.825 245.67268.95 0.374 46.114 252.964 0.000169 0.177752 272.934 259.43168.95 0.541 66.785 273.635 0.000247 0.258765 270.109 258.09168.95 0.821 101.310 308.160 0.00035 0.387608 289.171 261.37334.47 0.151 18.588 121.998 0.0001 0.115485 185.064 160.95934.47 0.261 32.205 135.615 0.00017 0.196497 189.687 163.89534.47 0.373 46.005 149.415 0.000252 0.276647 182.518 166.29434.47 0.541 66.707 170.117 0.000337 0.387177 197.876 172.29213.79 0.151 18.568 59.938 0.000152 0.184 122.483 100.91113.79 0.262 32.284 73.654 0.000256 0.30121 125.877 107.18213.79 0.374 46.154 87.524 0.000343 0.399458 134.448 115.542

119
Figure D.59 Resilient Modulus vs. Bulk Stress for A-2-4 20% at OMC (Sample # A2420%O2)
Figure D.60 Resilient Modulus vs. Confining Stress for A-2-4 20% at OMC (Sample # A2420%O2)
101 1022 3 4 5 6 7 8 9CONFINING PRESSURE, kPa
102
5
6789
2
3
4
5
67
RE
SILI
EN
T M
OD
ULU
S, M
Pa
FROM LVDT AT MIDDLE HALFFROM LVDT AT FULL LENGTH
y=25.07x0.547
R2=0.9956
y = 34.294 * x(0.4928)
R2=0.9961
1025 6 7 8 9 2 3 4 5
BULK STRESS, kPa
102
789
2
3
4
5
678
RE
SILI
ENT
MO
DU
LUS,
MP
aFROM LVDT AT MIDDLE HALFFROM LVDT AT FULL LENGTH
Y o u r t e x t
y=10.387x0.55862
R2=0.983
y=6.5854x0.6529
R2=0.9867

120
Table D.31 Resilient Modulus of A-2-4 20% after drying (Sample # A2420%D1)
Summary Resilient Modulus Test Result
Test Type: T292-91I Soil IdentificationSample # A2420%D1 A-2-4.20%
Lab. Moist. 10.00% Opt. Moist. 10.00%Lab. Den. 117.3 pcf Opt. Den. 124.4 pcfAfter drying 8.26%
Conditioning InformationLoad Type: DynamicDev. Stress: 82.74 kPaConf. Stress: 103.42 kPaNo. Reps.: 1000
Confining Pressure
Axial Load
Dev. Stress
Bulk Stress
Middle Strain
Full Length Strain
Middle Modulus
Full Length
ModuluskPa kN kPa kPa MPa Mpa
103.42 0.374 46.107 356.367 0.0001327 0.000128 347.405 339.051103.42 0.542 66.811 377.071 0.0001937 0.000189 344.861 343.582103.42 0.820 101.174 411.434 0.0002901 0.000283 348.774 337.093
68.95 0.262 32.260 239.110 0.000107 0.000111 301.387 291.86568.95 0.374 46.139 252.989 0.0001562 0.000162 295.460 285.52668.95 0.541 66.791 273.641 0.0002273 0.000235 293.784 284.13868.95 0.821 101.320 308.170 0.0003335 0.000345 303.788 293.90834.47 0.151 18.568 121.978 7.17E-05 9.31E-05 258.951 199.48434.47 0.262 32.349 135.759 0.0001338 0.000165 241.852 195.74834.47 0.373 46.041 149.451 0.0001872 0.000227 245.964 202.74034.47 0.542 66.829 170.239 0.000272 0.000317 245.704 210.85713.79 0.151 18.581 59.951 9.032E-05 0.000155 205.727 119.77613.79 0.262 32.258 73.628 0.000162 0.000253 199.097 127.74513.79 0.374 46.071 87.441 0.0002308 0.000338 199.618 136.283

121
Figure D.61 Resilient Modulus vs. Bulk Stress for A-2-4 20% after drying (Sample # A2420%D1)
Figure D.62 Resilient Modulus vs. Confining Stress for A-2-4 20% after drying (Sample # A2420%D1)
1025 6 7 8 9
BULK STRESS, kPa
102
2
3R
ESIL
IEN
T M
OD
ULU
S, M
Pa
FROM LVDT AT MIDDLE HALFFROM LVDT AT FULL LENGTH
Y o u r t e x t
y=11.021x0.5807
R2=0.9771
y=54.142x0.3077
R2=0.9395
101 1022 3 4 5 6 7 8 9CONFINING PRESSURE, kPa
102
5
6789
2
3
4
5
67
RE
SILI
EN
T M
OD
ULU
S, M
Pa
FROM LVDT AT MIDDLE HALFFROM LVDT AT FULL LENGTH
y=35.506x0.4906
R2=0.9988
y = 99.004 * x(0.2652)
R2=0.9907

122
Table D.32 Resilient Modulus of A-2-4 20% after drying (Sample # A2420%D2)
Summary Resilient Modulus Test Result
Test Type: T292-91I Soil IdentificationSample # A2420%D2 A-2-4, 20%
Lab. Moist. 10.00% Opt. Moist. 10%Lab. Den. 117.9 pcf Opt. Den. 124.4 pcfAfter drying 7.32%
Conditioning InformationLoad Type: DynamicDev. Stress: 82.74 kPaConf. Stress: 103.42 kPaNo. Reps.: 1000
Confining Pressure
Axial Load
Dev. Stress
Bulk Stress
Middle Strain
Full Length Strain
Middle Modulus
Full Length
ModuluskPa kN kPa kPa MPa Mpa
103.42 0.373 45.969 356.229 0.000108 0.000117 426.041 394.371103.42 0.541 66.709 376.969 0.000163 0.000169 409.559 394.920103.42 0.821 101.288 411.548 0.000257 0.000262 394.130 386.599
68.95 0.261 32.209 239.059 8.65E-05 0.000101 372.248 320.10668.95 0.373 46.046 252.896 0.000132 0.000146 348.762 316.14568.95 0.540 66.641 273.491 0.000196 0.000215 339.455 310.54368.95 0.821 101.263 308.113 0.000311 0.000328 325.129 308.79834.47 0.150 18.482 121.892 6.2E-05 8.08E-05 297.871 228.75334.47 0.261 32.222 135.632 0.000119 0.000148 270.155 218.32234.47 0.374 46.082 149.492 0.000177 0.000215 260.840 214.52534.47 0.541 66.751 170.161 0.000263 0.000307 254.285 217.71613.79 0.150 18.488 59.858 8.29E-05 0.000137 223.008 134.70713.79 0.261 32.254 73.624 0.000153 0.000229 211.213 140.96013.79 0.374 46.103 87.473 0.000224 0.000313 206.232 147.064

123
Figure D.63 Resilient Modulus vs. Bulk Stress for A-2-4 20% after drying (Sample # A2420%D2)
Figure D.64 Resilient Modulus vs. Confining Pressure for A-2-4 20% after drying (Sample # A2420%D2)
1025 6 7 8 9 2
BULK STRESS, kPa
102
103
2
3
4
5
6789
RE
SIL
IEN
T M
OD
ULU
S, M
Pa
FROM LVDT AT MIDDLE HALFFROM LVDT AT FULL LENGTH
Y o u r t e x t
y=11.517x0.5914
R2=0.9612
y=45.132x0.3647
R2=0.8629
101 2 3 4 5 6 7 8CONFINING PRESSURE, kPa
102
5
6789
2
3
4
5
67
RES
ILIE
NT
MO
DU
LUS,
MPa
FROM LVDT AT MIDDLE HALFFROM LVDT AT FULL LENGTH
y=37.578x0.5086
R2=0.9994
y = 89.797 * x(0.3218)
R2=0.9896

124
Table D.33 Resilient Modulus of A-2-4 20% after soaking (Sample # A2420%S1)
Summary Resilient Modulus Test Result
Test Type: T292-91I Soil IdentificationSample # A2420%S1 A-2-4, 20%
Lab. Moist. 10.00% Opt. Moist. 10.00%Lab. Den. 119 pcf Opt. Den. 124.4 pcfAfter soaking 11.57%
Conditioning InformationLoad Type: DynamicDev. Stress: 82.74 kPaConf. Stress: 103.42 kPaNo. Reps.: 1000
Confining Pressure
Axial Load
Dev. Stress
Bulk Stress
Middle Strain
Full Length Strain
Middle Modulus
Full Length
ModuluskPa kN kPa kPa MPa Mpa
103.42 0.373 46.022 356.282 0.00015 0.000172 306.904 267.669103.42 0.541 66.738 376.998 0.000221 0.000246 302.262 270.997103.42 0.820 101.100 411.360 0.000328 0.000366 308.553 276.021
68.95 0.262 32.284 239.134 0.000132 0.000154 245.163 209.86168.95 0.374 46.103 252.953 0.000189 0.000221 244.273 208.96268.95 0.542 66.868 273.718 0.000274 0.000319 243.690 209.41668.95 0.821 101.233 308.083 0.000402 0.00046 251.965 219.96834.47 0.150 18.496 121.906 0.000104 0.000129 178.253 142.83534.47 0.261 32.203 135.613 0.000187 0.00023 172.356 139.81634.47 0.373 46.058 149.468 0.000266 0.000324 172.844 142.22734.47 0.541 66.675 170.085 0.000371 0.000445 179.505 149.85913.79 0.150 18.464 59.834 0.000151 0.000196 122.284 94.17013.79 0.261 32.220 73.590 0.000258 0.000327 124.955 98.38313.79 0.374 46.092 87.462 0.000346 0.00043 133.042 107.284

125
Figure D.65 Resilient Modulus vs. Bulk Stress for A-2-4 20% after soaking (Sample# A2420%S1)
Figure D.66 Resilient Modulus vs. Confining Pressure for A-2-4 20% after soaking (Sample # A2420%S1)
1025 6 7 8 9 2
BULK STRESS, kPa
102
7
89
2
3
4
5R
ESIL
IEN
T M
OD
ULU
S, M
PaFROM LVDT AT MIDDLE HALFFROM LVDT AT FULL LENGTH
Y o u r t e x t
y=7.8573x0.5907
R2=0.9825
y=13.816x0.5163
R2=0.9749
101 2 3 4 5 6 7 8CONFINING PRESSURE, kPa
102
5
6789
2
3
4
5
67
RE
SILI
ENT
MO
DU
LUS,
MPa
FROM LVDT AT MIDDLE HALFFROM LVDT AT FULL LENGTH
y=26.351x0.4953
R2=0.9900
y = 39.284 * x(0.4361)
R2=0.9915

126
Table D.34 Resilient Modulus of A-2-4 20% after soaking (Sample # A2420%S2)
Summary Resilient Modulus Test Result
Test Type: T292-91I Soil IdentificationSample # A2420%S2 A-2-4, 20%
Lab. Moist. 10% Opt. Moist. 10%Lab. Den. 118 pcf Opt. Den. 124.4 pcfAfter Soaking 12.27%
Conditioning InformationLoad Type: DynamicDev. Stress: 82.74 kPaConf. Stress: 103.42 kPaNo. Reps.: 1000
Confining Pressure Axial Load Dev.
StressBulk
StressMiddle Strain
Full Length Strain
Middle Modulus
Full Length
ModuluskPa kN kPa kPa MPa Mpa
103.42 0.374 46.088 356.348 0.0001565 0.000171 294.505 270.085103.42 0.541 66.770 377.030 0.0002323 0.000245 287.395 272.798103.42 0.820 101.131 411.391 0.0003468 0.000365 291.637 277.245
68.95 0.262 32.330 239.180 0.0001424 0.000156 227.094 206.68368.95 0.374 46.111 252.961 0.0002092 0.00022 220.378 209.81668.95 0.541 66.742 273.592 0.0002989 0.000318 223.324 209.72768.95 0.821 101.320 308.170 0.0004236 0.000455 239.167 222.55334.47 0.150 18.507 121.917 0.0001151 0.000132 160.750 139.89634.47 0.263 32.392 135.802 0.0002044 0.000232 158.467 139.46234.47 0.373 46.052 149.462 0.0002899 0.000324 158.859 141.92634.47 0.541 66.681 170.091 0.0003916 0.000438 170.287 152.30613.79 0.150 18.513 59.883 0.0001827 0.000208 101.333 88.85513.79 0.262 32.320 73.690 0.0002944 0.000336 109.793 96.15913.79 0.374 46.186 87.556 0.0003702 0.000433 124.757 106.649
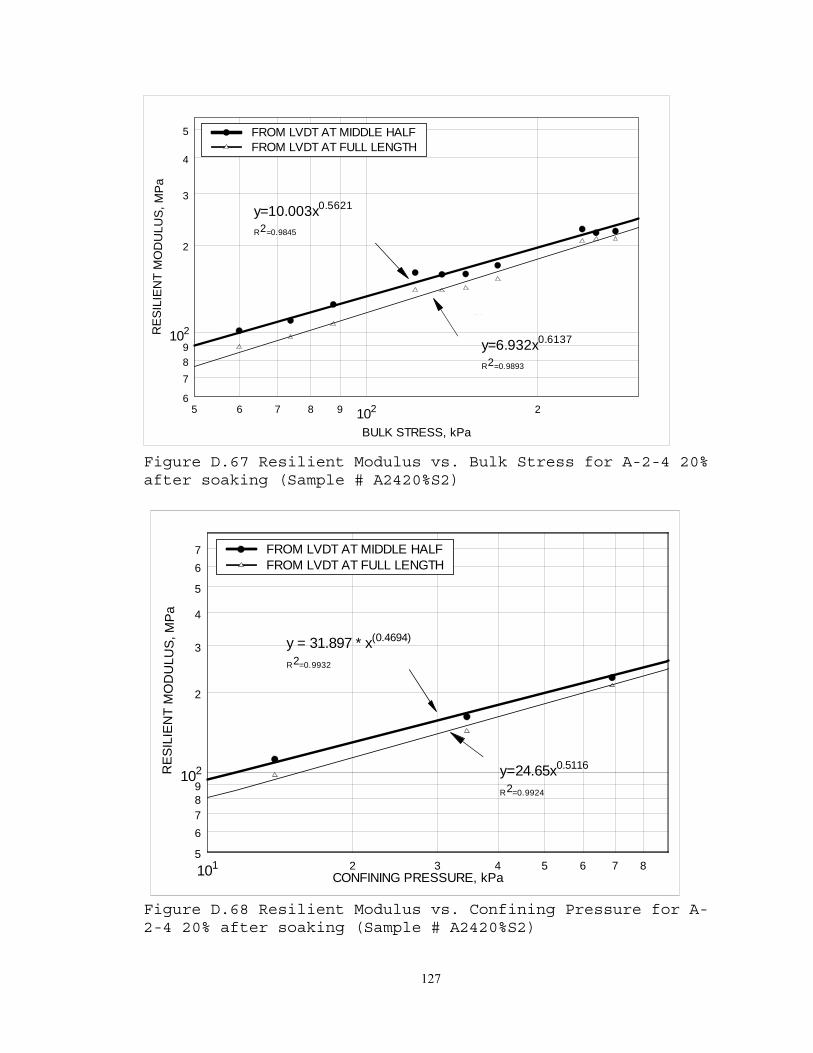
127
Figure D.67 Resilient Modulus vs. Bulk Stress for A-2-4 20% after soaking (Sample # A2420%S2)
Figure D.68 Resilient Modulus vs. Confining Pressure for A-2-4 20% after soaking (Sample # A2420%S2)
1025 6 7 8 9 2
BULK STRESS, kPa
102
6
789
2
3
4
5
RES
ILIE
NT
MO
DU
LUS,
MPa
FROM LVDT AT MIDDLE HALFFROM LVDT AT FULL LENGTH
Y o u r t e x t
y=6.932x0.6137
R2=0.9893
y=10.003x0.5621
R2=0.9845
101 2 3 4 5 6 7 8CONFINING PRESSURE, kPa
102
5
6789
2
3
4
5
67
RES
ILIE
NT
MO
DU
LUS,
MPa
FROM LVDT AT MIDDLE HALFFROM LVDT AT FULL LENGTH
y=24.65x0.5116
R2=0.9924
y = 31.897 * x(0.4694)
R2=0.9932
128
D.6 A-2-4, 24% SOIL

129
Table D.35 Resilient Modulus of A-2-4 24% at OMC (Sample # A2424%O1)
Summary Resilient Modulus Test Result
Test Type: T292-91I Soil IdentificationSample # A2424%O1 A-2-4, 24%
Lab. Moist. 10.70% Opt. Moist. 10.70%Lab. Den. 115.1 pcf Opt. Den. 116.3 pcf
Conditioning InformationLoad Type: DynamicDev. Stress: 82.74 kPaConf. Stress: 103.42 kPaNo. Reps.: 1000
Confining Pressure
Axial Load
Dev. Stress
Bulk Stress
Middle Strain
Full Length Strain
Middle Modulus
Full Length
ModuluskPa kN kPa kPa MPa Mpa
103.42 0.373 46.046 356.306 0.000213 0.000208 216.153 221.236103.42 0.541 66.685 376.945 0.000308 0.000298 216.395 223.629103.42 0.820 101.178 411.438 0.000452 0.000434 223.893 233.050
68.95 0.262 32.316 239.166 0.000171 0.000188 189.398 171.81068.95 0.374 46.177 253.027 0.000249 0.000265 185.801 174.52868.95 0.542 66.840 273.690 0.00036 0.00037 185.735 180.46768.95 0.821 101.316 308.166 0.000518 0.000529 195.428 191.38634.47 0.151 18.645 122.055 0.000121 0.000157 154.105 118.70734.47 0.261 32.250 135.660 0.000222 0.000265 145.054 121.69334.47 0.374 46.099 149.509 0.000317 0.000369 145.366 125.05034.47 0.542 66.847 170.257 0.000445 0.0005 150.333 133.61713.79 0.150 18.477 59.847 0.00017 0.00022 108.948 84.15713.79 0.262 32.332 73.702 0.000292 0.000358 110.739 90.23513.79 0.374 46.107 87.477 0.00039 0.000472 118.371 97.625

130
Figure D.69 Resilient Modulus vs. Bulk Stress for A-2-4 24% at OMC (Sample # A2424%O1)
Figure D.70 Resilient Modulus vs. Confining Pressure for A-2-4 24% at OMC (Sample # A2424%O1)
1025 6 7 8 9 2
BULK STRESS, kPa
102
6
7
89
2
3
4
RES
ILIE
NT
MO
DU
LUS
, MPa
FROM LVDT AT MIDDLE HALFFROM LVDT AT FULL LENGTH
Y o u r t e x t
y=8.5045x0.5469
R2=0.9916
y=21.507x0.3889
R2=0.9734
101 2 3 4 5 6 7 8CONFINING PRESSURE, kPa
102
5
6789
2
3
4
5
67
RES
ILIE
NT
MO
DU
LUS,
MPa
FROM LVDT AT MIDDLE HALFFROM LVDT AT FULL LENGTH
y=26.681x0.4528
R2=0.997
y = 47.093 * x(0.3291)
R2=0.9984

131
Table D.36 Resilient Modulus of A-2-4 24% at OMC (Sample # A2424%O2)
Summary Resilient Modulus Test Result
Test Type: T292-91I Soil IdentificationSample # A2424%O2 A-2-4, 24%
Lab. Moist. 10.70% Opt. Moist. 10.70%Lab. Den. 115.7 pcf Opt. Den. 116.3 pcf
Conditioning InformationLoad Type: DynamicDev. Stress: 82.74 kPaConf. Stress: 103.42 kPaNo. Reps.: 1000
Confining
Pressure
Axial Load
Dev. Stress
Bulk Stress
Middle Strain
Full Length Strain
Middle Modulus
Full Length
ModuluskPa kN kPa kPa MPa Mpa
103.42 0.373 46.067 356.327 0.00017 0.000173 271.634 266.267103.42 0.541 66.751 377.011 0.000261 0.00026 256.149 256.253103.42 0.821 101.318 411.578 0.000408 0.000404 248.042 251.065
68.95 0.262 32.265 239.115 0.000151 0.000168 214.197 191.74568.95 0.373 45.988 252.838 0.000224 0.000238 205.568 193.33568.95 0.541 66.774 273.624 0.000324 0.000342 205.860 195.16168.95 0.820 101.150 308.000 0.000491 0.000508 206.213 199.26334.47 0.150 18.505 121.915 0.000113 0.000144 163.673 128.76734.47 0.261 32.245 135.655 0.000209 0.000249 154.363 129.68534.47 0.375 46.224 149.634 0.000301 0.000346 153.783 133.58634.47 0.541 66.760 170.170 0.000428 0.000482 155.939 138.45113.79 0.150 18.458 59.828 0.000166 0.000211 111.325 87.59513.79 0.262 32.282 73.652 0.000286 0.000351 112.971 91.86513.79 0.373 46.010 87.380 0.000393 0.00047 116.984 97.958

132
Figure D.71 Resilient Modulus vs. Bulk Stress for A-2-4 24% at OMC (Sample # A2424%O2)
Figure D.72 Resilient Modulus vs. Confining Pressure for A-2-4 24% at OMC (Sample # A2424%O2)
1025 6 7 8 9 2
BULK STRESS, kPa
102
6
7
89
2
3
4
RE
SIL
IEN
T M
OD
ULU
S, M
Pa
FROM LVDT AT MIDDLE HALFFROM LVDT AT FULL LENGTH
Y o u r t e x t
y=6.9937x0.5987
R2=0.9757
y=15.512x0.4671
R2=0.9976
101 2 3 4 5 6 7 8CONFINING PRESSURE, kPa
102
5
6789
2
3
4
5
67
RES
ILIE
NT
MO
DU
LUS,
MPa
FROM LVDT AT MIDDLE HALFFROM LVDT AT FULL LENGTH
y=23.702x0.5039
R2=0.9859
y = 38.884 * x(0.4017)
R2=0.993

133
Table D.37 Resilient Modulus of A-2-4, 24% after drying (Sample # A2424%D1)
Summary Resilient Modulus Test Result
Test Type: T292-91I Soil IdentificationSample # A2424%D1 A-2-4, 24%
Lab. Moist. 10.70% Opt. Moist. 10.70%Lab. Den. 114.0 pcf Opt. Den. 116.3 pcfAfter drying 7.65%
Conditioning InformationLoad Type: DynamicDev. Stress: 82.74 kPaConf. Stress: 103.42 kPaNo. Reps.: 1000
Confining Pressure
Axial Load
Dev. Stress
Bulk Stress
Middle Strain
Full Length Strain
Middle Modulus
Full Length
ModuluskPa kN kPa kPa MPa Mpa
103.42 0.373 45.999 356.259 0.000176 0.000189 260.875 243.439103.42 0.543 66.950 377.210 0.000259 0.000271 258.090 247.398103.42 0.820 101.119 411.379 0.000388 0.000394 260.858 256.882
68.95 0.261 32.199 239.049 0.000155 0.000168 207.569 192.08968.95 0.374 46.088 252.938 0.000227 0.000239 203.184 192.88368.95 0.541 66.690 273.540 0.000326 0.000337 204.612 198.03568.95 0.821 101.290 308.140 0.000483 0.000494 209.727 205.20034.47 0.149 18.426 121.836 0.000115 0.000132 160.513 139.96634.47 0.261 32.224 135.634 0.000214 0.000233 150.527 138.48134.47 0.374 46.186 149.596 0.000307 0.00033 150.625 140.01634.47 0.541 66.747 170.157 0.000429 0.000453 155.585 147.31013.79 0.150 18.528 59.898 0.000156 0.000191 118.517 96.94813.79 0.262 32.316 73.686 0.000282 0.000322 114.675 100.26013.79 0.374 46.099 87.469 0.000382 0.000428 120.749 107.626

134
Figure D.73 Resilient Modulus vs. Bulk Stress for A-2-4, 24% after drying (Sample # A2424%D1)
Figure D.74 Resilient Modulus vs. Confining Pressure for A-2-4, 24% after drying (Sample # A2424%D1)
1025 6 7 8 9 2
BULK STRESS, kPa
102
6
7
89
2
3
4
RES
ILIE
NT
MO
DU
L US,
MPa
FROM LVDT AT MIDDLE HALFFROM LVDT AT FULL LENGTH
Y o u r t e x t
y=10.554x0.5262
R2=0.9844
y=16.725x0.453
R2=0.9517
101 2 3 4 5 6 7 8CONFINING PRESSURE, kPa
102
5
6789
2
3
4
5
67
RES
ILIE
NT
MO
DU
LUS,
MPa
FROM LVDT AT MIDDLE HALFFROM LVDT AT FULL LENGTH
y=31.002x0.4415
R2=0.9901
y = 41.44 * x(0.3859)
R2=0.981

135
Table D.38 Resilient Modulus of A-2-4, 24% after drying (A2424%D2)
Summary Resilient Modulus Test Result
Test Type: T292-91I Soil IdentificationSample # A2424%D2 A-2-4, 24%
Lab. Moist. 10.70% Opt. Moist. 10.70%Lab. Den. 116 pcf Opt. Den. 116.3 pcfAfter drying 7.72%
Conditioning InformationLoad Type: DynamicDev. Stress: 82.74 kPaConf. Stress: 103.42 kPaNo. Reps.: 1000
Confining Pressure
Axial Load
Dev. Stress
Bulk Stress
Middle Strain
Full Length Strain
Middle Modulus
Full Length
ModuluskPa kN kPa kPa MPa Mpa
103.42 0.372 45.912 356.172 0.0001667 0.000176 275.411 260.503103.42 0.542 66.811 377.071 0.0002293 0.000253 291.412 264.133103.42 0.821 101.238 411.498 0.0003487 0.000373 290.342 271.135
68.95 0.261 32.222 239.072 0.0001341 0.000152 240.310 212.43068.95 0.375 46.222 253.072 0.0002064 0.000216 223.975 213.89068.95 0.541 66.736 273.586 0.0002977 0.000313 224.134 213.32068.95 0.821 101.235 308.085 0.0004373 0.000462 231.512 219.15134.47 0.150 18.518 121.928 0.0001027 0.000118 180.351 156.84134.47 0.262 32.337 135.747 0.0001877 0.000209 172.241 154.41034.47 0.374 46.145 149.555 0.0002722 0.000293 169.512 157.71034.47 0.541 66.675 170.085 0.0003691 0.000418 180.651 159.43313.79 0.149 18.428 59.798 0.0001446 0.000167 127.412 110.50113.79 0.261 32.237 73.607 0.0002485 0.000286 129.712 112.83613.79 0.374 46.179 87.549 0.0003522 0.000396 131.132 116.610

136
Figure D.75 Resilient Modulus vs. Bulk Stress for A-2-4, 24% (Sample # A24224%D2)
Figure D.76 Resilient Modulus vs. Confining Pressure for A-2-4, 24% (A2424%D2)
1025 6 7 8 9 2
BULK STRESS, kPa
102
8
9
2
3
4
RES
ILIE
NT
MO
DU
L US
, MPa
FROM LVDT AT MIDDLE HALFFROM LVDT AT FULL LENGTH
Y o u r t e x t
y=13.578x0.4954
R2=0.9771
y=18.713x0.4522
R2=0.958
101 2 3 4 5 6 7 8CONFINING PRESSURE, kPa
102
5
6789
2
3
4
5
67
RE
SILI
ENT
MO
DU
LUS,
MP
a
FROM LVDT AT MIDDLE HALFFROM LVDT AT FULL LENGTH
y=36.859x0.4196
R2=0.9935
y = 45.993 * x(0.3865)
R2=0.9913
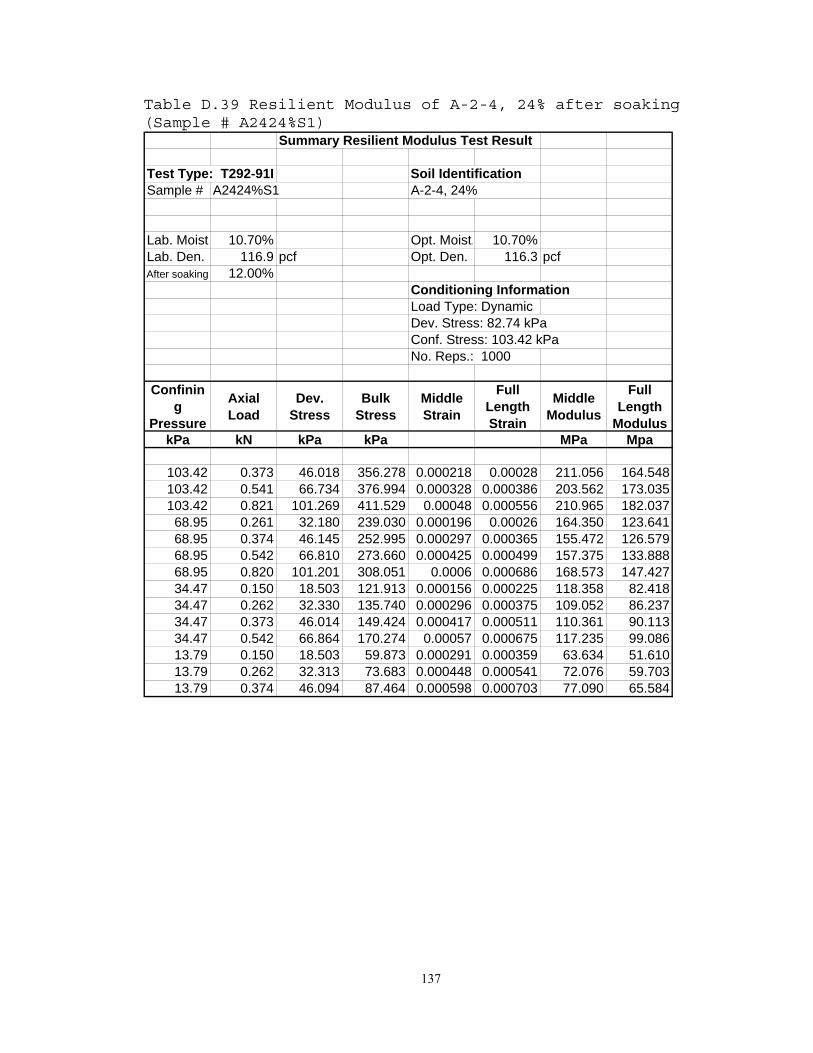
137
Table D.39 Resilient Modulus of A-2-4, 24% after soaking (Sample # A2424%S1)
Summary Resilient Modulus Test Result
Test Type: T292-91I Soil IdentificationSample # A2424%S1 A-2-4, 24%
Lab. Moist. 10.70% Opt. Moist. 10.70%Lab. Den. 116.9 pcf Opt. Den. 116.3 pcfAfter soaking: 12.00%
Conditioning InformationLoad Type: DynamicDev. Stress: 82.74 kPaConf. Stress: 103.42 kPaNo. Reps.: 1000
Confining
Pressure
Axial Load
Dev. Stress
Bulk Stress
Middle Strain
Full Length Strain
Middle Modulus
Full Length
ModuluskPa kN kPa kPa MPa Mpa
103.42 0.373 46.018 356.278 0.000218 0.00028 211.056 164.548103.42 0.541 66.734 376.994 0.000328 0.000386 203.562 173.035103.42 0.821 101.269 411.529 0.00048 0.000556 210.965 182.037
68.95 0.261 32.180 239.030 0.000196 0.00026 164.350 123.64168.95 0.374 46.145 252.995 0.000297 0.000365 155.472 126.57968.95 0.542 66.810 273.660 0.000425 0.000499 157.375 133.88868.95 0.820 101.201 308.051 0.0006 0.000686 168.573 147.42734.47 0.150 18.503 121.913 0.000156 0.000225 118.358 82.41834.47 0.262 32.330 135.740 0.000296 0.000375 109.052 86.23734.47 0.373 46.014 149.424 0.000417 0.000511 110.361 90.11334.47 0.542 66.864 170.274 0.00057 0.000675 117.235 99.08613.79 0.150 18.503 59.873 0.000291 0.000359 63.634 51.61013.79 0.262 32.313 73.683 0.000448 0.000541 72.076 59.70313.79 0.374 46.094 87.464 0.000598 0.000703 77.090 65.584

138
Figure D.77 Resilient Modulus vs. Bulk Stress for A-2-4, 24% after soaking (A2424%S1)
Figure D.78 Resilient Modulus vs. Confining Pressure for A-2-4, 24% after soaking (A2424%S1)
1025 6 7 8 9 2
BULK STRESS, kPa
102
3
4
5
678
2
3
4
RES
ILIE
NT
MO
DU
LUS
, MPa
FROM LVDT AT MIDDLE HALFFROM LVDT AT FULL LENGTH
Y o u r t e x t
y=3.6325x0.6465
R2=0.9979
y=4.9754x0.6255
R2=0.9744
101 2 3 4 5 6 7 8CONFINING PRESSURE, kPa
102
2
3
4
5678
2
3
4
RES
ILIE
NT
MO
DU
LUS,
MPa
FROM LVDT AT MIDDLE HALFFROM LVDT AT FULL LENGTH
y=14.217x0.5319
R2=0.994
y = 17.577 * x(0.529)
R2=0.9986

139
Table D.40 Resilient Modulus of A-2-4, 24% after soaking (Sample # A2424%S2)
Summary Resilient Modulus Test Result
Test Type: T292-91I Soil IdentificationSample # A2424%S2 A-2-4, 24%
Lab. Moist. 10.70% Opt. Moist. 10.70%Lab. Den. 116.9 pcf Opt. Den. 116.3 pcfAfer Soaking 11.40%
Conditioning InformationLoad Type: DynamicDev. Stress: 82.74 kPaConf. Stress: 103.42 kPaNo. Reps.: 1000
Confining
Pressure
Axial Load
Dev. Stress
Bulk Stress
Middle Strain
Full Length Strain
Middle Modulus
Full Length
ModuluskPa kN kPa kPa MPa Mpa
103.42 0.374 46.154 356.414 0.000138 0.000171 333.471 269.792103.42 0.542 66.808 377.068 0.000218 0.000262 306.408 255.417103.42 0.821 101.301 411.561 0.000336 0.000399 301.552 253.871
68.95 0.261 32.205 239.055 0.000113 0.000176 283.965 182.73068.95 0.374 46.088 252.938 0.000188 0.000253 245.090 182.20568.95 0.541 66.721 273.571 0.000291 0.000364 228.919 183.45568.95 0.821 101.269 308.119 0.000439 0.000525 230.860 192.94734.47 0.150 18.513 121.923 8.2E-05 0.000168 225.654 110.44134.47 0.262 32.345 135.755 0.000186 0.000284 173.598 114.07534.47 0.374 46.114 149.524 0.000297 0.000393 155.190 117.34234.47 0.541 66.730 170.140 0.000423 0.000534 157.701 124.98613.79 0.150 18.488 59.858 0.000174 0.000257 106.204 71.98813.79 0.262 32.324 73.694 0.000325 0.000414 99.331 78.13913.79 0.373 46.029 87.399 0.000428 0.000538 107.465 85.523

140
Figure D.79 Resilient Modulus vs. Bulk Stress for A-2-4, 24% (Sample # A2424%S2)
Figure D.80 Resilient Modulus vs. Confining Pressure for A-2-4, 24% (Sample # A2424%S2)
1025 6 7 8 9 2
BUL K ST R ESS, kPa
102
4
5
6789
2
3
4
5
RES
ILIE
NT
MO
DU
L US ,
MPa
F R O M L VD T AT MID D L E HAL FF R O M L VD T AT F UL L L ENG T H
Y o u r t e x t
y=3.7207x0.7035
R 2=0.9769
y=8.2687x0.608
R 2 =0.8505
101 2 3 4 5 6 7 8CO NF INING PRESSURE, kPa
102
2
3
4
5678
2
3
4
RES
ILIE
NT
MO
DU
L US,
MPa
F RO M LVD T AT MID DLE HALFF RO M LVD T AT F ULL LENG T H
y=15.913x0 .5 9 7 7
R 2 =0.9804
y = 25.598 * x(0 .5 3 9 9 )
R 2 =0.9982

141
D.7 A-2-4, 30% SOIL

142
Table D.41 Triaxial test results of A-2-4 30% fine after drying (A2430%D1)
Summary Resilient Modulus Test Result
Test Type: T292-91I Soil IdentificationSample NoA2430%D1 A-2-4,30% fine
Dried
Moisture 6.30% Opt. Moist. 12.00%Lab. Den. 116.1 pcf Opt. Den. 115.7 pcf
Conditioning InformationLoad Type: DynamicDev. Stress: 82.74 kPaConf. Stress: 103.42 kPaNo. Reps.: 1000
Confining
Pressure
Axial Load
Dev. Stress
Bulk Stress
Middle Strain
Full Length Strain
Middle Modulus
Full Length
ModuluskPa kN kPa kPa MPa Mpa
103.42 0.374 46.097 356.357 4.34E-05 5.71E-05 1061.272 807.369103.42 0.540 66.630 376.890 7.38E-05 8.86E-05 903.212 752.431103.42 0.820 101.093 411.353 0.000128 0.000146 789.396 694.085
68.95 0.262 32.262 239.112 3.07E-05 4.89E-05 1051.542 659.63568.95 0.372 45.912 252.762 4.96E-05 7.02E-05 924.901 653.65268.95 0.541 66.675 273.525 8.36E-05 0.000105 797.602 634.13568.95 0.821 101.314 308.164 0.000148 0.000171 682.697 591.48134.47 0.149 18.437 121.847 1.47E-05 4.03E-05 1258.461 457.60734.47 0.261 32.218 135.628 3.79E-05 7.26E-05 849.650 443.72134.47 0.373 46.003 149.413 6.15E-05 0.000102 747.622 450.44834.47 0.541 66.673 170.083 9.95E-05 0.000149 670.405 446.53813.79 0.150 18.524 59.894 2.02E-05 7.86E-05 918.614 235.55013.79 0.261 32.237 73.607 4.67E-05 0.000126 690.152 255.32613.79 0.374 46.094 87.464 7.83E-05 0.000165 589.043 278.560

143
y = 596.33x0.0647
R2 = 0.0379
y = 19.176x0.6226
R2 = 0.9343
100
1000
10000
10 100 1000BULK STRESS, kPa
RE
SIL
IEN
T M
OD
ULU
S, M
Pa FROM LVDT AT MIDDLE HALF
FROM LVDT AT FULL LENGTH
Figure D.81 Resilient Modulus vs. Bulk Stress for A-2-4 30% after drying (Sample # A2430%D1)
y = 578.4x0.1012
R2 = 0.8096
y = 64.499x0.5363
R2 = 0.9942
100
1000
10 100 1000CONFINING PRESSURE, kPa
RE
SIL
IEN
T M
OD
ULU
S, M
Pa FROM LVDT AT MIDDLE HALF
FROM LVDT AT FULL LENGTH
Figure D.82 Resilient Modulus vs. Confining Stress for A-2-4 30% fine after drying (Sample # A2430%D1)
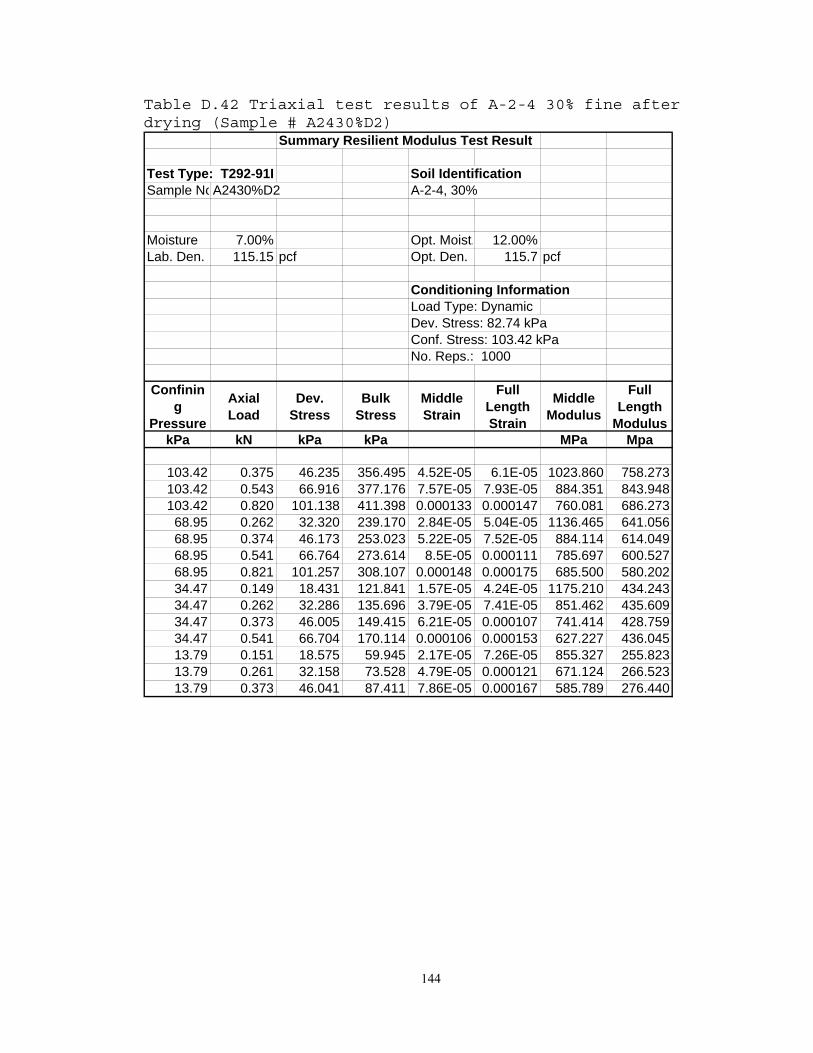
144
Table D.42 Triaxial test results of A-2-4 30% fine after drying (Sample # A2430%D2)
Summary Resilient Modulus Test Result
Test Type: T292-91I Soil IdentificationSample NoA2430%D2 A-2-4, 30%
Moisture 7.00% Opt. Moist. 12.00%Lab. Den. 115.15 pcf Opt. Den. 115.7 pcf
Conditioning InformationLoad Type: DynamicDev. Stress: 82.74 kPaConf. Stress: 103.42 kPaNo. Reps.: 1000
Confining
Pressure
Axial Load
Dev. Stress
Bulk Stress
Middle Strain
Full Length Strain
Middle Modulus
Full Length
ModuluskPa kN kPa kPa MPa Mpa
103.42 0.375 46.235 356.495 4.52E-05 6.1E-05 1023.860 758.273103.42 0.543 66.916 377.176 7.57E-05 7.93E-05 884.351 843.948103.42 0.820 101.138 411.398 0.000133 0.000147 760.081 686.273
68.95 0.262 32.320 239.170 2.84E-05 5.04E-05 1136.465 641.05668.95 0.374 46.173 253.023 5.22E-05 7.52E-05 884.114 614.04968.95 0.541 66.764 273.614 8.5E-05 0.000111 785.697 600.52768.95 0.821 101.257 308.107 0.000148 0.000175 685.500 580.20234.47 0.149 18.431 121.841 1.57E-05 4.24E-05 1175.210 434.24334.47 0.262 32.286 135.696 3.79E-05 7.41E-05 851.462 435.60934.47 0.373 46.005 149.415 6.21E-05 0.000107 741.414 428.75934.47 0.541 66.704 170.114 0.000106 0.000153 627.227 436.04513.79 0.151 18.575 59.945 2.17E-05 7.26E-05 855.327 255.82313.79 0.261 32.158 73.528 4.79E-05 0.000121 671.124 266.52313.79 0.373 46.041 87.411 7.86E-05 0.000167 585.789 276.440

145
y = 540.26x0.0793
R2 = 0.0564
y = 21.326x0.6001
R2 = 0.9418100
1000
10000
10 100 1000BULK STRESS, kPa
RE
SIL
IEN
T M
OD
ULU
S, M
Pa FROM LVDT AT MIDDLE HALF
FROM LVDT AT FULL LENGTH
Figure D.83 Resilient Modulus vs. Bulk Stress for A-2-4 30% after drying (Sample # A2430%D2)
y = 537.35x0.1142
R2 = 0.8753
y = 68.457x0.5188
R2 = 0.9996
100
1000
10 100 1000CONFINING PRESSURE, kPa
RE
SIL
IEN
T M
OD
ULU
S, M
Pa
FROM LVDT AT MIDDLE HALF
FROM LVDT AT FULL LENGTH
Figure D.84 Resilient Modulus vs. Confining Stress for A-2-4 30% fine after drying (Sample # A2430%D2)

146
Table D.43 Triaxial test results of A-2-4 30% at optimum condition (Sample # A2430%O1)
Summary Resilient Modulus Test Result
Test Type: T292-91I Soil IdentificationSample NoA2430%O1 A-2-4, 30% fine
Lab. Moist. 12% Opt. Moist. 12%Lab. Den. 115.8 pcf Opt. Den. 115.7 pcf
Conditioning InformationLoad Type: DynamicDev. Stress: 82.74 kPaConf. Stress: 103.42 kPaNo. Reps.: 1000
Confining
Pressure
Axial Load
Dev. Stress
Bulk Stress
Middle Strain
Full Length Strain
Middle Modulus
Full Length
ModuluskPa kN kPa kPa MPa Mpa
103.42 0.375 46.201 356.461 7.1E-05 0.000172 650.568 268.043103.42 0.541 66.726 376.986 0.000156 0.000265 427.282 251.581103.42 0.820 101.170 411.430 0.000376 0.000444 268.878 227.611
68.95 0.262 32.277 239.127 6.41E-05 0.000167 503.364 193.54768.95 0.374 46.154 253.004 0.000106 0.000242 434.672 190.75268.95 0.541 66.774 273.624 0.000271 0.000369 246.280 181.02568.95 0.821 101.257 308.107 0.000525 0.000589 192.929 171.89634.47 0.151 18.605 122.015 4.98E-05 0.000152 373.487 122.31334.47 0.262 32.301 135.711 0.000145 0.000284 222.564 113.74834.47 0.373 46.054 149.464 0.0003 0.00041 153.382 112.38134.47 0.542 66.796 170.206 0.000492 0.00059 135.739 113.18813.79 0.149 18.388 59.758 8.88E-05 0.00026 207.138 70.59013.79 0.261 32.243 73.613 0.000313 0.000458 102.895 70.32313.79 0.374 46.113 87.483 0.000502 0.000639 91.873 72.183

147
y = 10.877x0.5973
R2 = 0.3938
y = 3.3241x0.7184
R2 = 0.9353
10
100
1000
10 100 1000BULK STRESS, kPa
RE
SIL
IEN
T M
OD
ULU
S,
MP
a
FROM LVDT AT MIDDLE HALFFROM LVDT AT FULL LENGTH
Figure D.85 Resilient Modulus vs. Bulk Stress for A-2-4 30% at optimum moisture (Sample # A2430%O1)
y = 27.255x0.6002
R2 = 0.9982
y = 13.503x0.6208
R2 = 0.9943
10
100
1000
10 100 1000CONFINING PRESSURE, kPa
RE
SIL
IEN
T M
OD
ULU
S, M
Pa
FROM LVDT AT MIDDLE HALF
FROM LVDT AT FULL LENGTH
Figure D.86 Resilient Modulus vs. Confining Stress for A-2-4 30% at optimum moisture (Sample # A2430%O1)

148
Table D.44 Triaxial test results of A-2-4 30% at optimum condition (Sample # A2430%O2)
Summary Resilient Modulus Test Result
Test Type: T292-91I Soil IdentificationSample NoA2430%O2 A-2-4, 30% fine
Lab. Moist. 12.30% Opt. Moist. 12%Lab. Den. 115.1 pcf Opt. Den. 115.7 pcf
Conditioning InformationLoad Type: DynamicDev. Stress: 82.74 kPaConf. Stress: 103.42 kPaNo. Reps.: 1000
Confining
Pressure
Axial Load
Dev. Stress
Bulk Stress
Middle Strain
Full Length Strain
Middle Modulus
Full Length
ModuluskPa kN kPa kPa MPa Mpa
103.42 0.373 46.058 356.318 8.91E-05 0.000199 516.825 231.851103.42 0.542 66.819 377.079 0.000202 0.000295 330.766 226.701103.42 0.821 101.235 411.495 0.000406 0.000468 249.081 216.226
68.95 0.262 32.326 239.176 8.24E-05 0.000184 392.331 176.09668.95 0.374 46.073 252.923 0.000167 0.000267 275.279 172.86868.95 0.542 66.811 273.661 0.000322 0.000391 207.283 170.84968.95 0.821 101.284 308.134 0.000573 0.000633 176.781 159.89434.47 0.150 18.490 121.900 6.14E-05 0.000162 301.316 114.11934.47 0.262 32.299 135.709 0.000178 0.000305 181.403 106.01934.47 0.374 46.175 149.585 0.000337 0.000441 137.170 104.74634.47 0.541 66.759 170.169 0.000539 0.000637 123.822 104.85513.79 0.149 18.324 59.694 0.000108 0.000283 169.541 64.82113.79 0.262 32.256 73.626 0.000358 0.000494 90.145 65.26113.79 0.374 46.167 87.537 0.000588 0.000692 78.503 66.753

149
y = 9.9673x0.5778
R2 = 0.4464
y = 3.2058x0.7096
R2 = 0.9459
10
100
1000
10 100 1000BULK STRESS, kPa
RE
SIL
IEN
T M
OD
ULU
S,
MP
a
FROM LVDT AT MIDDLE HALF
FROM LVDT AT FULL LENGTH
Figure D.87 Resilient Modulus vs. Bulk Stress for A-2-4 30% at optimum moisture (Sample # A2430%O2)
y = 25.023x0.5683
R2 = 0.9932
y = 12.879x0.6112
R2 = 0.9965
10
100
1000
10 100 1000CONFINING PRESSURE, kPa
RE
SIL
IEN
T M
OD
ULU
S, M
Pa
FROM LVDT AT MIDDLE HALF
FROM LVDT AT FULL LENGTH
Figure D.88 Resilient Modulus vs. Confining Stress for A-2-4 30% at optimum moisture (Sample # A2430%O2)

150
Table D.45 Triaxial test results of A-2-4 30% after soaking (Sample # A2430%S1)
Summary Resilient Modulus Test Result
Test Type: T292-91I Soil IdentificationSample NoA2430%S1 A-2-4, 30% fine
Lab. Moist. 13.40% Opt. Moist. 12%Lab. Den. 116.4 pcf Opt. Den. 115.7 pcf
Conditioning InformationLoad Type: DynamicDev. Stress: 82.74 kPaConf. Stress: 103.42 kPaNo. Reps.: 1000
Confining
Pressure
Axial Load
Dev. Stress
Bulk Stress
Middle Strain
Full Length Strain
Middle Modulus
Full Length
ModuluskPa kN kPa kPa MPa Mpa
103.42 0.374 46.171 356.431 6.34E-05 0.000168 274.737103.42 0.541 66.728 376.988 0.000168 0.000255 398.318 261.577103.42 0.820 101.140 411.400 0.000327 0.000407 308.857 248.372
68.95 0.261 32.205 239.055 4.24E-05 0.000168 192.12468.95 0.375 46.201 253.051 0.000127 0.000233 364.222 198.18468.95 0.542 66.872 273.722 0.000246 0.000351 272.091 190.64768.95 0.821 101.267 308.117 0.000452 0.000546 224.090 185.33634.47 0.150 18.560 121.970 7.24E-06 0.000156 119.31134.47 0.262 32.294 135.704 0.000144 0.00028 224.668 115.29634.47 0.374 46.094 149.504 0.000255 0.000402 180.703 114.64934.47 0.542 66.851 170.261 0.000414 0.000567 161.347 117.97613.79 0.150 18.477 59.847 0.000115 0.00027 160.008 68.38613.79 0.262 32.358 73.728 0.000269 0.000459 120.350 70.44313.79 0.374 46.073 87.443 0.000431 0.000633 107.014 72.833

151
y = 12.556x0.5469
R2 = 0.712
y = 2.7408x0.7601
R2 = 0.959
10
100
1000
10 100 1000BULK STRESS, kPa
RE
SIL
IEN
T M
OD
ULU
S,
MP
a
FROM LVDT AT MIDDLE HALF
FROM LVDT AT FULL LENGTH
Figure D.89 Resilient Modulus vs. Bulk Stress for A-2-4 30% after soaking (Sample # A2430%S1)
y = 33.301x0.5059
R2 = 0.993
y = 12.42x0.6492
R2 = 0.9941
10
100
1000
10 100 1000CONFINING PRESSURE, kPa
RE
SIL
IEN
T M
OD
ULU
S, M
Pa
FROM LVDT AT MIDDLE HALF
FROM LVDT AT FULL LENGTH
Figure D.90 Resilient Modulus vs. Confining Stress for A-2-4 30% after soaking (Sample # A2430%S1)

152
Table D.46 Triaxial test results of A-2-4 30% after soaking (Sample # A2430%S2)
Summary Resilient Modulus Test Result
Test Type: T292-91I Soil IdentificationSample NoA2430%S2 A-2-4, 30% fine
Lab. Moist. 13.20% Opt. Moist. 12%Lab. Den. 116 pcf Opt. Den. 115.7 pcf
Conditioning InformationLoad Type: DynamicDev. Stress: 82.74 kPaConf. Stress: 103.42 kPaNo. Reps.: 1000
Confining Pressure Axial Load Dev.
StressBulk
StressMiddle Strain
Full Length Strain
Middle Modulus
Full Length
ModuluskPa kN kPa kPa MPa Mpa
103.42 0.373 45.990 356.250 3.344E-05 0.000199 231.510103.42 0.541 66.779 377.039 0.0001561 0.00029 427.664 229.928103.42 0.821 101.265 411.525 0.000324 0.00044 312.528 230.393
68.95 0.261 32.237 239.087 2.034E-05 0.000193 166.98968.95 0.374 46.141 252.991 0.0001158 0.000281 398.384 164.48168.95 0.541 66.690 273.540 0.0002454 0.000397 271.732 168.04168.95 0.820 101.199 308.049 0.0004495 0.000594 225.141 170.42634.47 0.150 18.511 121.921 6.549E-06 0.000172 107.39334.47 0.261 32.224 135.634 0.0001324 0.000314 243.447 102.72034.47 0.374 46.141 149.551 0.0002447 0.00044 188.532 104.97834.47 0.541 66.687 170.097 0.0004133 0.000612 161.353 108.98413.79 0.150 18.477 59.847 0.0001048 0.000276 176.325 66.89313.79 0.262 32.298 73.668 0.0002634 0.000477 122.641 67.76813.79 0.374 46.071 87.441 0.0004536 0.00066 101.561 69.788

153
y = 13.122x0.5448
R2 = 0.6345
y = 3.2634x0.7073
R2 = 0.9681
10
100
1000
10 100 1000BULK STRESS, kPa
RE
SIL
INE
T M
OD
ULU
S, M
Pa
FROM LVDT AT MIDDLE HALFFROM LVDT AT FULL LENGTH
Figure D.91 Resilient Modulus vs. Bulk Stress for A-2-4 30% after soaking (Sample # A2430%S2)
y = 34.09x0.5106
R2 = 0.9944
y = 13.528x0.6004
R2 = 0.989
10
100
1000
10 100 1000CONFINING PRESSURE, kPa
RE
SIL
IEN
T M
OD
ULU
S, M
Pa
FROM LVDT AT MIDDLE HALF
FROM LVDT AT FULL LENGTH
Figure D.92 Resilient Modulus vs. Confining Stress for A-2-4 30% after soaking (Sample # A2430%S2)

154
D.8 OOLITE A-1 SOIL

155
Table D.47 Triaxial test results of Oolite after drying (Sample # OOLITED1)
Summary Resilient Modulus Test Result
Test Type: T292-91I Soil IdentificationSample # OOLITED1 Oolite
Lab. Moist 5.60% Opt. Moist. 7.80%Lab. Den. 131.35 Opt. Den. 131.30
Conditioning InformationLoad Type: DynamicDev. Stress: 82.74 kPaConf. Stress: 103.42 kPaNo. Reps.: 1000
Confining
Pressure
Axial Load
Dev. Stress Bulk Stress Middle
StrainFull Length
StrainMiddle
Modulus
Full Length
ModuluskPa kN kPa kPa MPa Mpa
103.42 0.375 46.232 356.492 6.119E-05 9.2431E-05 755.568 500.174103.42 0.541 66.690 376.950 9.066E-05 0.00014112 735.584 472.564103.42 0.821 101.324 411.584 0.000155 0.00022451 653.902 451.31768.95 0.262 32.347 239.197 5.912E-05 9.9325E-05 547.129 325.66468.95 0.373 46.069 252.919 8.722E-05 0.00014112 528.219 326.44368.95 0.541 66.785 273.635 0.0001246 0.00019822 535.920 336.92268.95 0.820 101.125 307.975 0.0001986 0.00029539 509.291 342.34134.47 0.150 18.511 121.921 5.274E-05 9.8248E-05 350.968 188.40934.47 0.262 32.265 135.675 8.946E-05 0.00016202 360.684 199.14034.47 0.374 46.101 149.511 0.0001272 0.00021481 362.425 214.61334.47 0.543 66.938 170.348 0.0001774 0.00029625 377.413 225.94913.79 0.150 18.445 59.815 6.808E-05 0.00015642 270.911 117.91613.79 0.262 32.311 73.681 0.0001208 0.00024971 267.418 129.39113.79 0.374 46.156 87.526 0.0001618 0.00032297 285.181 142.911

156
1025 6 7 8 9 2 3 4 5
BULK STRESS, kPa
102
103
8
2
3
4
5
678
RES
ILIE
NT
MO
DU
LUS,
MP
a
FROM LVDT AT MIDDLE HALFFROM LVDT AT FULL LENGTH
y=4.9032x0.7596
R2=0.9807
y=24.927x0.5514
R2=0.9343
Figure D.93 Resilient Modulus vs. Bulk Stress for Oolite (crushed) after drying (OOLITED1)
10 1 10 22 3 4 5 6 7 8 9
C O NF INING PR ESSUR E, kPa
10 2
5
6789
2
3
4
5
67
RES
ILIE
NT
MO
DU
LUS
, MP a
F R O M L VD T AT MID D L E HAL FF R O M L VD T AT F UL L L ENG T H
y = 23 .479 x0 .6349
R 2=0 .9872
y= 7 5 .8 5 4x0.4682
R 2= 0 .9 6 5 3
Figure D.94 Resilient Modulus vs. Confining Stress for Oolite (crushed) after drying (Sample # OOLITED1)

157
Table D.48 Triaxial test results of Oolite (crushed) after drying (Sample # OOLITED2)
Summary Resilient Modulus Test Result
Test Type: T292-91I Soil IdentificationSample No. OOLITED2 Oolite (A-1, crushed)
Moisture 4.40% Opt. Moist. 7.80%Lab Density 131.3 pcf Opt. Den. 131.3 pcf
Conditioning InformationLoad Type: DynamicDev. Stress: 82.74 kPaConf. Stress: 103.42 kPaNo. Reps.: 1000
Confining Pressure Axial Load Dev.
StressBulk
StressMiddle Strain
Full Length Strain
Middle Modulus
Full Length
ModuluskPa kN kPa kPa MPa Mpa
103.42 0.373 46.039 356.299 5.843E-05 7.756E-05 787.907 593.552103.42 0.541 66.670 376.930 8.808E-05 0.0001107 756.949 602.009103.42 0.821 101.255 411.515 0.0001556 0.0001818 650.558 556.820
68.95 0.261 32.246 239.096 5.567E-05 7.326E-05 579.225 440.19268.95 0.373 46.041 252.891 8.205E-05 0.0001073 561.162 429.09568.95 0.541 66.726 273.576 0.0001203 0.000151 554.630 441.79268.95 0.822 101.354 308.204 0.0001963 0.0002381 516.269 425.71334.47 0.150 18.507 121.917 4.309E-05 6.722E-05 429.495 275.30934.47 0.263 32.394 135.804 8.463E-05 0.0001204 382.775 268.96234.47 0.374 46.171 149.581 0.0001193 0.0001709 387.102 270.23234.47 0.541 66.679 170.089 0.0001699 0.0002336 392.351 285.49513.79 0.150 18.549 59.919 6.05E-05 0.0001049 306.603 176.77613.79 0.261 32.180 73.550 0.0001113 0.0001769 289.015 181.92213.79 0.373 46.054 87.424 0.0001546 0.0002413 297.876 190.848

158
1025 6 7 8 9 2 3 4 5
BULK STRESS, kPa
102
103
2
3
4
5
6789
RES
ILIE
NT
MO
DU
LUS,
MPa
FROM LVDT AT MIDDLE HALFFROM LVDT AT FULL LENGTH
y=9.9158x0.5774
R2=0.9637
y=34.292x0.502
R2=0.8909
Figure D.95 Resilient Modulus vs. Bulk Stress for Oolite (crushed) after drying (OOLITED2)
101 1022 3 4 5 6 7 8 9
CO NFINING P RE S S URE , kP a
102
5
6789
2
3
4
5
67
RES
ILIE
NT
MO
DU
LUS ,
MPa
FRO M L V DT A T M IDDL E HA L FFRO M L V DT A T FUL L L E NG T H
y = 38.857 x0.574
R2=0.987
y=90.488x0.4371
R 2=0 .9739
Figure D.96 Resilient Modulus vs. Confining Stress for Oolite (crushed) after drying (Sample # OOLITED2)

159
Table D.49 Triaxial test results of Oolite (crushed) at optimum condition (Sample # OOLITEO1)
Summary Resilient Modulus Test Result
Test Type: T292-91I Soil IdentificationSample No. OOLITEO1 Oolite (A-1, crushed)
Lab. Moist. 7.80% Opt. Moist. 7.80%Lab. Den. 131.08 pcf Opt. Den. 131.3 pcf
Conditioning InformationLoad Type: DynamicDev. Stress: 82.74 kPaConf. Stress: 103.42 kPaNo. Reps.: 1000
Confining Pressure Axial Load Dev.
StressBulk
StressMiddle Strain
Full Length Strain
Middle Modulus
Full Length
ModuluskPa kN kPa kPa MPa Mpa
103.42 0.372 45.910 356.170 9.135E-05 0.0001049 502.562 437.540103.42 0.542 66.846 377.106 0.0001341 0.0001534 498.490 435.742103.42 0.820 101.150 411.410 0.0002246 0.0002461 450.379 411.090
68.95 0.261 32.212 239.062 0.0001013 0.0001112 317.836 289.74168.95 0.374 46.120 252.970 0.0001431 0.0001564 322.387 294.84468.95 0.541 66.787 273.637 0.0001998 0.0002198 334.322 303.89968.95 0.820 101.131 307.981 0.000332 0.000362 304.638 279.39134.47 0.149 18.437 121.847 0.0001113 0.0001241 165.584 148.56134.47 0.262 32.292 135.702 0.0001915 0.0002109 168.631 153.09134.47 0.375 46.211 149.621 0.0002527 0.0002827 182.882 163.47434.47 0.542 66.808 170.218 0.0003549 0.0003984 188.247 167.69813.79 0.150 18.505 59.875 0.0001451 0.0001859 127.509 99.52313.79 0.261 32.235 73.605 0.0002286 0.0002924 141.041 110.25213.79 0.374 46.073 87.443 0.0003171 0.0004014 145.273 114.781

160
1025 6 7 8 9 2 3 4 5BULK ST RESS, kPa
102
678
2
3
4
5
6789
RES
ILIE
NT
MO
DU
L US ,
MPa
FROM LVDT AT M IDDLE HALFFROM LVDT AT FULL LENGT H
y=3.0146x0.8194
R2=0.9552
y=5.0349x0.7568
R2=0.9182
Figure D.97 Resilient Modulus vs. Bulk Stress for Oolite (crushed) at optimum moisture(Sample # OOLITEO1)
101 1022 3 4 5 6 7 8 9
CO NFINING P RE S S URE , kP a
102
5
6789
2
3
4
5
67
RE
SILI
ENT
MO
DU
LUS,
MPa
FRO M L V DT A T M IDDL E HA L FFRO M L V DT A T FUL L L E NG T H
y = 16.429 x0.6842
R2=0.9642
y=24.041x0.6205
R2=0.9254
Figure D.98 Resilient Modulus vs. Confining Stress for Oolite (crushed) after drying (Sample # OOLITEO1)

161
Table D.50 Triaxial test results of Oolite (crushed) at optimum condition (Sample # OOLITEO2)
Summary Resilient Modulus Test Result
Test Type: T292-91I Soil IdentificationSample No. OOLITEO2 Oolite (A-1, crushed)
Lab. Moist. 7.80% Opt. Moist. 7.80%Lab. Den. 131.22 pcf Opt. Den. 131.3 pcf
Conditioning InformationLoad Type: DynamicDev. Stress: 82.74 kPaConf. Stress: 103.42 kPaNo. Reps.: 1000
Confining Pressure Axial Load Dev.
StressBulk
StressMiddle Strain
Full Length Strain
Middle Modulus
Full Length
ModuluskPa kN kPa kPa MPa Mpa
103.42 0.374 46.077 356.337 8.773E-05 0.0001008 525.197 456.958103.42 0.541 66.689 376.949 0.0001388 0.0001553 480.631 429.295103.42 0.820 101.180 411.440 0.0002267 0.0002473 446.402 409.063
68.95 0.262 32.279 239.129 9.704E-05 0.0001092 332.629 295.49268.95 0.374 46.154 253.004 0.0001391 0.0001558 331.816 296.28668.95 0.541 66.721 273.571 0.0001991 0.0002185 335.146 305.39368.95 0.822 101.331 308.181 0.0003218 0.0003529 314.888 287.12234.47 0.150 18.513 121.923 0.0001069 0.0001209 173.235 153.16034.47 0.261 32.250 135.660 0.0001829 0.0002027 176.351 159.06834.47 0.374 46.079 149.489 0.0002434 0.0002745 189.332 167.86834.47 0.540 66.636 170.046 0.0003354 0.0003814 198.665 174.73213.79 0.150 18.484 59.854 0.0001439 0.0001806 128.434 102.37613.79 0.262 32.288 73.658 0.0002153 0.0002762 149.983 116.89413.79 0.374 46.141 87.511 0.0002903 0.0003695 158.965 124.871

162
1025 6 7 8 9 2 3 4 5
BULK STRESS, kPa
102
678
2
3
4
5
6789
RES
ILIE
NT
MO
DU
LUS,
MP a
FROM LVDT AT MIDDLE HALFFROM LVDT AT FULL LENGTH
y = 5 . 9 6 3 3 x 0 . 7 2 0 4
R2
= 0 . 9 1 9 9
y = 3.5722 x0.7921
R2=0.9545
Figure D.99 Resilient Modulus vs. Bulk Stress for Oolite (crushed) at optimum moisture (Sample # OOLITEO2)
1 0 1 1 0 22 3 4 5 6 7 8 9
C O N F IN IN G PR ESSU R E, k Pa
1 0 2
5
6789
2
3
4
5
67
RE
SIL
IEN
T M
OD
ULU
S, M
Pa
F R O M LVD T AT MID D LE H ALFF R O M LVD T AT F U LL LEN G TH
y = 27.305x 0.5951
R2= 0.9269
y = 18.62 x0.6585
R2=0.9603
Figure D.100 Resilient Modulus vs. Confining Stress for Oolite (crushed) after drying (Sample # OOLITEO1)

163
Table D.51 Triaxial test results of Oolite (crushed) after soaking (Sample # OOLITES1)
Summary Resilient Modulus Test Result
Test Type: T292-91I Soil IdentificationSample No. OOLITES1 Oolite (A-1, crushed)
Lab. Moist. 8.20% Opt. Moist. 7.80%Lab. Den. 131.52 pcf Opt. Den. 131.3 pcf
Conditioning InformationLoad Type: DynamicDev. Stress: 82.74 kPaConf. Stress: 103.42 kPaNo. Reps.: 1000
Confining Pressure Axial Load Dev.
StressBulk
StressMiddle Strain
Full Length Strain
Middle Modulus
Full Length
ModuluskPa kN kPa kPa MPa Mpa
103.42 0.374 46.162 356.422 0.0001224 0.0001295 377.206 356.489103.42 0.542 66.859 377.119 0.0001765 0.0001827 378.806 365.932103.42 0.822 101.337 411.597 0.000283 0.0002907 358.057 348.654
68.95 0.262 32.292 239.142 0.0001379 0.0001437 234.188 224.70168.95 0.374 46.101 252.951 0.0001891 0.0002023 243.816 227.86968.95 0.542 66.819 273.669 0.0002611 0.0002745 255.884 243.42768.95 0.821 101.295 308.145 0.0004238 0.0004234 238.994 239.25734.47 0.150 18.524 121.934 0.0001718 0.0001838 107.795 100.79234.47 0.261 32.201 135.611 0.0002806 0.0002975 114.756 108.22234.47 0.374 46.107 149.517 0.0003695 0.0003932 124.767 117.25834.47 0.541 66.683 170.093 0.0005207 0.0005436 128.063 122.66913.79 0.150 18.486 59.856 0.000251 0.0003044 73.663 60.72213.79 0.261 32.246 73.616 0.0003711 0.0004563 86.895 70.66313.79 0.374 46.088 87.458 0.0004809 0.0005977 95.839 77.112

164
1025 6 7 8 9 2 3 4 5
BULK ST RESS, kPa
102
3
4
5678
2
3
4
5678
RES
ILIE
NT
MO
DU
LUS ,
MPa
FROM LVDT AT M IDDLE HALFFROM LVDT AT FULL LENGT H
y=0.9275x0.9888
R2=0.9728
y=1.6414x0.8946
R2=0.9429
Figure D.101 Resilient Modulus vs. Bulk Stress for Oolite (crushed) after soaking (Sample # OOLITES1)
101 10 22 3 4 5 6 7 8 9
CO NF INING PRESSURE, kPa
102
5
6789
2
3
4
5
67
RE
SIL
IEN
T M
OD
ULU
S, M
P a
F RO M LVDT AT MIDDLE HALFF RO M LVDT AT F ULL LENG T H
y = 7 .3804 x0 .818
R2=0 .971
y= 10 .987x0.7349
R 2= 0 .9429
Figure D.102 Resilient Modulus vs. Confining Stress for Oolite (crushed) after soaking (Sample # OOLITES1)

165
Table D.52 Triaxial test results of Oolite (crushed) after soaking (Sample # OOLITES2)
Summary Resilient Modulus Test Result
Test Type: T292-91I Soil IdentificationSample No. OOLITES2 Oolite (A-1, crushed)
Lab. Moist. 8.09% Opt. Moist. 7.80%Lab. Den. 131.2 pcf Opt. Den. 131.3 pcf
Conditioning InformationLoad Type: DynamicDev. Stress: 82.74 kPaConf. Stress: 103.42 kPaNo. Reps.: 1000
Confining Pressure Axial Load Dev.
StressBulk
StressMiddle Strain
Full Length Strain
Middle Modulus
Full Length
ModuluskPa kN kPa kPa MPa Mpa
103.42 0.374 46.173 356.433 0.000108 0.0001133 427.531 407.419103.42 0.541 66.677 376.937 0.0001672 0.0001747 398.723 381.588103.42 0.823 101.458 411.718 0.0002773 0.0002902 365.925 349.588
68.95 0.264 32.515 239.365 0.0001205 0.0001291 269.816 251.93968.95 0.375 46.279 253.129 0.0001698 0.0001834 272.567 252.40268.95 0.543 66.985 273.835 0.0002437 0.0002577 274.845 259.94968.95 0.822 101.424 308.274 0.0003798 0.0004098 267.012 247.49634.47 0.150 18.513 121.923 0.0001179 0.0001319 157.021 140.39734.47 0.261 32.167 135.577 0.0002089 0.0002323 154.010 138.49434.47 0.374 46.145 149.555 0.0002791 0.0003176 165.311 145.29934.47 0.540 66.660 170.070 0.0003876 0.0004369 172.001 152.55813.79 0.150 18.467 59.837 0.0001884 0.0002178 98.001 84.78013.79 0.261 32.226 73.596 0.0002932 0.0003503 109.925 91.98513.79 0.373 46.052 87.422 0.0004104 0.0004837 112.214 95.207

166
1025 6 7 8 9 2 3 4 5
BULK STRESS, kPa
102
3
4
5678
2
3
4
5678
RES
ILIE
NT
MO
DU
LUS,
MPa
FROM LVDT AT MIDDLE HALFFROM LVDT AT FULL LENGTH
y=2.4621x0.833
R2=0.9593
y=3.859x0.7655
R2=0.9588
Figure D.103 Resilient Modulus vs. Bulk Stress for Oolite (crushed) after soaking (Sample # OOLITES2) Figure D.104 Resilient Modulus vs. Confining Stress for Oolite (crushed) after soaking (Sample # OOLITES2)
101 1022 3 4 5 6 7 8 9
CONFINING PRESSURE, kPa
102
5
6789
2
3
4
5
67
RES
ILIE
NT
MO
DU
LUS,
MPa
FROM LVDT AT MIDDLE HALFFROM LVDT AT FULL LENGTH
y = 13.331 x0.7043
R2=0.9784
y=18.36x0.6454
R2=0.9759

167
D.9 SPRING CEMETERY A-2-4, 15% SOIL

168
Table D.53 Triaxial test results of Spring Cemetery (Sample # SC001C1)
SAMPLE ID: SC001 TEST NO: C1PROJECT ID: SPECIMEN PREPARATION DATE: 11/16/2005LAB NO: 21665~7 SPECIMEN DIAMETER, TOP, (in): 4SOIL CLASS: A-2-4 SPECIMEN DIAMETER, MIDDLE, (in): 4LBR 83 SPECIMEN DIAMETER, BOTTOM, (in): 4STD MAX DEN (pcf): 118.2 SPECIMEN HEIGHT (in): 8STD OPT MIS (%): 9.2 COMPACTION MC, (%): 9.2
COMPACTION DRY DEN, (pcf): 116MC AFTER TESTING, (%): 8.8TESTED BY: GingerTEST DATE: 11/17/2005
PRECONDITION INFORMATIONCONFINING STRESS (psi): 6MAX. AXIAL STRESS (psi): 4REPETITIONS: 500
REMARKS:
TEST SEQ. #
CONFINING STRESS
MAX. AXIAL STRESS
CONTACT STRESS
CYCLIC STRESS
BULK STRESS
RESILIENT STRAIN
RESILIENT MODULUS
psi psi psi psi psi in/in psi1 5.2 2.005515207 0.1668112 1.838704 17.60552 0.00010319 17818.25852 5.2 3.979742468 0.3581288 3.621614 19.57974 0.00020571 17605.11243 5.2 5.882095892 0.5433121 5.338784 21.4821 0.00030496 17506.48344 5.2 7.834399029 0.7085798 7.125819 23.4344 0.00040799 17465.77315 5.2 9.814375 0.8832058 8.931169 25.41438 0.0005069 17619.14586 3.4 2.000474697 0.1730089 1.827466 12.20047 0.00014887 12275.33427 3.4 3.950922341 0.3609797 3.589943 14.15092 0.00029287 12257.68758 3.4 5.915918041 0.5340028 5.381915 16.11592 0.00041143 13080.9319 3.4 7.893090701 0.6746429 7.218448 18.09309 0.00051799 13935.6108
10 3.4 9.92071465 0.8374954 9.083219 20.12071 0.00065192 13932.9911 1.6 1.998650892 0.1818761 1.816775 6.798651 0.0002011 9034.3261612 1.6 3.980885573 0.3828407 3.598045 8.780886 0.00039254 9165.9746113 1.6 5.942940939 0.5604942 5.382447 10.74294 0.00051883 10374.16614 1.6 7.902905669 0.7234926 7.179413 12.70291 0.00067946 10566.380515 1.6 9.874803025 0.9665529 8.90825 14.6748 0.00085142 10462.792
Light brown, very soft
RESILIENT MODULUS TEST RESULTSSOILS LABORATORY, FAMU-FSU COLLEGE OF ENGINEERING

169
RESILIENT MODULUS VS. BULK STRESS
y = 2795.9x0.5608
R2 = 0.9495
1000
10000
100000
1 10 100
BULK STRESS, psi
RES
ILIE
NT
MO
DU
LUS,
psi
Figure D.105 Resilient Modulus vs. Bulk Stress for Spring Cemetery at Optimum Condition (Sample #SC001C1)
RESILIENT MODULUS VS. CONFINING STRESS
y = 7727.8x0.4691
R2 = 0.9204
1000
10000
100000
1 10
CONFINING STRESS, psi
RES
ILIE
NT
MO
DU
LUS,
psi
Figure D.106 Resilient Modulus vs. Confining Stress for Spring Cemetery at Optimum Condition (Sample #SC001C1)

170
Table D.54 Triaxial test results of Spring Cemetery (Sample # SC001D2)
SAMPLE ID: SC001 TEST NO: D2PROJECT ID: SPECIMEN PREPARATION DATE: 11/16/2005LAB NO: 21665~7 SPECIMEN DIAMETER, TOP, (in): 4SOIL CLASS: A-2-4 SPECIMEN DIAMETER, MIDDLE, (in): 4LBR 83 SPECIMEN DIAMETER, BOTTOM, (in): 4MDF MAX DEN (pcf): 118.2 SPECIMEN HEIGHT (in): 8MDF OPT MIS (%): 9.2 COMPACTION MC, (%): 9.2
COMPACTION DRY DEN, (pcf): 116.2MC AFTER TESTING, (%): 9.5TESTED BY: GingerTEST DATE: 11/18/2005
PRECONDITION INFORMATIONCONFINING STRESS (psi): 6MAX. AXIAL STRESS (psi): 4REPETITIONS: 500
REMARKS:
TEST SEQ. #
CONFINING STRESS
MAX. AXIAL STRESS
CONTACT STRESS
CYCLIC STRESS
BULK STRESS
RESILIENT STRAIN
RESILIENT MODULUS
psi psi psi psi psi in/in psi1 5.2 2.040477771 0.1506224 1.889855 17.64048 0.00012503 15115.00412 5.2 3.97776129 0.3433914 3.63437 19.57776 0.00023444 15502.11393 5.2 5.960225876 0.5137338 5.446492 21.56023 0.0003525 15450.96454 5.2 7.883983424 0.6708485 7.213135 23.48398 0.00046746 15430.60555 5.2 9.843511943 0.8398821 9.00363 25.44351 0.00057922 15544.39426 3.4 2.000046306 0.1868367 1.81321 12.20005 0.00016584 10933.62777 3.4 3.934884538 0.3856349 3.54925 14.13488 0.00032613 10882.83728 3.4 5.878440462 0.5834968 5.294944 16.07844 0.00046133 11477.67719 3.4 7.90720121 0.6694204 7.237781 18.1072 0.00057989 12481.3103
10 3.4 9.929545541 0.8678144 9.061731 20.12955 0.00068418 13244.722411 1.6 2.010212723 0.1953149 1.814898 6.810213 0.00023763 7637.3860612 1.6 3.993040016 0.3896652 3.603375 8.79304 0.00044697 8061.8205913 1.6 5.972337197 0.5680488 5.404288 10.77234 0.00058493 9239.2408814 1.6 7.909542484 0.7490859 7.160457 12.70954 0.00075387 9498.261315 1.6 9.873573567 0.985392 8.888182 14.67357 0.00099561 8927.34655
RESILIENT MODULUS TEST RESULTSSOILS LABORATORY, FAMU-FSU COLLEGE OF ENGINEERING

171
RESILIENT MODULUS VS. BULK STRESS
y = 2340.7x0.5801
R2 = 0.9739
1000
10000
100000
1 10 100
BULK STRESS, psi
RES
ILIE
NT
MO
DU
LUS,
psi
Figure D.107 Resilient Modulus vs. Bulk Stress for Spring Cemetery at Optimum Condition (Sample #SC001D2)
RESILIENT MODULUS VS. CONFINING STRESS
y = 6796.2x0.4811
R2 = 0.9149
1000
10000
100000
1 10
CONFINING STRESS, psi
RES
ILIE
NT
MO
DU
LUS,
psi
Figure D.108 Resilient Modulus vs. Confining Stress for Spring Cemetery at Optimum Condition (Sample #SC001D2)

172
Table D.55 Triaxial test results of Spring Cemetery (Sample # SC001E1)
SAMPLE ID: SC001 TEST NO: E1PROJECT ID: SPECIMEN PREPARATION DATE: 02/02/2006LAB NO: 21665~21667 SPECIMEN DIAMETER, TOP, (in): 4SOIL CLASS: A-2-4 SPECIMEN DIAMETER, MIDDLE, (in): 4LBR 83 SPECIMEN DIAMETER, BOTTOM, (in): 4STD OPT MOIST (%): 9.2 SPECIMEN HEIGHT (in): 8STD MAX DRY DEN (pcf): 118.2 COMPACTION MC, (%): 9.3
COMPACTION DRY DEN, (pcf): 114.9MC AFTER TESTING, (%): 9.2TESTED BY: EdTEST DATE: 02/06/2006
PRECONDITION INFORMATIONCONFINING STRESS (psi): 6MAX. AXIAL STRESS (psi): 4REPETITIONS: 500
REMARKS:
TEST SEQ. #
CONFINING STRESS
MAX. AXIAL STRESS
CONTACT STRESS
CYCLIC STRESS
BULK STRESS
RESILIENT STRAIN
RESILIENT MODULUS
psi psi psi psi psi in/in psi1 6 2.004756194 0.1817417 1.823015 20.00476 0.00012948 14079.6292 6 3.941177787 0.3006315 3.640546 21.94118 0.00025072 14520.20873 6 6.017077866 0.2798148 5.737263 24.01708 0.00040043 14327.7494 6 8.090489013 0.3559042 7.734585 26.09049 0.00053628 14422.56345 6 10.07426592 0.7082643 9.366002 28.07427 0.000621 15082.11976 4 2.008678169 0.1441234 1.864555 14.00868 0.00017356 10743.09067 4 3.984450987 0.2664855 3.717966 15.98445 0.00033947 10952.22068 4 5.998252086 0.3447274 5.653525 17.99825 0.00049522 11416.07619 4 8.079654777 0.455485 7.62417 20.07965 0.00063108 12081.2262
10 4 10.03280605 0.7835051 9.249301 22.03281 0.00072058 12835.90911 2 2.021859156 0.1523178 1.869541 8.021859 0.00024218 7719.7406212 2 4.072945732 0.2428525 3.830093 10.07295 0.00046376 8258.807813 2 5.992376242 0.409711 5.582665 11.99238 0.00060843 9175.561451415
Test Stopped at Seq. 14.
RESILIENT MODULUS TEST RESULTSSOILS LABORATORY, FAMU-FSU COLLEGE OF ENGINEERING

173
RESILIENT MODULUS VS. BULK STRESS
y = 2383.4x0.5511
R2 = 0.9832
1000
10000
100000
1 10 100
BULK STRESS, psi
RES
ILIE
NT
MO
DU
LUS,
psi
Figure D.109 Resilient Modulus vs. Bulk Stress for Spring Cemetery at Optimum Condition (Sample #SC001E1)
RESILIENT MODULUS VS. CONFINING STRESS
y = 5868.7x0.4996
R2 = 0.9332
1000
10000
100000
1 10
CONFINING STRESS, psi
RES
ILIE
NT
MO
DU
LUS,
psi
Figure D.110 Resilient Modulus vs. Confining Stress for Spring Cemetery at Optimum Condition (Sample #SC001E1)

174
Table D.56 Triaxial test results of Spring Cemetery (Sample # SC001F1)
SAMPLE ID: SC001 TEST NO: F1PROJECT ID: SPECIMEN PREPARATION DATE: 02/02/2006LAB NO: 21665~21667 SPECIMEN DIAMETER, TOP, (in): 4SOIL CLASS: A-2-4 SPECIMEN DIAMETER, MIDDLE, (in): 4LBR 83 SPECIMEN DIAMETER, BOTTOM, (in): 4STD OPT MOIST (%): 9.2 SPECIMEN HEIGHT (in): 8STD MAX DRY DEN (pcf): 118.2 COMPACTION MC, (%): 9.3
COMPACTION DRY DEN, (pcf): 114.1MC AFTER TESTING, (%): 9.7TESTED BY: EdTEST DATE: 02/03/2006
PRECONDITION INFORMATIONCONFINING STRESS (psi): 6MAX. AXIAL STRESS (psi): 4REPETITIONS: 500
REMARKS:
TEST SEQ. #
CONFINING STRESS
MAX. AXIAL STRESS
CONTACT STRESS
CYCLIC STRESS
BULK STRESS
RESILIENT STRAIN
RESILIENT MODULUS
psi psi psi psi psi in/in psi1 6 2.001154841 0.1624553 1.8387 20.00115 0.00010034 18324.972 6 3.97832164 0.2789824 3.699339 21.97832 0.00020253 18265.98193 6 5.985225255 0.2740088 5.711216 23.98523 0.0003179 17965.57964 6 7.980391879 0.3030669 7.677325 25.98039 0.00043847 17509.24085 6 9.995384873 0.4874052 9.50798 27.99538 0.00054234 17531.41546 4 1.984990143 0.1770359 1.807954 13.98499 0.00013955 12955.56947 4 3.977135812 0.2987847 3.678351 15.97714 0.00028523 12896.20368 4 6.020817022 0.3135915 5.707226 18.02082 0.00043527 13111.7819 4 8.037308599 0.3752908 7.662018 20.03731 0.00056207 13631.8429
10 4 9.983038535 0.645514 9.337525 21.98304 0.00065956 14157.279111 2 2.015094666 0.1795367 1.835558 8.015095 0.00020992 8744.2146112 2 3.998142818 0.3744239 3.623719 9.998143 0.00038977 9297.0623613 2 6.004622994 0.4496965 5.554927 12.00462 0.00055703 9972.3949314 2 8.045032484 0.5303618 7.514671 14.04503 0.00074411 10098.881215 2 10.1031551 0.7334381 9.369717 16.10316 0.00092884 10087.587
RESILIENT MODULUS TEST RESULTSSOILS LABORATORY, FAMU-FSU COLLEGE OF ENGINEERING

175
RESILIENT MODULUS VS. BULK STRESS
y = 2357.7x0.5944
R2 = 0.9453
1000
10000
100000
1 10 100
BULK STRESS, psi
RES
ILIE
NT
MO
DU
LUS,
psi
Figure D.111 Resilient Modulus vs. Bulk Stress for Spring Cemetery at Optimum Condition (Sample #SC001F1)
RESILIENT MODULUS VS. CONFINING STRESS
y = 6446.9x0.5554
R2 = 0.9613
1000
10000
100000
1 10
CONFINING STRESS, psi
RES
ILIE
NT
MO
DU
LUS,
psi
Figure D.112 Resilient Modulus vs. Confining Stress for Spring Cemetery at Optimum Condition (Sample #SC001F1)

176
D.10 BRANCH A-2-4, 23% SOIL
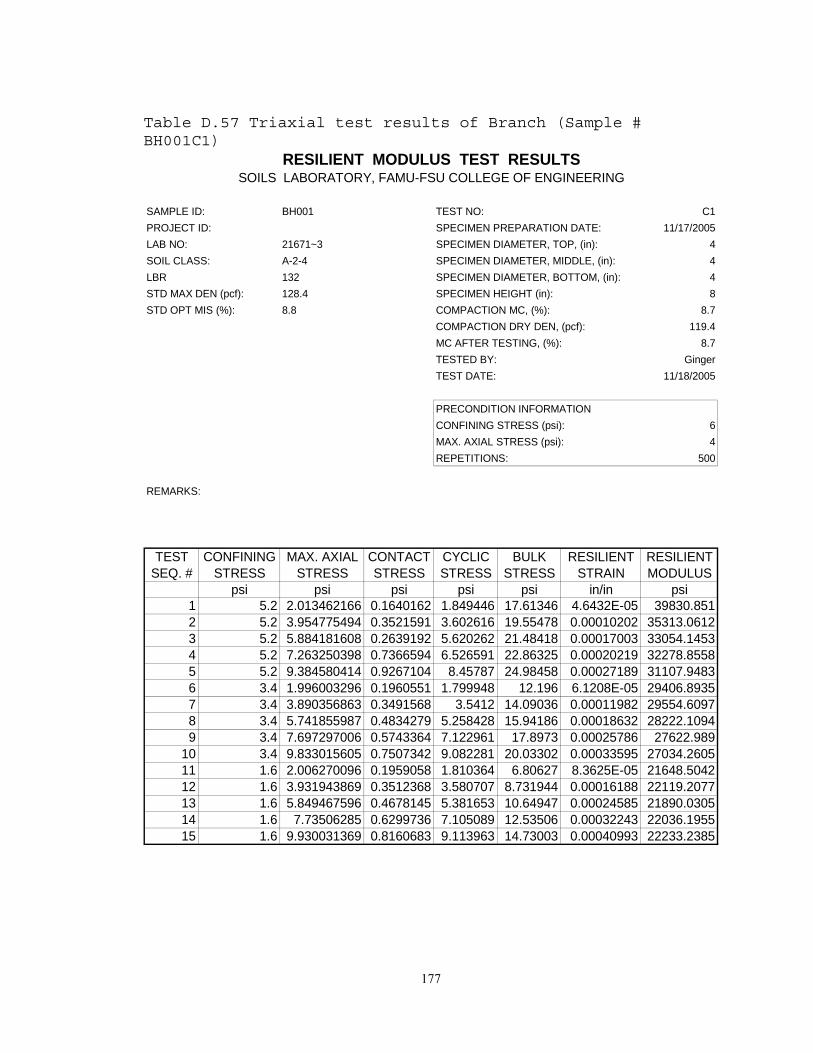
177
Table D.57 Triaxial test results of Branch (Sample # BH001C1)
SAMPLE ID: BH001 TEST NO: C1PROJECT ID: SPECIMEN PREPARATION DATE: 11/17/2005LAB NO: 21671~3 SPECIMEN DIAMETER, TOP, (in): 4SOIL CLASS: A-2-4 SPECIMEN DIAMETER, MIDDLE, (in): 4LBR 132 SPECIMEN DIAMETER, BOTTOM, (in): 4STD MAX DEN (pcf): 128.4 SPECIMEN HEIGHT (in): 8STD OPT MIS (%): 8.8 COMPACTION MC, (%): 8.7
COMPACTION DRY DEN, (pcf): 119.4MC AFTER TESTING, (%): 8.7TESTED BY: GingerTEST DATE: 11/18/2005
PRECONDITION INFORMATIONCONFINING STRESS (psi): 6MAX. AXIAL STRESS (psi): 4REPETITIONS: 500
REMARKS:
TEST SEQ. #
CONFINING STRESS
MAX. AXIAL STRESS
CONTACT STRESS
CYCLIC STRESS
BULK STRESS
RESILIENT STRAIN
RESILIENT MODULUS
psi psi psi psi psi in/in psi1 5.2 2.013462166 0.1640162 1.849446 17.61346 4.6432E-05 39830.8512 5.2 3.954775494 0.3521591 3.602616 19.55478 0.00010202 35313.06123 5.2 5.884181608 0.2639192 5.620262 21.48418 0.00017003 33054.14534 5.2 7.263250398 0.7366594 6.526591 22.86325 0.00020219 32278.85585 5.2 9.384580414 0.9267104 8.45787 24.98458 0.00027189 31107.94836 3.4 1.996003296 0.1960551 1.799948 12.196 6.1208E-05 29406.89357 3.4 3.890356863 0.3491568 3.5412 14.09036 0.00011982 29554.60978 3.4 5.741855987 0.4834279 5.258428 15.94186 0.00018632 28222.10949 3.4 7.697297006 0.5743364 7.122961 17.8973 0.00025786 27622.989
10 3.4 9.833015605 0.7507342 9.082281 20.03302 0.00033595 27034.260511 1.6 2.006270096 0.1959058 1.810364 6.80627 8.3625E-05 21648.504212 1.6 3.931943869 0.3512368 3.580707 8.731944 0.00016188 22119.207713 1.6 5.849467596 0.4678145 5.381653 10.64947 0.00024585 21890.030514 1.6 7.73506285 0.6299736 7.105089 12.53506 0.00032243 22036.195515 1.6 9.930031369 0.8160683 9.113963 14.73003 0.00040993 22233.2385
RESILIENT MODULUS TEST RESULTSSOILS LABORATORY, FAMU-FSU COLLEGE OF ENGINEERING
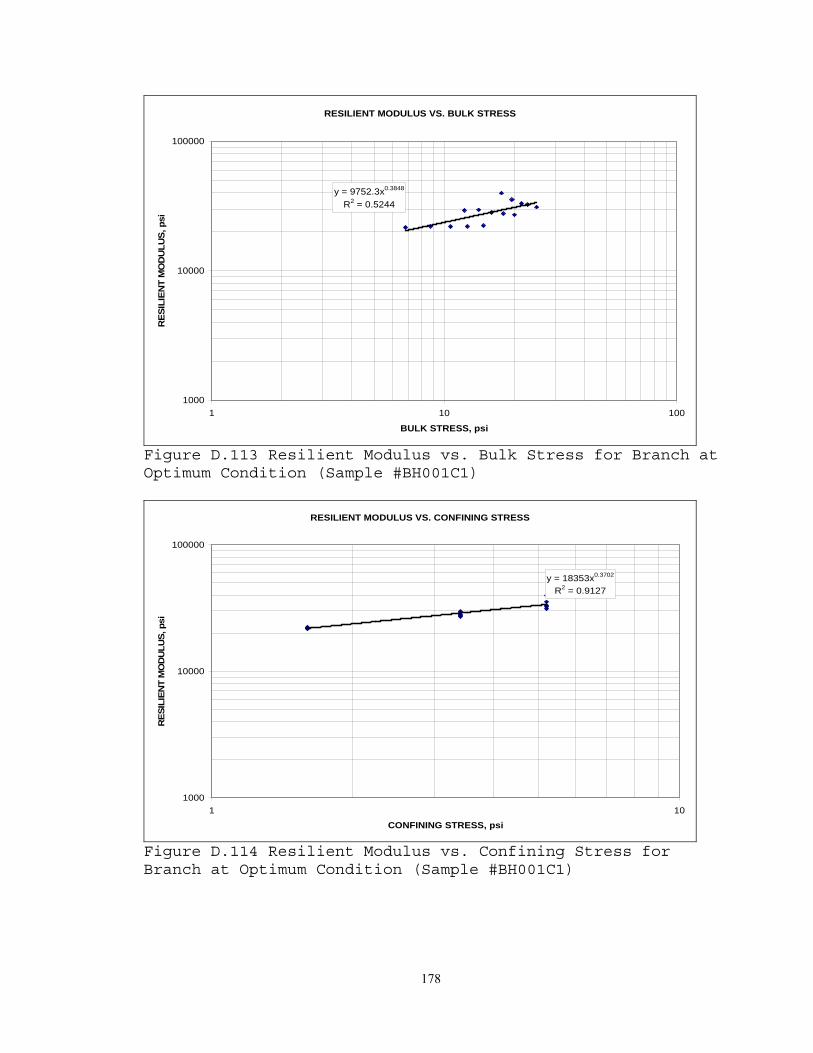
178
RESILIENT MODULUS VS. BULK STRESS
y = 9752.3x0.3848
R2 = 0.5244
1000
10000
100000
1 10 100
BULK STRESS, psi
RES
ILIE
NT
MO
DU
LUS,
psi
Figure D.113 Resilient Modulus vs. Bulk Stress for Branch at Optimum Condition (Sample #BH001C1)
RESILIENT MODULUS VS. CONFINING STRESS
y = 18353x0.3702
R2 = 0.9127
1000
10000
100000
1 10
CONFINING STRESS, psi
RES
ILIE
NT
MO
DU
LUS,
psi
Figure D.114 Resilient Modulus vs. Confining Stress for Branch at Optimum Condition (Sample #BH001C1)

179
Table D.58 Triaxial test results of Branch (Sample # BH001D2)
SAMPLE ID: BH001 TEST NO: D2PROJECT ID: SPECIMEN PREPARATION DATE: 11/17/2005LAB NO: 21671~3 SPECIMEN DIAMETER, TOP, (in): 4SOIL CLASS: A-2-4 SPECIMEN DIAMETER, MIDDLE, (in): 4LBR 132 SPECIMEN DIAMETER, BOTTOM, (in): 4STD MAX DEN (pcf): 128.4 SPECIMEN HEIGHT (in): 8STD OPT MIS (%): 8.8 COMPACTION MC, (%): 8.7
COMPACTION DRY DEN, (pcf): 119.8MC AFTER TESTING, (%): 8.3TESTED BY: GingerTEST DATE: 11/18/2005
PRECONDITION INFORMATIONCONFINING STRESS (psi): 6MAX. AXIAL STRESS (psi): 4REPETITIONS: 500
REMARKS:
TEST SEQ. #
CONFINING STRESS
MAX. AXIAL STRESS
CONTACT STRESS
CYCLIC STRESS
BULK STRESS
RESILIENT STRAIN
RESILIENT MODULUS
psi psi psi psi psi in/in psi1 5.2 1.991279204 0.1509486 1.840331 17.59128 3.468E-05 53065.66842 5.2 3.982617452 0.3281514 3.654466 19.58262 7.5239E-05 48571.75633 5.2 5.860455016 0.4273944 5.433061 21.46046 0.00011756 46216.29534 5.2 7.582602404 0.6720354 6.910567 23.1826 0.00015475 44655.10345 5.2 9.669064968 0.8855799 8.783485 25.26906 0.0002027 43332.89176 3.4 2.008666338 0.1675419 1.841124 12.20867 4.8872E-05 37672.47327 3.4 3.907129889 0.3500563 3.557074 14.10713 9.5977E-05 37061.58418 3.4 5.710358455 0.509745 5.200613 15.91036 0.0001404 37042.32989 3.4 7.731697532 0.6418109 7.089887 17.9317 0.00019221 36886.9643
10 3.4 9.890901274 0.8628568 9.028045 20.0909 0.00024779 36434.183411 1.6 1.991016943 0.1863091 1.804708 6.791017 8.236E-05 21912.331412 1.6 3.891407436 0.3669582 3.524449 8.691407 0.0001471 23959.87213 1.6 5.74622172 0.5153605 5.230861 10.54622 0.00020235 25850.226714 1.6 7.745380398 0.6286578 7.116723 12.54538 0.00026617 26737.495715 1.6 10.0941914 0.8478906 9.246301 14.89419 0.00033209 27843.1542
RESILIENT MODULUS TEST RESULTSSOILS LABORATORY, FAMU-FSU COLLEGE OF ENGINEERING

180
RESILIENT MODULUS VS. BULK STRESS
y = 6444.4x0.6256
R2 = 0.7156
1000
10000
100000
1 10 100
BULK STRESS, psi
RES
ILIE
NT
MO
DU
LUS,
psi
Figure D.115 Resilient Modulus vs. Bulk Stress for Branch at Optimum Condition (Sample #BH001D2)
RESILIENT MODULUS VS. CONFINING STRESS
y = 19569x0.5285
R2 = 0.9407
1000
10000
100000
1 10
CONFINING STRESS, psi
RES
ILIE
NT
MO
DU
LUS,
psi
Figure D.116 Resilient Modulus vs. Confining Stress for Branch at Optimum Condition (Sample #BH001D2)

181
Table D.59 Triaxial test results of Branch (Sample # BH001E1)
SAMPLE ID: BH001 TEST NO: E1PROJECT ID: SPECIMEN PREPARATION DATE: 12/07/2005LAB NO: 21671~3 SPECIMEN DIAMETER, TOP, (in): 4SOIL CLASS: A-2-4 SPECIMEN DIAMETER, MIDDLE, (in): 4LBR 132 SPECIMEN DIAMETER, BOTTOM, (in): 4STD MAX DEN (pcf): 128.4 SPECIMEN HEIGHT (in): 8STD OPT MIS (%): 8.8 COMPACTION MC, (%): 8.9
COMPACTION DRY DEN, (pcf): 121.87MC AFTER TESTING, (%): 8.8TESTED BY: GingerTEST DATE: 12/07/2005
PRECONDITION INFORMATIONCONFINING STRESS (psi): 6MAX. AXIAL STRESS (psi): 4REPETITIONS: 500
REMARKS:
TEST SEQ. #
CONFINING STRESS
MAX. AXIAL STRESS
CONTACT STRESS
CYCLIC STRESS
BULK STRESS
RESILIENT STRAIN
RESILIENT MODULUS
psi psi psi psi psi in/in psi1 6 2.075271465 0.1659004 1.909371 20.07527 4.6277E-05 41259.16552 6 3.951580016 0.374809 3.576771 21.95158 9.2449E-05 38688.96943 6 5.871104459 0.5458617 5.325243 23.8711 0.00014694 36241.0574 6 7.793001433 0.6450726 7.147929 25.793 0.00020353 35119.3925 6 9.829745541 0.7980615 9.031684 27.82975 0.00026944 33519.67626 4 2.021647962 0.1824516 1.839196 14.02165 5.4242E-05 33906.92427 4 3.942120366 0.341583 3.600537 15.94212 0.00011159 32265.84328 4 5.849660637 0.4787896 5.370871 17.84966 0.00017406 30856.50119 4 7.82546742 0.6638 7.161667 19.82547 0.00023896 29969.6344
10 4 9.85358121 0.7844058 9.069175 21.85358 0.00030496 29738.718811 2 2.02394242 0.1670946 1.856848 8.023942 6.8599E-05 27068.098412 2 3.947343089 0.3465916 3.600751 9.947343 0.00014165 25420.463613 2 5.824761131 0.4833436 5.341417 11.82476 0.00021545 24791.423214 2 7.782073885 0.6080799 7.173994 13.78207 0.0002927 24509.528115 2 9.825946656 0.7840605 9.041886 15.82595 0.00036701 24636.5453
31 blows per layer to achieve the max dry density
RESILIENT MODULUS TEST RESULTSSOILS LABORATORY, FAMU-FSU COLLEGE OF ENGINEERING

182
RESILIENT MODULUS VS. BULK STRESS
y = 12551x0.3171
R2 = 0.4444
1000
10000
100000
1 10 100
BULK STRESS, psi
RES
ILIE
NT
MO
DU
LUS,
psi
Figure D.117 Resilient Modulus vs. Bulk Stress for Branch at Optimum Condition (Sample #BH001E1)
RESILIENT MODULUS VS. CONFINING STRESS
y = 19846x0.3401
R2 = 0.883
1000
10000
100000
1 10
CONFINING STRESS, psi
RES
ILIE
NT
MO
DU
LUS,
psi
Figure D.118 Resilient Modulus vs. Confining Stress for Branch at Optimum Condition (Sample #BH001E1)

183
Table D.60 Triaxial test results of Branch (Sample # BH001F1)
SAMPLE ID: BH001 TEST NO: F1PROJECT ID: SPECIMEN PREPARATION DATE: 12/07/2005LAB NO: 21671~3 SPECIMEN DIAMETER, TOP, (in): 4SOIL CLASS: A-2-4 SPECIMEN DIAMETER, MIDDLE, (in): 4LBR 132 SPECIMEN DIAMETER, BOTTOM, (in): 4STD MAX DEN (pcf): 128.4 SPECIMEN HEIGHT (in): 8STD OPT MIS (%): 8.8 COMPACTION MC, (%): 8.9
COMPACTION DRY DEN, (pcf): 120.4MC AFTER TESTING, (%):TESTED BY: GingerTEST DATE: 12/07/2005
PRECONDITION INFORMATIONCONFINING STRESS (psi): 6MAX. AXIAL STRESS (psi): 4REPETITIONS: 500
REMARKS:
TEST SEQ. #
CONFINING STRESS
MAX. AXIAL STRESS
CONTACT STRESS
CYCLIC STRESS
BULK STRESS
RESILIENT STRAIN
RESILIENT MODULUS
psi psi psi psi psi in/in psi1 6 2.027237803 0.164337 1.862901 20.02724 4.173E-05 44641.76392 6 3.862848838 0.3480794 3.514769 21.86285 8.3712E-05 41986.69813 6 5.872005303 0.4772919 5.394713 23.87201 0.0001356 39783.54514 6 7.963938965 0.6438592 7.32008 25.96394 0.00019631 37288.46415 6 10.03605955 0.7344793 9.30158 28.03606 0.00026071 35677.81236 4 2.024563105 0.1678883 1.856675 14.02456 5.0377E-05 36855.69727 4 3.966306752 0.3210212 3.645286 15.96631 0.00010546 34566.39438 4 5.821077022 0.4509885 5.370088 17.82108 0.00016625 32301.59999 4 7.900737484 0.5805647 7.320173 19.90074 0.00023031 31783.6192
10 4 9.876334076 0.7841979 9.092136 21.87633 0.00029094 31251.327311 2 2.023696465 0.1777503 1.845946 8.023696 6.8679E-05 26877.88412 2 3.926261354 0.3501878 3.576074 9.926261 0.00013786 25939.1413 2 5.771383057 0.4836669 5.287716 11.77138 0.00020218 26153.459114 2 7.78313 0.5945203 7.18861 13.78313 0.00027918 25749.163815 2 9.945631529 0.7886593 9.156972 15.94563 0.00035449 25831.0609
RESILIENT MODULUS TEST RESULTSSOILS LABORATORY, FAMU-FSU COLLEGE OF ENGINEERING

184
RESILIENT MODULUS VS. BULK STRESS
y = 11636x0.3637
R2 = 0.4793
1000
10000
100000
1 10 100
BULK STRESS, psi
RES
ILIE
NT
MO
DU
LUS,
psi
Figure D.119 Resilient Modulus vs. Bulk Stress for Branch at Optimum Condition (Sample #BH001F1)
RESILIENT MODULUS VS. CONFINING STRESS
y = 19966x0.3792
R2 = 0.8918
1000
10000
100000
1 10
CONFINING STRESS, psi
RES
ILIE
NT
MO
DU
LUS,
psi
Figure D.120 Resilient Modulus vs. Confining Stress for Branch at Optimum Condition (Sample #BH001F1)
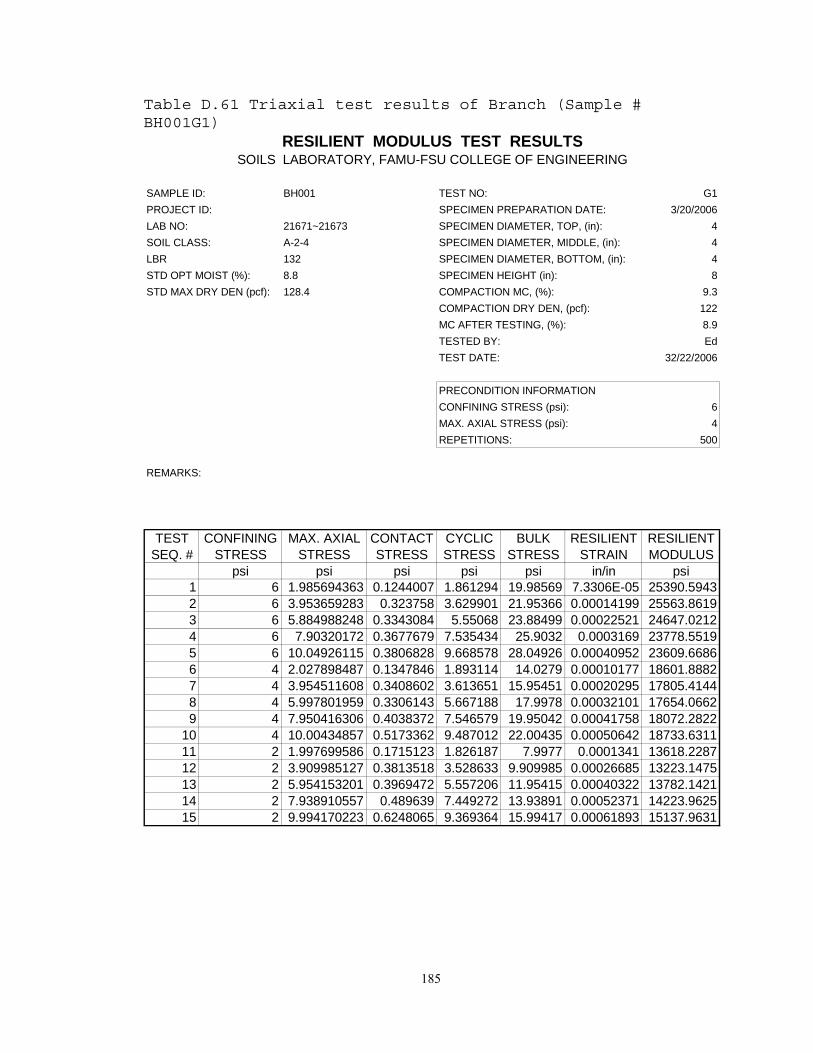
185
Table D.61 Triaxial test results of Branch (Sample # BH001G1)
SAMPLE ID: BH001 TEST NO: G1PROJECT ID: SPECIMEN PREPARATION DATE: 3/20/2006LAB NO: 21671~21673 SPECIMEN DIAMETER, TOP, (in): 4SOIL CLASS: A-2-4 SPECIMEN DIAMETER, MIDDLE, (in): 4LBR 132 SPECIMEN DIAMETER, BOTTOM, (in): 4STD OPT MOIST (%): 8.8 SPECIMEN HEIGHT (in): 8STD MAX DRY DEN (pcf): 128.4 COMPACTION MC, (%): 9.3
COMPACTION DRY DEN, (pcf): 122MC AFTER TESTING, (%): 8.9TESTED BY: EdTEST DATE: 32/22/2006
PRECONDITION INFORMATIONCONFINING STRESS (psi): 6MAX. AXIAL STRESS (psi): 4REPETITIONS: 500
REMARKS:
TEST SEQ. #
CONFINING STRESS
MAX. AXIAL STRESS
CONTACT STRESS
CYCLIC STRESS
BULK STRESS
RESILIENT STRAIN
RESILIENT MODULUS
psi psi psi psi psi in/in psi1 6 1.985694363 0.1244007 1.861294 19.98569 7.3306E-05 25390.59432 6 3.953659283 0.323758 3.629901 21.95366 0.00014199 25563.86193 6 5.884988248 0.3343084 5.55068 23.88499 0.00022521 24647.02124 6 7.90320172 0.3677679 7.535434 25.9032 0.0003169 23778.55195 6 10.04926115 0.3806828 9.668578 28.04926 0.00040952 23609.66866 4 2.027898487 0.1347846 1.893114 14.0279 0.00010177 18601.88827 4 3.954511608 0.3408602 3.613651 15.95451 0.00020295 17805.41448 4 5.997801959 0.3306143 5.667188 17.9978 0.00032101 17654.06629 4 7.950416306 0.4038372 7.546579 19.95042 0.00041758 18072.2822
10 4 10.00434857 0.5173362 9.487012 22.00435 0.00050642 18733.631111 2 1.997699586 0.1715123 1.826187 7.9977 0.0001341 13618.228712 2 3.909985127 0.3813518 3.528633 9.909985 0.00026685 13223.147513 2 5.954153201 0.3969472 5.557206 11.95415 0.00040322 13782.142114 2 7.938910557 0.489639 7.449272 13.93891 0.00052371 14223.962515 2 9.994170223 0.6248065 9.369364 15.99417 0.00061893 15137.9631
RESILIENT MODULUS TEST RESULTSSOILS LABORATORY, FAMU-FSU COLLEGE OF ENGINEERING
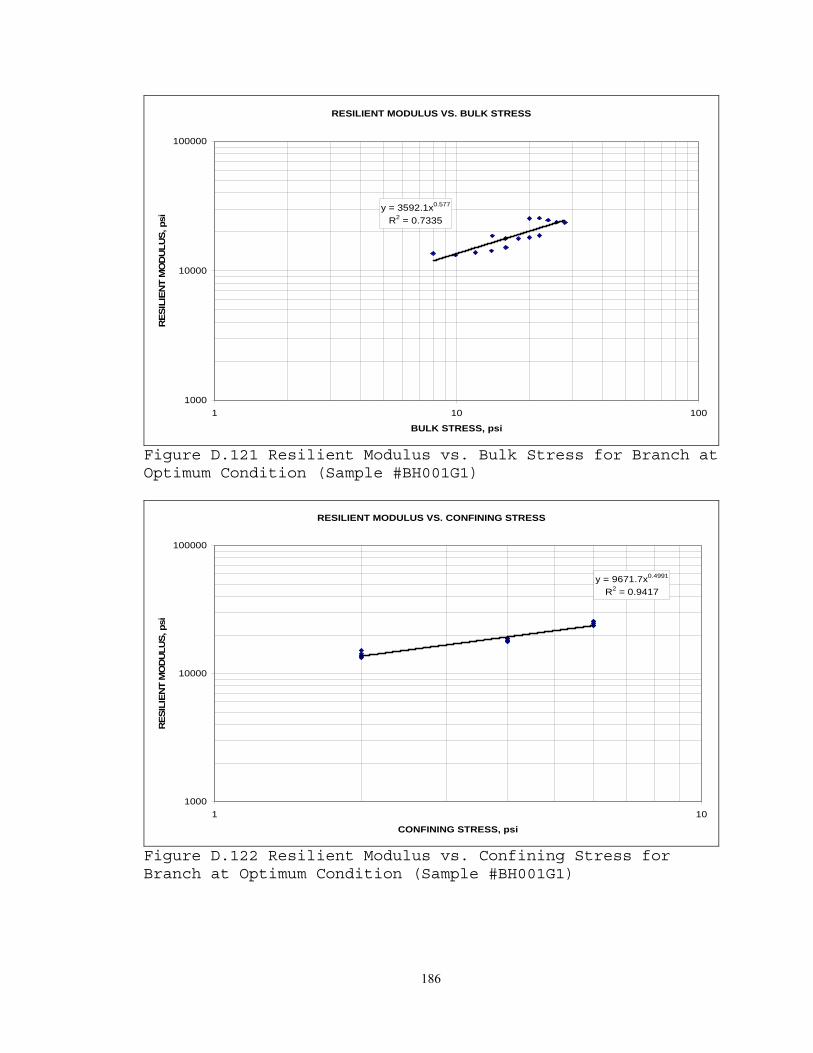
186
RESILIENT MODULUS VS. BULK STRESS
y = 3592.1x0.577
R2 = 0.7335
1000
10000
100000
1 10 100
BULK STRESS, psi
RES
ILIE
NT
MO
DU
LUS,
psi
Figure D.121 Resilient Modulus vs. Bulk Stress for Branch at Optimum Condition (Sample #BH001G1)
RESILIENT MODULUS VS. CONFINING STRESS
y = 9671.7x0.4991
R2 = 0.9417
1000
10000
100000
1 10
CONFINING STRESS, psi
RES
ILIE
NT
MO
DU
LUS,
psi
Figure D.122 Resilient Modulus vs. Confining Stress for Branch at Optimum Condition (Sample #BH001G1)

187
Table D.62 Triaxial test results of Branch (Sample # BH001H1)
SAMPLE ID: BH001 TEST NO: H1PROJECT ID: SPECIMEN PREPARATION DATE: 3/20/2006LAB NO: 21671~21673 SPECIMEN DIAMETER, TOP, (in): 4SOIL CLASS: A-2-4 SPECIMEN DIAMETER, MIDDLE, (in): 4LBR 132 SPECIMEN DIAMETER, BOTTOM, (in): 4STD OPT MOIST (%): 8.8 SPECIMEN HEIGHT (in): 8STD MAX DRY DEN (pcf): 128.4 COMPACTION MC, (%): 9.3
COMPACTION DRY DEN, (pcf): 124.7MC AFTER TESTING, (%): 8.2TESTED BY: EdTEST DATE: 3/22/2006
PRECONDITION INFORMATIONCONFINING STRESS (psi): 6MAX. AXIAL STRESS (psi): 4REPETITIONS: 500
REMARKS:
TEST SEQ. #
CONFINING STRESS
MAX. AXIAL STRESS
CONTACT STRESS
CYCLIC STRESS
BULK STRESS
RESILIENT STRAIN
RESILIENT MODULUS
psi psi psi psi psi in/in psi1 6 2.002379092 0.1047868 1.897592 20.00238 6.1046E-05 31084.66112 6 3.876477197 0.31716 3.559317 21.87648 0.00012939 27507.39153 6 5.923512436 0.3419112 5.581601 23.92351 0.00020782 26857.7754 6 7.850061035 0.4097213 7.44034 25.85006 0.00028012 26561.64155 6 9.859067994 0.5508922 9.308176 27.85907 0.00035023 26577.51356 4 1.995436258 0.1739502 1.821486 13.99544 7.4562E-05 24428.9997 4 3.960514061 0.3076244 3.65289 15.96051 0.00015971 22872.66388 4 5.979230717 0.3004178 5.678813 17.97923 0.00025996 21844.68019 4 7.919578169 0.2981789 7.621399 19.91958 0.00035308 21585.3038
10 4 9.990978662 0.4064441 9.584535 21.99098 0.00043671 21946.924911 2 1.987590366 0.1665322 1.821058 7.98759 0.00011033 16504.894112 2 3.984161194 0.3089201 3.675241 9.984161 0.00022503 16331.993313 2 6.013697373 0.2585161 5.755181 12.0137 0.00035829 16062.908914 2 8.027025637 0.2855004 7.741525 14.02703 0.00047702 16228.907415 2 9.972047611 0.6147813 9.357266 15.97205 0.00055721 16793.0994
RESILIENT MODULUS TEST RESULTSSOILS LABORATORY, FAMU-FSU COLLEGE OF ENGINEERING

188
RESILIENT MODULUS VS. BULK STRESS
y = 5283.8x0.4985
R2 = 0.6085
1000
10000
100000
1 10 100
BULK STRESS, psi
RES
ILIE
NT
MO
DU
LUS,
psi
Figure D.123 Resilient Modulus vs. Bulk Stress for Branch at Optimum Condition (Sample #BH001H1)
RESILIENT MODULUS VS. CONFINING STRESS
y = 11750x0.475
R2 = 0.9591
1000
10000
100000
1 10
CONFINING STRESS, psi
RES
ILIE
NT
MO
DU
LUS,
psi
Figure D.124 Resilient Modulus vs. Confining Stress for Branch at Optimum Condition (Sample #BH001H1)

189
D.11 IRON BRIDGE A-2-6, 31% SOIL

190
Table D.63 Triaxial test results of Iron Bridge (Sample # IB001C1)
SAMPLE ID: IB001 TEST NO: C1PROJECT ID: SPECIMEN PREPARATION DATE: 11/20/2005LAB NO: 21668~70 SPECIMEN DIAMETER, TOP, (in): 4SOIL CLASS: A-2-6 SPECIMEN DIAMETER, MIDDLE, (in): 4LBR 127 SPECIMEN DIAMETER, BOTTOM, (in): 4STD MAX DEN (pcf): 123.3 SPECIMEN HEIGHT (in): 8STD OPT MIS (%): 10.3 COMPACTION MC, (%): 10.3
COMPACTION DRY DEN, (pcf): 121.4MC AFTER TESTING, (%): 9.3TESTED BY: GingerTEST DATE: 11/22/2005
PRECONDITION INFORMATIONCONFINING STRESS (psi): 6MAX. AXIAL STRESS (psi): 4REPETITIONS: 500
REMARKS:
TEST SEQ. #
CONFINING STRESS
MAX. AXIAL STRESS
CONTACT STRESS
CYCLIC STRESS
BULK STRESS
RESILIENT STRAIN
RESILIENT MODULUS
psi psi psi psi psi in/in psi1 5.2 2.04520086 0.1472696 1.897931 17.6452 0.0001508 12585.4172 5.2 3.985863535 0.3555535 3.63031 19.58586 0.00029766 12195.97933 5.2 5.914285016 0.5410702 5.373215 21.51429 0.00046627 11523.72294 5.2 7.898081768 0.6922141 7.205868 23.49808 0.00059634 12083.42065 5.2 9.922165127 0.8613314 9.060834 25.52217 0.00070835 12791.4466 3.4 2.037418089 0.1656778 1.87174 12.23742 0.00023217 8061.800227 3.4 4.042256417 0.372462 3.669794 14.24226 0.00038995 9410.926518 3.4 5.976768901 0.5745343 5.402235 16.17677 0.00050725 10650.0489 3.4 7.92207 0.7359321 7.186138 18.12207 0.000608 11819.2115
10 3.4 9.915204777 0.8917315 9.023473 20.1152 0.00073454 12284.533311 1.6 2.043383774 0.1932085 1.850175 6.843384 0.00024359 7595.4772812 1.6 4.018622118 0.3801575 3.638465 8.818622 0.00040287 9031.2546713 1.6 5.957823583 0.5795718 5.378252 10.75782 0.00053755 10005.029214 1.6 7.892085271 0.7719836 7.120102 12.69209 0.00064403 11055.600815 1.6 9.872484554 0.9537947 8.91869 14.67248 0.00075293 11845.2793
RESILIENT MODULUS TEST RESULTSSOILS LABORATORY, FAMU-FSU COLLEGE OF ENGINEERING

191
RESILIENT MODULUS VS. BULK STRESS
y = 3897.9x0.3678
R2 = 0.7348
1000
10000
100000
1 10 100
BULK STRESS, psi
RES
ILIE
NT
MO
DU
LUS,
psi
Figure D.125 Resilient Modulus vs. Bulk Stress for Iron Bridge at Optimum Condition (Sample #IB001C1)
RESILIENT MODULUS VS. CONFINING STRESS
y = 8829.6x0.1751
R2 = 0.285
1000
10000
100000
1 10
CONFINING STRESS, psi
RES
ILIE
NT
MO
DU
LUS,
psi
Figure D.126 Resilient Modulus vs. Confining Stress for Iron Bridge at Optimum Condition (Sample #IB001C1)

192
Table D.64 Triaxial test results of Iron Bridge (Sample # IB001D1)
SAMPLE ID: IB001 TEST NO: D1PROJECT ID: SPECIMEN PREPARATION DATE: 11/21/2005LAB NO: 21668~70 SPECIMEN DIAMETER, TOP, (in): 4SOIL CLASS: A-2-6 SPECIMEN DIAMETER, MIDDLE, (in): 4LBR 127 SPECIMEN DIAMETER, BOTTOM, (in): 4STD MAX DEN (pcf): 123.3 SPECIMEN HEIGHT (in): 8STD OPT MIS (%): 10.3 COMPACTION MC, (%): 10.3
COMPACTION DRY DEN, (pcf): 121.7MC AFTER TESTING, (%): 9.6TESTED BY: GingerTEST DATE: 11/22/2005
PRECONDITION INFORMATIONCONFINING STRESS (psi): 6MAX. AXIAL STRESS (psi): 4REPETITIONS: 500
REMARKS:
TEST SEQ. #
CONFINING STRESS
MAX. AXIAL STRESS
CONTACT STRESS
CYCLIC STRESS
BULK STRESS
RESILIENT STRAIN
RESILIENT MODULUS
psi psi psi psi psi in/in psi1 5.2 2.031681783 0.1656255 1.866056 17.63168 0.0001425 13095.37322 5.2 3.940747436 0.370462 3.570285 19.54075 0.00028281 12624.51513 5.2 5.855494697 0.5756314 5.279863 21.45549 0.00042831 12327.07834 5.2 7.794409825 0.768237 7.026173 23.39441 0.0005923 11862.52375 5.2 9.910198885 0.9287675 8.981431 25.5102 0.00071346 12588.6096 3.4 2.000613583 0.1832253 1.817388 12.20061 0.00023619 7694.520417 3.4 3.994871736 0.3816206 3.613251 14.19487 0.00040497 8922.354388 3.4 5.94227043 0.5829105 5.35936 16.14227 0.00052218 10263.36479 3.4 7.922203774 0.7371973 7.185006 18.1222 0.0006174 11637.4609
10 3.4 10.00137086 0.9282225 9.073148 20.20137 0.00074142 12237.474911 1.6 2.002032898 0.1846511 1.817382 6.802033 0.00024921 7292.4452712 1.6 4.036896704 0.3838762 3.653021 8.836897 0.00041673 8765.9418213 1.6 5.955528328 0.5770714 5.378457 10.75553 0.00053512 10050.864814 1.6 7.93875871 0.7390146 7.199744 12.73876 0.00065856 10932.618115 1.6 10.04588344 0.9212691 9.124614 14.84588 0.00079123 11532.2587
RESILIENT MODULUS TEST RESULTSSOILS LABORATORY, FAMU-FSU COLLEGE OF ENGINEERING

193
RESILIENT MODULUS VS. BULK STRESS
y = 3555.2x0.3946
R2 = 0.7027
1000
10000
100000
1 10 100
BULK STRESS, psi
RES
ILIE
NT
MO
DU
LUS,
psi
Figure D.127 Resilient Modulus vs. Bulk Stress for Iron Bridge at Optimum Condition (Sample #IB001D1)
RESILIENT MODULUS VS. CONFINING STRESS
y = 8452.1x0.2051
R2 = 0.3062
1000
10000
100000
1 10
CONFINING STRESS, psi
RES
ILIE
NT
MO
DU
LUS,
psi
Figure D.128 Resilient Modulus vs. Confining Stress for Iron Bridge at Optimum Condition (Sample #IB001D1)

194
Table D.65 Triaxial test results of Iron Bridge (Sample # IB001E1)
SAMPLE ID: IB001 TEST NO: E1PROJECT ID: SPECIMEN PREPARATION DATE: 02/06/2006LAB NO: 21668~21670 SPECIMEN DIAMETER, TOP, (in): 4SOIL CLASS: A-2-6 SPECIMEN DIAMETER, MIDDLE, (in): 4LBR 127 SPECIMEN DIAMETER, BOTTOM, (in): 4STD OPT MOIST (%): 10.3 SPECIMEN HEIGHT (in): 8STD MAX DRY DEN (pcf): 123.3 COMPACTION MC, (%): 10.4
COMPACTION DRY DEN, (pcf): 124.1MC AFTER TESTING, (%): 9.7TESTED BY: EdTEST DATE: 02/07/2006
PRECONDITION INFORMATIONCONFINING STRESS (psi): 6MAX. AXIAL STRESS (psi): 4REPETITIONS: 500
REMARKS:
TEST SEQ. #
CONFINING STRESS
MAX. AXIAL STRESS
CONTACT STRESS
CYCLIC STRESS
BULK STRESS
RESILIENT STRAIN
RESILIENT MODULUS
psi psi psi psi psi in/in psi1 6 2.003843312 0.1697418 1.834102 20.00384 0.00014728 12453.32452 6 3.990847707 0.3762782 3.61457 21.99085 0.00029338 12320.49013 6 5.98976258 0.539662 5.450101 23.98976 0.00044645 12207.62664 6 8.188478185 0.430405 7.758073 26.18848 0.00064713 11988.44095 6 10.11303455 0.7174875 9.395547 28.11303 0.00072127 13026.32996 4 2.003259713 0.1794318 1.823828 14.00326 0.00021479 8491.29087 4 4.038238949 0.3737873 3.664452 16.03824 0.00037474 9778.55928 4 6.059404252 0.4831335 5.576271 18.0594 0.00049884 11178.36469 4 7.987192834 0.6282229 7.35897 19.98719 0.00060674 12128.6666
10 4 10.1092086 0.7690862 9.340122 22.10921 0.00072866 12818.237411 2 2.036021146 0.1737725 1.862249 8.036021 0.00023846 7809.3820312 2 3.994583073 0.3775786 3.617005 9.994583 0.00040404 8952.0258613 2 5.990687213 0.5799719 5.410715 11.99069 0.00052823 10243.114714 2 7.975225318 0.6921262 7.283099 13.97523 0.00062109 11726.259415 2 10.02827102 0.9382194 9.090052 16.02827 0.00072068 12613.2358
RESILIENT MODULUS TEST RESULTSSOILS LABORATORY, FAMU-FSU COLLEGE OF ENGINEERING

195
RESILIENT MODULUS VS. BULK STRESS
y = 3779.6x0.3762
R2 = 0.6927
1000
10000
100000
1 10 100
BULK STRESS, psi
RES
ILIE
NT
MO
DU
LUS,
psi
Figure D.129 Resilient Modulus vs. Bulk Stress for Iron Bridge at Optimum Condition (Sample #IB001E1)
RESILIENT MODULUS VS. CONFINING STRESS
y = 8820.5x0.1746
R2 = 0.2499
1000
10000
100000
1 10
CONFINING STRESS, psi
RES
ILIE
NT
MO
DU
LUS,
psi
Figure D.130 Resilient Modulus vs. Confining Stress for Iron Bridge at Optimum Condition (Sample #IB001E1)

196
Table D.66 Triaxial test results of Iron Bridge (Sample # IB001F1)
SAMPLE ID: IB001 TEST NO: F1PROJECT ID: SPECIMEN PREPARATION DATE: 02/06/2006LAB NO: 21668~21670 SPECIMEN DIAMETER, TOP, (in): 4SOIL CLASS: A-2-6 SPECIMEN DIAMETER, MIDDLE, (in): 4LBR 127 SPECIMEN DIAMETER, BOTTOM, (in): 4STD OPT MOIST (%): 10.3 SPECIMEN HEIGHT (in): 8STD MAX DRY DEN (pcf): 123.3 COMPACTION MC, (%): 10.4
COMPACTION DRY DEN, (pcf): 123.9MC AFTER TESTING, (%): 10.3TESTED BY: EdTEST DATE: 02/07/2006
PRECONDITION INFORMATIONCONFINING STRESS (psi): 6MAX. AXIAL STRESS (psi): 4REPETITIONS: 500
REMARKS:
TEST SEQ. #
CONFINING STRESS
MAX. AXIAL STRESS
CONTACT STRESS
CYCLIC STRESS
BULK STRESS
RESILIENT STRAIN
RESILIENT MODULUS
psi psi psi psi psi in/in psi1 6 1.997324522 0.1760898 1.821235 19.99732 0.00017154 10616.67052 6 4.009422611 0.3779357 3.631487 22.00942 0.00033486 10844.80583 6 6.025898694 0.5045828 5.521316 24.0259 0.00049616 11128.10674 6 8.107008917 0.5078442 7.599165 26.10701 0.00067124 11321.16465 6 10.04107946 0.8196099 9.22147 28.04108 0.00073639 12522.56276 4 2.031102213 0.1762741 1.854828 14.0311 0.00021454 8645.725797 4 4.032015541 0.3761197 3.655896 16.03202 0.00038398 9521.020798 4 6.009813169 0.5380148 5.471798 18.00981 0.00048953 11177.68269 4 8.021163376 0.6258435 7.39532 20.02116 0.00061741 11977.9674
10 4 9.991923567 0.9005788 9.091345 21.99192 0.00070785 12843.676111 2 2.005395573 0.1840093 1.821386 8.005396 0.00023948 7605.5843412 2 4.026819092 0.3800846 3.646734 10.02682 0.00040834 8930.6734613 2 6.007255876 0.5571191 5.450137 12.00726 0.00051968 10487.473514 2 8.046323726 0.6470476 7.399276 14.04632 0.00065092 11367.34715 2 10.09528758 0.9075859 9.187702 16.09529 0.00039263 23400.3098
Sample is very soft and the MR value doesn't change much
RESILIENT MODULUS TEST RESULTSSOILS LABORATORY, FAMU-FSU COLLEGE OF ENGINEERING

197
RESILIENT MODULUS VS. BULK STRESS
y = 4163.2x0.3269
R2 = 0.6658
1000
10000
100000
1 10 100
BULK STRESS, psi
RES
ILIE
NT
MO
DU
LUS,
psi
Figure D.131 Resilient Modulus vs. Bulk Stress for Iron Bridge at Optimum Condition (Sample #IB001F1)
RESILIENT MODULUS VS. CONFINING STRESS
y = 11344x-0.0159
R2 = 0.0009
1000
10000
100000
1 10
CONFINING STRESS, psi
RES
ILIE
NT
MO
DU
LUS,
psi
Figure D.132 Resilient Modulus vs. Confining Stress for Iron Bridge at Optimum Condition (Sample #IB001F1)

198
APPENDIX E
MOISTURE CHANGE VERSUS TIME IN TEST PIT
199
E.1 LEVY COUNTY A-3, 4% SOIL

200
Levy County Moisture Profile v.s. Elapse of Time (W.T. from -20 in. to +0 in.)
(at Each Elevation above Embankment)
0
2
4
6
8
10
12
14
16
0 5 10 15 20 25 30 35
Elapse of Time, Day
Moi
stur
e C
onte
nt, %
0-6 in.6-12 in.12-18 in.18-24 in.24-30 in.30-36 in.
Figure E.1 Moisture Profile versus Time for Levy County A-3 Soil (W.T. from -20 in. to +0 in. above Embankment)
Levy County Moisture Profile v.s. Elapse of Time (W.T. from 0 in. to +12 in.)
(at Each Elevation above Embankment)
0
2
4
6
8
10
12
14
16
18
0 5 10 15 20 25 30 35 40 45 50
Elapse of Time, Day
Moi
stur
e C
onte
nt, %
0-6 in.6-12 in.12-18 in.18-24 in.24-30 in.30-36 in.
Figure E.2 Moisture Profile versus Time for Levy County A-3 Soil (W.T. from +0 in. to +12 in. above Embankment)

201
Levy County Moisture Profile v.s. Elapse of Time (W.T. from +12 in. to +36 in.)
(at Each Elevation above Embankment)
4
6
8
10
12
14
16
18
0 2 4 6 8 10 12 14
Elapse of Time, Day
Moi
stur
e C
onte
nt, %
0-6 in.6-12 in.12-18 in.18-24 in.24-30 in.30-36 in.
Figure E.3 Moisture Profile versus Time for Levy County A-3 Soil (W.T. from +12 in. to +36 in. above Embankment)
Levy County Moisture Profile v.s. Elapse of Time (W.T. from +36 in. to -20 in.)
(at Each Elevation above Embankment)
0
2
4
6
8
10
12
14
16
18
0 1 2 3 4
Elapse of Time, Day
Moi
stur
e C
onte
nt, %
0-6 in.6-12 in.12-18 in.18-24 in.24-30 in.30-36 in.
Figure E.4 Moisture Profile versus Time for Levy County A-3 Soil (W.T. from +36 in. to -20 in. above Embankment)

202
E.2 SR70 A-3, 8% SOIL

203
SR70 (A-3) Moisture Profile v.s. Elapse of Time (W.T. from -24 in. to -12 in.)
(at Each Elevation above Embankment)
6
7
8
9
10
11
12
0 5 10 15 20 25
Elapse of Time, Day
Moi
stur
e C
onte
nt, %
0-6 in.6-12 in.12-18 in.18-24 in.24-30 in.30-36 in.
Figure E.5 Moisture Profile versus Time for SR70 A-3 Soil (W.T. from -24 in. to -12 in. above Embankment)
SR70 (A-3) Moisture Profile v.s. Elapse of Time (W.T. from -12 in. to 0 in.)
(at Each Elevation above Embankment)
4
6
8
10
12
14
16
18
20
0 5 10 15 20 25 30 35 40 45
Elapse of Time, Day
Moi
stur
e C
onte
nt, %
0-6 in.6-12 in.12-18 in.18-24 in.24-30 in.30-36 in.
Figure E.6 Moisture Profile versus Time for SR70 A-3 Soil (W.T. from -12 in. to +0 in. above Embankment)

204
SR70 (A-3) Moisture Profile v.s. Elapse of Time (W.T. from 0 in. to 12 in.)
(at Each Elevation above Embankment)
0
5
10
15
20
25
0 5 10 15 20 25 30 35 40 45 50
Elapse of Time, Day
Moi
stur
e C
onte
nt, %
0-6 in.6-12 in.12-18 in.18-24 in.24-30 in.30-36 in.
Figure E.7 Moisture Profile versus Time for SR70 A-3 Soil (W.T. from +0 in. to +12 in. above Embankment)
SR70 (A-3) Moisture Profile v.s. Elapse of Time (W.T. from +12 in. to +36 in.)
(at Each Elevation above Embankment)
6
8
10
12
14
16
18
20
22
24
0 5 10 15 20 25 30 35 40
Elapse of Time, Day
Moi
stur
e C
onte
nt, %
0-6 in.6-12 in.12-18 in.18-24 in.24-30 in.30-36 in.
Figure E.8 Moisture Profile versus Time for SR70 A-3 Soil (W.T. from +12 in. to +36 in. above Embankment)

205
SR70 (A-3) Moisture Profile v.s. Elapse of Time (W.T. from +36 in. to -24 in.)
(at Each Elevation above Embankment)
5
10
15
20
25
0 10 20 30 40 50 60 70 80 90
Elapse of Time, Day
Moi
stur
e C
onte
nt, %
0-6 in.6-12 in.12-18 in.18-24 in.24-30 in.30-36 in.
Figure E.9 Moisture Profile versus Time for SR70 A-3 Soil (W.T. from +36 in. to -24 in. above Embankment)
SR70 (A-3) Moisture Profile v.s. Elapse of Time (W.T. from -24 in. to 36 in.)
(at Each Elevation above Embankment)
5
10
15
20
0 2 4 6 8 10 12 14 16
Elapse of Time, Day
Moi
stur
e C
onte
nt, %
0-6 in.6-12 in.12-18 in.18-24 in.24-30 in.30-36 in.
Figure E.10 Moisture Profile versus Time for SR70 A-3 Soil (W.T. from -24 in. to +36 in. above Embankment)

206
SR70 (A-3) Moisture Profile v.s. Elapse of Time (W.T. from +36 in. to +41 in.)
(at Each Elevation above Embankment)
13
14
15
16
17
18
19
20
0 5 10 15 20 25 30
Elapse of Time, Day
Moi
stur
e C
onte
nt, %
0-6 in.6-12 in.12-18 in.18-24 in.24-30 in.30-36 in.
Figure E.11 Moisture Profile versus Time for SR70 A-3 Soil (W.T. from +36 in. to +41 in. above Embankment)

207
E.3 SR70 A-2-4, 14% SOIL
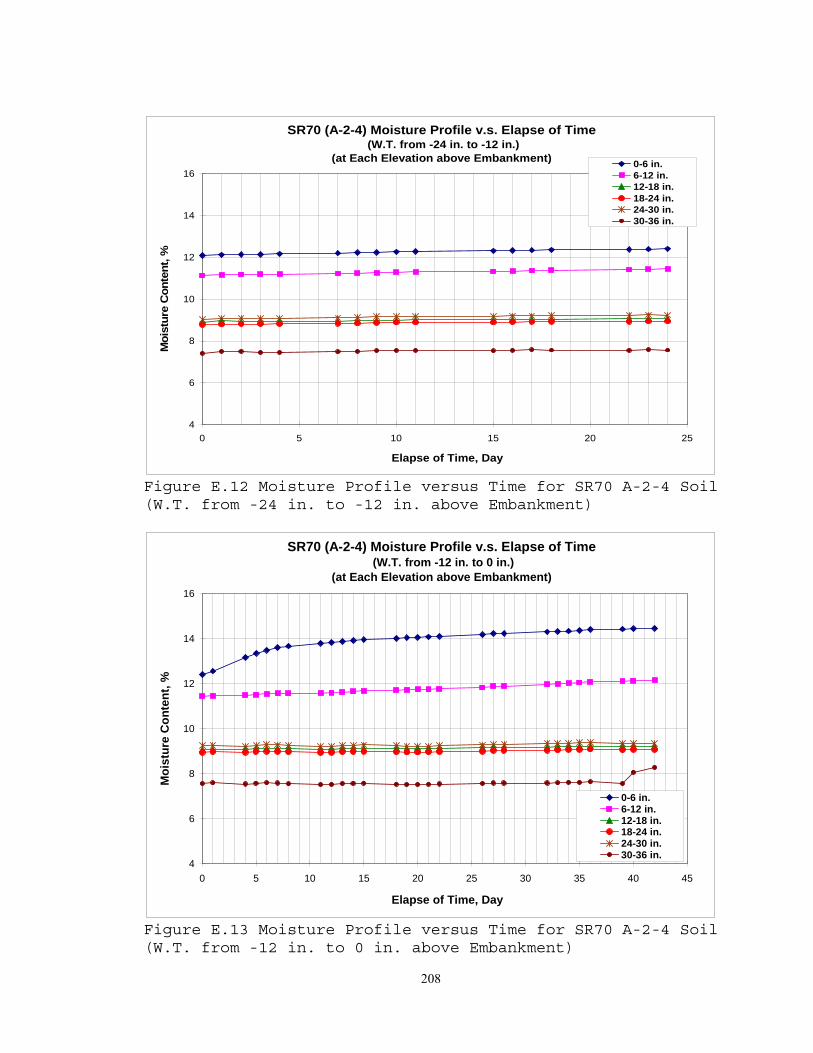
208
SR70 (A-2-4) Moisture Profile v.s. Elapse of Time (W.T. from -24 in. to -12 in.)
(at Each Elevation above Embankment)
4
6
8
10
12
14
16
0 5 10 15 20 25
Elapse of Time, Day
Moi
stur
e C
onte
nt, %
0-6 in.6-12 in.12-18 in.18-24 in.24-30 in.30-36 in.
Figure E.12 Moisture Profile versus Time for SR70 A-2-4 Soil (W.T. from -24 in. to -12 in. above Embankment)
SR70 (A-2-4) Moisture Profile v.s. Elapse of Time (W.T. from -12 in. to 0 in.)
(at Each Elevation above Embankment)
4
6
8
10
12
14
16
0 5 10 15 20 25 30 35 40 45
Elapse of Time, Day
Moi
stur
e C
onte
nt, %
0-6 in.6-12 in.12-18 in.18-24 in.24-30 in.30-36 in.
Figure E.13 Moisture Profile versus Time for SR70 A-2-4 Soil (W.T. from -12 in. to 0 in. above Embankment)

209
SR70 (A-2-4) Moisture Profile v.s. Elapse of Time (W.T. from 0 in. to +12 in.)
(at Each Elevation above Embankment)
4
6
8
10
12
14
16
18
20
0 5 10 15 20 25 30 35 40 45
Elapse of Time, Day
Moi
stur
e C
onte
nt, %
0-6 in.6-12 in.12-18 in.18-24 in.24-30 in.30-36 in.
Figure E.14 Moisture Profile versus Time for SR70 A-2-4 Soil (W.T. from 0 in. to +12 in. above Embankment)
SR70 (A-2-4) Moisture Profile v.s. Elapse of Time (W.T. from +12 in. to +36 in.)
(at Each Elevation above Embankment)
0
5
10
15
20
25
30
35
0 5 10 15 20 25 30 35 40
Elapse of Time, Day
Moi
stur
e C
onte
nt, %
0-6 in.6-12 in.12-18 in.18-24 in.24-30 in.30-36 in.
Figure E.15 Moisture Profile versus Time for SR70 A-2-4 Soil (W.T. from +12 in. to +36 in. above Embankment)

210
SR70 (A-2-4) Moisture Profile v.s. Elapse of Time (W.T. from +36 in. to -24 in.)
(at Each Elevation above Embankment)
5
10
15
20
25
30
35
0 10 20 30 40 50 60 70 80 90
Elapse of Time, Day
Moi
stur
e C
onte
nt, %
0-6 in.6-12 in.12-18 in.18-24 in.24-30 in.30-36 in.
Figure E.16 Moisture Profile versus Time for SR70 A-2-4 Soil (W.T. from +36 in. to -24 in. above Embankment)
SR70 (A-2-4) Moisture Profile v.s. Elapse of Time (W.T. from -24 in. to +36 in.)
(at Each Elevation above Embankment)
5
10
15
20
25
0 2 4 6 8 10 12 14 16
Elapse of Time, Day
Moi
stur
e C
onte
nt, %
0-6 in.6-12 in.12-18 in.18-24 in.24-30 in.30-36 in.
Figure E.17 Moisture Profile versus Time for SR70 A-2-4 Soil (W.T. from -24 in. to +36 in. above Embankment)

211
SR70 (A-2-4) Moisture Profile v.s. Elapse of Time (W.T. from +36 in. to +41 in.)
(at Each Elevation above Embankment)
5
10
15
20
25
0 5 10 15 20 25 30
Elapse of Time, Day
Moi
stur
e C
onte
nt, %
0-6 in.6-12 in.12-18 in.18-24 in.24-30 in.30-36 in.
Figure E.18 Moisture Profile versus Time for SR70 A-2-4 Soil (W.T. from +36 in. to +41 in. above Embankment)

212
E.4 A-2-4, 12% SOIL

213
A-2-4 (12%) Moisture Profile v.s. Elapse of Time (W.T. from -24 in. to 0 in.)
(at Each Elevation above Embankment)
0
2
4
6
8
10
12
14
0 10 20 30 40 50 60
Elapse of Time, Day
Moi
stur
e C
onte
nt, %
0-6 in.6-12 in.12-18 in.18-24 in.24-30 in.30-36 in.
Figure E.19 Moisture Profile versus Time for A-2-4, 12% Soil (W.T. from -24 in. to 0 in. above Embankment)
A-2-4 (12%) Moisture Profile v.s. Elapse of Time (W.T. from 0 in. to +12 in.)
(at Each Elevation above Embankment)
2
4
6
8
10
12
14
0 10 20 30 40 50 60 70 80 90
Elapse of Time, Day
Moi
stur
e C
onte
nt, %
0-6 in.6-12 in.12-18 in.18-24 in.24-30 in.30-36 in.
Figure E.20 Moisture Profile versus Time for A-2-4, 12% Soil (W.T. from 0 in. to +12 in. above Embankment)

214
A-2-4 (12%) Moisture Profile v.s. Elapse of Time (W.T. from +12 in. to +36 in.)
(at Each Elevation above Embankment)
0
2
4
6
8
10
12
14
16
0 1 2 3 4 5 6 7 8 9
Elapse of Time, Day
Moi
stur
e C
onte
nt, %
0-6 in.6-12 in.12-18 in.18-24 in.24-30 in.30-36 in.
Figure E.21 Moisture Profile versus Time for A-2-4, 12% Soil (W.T. from +12 in. to +36 in. above Embankment)
A-2-4 (12%) Moisture Profile v.s. Elapse of Time (W.T. from +36 in. to +41 in.)
(at Each Elevation above Embankment)
6
7
8
9
10
11
12
13
14
15
0 1 2 3 4 5
Elapse of Time, Day
Moi
stur
e C
onte
nt, %
0-6 in.6-12 in.12-18 in.18-24 in.24-30 in.30-36 in.
Figure E.22 Moisture Profile versus Time for A-2-4, 12% Soil (W.T. from +36 in. to +41 in. above Embankment)

215
A-2-4 (12%) Moisture Profile v.s. Elapse of Time (W.T. from +41 in. to +30 in.)
(at Each Elevation above Embankment)
6
7
8
9
10
11
12
13
14
15
0 1 2 3 4 5 6 7
Elapse of Time, Day
Moi
stur
e C
onte
nt, %
0-6 in.6-12 in.12-18 in.18-24 in.24-30 in.30-36 in.
Figure E.23 Moisture Profile versus Time for A-2-4, 12% Soil (W.T. from +41 in. to +30 in. above Embankment)
A-2-4 (12%) Moisture Profile v.s. Elapse of Time (W.T. from +30 in. to +12 in.)
(at Each Elevation above Embankment)
6
7
8
9
10
11
12
13
14
15
0 5 10 15 20 25 30
Elapse of Time, Day
Moi
stur
e C
onte
nt, %
0-6 in.6-12 in.12-18 in.18-24 in.24-30 in.30-36 in.
Figure E.24 Moisture Profile versus Time for A-2-4, 12% Soil (W.T. from +30 in. to +12 in. above Embankment)
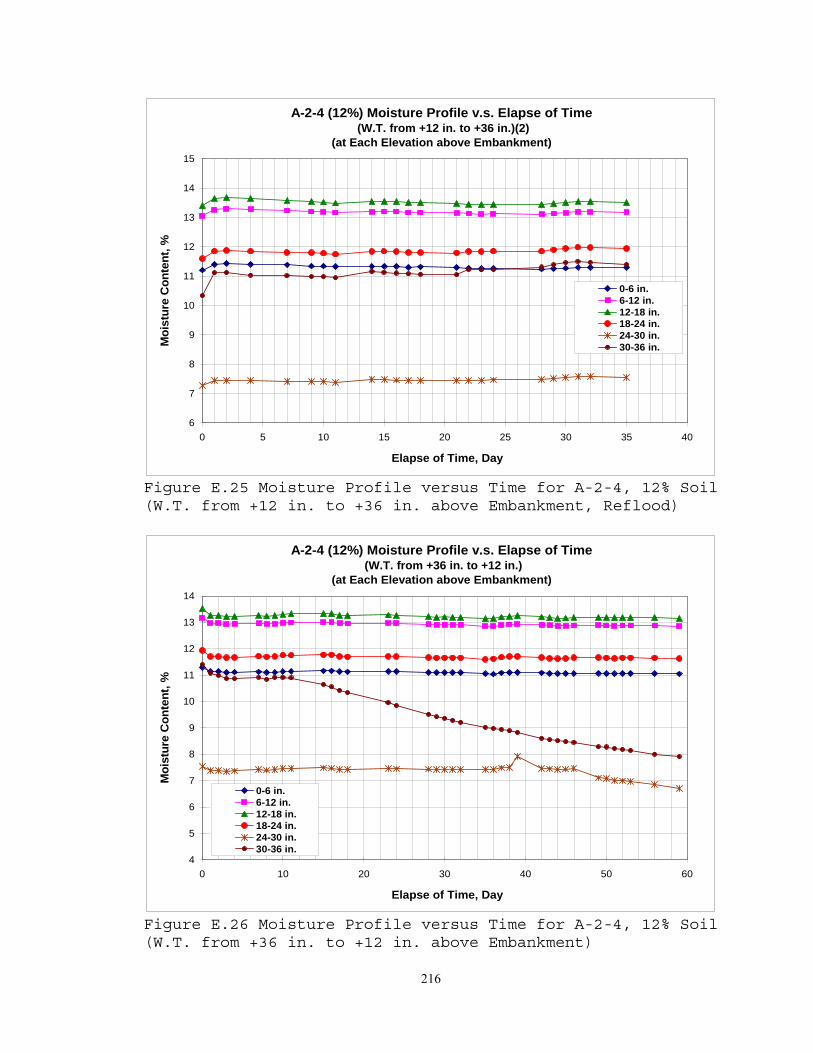
216
A-2-4 (12%) Moisture Profile v.s. Elapse of Time (W.T. from +12 in. to +36 in.)(2)
(at Each Elevation above Embankment)
6
7
8
9
10
11
12
13
14
15
0 5 10 15 20 25 30 35 40
Elapse of Time, Day
Moi
stur
e C
onte
nt, %
0-6 in.6-12 in.12-18 in.18-24 in.24-30 in.30-36 in.
Figure E.25 Moisture Profile versus Time for A-2-4, 12% Soil (W.T. from +12 in. to +36 in. above Embankment, Reflood)
A-2-4 (12%) Moisture Profile v.s. Elapse of Time (W.T. from +36 in. to +12 in.)
(at Each Elevation above Embankment)
4
5
6
7
8
9
10
11
12
13
14
0 10 20 30 40 50 60
Elapse of Time, Day
Moi
stur
e C
onte
nt, %
0-6 in.6-12 in.12-18 in.18-24 in.24-30 in.30-36 in.
Figure E.26 Moisture Profile versus Time for A-2-4, 12% Soil (W.T. from +36 in. to +12 in. above Embankment)

217
E.5 A-2-4, 20% SOIL

218
A-2-4 (20%) Moisture Profile v.s. Elapse of Time (W.T. from -24 in. to 0 in.)
(at Each Elevation above Embankment)
0
2
4
6
8
10
12
0 10 20 30 40 50 60
Elapse of Time, Day
Moi
stur
e C
onte
nt, %
0-6 in.6-12 in.12-18 in.18-24 in.24-30 in.30-36 in.
Figure E.27 Moisture Profile versus Time for A-2-4, 20% Soil (W.T. from -24 in. to 0 in. above Embankment)
A-2-4 (20%) Moisture Profile v.s. Elapse of Time (W.T. from 0 in. to +12 in.)
(at Each Elevation above Embankment)
0
2
4
6
8
10
12
0 10 20 30 40 50 60 70 80 90
Elapse of Time, Day
Moi
stur
e C
onte
nt, %
0-6 in.6-12 in.12-18 in.18-24 in.24-30 in.30-36 in.
Figure E.28 Moisture Profile versus Time for A-2-4, 20% Soil (W.T. from +0 in. to +12 in. above Embankment)

219
A-2-4 (20%) Moisture Profile v.s. Elapse of Time (W.T. from +12 in. to +36 in.)
(at Each Elevation above Embankment)
0
2
4
6
8
10
12
0 1 2 3 4 5 6 7 8 9
Elapse of Time, Day
Moi
stur
e C
onte
nt, %
0-6 in.6-12 in.12-18 in.18-24 in.24-30 in.30-36 in.
Figure E.29 Moisture Profile versus Time for A-2-4, 20% Soil (W.T. from +12 in. to +36 in. above Embankment)
A-2-4 (20%) Moisture Profile v.s. Elapse of Time (W.T. from +36 in. to +41 in.)
(at Each Elevation above Embankment)
6
7
8
9
10
11
12
0 1 2 3 4 5
Elapse of Time, Day
Moi
stur
e C
onte
nt, %
0-6 in.6-12 in.12-18 in.18-24 in.24-30 in.30-36 in.
Figure E.30 Moisture Profile versus Time for A-2-4, 20% Soil (W.T. from +36 in. to +41 in. above Embankment)

220
A-2-4 (20%) Moisture Profile v.s. Elapse of Time (W.T. from +41 in. to +30 in.)
(at Each Elevation above Embankment)
6
7
8
9
10
11
12
0 1 2 3 4 5 6 7
Elapse of Time, Day
Moi
stur
e C
onte
nt, %
0-6 in.6-12 in.12-18 in.18-24 in.24-30 in.30-36 in.
Figure E.31 Moisture Profile versus Time for A-2-4, 20% Soil (W.T. from +41 in. to +30 in. above Embankment)
A-2-4 (20%) Moisture Profile v.s. Elapse of Time (W.T. from +30 in. to +12 in.)
(at Each Elevation above Embankment)
6
7
8
9
10
11
12
0 5 10 15 20 25 30
Elapse of Time, Day
Moi
stur
e C
onte
nt, %
0-6 in.6-12 in.12-18 in.18-24 in.24-30 in.30-36 in.
Figure E.32 Moisture Profile versus Time for A-2-4, 20% Soil (W.T. from +30 in. to +12 in. above Embankment)

221
A-2-4 (20%) Moisture Profile v.s. Elapse of Time (W.T. from +12 in. to +36 in.)(2)
(at Each Elevation above Embankment)
6
7
8
9
10
11
12
0 5 10 15 20 25 30 35 40
Elapse of Time, Day
Moi
stur
e C
onte
nt, %
0-6 in.6-12 in.12-18 in.18-24 in.24-30 in.30-36 in.
Figure E.33 Moisture Profile versus Time for A-2-4, 20% Soil (W.T. from +12 in. to +36 in. above Embankment, Reflood)
A-2-4 (20%) Moisture Profile v.s. Elapse of Time (W.T. from +36 in. to +12 in.)
(at Each Elevation above Embankment)
4
5
6
7
8
9
10
11
12
0 10 20 30 40 50 60
Elapse of Time, Day
Moi
stur
e C
onte
nt, %
0-6 in.6-12 in.12-18 in.18-24 in.24-30 in.30-36 in.
Figure E.34 Moisture Profile versus Time for A-2-4, 20% Soil (W.T. from +36 in. to +41 in. above Embankment)

222
E.6 A-2-4, 24% SOIL

223
A-2-4 (24%) Moisture Profile v.s. Elapse of Time (W.T. from -24 in. to 0 in.)
(at Each Elevation above Embankment)
4
5
6
7
8
9
10
11
0 10 20 30 40 50 60
Elapse of Time, Day
Moi
stur
e C
onte
nt, %
0-6 in.6-12 in.12-18 in.18-24 in.24-30 in.30-36 in.
Figure E.35 Moisture Profile versus Time for A-2-4, 24% Soil (W.T. from -24 in. to 0 in. above Embankment)
A-2-4 (24%) Moisture Profile v.s. Elapse of Time (W.T. from 0 in. to +12 in.)
(at Each Elevation above Embankment)
4
5
6
7
8
9
10
11
12
13
14
0 10 20 30 40 50 60 70 80 90
Elapse of Time, Day
Moi
stur
e C
onte
nt, %
0-6 in.6-12 in.12-18 in.18-24 in.24-30 in.30-36 in.
Figure E.36 Moisture Profile versus Time for A-2-4, 24% Soil (W.T. from +0 in. to +12 in. above Embankment)

224
A-2-4 (24%) Moisture Profile v.s. Elapse of Time (W.T. from +12 in. to +36 in.)
(at Each Elevation above Embankment)
4
5
6
7
8
9
10
11
12
13
14
0 1 2 3 4 5 6 7 8 9
Elapse of Time, Day
Moi
stur
e C
onte
nt, %
0-6 in.6-12 in.12-18 in.18-24 in.24-30 in.30-36 in.
Figure E.37 Moisture Profile versus Time for A-2-4, 24% Soil (W.T. from +12 in. to +36 in. above Embankment)
A-2-4 (24%) Moisture Profile v.s. Elapse of Time (W.T. from +36 in. to +41 in.)
(at Each Elevation above Embankment)
6
7
8
9
10
11
12
13
14
0 1 2 3 4 5
Elapse of Time, Day
Moi
stur
e C
onte
nt, %
0-6 in.6-12 in.12-18 in.18-24 in.24-30 in.30-36 in.
Figure E.38 Moisture Profile versus Time for A-2-4, 24% Soil (W.T. from +36 in. to +41 in. above Embankment)

225
A-2-4 (24%) Moisture Profile v.s. Elapse of Time (W.T. from +41 in. to +30 in.)
(at Each Elevation above Embankment)
4
5
6
7
8
9
10
11
12
13
14
0 1 2 3 4 5 6 7
Elapse of Time, Day
Moi
stur
e C
onte
nt, %
0-6 in.6-12 in.12-18 in.18-24 in.24-30 in.30-36 in.
Figure E.39 Moisture Profile versus Time for A-2-4, 24% Soil (W.T. from +41 in. to +30 in. above Embankment)
A-2-4 (24%) Moisture Profile v.s. Elapse of Time (W.T. from +30 in. to +12 in.)
(at Each Elevation above Embankment)
4
5
6
7
8
9
10
11
12
13
14
0 5 10 15 20 25 30
Elapse of Time, Day
Moi
stur
e C
onte
nt, %
0-6 in.6-12 in.12-18 in.18-24 in.24-30 in.30-36 in.
Figure E.40 Moisture Profile versus Time for A-2-4, 24% Soil (W.T. from +30 in. to +12 in. above Embankment)

226
A-2-4 (24%) Moisture Profile v.s. Elapse of Time (W.T. from +12 in. to +36 in.)(2)
(at Each Elevation above Embankment)
4
5
6
7
8
9
10
11
12
13
14
0 5 10 15 20 25 30 35 40
Elapse of Time, Day
Moi
stur
e C
onte
nt, %
0-6 in.6-12 in.12-18 in.18-24 in.24-30 in.30-36 in.
Figure E.41 Moisture Profile versus Time for A-2-4, 24% Soil (W.T. from +12 in. to +36 in. above Embankment, Reflood)
A-2-4 (24%) Moisture Profile v.s. Elapse of Time (W.T. from +36 in. to +12 in.)
(at Each Elevation above Embankment)
4
5
6
7
8
9
10
11
12
13
14
0 10 20 30 40 50 60
Elapse of Time, Day
Moi
stur
e C
onte
nt, %
0-6 in.6-12 in.12-18 in.18-24 in.24-30 in.30-36 in.
Figure E.42 Moisture Profile versus Time for A-2-4, 24% Soil (W.T. from +36 in. to +41 in. above Embankment)

227
E.7 A-2-4, 30% SOIL

228
A-2-4 (30%) Moisture Profile v.s. Elapse of Time (W.T. from -24 in. to 0 in.)
(at Each Elevation above Embankment)
6
8
10
12
14
16
18
0 5 10 15 20 25 30 35 40 45
Elapse of Time, Day
Moi
stur
e C
onte
nt, %
0-6 in.6-12 in.12-18 in.18-24 in.24-30 in.30-36 in.
Figure E.43 Moisture Profile versus Time for A-2-4, 30% Soil (W.T. from -24 in. to +0 in. above Embankment)
A-2-4 (30%) Moisture Profile v.s. Elapse of Time (W.T. from 0 in. to +12 in.)
(at Each Elevation above Embankment)
4
6
8
10
12
14
16
18
0 20 40 60 80 100 120 140
Elapse of Time, Day
Moi
stur
e C
onte
nt, %
0-6 in.6-12 in.12-18 in.18-24 in.24-30 in.30-36 in.
Figure E.44 Moisture Profile versus Time for A-2-4, 30% Soil (W.T. from +0 in. to +12 in. above Embankment)

229
Levy County Moisture Profile v.s. Elapse of Time (W.T. from +12 in. to +36 in.)
(at Each Elevation above Embankment)
4
6
8
10
12
14
16
18
0 2 4 6 8 10 12 14
Elapse of Time, Day
Moi
stur
e C
onte
nt, %
0-6 in.6-12 in.12-18 in.18-24 in.24-30 in.30-36 in.
Figure E.45 Moisture Profile versus Time for A-2-4, 30% Soil (W.T. from +12 in. to +36 in. above Embankment)
Levy County Moisture Profile v.s. Elapse of Time (W.T. from +36 in. to -20 in.)
(at Each Elevation above Embankment)
0
2
4
6
8
10
12
14
16
18
0 1 2 3 4
Elapse of Time, Day
Moi
stur
e C
onte
nt, %
0-6 in.6-12 in.12-18 in.18-24 in.24-30 in.30-36 in.
Figure E.46 Moisture Profile versus Time for A-2-4, 30% Soil (W.T. from +36 in. to -20 in. above Embankment)

230
E.8 OOLITE A-1 SOIL

231
Oolite Moisture Profile v.s. Elapse of Time (W.T. from -24 in. to 0 in.)
(at Each Elevation above Embankment)
0
1
2
3
4
5
6
7
0 5 10 15 20 25 30 35 40 45
Elapse of Time, Day
Moi
stur
e C
onte
nt, %
0-6 in.6-12 in.12-18 in.18-24 in.24-30 in.30-36 in.
Figure E.47 Moisture Profile versus Time for Oolite A-1 Soil (W.T. from -24 in. to +0 in. above Embankment)
Oolite Moisture Profile v.s. Elapse of Time (W.T. from 0 in. to +12 in.)
(at Each Elevation above Embankment)
0
1
2
3
4
5
6
7
0 20 40 60 80 100 120 140
Elapse of Time, Day
Moi
stur
e C
onte
nt, %
0-6 in.6-12 in.12-18 in.18-24 in.24-30 in.30-36 in.
Figure E.48 Moisture Profile versus Time for Oolite A-1 Soil (W.T. from +0 in. to +12 in. above Embankment)

232
Oolite Moisture Profile v.s. Elapse of Time (W.T. from +12 in. to +36 in.)
(at Each Elevation above Embankment)
2
3
4
5
6
7
0 10 20 30 40 50 60 70 80 90
Elapse of Time, Day
Moi
stur
e C
onte
nt, %
0-6 in.6-12 in.12-18 in.18-24 in.24-30 in.30-36 in.
Figure E.49 Moisture Profile versus Time for Oolite A-1 Soil (W.T. from +12 in. to +36 in. above Embankment)
Oolite Moisture Profile v.s. Elapse of Time (W.T. from +36 in. to +12 in.)
(at Each Elevation above Embankment)
2
3
4
5
6
7
0 10 20 30 40 50 60
Elapse of Time, Day
Moi
stur
e C
onte
nt, %
0-6 in.6-12 in.12-18 in.18-24 in.24-30 in.30-36 in.
Figure E.50 Moisture Profile versus Time for Oolite A-1 Soil (W.T. from +36 in. to -20 in. above Embankment)

233
E.9 SPRING CEMETERY A-2-4, 15% SOIL

234
Spring Cemetery Moisture Profile v.s. Elapse of Time (W.T. from -24 in. to +0 in.)
(at Each Elevation above Embankment)
0.0
2.0
4.0
6.0
8.0
10.0
12.0
14.0
16.0
0 5 10 15 20
Elapse of Time, Day
Moi
stur
e C
onte
nt, %
0-6 in.6-12 in.12-18 in.18-24 in.24-30 in.
Figure E.51 Moisture Profile versus Time for Spring Cemetery A-2-4 Soil (W.T. from -24 in. to 0 in. above Embankment)
Spring Cemetery Moisture Profile v.s. Elapse of Time (W.T. from +0 in. to +12 in.)
(at Each Elevation above Embankment)
0.0
2.0
4.0
6.0
8.0
10.0
12.0
14.0
16.0
0 5 10 15 20 25 30 35 40 45 50 55 60
Elapse of Time, Day
Moi
stur
e C
onte
nt, %
0-6 in.6-12 in.12-18 in.18-24 in.24-30 in.
Figure E.52 Moisture Profile versus Time for Spring Cemetery A-2-4 Soil (W.T. from +0 in. to +12 in. above Embankment)
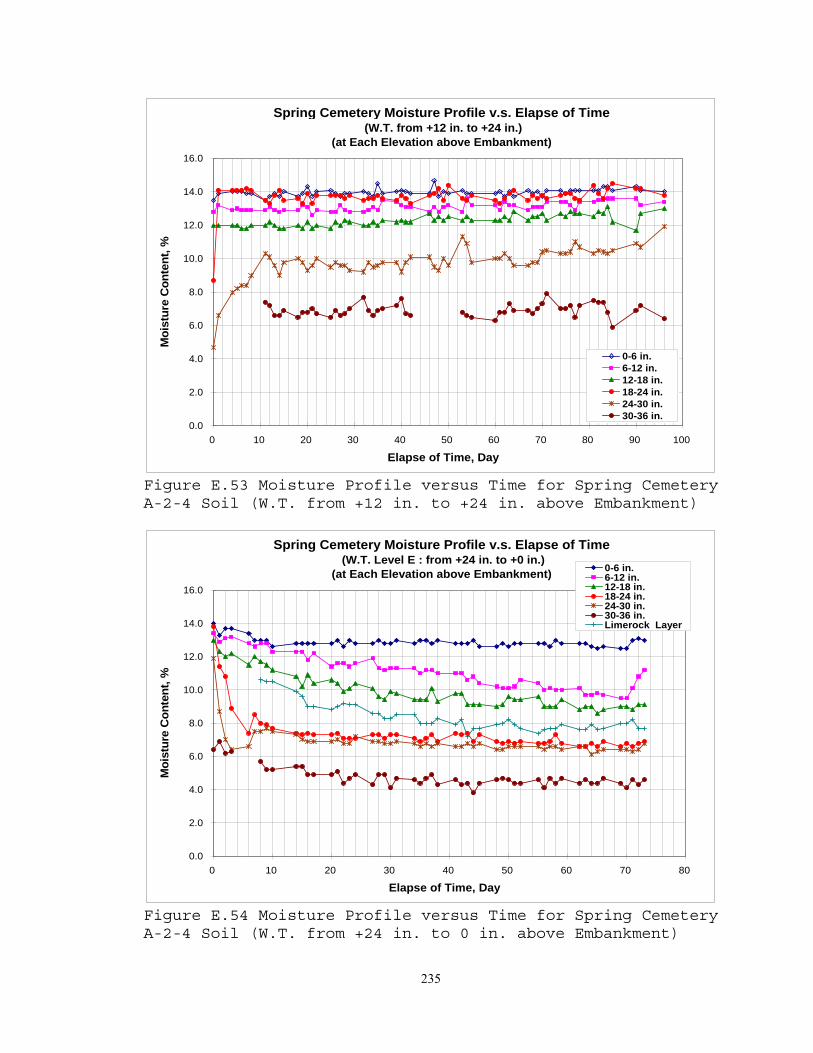
235
Spring Cemetery Moisture Profile v.s. Elapse of Time (W.T. from +12 in. to +24 in.)
(at Each Elevation above Embankment)
0.0
2.0
4.0
6.0
8.0
10.0
12.0
14.0
16.0
0 10 20 30 40 50 60 70 80 90 100
Elapse of Time, Day
Moi
stur
e C
onte
nt, %
0-6 in.6-12 in.12-18 in.18-24 in.24-30 in.30-36 in.
Figure E.53 Moisture Profile versus Time for Spring Cemetery A-2-4 Soil (W.T. from +12 in. to +24 in. above Embankment)
Spring Cemetery Moisture Profile v.s. Elapse of Time (W.T. Level E : from +24 in. to +0 in.)
(at Each Elevation above Embankment)
0.0
2.0
4.0
6.0
8.0
10.0
12.0
14.0
16.0
0 10 20 30 40 50 60 70 80
Elapse of Time, Day
Moi
stur
e C
onte
nt, %
0-6 in.6-12 in.12-18 in.18-24 in.24-30 in.30-36 in.Limerock Layer
Figure E.54 Moisture Profile versus Time for Spring Cemetery A-2-4 Soil (W.T. from +24 in. to 0 in. above Embankment)

236
Spring Cemetery Moisture Profile v.s. Elapse of Time (W.T. Level F : from 0 in. to +12 in.)
(at Each Elevation above Embankment)
0.0
2.0
4.0
6.0
8.0
10.0
12.0
14.0
16.0
0 10 20 30 40 50 60 70 80
Elapse of Time, Day
Moi
stur
e C
onte
nt, %
0-6 in.6-12 in.12-18 in.18-24 in.24-30 in.30-36 in.Limerock Layer
Figure E.55 Moisture Profile versus Time for Spring Cemetery A-2-4 Soil (W.T. from 0 in. to +12 in. above Embankment, Reflood)
Spring Cemetery Moisture Profile v.s. Elapse of Time (W.T. Level G : from +12 in. to +24 in.)(at Each Elevation above Embankment)
0.0
2.0
4.0
6.0
8.0
10.0
12.0
14.0
16.0
0 10 20 30 40 50 60 70 80
Elapse of Time, Day
Moi
stur
e C
onte
nt, %
0-6 in.6-12 in.12-18 in.18-24 in.24-30 in.30-36 in.Limerock Layer
Figure E.56 Moisture Profile versus Time for Spring Cemetery A-2-4 Soil (W.T. from +12 in. to +24 in. above Embankment, Reflood)

237
Spring Cemetery Moisture Profile v.s. Elapse of Time (W.T. Level H : from +24 in. to +36 in.)
(at Each Elevation above Embankment)
10.0
11.0
12.0
13.0
14.0
15.0
16.0
17.0
18.0
19.0
20.0
0 10 20 30 40 50 60 70 80
Elapse of Time, Day
Moi
stur
e C
onte
nt, %
0-6 in.6-12 in.12-18 in.18-24 in.24-30 in.30-36 in.Limerock Layer
Figure E.57 Moisture Profile versus Time for Spring Cemetery A-2-4 Soil (W.T. from +24 in. to +36 in. above Embankment)
Spring Cemetery Moisture Profile v.s. Elapse of Time (W.T. Level I : Drawn down from +36 in. to +24 in.)
(at Each Elevation above Embankment)
10.0
11.0
12.0
13.0
14.0
15.0
16.0
17.0
18.0
19.0
20.0
0 10 20 30 40 50 60 70 80 90
Elapse of Time, Day
Moi
stur
e C
onte
nt, %
0-6 in.6-12 in.12-18 in.18-24 in.24-30 in.30-36 in.Limerock Layer
Figure E.58 Moisture Profile versus Time for Spring Cemetery A-2-4 Soil (W.T. from +36 in. to +24 in. above Embankment)

238
Spring Cemetery Moisture Profile v.s. Elapse of Time (W.T. Level J : Drawn down from +24 in. to +12 in.)
(at Each Elevation above Embankment)
0.0
2.0
4.0
6.0
8.0
10.0
12.0
14.0
16.0
18.0
0 10 20 30 40 50 60 70 80 90
Elapse of Time, Day
Moi
stur
e C
onte
nt, %
0-6 in.6-12 in.12-18 in.18-24 in.24-30 in.30-36 in.Limerock Layer
Figure E.59 Moisture Profile versus Time for Spring Cemetery A-2-4 Soil (W.T. from +24 in. to +12 in. above Embankment)

239
E.10 BRANCH A-2-4, 23% SOIL

240
Branch Moisture Profile v.s. Elapse of Time (W.T. Level B : from -24 in. to +0 in.)
(at Each Elevation above Embankment)
0.0
2.0
4.0
6.0
8.0
10.0
12.0
14.0
16.0
0 5 10 15 20
Elapse of Time, Day
Moi
stur
e C
onte
nt, %
0-6 in.6-12 in.12-18 in.18-24 in.24-30 in.
Figure E.60 Moisture Profile versus Time for Branch A-2-4 Soil (W.T. from -24 in. to 0 in. above Embankment)
Branch Moisture Profile v.s. Elapse of Time (W.T. Level C : from +0 in. to +12 in.)
(at Each Elevation above Embankment)
0.0
2.0
4.0
6.0
8.0
10.0
12.0
14.0
0 5 10 15 20 25 30 35 40 45 50 55 60
Elapse of Time, Day
Moi
stur
e C
onte
nt, %
0-6 in.6-12 in.12-18 in.18-24 in.24-30 in.
Figure E.61 Moisture Profile versus Time for Branch A-2-4 Soil (W.T. from +0 in. to +12 in. above Embankment)

241
Branch Moisture Profile v.s. Elapse of Time (W.T. Level D : from +12 in. to +24 in.)
(at Each Elevation above Embankment)
0.0
2.0
4.0
6.0
8.0
10.0
12.0
14.0
0 10 20 30 40 50 60 70 80 90 100
Elapse of Time, Day
Moi
stur
e C
onte
nt, %
0-6 in.6-12 in.12-18 in.18-24 in.24-30 in.30-36 in.
Figure E.62 Moisture Profile versus Time for Branch A-2-4 Soil (W.T. from +12 in. to +24 in. above Embankment)
Branch Moisture Profile v.s. Elapse of Time (W.T. Level E : from +24 in. to +0 in.)
(at Each Elevation above Embankment)
0.0
2.0
4.0
6.0
8.0
10.0
12.0
14.0
16.0
0 10 20 30 40 50 60 70 80
Elapse of Time, Day
Moi
stur
e C
onte
nt, %
0-6 in.6-12 in.12-18 in.18-24 in.24-30 in.30-36 in.Limerock Layer
Figure E.63 Moisture Profile versus Time for Branch A-2-4 Soil (W.T. from +24 in. to 0 in. above Embankment)

242
Branch Moisture Profile v.s. Elapse of Time (W.T. Level F : from 0 in. to +12 in.)
(at Each Elevation above Embankment)
0.0
2.0
4.0
6.0
8.0
10.0
12.0
14.0
16.0
0 10 20 30 40 50 60 70 80
Elapse of Time, Day
Moi
stur
e C
onte
nt, %
0-6 in.6-12 in.12-18 in.18-24 in.24-30 in.30-36 in.Limerock Layer
Figure E.64 Moisture Profile versus Time for Branch A-2-4 Soil (W.T. from 0 in. to +12 in. above Embankment, Reflood)
Branch Moisture Profile v.s. Elapse of Time (W.T. Level G : from +12 in. to +24 in.)(at Each Elevation above Embankment)
0.0
2.0
4.0
6.0
8.0
10.0
12.0
14.0
16.0
0 10 20 30 40 50 60 70 80
Elapse of Time, Day
Moi
stur
e C
onte
nt, %
0-6 in.6-12 in.12-18 in.18-24 in.24-30 in.30-36 in.Limerock Layer
Figure E.65 Moisture Profile versus Time for Branch A-2-4 Soil (W.T. from +12 in. to +24 in. above Embankment, Reflood)
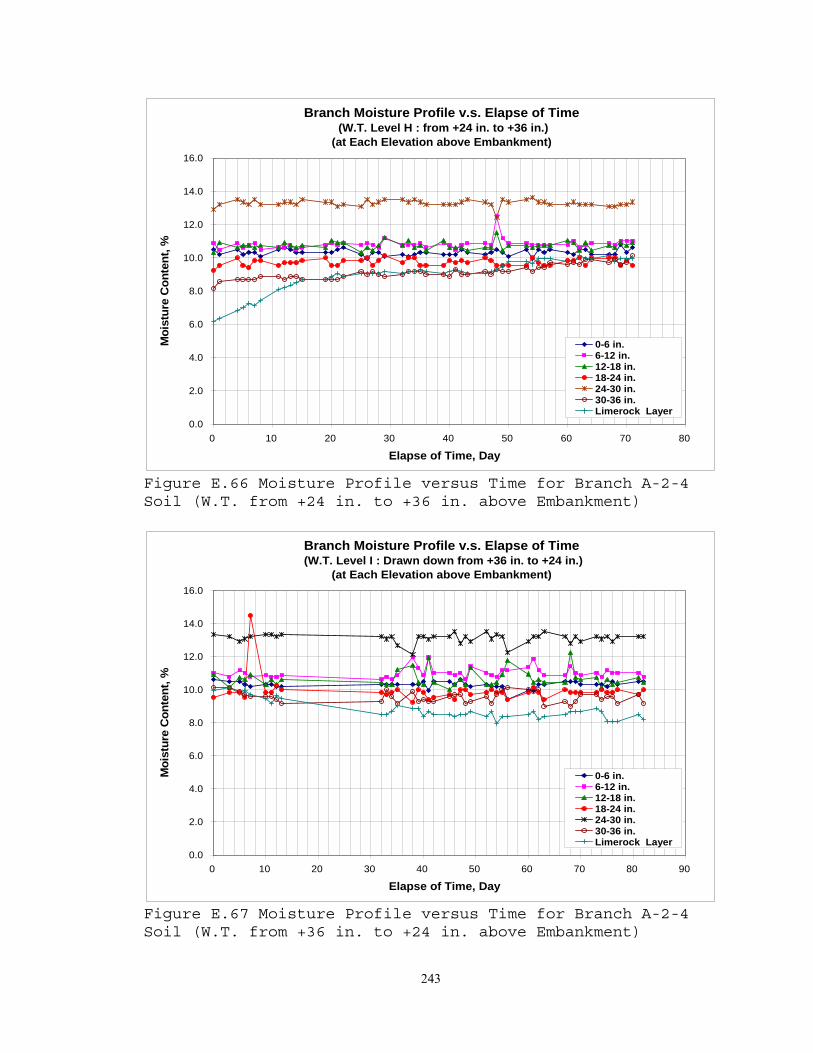
243
Branch Moisture Profile v.s. Elapse of Time (W.T. Level H : from +24 in. to +36 in.)
(at Each Elevation above Embankment)
0.0
2.0
4.0
6.0
8.0
10.0
12.0
14.0
16.0
0 10 20 30 40 50 60 70 80
Elapse of Time, Day
Moi
stur
e C
onte
nt, %
0-6 in.6-12 in.12-18 in.18-24 in.24-30 in.30-36 in.Limerock Layer
Figure E.66 Moisture Profile versus Time for Branch A-2-4 Soil (W.T. from +24 in. to +36 in. above Embankment)
Branch Moisture Profile v.s. Elapse of Time (W.T. Level I : Drawn down from +36 in. to +24 in.)
(at Each Elevation above Embankment)
0.0
2.0
4.0
6.0
8.0
10.0
12.0
14.0
16.0
0 10 20 30 40 50 60 70 80 90
Elapse of Time, Day
Moi
stur
e C
onte
nt, %
0-6 in.6-12 in.12-18 in.18-24 in.24-30 in.30-36 in.Limerock Layer
Figure E.67 Moisture Profile versus Time for Branch A-2-4 Soil (W.T. from +36 in. to +24 in. above Embankment)

244
Branch Moisture Profile v.s. Elapse of Time (W.T. Level J : Drawn down from +24 in. to +12 in.)
(at Each Elevation above Embankment)
0.0
2.0
4.0
6.0
8.0
10.0
12.0
14.0
16.0
0 10 20 30 40 50 60 70 80 90
Elapse of Time, Day
Moi
stur
e C
onte
nt, %
0-6 in.6-12 in.12-18 in.18-24 in.24-30 in.30-36 in.Limerock Layer
Figure E.68 Moisture Profile versus Time for Branch A-2-4 Soil (W.T. from +24 in. to +12 in. above Embankment)

245
E.11 IRON BRIDGE A-2-6, 31% SOIL

246
Iron Bridge Moisture Profile v.s. Elapse of Time (W.T. Level B : from -24 in. to +0 in.)
(at Each Elevation above Embankment)
0.0
2.0
4.0
6.0
8.0
10.0
12.0
14.0
16.0
0 5 10 15 20
Elapse of Time, Day
Moi
stur
e C
onte
nt, %
0-6 in.6-12 in.12-18 in.18-24 in.24-30 in.
Figure E.69 Moisture Profile versus Time for Iron Bridge A-2-6 Soil (W.T. from -24 in. to 0 in. above Embankment)
Iron Bridge Moisture Profile v.s. Elapse of Time (W.T. Level C : from +0 in. to +12 in.)
(at Each Elevation above Embankment)
0.0
2.0
4.0
6.0
8.0
10.0
12.0
14.0
16.0
0 5 10 15 20 25 30 35 40 45 50 55 60
Elapse of Time, Day
Moi
stur
e C
onte
nt, %
0-6 in.6-12 in.12-18 in.18-24 in.24-30 in.
Figure E.70 Moisture Profile versus Time for Iron Bridge A-2-6 Soil (W.T. from +0 in. to +12 in. above Embankment)

247
Iron Bridge Moisture Profile v.s. Elapse of Time (W.T. Level D : from +12 in. to +24 in.)
(at Each Elevation above Embankment)
0.0
2.0
4.0
6.0
8.0
10.0
12.0
14.0
0 10 20 30 40 50 60 70 80 90 100
Elapse of Time, Day
Moi
stur
e C
onte
nt, %
0-6 in.6-12 in.12-18 in.18-24 in.24-30 in.30-36 in.
Figure E.71 Moisture Profile versus Time for Iron Bridge A-2-6 Soil (W.T. from +12 in. to +24 in. above Embankment)
Iron Bridge Moisture Profile v.s. Elapse of Time (W.T. Level E : from +24 in. to +0 in.)
(at Each Elevation above Embankment)
0.0
2.0
4.0
6.0
8.0
10.0
12.0
14.0
16.0
0 10 20 30 40 50 60 70 80
Elapse of Time, Day
Moi
stur
e C
onte
nt, %
0-6 in.6-12 in.12-18 in.18-24 in.24-30 in.30-36 in.Limerock Layer
Figure E.72 Moisture Profile versus Time for Iron Bridge A-2-6 Soil (W.T. from +24 in. to 0 in. above Embankment)

248
Iron Bridge Moisture Profile v.s. Elapse of Time (W.T. Level F : from 0 in. to +12 in.)
(at Each Elevation above Embankment)
0.0
2.0
4.0
6.0
8.0
10.0
12.0
14.0
16.0
0 10 20 30 40 50 60 70 80
Elapse of Time, Day
Moi
stur
e C
onte
nt, %
0-6 in.6-12 in.12-18 in.18-24 in.24-30 in.30-36 in.Limerock Layer
Figure E.73 Moisture Profile versus Time for Iron Bridge A-2-6 Soil (W.T. from 0 in. to +12 in. above Embankment, Reflood)
Iron Bridge Moisture Profile v.s. Elapse of Time (W.T. Level G : from +12 in. to +24 in.)(at Each Elevation above Embankment)
0.0
2.0
4.0
6.0
8.0
10.0
12.0
14.0
16.0
0 10 20 30 40 50 60 70 80
Elapse of Time, Day
Moi
stur
e C
onte
nt, %
0-6 in.6-12 in.12-18 in.18-24 in.24-30 in.30-36 in.Limerock Layer
Figure E.74 Moisture Profile versus Time for Iron Bridge A-2-6 Soil (W.T. from +12 in. to +24 in. above Embankment, Reflood)

249
Iron Bridge Moisture Profile v.s. Elapse of Time (W.T. Level H : from +24 in. to +36 in.)
(at Each Elevation above Embankment)
0.0
2.0
4.0
6.0
8.0
10.0
12.0
14.0
16.0
0 10 20 30 40 50 60 70 80
Elapse of Time, Day
Moi
stur
e C
onte
nt, %
0-6 in.6-12 in.12-18 in.18-24 in.24-30 in.30-36 in.Limerock Layer
Figure E.75 Moisture Profile versus Time for Iron Bridge A-2-6 Soil (W.T. from +24 in. to +36 in. above Embankment)
Iron Bridge Moisture Profile v.s. Elapse of Time (W.T. Level I : Drawn down from +36 in. to +24 in.)
(at Each Elevation above Embankment)
0
2
4
6
8
10
12
14
16
0 10 20 30 40 50 60 70 80 90
Elapse of Time, Day
Moi
stur
e C
onte
nt, %
0-6 in.6-12 in.12-18 in.18-24 in.24-30 in.30-36 in.Limerock Layer
Figure E.76 Moisture Profile versus Time for Iron Bridge A-2-6 Soil (W.T. from +36 in. to +24 in. above Embankment)

250
Iron Bridge Moisture Profile v.s. Elapse of Time (W.T. Level J : Drawn down from +24 in. to +12 in.)
(at Each Elevation above Embankment)
0.0
2.0
4.0
6.0
8.0
10.0
12.0
14.0
16.0
0 10 20 30 40 50 60 70 80 90
Elapse of Time, Day
Moi
stur
e C
onte
nt, %
0-6 in.6-12 in.12-18 in.18-24 in.24-30 in.30-36 in.Limerock Layer
Figure E.77 Moisture Profile versus Time for Iron Bridge A-2-6 Soil (W.T. from +24 in. to +12 in. above Embankment)

251
APPENDIX F
DEFORMATION DATA IN PLATE LOAD TEST

252
F.1 LEVY COUNTY A-3, 4% SOIL

253
Table F.1 Levy County A-3 Soil Plate Load Test, 20 psi w/o Limerock
Permanent Total Resilient Permanent Total Resilient
(mm) (mm) (mm) (mm) (mm) (mm)
1 0.1721 0.3599 0.1879 1 0.1528 0.3090 0.1562
4 0.2503 0.4608 0.2105 4 0.2066 0.3580 0.1514
5 0.2875 0.4880 0.2004 5 0.2258 0.3733 0.1475
10 0.3777 0.5676 0.1899 10 0.3252 0.4477 0.1225
25 0.5125 0.6954 0.1829 25 0.4788 0.6057 0.1269
50 0.6254 0.8039 0.1785 50 0.6144 0.7444 0.1300
100 0.7475 0.9234 0.1759 100 0.7698 0.9531 0.1834
200 0.8892 1.0647 0.1755 200 0.9216 1.1221 0.2004
500 1.1378 1.3133 0.1755 1000 1.2940 1.4980 0.2039
1000 1.3168 1.4892 0.1724 2000 1.4516 1.6699 0.2184
2000 1.5255 1.6962 0.1707 10000 1.8839 2.0927 0.2087
5000 1.7185 1.8918 0.1733 25000 2.1972 2.3902 0.1930
10000 1.8857 2.0533 0.1676 30000
15000 2.0253 2.1894 0.1641
20000 2.1246 2.2865 0.1619
25000 2.2086 2.3710 0.1624
30000 2.2795 2.4388 0.1593
Permanent Total Resilient
(mm) (mm) (mm)
1 0.0591 0.2683 0.2092
4 0.0591 0.2814 0.2223
5 0.0569 0.2797 0.2227
10 0.0652 0.2889 0.2236
25 0.0714 0.2902 0.2188
50 0.0775 0.2906 0.2131
100 0.0845 0.3002 0.2157
200 0.0906 0.3059 0.2153
500 0.1016 0.3199 0.2184
1000 0.1278 0.3514 0.2236
2000 0.1585 0.3860 0.2276
5000 0.2398 0.4648 0.2249
30000 0.6626 0.8831 0.2206
Deformation with W.T. at +12 in., Test 1-3
Load Cycles
Deformation at Drained Condition (-20 in.), Test 1-1 Deformation with W.T. at 0.0 in., Test 1-2
Load Cycles
Load Cycles

254
Table F.2 Levy County A-3 Soil Plate Load Test, 20 psi w/ Limerock
Permanent Total Resilient Permanent Total Resilient(mm) (mm) (mm) (mm) (mm) (mm)
1 0.1261 0.2757 0.1497 1 0.0686 0.2614 0.19284 4 0.0912 0.2496 0.15855 5 0.0855 0.2572 0.1718
10 10 0.0984 0.2865 0.188225 25 0.1133 0.3049 0.191750 50 0.1371 0.3286 0.1915
100 100 0.1785 0.3819 0.2035200 0.3689 0.5090 0.1400 200 0.2347 0.4388 0.2041500 0.3969 0.5418 0.1448 500 0.3349 0.5329 0.1980
1000 0.4258 0.5685 0.1427 1000 0.4207 0.6161 0.19542000 0.4451 0.5899 0.1448 2000 0.5180 0.7112 0.19325000 0.5037 0.6490 0.1453 5000 0.6373 0.8268 0.1895
10000 0.5895 0.7203 0.1308 10000 0.7869 0.9683 0.181415000 0.6543 0.7807 0.1265 15000 0.8815 1.0561 0.174620000 0.6971 0.8267 0.1295 20000 0.9655 1.1335 0.168025000 0.7348 0.8612 0.1265 25000 1.0309 1.1957 0.164830000 0.7628 0.8906 0.1278 30000 1.0839 1.2491 0.1652
Deformation with W.T. at +12 in., Test 1-4 Deformation with W.T. at +36 in., Test 1-7
Load Cycles
Load Cycles
Table F.3 Levy County A-3 Soil Plate Load Test, 50 psi w/ Limerock
Permanent Total Resilient Permanent Total Resilient(mm) (mm) (mm) (mm) (mm) (mm)
1 0.9278 1.2730 0.3453 1 0.1740 0.4915 0.31754 1.1417 1.4227 0.2809 4 0.2096 0.5652 0.35565 1.1623 1.4682 0.3059 5 0.2311 0.5817 0.3505
10 1.2656 1.5807 0.3151 10 0.3073 0.6426 0.335325 1.4231 1.7281 0.3050 25 0.4483 0.7887 0.340450 1.5540 1.8634 0.3094 50 0.5779 0.9347 0.3569
100 1.6905 2.0113 0.3208 100 0.7595 1.1138 0.3543200 1.8222 2.1242 0.3019 200 0.9792 1.3538 0.3747500 1.9609 2.2598 0.2989 500 1.4961 1.8631 0.3670
1000 2.0638 2.3684 0.3046 1000 1.9660 2.3711 0.40512000 2.1513 2.4603 0.3089 2000 2.7038 3.0963 0.39245000 2.2813 2.5828 0.3015 5000 3.6932 4.1021 0.4089
10000 2.4139 2.7027 0.2888 10000 4.7396 5.1321 0.392415000 2.5115 2.7828 0.2713 15000 5.5372 5.9055 0.368320000 2.5780 2.8598 0.2818 20000 6.1709 6.5367 0.365825000 2.6432 2.9171 0.2739 25000 6.6853 7.0498 0.364530000 2.7071 2.9661 0.2591 30000 7.1158 7.4740 0.3581
Deformation with W.T. at +12 in., Test 1-5 Deformation with W.T. at +36 in., Test 1-6
Load Cycles
Load Cycles

255
Table F.4 Summary of Deformation for Levy County A-3 Soil Plate Load Test
Test No. 1-1 1-2 1-3 1-4 1-5 1-6 1-7
Test Date 12/30/1998 2/5/1999 2/26/1999 3/23/1999 3/24/1999 3/31/1999 4/1/1999
Loads (psi) 20 20 20 20 50 50 20
Limerock Layer No No No Yes Yes Yes Yes
-20 0 12 12 12 36 36
1 0.00740 0.00615 0.00824 0.00589 0.01359 0.01250 0.00759
4 0.00829 0.00596 0.00875 0.01106 0.01400 0.00624
5 0.00789 0.00581 0.00877 0.01204 0.01380 0.00676
10 0.00748 0.00482 0.00880 0.01240 0.01320 0.00741
25 0.00720 0.00500 0.00861 0.01201 0.01340 0.00755
50 0.00703 0.00512 0.00839 0.01218 0.01405 0.00754
100 0.00693 0.00722 0.00849 0.01263 0.01395 0.00801
200 0.00691 0.00789 0.00848 0.00551 0.01189 0.01475 0.00804
500 0.00691 0.00860 0.00570 0.01177 0.01445 0.00780
1000 0.00679 0.00803 0.00880 0.00562 0.01199 0.01595 0.00769
2000 0.00672 0.00860 0.00896 0.00570 0.01216 0.01545 0.00761
5000 0.00682 0.00886 0.00572 0.01187 0.01610 0.00746
10000 0.00660 0.00822 0.00515 0.01137 0.01545 0.00714
15000 0.00646 0.00498 0.01068 0.01450 0.00687
20000 0.00637 0.00510 0.01110 0.01440 0.00662
25000 0.00639 0.00760 0.00498 0.01079 0.01435 0.00649
30000 0.00627 0.00868 0.00503 0.01020 0.01410 0.00650
Water Table (in. above Embankment)No.of Plate Load Cycles
Resilient Deformation (in.) for Levy County A-3 Soil

256
Levy County A-3 Soil (Deformation), Test 1-1
0.00
0.50
1.00
1.50
2.00
2.50
3.00
1 10 100 1000 10000 100000
Number of Cycles
Def
orm
atio
n, m
m
PermanentResilientTotal
20 psi
Subgrade
Embankment
-20 in.
Figure F.1 Levy County A-3 Soil, Deformation under 20 psi Plate Load (Water Table at –20 in., without Limerock, Test 1-1) Figure F.2 Levy County A-3 Soil, Deformation under 20 psi Plate Load (Water Table at 0.0 in., without Limerock, Test 1-2)
Levy County A-3 Soil (Deformation), Test 1-2
0.00
0.50
1.00
1.50
2.00
2.50
3.00
1 10 100 1000 10000 100000
Number of Cycles
Def
orm
atio
n, m
m
PermanentTotalResilient
20 psi
Subgrade
Embankment
0.0 in.

257
Figure F.3 Levy County A-3 Soil, Deformation under 20 psi Plate Load (Water Table at 12 in., without Limerock, Test 1-3) Figure F.4 Levy County A-3 Soil, Deformation under 20 psi Plate Load (Water Table at 12 in., with Limerock, Test 1-4)
Levy County A-3 Soil (Deformation), Test 1-3
0.00
0.50
1.00
1.50
2.00
2.50
3.00
1 10 100 1000 10000 100000
Number of Cycles
Def
orm
atio
n, m
m
PermanentTotalResilient
20 psi
Subgrade
Embankment
+12 in.
Levy County A-3 Soil (Deformation), Test 1-4
0.00
0.50
1.00
1.50
2.00
2.50
3.00
1 10 100 1000 10000 100000
Number of Cycles
Def
orm
atio
n, m
m
PermanentTotalResilient
20 psi
Subgrade
Embankment
+12 in.
Limerock

258
Levy County A-3 Soil (Deformation), Test 1-5
0.00
1.00
2.00
3.00
4.00
5.00
6.00
7.00
8.00
1 10 100 1000 10000 100000
Number of Cycles
Def
orm
atio
n,
mm
PermanentTotalResilient
50 psi
Subgrade
Embankment
+12 in.
Limerock
Figure F.5 Levy County A-3 Soil, Deformation under 20 psi Plate Load (Water Table at 36 in., with Limerock, Test 1-5)
Levy County A-3 Soil (Deformation), Test 1-6
0.00
1.00
2.00
3.00
4.00
5.00
6.00
7.00
8.00
1 10 100 1000 10000 100000
Number of Cycles
Def
orm
atio
n, m
m
PermanentTotalResilient
50 psi
Subgrade
Embankment
+36 in.
Limerock
Figure F.6 Levy County A-3 Soil, Deformation under 50 psi Plate Load (Water Table at 36 in., with Limerock, Test 1-6)

259
Levy County A-3 Soil (Deformation), Test 1-7
0.00
0.50
1.00
1.50
2.00
2.50
3.00
1 10 100 1000 10000 100000
Number of Cycles
Def
orm
atio
n,
mm
PermanentTotalResilient
20 psi
Subgrade
Embankment
+36 in.
Limerock
Figure F.7 Levy County A-3 Soil, Deformation under 50 psi Plate Load (Water Table at 36 in., with Limerock, Test 1-7)
Levy A3 Resilient Deformation v.s. Load Cycles (20 psi Plate Load)
0.00000
0.00100
0.00200
0.00300
0.00400
0.00500
0.00600
0.00700
0.00800
0.00900
0.01000
1 10 100 1000 10000 100000
Load Cycles
Res
ilien
t Def
orm
atio
n (in
ch)
Test 1-1 : Base Clearance 5 ft _1Test 1-2 : Base Clearance 3 ft _1Test 1-3 : Base Clearance 2 ft _1Test 1-4 : Base Clearance 2 ft _2 (w/ Limerock Base Layer)Test 1-7 : Base Clearance 0 ft _1
Figure F.8 Levy County A-3 Soil, Deformation Summary under 20 psi Plate Load at Different Water Table Level

260
Levy A3 Resilient Deformation v.s. Load Cycles (50 psi Plate Load)
0.00000
0.00200
0.00400
0.00600
0.00800
0.01000
0.01200
0.01400
0.01600
0.01800
1 10 100 1000 10000 100000
Load Cycles
Res
ilien
t Def
orm
atio
n (in
ch)
Test 1-5 : Base Clearance 2 ft _1
Test 1-6 : Base Clearance 0 ft _1
Figure F.9 Levy County A-3 Soil, Deformation Summary under 50 psi Plate Load at Different Water Table Level

261
F.2 SR70 A-3, 8% SOIL

262
Table F.5 SR-70 A-3 Soil Plate Load Test, 20 psi w/o Limerock
Permanent Total Resilient Permanent Total Resilientmm mm mm mm mm mm
1 0.8044 0.9711 0.1667 1 0.4039 0.6858 0.28194 1.0538 1.2754 0.2216 4 0.5690 0.7976 0.22865 1.0936 1.3213 0.2277 5 0.6020 0.8407 0.238810 1.2406 1.4546 0.2140 10 0.7264 0.9550 0.228625 1.4695 1.6629 0.1934 25 0.9144 1.1125 0.198150 1.6559 1.8380 0.1820 50 1.0516 1.2243 0.1727
100 1.7845 1.9600 0.1755 100 1.1862 1.3411 0.1549200 1.9999 2.1832 0.1834 200 1.3056 1.4707 0.1626500 2.1815 2.3583 0.1768 500 1.4376 1.5951 0.16001000 2.2861 2.4638 0.1777 1000 1.5138 1.6764 0.16512000 2.3675 2.5381 0.1707 2000 1.5748 1.7501 0.17275000 2.4458 2.6130 0.1672 5000 1.6637 1.8313 0.1676
10000 2.5097 2.6650 0.1553 10000 1.7297 1.8999 0.170215000 2.5583 2.6987 0.1405 15000 1.8390 2.0066 0.170220000 2.5915 2.7254 0.1339 20000 1.8923 2.0599 0.165125000 2.6186 2.7603 0.1417 25000 1.9431 2.1057 0.1626
30000 1.9837 2.1463 0.1626
Deformation with W.T. at 0.0 in., Test 2-1 Deformation with W.T. at 12.0 in., Test 2-2
Load Cycles
Load Cycles
Table F.6 SR-70 A-3 Soil Plate Load Test, 50 psi w/Limerock
Permanent Total Resilient Permanent Total Resilientmm mm mm mm mm mm
1 0.5766 0.8839 0.3073 1 0.1121 0.3786 0.26654 0.7061 0.9804 0.2718 4 0.1051 0.3457 0.24075 0.7239 0.9982 0.2743 5 0.1046 0.3523 0.2477
10 0.7823 1.0617 0.2794 10 0.1090 0.3624 0.253425 0.8788 1.1557 0.2769 25 0.1195 0.3681 0.248650 0.9677 1.2446 0.2769 50 0.1243 0.3803 0.2560
100 1.0541 1.3360 0.2819 100 0.1300 0.3873 0.2573200 1.1455 1.4199 0.2718 200 0.1392 0.4044 0.2652500 1.2522 1.5240 0.2718 500 0.1606 0.4328 0.2722
1000 1.3284 1.6027 0.2743 1000 0.1825 0.4687 0.28622000 1.4122 1.6866 0.2743 2000 0.2245 0.5230 0.29845000 1.5494 1.8186 0.2692 5000 0.3576 0.6512 0.2936
10000 1.6942 1.9507 0.2565 10000 0.5449 0.8525 0.307615000 1.8085 2.0549 0.2489 15000 0.7107 1.0249 0.314220000 1.9101 2.1514 0.2413 20000 0.8757 1.1930 0.317325000 2.0066 2.2403 0.2337 25000 1.0319 1.3509 0.319030000 2.0904 2.3190 0.2311 30000 1.1719 1.4940 0.3221
Load Cycles
Deformation with W.T.at 12.0 in., Test 2-3 Deformation with W.T. at +36.0 in., Test 2-4Load
Cycles

263
Table F.6 – Continued
Permanent Total Resilient Permanent Total Resilientmm mm mm mm mm mm
1 0.7287 1.1299 0.4013 1 0.4175 0.7483 0.33084 1.0083 1.2153 0.2070 4 0.5182 0.8205 0.30245 1.0337 1.2525 0.2188 5 0.5304 0.8542 0.323810 1.1229 1.3658 0.2429 10 0.6022 0.9273 0.325125 1.2914 1.5448 0.2534 25 0.7195 1.0350 0.315550 1.4809 1.7373 0.2564 50 0.8153 1.1387 0.3234100 1.6056 1.9561 0.3505 100 0.9107 1.2446 0.3339200 1.7404 2.0839 0.3435 200 1.0118 1.3426 0.3308500 1.9286 2.2721 0.3435 500 1.1347 1.4691 0.3343
1000 2.0861 2.4191 0.3330 1000 1.2284 1.5702 0.34182000 2.2611 2.5928 0.3317 2000 1.3444 1.6931 0.34885000 2.5447 2.8852 0.3405 5000 1.5290 1.8769 0.347910000 2.8239 3.1622 0.3383 10000 1.7189 2.0668 0.347915000 3.0571 3.3748 0.3177 15000 1.8585 2.2108 0.352320000 3.2374 3.5783 0.3409 20000 1.9911 2.3316 0.340525000 3.4274 3.7577 0.3304 25000 2.0927 2.4476 0.354930000 3.5862 3.9122 0.3260 30000 2.2078 2.5570 0.3492
Permanent Total Resilient Permanent Total Resilientmm mm mm mm mm mm
1 0.1042 0.3055 0.2013 1 0.0884 0.2407 0.15234 0.1961 0.2788 0.0827 4 0.0819 0.2105 0.12875 0.1974 0.2880 0.0906 5 0.0827 0.2280 0.145310 0.2040 0.2967 0.0928 10 0.0902 0.2372 0.147025 0.2167 0.3059 0.0893 25 0.0981 0.2433 0.145350 0.2215 0.3103 0.0888 50 0.1007 0.2644 0.1637100 0.2324 0.3208 0.0884 100 0.1108 0.2604 0.1497200 0.2315 0.3506 0.1190 200 0.1125 0.2622 0.1497500 0.2390 0.3650 0.1260 500 0.1090 0.2626 0.1536
1000 0.2447 0.3729 0.1282 1000 0.1033 0.2595 0.15622000 0.2460 0.3794 0.1335 2000 0.0968 0.2578 0.16105000 0.2464 0.3869 0.1405 5000 0.0928 0.2613 0.168510000 0.2517 0.3939 0.1422 10000 0.0994 0.2731 0.173715000 0.2482 0.3891 0.1409 15000 0.1055 0.2823 0.176820000 0.2517 0.3978 0.1462 20000 0.1151 0.2875 0.172425000 0.2574 0.4039 0.1466 25000 0.1248 0.3064 0.181630000 0.2622 0.4136 0.1514 30000 0.1331 0.3177 0.1847
Load Cycles
Load Cycles
Load Cycles
Load Cycles
Deformation with W.T. at -24.0 in., Test 2-6 Deformation with W.T. at -24.0 in., Test 2-7
Deformation with W.T. at +36.0 in., Test 2-5 Deformation with W.T. at +36.0 in., Test 2-8
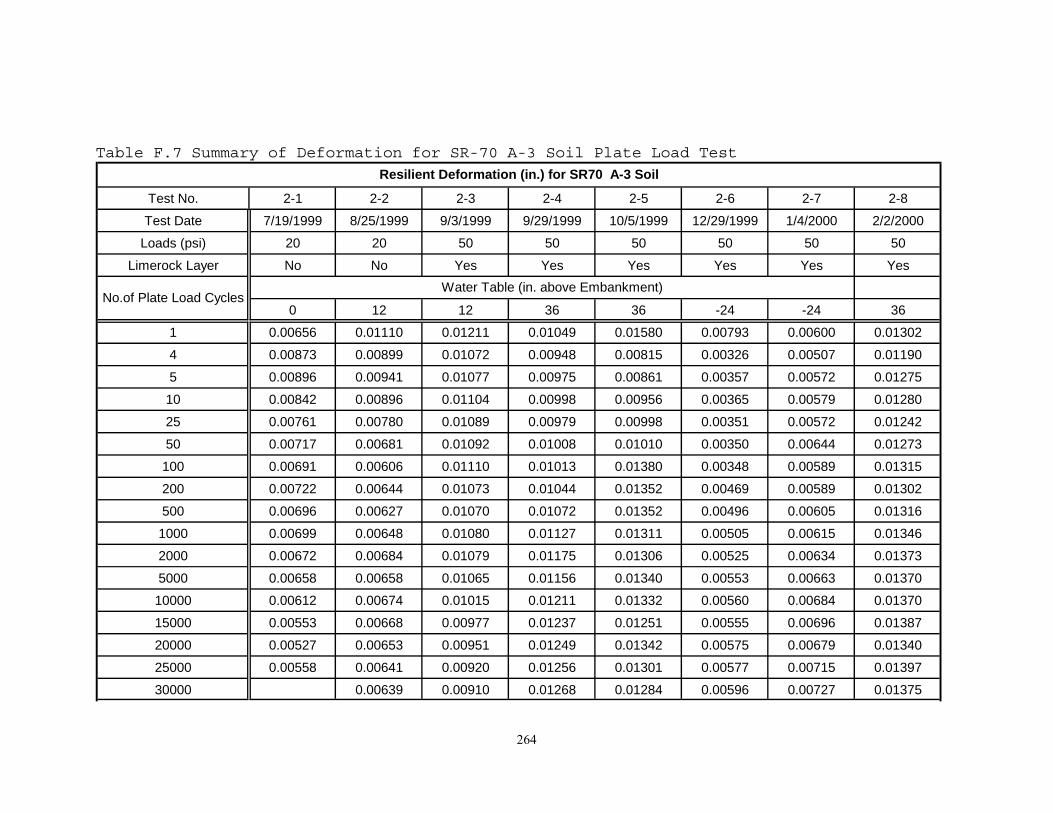
264
Table F.7 Summary of Deformation for SR-70 A-3 Soil Plate Load Test
Test No. 2-1 2-2 2-3 2-4 2-5 2-6 2-7 2-8
Test Date 7/19/1999 8/25/1999 9/3/1999 9/29/1999 10/5/1999 12/29/1999 1/4/2000 2/2/2000
Loads (psi) 20 20 50 50 50 50 50 50
Limerock Layer No No Yes Yes Yes Yes Yes Yes
0 12 12 36 36 -24 -24 36
1 0.00656 0.01110 0.01211 0.01049 0.01580 0.00793 0.00600 0.01302
4 0.00873 0.00899 0.01072 0.00948 0.00815 0.00326 0.00507 0.01190
5 0.00896 0.00941 0.01077 0.00975 0.00861 0.00357 0.00572 0.01275
10 0.00842 0.00896 0.01104 0.00998 0.00956 0.00365 0.00579 0.01280
25 0.00761 0.00780 0.01089 0.00979 0.00998 0.00351 0.00572 0.01242
50 0.00717 0.00681 0.01092 0.01008 0.01010 0.00350 0.00644 0.01273
100 0.00691 0.00606 0.01110 0.01013 0.01380 0.00348 0.00589 0.01315
200 0.00722 0.00644 0.01073 0.01044 0.01352 0.00469 0.00589 0.01302
500 0.00696 0.00627 0.01070 0.01072 0.01352 0.00496 0.00605 0.01316
1000 0.00699 0.00648 0.01080 0.01127 0.01311 0.00505 0.00615 0.01346
2000 0.00672 0.00684 0.01079 0.01175 0.01306 0.00525 0.00634 0.01373
5000 0.00658 0.00658 0.01065 0.01156 0.01340 0.00553 0.00663 0.01370
10000 0.00612 0.00674 0.01015 0.01211 0.01332 0.00560 0.00684 0.01370
15000 0.00553 0.00668 0.00977 0.01237 0.01251 0.00555 0.00696 0.01387
20000 0.00527 0.00653 0.00951 0.01249 0.01342 0.00575 0.00679 0.01340
25000 0.00558 0.00641 0.00920 0.01256 0.01301 0.00577 0.00715 0.01397
30000 0.00639 0.00910 0.01268 0.01284 0.00596 0.00727 0.01375
Water Table (in. above Embankment)No.of Plate Load Cycles
Resilient Deformation (in.) for SR70 A-3 Soil

265
Figure F.10 SR-70 A-3 Soil, Deformation under 20 psi Plate Load (Water Table at 0.0 in., without Limerock, Test 2-1) Figure F.11 SR-70 A-3 Soil, Deformation under 20 psi Plate Load (Water Table at 12 in., without Limerock, Test 2-2)
SR70 A-3 Soil (Deformation), Test 2-1
0.00
0.50
1.00
1.50
2.00
2.50
3.00
1 10 100 1000 10000 100000
Number of Cycles
Def
orm
atio
n, m
mPermanentTotalResilient
20 psi
Subgrade
Embankment
0.0 in.
SR70 A-3 Soil (Deformation), Test 2-2
0.00
0.50
1.00
1.50
2.00
2.50
3.00
1 10 100 1000 10000 100000
Number of Cycles
Def
orm
atio
n, m
m
PermanentTotalResilient
20 psi
Subgrade
Embankment
+12 in.

266
Figure F.12 SR-70 A-3 Soil, Deformation under 50 psi Plate Load (Water Table at +12 in., with Limerock, Test 2-3) Figure F.13 SR-70 A-3 Soil, Deformation under 50 psi Plate Load (Water Table at +36 in., with Limerock, Test 2-4)
SR70 A-3 Soil (Deformation), Test 2-3
0.00
0.50
1.00
1.50
2.00
2.50
3.00
1 10 100 1000 10000 100000
Number of Cycles
Def
orm
atio
n, m
m
PermanentTotalResilient
50 psi
Subgrade
Embankment
+12 in.
Limerock
SR70 A-3 (Deformation), Flooded, Test 2-4
0.00
0.50
1.00
1.50
2.00
2.50
3.00
1 10 100 1000 10000 100000
Number of Cycles
Def
orm
atio
n, m
m
PermanentTotalResilient
50 psi
Subgrade
Em bankm ent
+36 in.
Limerock

267
Figure F.14 SR-70 A-3 Soil, Deformation under 50 psi Plate Load (Water Table at +36 in., with Limerock, Test 2-5) Figure F.15 SR-70 A-3 Soil, Deformation under 50 psi Plate Load (Water Table at –24 in., with Limerock, Test 2-6)
SR70 A-3 (Deformation), Flooded, Test 2-5
0.00
0.50
1.00
1.50
2.00
2.50
3.00
3.50
4.00
4.50
1 10 100 1000 10000 100000Number of Cycles
Def
orm
atio
n, m
m
PermanentTotalResilient
50 psi
Subgrade
Embankment
+36 in.
Limerock
SR70 A-3 Soil (Deformation), Drained, Test 2-6
0.00
0.50
1.00
1.50
2.00
2.50
3.00
1 10 100 1000 10000 100000
Number of Cycles
Def
orm
atio
n, m
m
PermanentTotalResilient
50 psi
Subgrade
Embankment
Limerock
-24 in.

268
Figure F.16 SR-70 A-3 Soil, Deformation under 50 psi Plate Load (Water Table at –24 in., with Limerock, Test 2-7) Figure F.17 SR-70 A-3 Soil, Deformation under 50 psi Plate Load (Water Table at +36 in., with Limerock, Test 2-8)
SR70 A-3 Soil (Deformation), Drained, Test 2-7
0.00
0.50
1.00
1.50
2.00
2.50
3.00
1 10 100 1000 10000 100000
Number of Cycles
Def
orm
atio
n, m
m
PermanentTotalResilient
50 psi
Subgrade
Embankment
Limerock
-24 in.
SR70 A-3 (Deformation), Re-flooded, Test 2-8
0.00
0.50
1.00
1.50
2.00
2.50
3.00
1 10 100 1000 10000 100000
Number of Cycles
Def
orm
atio
n, m
m
PermanentTotalResilient
50 psi
Subgrade
Embankment
+36 in.
Limerock

269
SR70 A3 Resilient Deformation v.s. Load Cycles (20 psi Plate Load)
0.00000
0.00200
0.00400
0.00600
0.00800
0.01000
0.01200
1 10 100 1000 10000 100000
Load Cycles
Res
ilien
t Def
orm
atio
n (in
ch)
Test 2-1 : Base Clearance 3 ft _1Test 2-2 : Base Clearance 2 ft _1
Figure F.18 SR70 A-3 Soil, Deformation Summary under 20 psi Plate Load at Different Water Table Level
SR70 A3 Resilient Deformation v.s. Load Cycles (50 psi Plate Load)
0.00000
0.00200
0.00400
0.00600
0.00800
0.01000
0.01200
0.01400
0.01600
0.01800
0.02000
1 10 100 1000 10000 100000
Load Cycles
Res
ilien
t Def
orm
atio
n (in
ch)
Test 2-3 : Base Clearance 2 ft _1Test 2-4 : Base Clearance 0 ft _1Test 2-5 : Base Clearance 0 ft _2Test 2-6 : Base Clearance 5 ft _1 (Drawdown)Test 2-7 : Base Clearance 5 ft _2 (Drawdown)Test 2-8 : Base Clearance 0 ft _3 (Reflood)
Figure F.19 SR70 A-3 Soil, Deformation Summary under 50 psi Plate Load at Different Water Table Level

270
F.3 SR70 A-2-4, 14% SOIL

271
Table F.8 SR-70 A-2-4 Soil Plate Load Test, 20 psi w/o Limerock
Permanent Total Resilient Permanent Total Resilientmm mm mm mm mm mm
1 0.3173 0.5886 0.2713 1 0.9119 1.2090 0.29724 0.4210 0.5838 0.1628 4 1.0389 1.2319 0.19305 0.4315 0.5908 0.1593 5 1.0541 1.2395 0.1854
10 0.4648 0.6219 0.1571 10 1.0998 1.2776 0.175325 0.5112 0.6718 0.1606 25 1.1659 1.3437 0.177850 0.5453 0.7020 0.1567 50 1.2090 1.3919 0.1803100 0.5702 0.7330 0.1628 100 1.2446 1.4275 0.1803200 0.5899 0.7558 0.1659 200 1.2675 1.4529 0.1854500 0.6074 0.7711 0.1637 500 1.2903 1.4707 0.1803
1000 0.6118 0.7759 0.1641 1000 1.3005 1.4783 0.18032000 0.6171 0.7812 0.1641 2000 1.3081 1.4910 0.18295000 0.6319 0.7982 0.1663 5000 1.3233 1.5138 0.1905
10000 0.6586 0.8262 0.1676 10000 1.3513 1.5418 0.190515000 0.6884 0.8468 0.1584 15000 1.3741 1.5646 0.190520000 0.7129 0.8674 0.1545 20000 1.3945 1.5824 0.188025000 0.7286 0.8827 0.1540 25000 1.4072 1.5926 0.185430000 0.7440 0.9033 0.1593 30000 1.4173 1.6053 0.1905
Deformation with W.T. at 0.0 in., Test 3-1 Deformation with W.T. at +12.0 in., Test 3-2
Load Cycles
Load Cycles
Table F.9 SR-70 A-2-4 Soil Plate Load Test, 50 psi w/ Limerock
Permanent Total Resilientmm mm mm
1 0.5182 0.8687 0.35054 0.6020 0.8814 0.28195 0.6071 0.8712 0.2642
10 0.6325 0.9169 0.284525 0.6782 0.9652 0.284550 0.7163 1.0109 0.2946
100 0.7620 1.0516 0.2896200 0.8103 1.0973 0.2870500 0.8712 1.1659 0.2946
1000 0.9093 1.2192 0.30992000 0.9652 1.2776 0.31245000 1.0465 1.3665 0.3200
10000 1.1278 1.4605 0.332715000 1.1913 1.5240 0.332720000 1.2497 1.5723 0.320025000 1.3056 1.6104 0.304830000 1.3487 1.6586 0.3099
Load Cycles
Deformation with W.T. at +12.0 in., Test 3-3

272
Table F.9 Continued
Permanent Total Resilient Permanent Total Resilient
mm mm mm mm mm mm
1 0.5589 0.9873 0.4284 1 0.5899 0.9531 0.3632
4 0.6783 0.9168 0.2385 4 0.6709 0.8556 0.1847
5 0.6963 0.9348 0.2385 5 0.6801 0.8866 0.2065
10 0.7168 0.9623 0.2455 10 0.7046 0.9111 0.2065
25 0.7663 0.9960 0.2297 25 0.7405 0.9378 0.1974
50 0.8109 1.0179 0.2070 50 0.7553 0.9593 0.2039
100 0.8459 1.0682 0.2223 100 0.7816 0.9833 0.2017
200 0.9348 1.2722 0.3374 200 0.8065 1.0109 0.2044
500 0.9917 1.3247 0.3330 500 0.8411 1.0442 0.2030
1000 1.0433 1.3632 0.3199 1000 0.9203 1.0735 0.1532
2000 1.0796 1.3999 0.3203 2000 0.9549 1.1312 0.1764
5000 1.1444 1.4603 0.3159 5000 1.0337 1.2061 0.1724
10000 1.1951 1.5089 0.3138 10000 1.0884 1.2761 0.1877
15000 1.2323 1.5435 0.3111 15000 1.1404 1.3238 0.1834
20000 1.2603 1.5689 0.3085 20000 1.1763 1.3570 0.1807
25000 1.2827 1.5942 0.3116 25000 1.1921 1.3899 0.1978
30000 1.2971 1.6087 0.3116 30000 1.2113 1.4091 0.1978
Permanent Total Resilient Permanent Total Resilient
mm mm mm mm mm mm
1 0.8516 2.0030 1.1513 1 1.1776 2.1640 0.9864
200 2.5373 3.3298 0.7925 4 1.5487 2.4631 0.9144
500 3.2786 4.0776 0.7991 5 1.5899 2.4774 0.8876
1000 3.9897 4.7892 0.7995 10 1.7238 2.5299 0.8062
2000 4.8526 5.6574 0.8048 25 1.9636 2.7256 0.7620
5000 6.3068 7.0800 0.7732 50 2.1955 2.9197 0.7242
10000 7.6038 8.3307 0.7269 100 2.4813 3.1267 0.6455
15000 8.3933 9.0632 0.6700 200 2.8182 3.4733 0.6551
20000 8.9849 9.6413 0.6564 500 3.3578 4.0461 0.6883
25000 9.4798 10.1721 0.6923 1000 3.9092 4.6540 0.7448
30000 9.9122 10.6014 0.6892 2000 4.7297 5.5598 0.8301
5000 6.7623 7.6148 0.8525
10000 9.7971 10.9817 1.1846
15000 12.9803 14.3583 1.3780
20000 15.4068 16.4702 1.0634
Load Cycles
Load Cycles
Load Cycles
Load Cycles
Deformation with W.T. at +36.0 in., Test 3-4 Deformation with W.T. at +36.0 in., Test 3-7
Deformation with W.T. at -24.0 in., Test 3-5 Deformation with W.T. at -24.0 in., Test 3-6
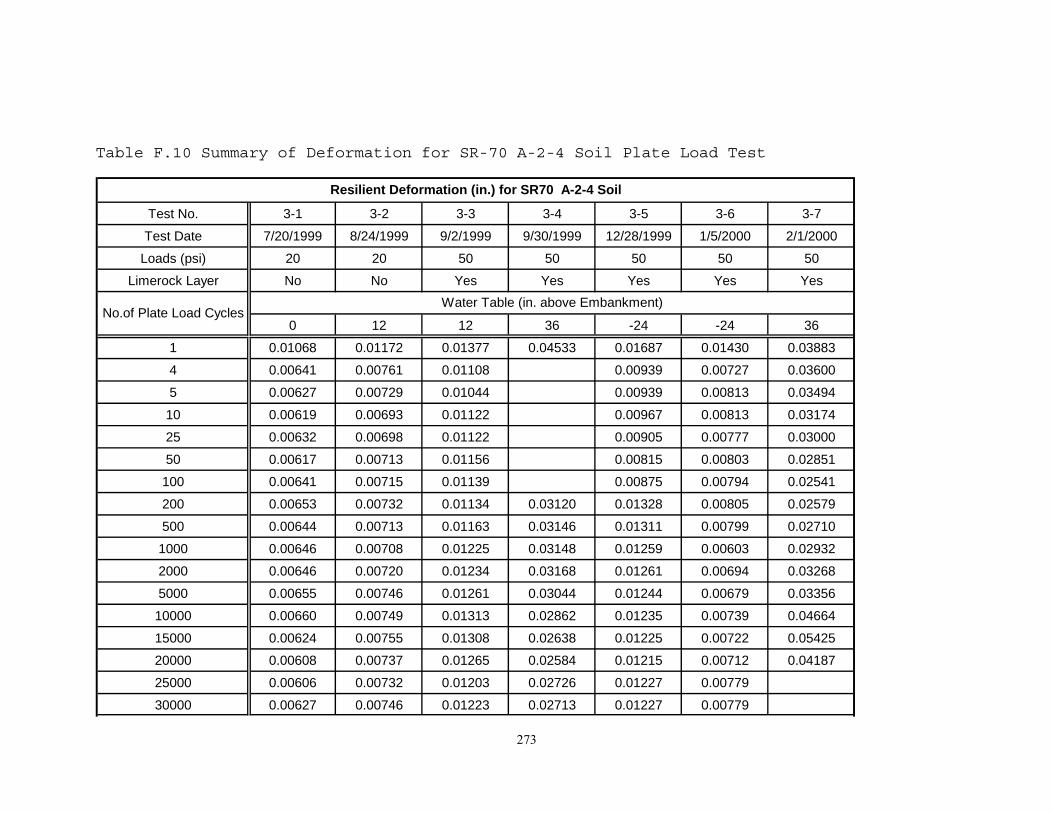
273
Table F.10 Summary of Deformation for SR-70 A-2-4 Soil Plate Load Test
Test No. 3-1 3-2 3-3 3-4 3-5 3-6 3-7
Test Date 7/20/1999 8/24/1999 9/2/1999 9/30/1999 12/28/1999 1/5/2000 2/1/2000
Loads (psi) 20 20 50 50 50 50 50
Limerock Layer No No Yes Yes Yes Yes Yes
0 12 12 36 -24 -24 36
1 0.01068 0.01172 0.01377 0.04533 0.01687 0.01430 0.03883
4 0.00641 0.00761 0.01108 0.00939 0.00727 0.03600
5 0.00627 0.00729 0.01044 0.00939 0.00813 0.03494
10 0.00619 0.00693 0.01122 0.00967 0.00813 0.03174
25 0.00632 0.00698 0.01122 0.00905 0.00777 0.03000
50 0.00617 0.00713 0.01156 0.00815 0.00803 0.02851
100 0.00641 0.00715 0.01139 0.00875 0.00794 0.02541
200 0.00653 0.00732 0.01134 0.03120 0.01328 0.00805 0.02579
500 0.00644 0.00713 0.01163 0.03146 0.01311 0.00799 0.02710
1000 0.00646 0.00708 0.01225 0.03148 0.01259 0.00603 0.02932
2000 0.00646 0.00720 0.01234 0.03168 0.01261 0.00694 0.03268
5000 0.00655 0.00746 0.01261 0.03044 0.01244 0.00679 0.03356
10000 0.00660 0.00749 0.01313 0.02862 0.01235 0.00739 0.04664
15000 0.00624 0.00755 0.01308 0.02638 0.01225 0.00722 0.05425
20000 0.00608 0.00737 0.01265 0.02584 0.01215 0.00712 0.04187
25000 0.00606 0.00732 0.01203 0.02726 0.01227 0.00779
30000 0.00627 0.00746 0.01223 0.02713 0.01227 0.00779
Water Table (in. above Embankment)No.of Plate Load Cycles
Resilient Deformation (in.) for SR70 A-2-4 Soil
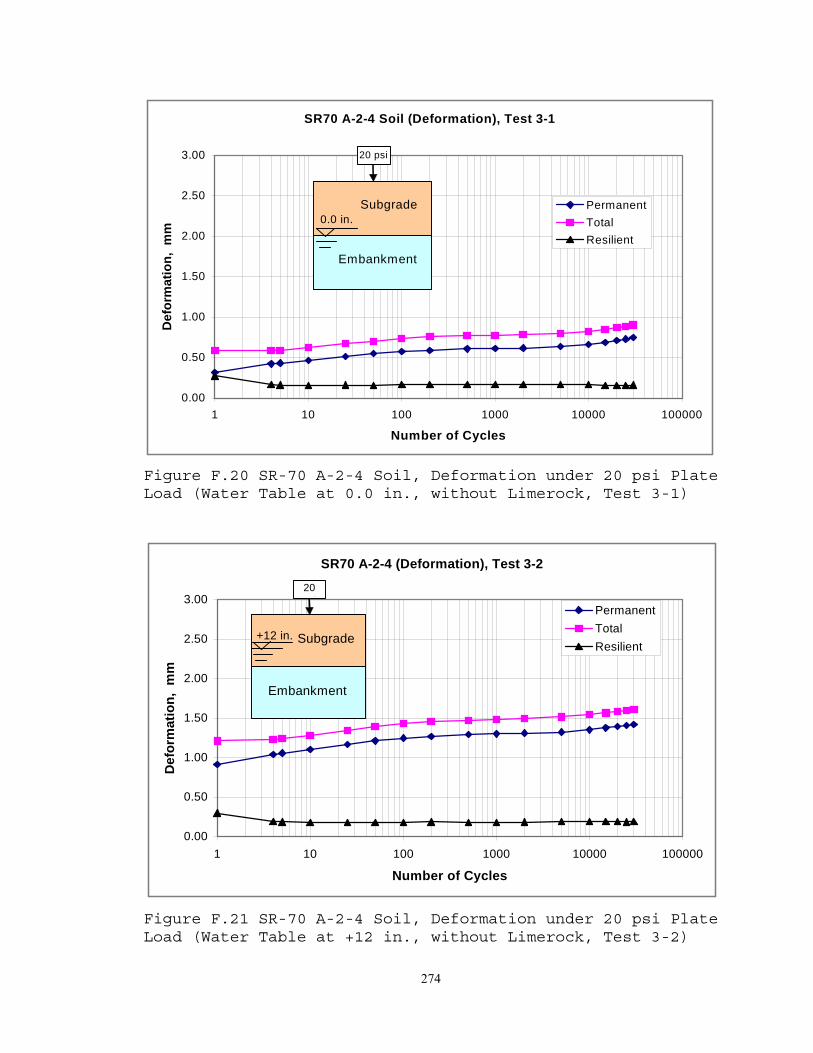
274
Figure F.20 SR-70 A-2-4 Soil, Deformation under 20 psi Plate Load (Water Table at 0.0 in., without Limerock, Test 3-1) Figure F.21 SR-70 A-2-4 Soil, Deformation under 20 psi Plate Load (Water Table at +12 in., without Limerock, Test 3-2)
SR70 A-2-4 Soil (Deformation), Test 3-1
0.00
0.50
1.00
1.50
2.00
2.50
3.00
1 10 100 1000 10000 100000
Number of Cycles
Def
orm
atio
n, m
m
PermanentTotalResilient
20 psi
Subgrade
Embankment
0.0 in.
SR70 A-2-4 (Deformation), Test 3-2
0.00
0.50
1.00
1.50
2.00
2.50
3.00
1 10 100 1000 10000 100000
Number of Cycles
Def
orm
atio
n, m
m
PermanentTotalResilient
20 i
Subgrade
Embankment
+12 in.

275
Figure F.22 SR-70 A-2-4 Soil, Deformation under 50 psi Plate Load (Water Table at +12 in., with Limerock, Test 3-3) Figure F.23 SR-70 A-2-4 Soil, Deformation under 50 psi Plate Load (Water Table at +36 in., with Limerock, Test 3-4)
SR70 A-2-4 Soil (Deformation), Test 3-3
0.00
0.50
1.00
1.50
2.00
2.50
3.00
1 10 100 1000 10000 100000
Number of Cycles
Def
orm
atio
n, m
mPermanentTotalResilient
50 psi
Subgrade
Embankment
+12 in.
Limerock
SR70 A-2-4 Soil (Deformation), Flooded, Test 3-4
0.00
2.00
4.00
6.00
8.00
10.00
12.00
1 10 100 1000 10000 100000
Number of Cycles
Def
orm
atio
n, m
m
PermanentTotalResilient
50 psi
Subgrade
Embankment
+36 in.
Limerock

276
Figure F.24 SR-70 A-2-4 Soil, Deformation under 50-psi Plate Load (Water Table at –24 in., with Limerock, Test 3-5) Figure F.25 SR-70 A-2-4 Soil, Deformation under 50 psi Plate Load (Water Table at –24 in., with Limerock, Test 3-6)
SR70 A-2-4 Soil (Deformation), Drained, Test 3-5
0.00
0.50
1.00
1.50
2.00
2.50
3.00
1 10 100 1000 10000 100000
Number of Cycles
Def
orm
atio
n,
mm
PremanentTotalResilient
50 psi
Subgrade
Embankment
Limerock
-24 in.
SR70 A-2-4 Soil (Deformation), Drained, Test 3-6
0.00
0.50
1.00
1.50
2.00
2.50
3.00
1 10 100 1000 10000 100000Number of Cycles
Def
orm
atio
n, m
m
PermanentTotalResilient
50 psi
Subgrade
Embankment
Limerock
-24 in.

277
Figure F.26 SR-70 A-2-4 Soil, Deformation under 50 psi Plate Load (Water Table at +36 in., with Limerock, Test 3-7)
SR70 A24 Resilient Deformation v.s. Load Cycles (20 psi Plate Load)
0.00000
0.00200
0.00400
0.00600
0.00800
0.01000
0.01200
0.01400
1 10 100 1000 10000 100000
Load Cycles
Res
ilien
t Def
orm
atio
n (in
ch)
Test 3-1 : Base Clearance 3 ft _1Test 3-2 : Base Clearance 2 ft _1
Figure F.27 SR70 A-2-4 Soil, Deformation Summary under 20 psi Plate Load at Different Water Table Level
SR70 A-2-4 Soil (Deformation), Re-flooded, Test 3-7
0.00
2.00
4.00
6.00
8.00
10.00
12.00
14.00
16.00
18.00
1 10 100 1000 10000 100000
Number of Cycles
Def
orm
atio
n, m
m
PermanentTotalResilient
50 psi
Subgrade
Embankment
+36 in.
Limerock

278
SR70 A24 Resilient Deformation v.s. Load Cycles (50 psi Plate Load)
0.00000
0.01000
0.02000
0.03000
0.04000
0.05000
0.06000
1 10 100 1000 10000 100000
Load Cycles
Res
ilien
t Def
orm
atio
n (in
ch)
Test 3-3 : Base Clearance 2 ft _1Test 3-4 : Base Clearance 0 ft _1 Test 3-5 : Base Clearance 5 ft _1 (Drawdown)Test 3-6 : Base Clearance 5 ft _2 (Drawdown)Test 3-7 : Base Clearance 0 ft _2
Figure F.28 SR70 A-2-4 Soil, Deformation Summary under 50 psi Plate Load at Different Water Table Level

279
F.4 A-2-4, 12% SOIL

280
Table F.11 A-2-4, 12% Soil Plate Load Test, 20 psi w/out Limerock
Permanent Total Resilient Permanent Total Resilient
(mm) (mm) (mm) (mm) (mm) (mm)
1 0.1787 0.3682 0.1895 1 0.5429 0.7858 0.2429
4 4
5 5
10 10
25 0.4146 0.5805 0.1659 25 0.6667 0.8829 0.2162
50 0.4943 0.6628 0.1685 50 0.7293 0.9438 0.2145
100 0.5739 0.7429 0.1690 100 0.8033 1.0147 0.2114
200 0.6527 0.8204 0.1676 200 0.8786 1.0856 0.2070
500 0.7521 0.9245 0.1725 500 0.9814 1.1779 0.1965
1000 0.8208 0.9924 0.1716 1000 1.0633 1.2515 0.1882
2000 0.8952 1.0685 0.1733 2000 1.1372 1.3267 0.1895
5000 1.0094 1.1876 0.1782 5000 1.2466 1.4226 0.1759
10000 1.1250 1.2856 0.1606 10000 1.3456 1.5189 0.1733
15000 1.1897 1.3495 0.1598 15000 1.4143 1.5876 0.173320000 1.2405 1.4060 0.1654 20000 1.4677 1.6366 0.168925000 1.2944 1.4559 0.1615 25000 1.5106 1.6817 0.171130000 1.3127 1.4804 0.1676 30000 1.5434 1.7093 0.1659
Permanent Total Resilient Permanent Total Resilient
(mm) (mm) (mm) (mm) (mm) (mm)
1 0.1398 0.3529 0.2131 1 0.3542 0.6562 0.30204 0.1748 0.3748 0.2000 4
5 5
10 0.1962 0.4124 0.2162 10
25 0.2286 0.4374 0.2088 25 0.8120 1.0637 0.251750 0.2531 0.4619 0.2088 50 0.9569 1.2051 0.2482
100 0.2837 0.4956 0.2118 100 1.0965 1.3442 0.2477200 0.3166 0.5293 0.2127 200 1.2335 1.4755 0.2420500 0.3647 0.5849 0.2202 500 1.4099 1.6467 0.2368
1000 0.4107 0.6396 0.2289 1000 1.5368 1.7832 0.24642000 0.4606 0.6965 0.2359 2000 1.6454 1.8835 0.23815000 0.5626 0.7993 0.2368 5000 1.8095 2.0467 0.2372
10000 0.6777 0.9140 0.2363 10000 1.9587 2.1929 0.234215000 0.7669 1.0042 0.2372 15000 2.0581 2.2883 0.230220000 0.8440 1.0816 0.2377 20000 2.1378 2.3614 0.223725000 0.9149 1.1504 0.2355 25000 2.2052 2.4288 0.223730000 0.9775 1.2112 0.2337 30000 2.2634 2.4853 0.2219
Deformation with W.T. at +0 in., Test 4-3
Load Cycles
Deformation with W.T. at +0 in., Test 4-4
Load Cycles
Deformation with W.T. at -24 in., Test 4-1 Deformation with W.T. at -24 in., Test 4-2
Load Cycles
Load Cycles

281
Table F.11 Continued
Permanent Total Resilient Permanent Total Resilient
(mm) (mm) (mm) (mm) (mm) (mm)
1 0.2198 0.4807 0.2609 1 0.2190 0.4558 0.2368
4 0.3091 0.5272 0.2181 4 0.3004 0.5140 0.2136
5 0.3249 0.5500 0.2251 5 0.3126 0.5281 0.2154
10 0.3949 0.6243 0.2293 10 0.3665 0.5853 0.2188
25 0.5306 0.7516 0.2210 25 0.4623 0.6742 0.2118
50 0.6527 0.8785 0.2258 50 0.5520 0.7783 0.2263
100 0.7884 1.0138 0.2254 100 0.6470 0.8751 0.2280
200 0.9424 1.1652 0.2228 200 0.7543 0.9858 0.2315
500 1.1762 1.3823 0.2061 500 0.9123 1.1302 0.2180
1000 1.3784 1.5736 0.1952 1000 1.0370 1.2628 0.2258
2000 1.5937 1.7959 0.2022 2000 1.1797 1.4138 0.2342
5000 1.9092 2.1250 0.2158 5000 1.3876 1.6239 0.2363
10000 2.2112 2.4358 0.2246 10000 1.5876 1.8222 0.2346
15000 2.4278 2.6498 0.2220 15000 1.7390 1.9727 0.233720000 2.5986 2.8393 0.2407 20000 1.8603 2.0909 0.230725000 2.7487 2.9750 0.2263 25000 1.9644 2.1933 0.228930000 2.8678 3.0953 0.2276 30000 2.0572 2.2883 0.2311
40000 2.2143 2.4415 0.2272
50000 2.3566 2.5811 0.2245
60000 2.4853 2.7111 0.2258
70000 2.6052 2.8293 0.2241
80000 2.7190 2.9391 0.2202
90000 2.8302 3.0542 0.2241
100000 2.9299 3.1510 0.2210
Deformation with W.T. at 12 in., Test 4-5 Deformation with W.T. at 12 in., Test 4-6
Load Cycles
Load Cycles

282
Table F.12 A-2-4, 12% Soil Plate Load Test, 50 psi w/ Limerock
Permanent Total Resilient Permanent Total Resilient(mm) (mm) (mm) (mm) (mm) (mm)
1 0.7227 1.1302 0.4075 1 0.4225 0.8077 0.3852
4 0.9398 1.2768 0.3370 4 0.5271 0.8856 0.3585
5 0.9613 1.2909 0.3296 5 0.5459 0.9144 0.3685
10 1.0558 1.4681 0.4123 10 0.6238 0.9749 0.3510
25 1.2042 1.6077 0.4035 25 0.7284 1.0891 0.3606
50 1.3324 1.7281 0.3957 50 0.8199 1.1740 0.3541
100 1.5018 1.8629 0.3611 100 0.9131 1.2615 0.3484
200 1.6257 1.9837 0.3580 200 1.0160 1.3626 0.3466
500 1.7876 2.1344 0.3468 500 1.1477 1.4848 0.3370
1000 1.9040 2.2450 0.3410 1000 1.2418 1.5762 0.3344
2000 2.0266 2.3566 0.3300 2000 1.3491 1.6769 0.3278
5000 2.2244 2.5444 0.3199 5000 1.5014 1.8253 0.3239
10000 2.4376 2.7492 0.3116 10000 1.6751 2.0021 0.3269
15000 2.6704 2.9545 0.2841 15000 1.8056 2.1238 0.318220000 2.8118 3.0915 0.2797 20000 1.9119 2.2244 0.312525000 2.9252 3.2035 0.2784 25000 1.9933 2.3137 0.320430000 3.0280 3.3051 0.2770 30000 2.0695 2.3776 0.308140000 3.1943 3.4871 0.292850000 3.3488 3.6281 0.279260000 3.4946 3.7852 0.290670000 3.6197 3.9082 0.288480000 3.7366 4.0229 0.286290000 3.8452 4.1314 0.2862
100000 3.9511 4.2369 0.2858
Deformation with W.T. at +12 in., Test 4-8
Load CyclesLoad Cycles
Deformation with W.T. at +12 in., Test 4-7
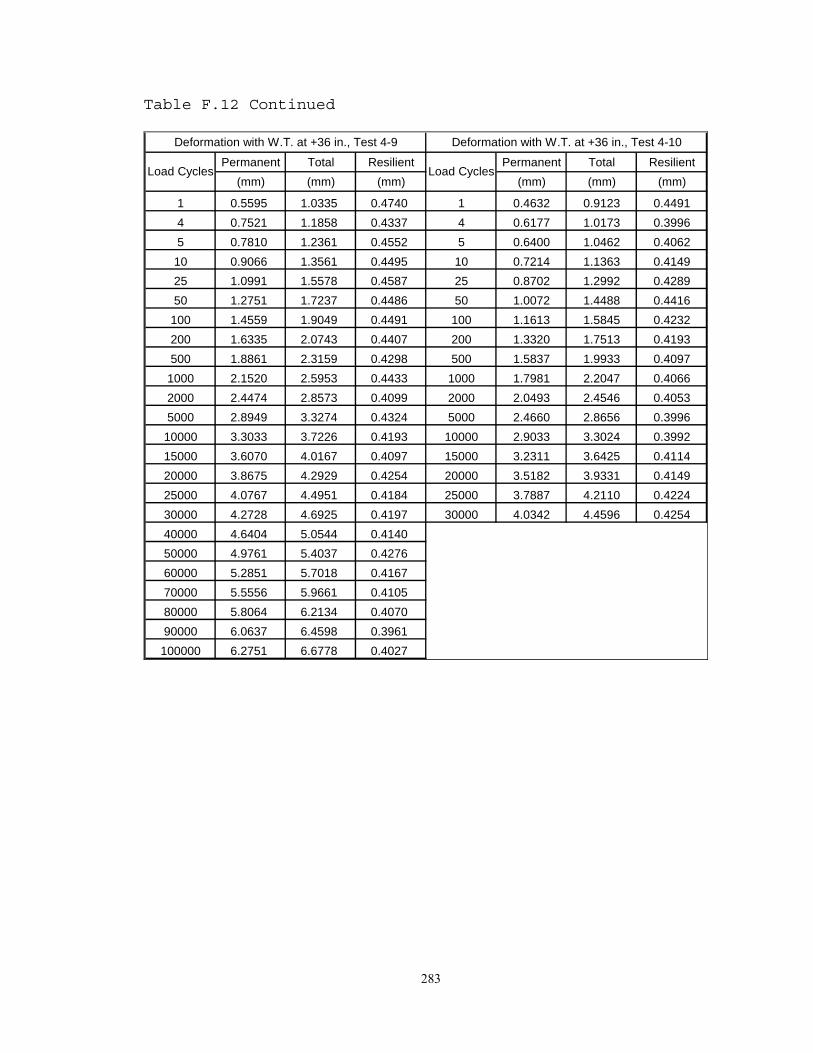
283
Table F.12 Continued
Permanent Total Resilient Permanent Total Resilient(mm) (mm) (mm) (mm) (mm) (mm)
1 0.5595 1.0335 0.4740 1 0.4632 0.9123 0.44914 0.7521 1.1858 0.4337 4 0.6177 1.0173 0.39965 0.7810 1.2361 0.4552 5 0.6400 1.0462 0.4062
10 0.9066 1.3561 0.4495 10 0.7214 1.1363 0.414925 1.0991 1.5578 0.4587 25 0.8702 1.2992 0.428950 1.2751 1.7237 0.4486 50 1.0072 1.4488 0.4416
100 1.4559 1.9049 0.4491 100 1.1613 1.5845 0.4232200 1.6335 2.0743 0.4407 200 1.3320 1.7513 0.4193500 1.8861 2.3159 0.4298 500 1.5837 1.9933 0.4097
1000 2.1520 2.5953 0.4433 1000 1.7981 2.2047 0.40662000 2.4474 2.8573 0.4099 2000 2.0493 2.4546 0.40535000 2.8949 3.3274 0.4324 5000 2.4660 2.8656 0.3996
10000 3.3033 3.7226 0.4193 10000 2.9033 3.3024 0.399215000 3.6070 4.0167 0.4097 15000 3.2311 3.6425 0.411420000 3.8675 4.2929 0.4254 20000 3.5182 3.9331 0.414925000 4.0767 4.4951 0.4184 25000 3.7887 4.2110 0.422430000 4.2728 4.6925 0.4197 30000 4.0342 4.4596 0.425440000 4.6404 5.0544 0.414050000 4.9761 5.4037 0.427660000 5.2851 5.7018 0.416770000 5.5556 5.9661 0.410580000 5.8064 6.2134 0.407090000 6.0637 6.4598 0.3961
100000 6.2751 6.6778 0.4027
Load Cycles Load Cycles
Deformation with W.T. at +36 in., Test 4-10Deformation with W.T. at +36 in., Test 4-9

284
Table F.13 Summary of Deformation for A-2-4 (12%) Soil Plate Load Test
Test No. 4-1 4-2 4-3 4-4 4-5 4-6 4-7 4-8 4-9 4-10Test Date 8/3/00 8/42000 9/19/00 9/19/00 11/1/00 11/1/00 12/14/00 12/21/00 2/26/01 2/28/01
Loads (psi) 20 20 20 20 20 20 50 50 50 50Limerock Layer No No No No No No Yes Yes Yes Yes
-24 -24 0 0 12 12 12 12 36 361 0.00746 0.00956 0.00839 0.01189 0.01027 0.00932 0.01604 0.01516 0.01866 0.017684 0.00787 0.00787 0.00858 0.00841 0.01327 0.01411 0.01708 0.015735 0.00851 0.00886 0.00848 0.01298 0.01451 0.01792 0.0159910 0.00822 0.00851 0.00903 0.00862 0.01623 0.01382 0.01770 0.0163425 0.00653 0.00851 0.00822 0.00991 0.00870 0.00834 0.01589 0.01420 0.01806 0.0168950 0.00663 0.00844 0.00834 0.00977 0.00889 0.00891 0.01558 0.01394 0.01766 0.01739100 0.00665 0.00832 0.00837 0.00975 0.00887 0.00898 0.01422 0.01372 0.01768 0.01666200 0.00660 0.00815 0.00867 0.00953 0.00877 0.00912 0.01410 0.01365 0.01735 0.01651500 0.00679 0.00774 0.00901 0.00932 0.00812 0.00858 0.01365 0.01327 0.01692 0.016131000 0.00676 0.00741 0.00929 0.00970 0.00769 0.00889 0.01342 0.01316 0.01745 0.016012000 0.00682 0.00746 0.00932 0.00937 0.00796 0.00922 0.01299 0.01291 0.01614 0.015965000 0.00701 0.00693 0.00930 0.00934 0.00850 0.00930 0.01260 0.01275 0.01702 0.0157310000 0.00632 0.00682 0.00934 0.00922 0.00884 0.00924 0.01227 0.01287 0.01651 0.0157215000 0.00629 0.00682 0.00936 0.00906 0.00874 0.00920 0.01118 0.01253 0.01613 0.0162020000 0.00651 0.00665 0.00927 0.00881 0.00948 0.00908 0.01101 0.01230 0.01675 0.0163425000 0.00636 0.00674 0.00920 0.00881 0.00891 0.00901 0.01096 0.01261 0.01647 0.0166330000 0.00660 0.00653 0.00874 0.00896 0.00910 0.01091 0.01213 0.01652 0.01675
Average from 10,000 Cycles 0.00642 0.00671 0.00929 0.00893 0.00899 0.00913 0.01127 0.01249 0.01648 0.01633
No.of Plate Load Cycles
Resilient Deformation (in.) for A-2-4, 12% Soil
Water Table (in. above Embankment)

285
A- 2- 4 ( 12%) Soi l ( Def or mat i on) , Test 4- 1
0. 00
0. 20
0. 40
0. 60
0. 80
1. 00
1. 20
1. 40
1. 60
1 10 100 1000 10000 100000Number of Cycl es
Defo
rmat
ion,
mm
Per manentTot alResi l i ent
Figure F.29 A-2-4 (12%) Soil, Deformation under 20 psi Plate Load (Water Table at -24.0 in., w/out Limerock, Test 4-1)
A- 2- 4 ( 12%) Soi l ( Def or mat i on) , Test 4- 2
0. 00
0. 20
0. 40
0. 60
0. 80
1. 00
1. 20
1. 40
1. 60
1. 80
1 10 100 1000 10000 100000Number of Cycl es
Defo
rmat
ion,
mm
Per manentTot alResi l i ent
Figure F.30 A-2-4 (12%) Soil, Deformation under 20 psi Plate Load (Water Table at -24.0 in., w/out Limerock, Test 4-2)

286
A- 2- 4 ( 12%) Soi l ( Def or mat i on) , Test 4- 3
0. 00
0. 20
0. 40
0. 60
0. 80
1. 00
1. 20
1. 40
1 10 100 1000 10000 100000Number of Cycl es
Defo
rmat
ion,
mm
Per manentTot alResi l i ent
Figure F.31 A-2-4 (12%) Soil, Deformation under 20 psi Plate Load (Water Table at 0.0 in., w/out Limerock, Test 4-3)
A- 2- 4 ( 12%) Soi l ( Def or mat i on) , Test 4- 4
0. 00
0. 50
1. 00
1. 50
2. 00
2. 50
3. 00
1 10 100 1000 10000 100000Number of Cycl es
Defo
rmat
ion,
mm
Per manentTot alResi l i ent
Figure F.32 A-2-4 (12%) Soil, Deformation under 20 psi Plate Load (Water Table at 0.0 in., w/out Limerock, Test 4-4)

287
A- 2- 4 ( 12%) Soi l ( Def or mat i on) , Test 4- 5
0. 00
0. 50
1. 00
1. 50
2. 00
2. 50
3. 00
3. 50
1 10 100 1000 10000 100000Number of Cycl es
Defo
rmat
ion,
mm
Per manentTot alResi l i ent
Figure F.33 A-2-4 (12%) Soil, Deformation under 20 psi Plate Load (Water Table at +12.0 in., no Limerock, Test 4-5)
A- 2- 4 ( 12%) Soi l ( Def or mat i on) , Test 4- 6
0. 00
0. 50
1. 00
1. 50
2. 00
2. 50
3. 00
3. 50
1 10 100 1000 10000 100000Number of Cycl es
Defo
rmat
ion,
mm
Per manentTot alResi l i ent
Figure F.34 A-2-4 (12%) Soil, Deformation under 20 psi Plate Load (Water Table at +12.0 in., no Limerock, Test 4-6)

288
A- 2- 4 ( 12%) Soi l ( Def or mat i on) , Test 4- 7
0. 00
0. 50
1. 00
1. 50
2. 00
2. 50
3. 00
3. 50
4. 00
4. 50
1 10 100 1000 10000 100000Number of Cycl es
Defo
rmat
ion
Per manentTot alResi l i ent
Figure F.35 A-2-4 (12%) Soil, Deformation under 50 psi Plate Load (Water Table at +12.0 in., with Limerock, Test 4-7)
A- 2- 4 ( 12%) Soi l ( Def or mat i on) , Test 4- 8
0. 00
0. 50
1. 00
1. 50
2. 00
2. 50
1 10 100 1000 10000 100000Number of Cycl es
Defo
rmat
ion
Per manentTot alResi l i ent
Figure F.36 A-2-4 (12%) Soil, Deformation under 50 psi Plate Load (Water Table at +12.0 in., with Limerock, Test 4-8)

289
A- 2- 4 ( 12%) Soi l ( Def or mat i on) , Test 4- 9
0. 00
1. 00
2. 00
3. 00
4. 00
5. 00
6. 00
7. 00
8. 00
1 10 100 1000 10000 100000Number of Cycl es
Defo
rmat
ion,
mm
Per manentTot alResi l i ent
Figure F.37 A-2-4 (12%) Soil, Deformation under 50 psi Plate Load (Water Table at +36.0 in., with Limerock, Test 4-9)
A- 2- 4 ( 12%) Soi l ( Def or mat i on) , Test 4- 10
0. 00
0. 50
1. 00
1. 50
2. 00
2. 50
3. 00
3. 50
4. 00
4. 50
5. 00
1 10 100 1000 10000 100000Number of Cycl es
Defo
rmat
ion,
mm
Per manentTot alResi l i ent
Figure F.38 A-2-4 (12%) Soil, Deformation under 50 psi Plate Load (Water Table at +36.0 in., with Limerock, Test 4-10)

290
A-2-4 (12%) Resilient Deformation v.s. Load Cycles (20 psi Plate Load)
0.00000
0.00200
0.00400
0.00600
0.00800
0.01000
0.01200
0.01400
1 10 100 1000 10000 100000
Load Cycles
Res
ilien
t Def
orm
atio
n (in
ch)
Test 4-1 : Base Clearance 5 ft _1Test 4-2 : Base Clearance 5 ft _2Test 4-3 : Base Clearance 3 ft _1Test 4-4 : Base Clearance 3 ft _2 Test 4-5 : Base Clearance 2 ft _1Test 4-6 : Base Clearance 2 ft _2
Figure F.39 A-2-4 (12%) Soil, Deformation Summary under 20 psi Plate Load at Different Water Table Level
A-2-4 (12%) Resilient Deformation v.s. Load Cycles (50 psi Plate Load)
0.00000
0.00200
0.00400
0.00600
0.00800
0.01000
0.01200
0.01400
0.01600
0.01800
0.02000
1 10 100 1000 10000 100000
Load Cycles
Res
ilien
t Def
orm
atio
n (in
ch)
Test 4-7 : Base Clearance 2 ft _1Test 4-8 : Base Clearance 2 ft _2Test 4-9 : Base Clearance 0 ft _1Test 4-10 : Base Clearance 0 ft _2
Figure F.40 A-2-4 (12%) Soil, Deformation Summary under 50 psi Plate Load at Different Water Table Level

291
F.5 A-2-4, 20% SOIL
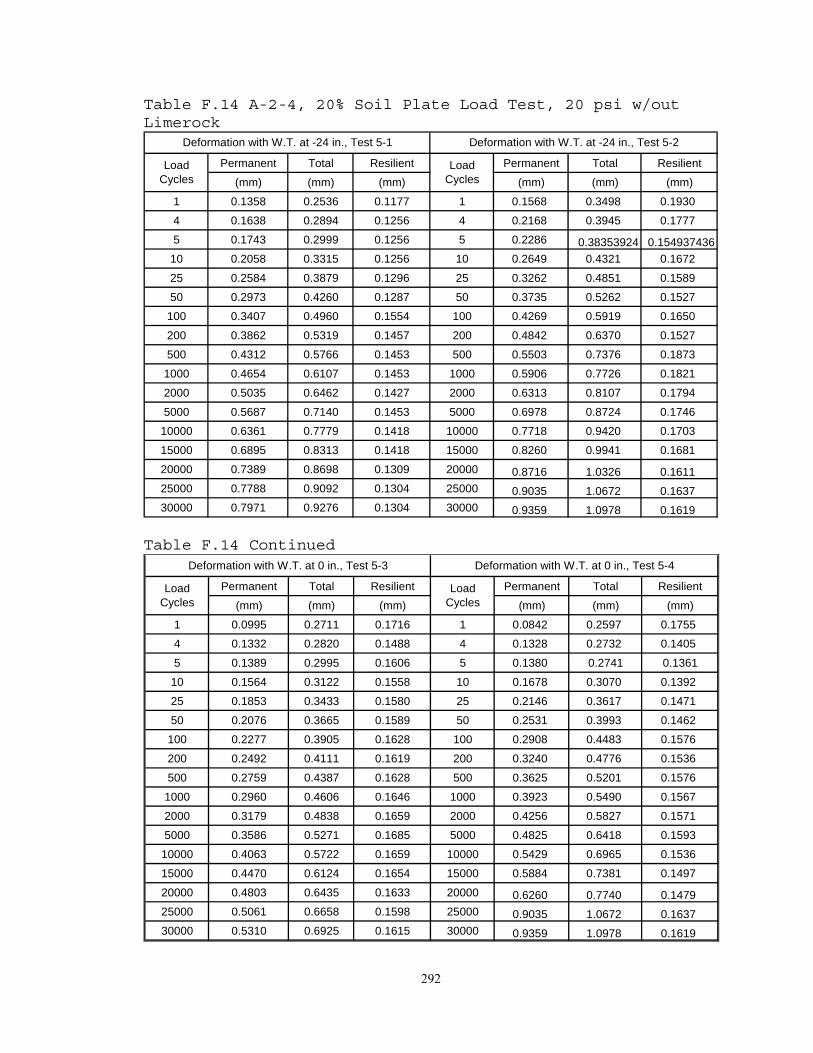
292
Table F.14 A-2-4, 20% Soil Plate Load Test, 20 psi w/out Limerock
Permanent Total Resilient Permanent Total Resilient
(mm) (mm) (mm) (mm) (mm) (mm)
1 0.1358 0.2536 0.1177 1 0.1568 0.3498 0.1930
4 0.1638 0.2894 0.1256 4 0.2168 0.3945 0.1777
5 0.1743 0.2999 0.1256 5 0.2286 0.38353924 0.15493743610 0.2058 0.3315 0.1256 10 0.2649 0.4321 0.1672
25 0.2584 0.3879 0.1296 25 0.3262 0.4851 0.1589
50 0.2973 0.4260 0.1287 50 0.3735 0.5262 0.1527
100 0.3407 0.4960 0.1554 100 0.4269 0.5919 0.1650
200 0.3862 0.5319 0.1457 200 0.4842 0.6370 0.1527
500 0.4312 0.5766 0.1453 500 0.5503 0.7376 0.1873
1000 0.4654 0.6107 0.1453 1000 0.5906 0.7726 0.1821
2000 0.5035 0.6462 0.1427 2000 0.6313 0.8107 0.1794
5000 0.5687 0.7140 0.1453 5000 0.6978 0.8724 0.1746
10000 0.6361 0.7779 0.1418 10000 0.7718 0.9420 0.1703
15000 0.6895 0.8313 0.1418 15000 0.8260 0.9941 0.1681
20000 0.7389 0.8698 0.1309 20000 0.8716 1.0326 0.161125000 0.7788 0.9092 0.1304 25000 0.9035 1.0672 0.163730000 0.7971 0.9276 0.1304 30000 0.9359 1.0978 0.1619
Deformation with W.T. at -24 in., Test 5-1 Deformation with W.T. at -24 in., Test 5-2
Load Cycles
Load Cycles
Table F.14 Continued
Permanent Total Resilient Permanent Total Resilient
(mm) (mm) (mm) (mm) (mm) (mm)
1 0.0995 0.2711 0.1716 1 0.0842 0.2597 0.1755
4 0.1332 0.2820 0.1488 4 0.1328 0.2732 0.1405
5 0.1389 0.2995 0.1606 5 0.1380 0.2741 0.1361
10 0.1564 0.3122 0.1558 10 0.1678 0.3070 0.1392
25 0.1853 0.3433 0.1580 25 0.2146 0.3617 0.1471
50 0.2076 0.3665 0.1589 50 0.2531 0.3993 0.1462
100 0.2277 0.3905 0.1628 100 0.2908 0.4483 0.1576
200 0.2492 0.4111 0.1619 200 0.3240 0.4776 0.1536
500 0.2759 0.4387 0.1628 500 0.3625 0.5201 0.1576
1000 0.2960 0.4606 0.1646 1000 0.3923 0.5490 0.1567
2000 0.3179 0.4838 0.1659 2000 0.4256 0.5827 0.1571
5000 0.3586 0.5271 0.1685 5000 0.4825 0.6418 0.1593
10000 0.4063 0.5722 0.1659 10000 0.5429 0.6965 0.1536
15000 0.4470 0.6124 0.1654 15000 0.5884 0.7381 0.1497
20000 0.4803 0.6435 0.1633 20000 0.6260 0.7740 0.147925000 0.5061 0.6658 0.1598 25000 0.9035 1.0672 0.163730000 0.5310 0.6925 0.1615 30000 0.9359 1.0978 0.1619
Deformation with W.T. at 0 in., Test 5-3 Deformation with W.T. at 0 in., Test 5-4
Load Cycles
Load Cycles

293
Table F.14 Continued
Permanent Total Resilient Permanent Total Resilient
(mm) (mm) (mm) (mm) (mm) (mm)
1 0.1292 0.2741 0.1449 1 0.1975 0.3704 0.1729
4 0.1568 0.2754 0.1186 4 0.2991 0.4365 0.1375
5 0.1524 0.2921 0.1396 5
10 0.1673 0.3008 0.1335 10 0.3687 0.5135 0.1449
25 0.1848 0.3174 0.1326 25 0.5245 0.6724 0.1479
50 0.2032 0.3402 0.1370 50 0.5897 0.7271 0.1374
100 0.2120 0.3595 0.1475 100 0.6085 0.7687 0.1602
200 0.2255 0.3787 0.1532 200 0.6291 0.7915 0.1624
500 0.2391 0.3945 0.1554 500 0.6518 0.8309 0.1790
1000 0.2457 0.4037 0.1580 1000 0.6742 0.8624 0.1882
2000 0.2641 0.4199 0.1558 2000 0.7127 0.9004 0.1878
5000 0.2969 0.4658 0.1689 5000 0.7678 0.9517 0.1838
10000 0.3420 0.5052 0.1633 10000 0.8304 1.0072 0.1768
15000 0.3757 0.5372 0.1615 15000 0.8790 1.0576 0.1786
20000 0.4094 0.5682 0.1589 20000 0.9201 1.0882 0.1681
25000 0.4343 0.5958 0.1615 25000 0.9512 1.1193 0.1681
30000 0.4544 0.6124 0.1580 30000 0.9884 1.1578 0.1694
40000 0.4969 0.6510 0.1541
50000 0.5328 0.6895 0.1567
60000 0.5704 0.7236 0.1532
70000 0.6011 0.7608 0.1598
80000 0.6313 0.7897 0.1584
90000 0.6619 0.8230 0.1611
100000 0.7070 0.8645 0.1576
Deformation with W.T. at +12 in., Test 5-5 Deformation with W.T. at +12 in., Test 5-6
Load Cycles
Load Cycles

294
Table F.15 A-2-4, 20% Soil Plate Load Test, 50 psi with Limerock
Permanent Total Resilient Permanent Total Resilient(mm) (mm) (mm) (mm) (mm) (mm)
1 0.5840 0.9906 0.4066 1 0.5227 0.8580 0.3353
4 0.7468 1.1040 0.3571 4 0.6536 0.9219 0.2683
5 0.7621 1.1381 0.3760 5 0.6624 0.9823 0.3199
10 0.8370 1.2020 0.3650 10 0.7153 1.0107 0.2954
25 0.9748 1.3884 0.4136 25 0.8077 1.1092 0.3016
50 1.0965 1.4825 0.3860 50 0.9018 1.2108 0.3090
100 1.2256 1.6182 0.3926 100 1.0042 1.3088 0.3046
200 1.3919 1.7451 0.3532 200 1.1105 1.4064 0.2959
500 1.5517 1.9075 0.3558 500 1.2449 1.5316 0.2867
1000 1.6734 2.0196 0.3462 1000 1.3333 1.6222 0.2889
2000 1.7714 2.1281 0.3567 2000 1.4200 1.7045 0.2845
5000 1.9198 2.2752 0.3554 5000 1.5596 1.8332 0.2735
10000 2.0559 2.3907 0.3348 10000 1.6765 1.9461 0.2696
15000 2.1539 2.4888 0.3348 15000 1.7649 2.0266 0.261720000 2.2353 2.5597 0.3243 20000 1.8310 2.0848 0.253925000 2.3023 2.6253 0.3230 25000 1.8791 2.1430 0.263930000 2.3614 2.6792 0.3178 30000 1.9229 2.1815 0.258740000 2.4651 2.7855 0.3204
50000 2.5597 2.8809 0.3213
60000 2.6507 2.9641 0.3134
70000 2.7203 3.0328 0.3125
80000 2.7982 3.1098 0.3116
90000 2.8709 3.1764 0.3055
100000 2.9216 3.2214 0.2998
Deformation with W.T. at +12 in., Test 5-8
Load Cycles
Deformation with W.T. at +12 in., 50 psi, Test 5-7
Load Cycles

295
Table F.15 Continued
Permanent Total Resilient Permanent Total Resilient(mm) (mm) (mm) (mm) (mm) (mm)
1 0.5529 1.0151 0.4622 1 0.5884 1.0624 0.4740
4 0.7617 1.1337 0.3720 4 0.8129 1.2121 0.3992
5 0.7893 1.1630 0.3738 5 0.8462 1.2501 0.4040
10 0.8956 1.2725 0.3768 10 0.9648 1.3714 0.4066
25 1.0895 1.4537 0.3641 25 1.1731 1.5784 0.4053
50 1.2501 1.6353 0.3852 50 1.3556 1.7552 0.3996
100 1.4340 1.8261 0.3922 100 1.5513 1.9224 0.3712
200 1.6248 2.0148 0.3900 200 1.7697 2.1325 0.3628
500 1.8848 2.2673 0.3825 500 2.0695 2.4144 0.3449
1000 2.0900 2.4270 0.3370 1000 2.3028 2.6372 0.3344
2000 2.2791 2.6266 0.3475 2000 2.5409 2.8621 0.3213
5000 2.5885 2.9886 0.4000 5000 2.9033 3.2223 0.3191
10000 2.9326 3.3637 0.4311 10000 3.3059 3.6097 0.3037
15000 3.2078 3.6324 0.4245 15000 3.5773 3.8701 0.2928
20000 3.4451 3.8652 0.4202 20000 3.7891 4.0916 0.3024
25000 3.6683 4.0906 0.4224 25000 3.9821 4.2671 0.2849
30000 3.8932 4.3239 0.4307 30000 4.1485 4.4373 0.2889
40000 4.2543 4.6920 0.437750000 4.6097 5.0384 0.428760000 4.8080 5.2156 0.407670000 5.0574 5.5167 0.459380000 5.3122 5.7595 0.447390000 5.4890 5.9390 0.4499
100000 5.6702 6.1210 0.4508
Deformation with W.T. at +36 in., Test 5-9
Load Cycles
Deformation with W.T. at +36 in., Test 5-10
Load Cycles

296
Table F.16 Summary of Deformation for A-2-4 (20%) Soil Plate Load Test
Test No. 5-1 5-2 5-3 5-4 5-5 5-6 5-7 5-8 5-9 5-10Test Date 8/1/00 8/2/00 9/21/00 9/22/00 11/6/00 11/8/00 12/11/00 12/13/00 3/1/01 3/5/01
Loads (psi) 20 20 20 20 20 20 50 50 50 50Limerock Layer No No No No No No Yes Yes Yes Yes
-24 -24 0 0 12 12 12 12 36 361 0.00464 0.00760 0.00675 0.00691 0.00570 0.01604 0.01601 0.01320 0.01820 0.018664 0.00495 0.00700 0.00586 0.00553 0.00467 0.01327 0.01406 0.01056 0.01465 0.015725 0.00495 0.00610 0.00632 0.00536 0.00550 0.01480 0.01260 0.01472 0.0159010 0.00495 0.00658 0.00613 0.00548 0.00526 0.00570 0.01437 0.01163 0.01484 0.0160125 0.00510 0.00625 0.00622 0.00579 0.00522 0.00582 0.01628 0.01187 0.01434 0.0159650 0.00507 0.00601 0.00625 0.00576 0.00539 0.00541 0.01520 0.01217 0.01516 0.01573100 0.00612 0.00650 0.00641 0.00620 0.00581 0.00631 0.01546 0.01199 0.01544 0.01461200 0.00574 0.00601 0.00638 0.00605 0.00603 0.00639 0.01391 0.01165 0.01535 0.01428500 0.00572 0.00738 0.00641 0.00620 0.00612 0.00705 0.01401 0.01129 0.01506 0.013581000 0.00572 0.00717 0.00648 0.00617 0.00622 0.00741 0.01363 0.01137 0.01327 0.013162000 0.00562 0.00706 0.00653 0.00619 0.00613 0.00739 0.01404 0.01120 0.01368 0.012655000 0.00572 0.00688 0.00663 0.00627 0.00665 0.00724 0.01399 0.01077 0.01575 0.0125610000 0.00558 0.00670 0.00653 0.00605 0.00643 0.00696 0.01318 0.01061 0.01697 0.0119615000 0.00558 0.00662 0.00651 0.00589 0.00636 0.00703 0.01318 0.01030 0.01671 0.0115320000 0.00515 0.00634 0.00643 0.00582 0.00625 0.00662 0.01277 0.00999 0.01654 0.0119125000 0.00513 0.00644 0.00629 0.00644 0.00636 0.00662 0.01272 0.01039 0.01663 0.0112230000 0.00513 0.00638 0.00636 0.00638 0.00622 0.00667 0.01251 0.01018 0.01696 0.01137
Average from 10,000 Cycles 0.00532 0.00650 0.00642 0.00612 0.00632 0.00678 0.01287 0.01030 0.01676 0.01160
No.of Plate Load Cycles
Resilient Deformation (in.) for A-2-4, 20% Soil
Water Table (in. above Embankment)

297
A- 2- 4 ( 20%) Soi l ( Def or mat i on) , Test 5- 1
0. 00
0. 10
0. 20
0. 30
0. 40
0. 50
0. 60
0. 70
0. 80
0. 90
1. 00
1 10 100 1000 10000 100000Number of Cycl es
Defo
rmat
ion,
mm
Per manentTot alResi l i ent
Figure F.41 A-2-4 (20%) Soil, Deformation under 20 psi Plate Load (Water Table at -24 in., no Limerock, Test 5-1)
A- 2- 4 ( 20%) Soi l ( Def or mat i on) , Test 5- 2
0. 00
0. 20
0. 40
0. 60
0. 80
1. 00
1. 20
1 10 100 1000 10000 100000Number of Cycl es
Defo
rmat
ion,
mm
Per manentTot alResi l i ent
Figure F.42 A-2-4 (20%) Soil, Deformation under 20 psi Plate Load (Water Table at -24 in., no Limerock, Test 5-2)
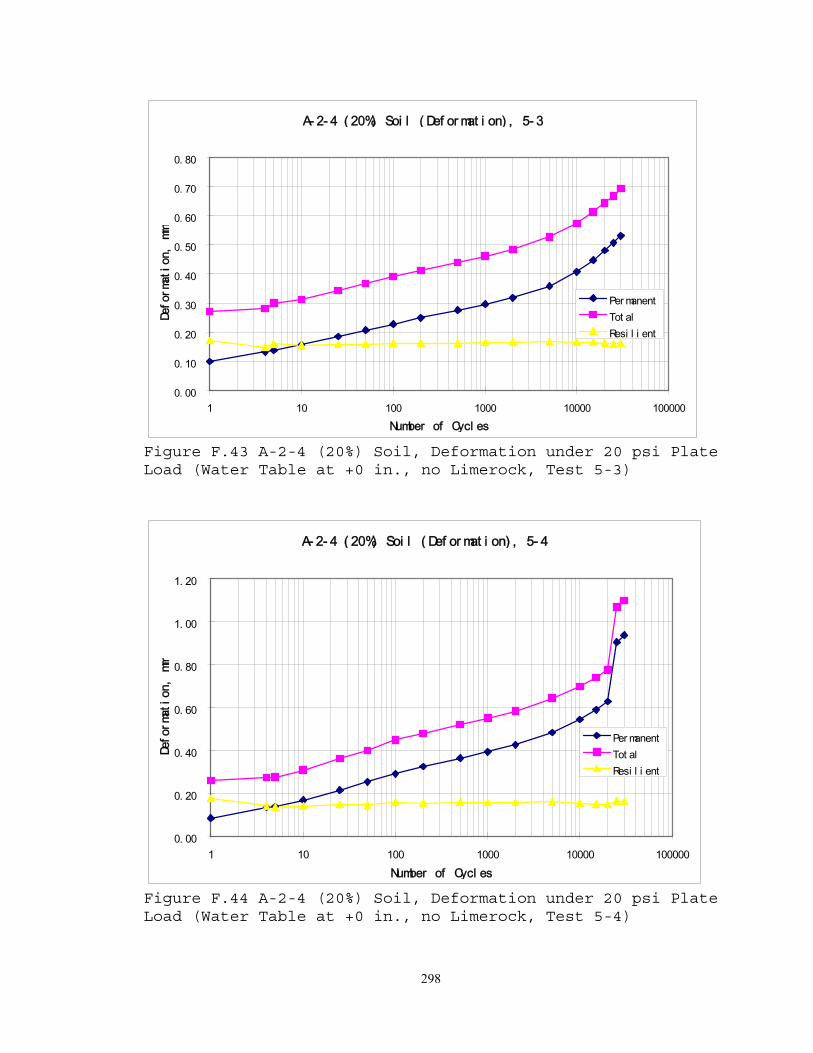
298
A- 2- 4 ( 20%) Soi l ( Def or mat i on) , 5- 3
0. 00
0. 10
0. 20
0. 30
0. 40
0. 50
0. 60
0. 70
0. 80
1 10 100 1000 10000 100000Number of Cycl es
Defo
rmat
ion,
mm
Per manentTot alResi l i ent
Figure F.43 A-2-4 (20%) Soil, Deformation under 20 psi Plate Load (Water Table at +0 in., no Limerock, Test 5-3)
A- 2- 4 ( 20%) Soi l ( Def or mat i on) , 5- 4
0. 00
0. 20
0. 40
0. 60
0. 80
1. 00
1. 20
1 10 100 1000 10000 100000Number of Cycl es
Defo
rmat
ion,
mm
Per manentTot alResi l i ent
Figure F.44 A-2-4 (20%) Soil, Deformation under 20 psi Plate Load (Water Table at +0 in., no Limerock, Test 5-4)

299
A- 2- 4 ( 20%) Soi l ( Def or mat i on) , 5- 5
0. 00
0. 10
0. 20
0. 30
0. 40
0. 50
0. 60
0. 70
0. 80
0. 90
1. 00
1 10 100 1000 10000 100000Number of Cycl es
Defo
rmat
ion,
mm
Per manentTot alResi l i ent
Figure F.45 A-2-4 (20%) Soil, Deformation under 20 psi Plate Load (Water Table at +12.0 in., no Limerock, Test 4-5)
A- 2- 4 ( 20%) Soi l ( Def or mat i on) , 5- 6
0. 00
0. 20
0. 40
0. 60
0. 80
1. 00
1. 20
1. 40
1 10 100 1000 10000 100000Number of Cycl es
Defo
rmat
ion,
mm
Per manentTot alResi l i ent
Figure F.46 A-2-4 (20%) Soil, Deformation under 20 psi Plate Load (Water Table at +12.0 in., no Limerock, Test 4-6)

300
A- 2- 4 ( 20%) Soi l ( Def or mat i on) , 5- 7
0. 00
0. 50
1. 00
1. 50
2. 00
2. 50
3. 00
3. 50
1 10 100 1000 10000 100000Number of Cycl es
Defo
rmat
ion,
mm
Per manentTot alResi l i ent
Figure F.47 A-2-4 (20%) Soil, Deformation under 50 psi Plate Load (Water Table at +12.0 in., w/ Limerock, Test 4-7)
A- 2- 4 ( 20%) Soi l ( Def or mat i on) , 5- 8
0. 00
0. 50
1. 00
1. 50
2. 00
2. 50
1 10 100 1000 10000 100000Number of Cycl es
Defo
rmat
ion,
mm
Per manentTot alResi l i ent
Figure F.48 A-2-4 (20%) Soil, Deformation under 50 psi Plate Load (Water Table at +12.0 in., w/ Limerock, Test 4-8)

301
A- 2- 4 ( 20%) Soi l ( Def or mat i on) , 5- 9
0. 00
1. 00
2. 00
3. 00
4. 00
5. 00
6. 00
7. 00
1 10 100 1000 10000 100000Number of Cycl es
Defo
rmat
ion,
mm
Per manentTot alResi l i ent
Figure F.49 A-2-4 (20%) Soil, Deformation under 50 psi Plate Load (Water Table at +36.0 in., w/ Limerock, Test 4-9)
A- 2- 4 ( 20%) Soi l ( Def or mat i on) , 5- 10
0. 00
0. 50
1. 00
1. 50
2. 00
2. 50
3. 00
3. 50
4. 00
4. 50
5. 00
1 10 100 1000 10000 100000Number of Cycl es
Defo
rmat
ion,
mm
Per manentTot alResi l i ent
Figure F.50 A-2-4 (20%) Soil, Deformation under 50 psi Plate Load (Water Table at +36.0 in., w/ Limerock, Test 4-10)

302
A-2-4 (20%) Resilient Deformation v.s. Load Cycles (20 psi Plate Load)
0.00000
0.00100
0.00200
0.00300
0.00400
0.00500
0.00600
0.00700
0.00800
1 10 100 1000 10000 100000
Load Cycles
Res
ilien
t Def
orm
atio
n (in
ch)
Test 5-1 : Base Clearance 5 ft _1Test 5-2 : Base Clearance 5 ft _2Test 5-3 : Base Clearance 3 ft _1Test 5-4 : Base Clearance 3 ft _2 Test 5-5 : Base Clearance 2 ft _1Test 5-6 : Base Clearance 2 ft _2
Figure F.51 A-2-4 (20%) Soil, Deformation Summary under 20 psi Plate Load at Different Water Table Level
A-2-4 (20%) Resilient Deformation v.s. Load Cycles (50 psi Plate Load)
0.00000
0.00200
0.00400
0.00600
0.00800
0.01000
0.01200
0.01400
0.01600
0.01800
0.02000
1 10 100 1000 10000 100000
Load Cycles
Res
ilien
t Def
orm
atio
n (in
ch)
Test 5-7 : Base Clearance 2 ft _1Test 5-8 : Base Clearance 2 ft _2Test 5-9 : Base Clearance 0 ft _1Test 5-10 : Base Clearance 0 ft _2
Figure F.52 A-2-4 (20%) Soil, Deformation Summary under 50 psi Plate Load at Different Water Table Level

303
F.6 A-2-4, 24% SOIL

304
Table F.17 A-2-4, 24% Soil Plate Load Test, 20 psi w/out Limerock
Permanent Total Resilient Permanent Total Resilient(mm) (mm) (mm) (mm) (mm) (mm)
1 0.2531 0.4776 0.2245 1 0.1209 0.2124 0.091550 0.4308 0.6291 0.1983 4 0.0820 0.2261 0.1441
100 0.4737 0.6720 0.1983 5 0.0864 0.2273 0.1409200 0.5258 0.7241 0.1983 10 0.1008 0.2449 0.1441500 0.6103 0.8085 0.1983 25 0.1301 0.3056 0.1755
1000 0.6737 0.8720 0.1983 50 0.1564 0.3319 0.17552000 0.7092 0.9018 0.1926 100 0.1853 0.3610 0.17575000 0.7473 0.9219 0.1746 200 0.2142 0.3888 0.1746
10000 0.7376 0.9057 0.1681 500 0.2452 0.4330 0.187815000 0.7560 0.9320 0.1759 1000 0.2627 0.4444 0.181620000 0.7700 0.9398 0.1698 2000 0.2732 0.4492 0.175925000 0.7805 0.9455 0.1650 5000 0.2811 0.4606 0.179430000 0.7950 0.9521 0.1571 10000 0.2947 0.4720 0.1773
15000 0.3039 0.4785 0.174620000 0.3100 0.4820 0.172025000 0.3214 0.4947 0.173330000 0.3323 0.5061 0.1738
Permanent Total Resilient Permanent Total Resilient(mm) (mm) (mm) (mm) (mm) (mm)
1 0.0842 0.2597 0.1755 1 0.1437 0.2255 0.08184 0.1328 0.2732 0.1405 4 0.1577 0.2067 0.04905 0.1380 0.2741 0.1361 5 0.1621 0.2417 0.0797
10 0.1678 0.3070 0.1392 10 0.1730 0.2588 0.085825 0.2146 0.3617 0.1471 25 0.2063 0.2934 0.087150 0.2531 0.3993 0.1462 50 0.2128 0.3008 0.0880
100 0.2908 0.4483 0.1576 100 0.2334 0.3301 0.0967200 0.3240 0.4776 0.1536 200 0.2479 0.3490 0.1011500 0.3625 0.5201 0.1576 500 0.2619 0.3787 0.1169
1000 0.3923 0.5490 0.1567 1000 0.2702 0.4041 0.13392000 0.4256 0.5827 0.1571 2000 0.2934 0.4234 0.13005000 0.4825 0.6418 0.1593 5000 0.3367 0.4720 0.1352
10000 0.7718 0.9420 0.1703 10000 0.3822 0.5262 0.144015000 0.8260 0.9941 0.1681 15000 0.4172 0.5652 0.147920000 0.8716 1.0326 0.1611 20000 0.4492 0.5936 0.144425000 0.9035 1.0672 0.1637 25000 0.4794 0.6251 0.145730000 0.9359 1.0978 0.1619 30000 0.4991 0.6505 0.1514
Deformation with W.T. at 0 in., Test 6-4
Load Cycles
Deformation with W.T. at -24 in., Test 6-1
Load Cycles
Deformation with W.T. at -24 in., Test 6-2
Load Cycles
Deformation with W.T. at 0 in., Test 6-3
Load Cycles

305
Table F.17 Continued
Permanent Total Resilient Permanent Total Resilient(mm) (mm) (mm) (mm) (mm) (mm)
1 0.1870 0.4177 0.2307 1 0.2137 0.4685 0.25474 0.2422 0.4339 0.1917 4 0.2715 0.4899 0.21845 0.2439 0.4505 0.2066 5 0.2803 0.4982 0.2180
10 0.2706 0.4776 0.2070 10 0.3105 0.5293 0.218825 0.3096 0.5052 0.1956 25 0.3621 0.5814 0.219350 0.3428 0.5564 0.2136 50 0.4094 0.6330 0.2237
100 0.3870 0.5989 0.2118 100 0.4597 0.6842 0.2245200 0.4326 0.6418 0.2092 200 0.5087 0.7359 0.2272500 0.4873 0.6995 0.2123 500 0.5735 0.8028 0.2293
1000 0.5310 0.7477 0.2166 1000 0.6273 0.8571 0.22982000 0.5757 0.7845 0.2088 2000 0.6834 0.9131 0.22985000 0.6431 0.8540 0.2110 5000 0.7617 0.9906 0.2289
10000 0.7144 0.9201 0.2057 10000 0.8444 1.0716 0.227215000 0.7613 0.9670 0.2057 15000 0.9057 1.1307 0.225020000 0.8033 1.0064 0.2031 20000 0.9534 1.1766 0.223225000 0.8352 1.0440 0.2088 25000 0.9976 1.2182 0.220630000 0.8632 1.0720 0.2088 30000 1.0361 1.2589 0.2228
40000 1.1009 1.3232 0.222350000 1.1587 1.3823 0.223760000 1.2108 1.4366 0.225870000 1.2550 1.4843 0.229380000 1.2930 1.5184 0.225490000 1.3259 1.5500 0.2241
100000 1.3543 1.5762 0.2219
Deformation with W.T. at +12 in., Test 6-5
Load Cycles
Deformation with W.T. at +12 in., Test 6-6
Load Cycles
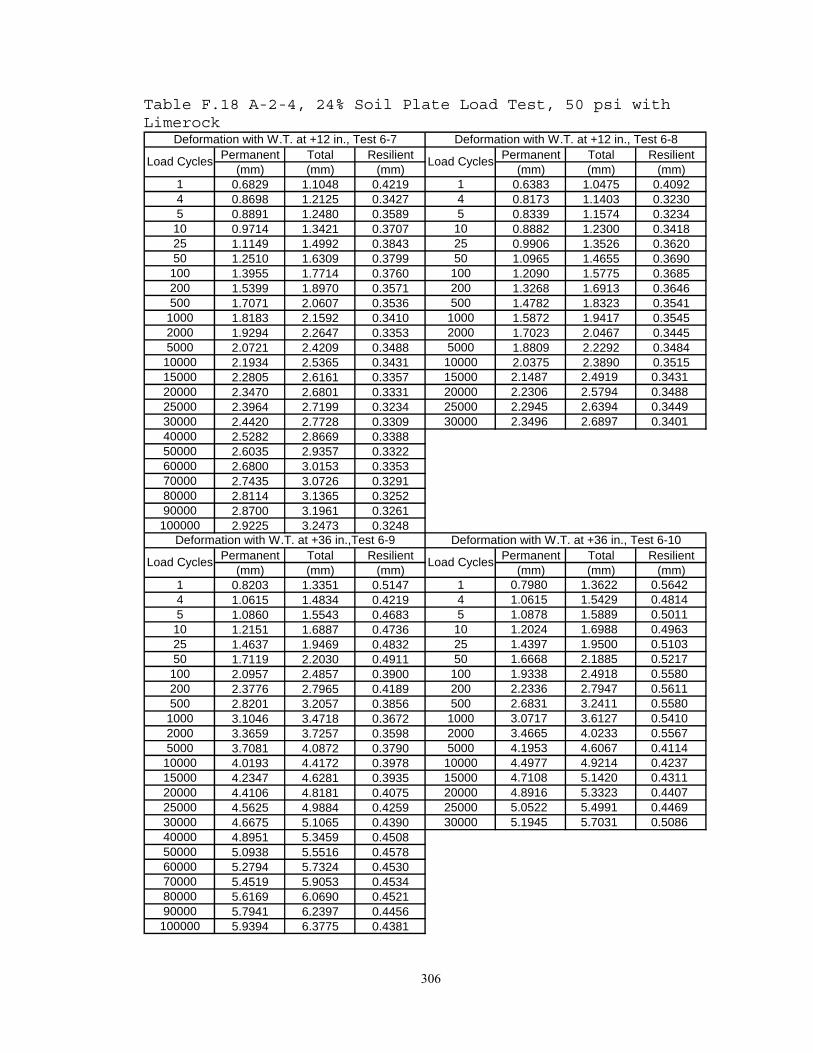
306
Table F.18 A-2-4, 24% Soil Plate Load Test, 50 psi with Limerock
Permanent Total Resilient Permanent Total Resilient(mm) (mm) (mm) (mm) (mm) (mm)
1 0.6829 1.1048 0.4219 1 0.6383 1.0475 0.40924 0.8698 1.2125 0.3427 4 0.8173 1.1403 0.32305 0.8891 1.2480 0.3589 5 0.8339 1.1574 0.3234
10 0.9714 1.3421 0.3707 10 0.8882 1.2300 0.341825 1.1149 1.4992 0.3843 25 0.9906 1.3526 0.362050 1.2510 1.6309 0.3799 50 1.0965 1.4655 0.3690
100 1.3955 1.7714 0.3760 100 1.2090 1.5775 0.3685200 1.5399 1.8970 0.3571 200 1.3268 1.6913 0.3646500 1.7071 2.0607 0.3536 500 1.4782 1.8323 0.3541
1000 1.8183 2.1592 0.3410 1000 1.5872 1.9417 0.35452000 1.9294 2.2647 0.3353 2000 1.7023 2.0467 0.34455000 2.0721 2.4209 0.3488 5000 1.8809 2.2292 0.3484
10000 2.1934 2.5365 0.3431 10000 2.0375 2.3890 0.351515000 2.2805 2.6161 0.3357 15000 2.1487 2.4919 0.343120000 2.3470 2.6801 0.3331 20000 2.2306 2.5794 0.348825000 2.3964 2.7199 0.3234 25000 2.2945 2.6394 0.344930000 2.4420 2.7728 0.3309 30000 2.3496 2.6897 0.340140000 2.5282 2.8669 0.338850000 2.6035 2.9357 0.332260000 2.6800 3.0153 0.335370000 2.7435 3.0726 0.329180000 2.8114 3.1365 0.325290000 2.8700 3.1961 0.3261
100000 2.9225 3.2473 0.3248
Permanent Total Resilient Permanent Total Resilient(mm) (mm) (mm) (mm) (mm) (mm)
1 0.8203 1.3351 0.5147 1 0.7980 1.3622 0.56424 1.0615 1.4834 0.4219 4 1.0615 1.5429 0.48145 1.0860 1.5543 0.4683 5 1.0878 1.5889 0.5011
10 1.2151 1.6887 0.4736 10 1.2024 1.6988 0.496325 1.4637 1.9469 0.4832 25 1.4397 1.9500 0.510350 1.7119 2.2030 0.4911 50 1.6668 2.1885 0.5217
100 2.0957 2.4857 0.3900 100 1.9338 2.4918 0.5580200 2.3776 2.7965 0.4189 200 2.2336 2.7947 0.5611500 2.8201 3.2057 0.3856 500 2.6831 3.2411 0.5580
1000 3.1046 3.4718 0.3672 1000 3.0717 3.6127 0.54102000 3.3659 3.7257 0.3598 2000 3.4665 4.0233 0.55675000 3.7081 4.0872 0.3790 5000 4.1953 4.6067 0.4114
10000 4.0193 4.4172 0.3978 10000 4.4977 4.9214 0.423715000 4.2347 4.6281 0.3935 15000 4.7108 5.1420 0.431120000 4.4106 4.8181 0.4075 20000 4.8916 5.3323 0.440725000 4.5625 4.9884 0.4259 25000 5.0522 5.4991 0.446930000 4.6675 5.1065 0.4390 30000 5.1945 5.7031 0.508640000 4.8951 5.3459 0.450850000 5.0938 5.5516 0.457860000 5.2794 5.7324 0.453070000 5.4519 5.9053 0.453480000 5.6169 6.0690 0.452190000 5.7941 6.2397 0.4456
100000 5.9394 6.3775 0.4381
Load Cycles
Deformation with W.T. at +12 in., Test 6-7
Load Cycles
Deformation with W.T. at +36 in.,Test 6-9
Load Cycles
Deformation with W.T. at +12 in., Test 6-8
Load Cycles
Deformation with W.T. at +36 in., Test 6-10

307
Table F.19 Summary of Deformation for A-2-4 (24%) Soil Plate Load Test
Test No. 6-1 6-2 6-3 6-4 6-5 6-6 6-7 6-8 6-9 6-10Test Date 7/27/00 7/28/00 9/25/00 9/26/00 11/9/00 11/14/00 12/18/00 12/20/00 3/6/01 3/8/01
Loads (psi) 20 20 20 20 20 20 50 50 50 50Limerock Layer No No No No No No Yes Yes Yes Yes
-24 -24 0 0 12 12 12 12 36 361 0.00884 0.00360 0.00691 0.00322 0.00908 0.01003 0.01661 0.01611 0.02026 0.022214 0.00567 0.00553 0.00193 0.00755 0.00860 0.01349 0.01272 0.01661 0.018955 0.00555 0.00536 0.00314 0.00813 0.00858 0.01413 0.01273 0.01844 0.0197310 0.00567 0.00548 0.00338 0.00815 0.00862 0.01460 0.01346 0.01864 0.0195425 0.00691 0.00579 0.00343 0.00770 0.00863 0.01513 0.01425 0.01902 0.0200950 0.00781 0.00691 0.00576 0.00346 0.00841 0.00881 0.01496 0.01453 0.01933 0.02054100 0.00781 0.00692 0.00620 0.00381 0.00834 0.00884 0.01480 0.01451 0.01535 0.02197200 0.00781 0.00688 0.00605 0.00398 0.00824 0.00894 0.01406 0.01435 0.01649 0.02209500 0.00781 0.00739 0.00620 0.00460 0.00836 0.00903 0.01392 0.01394 0.01518 0.021971000 0.00781 0.00715 0.00617 0.00527 0.00853 0.00905 0.01342 0.01396 0.01446 0.021302000 0.00758 0.00693 0.00619 0.00512 0.00822 0.00905 0.01320 0.01356 0.01416 0.021925000 0.00688 0.00706 0.00627 0.00532 0.00831 0.00901 0.01373 0.01372 0.01492 0.0162010000 0.00662 0.00698 0.00670 0.00567 0.00810 0.00894 0.01351 0.01384 0.01566 0.0166815000 0.00693 0.00688 0.00662 0.00582 0.00810 0.00886 0.01322 0.01351 0.01549 0.0169720000 0.00669 0.00677 0.00634 0.00569 0.00800 0.00879 0.01311 0.01373 0.01604 0.0173525000 0.00650 0.00682 0.00644 0.00574 0.00822 0.00868 0.01273 0.01358 0.01677 0.0175930000 0.00619 0.00684 0.00638 0.00596 0.00822 0.00877 0.01303 0.01339 0.01728 0.02002
Average from 10,000 Cycles 0.00658 0.00686 0.00650 0.00578 0.00813 0.00881 0.01312 0.01361 0.01625 0.01772
No.of Plate Load Cycles
Resilient Deformation (in.) for A-2-4, 24% Soil
Water Table (in. above Embankment)

308
A- 2- 4 ( 24%) Soi l ( Def or mat i on) , Test 6- 1
0. 00
0. 10
0. 20
0. 30
0. 40
0. 50
0. 60
0. 70
0. 80
0. 90
1. 00
1 10 100 1000 10000 100000Number of Cycl es
Defo
rmat
ion,
mm
Per manentTot alResi l i ent
Figure F.53 A-2-4 (24%) Soil, Deformation under 20 psi Plate Load (Water Table at -24 in., no Limerock, Test 6-1)
A- 2- 4 ( 24%) Soi l ( Def or mat i on) , Test 6- 2
0. 00
0. 10
0. 20
0. 30
0. 40
0. 50
0. 60
1 10 100 1000 10000 100000Number of Cycl es
Defo
rmat
ion,
mm
Per manentTot alResi l i ent
Figure F.54 A-2-4 (24%) Soil, Deformation under 20 psi Plate Load (Water Table at -24 in., no Limerock, Test 6-2)

309
A- 2- 4 ( 24%) Soi l ( Def or mat i on) , Test 6- 3
0. 00
0. 20
0. 40
0. 60
0. 80
1. 00
1. 20
1 10 100 1000 10000 100000Number of Cycl es
Defo
rmat
ion,
mm
Per manentTot alResi l i ent
Figure F.55 A-2-4 (24%) Soil, Deformation under 20 psi Plate Load (Water Table at +0.0 in., no Limerock, Test 6-3)
A- 2- 4 ( 24%) Soi l ( Def or mat i on) , Test 6- 4
0. 00
0. 10
0. 20
0. 30
0. 40
0. 50
0. 60
0. 70
1 10 100 1000 10000 100000Number of Cycl es
Defo
rmat
ion,
mm
Per manentTot alResi l i ent
Figure F.56 A-2-4 (24%) Soil, Deformation under 20 psi Plate Load (Water Table at +0.0 in., no Limerock, Test 6-4)

310
A- 2- 4 ( 24%) Soi l ( Def or mat i on) , Test 6- 5
0. 00
0. 20
0. 40
0. 60
0. 80
1. 00
1. 20
1 10 100 1000 10000 100000Number of Cycl es
Defo
rmat
ion,
mm
Per manentTot alResi l i ent
Figure F.57 A-2-4 (24%) Soil, Deformation under 20 psi Plate Load (Water Table at +12.0 in., no Limerock, Test 6-5)
A- 2- 4 ( 24%) Soi l ( Def or mat i on) , Test 6- 6
0. 00
0. 20
0. 40
0. 60
0. 80
1. 00
1. 20
1. 40
1. 60
1. 80
1 10 100 1000 10000 100000Number of Cycl es
Defo
rmat
ion,
mm
Per manentTot alResi l i ent
Figure F.58 A-2-4 (24%) Soil, Deformation under 20 psi Plate Load (Water Table at +12.0 in., no Limerock, Test 6-6)

311
A- 2- 4 ( 24%) Soi l ( Def or mat i on) , Test 6- 7
0. 00
0. 50
1. 00
1. 50
2. 00
2. 50
3. 00
3. 50
1 10 100 1000 10000 100000Number of Cycl es
Defo
rmat
ion,
mm
Per manentTot alResi l i ent
Figure F.59 A-2-4 (24%) Soil, Deformation under 50 psi Plate Load (Water Table at +12.0 in., with Limerock, Test 6-7)
A- 2- 4 ( 24%) Soi l ( Def or mat i on) , Test 6- 8
0. 00
0. 50
1. 00
1. 50
2. 00
2. 50
3. 00
1 10 100 1000 10000 100000Number of Cycl es
Defo
rmat
ion,
mm
Per manentTot alResi l i ent
Figure F.60 A-2-4 (24%) Soil, Deformation under 50 psi Plate Load (Water Table at +12.0 in., with Limerock, Test 6-8)

312
A- 2- 4 ( 24%) Soi l ( Def or mat i on) , Test 6- 9
0. 00
1. 00
2. 00
3. 00
4. 00
5. 00
6. 00
7. 00
1 10 100 1000 10000 100000Number of Cycl es
Defo
rmat
ion,
mm
Per manentTot alResi l i ent
Figure F.61 A-2-4 (24%) Soil, Deformation under 50 psi Plate Load (Water Table at +36.0 in., with Limerock, Test 6-9)
A- 2- 4 ( 24%) Soi l ( Def or mat i on) , Test 6- 10
0. 00
1. 00
2. 00
3. 00
4. 00
5. 00
6. 00
1 10 100 1000 10000 100000Number of Cycl es
Defo
rmat
ion,
mm
Per manentTot alResi l i ent
Figure F.62 A-2-4 (24%) Soil, Deformation under 50 psi Plate Load (Water Table at +36.0 in., with Limerock, Test 6-10)
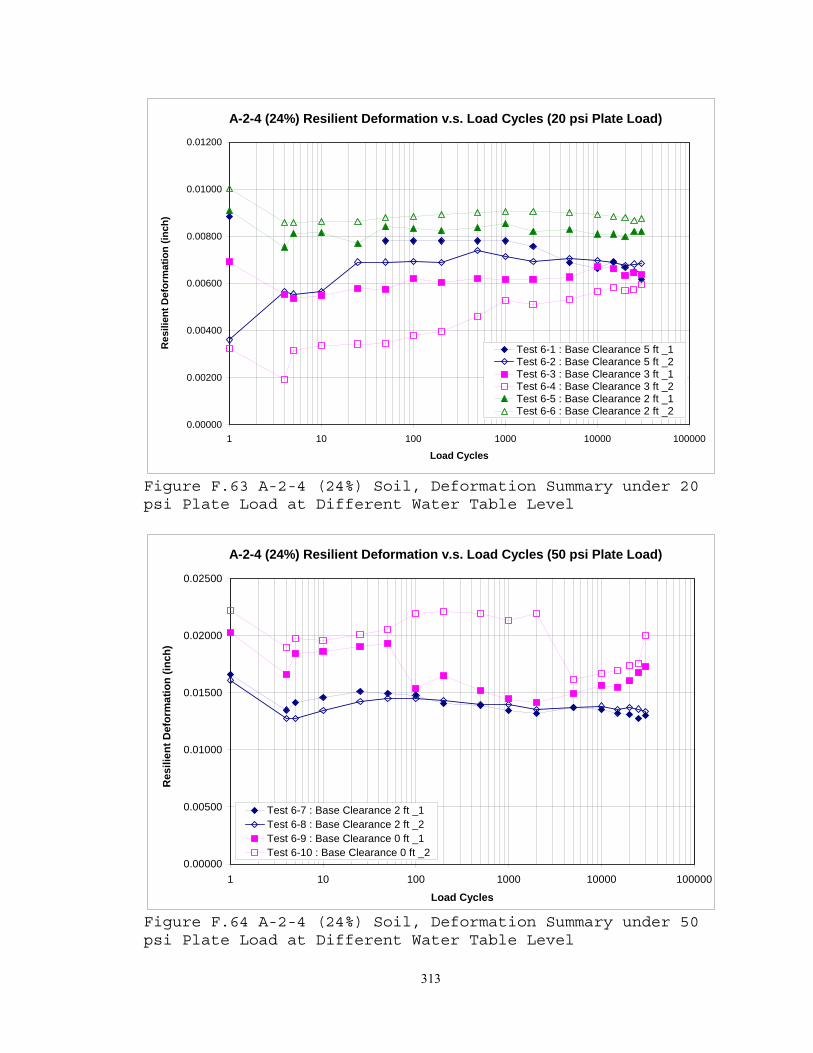
313
A-2-4 (24%) Resilient Deformation v.s. Load Cycles (20 psi Plate Load)
0.00000
0.00200
0.00400
0.00600
0.00800
0.01000
0.01200
1 10 100 1000 10000 100000
Load Cycles
Res
ilien
t Def
orm
atio
n (in
ch)
Test 6-1 : Base Clearance 5 ft _1Test 6-2 : Base Clearance 5 ft _2Test 6-3 : Base Clearance 3 ft _1Test 6-4 : Base Clearance 3 ft _2 Test 6-5 : Base Clearance 2 ft _1Test 6-6 : Base Clearance 2 ft _2
Figure F.63 A-2-4 (24%) Soil, Deformation Summary under 20 psi Plate Load at Different Water Table Level
A-2-4 (24%) Resilient Deformation v.s. Load Cycles (50 psi Plate Load)
0.00000
0.00500
0.01000
0.01500
0.02000
0.02500
1 10 100 1000 10000 100000
Load Cycles
Res
ilien
t Def
orm
atio
n (in
ch)
Test 6-7 : Base Clearance 2 ft _1Test 6-8 : Base Clearance 2 ft _2Test 6-9 : Base Clearance 0 ft _1Test 6-10 : Base Clearance 0 ft _2
Figure F.64 A-2-4 (24%) Soil, Deformation Summary under 50 psi Plate Load at Different Water Table Level

314
F.7 A-2-4, 30% SOIL

315
Table F.20 A-2-4, 30% Soil Plate Load Test, 20 psi without Limerock
Permanent Total Resilient(mm) (mm) (mm)
1 0.4617 0.6490 0.1873
4 0.5400 0.6888 0.1488
5 0.5497 0.7024 0.1527
10 0.5812 0.7422 0.1610
25 0.6543 0.8166 0.1624
50 0.7243 0.8879 0.1637
100 0.8057 0.9715 0.1659
200 0.8941 1.0652 0.1711
500 0.9995 1.1680 0.1685
1000 1.0695 1.2376 0.1680
2000 1.1264 1.2875 0.1610
5000 1.1894 1.3457 0.1562
10000 1.2275 1.3737 0.1462
15000 1.2376 1.3820 0.1444
20000 1.2446 1.3802 0.1357
25000 1.2424 1.3781 0.1357
30000 1.2512 1.3846 0.1335
Permanent Total Resilient Permanent Total Resilient(mm) (mm) (mm) (mm) (mm) (mm)
1 0.1553 0.3360 0.1807 1 0.5190 0.6980 0.1790
4 0.2302 0.3492 0.1190 10 0.6656 0.8512 0.1855
5 0.2324 0.3619 0.1295 25 0.7225 0.9190 0.1965
10 0.2407 0.3860 0.1453 50 0.7882 0.9855 0.1974
25 0.2696 0.4232 0.1536 100 0.8521 1.0529 0.2009
50 0.2989 0.4608 0.1619 200 0.9212 1.1168 0.1956
100 0.3383 0.5046 0.1663 500 1.0078 1.2021 0.1943
200 0.3812 0.5492 0.1680 1000 1.0800 1.2717 0.1917
500 0.4368 0.6031 0.1663 2000 1.1361 1.3220 0.1860
1000 0.4731 0.6420 0.1689 5000 1.1916 1.3728 0.1812
2000 0.5077 0.6722 0.1645 10000 1.2376 1.4161 0.1785
5000 0.5449 0.7033 0.1584 15000 1.2743 1.4446 0.1702
10000 0.5716 0.7269 0.1553 20000 1.3019 1.4665 0.1645
15000 0.5856 0.7339 0.1483 25000 1.3225 1.4813 0.1589
20000 0.5908 0.7400 0.1492 30000 1.3387 1.4988 0.1602
25000 0.5987 0.7422 0.1435
30000 0.5974 0.7400 0.1427
Deformation with W.T. at 0 in., Tes 7-2 Deformation with W.T. at 0 in., Test 7-3
Load Cycles
Load Cycles
Load Cycles
Deformation with W.T. at -24 in., Test 7-1

316
Table F.20 Continued
Permanent Total Resilient Permanent Total Resilient(mm) (mm) (mm) (mm) (mm) (mm)
1 0.1313 0.2897 0.1585 1 0.3418 0.5379 0.19604 0.2250 0.3918 0.1668 4 0.4512 0.5961 0.14485 0.2328 0.4027 0.1699 5 0.4604 0.6114 0.1510
10 0.2517 0.4276 0.1760 10 0.5028 0.6486 0.145725 0.2753 0.4390 0.1637 25 0.5803 0.7357 0.155350 0.2941 0.4605 0.1663 50 0.6534 0.8289 0.1755
100 0.3278 0.4727 0.1448 100 0.7396 0.9168 0.1772200 0.3593 0.5068 0.1475 200 0.8328 1.0236 0.1908500 0.4048 0.5702 0.1654 500 0.9641 1.1483 0.1842
1000 0.4315 0.5965 0.1650 1000 1.0660 1.2354 0.16942000 0.4586 0.6271 0.1685 2000 1.1448 1.3308 0.18605000 0.4976 0.6613 0.1637 5000 1.2481 1.4279 0.1799
10000 0.5352 0.6897 0.1545 10000 1.3216 1.4945 0.172915000 0.5610 0.7173 0.1562 15000 1.3676 1.5229 0.155420000 0.5803 0.7396 0.1593 20000 1.3868 1.5452 0.158425000 0.5996 0.7553 0.1558 25000 1.4008 1.5601 0.159330000 0.6070 0.7628 0.1558 30000 1.4170 1.5763 0.1593
Permanent Total Resilient(mm) (mm) (mm)
1 0.4459 0.7016 0.25564 0.5225 0.7177 0.19525 0.5243 0.7313 0.2070
10 0.5505 0.7575 0.207025 0.6017 0.8166 0.214950 0.6508 0.8678 0.2171
100 0.7050 0.9356 0.2306200 0.7672 0.9991 0.2319500 0.8381 1.0582 0.2201
1000 0.8936 1.1177 0.22412000 0.9483 1.1829 0.23465000 1.0245 1.2577 0.2332
10000 1.0954 1.3199 0.224515000 1.1383 1.3536 0.215320000 1.1715 1.3925 0.221025000 1.2039 1.4131 0.209230000 1.2188 1.4441 0.2254
40000 1.2105 1.4244 0.2140
50000 1.2236 1.4393 0.2157
60000 1.2468 1.4573 0.2105
70000 1.2603 1.4647 0.2044
80000 1.2809 1.4857 0.2048
90000 1.2932 1.4953 0.2022
100000 1.3172 1.5115 0.1943
Deformation with W.T. at +12 in., Test 7-4
Deformation with W.T. at +12 in., Test 7-6
Deformation with W.T. at +12 in., Test 7-5
Load Cycles
Load Cycles
Load Cycles

317
Table F.21 A-2-4, 30% Soil Plate Load Test, 50 psi with Limerock
Permanent Total Resilient Permanent Total Resilient(mm) (mm) (mm) (mm) (mm) (mm)
1 0.7632 1.2196 0.4564 1 0.4131 0.7291 0.31594 0.9461 1.3582 0.4120 4 0.5274 0.8133 0.28595 0.9553 1.3650 0.4096 5 0.5317 0.8146 0.2829
10 1.0192 1.4078 0.3886 10 0.5597 0.8416 0.281825 1.1501 1.5684 0.4184 25 0.6241 0.9256 0.301550 1.2752 1.6936 0.4184 50 0.6827 0.9982 0.3155
100 1.4209 1.8297 0.4087 100 0.7724 1.0722 0.2998200 1.5640 1.9706 0.4065 200 0.8499 1.1628 0.3129500 1.7776 2.1631 0.3855 500 0.9549 1.2590 0.3041
1000 1.9067 2.2769 0.3702 1000 1.0319 1.3325 0.30062000 2.0187 2.3740 0.3553 2000 1.1085 1.4034 0.29495000 2.1517 2.4966 0.3448 5000 1.2056 1.4888 0.2831
10000 2.2616 2.5977 0.3361 10000 1.2787 1.5570 0.278315000 2.3272 2.6502 0.3230 15000 1.3238 1.5938 0.270020000 2.4012 2.6992 0.2980 20000 1.3750 1.6314 0.256425000 2.4419 2.7298 0.2879 25000 1.4034 1.6520 0.248630000 2.4659 2.7495 0.2836 30000 1.4205 1.6608 0.2402
40000 1.4271 1.6691 0.242050000 1.4284 1.6734 0.245160000 1.4402 1.6848 0.244670000 1.4538 1.6914 0.237680000 1.4673 1.7023 0.235090000 1.4761 1.7120 0.2359
100000 1.4918 1.7229 0.2311
Permanent Total Resilient Permanent Total Resilient(mm) (mm) (mm) (mm) (mm) (mm)
1 0.5107 1.1689 0.6582 1 0.9825 1.6839 0.70154 0.6184 1.1400 0.5216 4 1.2459 1.7964 0.55055 0.6341 1.1606 0.5264 5 1.2708 1.8380 0.5671
10 0.6761 1.2450 0.5689 10 1.3627 1.9566 0.593825 0.7772 1.3789 0.6017 25 1.5439 2.1570 0.613150 0.8783 1.5120 0.6337 50 1.7198 2.3806 0.6608
100 1.0100 1.6581 0.6481 100 1.9255 2.5946 0.6691200 1.1684 1.8279 0.6595 200 2.1570 2.8340 0.6770500 1.4152 2.0874 0.6722 500 2.4909 3.1727 0.6818
1000 1.6529 2.3347 0.6818 1000 2.7530 3.4436 0.69052000 1.9592 2.6729 0.7137 2000 3.0366 3.7298 0.69325000 2.5513 3.2781 0.7269 5000 3.4773 4.1687 0.6914
10000 3.1005 3.8356 0.7352 10000 3.9066 4.6037 0.697115000 3.5241 4.2745 0.7505 15000 4.2168 4.9113 0.694520000 3.9183 4.6951 0.7767 20000 4.4746 5.1585 0.684025000 4.3157 5.1086 0.7929 25000 4.6619 5.3458 0.684030000 4.6946 5.5239 0.8293 30000 4.7993 5.5104 0.711140000 5.4495 6.3103 0.860850000 6.0131 6.9146 0.901560000 6.6083 7.5351 0.926870000 7.1492 8.0524 0.903280000 7.4957 8.4098 0.914190000 7.7828 8.6792 0.8964
100000 8.1241 9.0326 0.9085
Load Cycles
Deformation with W .T. at +36 in., Test 7-10
Load Cycles
Deformation with W .T. at +12 in., Test 7-7
Load Cycles
Deformation with W .T. at +12 in., Test 7-8
Load Cycles
Deformation with W .T. at +36 in., Test 7-9

318
Table F.22 Summary of Deformation for A-2-4 (30%) Soil Plate Load Test
Test No. 7-1 7-2 7-3 7-4 7-5 7-6 7-7 7-8 7-9 7-10Test Date 7/52000 8/14/00 8/15/00 10/5/00 10/6/00 10/19/00 12/13/00 12/14/00 2/11/01 2/14/01
Loads (psi) 20 20 20 20 20 20 50 50 50 50Limerock Layer No No No No No No Yes Yes Yes Yes
-24 0 0 12 12 12 12 12 36 361 0.00737 0.00712 0.00705 0.00624 0.00772 0.01006 0.01797 0.01244 0.02591 0.027624 0.00586 0.00469 0.00657 0.00570 0.00768 0.01622 0.01126 0.02054 0.021675 0.00601 0.00510 0.00669 0.00594 0.00815 0.01613 0.01114 0.02073 0.0223310 0.00634 0.00572 0.00730 0.00693 0.00574 0.00815 0.01530 0.01110 0.02240 0.0233825 0.00639 0.00605 0.00774 0.00645 0.00612 0.00846 0.01647 0.01187 0.02369 0.0241450 0.00644 0.00637 0.00777 0.00655 0.00691 0.00855 0.01647 0.01242 0.02495 0.02602100 0.00653 0.00655 0.00791 0.00570 0.00698 0.00908 0.01609 0.01180 0.02552 0.02634200 0.00674 0.00662 0.00770 0.00581 0.00751 0.00913 0.01601 0.01232 0.02596 0.02665500 0.00663 0.00655 0.00765 0.00651 0.00725 0.00867 0.01518 0.01197 0.02646 0.026841000 0.00662 0.00665 0.00755 0.00650 0.00667 0.00882 0.01458 0.01184 0.02684 0.027192000 0.00634 0.00648 0.00732 0.00663 0.00732 0.00923 0.01399 0.01161 0.02810 0.027295000 0.00615 0.00624 0.00713 0.00644 0.00708 0.00918 0.01358 0.01115 0.02862 0.0272210000 0.00575 0.00612 0.00703 0.00608 0.00681 0.00884 0.01323 0.01096 0.02894 0.0274515000 0.00569 0.00584 0.00670 0.00615 0.00612 0.00848 0.01271 0.01063 0.02955 0.0273420000 0.00534 0.00587 0.00648 0.00627 0.00624 0.00870 0.01173 0.01010 0.03058 0.0269325000 0.00534 0.00565 0.00625 0.00613 0.00627 0.00824 0.01134 0.00979 0.03122 0.0269330000 0.00525 0.00562 0.00631 0.00613 0.00627 0.00887 0.01116 0.00946 0.03265 0.02800
Average from 10,000 Cycles 0.00548 0.00582 0.00655 0.00615 0.00634 0.00862 0.01204 0.01019 0.03059 0.02733
No.of Plate Load Cycles
Resilient Deformation (in.) for A-2-4, 30% Soil
Water Table (in. above Embankment)

319
A- 2- 4 ( 30%) Soi l Def or mat i on. Test 7- 1
0. 00
0. 20
0. 40
0. 60
0. 80
1. 00
1. 20
1. 40
1. 60
1 10 100 1000 10000 100000Number of Cycl es
Defo
rmat
ion,
mm
Per manentTot alResi l i ent
Figure F.65 A-2-4 (30%) Soil, Deformation under 20 psi Plate Load (Water Table at -24 in., no Limerock, Test 7-1)
A- 2- 4 ( 30%) Soi l Def or mat i on, Test 7- 2
0. 00
0. 10
0. 20
0. 30
0. 40
0. 50
0. 60
0. 70
0. 80
1 10 100 1000 10000 100000Number of Cycl es
Defo
rmat
ion,
mm
Per manentTot alResi l i ent
Figure F.66 A-2-4 (30%) Soil, Deformation under 20 psi Plate Load (Water Table at +0 in., no Limerock, Test 7-2)

320
A- 2- 4 ( 30%) Soi l Def or mat i on, Test 7- 3
0. 00
0. 20
0. 40
0. 60
0. 80
1. 00
1. 20
1. 40
1. 60
1 10 100 1000 10000 100000Number of Cycl es
Defo
rmat
ion,
mm
Per manentTot alResi l i ent
Figure F.67 A-2-4 (30%) Soil, Deformation under 20 psi Plate Load (Water Table at +0 in., no Limerock, Test 7-3)
A- 2- 4 ( 30%) Soi l Def or mat i on, Test 7- 4
0. 00
0. 10
0. 20
0. 30
0. 40
0. 50
0. 60
0. 70
0. 80
0. 90
1 10 100 1000 10000 100000Number of Cycl es
Defo
rmat
ion,
mm
Per manentTot alResi l i ent
Figure F.68 A-2-4 (30%) Soil, Deformation under 20 psi Plate Load (Water Table at +12.0 in., no Limerock, Test 7-4)

321
A- 2- 4 ( 30%) Soi l Def or mat i on, Test 7- 5
0. 00
0. 20
0. 40
0. 60
0. 80
1. 00
1. 20
1. 40
1. 60
1. 80
1 10 100 1000 10000 100000Number of Cycl es
Defo
rmat
ion,
mm
Per manentTot alResi l i ent
Figure F.69 A-2-4 (30%) Soil, Deformation under 20 psi Plate Load (Water Table at +12.0 in., no Limerock, Test 7-5)
A- 2- 4 ( 30%) Soi l Def or mat i on, Test 7- 6
0. 00
0. 20
0. 40
0. 60
0. 80
1. 00
1. 20
1. 40
1. 60
1 10 100 1000 10000 100000Number of Cycl es
Defo
rmat
ion,
mm
Per manentTot alResi l i ent
Figure F.70 A-2-4 (30%) Soil, Deformation under 20 psi Plate Load (Water Table at +12.0 in., no Limerock, Test 7-6)

322
A- 2- 4 ( 30%) Soi l Def or mat i on, Test 7- 7
0. 00
0. 50
1. 00
1. 50
2. 00
2. 50
3. 00
1 10 100 1000 10000 100000Number of Cycl es
Defo
rmat
ion,
mm
Per manentTot alResi l i ent
Figure F.71 A-2-4 (30%) Soil, Deformation under 50 psi Plate Load (Water Table at +12.0 in., with Limerock, Test 7-7)
A- 2- 4 ( 30%) Soi l Def or mat i on, Test 7- 8
0. 00
0. 20
0. 40
0. 60
0. 80
1. 00
1. 20
1. 40
1. 60
1. 80
2. 00
1 10 100 1000 10000 100000Number of Cycl es
Defo
rmat
ion,
mm
Per manentTot alResi l i ent
Figure F.72 A-2-4 (30%) Soil, Deformation under 50 psi Plate Load (Water Table at +12.0 in., with Limerock, Test 7-8)

323
A- 2- 4 ( 30%) Soi l Def or mat i on, Test 7- 9
0. 00
1. 00
2. 00
3. 00
4. 00
5. 00
6. 00
7. 00
8. 00
9. 00
10. 00
1 10 100 1000 10000 100000Number of Cycl es
Defo
rmat
ion,
mm
Per manentTot alResi l i ent
Figure F.73 A-2-4 (30%) Soil, Deformation under 50 psi Plate Load (Water Table at +36.0 in., with Limerock, Test 7-9)
A- 2- 4 ( 30%) Soi l Def or mat i on, Test 7- 10
0. 00
1. 00
2. 00
3. 00
4. 00
5. 00
6. 00
1 10 100 1000 10000 100000Number of Cycl es
Defo
rmat
ion,
mm
Per manentTot alResi l i ent
Figure F.74 A-2-4 (30%) Soil, Deformation under 50 psi Plate Load (Water Table at +36.0 in., with Limerock, Test 7-10)

324
A-2-4 (30%) Resilient Deformation v.s. Load Cycles (20 psi Plate Load)
0.00000
0.00200
0.00400
0.00600
0.00800
0.01000
0.01200
1 10 100 1000 10000 100000
Load Cycles
Res
ilien
t Def
orm
atio
n (in
ch)
Test 7-1 : Base Clearance 5 ft _1Test 7-2 : Base Clearance 3 ft _1Test 7-3 : Base Clearance 3 ft _2Test 7-4 : Base Clearance 2 ft _1 Test 7-5 : Base Clearance 2 ft _2Test 7-6 : Base Clearance 2 ft _3
Figure F.75 SR70 A-3 Soil, Deformation Summary under 20 psi Plate Load at Different Water Table Level
A-2-4 (30%) Resilient Deformation v.s. Load Cycles (50 psi Plate Load)
0.00000
0.00500
0.01000
0.01500
0.02000
0.02500
0.03000
0.03500
1 10 100 1000 10000 100000
Load Cycles
Res
ilien
t Def
orm
atio
n (in
ch)
Test 7-7 : Base Clearance 2 ft _1Test 7-8 : Base Clearance 2 ft _2Test 7-9 : Base Clearance 0 ft _1Test 7-10 : Base Clearance 0 ft _2
Figure F.76 SR70 A-3 Soil, Deformation Summary under 50 psi Plate Load at Different Water Table Level

325
F.8 OOLITE A-1 SOIL

326
Table F.23 Oolite A-1 Soil Plate Load Test, 50 psi without Limerock
Permanent Total Resilient
(mm) (mm) (mm)
1 0.5589 0.7190 0.1602
4 0.5934 0.7448 0.1514
5 0.5996 0.7711 0.1715
10 0.6284 0.8153 0.1869
25 0.7111 0.9094 0.1982
50 0.8092 0.9759 0.1667
100 1.0175 1.1881 0.1707
200 1.2105 1.3833 0.1729
500 1.2993 1.5273 0.2280
1000 1.4704 1.6861 0.2157
2000 1.6078 1.8012 0.1934
5000 1.7321 1.9251 0.1930
10000 1.7955 1.9854 0.1899
15000 1.8283 2.0086 0.1803
20000 1.8493 2.0174 0.1680
25000 1.8660 2.0314 0.1654
30000 1.8747 2.0301 0.1553
Permanent Total Resilient Permanent Total Resilient
(mm) (mm) (mm) (mm) (mm) (mm)
1 0.5659 0.7715 0.2057 1 0.4403 0.6919 0.2516
4 0.6849 0.8875 0.2026 10 0.6013 0.8437 0.2424
5 0.7011 0.9111 0.2100 25 0.7098 0.9728 0.2630
10 0.7645 0.9794 0.2149 50 0.8346 1.1006 0.2661
25 0.9164 1.1487 0.2324 100 0.9903 1.2512 0.2608
50 1.0800 1.3233 0.2433 200 1.1588 1.4170 0.2582
100 1.2603 1.4874 0.2271 500 1.3811 1.6327 0.2516
200 1.5627 1.8227 0.2599 1000 1.5365 1.7776 0.2411
500 1.8861 2.1351 0.2490 2000 1.6682 1.9041 0.2359
1000 2.1010 2.3565 0.2556 5000 1.8157 2.0371 0.2214
2000 2.2336 2.4677 0.2341 10000 1.9189 2.1285 0.2096
5000 2.3675 2.5771 0.2096 15000 1.9771 2.1771 0.2000
10000 2.4467 2.6383 0.1917 20000 2.0174 2.2148 0.1974
15000 2.5145 2.6913 0.1768 25000 2.0502 2.2428 0.1925
20000 2.5576 2.7340 0.1763 30000 2.0708 2.2625 0.1917
25000 2.5677 2.7422 0.1745
30000 2.5764 2.7487 0.1723
Deformation with W.T. at 0 in., Test 8-2 Deformation with W.T. at 0 in., Test 8-3
Load Cycles
Load Cycles
Deformation with W.T. at -24 in.,Test 8-1
Load Cycles
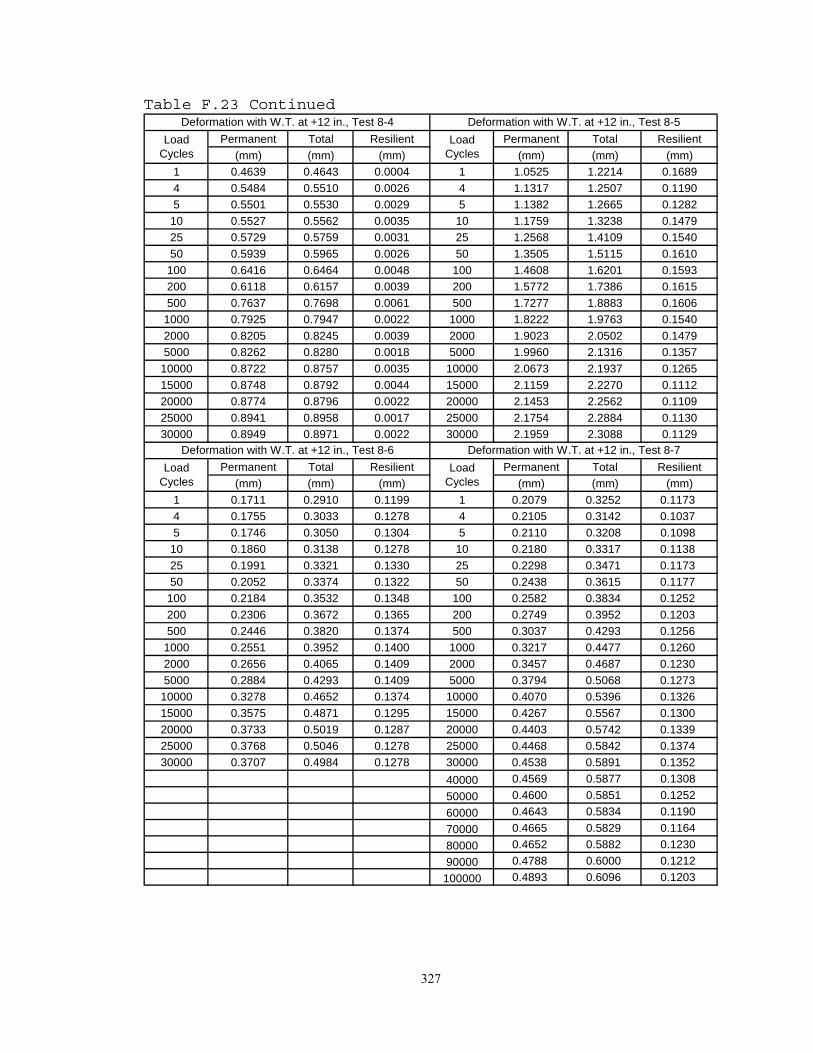
327
Table F.23 Continued
Permanent Total Resilient Permanent Total Resilient(mm) (mm) (mm) (mm) (mm) (mm)
1 0.4639 0.4643 0.0004 1 1.0525 1.2214 0.16894 0.5484 0.5510 0.0026 4 1.1317 1.2507 0.11905 0.5501 0.5530 0.0029 5 1.1382 1.2665 0.1282
10 0.5527 0.5562 0.0035 10 1.1759 1.3238 0.147925 0.5729 0.5759 0.0031 25 1.2568 1.4109 0.154050 0.5939 0.5965 0.0026 50 1.3505 1.5115 0.1610
100 0.6416 0.6464 0.0048 100 1.4608 1.6201 0.1593200 0.6118 0.6157 0.0039 200 1.5772 1.7386 0.1615500 0.7637 0.7698 0.0061 500 1.7277 1.8883 0.1606
1000 0.7925 0.7947 0.0022 1000 1.8222 1.9763 0.15402000 0.8205 0.8245 0.0039 2000 1.9023 2.0502 0.14795000 0.8262 0.8280 0.0018 5000 1.9960 2.1316 0.1357
10000 0.8722 0.8757 0.0035 10000 2.0673 2.1937 0.126515000 0.8748 0.8792 0.0044 15000 2.1159 2.2270 0.111220000 0.8774 0.8796 0.0022 20000 2.1453 2.2562 0.110925000 0.8941 0.8958 0.0017 25000 2.1754 2.2884 0.113030000 0.8949 0.8971 0.0022 30000 2.1959 2.3088 0.1129
Permanent Total Resilient Permanent Total Resilient(mm) (mm) (mm) (mm) (mm) (mm)
1 0.1711 0.2910 0.1199 1 0.2079 0.3252 0.11734 0.1755 0.3033 0.1278 4 0.2105 0.3142 0.10375 0.1746 0.3050 0.1304 5 0.2110 0.3208 0.1098
10 0.1860 0.3138 0.1278 10 0.2180 0.3317 0.113825 0.1991 0.3321 0.1330 25 0.2298 0.3471 0.117350 0.2052 0.3374 0.1322 50 0.2438 0.3615 0.1177
100 0.2184 0.3532 0.1348 100 0.2582 0.3834 0.1252200 0.2306 0.3672 0.1365 200 0.2749 0.3952 0.1203500 0.2446 0.3820 0.1374 500 0.3037 0.4293 0.1256
1000 0.2551 0.3952 0.1400 1000 0.3217 0.4477 0.12602000 0.2656 0.4065 0.1409 2000 0.3457 0.4687 0.12305000 0.2884 0.4293 0.1409 5000 0.3794 0.5068 0.1273
10000 0.3278 0.4652 0.1374 10000 0.4070 0.5396 0.132615000 0.3575 0.4871 0.1295 15000 0.4267 0.5567 0.130020000 0.3733 0.5019 0.1287 20000 0.4403 0.5742 0.133925000 0.3768 0.5046 0.1278 25000 0.4468 0.5842 0.137430000 0.3707 0.4984 0.1278 30000 0.4538 0.5891 0.1352
40000 0.4569 0.5877 0.130850000 0.4600 0.5851 0.125260000 0.4643 0.5834 0.119070000 0.4665 0.5829 0.116480000 0.4652 0.5882 0.123090000 0.4788 0.6000 0.1212
100000 0.4893 0.6096 0.1203
Load Cycles
Deformation with W.T. at +12 in., Test 8-4Load
Cycles
Deformation with W.T. at +12 in., Test 8-6Load
Cycles
Deformation with W.T. at +12 in., Test 8-5
Deformation with W.T. at +12 in., Test 8-7
Load Cycles

328
Table F.24 Oolite A-1 Soil Plate Load Test, 50 psi with Limerock
Permanent Total Resilient Permanent Total Resilient(mm) (mm) (mm) (mm) (mm) (mm)
1 0.3961 0.6171 0.2210 1 0.2587 0.4166 0.15804 0.4954 0.6919 0.1965 4 0.2994 0.4547 0.15535 0.4963 0.7155 0.2192 5 0.2985 0.4600 0.1615
10 0.5168 0.7333 0.2164 10 0.3230 0.4819 0.158925 0.5379 0.7663 0.2284 25 0.3514 0.5101 0.158750 0.5891 0.8057 0.2166 50 0.3829 0.5221 0.1392
100 0.6363 0.8398 0.2035 100 0.4245 0.5663 0.1418200 0.6761 0.8875 0.2114 200 0.4582 0.5821 0.1238500 0.7278 0.9260 0.1982 500 0.5274 0.6333 0.1059
1000 0.7637 0.9615 0.1978 1000 0.5549 0.6591 0.10422000 0.8070 1.0149 0.2079 2000 0.5685 0.6810 0.11255000 0.8662 1.0508 0.1847 5000 0.5759 0.6963 0.1203
10000 0.8902 1.0688 0.1786 10000 0.5786 0.6941 0.115515000 0.9057 1.0917 0.1861 15000 0.5720 0.6919 0.119920000 0.9178 1.1048 0.1869 20000 0.5650 0.6831 0.118225000 0.9250 1.1073 0.1823 25000 0.5584 0.6700 0.111630000 0.9319 1.1161 0.1843 30000 0.5540 0.6652 0.111240000 0.9372 1.1248 0.187650000 0.9409 1.1265 0.185660000 0.9444 1.1284 0.184170000 0.9503 1.1330 0.182780000 0.9526 1.1360 0.183390000 0.9566 1.1385 0.1818
100000 0.9588 1.1393 0.1805
Permanent Total Resilient Permanent Total Resilient(mm) (mm) (mm) (mm) (mm) (mm)
1 0.6127 0.9619 0.3492 1 0.4928 0.8319 0.33914 0.8153 1.2254 0.4101 4 0.6564 0.9715 0.31515 0.8315 1.2451 0.4136 5 0.6709 0.9877 0.3168
10 0.9326 1.3290 0.3964 10 0.7523 1.0927 0.340525 1.1807 1.5818 0.4011 25 0.9934 1.3719 0.378550 1.5142 1.8997 0.3855 50 1.3212 1.6962 0.3750
100 2.0458 2.4357 0.3899 100 1.7487 2.1548 0.4061200 2.6060 2.9631 0.3571 200 2.2703 2.6817 0.4113500 3.1127 3.5153 0.4026 500 2.9351 3.3376 0.4026
1000 3.5586 3.9643 0.4057 1000 3.4116 3.7989 0.38732000 4.1625 4.4093 0.2468 2000 3.8833 4.2527 0.36935000 4.3778 4.6163 0.2385 5000 4.4833 4.8465 0.3632
10000 4.5104 4.7616 0.2512 10000 4.9397 5.3082 0.368515000 4.6150 4.8649 0.2499 15000 5.2618 5.6224 0.360620000 4.6977 4.9401 0.2424 20000 5.5187 5.8814 0.362825000 4.7607 5.0044 0.2437 25000 5.7020 6.0744 0.372430000 4.8312 5.0723 0.2411 30000 5.8617 6.2412 0.379440000 4.9143 5.1484 0.234150000 4.9839 5.2193 0.235460000 5.0474 5.2841 0.236770000 5.1108 5.3480 0.237280000 5.1931 5.4346 0.241690000 5.3134 5.5572 0.2437
100000 5.4517 5.6972 0.2455
Load Cycles
Deformation with W .T. at +36 in., Test 8-11
Load Cycles
Deformation with W .T. at +12 in., Test 8-8
Load Cycles
Deformation with W .T. at +12 in., Test 8-9
Load Cycles
Deformation with W .T. at +36 in., Test 8-10
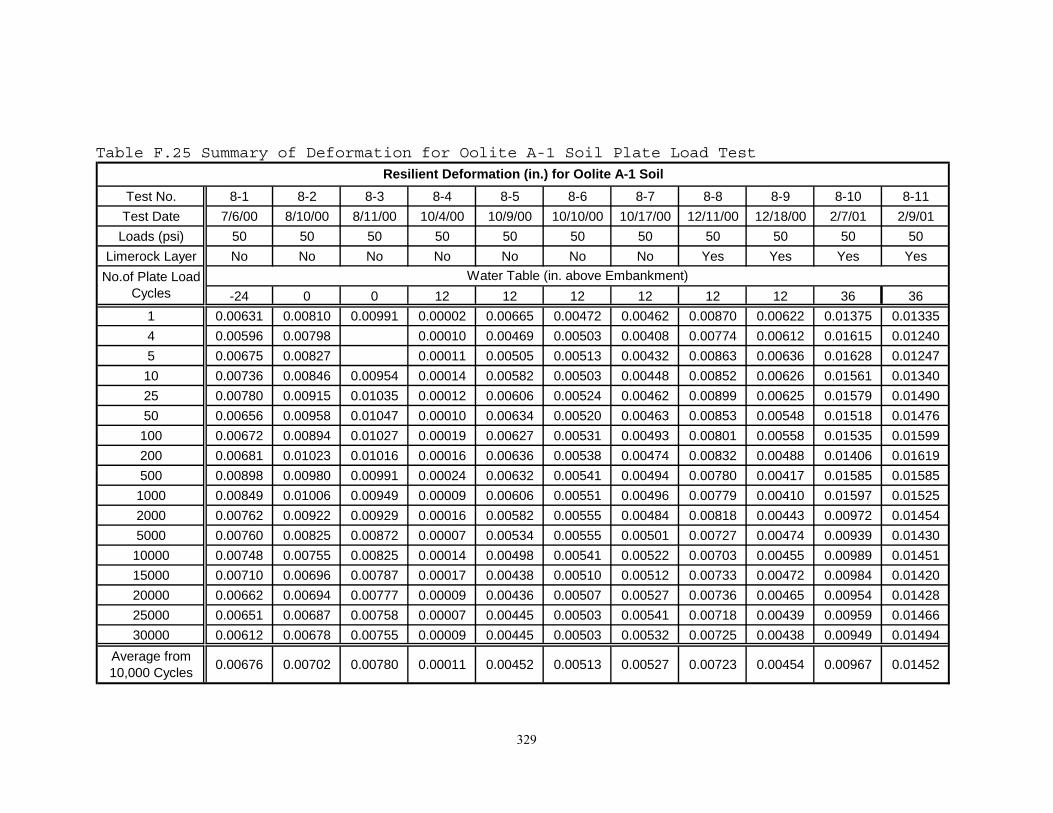
329
Table F.25 Summary of Deformation for Oolite A-1 Soil Plate Load Test
Test No. 8-1 8-2 8-3 8-4 8-5 8-6 8-7 8-8 8-9 8-10 8-11Test Date 7/6/00 8/10/00 8/11/00 10/4/00 10/9/00 10/10/00 10/17/00 12/11/00 12/18/00 2/7/01 2/9/01
Loads (psi) 50 50 50 50 50 50 50 50 50 50 50Limerock Layer No No No No No No No Yes Yes Yes Yes
-24 0 0 12 12 12 12 12 12 36 361 0.00631 0.00810 0.00991 0.00002 0.00665 0.00472 0.00462 0.00870 0.00622 0.01375 0.013354 0.00596 0.00798 0.00010 0.00469 0.00503 0.00408 0.00774 0.00612 0.01615 0.012405 0.00675 0.00827 0.00011 0.00505 0.00513 0.00432 0.00863 0.00636 0.01628 0.0124710 0.00736 0.00846 0.00954 0.00014 0.00582 0.00503 0.00448 0.00852 0.00626 0.01561 0.0134025 0.00780 0.00915 0.01035 0.00012 0.00606 0.00524 0.00462 0.00899 0.00625 0.01579 0.0149050 0.00656 0.00958 0.01047 0.00010 0.00634 0.00520 0.00463 0.00853 0.00548 0.01518 0.01476100 0.00672 0.00894 0.01027 0.00019 0.00627 0.00531 0.00493 0.00801 0.00558 0.01535 0.01599200 0.00681 0.01023 0.01016 0.00016 0.00636 0.00538 0.00474 0.00832 0.00488 0.01406 0.01619500 0.00898 0.00980 0.00991 0.00024 0.00632 0.00541 0.00494 0.00780 0.00417 0.01585 0.015851000 0.00849 0.01006 0.00949 0.00009 0.00606 0.00551 0.00496 0.00779 0.00410 0.01597 0.015252000 0.00762 0.00922 0.00929 0.00016 0.00582 0.00555 0.00484 0.00818 0.00443 0.00972 0.014545000 0.00760 0.00825 0.00872 0.00007 0.00534 0.00555 0.00501 0.00727 0.00474 0.00939 0.0143010000 0.00748 0.00755 0.00825 0.00014 0.00498 0.00541 0.00522 0.00703 0.00455 0.00989 0.0145115000 0.00710 0.00696 0.00787 0.00017 0.00438 0.00510 0.00512 0.00733 0.00472 0.00984 0.0142020000 0.00662 0.00694 0.00777 0.00009 0.00436 0.00507 0.00527 0.00736 0.00465 0.00954 0.0142825000 0.00651 0.00687 0.00758 0.00007 0.00445 0.00503 0.00541 0.00718 0.00439 0.00959 0.0146630000 0.00612 0.00678 0.00755 0.00009 0.00445 0.00503 0.00532 0.00725 0.00438 0.00949 0.01494
Average from 10,000 Cycles 0.00676 0.00702 0.00780 0.00011 0.00452 0.00513 0.00527 0.00723 0.00454 0.00967 0.01452
No.of Plate Load Cycles
Resilient Deformation (in.) for Oolite A-1 Soil
Water Table (in. above Embankment)

330
Ool i t e Soi l Def or mat i on, Test 8- 1
0. 00
0. 50
1. 00
1. 50
2. 00
2. 50
1 10 100 1000 10000 100000Number of Cycl es
Defo
rmat
ion,
mm
Per manentTot alResi l i ent
Figure F.77 Oolite Soil, Deformation under 50 psi Plate Load (Water Table at -24 in., w/out Limerock, Test 8-1)
Ool i t e Soi l Def or mat i on, Test 8- 2
0. 00
0. 50
1. 00
1. 50
2. 00
2. 50
3. 00
1 10 100 1000 10000 100000Number of Cycl es
Defo
rmat
ion,
mm
Per manentTot alResi l i ent
Figure F.78 Oolite Soil, Deformation under 50 psi Plate Load (Water Table at +0 in., w/out Limerock, Test 8-2)

331
Ool i t e Soi l Def or mat i on, Test 8- 3
0. 00
0. 50
1. 00
1. 50
2. 00
2. 50
1 10 100 1000 10000 100000Number of Cycl es
Defo
rmat
ion,
mm
Per manentTot alResi l i ent
Figure F.79 Oolite Soil, Deformation under 50 psi Plate Load (Water Table at +0 in., w/out Limerock, Test 8-3)
Ool i t e Soi l Def or mat i on, Test 8- 4
0. 00
0. 10
0. 20
0. 30
0. 40
0. 50
0. 60
0. 70
0. 80
0. 90
1. 00
1 10 100 1000 10000 100000Number of Cycl es
Defo
rmat
ion,
mm
Per manentTot alResi l i ent
Figure F.80 Oolite Soil, Deformation under 50 psi Plate Load (Water Table at +12.0 in., w/out Limerock, Test 8-4)

332
Ool i t e Soi l Def or mat i on, Test 8- 5
0. 00
0. 50
1. 00
1. 50
2. 00
2. 50
1 10 100 1000 10000 100000Number of Cycl es
Defo
rmat
ion,
mm
Per manentTot alResi l i ent
Figure F.81 Oolite Soil, Deformation under 50 psi Plate Load (Water Table at +12.0 in., w/out Limerock, Test 8-5)
Ool i t e Soi l Def or mat i on, Test 8- 6
0. 00
0. 10
0. 20
0. 30
0. 40
0. 50
0. 60
1 10 100 1000 10000 100000Number of Cycl es
Defo
rmat
ion,
mm
Per manentTot alResi l i ent
Figure F.82 Oolite Soil, Deformation under 50 psi Plate Load (Water Table at +12.0 in., w/out Limerock, Test 8-6)

333
Ool i t e Soi l Def or mat i on, Test 8- 7
0. 00
0. 10
0. 20
0. 30
0. 40
0. 50
0. 60
0. 70
1 10 100 1000 10000 100000Number of Cycl es
Defo
rmat
ion,
mm
Per manentTot alResi l i ent
Figure F.83 Oolite Soil, Deformation under 50 psi Plate Load (Water Table at +12.0 in., w/out Limerock, Test 8-7)
Ool i t e Soi l Def or mat i on, Test 8- 8
0. 00
0. 20
0. 40
0. 60
0. 80
1. 00
1. 20
1 10 100 1000 10000 100000Number of Cycl es
Defo
rmat
ion,
mm
Per manentTot alResi l i ent
Figure F.84 Oolite Soil, Deformation under 50 psi Plate Load (Water Table at +12.0 in., w/ Limerock, Test 8-8)

334
Ool i t e Soi l Def or mat i on, Test 8- 9
0. 00
0. 10
0. 20
0. 30
0. 40
0. 50
0. 60
0. 70
0. 80
1 10 100 1000 10000 100000Number of Cycl es
Defo
rmat
ion,
mm
Per manentTot alResi l i ent
Figure F.85 Oolite Soil, Deformation under 50 psi Plate Load (Water Table at +12.0 in., w/ Limerock, Test 8-9)
Ool i t e Soi l Def or mat i on, Test 8- 10
0. 00
1. 00
2. 00
3. 00
4. 00
5. 00
6. 00
1 10 100 1000 10000 100000Number of Cycl es
Defo
rmat
ion,
mm
Per manentTot alResi l i ent
Figure F.86 Oolite Soil, Deformation under 50 psi Plate Load (Water Table at +36.0 in., w/ Limerock, Test 8-10)

335
Ool i t e Soi l Def or mat i on, Test 8- 11
0. 00
1. 00
2. 00
3. 00
4. 00
5. 00
6. 00
7. 00
1 10 100 1000 10000 100000Number of Cycl es
Defo
rmat
ion,
mm
Per manentTot alResi l i ent
Figure F.87 Oolite Soil, Deformation under 50 psi Plate Load (Water Table at +36.0 in., w/ Limerock, Test 8-11)
Oolite A1 Resilient Deformation v.s. Load Cycles (50 psi Plate Load)
0.00000
0.00500
0.01000
0.01500
0.02000
0.02500
0.03000
1 10 100 1000 10000 100000
Load Cycles
Res
ilien
t Def
orm
atio
n (in
ch)
Test 8-1 : Base Clearance 5 ft _1 (w/o Limerock Base Layer)Test 8-2 : Base Clearance 3 ft _1 (w/o Limerock Base Layer)Test 8-3 : Base Clearance 3 ft _2 (w/o Limerock Base Layer)Test 8-4 : Base Clearance 2 ft _1 (w/o Limerock Base Layer) Test 8-5 : Base Clearance 2 ft _2 (w/o Limerock Base Layer)Test 8-6 : Base Clearance 2 ft _3 (w/o Limerock Base Layer)Test 8-7 : Base Clearance 2 ft _4 (w/o Limerock Base Layer)Test 8-8 : Base Clearance 2 ft _5Test 8-9 : Base Clearance 2 ft _6Test 8-10 : Base Clearance 0 ft _1Test 8-11 : Base Clearance 0 ft _2
Figure F.88 Oolite A-1 Soil, Deformation Summary under 50 psi Plate Load at Different Water Table Level
336
F.9 SPRING CEMETERY A-2-4, 15% SOIL

337
Table F.26 Spring Cemetery A-2-4 Soil Plate Load Test, 20 psi w/o Limerock
Permanent Total Resilient Permanent Total Resilient(mm) (mm) (mm) (mm) (mm) (mm)
1 0.0275 0.3075 0.2800 1 0.1704 0.4262 0.25574 4 0.2486 0.6120 0.36355 5 0.2606 0.6591 0.3985
10 10 0.3092 0.6595 0.350425 25 0.4118 0.6830 0.271250 50 0.5017 0.7746 0.2729
100 0.1837 0.4466 0.2629 100 0.5919 0.8654 0.2735200 0.2176 0.4784 0.2608 200 0.6864 0.9583 0.2719500 0.2706 0.5282 0.2576 500 0.8129 1.0837 0.2708
1000 0.3157 0.5717 0.2560 1000 0.9099 1.1800 0.27012000 0.3640 0.6193 0.2552 2000 1.0023 1.2727 0.27055000 0.4445 0.6995 0.2550 5000 1.1421 1.4105 0.2685
10000 0.5133 0.7681 0.2548 10000 1.2566 1.5226 0.266015000 0.5553 0.8103 0.2550 15000 1.3295 1.5940 0.264520000 0.5890 0.8424 0.2534 20000 1.3853 1.6478 0.262525000 0.6177 0.8689 0.2511 25000 1.4325 1.6934 0.260930000 0.6275 0.8706 0.2430 30000 1.4740 1.7346 0.2606
Permanent Total Resilient(mm) (mm) (mm)
1 0.0527 0.2999 0.24724 0.1113 0.3660 0.25475 0.1242 0.3691 0.2449
10 0.1764 0.3889 0.212525 0.2677 0.5355 0.267850 0.3496 0.6101 0.2604
100 0.4422 0.6986 0.2564200 0.5312 0.7872 0.2560500 0.6455 0.8991 0.2536
1000 0.7282 0.9810 0.25282000 0.8099 1.0624 0.25265000 0.9195 1.1719 0.2524
10000 1.0197 1.2701 0.250415000 1.0850 1.3338 0.248820000 1.1356 1.3848 0.249225000 1.1792 1.4274 0.248230000 1.2138 1.4612 0.2473
Deformation with W.T. at 0 in., Test 9-3Load
Cycles
Deformation with W.T. at 0 in., Test 9-1Load
Cycles
Deformation with W.T. at 0 in., Test 9-2Load
Cycles

338
Table F.26 Continued
Permanent Total Resilient Permanent Total Resilient(mm) (mm) (mm) (mm) (mm) (mm)
1 0.2786 0.5555 0.2769 1 0.0521 0.3116 0.25964 0.3713 0.6546 0.2833 4 0.1035 0.3768 0.27335 0.3879 0.6756 0.2877 5 0.1127 0.3760 0.2633
10 0.4516 0.7445 0.2929 10 0.1538 0.4375 0.283725 0.5576 0.8465 0.2890 25 0.2333 0.5091 0.275850 0.6488 0.9366 0.2878 50 0.3040 0.5783 0.2743
100 0.7453 1.0321 0.2868 100 0.3815 0.6544 0.2729200 0.8431 1.1274 0.2843 200 0.4653 0.7363 0.2710500 0.9690 1.2511 0.2820 500 0.5775 0.8457 0.2682
1000 1.0643 1.3447 0.2804 1000 0.6637 0.9302 0.26652000 1.1569 1.4370 0.2801 2000 0.7529 1.0193 0.26645000 1.2922 1.5727 0.2805 5000 0.8860 1.1509 0.2649
10000 1.4009 1.6803 0.2793 10000 0.9915 1.2575 0.266015000 1.4727 1.7527 0.2800 15000 1.0582 1.3238 0.265520000 1.5267 1.8068 0.2801 20000 1.1062 1.3713 0.265225000 1.5726 1.8527 0.2801 25000 1.1508 1.4149 0.264230000 1.6144 1.8937 0.2793 30000 1.1888 1.4530 0.2642
Permanent Total Resilient(mm) (mm) (mm)
1 0.1795 0.4159 0.23654 0.2449 0.4922 0.24735 0.2577 0.5118 0.2541
10 0.3071 0.5607 0.253625 0.3898 0.6425 0.252750 0.4584 0.7114 0.2531
100 0.5286 0.7815 0.2529200 0.5999 0.8511 0.2512500 0.6948 0.9456 0.2509
1000 0.7674 1.0173 0.24992000 0.8420 1.0939 0.25195000 0.9557 1.2096 0.2539
10000 1.0607 1.3158 0.255015000 1.1298 1.3859 0.256120000 1.1910 1.4468 0.255725000 1.2383 1.4940 0.255730000 1.2757 1.5319 0.2562
Deformation with W.T. at 12 in., Test 9-5Load
Cycles
Deformation with W.T. at 12 in., Test 9-6Load
Cycles
Deformation with W.T. at 12 in., Test 9-4Load
Cycles

339
Table F.26 Continued
Permanent Total Resilient Permanent Total Resilient(mm) (mm) (mm) (mm) (mm) (mm)
1 0.0522 0.4533 0.4010 1 0.2637 0.5922 0.32854 0.0995 0.4887 0.3892 4 0.3003 0.6279 0.32755 0.1080 0.4981 0.3901 5 0.3049 0.6314 0.326610 0.1409 0.5285 0.3876 10 0.3193 0.6441 0.324825 0.2072 0.5891 0.3819 25 0.3502 0.6751 0.324950 0.2787 0.6558 0.3771 50 0.4013 0.7272 0.3259
100 0.3677 0.7396 0.3719 100 0.4865 0.8133 0.3268200 0.4770 0.8457 0.3686 200 0.6102 0.9383 0.3280500 0.6572 1.0224 0.3652 500 0.8314 1.1561 0.32471000 0.8232 1.1884 0.3652 1000 1.0417 1.3653 0.32362000 1.0167 1.3815 0.3649 2000 1.2809 1.6066 0.32575000 1.3122 1.6774 0.3652 5000 1.6670 1.9930 0.325910000 1.5807 1.9478 0.3671 10000 2.0167 2.3526 0.335915000 1.7511 2.1199 0.3688 15000 2.2639 2.5999 0.336020000 1.8821 2.2529 0.3708 20000 2.4551 2.7907 0.335525000 2.0150 2.3846 0.3696 25000 2.6235 2.9609 0.337430000 2.1228 2.4920 0.3692 30000 2.7701 3.1033 0.3332
Permanent Total Resilient(mm) (mm) (mm)
1 0.5003 0.9206 0.42034 0.6996 1.1350 0.43545 0.7402 1.1752 0.434910 0.9056 1.3381 0.432525 1.1799 1.6047 0.424850 1.4166 1.8364 0.4198
100 1.6717 2.0827 0.4109200 1.9446 2.3469 0.4022500 2.3393 2.7313 0.39201000 2.6645 3.0486 0.38402000 3.0159 3.3933 0.37745000 3.5494 3.9167 0.367210000 3.9829 4.3442 0.361315000 4.2758 4.6347 0.358920000 4.5126 4.8687 0.356125000 4.7120 5.0663 0.354230000 4.8928 5.2465 0.3538
Deformation with W.T. at 24 in., Test 9-9Load
Cycles
Deformation with W.T. at 24 in., Test 9-7 Deformation with W.T. at 24 in., Test 9-8Load
CyclesLoad
Cycles

340
Table F.27 Spring Cemetery A-2-4 Soil Plate Load Test, 50 psi w/ Limerock
Permanent Total Resilient Permanent Total Resilient(mm) (mm) (mm) (mm) (mm) (mm)
1 0.2930 0.5710 0.2781 1 0.3380 0.6150 0.27704 0.3685 0.6525 0.2839 4 0.4273 0.7152 0.28795 0.3761 0.6594 0.2833 5 0.4351 0.7143 0.2792
10 0.4035 0.6863 0.2828 10 0.4609 0.7399 0.279025 0.4513 0.7391 0.2877 25 0.5056 0.7891 0.283550 0.4941 0.7835 0.2894 50 0.5450 0.8283 0.2833
100 0.5384 0.8291 0.2907 100 0.5876 0.8720 0.2844200 0.5645 0.8568 0.2923 200 0.6130 0.8966 0.2835500 0.6350 0.9248 0.2898 500 0.6871 0.9712 0.2842
1000 0.6815 0.9703 0.2888 1000 0.7376 1.0222 0.28462000 0.7269 1.0144 0.2875 2000 0.7908 1.0772 0.28635000 0.8014 1.0937 0.2922 5000 0.8890 1.1808 0.2918
10000 0.8853 1.1799 0.2946 10000 0.9927 1.2879 0.295215000 0.9555 1.2515 0.2960 15000 1.0417 1.3390 0.297320000 1.0085 1.3060 0.2975 20000 1.1095 1.4084 0.298825000 1.0545 1.3545 0.3000 25000 1.1462 1.4463 0.300130000 1.0668 1.3641 0.2974 30000 1.1760 1.4758 0.2998
Permanent Total Resilient(mm) (mm) (mm)
1 0.3803 0.6587 0.27844 0.4687 0.7572 0.28855 0.4762 0.7569 0.2808
10 0.5032 0.7844 0.281125 0.5464 0.8274 0.281150 0.5838 0.8633 0.2795
100 0.6219 0.9021 0.2802200 0.6466 0.9247 0.2781500 0.7110 0.9856 0.2745
1000 0.7558 1.0291 0.27322000 0.8027 1.0781 0.27545000 0.8796 1.1586 0.2789
10000 0.9552 1.2388 0.283615000 1.0112 1.2971 0.285920000 1.0598 1.3477 0.287825000 1.1020 1.3909 0.288830000 1.1387 1.4274 0.2886
Deformation with W.T. at 0 in., Test 9-10Load
Cycles
Deformation with W.T. at 0 in., Test 9-11Load
Cycles
Deformation with W.T. at 0 in., Test 9-12Load
Cycles

341
Table F.27 Continued
Permanent Total Resilient Permanent Total Resilient(mm) (mm) (mm) (mm) (mm) (mm)
1 0.3761 0.7530 0.3769 1 0.2781 0.6433 0.36524 0.4982 0.8957 0.3975 4 0.3859 0.7555 0.36975 0.5117 0.8947 0.3830 5 0.3956 0.7719 0.3763
10 0.5512 0.9259 0.3747 10 0.4317 0.8179 0.386225 0.6197 1.0074 0.3877 25 0.5001 0.8922 0.392250 0.6837 1.0618 0.3781 50 0.5573 0.9552 0.3979100 0.7521 1.1276 0.3755 100 0.6203 1.0156 0.3952200 0.7926 1.1659 0.3733 200 0.6557 1.0499 0.3942500 0.8979 1.2646 0.3667 500 0.7523 1.1324 0.3802
1000 0.9641 1.3289 0.3649 1000 0.8136 1.1912 0.37762000 1.0321 1.3960 0.3639 2000 0.8741 1.2553 0.38125000 1.1436 1.5091 0.3655 5000 0.9177 1.3038 0.386110000 1.2802 1.6475 0.3672 10000 0.9598 1.3539 0.394015000 1.3643 1.7310 0.3667 15000 1.0255 1.4042 0.378720000 1.4511 1.8233 0.3722 20000 1.0855 1.4621 0.376525000 1.5257 1.8937 0.3680 25000 1.1433 1.5201 0.376830000 1.5826 1.9495 0.3669 30000 1.1988 1.5773 0.3784
Permanent Total Resilient(mm) (mm) (mm)
1 0.3700 0.7276 0.35774 0.4764 0.8431 0.36675 0.4918 0.8751 0.3833
10 0.5349 0.9116 0.376825 0.6060 0.9861 0.380150 0.6669 1.0460 0.3791100 0.7324 1.1085 0.3760200 0.7692 1.1423 0.3731500 0.8646 1.2314 0.3668
1000 0.9252 1.2900 0.36492000 0.9862 1.3503 0.36405000 1.1015 1.4675 0.366010000 1.2149 1.5804 0.365515000 1.3122 1.6762 0.364020000 1.3884 1.7521 0.363725000 1.4575 1.8197 0.362230000 1.5124 1.8748 0.3623
Deformation with W.T. at 12 in., Test 9-13Load
Cycles
Deformation with W.T. at 12 in., Test 9-15Load
Cycles
Deformation with W.T. at 12 in., Test 9-14Load
Cycles

342
Table F.27 Continued
Permanent Total Resilient Permanent Total Resilient(mm) (mm) (mm) (mm) (mm) (mm)
1 0.3771 0.8293 0.4522 1 0.3919 0.8898 0.49804 0.5214 1.1249 0.6035 4 0.5517 1.0895 0.53775 0.5392 1.1249 0.5857 5 0.5782 1.0888 0.5106
10 0.5988 1.1620 0.5632 10 0.6559 1.1728 0.516825 0.7092 1.1963 0.4871 25 0.7902 1.3138 0.523750 0.8187 1.3129 0.4942 50 0.9106 1.4367 0.5261100 0.9432 1.4391 0.4960 100 1.0445 1.5673 0.5228200 1.0203 1.5170 0.4967 200 1.1251 1.6459 0.5208500 1.2287 1.7234 0.4948 500 1.3486 1.8628 0.5142
1000 1.3727 1.8661 0.4934 1000 1.5056 2.0150 0.50942000 1.5240 2.0162 0.4922 2000 1.6680 2.1754 0.50745000 1.7594 2.2516 0.4922 5000 1.9138 2.4164 0.5026
10000 2.0034 2.4913 0.4879 10000 2.1690 2.6681 0.499115000 2.1809 2.6663 0.4854 15000 2.3669 2.8638 0.496820000 2.3250 2.8074 0.4824 20000 2.5157 3.0112 0.495525000 2.4582 2.9391 0.4810 25000 2.6464 3.1408 0.494330000 2.5698 3.0618 0.4920 30000 2.7623 3.2562 0.4939
Permanent Total Resilient(mm) (mm) (mm)
1 0.4931 1.0202 0.52724 0.6949 1.2378 0.54295 0.7310 1.2857 0.5547
10 0.8309 1.4010 0.570225 1.0670 1.6762 0.609250 1.3047 1.9098 0.6050100 1.5556 2.1427 0.5872200 1.6968 2.2753 0.5785500 2.0954 2.6538 0.5584
1000 2.3665 2.9150 0.54852000 2.6452 3.1868 0.54165000 3.0823 3.6156 0.5333
10000 3.5339 4.0646 0.530715000 3.9126 4.4427 0.530120000 4.2327 4.7620 0.529225000 4.5346 5.0663 0.531730000 4.8195 5.3547 0.5352
Deformation with W.T. at 24 in., Test 9-18Load
Cycles
Deformation with W.T. at 24 in., Test 9-16 Deformation with W.T. at 24 in., Test 9-17Load
CyclesLoad
Cycles

343
Table F.27 Continued
Permanent Total Resilient Permanent Total Resilient(mm) (mm) (mm) (mm) (mm) (mm)
1 0.4828 1.1023 0.6195 1 0.4637 1.0063 0.54264 0.6775 1.3059 0.6284 4 0.6408 1.2277 0.58695 0.7043 1.3334 0.6291 5 0.6640 1.2277 0.563610 0.8073 1.4372 0.6299 10 0.7560 1.3286 0.572625 0.9914 1.6262 0.6348 25 0.9197 1.5045 0.584850 1.1651 1.7986 0.6335 50 1.0788 1.6703 0.5914
100 1.3614 1.9922 0.6308 100 1.2637 1.8592 0.5955200 1.4850 2.1136 0.6286 200 1.3796 1.9782 0.5986500 1.8386 2.4595 0.6209 500 1.7412 2.3377 0.59641000 2.1100 2.7287 0.6187 1000 2.0379 2.6363 0.59842000 2.4118 3.0335 0.6217 2000 2.4111 3.0171 0.60595000 2.9576 3.5940 0.6364 5000 3.1836 3.8078 0.624310000 3.7069 4.3623 0.6554 10000 4.1824 4.8244 0.642015000 4.3039 4.9707 0.6669 15000 4.9895 5.6390 0.649620000 4.7836 5.4564 0.6728 20000 5.6377 6.2857 0.648125000 5.2200 5.8942 0.6742 25000 6.2274 6.8722 0.644930000 5.5799 6.2497 0.6698 30000 6.7295 7.3648 0.6353
Permanent Total Resilient(mm) (mm) (mm)
1 0.4625 1.0323 0.56984 0.6377 1.2561 0.61845 0.6662 1.2548 0.588610 0.7644 1.3575 0.593125 0.9326 1.5357 0.603050 1.0899 1.6983 0.6084
100 1.2712 1.8834 0.6123200 1.3911 2.0044 0.6133500 1.7491 2.3689 0.61991000 2.0538 2.6854 0.63162000 2.5043 3.1654 0.66115000 3.7172 4.4429 0.725710000 5.3708 6.1118 0.741015000 6.4461 7.1524 0.706320000 7.1801 7.8643 0.684225000 7.7577 8.4325 0.674930000 8.2147 8.8971 0.6824
Load Cycles
Load Cycles
Deformation with W.T. at 36 in., Test 9-21Load
Cycles
Deformation with W.T. at 36 in., Test 9-19 Deformation with W.T. at 36 in., Test 9-20

344
Table F.27 Continued
Permanent Total Resilient Permanent Total Resilient(mm) (mm) (mm) (mm) (mm) (mm)
1 0.4406 0.9201 0.4795 1 0.4431 0.9242 0.48124 0.5948 1.0893 0.4946 4 0.5927 1.0774 0.48475 0.6152 1.1088 0.4936 5 0.6092 1.0978 0.488710 0.6856 1.1854 0.4998 10 0.6608 1.1630 0.502225 0.8031 1.3132 0.5101 25 0.7481 1.2569 0.508850 0.9099 1.4272 0.5173 50 0.8283 1.3391 0.5108100 1.0336 1.5555 0.5219 100 0.9177 1.4317 0.5140200 1.1106 1.6351 0.5245 200 0.9743 1.4895 0.5152500 1.3337 1.8637 0.5300 500 1.1405 1.6609 0.52041000 1.5008 2.0349 0.5341 1000 1.2684 1.7915 0.52312000 1.6842 2.2255 0.5413 2000 1.4158 1.9442 0.52835000 2.0132 2.5618 0.5486 5000 1.6848 2.2201 0.535310000 2.3420 2.8958 0.5538 10000 2.0037 2.5418 0.538115000 2.5782 3.1336 0.5554 15000 2.2508 2.7915 0.540620000 2.7642 3.3206 0.5564 20000 2.4598 3.0019 0.542125000 2.9264 3.4817 0.5553 25000 2.6275 3.1743 0.546830000 3.0700 3.6233 0.5533 30000 2.7460 3.2901 0.5441
Permanent Total Resilient(mm) (mm) (mm)
1 0.4567 0.9020 0.44534 0.6121 1.0716 0.45955 0.6337 1.0911 0.457410 0.7104 1.1775 0.467125 0.8375 1.3148 0.477350 0.9526 1.4357 0.4832100 1.0764 1.5645 0.4880200 1.1531 1.6427 0.4895500 1.3739 1.8658 0.49191000 1.5358 2.0306 0.49482000 1.7154 2.2162 0.50085000 2.0113 2.5227 0.511410000 2.3328 2.8564 0.523615000 2.5811 3.1006 0.519520000 2.7867 3.3100 0.523325000 2.9544 3.4753 0.520930000 3.1238 3.6402 0.5164
Deformation with W.T. at 24 in. (Drawdown), Test 9-22 Deformation with W.T. at 24 in. (Drawdown), Test 9-23
Load Cycles Load Cycles
Deformation with W.T. at 24 in. (Drawdown), Test 9-24
Load Cycles

345
Table F.27 Continued
Permanent Total Resilient Permanent Total Resilient(mm) (mm) (mm) (mm) (mm) (mm)
1 0.3634 0.7670 0.4036 1 0.3030 0.6688 0.36584 0.4924 0.9184 0.4260 4 0.4002 0.7748 0.37475 0.5094 0.9175 0.4082 5 0.4129 0.7907 0.377810 0.5639 0.9742 0.4103 10 0.4532 0.8319 0.378725 0.6523 1.0649 0.4126 25 0.5144 0.8957 0.381350 0.7302 1.1420 0.4118 50 0.5656 0.9471 0.3815100 0.8120 1.2220 0.4099 100 0.6205 1.0021 0.3816200 0.8948 1.3021 0.4073 200 0.6750 1.0564 0.3814500 1.0004 1.4055 0.4051 500 0.7499 1.1310 0.38111000 1.0873 1.4913 0.4040 1000 0.8097 1.1922 0.38252000 1.1937 1.6027 0.4090 2000 0.8761 1.2613 0.38525000 1.2935 1.6996 0.4061 5000 0.9825 1.3625 0.379910000 1.4530 1.8594 0.4064 10000 1.1072 1.4876 0.380415000 1.5708 1.9800 0.4093 15000 1.2232 1.6080 0.384820000 1.6600 2.0729 0.4129 20000 1.3169 1.6934 0.376625000 1.7444 2.1566 0.4122 25000 1.3682 1.7450 0.376730000 1.8138 2.2221 0.4083 30000 1.4252 1.7996 0.3744
Permanent Total Resilient(mm) (mm) (mm)
1 0.3282 0.7227 0.39454 0.4623 0.8796 0.41735 0.4783 0.8796 0.401210 0.5294 0.9317 0.402225 0.6051 1.0095 0.404550 0.6680 1.0719 0.4039100 0.7350 1.1366 0.4016200 0.8019 1.2022 0.4003500 0.8914 1.2903 0.39891000 0.9593 1.3590 0.39982000 1.0348 1.4365 0.40175000 1.1615 1.5669 0.405410000 1.2953 1.7047 0.409415000 1.3935 1.8032 0.409720000 1.4731 1.8835 0.410425000 1.5557 1.9664 0.410630000 1.6245 2.0355 0.4109
Deformation with W.T. at 12 in. (Drawdown), Test 9-27
Load Cycles
Deformation with W.T. at 12 in. (Drawdown), Test 9-25 Deformation with W.T. at 12 in. (Drawdown), Test 9-26
Load Cycles Load Cycles

346
Table F.28 Summary of Deformation for Spring Cemetery A-2-4 (15%) Soil Plate Load Test, 20 psi Plate Load
Test No. 9-1 9-2 9-3 9-4 9-5 9-6 9-7 9-8 9-9
Test Date 7/19/2005 7/20/2005 7/21/2005 8/12/2005 8/15/2005 8/16/2005 12/20/2005 12/21/2005 12/22/2005
Loads (psi) 20 20 20 20 20 20 20 20 20
Limerock Layer No No No No No No No No No
0 0 0 12 12 12 24 24 24
1 0.01103 0.01007 0.00973 0.01090 0.01022 0.00931 0.01579 0.01293 0.01655
4 0.01431 0.01003 0.01115 0.01076 0.00974 0.01532 0.01290 0.01714
5 0.01569 0.00964 0.01133 0.01037 0.01001 0.01536 0.01286 0.01712
10 0.01379 0.00836 0.01153 0.01117 0.00998 0.01526 0.01279 0.01703
25 0.01068 0.01054 0.01138 0.01086 0.00995 0.01503 0.01279 0.01672
50 0.01074 0.01025 0.01133 0.01080 0.00996 0.01485 0.01283 0.01653
100 0.01035 0.01077 0.01009 0.01129 0.01075 0.00995 0.01464 0.01287 0.01618
200 0.01027 0.01070 0.01008 0.01119 0.01067 0.00989 0.01451 0.01292 0.01584
500 0.01014 0.01066 0.00998 0.01110 0.01056 0.00988 0.01438 0.01278 0.01543
1000 0.01008 0.01063 0.00995 0.01104 0.01049 0.00984 0.01438 0.01274 0.01512
2000 0.01005 0.01065 0.00994 0.01103 0.01049 0.00992 0.01436 0.01282 0.01486
5000 0.01004 0.01057 0.00994 0.01104 0.01043 0.01000 0.01438 0.01283 0.01446
10000 0.01003 0.01047 0.00986 0.01100 0.01047 0.01004 0.01445 0.01322 0.01422
15000 0.01004 0.01041 0.00980 0.01102 0.01045 0.01008 0.01452 0.01323 0.01413
20000 0.00998 0.01034 0.00981 0.01103 0.01044 0.01007 0.01460 0.01321 0.01402
25000 0.00989 0.01027 0.00977 0.01103 0.01040 0.01007 0.01455 0.01328 0.01395
30000 0.00957 0.01026 0.00974 0.01100 0.01040 0.01009 0.01454 0.01312 0.01393Average from 10,000 Cycles 0.00990 0.01035 0.00979 0.01101 0.01043 0.01007 0.01453 0.01321 0.01405
No.of Plate Load Cycles
W ater Table (in. above Embankment)
Resilient Deformation (in.) for Spring A-2-4 Soil
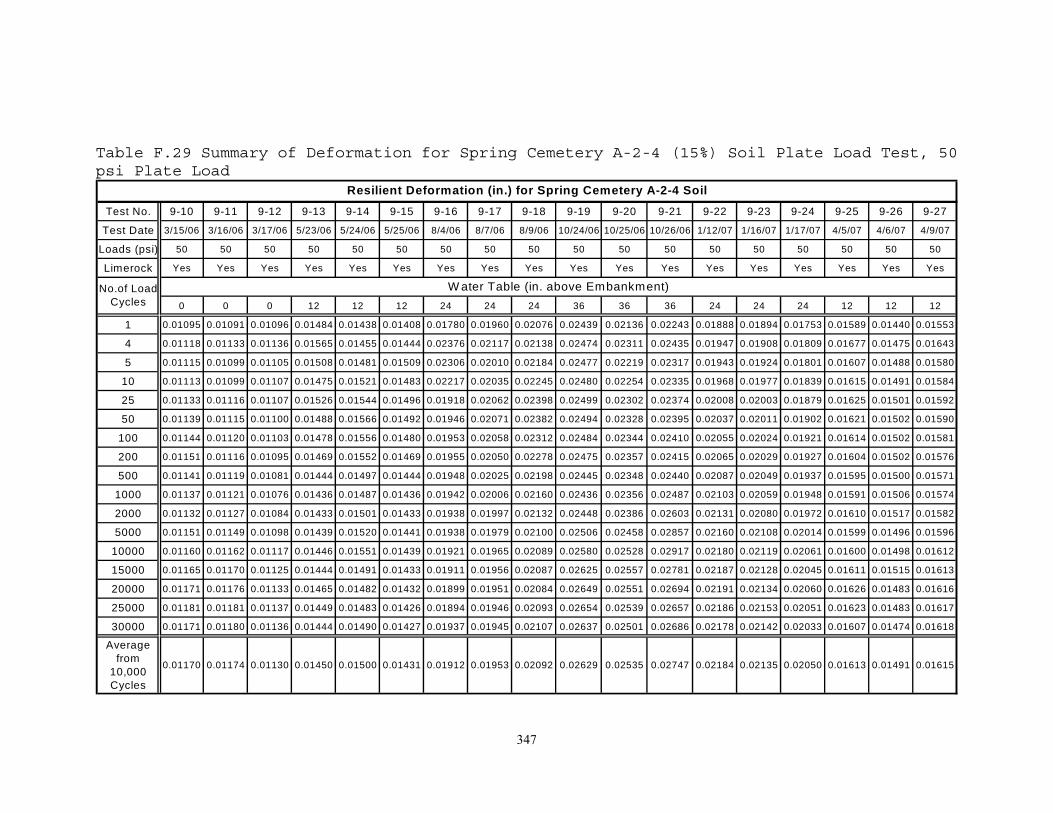
347
Table F.29 Summary of Deformation for Spring Cemetery A-2-4 (15%) Soil Plate Load Test, 50 psi Plate Load
Test No. 9-10 9-11 9-12 9-13 9-14 9-15 9-16 9-17 9-18 9-19 9-20 9-21 9-22 9-23 9-24 9-25 9-26 9-27
Test Date 3/15/06 3/16/06 3/17/06 5/23/06 5/24/06 5/25/06 8/4/06 8/7/06 8/9/06 10/24/06 10/25/06 10/26/06 1/12/07 1/16/07 1/17/07 4/5/07 4/6/07 4/9/07
Loads (psi) 50 50 50 50 50 50 50 50 50 50 50 50 50 50 50 50 50 50
Limerock Yes Yes Yes Yes Yes Yes Yes Yes Yes Yes Yes Yes Yes Yes Yes Yes Yes Yes
0 0 0 12 12 12 24 24 24 36 36 36 24 24 24 12 12 12
1 0.01095 0.01091 0.01096 0.01484 0.01438 0.01408 0.01780 0.01960 0.02076 0.02439 0.02136 0.02243 0.01888 0.01894 0.01753 0.01589 0.01440 0.01553
4 0.01118 0.01133 0.01136 0.01565 0.01455 0.01444 0.02376 0.02117 0.02138 0.02474 0.02311 0.02435 0.01947 0.01908 0.01809 0.01677 0.01475 0.01643
5 0.01115 0.01099 0.01105 0.01508 0.01481 0.01509 0.02306 0.02010 0.02184 0.02477 0.02219 0.02317 0.01943 0.01924 0.01801 0.01607 0.01488 0.01580
10 0.01113 0.01099 0.01107 0.01475 0.01521 0.01483 0.02217 0.02035 0.02245 0.02480 0.02254 0.02335 0.01968 0.01977 0.01839 0.01615 0.01491 0.01584
25 0.01133 0.01116 0.01107 0.01526 0.01544 0.01496 0.01918 0.02062 0.02398 0.02499 0.02302 0.02374 0.02008 0.02003 0.01879 0.01625 0.01501 0.01592
50 0.01139 0.01115 0.01100 0.01488 0.01566 0.01492 0.01946 0.02071 0.02382 0.02494 0.02328 0.02395 0.02037 0.02011 0.01902 0.01621 0.01502 0.01590
100 0.01144 0.01120 0.01103 0.01478 0.01556 0.01480 0.01953 0.02058 0.02312 0.02484 0.02344 0.02410 0.02055 0.02024 0.01921 0.01614 0.01502 0.01581
200 0.01151 0.01116 0.01095 0.01469 0.01552 0.01469 0.01955 0.02050 0.02278 0.02475 0.02357 0.02415 0.02065 0.02029 0.01927 0.01604 0.01502 0.01576
500 0.01141 0.01119 0.01081 0.01444 0.01497 0.01444 0.01948 0.02025 0.02198 0.02445 0.02348 0.02440 0.02087 0.02049 0.01937 0.01595 0.01500 0.01571
1000 0.01137 0.01121 0.01076 0.01436 0.01487 0.01436 0.01942 0.02006 0.02160 0.02436 0.02356 0.02487 0.02103 0.02059 0.01948 0.01591 0.01506 0.01574
2000 0.01132 0.01127 0.01084 0.01433 0.01501 0.01433 0.01938 0.01997 0.02132 0.02448 0.02386 0.02603 0.02131 0.02080 0.01972 0.01610 0.01517 0.01582
5000 0.01151 0.01149 0.01098 0.01439 0.01520 0.01441 0.01938 0.01979 0.02100 0.02506 0.02458 0.02857 0.02160 0.02108 0.02014 0.01599 0.01496 0.01596
10000 0.01160 0.01162 0.01117 0.01446 0.01551 0.01439 0.01921 0.01965 0.02089 0.02580 0.02528 0.02917 0.02180 0.02119 0.02061 0.01600 0.01498 0.01612
15000 0.01165 0.01170 0.01125 0.01444 0.01491 0.01433 0.01911 0.01956 0.02087 0.02625 0.02557 0.02781 0.02187 0.02128 0.02045 0.01611 0.01515 0.01613
20000 0.01171 0.01176 0.01133 0.01465 0.01482 0.01432 0.01899 0.01951 0.02084 0.02649 0.02551 0.02694 0.02191 0.02134 0.02060 0.01626 0.01483 0.01616
25000 0.01181 0.01181 0.01137 0.01449 0.01483 0.01426 0.01894 0.01946 0.02093 0.02654 0.02539 0.02657 0.02186 0.02153 0.02051 0.01623 0.01483 0.01617
30000 0.01171 0.01180 0.01136 0.01444 0.01490 0.01427 0.01937 0.01945 0.02107 0.02637 0.02501 0.02686 0.02178 0.02142 0.02033 0.01607 0.01474 0.01618
Average from
10,000 Cycles
0.01170 0.01174 0.01130 0.01450 0.01500 0.01431 0.01912 0.01953 0.02092 0.02629 0.02535 0.02747 0.02184 0.02135 0.02050 0.01613 0.01491 0.01615
No.of Load Cycles
Resilient Deformation (in.) for Spring Cemetery A-2-4 Soil
W ater Table (in. above Embankment)

348
Deformation for Spring Cemetery A-2-4 Soil, Plate Load Test 9-1
0.00
0.10
0.20
0.30
0.40
0.50
0.60
0.70
0.80
0.90
1.00
1 10 100 1000 10000 100000
Number of Cycles
Def
orm
atio
n, m
mPermanentTotalResilient
( Plate Load : 20 psi, w/out Limerock Base Layer, Base Clearance : 3 ft )
Figure F.89 Spring Cemetery A-2-4 (15%) Soil, Deformation under 20 psi Plate Load (Water Table at 0.0 in., w/out Limerock, Test 9-1)
Deformation for Spring Cemetery A-2-4 Soil, Plate Load Test 9-2
0.00
0.20
0.40
0.60
0.80
1.00
1.20
1.40
1.60
1.80
2.00
1 10 100 1000 10000 100000
Number of Cycles
Def
orm
atio
n, m
m
PermanentTotalResilient
( Plate Load : 20 psi, w/out Limerock Base Layer, Base Clearance : 3 ft )
Figure F.90 Spring Cemetery A-2-4 (15%) Soil, Deformation under 20 psi Plate Load (Water Table at 0.0 in., w/out Limerock, Test 9-2)

349
Deformation for Spring Cemetery A-2-4 Soil, Plate Load Test 9-3
0.00
0.20
0.40
0.60
0.80
1.00
1.20
1.40
1.60
1 10 100 1000 10000 100000
Number of Cycles
Def
orm
atio
n, m
mPermanentTotalResilient
( Plate Load : 20 psi, w/out Limerock Base Layer, Base Clearance : 3 ft )
Figure F.91 Spring Cemetery A-2-4 (15%) Soil, Deformation under 20 psi Plate Load (Water Table at 0.0 in., w/out Limerock, Test 9-3)
Deformation for Spring Cemetery A-2-4 Soil, Plate Load Test 9-4
0.00
0.20
0.40
0.60
0.80
1.00
1.20
1.40
1.60
1.80
2.00
1 10 100 1000 10000 100000
Number of Cycles
Def
orm
atio
n, m
m
PermanentTotalResilient
( Plate Load : 20 psi, w/out Limerock Base Layer, Base Clearance : 2 ft )
Figure F.92 Spring Cemetery A-2-4 (15%) Soil, Deformation under 20 psi Plate Load (Water Table at 12 in., w/out Limerock, Test 9-4)

350
Deformation for Spring Cemetery A-2-4 Soil, Plate Load Test 9-5
0.00
0.20
0.40
0.60
0.80
1.00
1.20
1.40
1.60
1 10 100 1000 10000 100000
Number of Cycles
Def
orm
atio
n, m
mPermanentTotalResilient
( Plate Load : 20 psi, w/out Limerock Base Layer, Base Clearance : 2 ft )
Figure F.93 Spring Cemetery A-2-4 (15%) Soil, Deformation under 20 psi Plate Load (Water Table at 12 in., w/out Limerock, Test 9-5)
Deformation for Spring Cemetery A-2-4 Soil, Plate Load Test 9-6
0.00
0.20
0.40
0.60
0.80
1.00
1.20
1.40
1.60
1.80
1 10 100 1000 10000 100000
Number of Cycles
Def
orm
atio
n, m
m
PermanentTotalResilient
( Plate Load : 20 psi, w/out Limerock Base Layer, Base Clearance : 2 ft )
Figure F.94 Spring Cemetery A-2-4 (15%) Soil, Deformation under 20 psi Plate Load (Water Table at 12 in., w/out Limerock, Test 9-6)

351
Deformation for Spring Cemetery A-2-4 Soil, Plate Load Test 9-7
0.00
0.50
1.00
1.50
2.00
2.50
3.00
1 10 100 1000 10000 100000
Number of Cycles
Def
orm
atio
n, m
mPermanentTotalResilient
( Plate Load : 20 psi, w/out Limerock Base Layer, Base Clearance : 1 ft )
Figure F.95 Spring Cemetery A-2-4 (15%) Soil, Deformation under 20 psi Plate Load (Water Table at 24 in., w/out Limerock, Test 9-7)
Deformation for Spring Cemetery A-2-4 Soil, Plate Load Test 9-8
0.00
0.50
1.00
1.50
2.00
2.50
3.00
3.50
1 10 100 1000 10000 100000
Number of Cycles
Def
orm
atio
n, m
m
PermanentTotalResilient
( Plate Load : 20 psi, w/out Limerock Base Layer, Base Clearance : 1 ft )
Figure F.96 Spring Cemetery A-2-4 (15%) Soil, Deformation under 20 psi Plate Load (Water Table at 24 in., w/out Limerock, Test 9-8)

352
Deformation for Spring Cemetery A-2-4 Soil, Plate Load Test 9-9
0.00
1.00
2.00
3.00
4.00
5.00
6.00
1 10 100 1000 10000 100000
Number of Cycles
Def
orm
atio
n, m
mPermanentTotalResilient
( Plate Load : 20 psi, w/out Limerock Base Layer, Base Clearance : 1 ft )
Figure F.97 Spring Cemetery A-2-4 (15%) Soil, Deformation under 20 psi Plate Load (Water Table at 24 in., w/out Limerock, Test 9-9)
Deformation for Spring Cemetery A-2-4 Soil, Plate Load Test 9-10
0.00
0.20
0.40
0.60
0.80
1.00
1.20
1.40
1.60
1 10 100 1000 10000 100000
Number of Cycles
Def
orm
atio
n, m
m
PermanentTotalResilient
( Plate Load : 50 psi w/ Limerock Base Layer, Base Clearance : 3 ft )
Figure F.98 Spring Cemetery A-2-4 (15%) Soil, Deformation under 50 psi Plate Load (Water Table at 0.0 in., w/ Limerock, Test 9-10)

353
Deformation for Spring Cemetery A-2-4 Soil, Plate Load Test 9-11
0.00
0.20
0.40
0.60
0.80
1.00
1.20
1.40
1.60
1 10 100 1000 10000 100000
Number of Cycles
Def
orm
atio
n, m
mPermanentTotalResilient
( Plate Load : 50 psi w/ Limerock Base Layer, Base Clearance : 3 ft )
Figure F.99 Spring Cemetery A-2-4 (15%) Soil, Deformation under 50 psi Plate Load (Water Table at 0.0 in., w/ Limerock, Test 9-11)
Deformation for Spring Cemetery A-2-4 Soil, Plate Load Test 9-12
0.00
0.20
0.40
0.60
0.80
1.00
1.20
1.40
1.60
1 10 100 1000 10000 100000
Number of Cycles
Def
orm
atio
n, m
m
PermanentTotalResilient
( Plate Load : 50 psi w/ Limerock Base Layer, Base Clearance : 3 ft )
Figure F.100 Spring Cemetery A-2-4 (15%) Soil, Deformation under 50 psi Plate Load (Water Table at 0.0 in., w/ Limerock, Test 9-12)
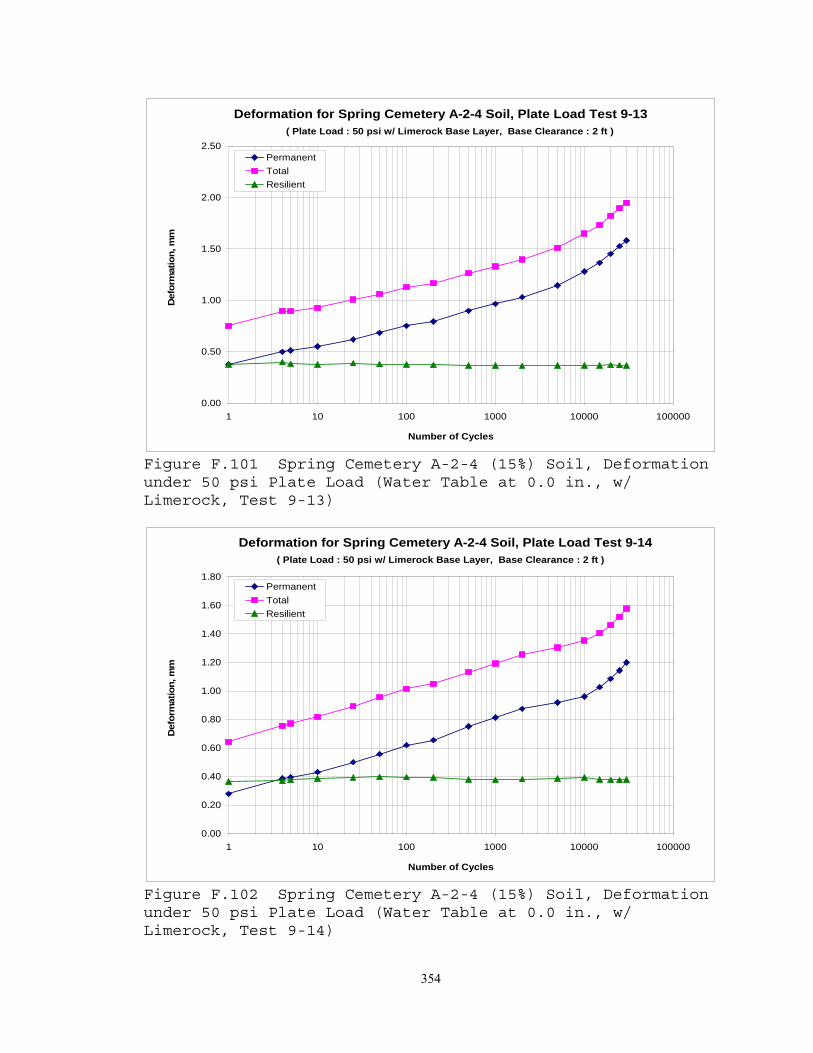
354
Deformation for Spring Cemetery A-2-4 Soil, Plate Load Test 9-13
0.00
0.50
1.00
1.50
2.00
2.50
1 10 100 1000 10000 100000
Number of Cycles
Def
orm
atio
n, m
mPermanentTotalResilient
( Plate Load : 50 psi w/ Limerock Base Layer, Base Clearance : 2 ft )
Figure F.101 Spring Cemetery A-2-4 (15%) Soil, Deformation under 50 psi Plate Load (Water Table at 0.0 in., w/ Limerock, Test 9-13)
Deformation for Spring Cemetery A-2-4 Soil, Plate Load Test 9-14
0.00
0.20
0.40
0.60
0.80
1.00
1.20
1.40
1.60
1.80
1 10 100 1000 10000 100000
Number of Cycles
Def
orm
atio
n, m
m
PermanentTotalResilient
( Plate Load : 50 psi w/ Limerock Base Layer, Base Clearance : 2 ft )
Figure F.102 Spring Cemetery A-2-4 (15%) Soil, Deformation under 50 psi Plate Load (Water Table at 0.0 in., w/ Limerock, Test 9-14)

355
Deformation for Spring Cemetery A-2-4 Soil, Plate Load Test 9-15
0.00
0.20
0.40
0.60
0.80
1.00
1.20
1.40
1.60
1.80
2.00
1 10 100 1000 10000 100000
Number of Cycles
Def
orm
atio
n, m
mPermanentTotalResilient
( Plate Load : 50 psi w/ Limerock Base Layer, Base Clearance : 2 ft )
Figure F.103 Spring Cemetery A-2-4 (15%) Soil, Deformation under 50 psi Plate Load (Water Table at 0.0 in., w/ Limerock, Test 9-15)
Deformation for Spring Cemetery A-2-4 Soil, Plate Load Test 9-16
0.00
0.50
1.00
1.50
2.00
2.50
3.00
3.50
1 10 100 1000 10000 100000
Number of Cycles
Def
orm
atio
n, m
m
PermanentTotalResilient
( Plate Load : 50 psi w/ Limerock Base Layer, Base Clearance : 1 ft )
Figure F.104 Spring Cemetery A-2-4 (15%) Soil, Deformation under 50 psi Plate Load (Water Table at 0.0 in., w/ Limerock, Test 9-16)

356
Deformation for Spring Cemetery A-2-4 Soil, Plate Load Test 9-17
0.00
0.50
1.00
1.50
2.00
2.50
3.00
3.50
1 10 100 1000 10000 100000
Number of Cycles
Def
orm
atio
n, m
mPermanentTotalResilient
( Plate Load : 50 psi w/ Limerock Base Layer, Base Clearance : 1 ft )
Figure F.105 Spring Cemetery A-2-4 (15%) Soil, Deformation under 50 psi Plate Load (Water Table at 0.0 in., w/ Limerock, Test 9-17)
Deformation for Spring Cemetery A-2-4 Soil, Plate Load Test 9-18
0.00
1.00
2.00
3.00
4.00
5.00
6.00
1 10 100 1000 10000 100000
Number of Cycles
Def
orm
atio
n, m
m
PermanentTotalResilient
( Plate Load : 50 psi w/ Limerock Base Layer, Base Clearance : 1 ft )
Figure F.106 Spring Cemetery A-2-4 (15%) Soil, Deformation under 50 psi Plate Load (Water Table at 0.0 in., w/ Limerock, Test 9-18)

357
Deformation for Spring Cemetery A-2-4 Soil, Plate Load Test 9-19
0.00
1.00
2.00
3.00
4.00
5.00
6.00
7.00
1 10 100 1000 10000 100000
Number of Cycles
Def
orm
atio
n, m
mPermanentTotalResilient
( Plate Load : 50 psi w/ Limerock Base Layer, Base Clearance : 0 ft )
Figure F.107 Spring Cemetery A-2-4 (15%) Soil, Deformation under 50 psi Plate Load (Water Table at 0.0 in., w/ Limerock, Test 9-19)
Deformation for Spring Cemetery A-2-4 Soil, Plate Load Test 9-20
0.00
1.00
2.00
3.00
4.00
5.00
6.00
7.00
8.00
1 10 100 1000 10000 100000
Number of Cycles
Def
orm
atio
n, m
m
PermanentTotalResilient
( Plate Load : 50 psi w/ Limerock Base Layer, Base Clearance : 0 ft )
Figure F.108 Spring Cemetery A-2-4 (15%) Soil, Deformation under 50 psi Plate Load (Water Table at 0.0 in., w/ Limerock, Test 9-20)

358
Deformation for Spring Cemetery A-2-4 Soil, Plate Load Test 9-21
0.00
1.00
2.00
3.00
4.00
5.00
6.00
7.00
8.00
9.00
10.00
1 10 100 1000 10000 100000
Number of Cycles
Def
orm
atio
n, m
m
PermanentTotalResilient
( Plate Load : 50 psi w/ Limerock Base Layer, Base Clearance : 0 ft )
Figure F.109 Spring Cemetery A-2-4 (15%) Soil, Deformation under 50 psi Plate Load (Water Table at 0.0 in., w/ Limerock, Test 9-21)
Deformation for Spring Cemetery A-2-4 Soil, Plate Load Test 9-22
0.00
0.50
1.00
1.50
2.00
2.50
3.00
3.50
4.00
1 10 100 1000 10000 100000
Number of Cycles
Def
orm
atio
n, m
m
PermanentTotalResilient
( Plate Load : 50 psi w/ Limerock Base Layer, Base Clearance : 1 ft (drawdown))
Figure F.110 Spring Cemetery A-2-4 (15%) Soil, Deformation under 50 psi Plate Load (Water Table at 0.0 in., w/ Limerock, Test 9-22)

359
Deformation for Spring Cemetery A-2-4 Soil, Plate Load Test 9-23
0.00
0.50
1.00
1.50
2.00
2.50
3.00
3.50
1 10 100 1000 10000 100000
Number of Cycles
Def
orm
atio
n, m
mPermanentTotalResilient
( Plate Load : 50 psi w/ Limerock Base Layer, Base Clearance : 1 ft (drawdown))
Figure F.111 Spring Cemetery A-2-4 (15%) Soil, Deformation under 50 psi Plate Load (Water Table at 0.0 in., w/ Limerock, Test 9-23)
Deformation for Spring Cemetery A-2-4 Soil, Plate Load Test 9-24
0.00
0.50
1.00
1.50
2.00
2.50
3.00
3.50
4.00
1 10 100 1000 10000 100000
Number of Cycles
Def
orm
atio
n, m
m
PermanentTotalResilient
( Plate Load : 50 psi w/ Limerock Base Layer, Base Clearance : 1 ft (drawdown))
Figure F.112 Spring Cemetery A-2-4 (15%) Soil, Deformation under 50 psi Plate Load (Water Table at 0.0 in., w/ Limerock, Test 9-24)

360
Deformation for Spring Cemetery A-2-4 Soil, Plate Load Test 9-25
0.00
0.50
1.00
1.50
2.00
2.50
1 10 100 1000 10000 100000
Number of Cycles
Def
orm
atio
n, m
mPermanentTotalResilient
( Plate Load : 50 psi w/ Limerock Base Layer, Base Clearance : 1 ft (drawdown))
Figure F.113 Spring Cemetery A-2-4 (15%) Soil, Deformation under 50 psi Plate Load (Water Table at 0.0 in., w/ Limerock, Test 9-25)
Deformation for Spring Cemetery A-2-4 Soil, Plate Load Test 9-26
0.00
0.20
0.40
0.60
0.80
1.00
1.20
1.40
1.60
1.80
2.00
1 10 100 1000 10000 100000
Number of Cycles
Def
orm
atio
n, m
m
PermanentTotalResilient
( Plate Load : 50 psi w/ Limerock Base Layer, Base Clearance : 2 ft (drawdown))
Figure F.114 Spring Cemetery A-2-4 (15%) Soil, Deformation under 50 psi Plate Load (Water Table at 0.0 in., w/ Limerock, Test 9-26)

361
Deformation for Spring Cemetery A-2-4 Soil, Plate Load Test 9-27
0.00
0.50
1.00
1.50
2.00
2.50
1 10 100 1000 10000 100000
Number of Cycles
Def
orm
atio
n, m
mPermanentTotalResilient
( Plate Load : 50 psi w/ Limerock Base Layer, Base Clearance : 1 ft (drawdown))
Figure F.115 Spring Cemetery A-2-4 (15%) Soil, Deformation under 50 psi Plate Load (Water Table at 0.0 in., w/ Limerock, Test 9-27)
Spring Cemetery A-2-4 Resilient Deformation v.s. Load Cycles (20 psi )
0.00000
0.00200
0.00400
0.00600
0.00800
0.01000
0.01200
0.01400
0.01600
0.01800
1 10 100 1000 10000 100000
Load Cycles
Res
ilien
t Def
orm
atio
n (in
ch)
Test 9-1 : Base Clearance 3 ft _1 Test 9-2 : Base Clearance 3 ft _2 Test 9-3 : Base Clearance 3 ft _3Test 9-4 : Base Clearance 2 ft _1 Test 9-5 : Base Clearance 2 ft _2 Test 9-6 : Base Clearance 2 ft _3Test 9-7 : Base Clearance 1 ft _1 Test 9-8 : Base Clearance 1 ft _2 Test 9-9 : Base Clearance 1 ft _3
Figure F.116 Spring Cemetery A-2-4 Soil, Deformation Summary under 20 psi Plate Load at Different Water Table Level

362
Spring Cemetery A-2-4 Resilient Deformation v.s. Load Cycles (50 psi )
0.00000
0.00500
0.01000
0.01500
0.02000
0.02500
0.03000
0.03500
1 10 100 1000 10000 100000
Load Cycles
Res
ilien
t Def
orm
atio
n (in
ch)
Test 9-10 : Base Clearance 3 ft _1 Test 9-11 : Base Clearance 3 ft _2 Test 9-12 : Base Clearance 3 ft _3Test 9-13 : Base Clearance 2 ft _1 Test 9-14 : Base Clearance 2 ft _2 Test 9-15 : Base Clearance 2 ft _3Test 9-16 : Base Clearance 1 ft _1 Test 9-17 : Base Clearance 1 ft _2 Test 9-18 : Base Clearance 1 ft _3Test 9-19 : Base Clearance 0 ft _1 Test 9-20 : Base Clearance 0 ft _2 Test 9-21 : Base Clearance 0 ft _3Test 9-22 : Base Clearance 1 ft _1 (Drawdown) Test 9-23 : Base Clearance 1 ft _2 (Drawdown) Test 9-24 : Base Clearance 1 ft _3 (Drawdown)Test 9-25 : Base Clearance 2 ft _1 (Drawdown) Test 9-26 : Base Clearance 2 ft _2 (Drawdown) Test 9-27 : Base Clearance 2 ft _3 (Drawdown)
Figure F.117 Spring Cemetery A-2-4 Soil, Deformation Summary under 50 psi Plate Load at Different Water Table Level

363
F.10 BRANCH A-2-4, 23% SOIL

364
Table F.30 Branch A-2-4 Soil Plate Load Test, 20 psi w/o Limerock
Permanent Total Resilient Permanent Total Resilient(mm) (mm) (mm) (mm) (mm) (mm)
1 0.3341 0.4381 0.1040 1 0.0438 0.1180 0.07424 0.3409 0.4403 0.0994 4 0.0643 0.1334 0.06915 0.3407 0.4425 0.1018 5 0.0644 0.1362 0.0717
10 0.3411 0.4253 0.0842 10 0.0663 0.1390 0.072725 0.4044 0.5022 0.0979 25 0.0729 0.1470 0.074150 0.4004 0.5018 0.1014 50 0.0784 0.1529 0.0745
100 0.3997 0.5006 0.1009 100 0.0848 0.1589 0.0740200 0.4001 0.5006 0.1005 200 0.0902 0.1635 0.0733500 0.4015 0.5029 0.1014 500 0.0971 0.1692 0.07211000 0.4041 0.5046 0.1005 1000 0.1018 0.1732 0.07142000 0.4083 0.5072 0.0988 2000 0.1094 0.1795 0.07015000 0.4151 0.5135 0.0984 5000 0.1260 0.1937 0.0677
10000 0.4102 0.5052 0.0950 10000 0.1618 0.2287 0.067015000 0.4124 0.5053 0.0929 15000 0.1620 0.2283 0.066320000 0.4128 0.5050 0.0921 20000 0.1712 0.2373 0.066125000 0.4121 0.5034 0.0913 25000 0.1731 0.2389 0.065930000 0.4091 0.4997 0.0907 30000 0.1460 0.2112 0.0652
Permanent Total Resilient Permanent Total Resilient(mm) (mm) (mm) (mm) (mm) (mm)
1 0.0165 0.1114 0.0949 1 0.0726 0.1762 0.10364 0.0236 0.1188 0.0951 4 0.0891 0.1886 0.09965 0.0224 0.1205 0.0982 5 0.0903 0.1934 0.1031
10 0.0240 0.1198 0.0958 10 0.0937 0.1993 0.105625 0.0265 0.1218 0.0953 25 0.0998 0.2078 0.108150 0.0271 0.1226 0.0955 50 0.1057 0.2145 0.1088
100 0.0284 0.1230 0.0946 100 0.1112 0.2212 0.1100200 0.0294 0.1233 0.0939 200 0.1163 0.2264 0.1101500 0.0324 0.1249 0.0925 500 0.1235 0.2325 0.10891000 0.0372 0.1287 0.0915 1000 0.1295 0.2379 0.10842000 0.0519 0.1430 0.0911 2000 0.1374 0.2444 0.10705000 0.0776 0.1669 0.0894 5000 0.1565 0.2623 0.1057
10000 0.1017 0.1899 0.0881 10000 0.2252 0.3263 0.101115000 0.1103 0.1993 0.0890 15000 0.2359 0.3354 0.099520000 0.1113 0.2002 0.0889 20000 0.2406 0.3396 0.099025000 0.1100 0.1988 0.0888 25000 0.2453 0.3433 0.098030000 0.1101 0.1980 0.0878 30000 0.2473 0.3454 0.0980
Deformation with W.T. at 0 in., Test 10-3Load
Cycles
Deformation with W.T. at 0 in., Test 10-1Load
Cycles
Deformation with W.T. at 0 in., Test 10-2Load
Cycles
Deformation with W.T. at 0 in., Test 10-4Load
Cycles

365
Table F.30 Continued
Permanent Total Resilient Permanent Total Resilient(mm) (mm) (mm) (mm) (mm) (mm)
1 0.0157 0.1192 0.1034 1 0.0925 0.2445 0.15204 4 0.1429 0.2598 0.11695 0.0252 0.1213 0.0961 5 0.1442 0.2599 0.1157
10 0.0254 0.1199 0.0945 10 0.1487 0.2596 0.110925 0.0266 0.1212 0.0945 25 0.1564 0.2708 0.114550 0.0273 0.1217 0.0944 50 0.1630 0.2769 0.1139
100 0.0282 0.1224 0.0942 100 0.1708 0.2850 0.1142200 0.0286 0.1230 0.0943 200 0.1787 0.2917 0.1130500 0.0294 0.1242 0.0948 500 0.1881 0.2977 0.1096
1000 0.0305 0.1252 0.0947 1000 0.1945 0.3043 0.10982000 0.0319 0.1253 0.0934 2000 0.2019 0.3077 0.10585000 0.0367 0.1299 0.0932 5000 0.2198 0.3150 0.095210000 0.0490 0.1408 0.0918 10000 0.2375 0.3315 0.093915000 0.0534 0.1440 0.0907 15000 0.2478 0.3397 0.091920000 0.0584 0.1481 0.0897 20000 0.2539 0.3441 0.090225000 0.0616 0.1516 0.0900 25000 0.2583 0.3470 0.088730000 0.0628 0.1521 0.0893 30000 0.2605 0.3486 0.0881
Permanent Total Resilient Permanent Total Resilient(mm) (mm) (mm) (mm) (mm) (mm)
1 0.3819 0.5120 0.1301 1 0.1047 0.1749 0.07024 0.3921 0.5171 0.1249 4 0.1245 0.1906 0.06615 0.3922 0.5180 0.1258 5 0.1255 0.1930 0.0675
10 0.3927 0.5177 0.1250 10 0.1294 0.1974 0.068025 0.3948 0.5189 0.1241 25 0.1363 0.2043 0.068050 0.3955 0.5201 0.1246 50 0.1426 0.2109 0.0683
100 0.3967 0.5223 0.1256 100 0.1489 0.2173 0.0684200 0.3974 0.5227 0.1253 200 0.1553 0.2230 0.0677500 0.3988 0.5241 0.1253 500 0.1650 0.2306 0.0656
1000 0.4006 0.5257 0.1251 1000 0.1714 0.2362 0.06482000 0.4047 0.5262 0.1215 2000 0.1799 0.2436 0.06365000 0.4177 0.5357 0.1181 5000 0.1942 0.2563 0.062110000 0.4219 0.5424 0.1204 10000 0.2071 0.2703 0.063115000 0.4259 0.5460 0.1201 15000 0.2133 0.2770 0.063720000 0.4306 0.5503 0.1197 20000 0.2188 0.2832 0.064425000 0.4368 0.5563 0.1194 25000 0.2257 0.2888 0.063130000 0.4411 0.5591 0.1180 30000 0.2305 0.2930 0.0625
Deformation with W.T. at 12 in., Test 10-5Load
Cycles
Deformation with W.T. at 12 in., Test 10-6Load
Cycles
Deformation with W.T. at 12 in., Test 10-7Load
Cycles
Deformation with W.T. at 12 in., Test 10-8Load
Cycles

366
Table F.30 Continued
Permanent Total Resilient Permanent Total Resilient(mm) (mm) (mm) (mm) (mm) (mm)
1 0.0545 0.2009 0.1464 1 0.1123 0.2615 0.14924 0.0910 0.2202 0.1292 4 0.1395 0.2757 0.13625 0.0926 0.2234 0.1308 5 0.1418 0.2779 0.1361
10 0.0991 0.2300 0.1308 10 0.1487 0.2991 0.150425 0.1091 0.2408 0.1317 25 0.1626 0.3046 0.142050 0.1174 0.2501 0.1327 50 0.1765 0.3201 0.1435100 0.1252 0.2581 0.1329 100 0.1910 0.3362 0.1452200 0.1328 0.2653 0.1325 200 0.2056 0.3514 0.1458500 0.1419 0.2743 0.1324 500 0.2249 0.3718 0.1470
1000 0.1497 0.2799 0.1302 1000 0.2429 0.3895 0.14652000 0.1328 0.2599 0.1272 2000 0.2637 0.4108 0.14725000 0.1703 0.2950 0.1247 5000 0.2901 0.4359 0.1458
10000 0.1811 0.2987 0.1177 10000 0.3122 0.4591 0.147015000 0.1653 0.2809 0.1155 15000 0.3243 0.4706 0.146320000 0.1684 0.2842 0.1158 20000 0.3339 0.4781 0.144225000 0.1773 0.2928 0.1155 25000 0.3436 0.4885 0.144930000 0.1793 0.2956 0.1162 30000 0.3539 0.4978 0.1439
Permanent Total Resilient(mm) (mm) (mm)
1 0.2667 0.4860 0.21944 0.3173 0.5449 0.22765 0.3213 0.5492 0.2279
10 0.3347 0.5529 0.218225 0.3603 0.5563 0.196150 0.3847 0.5807 0.1961100 0.4126 0.6069 0.1943200 0.4320 0.6231 0.1910500 0.4546 0.6426 0.1879
1000 0.4704 0.6541 0.18372000 0.4859 0.6666 0.18075000 0.5070 0.6852 0.1781
10000 0.5246 0.7007 0.176115000 0.5465 0.7214 0.174820000 0.5566 0.7309 0.174325000 0.5617 0.7358 0.174130000 0.5651 0.7388 0.1737
Deformation with W.T. at 24 in., Test 10-11Load
Cycles
Deformation with W.T. at 24 in., Test 10-9 Deformation with W.T. at 24 in., Test 10-10Load
CyclesLoad
Cycles

367
Table F.31 Branch A-2-4 Soil Plate Load Test, 50 psi w/ Limerock
Permanent Total Resilient Permanent Total Resilient(mm) (mm) (mm) (mm) (mm) (mm)
1 0.1226 0.2426 0.1200 1 0.1139 0.2157 0.10184 0.1499 0.2571 0.1071 4 0.1518 0.2490 0.09725 0.1511 0.2601 0.1090 5 0.1523 0.2508 0.0985
10 0.1531 0.2695 0.1164 10 0.1560 0.2539 0.097925 0.1610 0.2792 0.1182 25 0.1615 0.2595 0.098050 0.1667 0.2853 0.1186 50 0.1695 0.2664 0.0969
100 0.1730 0.2907 0.1177 100 0.1763 0.2721 0.0958200 0.1760 0.2940 0.1179 200 0.1797 0.2752 0.0955500 0.1858 0.3028 0.1170 500 0.1882 0.2828 0.0946
1000 0.1931 0.3096 0.1165 1000 0.1953 0.2894 0.09412000 0.2042 0.3183 0.1141 2000 0.2008 0.2943 0.09355000 0.2248 0.3420 0.1172 5000 0.2141 0.3066 0.092510000 0.2461 0.3691 0.1230 10000 0.2505 0.3430 0.092515000 0.2621 0.3816 0.1196 15000 0.2773 0.3703 0.093020000 0.2663 0.3862 0.1199 20000 0.2839 0.3758 0.091825000 0.2692 0.3912 0.1220 25000 0.2730 0.3641 0.091130000 0.2713 0.3985 0.1273 30000 0.2912 0.3821 0.0909
Permanent Total Resilient(mm) (mm) (mm)
1 0.0924 0.2275 0.13504 0.1220 0.2505 0.12855 0.1278 0.2492 0.1213
10 0.1287 0.2532 0.124525 0.1397 0.2739 0.134250 0.1482 0.2802 0.1320
100 0.1594 0.2990 0.1396200 0.1720 0.3026 0.1306500 0.1902 0.3086 0.1183
1000 0.2006 0.3264 0.12582000 0.2130 0.3354 0.12245000 0.2324 0.3520 0.119610000 0.2741 0.3936 0.119515000 0.3000 0.4168 0.116820000 0.3048 0.4198 0.115025000 0.3056 0.4193 0.113730000 0.3551 0.4668 0.1117
Deformation with W.T. at 0 in., Test 10-14Load
Cycles
Deformation with W.T. at 0 in., Test 10-12Load
Cycles
Deformation with W.T. at 0 in., Test 10-13Load
Cycles

368
Table F.31 Continued
Permanent Total Resilient Permanent Total Resilient(mm) (mm) (mm) (mm) (mm) (mm)
1 0.1354 0.2761 0.1407 1 0.0751 0.1849 0.10984 0.2252 0.3675 0.1423 4 0.0960 0.1989 0.10295 0.2257 0.3681 0.1424 5 0.0975 0.2039 0.1064
10 0.2270 0.3690 0.1420 10 0.1023 0.2102 0.107925 0.2299 0.3711 0.1412 25 0.1135 0.2219 0.108450 0.2325 0.3725 0.1399 50 0.1203 0.2280 0.1077100 0.2354 0.3742 0.1388 100 0.1252 0.2321 0.1068200 0.2367 0.3748 0.1382 200 0.1279 0.2346 0.1066500 0.2378 0.3737 0.1359 500 0.1331 0.2392 0.1061
1000 0.2311 0.3652 0.1342 1000 0.1355 0.2407 0.10522000 0.2221 0.3545 0.1324 2000 0.1497 0.2542 0.10455000 0.2606 0.3907 0.1301 5000 0.1572 0.2611 0.1040
10000 0.2811 0.4105 0.1294 10000 0.1768 0.2792 0.102315000 0.2977 0.4266 0.1288 15000 0.1900 0.2914 0.101520000 0.3224 0.4497 0.1273 20000 0.1961 0.2977 0.101625000 0.3415 0.4679 0.1264 25000 0.2102 0.3157 0.105630000 0.3537 0.4804 0.1267 30000 0.2184 0.3232 0.1048
Permanent Total Resilient(mm) (mm) (mm)
1 0.0783 0.2432 0.16494 0.1022 0.2613 0.15915 0.1037 0.2613 0.1575
10 0.1086 0.2724 0.163725 0.1186 0.2859 0.167350 0.1267 0.2941 0.1674100 0.1340 0.3018 0.1678200 0.1351 0.3029 0.1677500 0.1462 0.3162 0.1699
1000 0.1533 0.3252 0.17192000 0.1613 0.3355 0.17435000 0.2066 0.3377 0.1311
10000 0.2178 0.3484 0.130515000 0.2310 0.3616 0.130620000 0.2416 0.3734 0.131725000 0.2448 0.3778 0.132930000 0.2495 0.3827 0.1332
Deformation with W.T. at 12 in., Test 10-16Load
Cycles
Deformation with W.T. at 12 in., Test 10-17Load
Cycles
Deformation with W.T. at 12 in., Test 10-15Load
Cycles

369
Table F.31 Continued
Permanent Total Resilient Permanent Total Resilient(mm) (mm) (mm) (mm) (mm) (mm)
1 0.0783 0.2432 0.1649 1 0.1328 0.2965 0.16384 0.1022 0.2613 0.1591 4 0.1602 0.3173 0.15715 0.1037 0.2613 0.1575 5 0.1635 0.3205 0.1570
10 0.1086 0.2724 0.1637 10 0.1708 0.3316 0.160825 0.1186 0.2859 0.1673 25 0.1824 0.3449 0.162550 0.1267 0.2941 0.1674 50 0.1905 0.3531 0.1626
100 0.1340 0.3018 0.1678 100 0.1978 0.3594 0.1616200 0.1351 0.3029 0.1677 200 0.2023 0.3635 0.1612500 0.1462 0.3162 0.1699 500 0.2131 0.3748 0.1618
1000 0.1533 0.3252 0.1719 1000 0.2195 0.3846 0.16512000 0.1613 0.3355 0.1743 2000 0.2257 0.3903 0.16465000 0.1835 0.3613 0.1778 5000 0.2369 0.4023 0.1654
10000 0.2351 0.4142 0.1791 10000 0.2637 0.4307 0.167015000 0.2638 0.4462 0.1824 15000 0.3150 0.4821 0.167020000 0.2832 0.4672 0.1839 20000 0.3525 0.5197 0.167225000 0.2911 0.4759 0.1849 25000 0.3787 0.5466 0.167930000 0.3044 0.4905 0.1862 30000 0.3936 0.5621 0.1686
Permanent Total Resilient Permanent Total Resilient(mm) (mm) (mm) (mm) (mm) (mm)
1 0.8262 1.1422 0.3160 1 0.1772 0.3509 0.17364 0.8785 1.1774 0.2989 4 0.2160 0.3747 0.15875 0.8847 1.2042 0.3195 5 0.2187 0.3837 0.1650
10 0.9010 1.2048 0.3038 10 0.2252 0.3939 0.168725 0.9267 1.2286 0.3019 25 0.2367 0.4059 0.169250 0.9467 1.2470 0.3004 50 0.2465 0.4149 0.1684
100 0.9672 1.2655 0.2983 100 0.2562 0.4233 0.1671200 0.9781 1.2759 0.2978 200 0.2619 0.4286 0.1667500 1.0074 1.3052 0.2979 500 0.2772 0.4438 0.1665
1000 1.0271 1.3279 0.3008 1000 0.2883 0.4551 0.16682000 1.0474 1.3526 0.3052 2000 0.3005 0.4685 0.16805000 1.0840 1.3946 0.3106 5000 0.3230 0.4942 0.1711
10000 1.1304 1.4484 0.3180 10000 0.3463 0.5201 0.173815000 1.1736 1.4970 0.3234 15000 0.3640 0.5389 0.175020000 1.2098 1.5354 0.3257 20000 0.3821 0.5596 0.177425000 1.2109 1.5364 0.3255 25000 0.3843 0.5628 0.178430000 1.2133 1.5452 0.3319 30000 0.3919 0.5716 0.1797
Deformation with W.T. at 24 in., Test 10-20Load
Cycles
Deformation with W.T. at 24 in., Test 10-18 Deformation with W.T. at 24 in., Test 10-19Load
CyclesLoad
Cycles
Deformation with W.T. at 24 in., Test 10-21Load
Cycles

370
Table F.31 Continued
Permanent Total Resilient Permanent Total Resilient(mm) (mm) (mm) (mm) (mm) (mm)
1 0.3551 0.8041 0.4490 1 0.4022 0.8807 0.47854 0.4443 0.8424 0.3981 4 0.5371 0.9886 0.45155 0.4565 0.8560 0.3995 5 0.5460 0.9911 0.4450
10 0.4944 0.8973 0.4029 10 0.5827 1.0331 0.450425 0.5664 0.9735 0.4072 25 0.6550 1.1132 0.458250 0.6347 1.0412 0.4065 50 0.7304 1.1921 0.4617
100 0.7118 1.1148 0.4029 100 0.8182 1.2858 0.4677200 0.7572 1.1600 0.4028 200 0.8742 1.3433 0.4691500 0.8844 1.2869 0.4024 500 1.0409 1.5210 0.4801
1000 0.9700 1.3746 0.4047 1000 1.1644 1.6388 0.47442000 1.0521 1.4627 0.4106 2000 1.2814 1.7644 0.48315000 1.1593 1.5739 0.4146 5000 1.4694 1.9713 0.5020
10000 1.2323 1.6508 0.4185 10000 1.6656 2.1867 0.521115000 1.3114 1.7353 0.4239 15000 1.8171 2.3555 0.538320000 1.3686 1.7951 0.4265 20000 1.9623 2.5147 0.552425000 1.4288 1.8612 0.4324 25000 2.0850 2.6775 0.592530000 1.4477 1.8898 0.4421 30000 2.1831 2.7573 0.5742
Permanent Total Resilient(mm) (mm) (mm)
1 0.3210 0.7159 0.39494 0.4206 0.8048 0.38435 0.4303 0.8048 0.3745
10 0.4637 0.8452 0.381525 0.5281 0.9160 0.388050 0.5897 0.9786 0.3889
100 0.6558 1.0476 0.3918200 0.6973 1.0859 0.3886500 0.7961 1.1874 0.3913
1000 0.8578 1.2516 0.39382000 0.9163 1.3176 0.40145000 1.0161 1.4244 0.4083
10000 1.1373 1.5548 0.417415000 1.2252 1.6464 0.421220000 1.2765 1.6967 0.420125000 1.3244 1.7525 0.428130000 1.3685 1.7998 0.4313
Deformation with W.T. at 36 in., Test 10-24Load
Cycles
Deformation with W.T. at 36 in., Test 10-22 Deformation with W.T. at 36 in., Test 10-23Load
CyclesLoad
Cycles
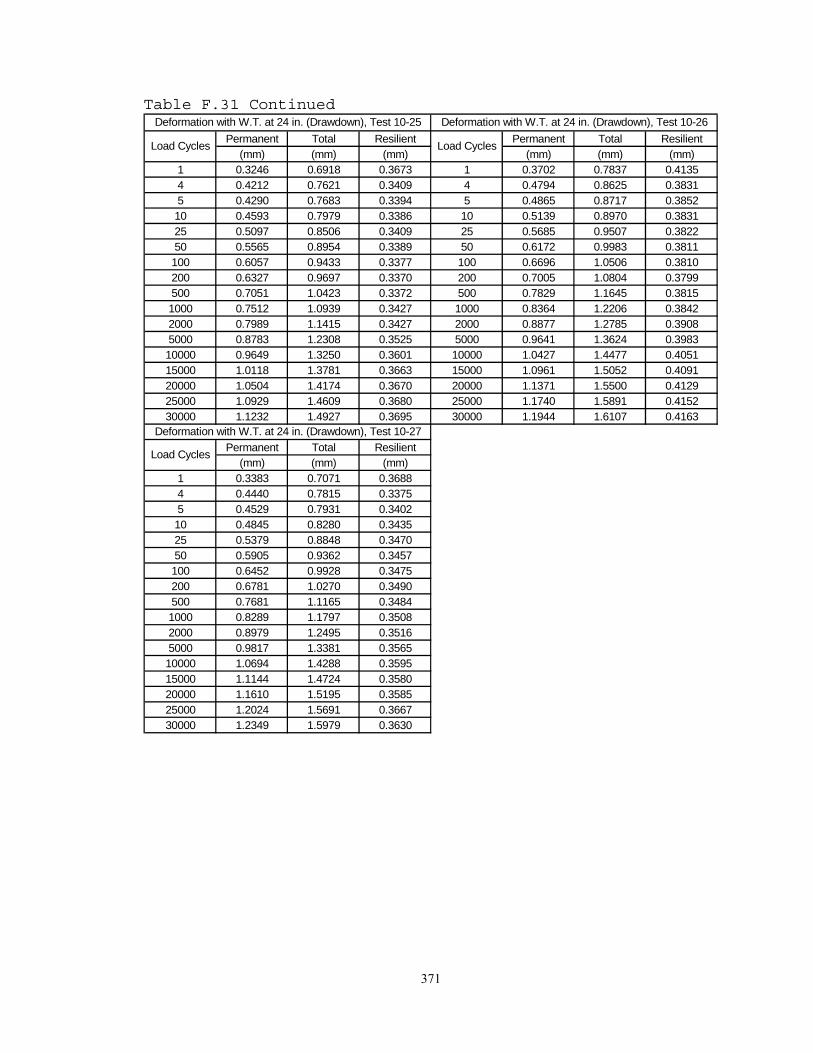
371
Table F.31 Continued
Permanent Total Resilient Permanent Total Resilient(mm) (mm) (mm) (mm) (mm) (mm)
1 0.3246 0.6918 0.3673 1 0.3702 0.7837 0.41354 0.4212 0.7621 0.3409 4 0.4794 0.8625 0.38315 0.4290 0.7683 0.3394 5 0.4865 0.8717 0.385210 0.4593 0.7979 0.3386 10 0.5139 0.8970 0.383125 0.5097 0.8506 0.3409 25 0.5685 0.9507 0.382250 0.5565 0.8954 0.3389 50 0.6172 0.9983 0.3811100 0.6057 0.9433 0.3377 100 0.6696 1.0506 0.3810200 0.6327 0.9697 0.3370 200 0.7005 1.0804 0.3799500 0.7051 1.0423 0.3372 500 0.7829 1.1645 0.38151000 0.7512 1.0939 0.3427 1000 0.8364 1.2206 0.38422000 0.7989 1.1415 0.3427 2000 0.8877 1.2785 0.39085000 0.8783 1.2308 0.3525 5000 0.9641 1.3624 0.398310000 0.9649 1.3250 0.3601 10000 1.0427 1.4477 0.405115000 1.0118 1.3781 0.3663 15000 1.0961 1.5052 0.409120000 1.0504 1.4174 0.3670 20000 1.1371 1.5500 0.412925000 1.0929 1.4609 0.3680 25000 1.1740 1.5891 0.415230000 1.1232 1.4927 0.3695 30000 1.1944 1.6107 0.4163
Permanent Total Resilient(mm) (mm) (mm)
1 0.3383 0.7071 0.36884 0.4440 0.7815 0.33755 0.4529 0.7931 0.340210 0.4845 0.8280 0.343525 0.5379 0.8848 0.347050 0.5905 0.9362 0.3457100 0.6452 0.9928 0.3475200 0.6781 1.0270 0.3490500 0.7681 1.1165 0.34841000 0.8289 1.1797 0.35082000 0.8979 1.2495 0.35165000 0.9817 1.3381 0.356510000 1.0694 1.4288 0.359515000 1.1144 1.4724 0.358020000 1.1610 1.5195 0.358525000 1.2024 1.5691 0.366730000 1.2349 1.5979 0.3630
Deformation with W.T. at 24 in. (Drawdown), Test 10-25 Deformation with W.T. at 24 in. (Drawdown), Test 10-26
Load Cycles Load Cycles
Deformation with W.T. at 24 in. (Drawdown), Test 10-27
Load Cycles

372
Table F.31 Continued
Permanent Total Resilient Permanent Total Resilient(mm) (mm) (mm) (mm) (mm) (mm)
1 0.1969 0.3653 0.1684 1 0.2207 0.4103 0.18964 0.2357 0.3902 0.1545 4 0.2626 0.4355 0.17295 0.2359 0.3872 0.1513 5 0.2652 0.4396 0.174310 0.2450 0.4058 0.1607 10 0.2703 0.4465 0.176125 0.2588 0.4201 0.1613 25 0.2815 0.4586 0.177150 0.2683 0.4302 0.1619 50 0.2905 0.4705 0.1800100 0.2780 0.4398 0.1618 100 0.3006 0.4816 0.1811200 0.2871 0.4501 0.1630 200 0.3106 0.4942 0.1835500 0.3004 0.4648 0.1644 500 0.3252 0.5127 0.18751000 0.3113 0.4785 0.1673 1000 0.3392 0.5302 0.19102000 0.3254 0.4957 0.1702 2000 0.3565 0.5509 0.19445000 0.3532 0.5278 0.1745 5000 0.3993 0.6028 0.203410000 0.3867 0.5715 0.1848 10000 0.4223 0.6295 0.207215000 0.4125 0.6014 0.1890 15000 0.4694 0.6782 0.208920000 0.4423 0.6282 0.1859 20000 0.4811 0.6921 0.211025000 0.4495 0.6372 0.1877 25000 0.4961 0.7064 0.210330000 0.4474 0.6310 0.1836 30000 0.5555 0.7664 0.2108
Permanent Total Resilient(mm) (mm) (mm)
1 0.1600 0.3176 0.15774 0.2000 0.3346 0.13465 0.2023 0.3339 0.131610 0.2115 0.3616 0.150125 0.2203 0.3723 0.152050 0.2284 0.3809 0.1526100 0.2376 0.3900 0.1524200 0.2471 0.3993 0.1522500 0.2618 0.4140 0.15221000 0.2787 0.4281 0.14952000 0.3065 0.4542 0.14785000 0.3108 0.4569 0.146210000 0.3397 0.4845 0.144815000 0.3558 0.4987 0.142820000 0.3840 0.5274 0.143425000 0.4049 0.5486 0.143730000 0.4217 0.5641 0.1423
Deformation with W.T. at 12 in. (Drawdown), Test 10-30
Load Cycles
Deformation with W.T. at 12 in. (Drawdown), Test 10-28 Deformation with W.T. at 12 in. (Drawdown), Test 10-29
Load Cycles Load Cycles
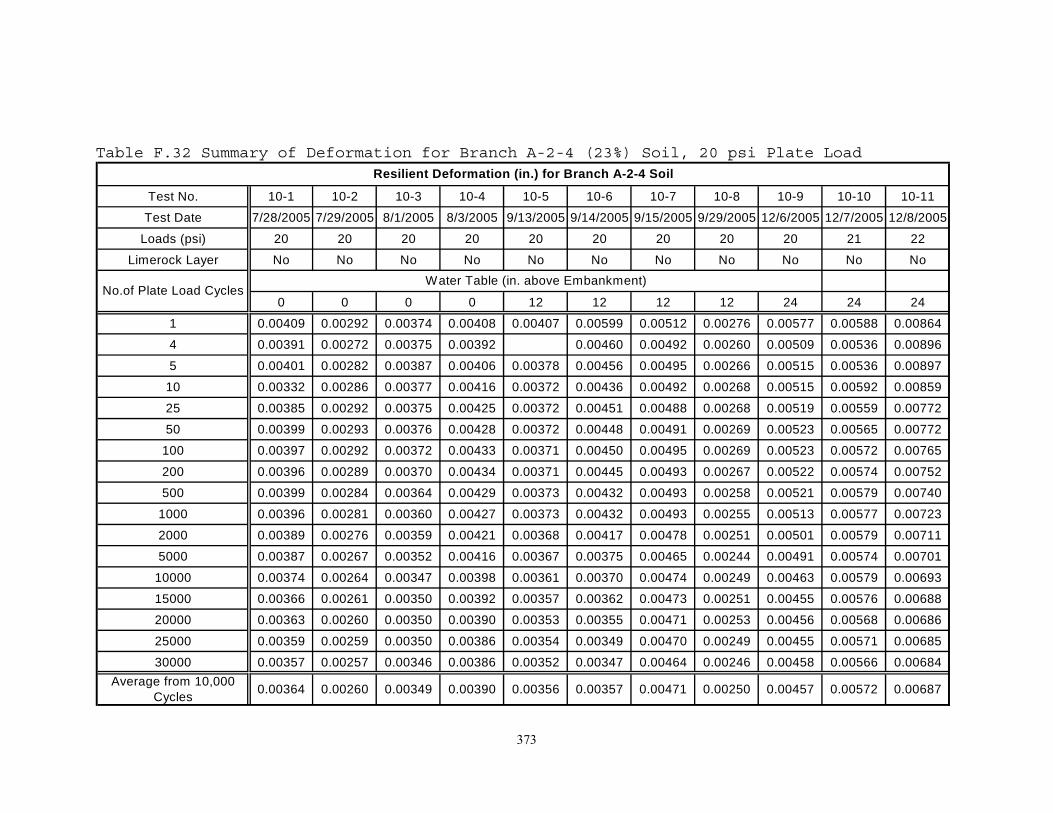
373
Table F.32 Summary of Deformation for Branch A-2-4 (23%) Soil, 20 psi Plate Load
Test No. 10-1 10-2 10-3 10-4 10-5 10-6 10-7 10-8 10-9 10-10 10-11
Test Date 7/28/2005 7/29/2005 8/1/2005 8/3/2005 9/13/2005 9/14/2005 9/15/2005 9/29/2005 12/6/2005 12/7/2005 12/8/2005
Loads (psi) 20 20 20 20 20 20 20 20 20 21 22
Limerock Layer No No No No No No No No No No No
0 0 0 0 12 12 12 12 24 24 24
1 0.00409 0.00292 0.00374 0.00408 0.00407 0.00599 0.00512 0.00276 0.00577 0.00588 0.00864
4 0.00391 0.00272 0.00375 0.00392 0.00460 0.00492 0.00260 0.00509 0.00536 0.00896
5 0.00401 0.00282 0.00387 0.00406 0.00378 0.00456 0.00495 0.00266 0.00515 0.00536 0.00897
10 0.00332 0.00286 0.00377 0.00416 0.00372 0.00436 0.00492 0.00268 0.00515 0.00592 0.00859
25 0.00385 0.00292 0.00375 0.00425 0.00372 0.00451 0.00488 0.00268 0.00519 0.00559 0.00772
50 0.00399 0.00293 0.00376 0.00428 0.00372 0.00448 0.00491 0.00269 0.00523 0.00565 0.00772
100 0.00397 0.00292 0.00372 0.00433 0.00371 0.00450 0.00495 0.00269 0.00523 0.00572 0.00765
200 0.00396 0.00289 0.00370 0.00434 0.00371 0.00445 0.00493 0.00267 0.00522 0.00574 0.00752
500 0.00399 0.00284 0.00364 0.00429 0.00373 0.00432 0.00493 0.00258 0.00521 0.00579 0.00740
1000 0.00396 0.00281 0.00360 0.00427 0.00373 0.00432 0.00493 0.00255 0.00513 0.00577 0.00723
2000 0.00389 0.00276 0.00359 0.00421 0.00368 0.00417 0.00478 0.00251 0.00501 0.00579 0.00711
5000 0.00387 0.00267 0.00352 0.00416 0.00367 0.00375 0.00465 0.00244 0.00491 0.00574 0.00701
10000 0.00374 0.00264 0.00347 0.00398 0.00361 0.00370 0.00474 0.00249 0.00463 0.00579 0.00693
15000 0.00366 0.00261 0.00350 0.00392 0.00357 0.00362 0.00473 0.00251 0.00455 0.00576 0.00688
20000 0.00363 0.00260 0.00350 0.00390 0.00353 0.00355 0.00471 0.00253 0.00456 0.00568 0.00686
25000 0.00359 0.00259 0.00350 0.00386 0.00354 0.00349 0.00470 0.00249 0.00455 0.00571 0.00685
30000 0.00357 0.00257 0.00346 0.00386 0.00352 0.00347 0.00464 0.00246 0.00458 0.00566 0.00684Average from 10,000
Cycles 0.00364 0.00260 0.00349 0.00390 0.00356 0.00357 0.00471 0.00250 0.00457 0.00572 0.00687
No.of Plate Load Cycles Water Table (in. above Embankment)
Resilient Deformation (in.) for Branch A-2-4 Soil

374
Table F.33 Summary of Deformation for Branch A-2-4 (23%) Soil, 50 psi Plate Load with Limerock Base Layer
Test No. 10-12 10-13 10-14 10-15 10-16 10-17 10-18 10-19 10-20 10-21 10-22 10-23 10-24 10-25 10-26 10-27 10-28 10-29 10-30
Test Date 3/6/06 3/7/06 3/8/06 5/15/06 5/16/06 5/17/06 7/27/06 7/28/06 7/29/06 8/15/06 10/16/06 10/17/06 10/18/06 1/3/07 1/4/07 1/8/07 3/20/07 3/21/07 3/30/07
Loads(psi) 50 50 50 50 50 50 50 50 50 50 50 50 50 50 50 50 50 50 50
Limerock Yes Yes Yes Yes Yes Yes Yes Yes Yes Yes Yes Yes Yes Yes Yes Yes Yes Yes Yes
0 0 0 12 12 12 24 24 24 24 36 36 36 24 24 24 12 12 12
1 0.00472 0.00401 0.00532 0.00554 0.00432 0.00649 0.00649 0.00645 0.01244 0.00684 0.01768 0.01884 0.01555 0.01446 0.01628 0.01452 0.00663 0.00746 0.00621
4 0.00422 0.00383 0.00506 0.00560 0.00405 0.00626 0.00626 0.00618 0.01177 0.00625 0.01568 0.01778 0.01513 0.01342 0.01508 0.01329 0.00608 0.00681 0.00530
5 0.00429 0.00388 0.00478 0.00561 0.00419 0.00620 0.00620 0.00618 0.01258 0.00650 0.01573 0.01752 0.01474 0.01336 0.01517 0.01339 0.00596 0.00686 0.00518
10 0.00458 0.00386 0.00490 0.00559 0.00425 0.00645 0.00645 0.00633 0.01196 0.00664 0.01586 0.01773 0.01502 0.01333 0.01508 0.01352 0.00633 0.00694 0.00591
25 0.00465 0.00386 0.00528 0.00556 0.00427 0.00659 0.00659 0.00640 0.01189 0.00666 0.01603 0.01804 0.01527 0.01342 0.01505 0.01366 0.00635 0.00697 0.00598
50 0.00467 0.00382 0.00520 0.00551 0.00424 0.00659 0.00659 0.00640 0.01183 0.00663 0.01600 0.01818 0.01531 0.01334 0.01501 0.01361 0.00638 0.00709 0.00601
100 0.00464 0.00377 0.00550 0.00546 0.00421 0.00661 0.00661 0.00636 0.01174 0.00658 0.01586 0.01841 0.01543 0.01329 0.01500 0.01368 0.00637 0.00713 0.00600
200 0.00464 0.00376 0.00514 0.00544 0.00420 0.00660 0.00660 0.00635 0.01172 0.00656 0.01586 0.01847 0.01530 0.01327 0.01496 0.01374 0.00642 0.00723 0.00599
500 0.00461 0.00373 0.00466 0.00535 0.00418 0.00669 0.00669 0.00637 0.01173 0.00656 0.01584 0.01890 0.01540 0.01328 0.01502 0.01372 0.00647 0.00738 0.00599
1000 0.00459 0.00370 0.00495 0.00528 0.00414 0.00677 0.00677 0.00650 0.01184 0.00657 0.01593 0.01868 0.01550 0.01349 0.01513 0.01381 0.00659 0.00752 0.00588
2000 0.00449 0.00368 0.00482 0.00521 0.00412 0.00686 0.00686 0.00648 0.01202 0.00661 0.01616 0.01902 0.01580 0.01349 0.01539 0.01384 0.00670 0.00766 0.00582
5000 0.00461 0.00364 0.00471 0.00512 0.00409 0.00516 0.00700 0.00651 0.01223 0.00674 0.01632 0.01976 0.01608 0.01388 0.01568 0.01403 0.00687 0.00801 0.00575
10000 0.00484 0.00364 0.00471 0.00509 0.00403 0.00514 0.00705 0.00657 0.01252 0.00684 0.01648 0.02052 0.01643 0.01418 0.01595 0.01415 0.00728 0.00816 0.00570
15000 0.00471 0.00366 0.00460 0.00507 0.00400 0.00514 0.00718 0.00658 0.01273 0.00689 0.01669 0.02119 0.01658 0.01442 0.01611 0.01410 0.00744 0.00822 0.00562
20000 0.00472 0.00362 0.00453 0.00501 0.00400 0.00519 0.00724 0.00658 0.01282 0.00699 0.01679 0.02175 0.01654 0.01445 0.01626 0.01411 0.00732 0.00831 0.00565
25000 0.00480 0.00359 0.00448 0.00498 0.00416 0.00523 0.00728 0.00661 0.01282 0.00703 0.01702 0.02333 0.01686 0.01449 0.01634 0.01444 0.00739 0.00828 0.00566
30000 0.00501 0.00358 0.00440 0.00499 0.00413 0.00524 0.00733 0.00664 0.01307 0.00708 0.01741 0.02261 0.01698 0.01455 0.01639 0.01429 0.00723 0.00830 0.00560
Average from
10,000 Cycles
0.00482 0.00362 0.00454 0.00503 0.00406 0.00519 0.00722 0.00660 0.01279 0.00696 0.01688 0.02188 0.01668 0.01442 0.01621 0.01422 0.00733 0.00825 0.00565
No.of Load
Cycles
Resilient Deformation (in.) for Branch A-2-4 Soil
Water Table (in. above Embankment)

375
Deformation for Branch A-2-4 Soil, Plate Load Test 10-1
0.00
0.10
0.20
0.30
0.40
0.50
0.60
1 10 100 1000 10000 100000
Number of Cycles
Def
orm
atio
n, m
mPermanentTotalResilient
( Plate Load : 20 psi, w/out Limerock Base Layer, Base Clearance : 3 ft )
Figure F.118 Branch A-2-4 (23%) Soil, Deformation under 20 psi Plate Load (Water Table at 0.0 in., w/out Limerock, Test 10-1)
Deformation for Branch A-2-4 Soil, Plate Load Test 10-2
0.00
0.05
0.10
0.15
0.20
0.25
0.30
1 10 100 1000 10000 100000
Number of Cycles
Def
orm
atio
n, m
m
PermanentTotalResilient
( Plate Load : 20 psi, w/out Limerock Base Layer, Base Clearance : 3 ft )
Figure F.119 Branch A-2-4 (23%) Soil, Deformation under 20 psi Plate Load (Water Table at 0.0 in., w/out Limerock, Test 10-2)

376
Deformation for Branch A-2-4 Soil, Plate Load Test 10-3
0.00
0.05
0.10
0.15
0.20
0.25
1 10 100 1000 10000 100000
Number of Cycles
Def
orm
atio
n, m
mPermanentTotalResilient
( Plate Load : 20 psi, w/out Limerock Base Layer, Base Clearance : 3 ft )
Figure F.120 Branch A-2-4 (23%) Soil, Deformation under 20 psi Plate Load (Water Table at 0.0 in., w/out Limerock, Test 10-3)
Deformation for Branch A-2-4 Soil, Plate Load Test 10-4
0.00
0.05
0.10
0.15
0.20
0.25
0.30
0.35
0.40
1 10 100 1000 10000 100000
Number of Cycles
Def
orm
atio
n, m
m
PermanentTotalResilient
( Plate Load : 20 psi, w/out Limerock Base Layer, Base Clearance : 3 ft
Figure F.121 Branch A-2-4 (23%) Soil, Deformation under 20 psi Plate Load (Water Table at 0.0 in., w/out Limerock, Test 10-4)

377
Deformation for Branch A-2-4 Soil, Plate Load Test 10-5
0.00
0.02
0.04
0.06
0.08
0.10
0.12
0.14
0.16
1 10 100 1000 10000 100000
Number of Cycles
Def
orm
atio
n, m
mPermanentTotalResilient
( Plate Load : 20 psi, w/out Limerock Base Layer, Base Clearance : 2 ft
Figure F.122 Branch A-2-4 (23%) Soil, Deformation under 20 psi Plate Load (Water Table at 12 in., w/out Limerock, Test 10-5)
Deformation for Branch A-2-4 Soil, Plate Load Test 10-6
0.00
0.05
0.10
0.15
0.20
0.25
0.30
0.35
0.40
1 10 100 1000 10000 100000
Number of Cycles
Def
orm
atio
n, m
m
PermanentTotalResilient
( Plate Load : 20 psi, w/out Limerock Base Layer, Base Clearance : 2 ft
Figure F.123 Branch A-2-4 (23%) Soil, Deformation under 20 psi Plate Load (Water Table at 12 in., w/out Limerock, Test 10-6)

378
Deformation for Branch A-2-4 Soil, Plate Load Test 10-7
0.00
0.10
0.20
0.30
0.40
0.50
0.60
1 10 100 1000 10000 100000
Number of Cycles
Def
orm
atio
n, m
mPermanentTotalResilient
( Plate Load : 20 psi, w/out Limerock Base Layer, Base Clearance : 2 ft
Figure F.124 Branch A-2-4 (23%) Soil, Deformation under 20 psi Plate Load (Water Table at 12 in., w/out Limerock, Test 10-7)
Deformation for Branch A-2-4 Soil, Plate Load Test 10-8
0.00
0.05
0.10
0.15
0.20
0.25
0.30
0.35
1 10 100 1000 10000 100000
Number of Cycles
Def
orm
atio
n, m
m
PermanentTotalResilient
( Plate Load : 20 psi, w/out Limerock Base Layer, Base Clearance : 2 ft
Figure F.125 Branch A-2-4 (23%) Soil, Deformation under 20 psi Plate Load (Water Table at 12 in., w/out Limerock, Test 10-8)

379
Deformation for Branch A-2-4 Soil, Plate Load Test 10-9
0.00
0.05
0.10
0.15
0.20
0.25
0.30
0.35
1 10 100 1000 10000 100000
Number of Cycles
Def
orm
atio
n, m
mPermanentTotalResilient
( Plate Load : 20 psi, w/out Limerock Base Layer, Base Clearance : 1 ft
Figure F.126 Branch A-2-4 (23%) Soil, Deformation under 20 psi Plate Load (Water Table at 24 in., w/out Limerock, Test 10-9)
Deformation for Branch A-2-4 Soil, Plate Load Test 10-10
0.00
0.10
0.20
0.30
0.40
0.50
0.60
1 10 100 1000 10000 100000
Number of Cycles
Def
orm
atio
n, m
m
PermanentTotalResilient
( Plate Load : 20 psi, w/out Limerock Base Layer, Base Clearance : 1 ft )
Figure F.127 Branch A-2-4 (23%) Soil, Deformation under 20 psi Plate Load (Water Table at 24 in., w/out Limerock, Test 10-10)

380
Deformation for Branch A-2-4 Soil, Plate Load Test 10-11
0.00
0.10
0.20
0.30
0.40
0.50
0.60
0.70
0.80
1 10 100 1000 10000 100000
Number of Cycles
Def
orm
atio
n, m
mPermanentTotalResilient
( Plate Load : 20 psi, w/out Limerock Base Layer, Base Clearance : 1 ft
Figure F.128 Branch A-2-4 (23%) Soil, Deformation under 20 psi Plate Load (Water Table at 24 in., w/out Limerock, Test 10-11)
Deformation for Branch A-2-4 Soil, Plate Load Test 10-12
0.00
0.05
0.10
0.15
0.20
0.25
0.30
0.35
0.40
0.45
1 10 100 1000 10000 100000
Number of Cycles
Def
orm
atio
n, m
m
PermanentTotalResilient
( Plate Load : 50 psi w/ Limerock Base Layer, Base Clearance : 3 ft )
Figure F.129 Branch A-2-4 (23%) Soil, Deformation under 50 psi Plate Load (Water Table at 0.0 in., w/ Limerock, Test 10-12)

381
Deformation for Branch A-2-4 Soil, Plate Load Test 10-13
0.00
0.05
0.10
0.15
0.20
0.25
0.30
0.35
0.40
0.45
1 10 100 1000 10000 100000
Number of Cycles
Def
orm
atio
n, m
mPermanentTotalResilient
( Plate Load : 50 psi w/ Limerock Base Layer, Base Clearance : 3 ft )
Figure F.130 Branch A-2-4 (23%) Soil, Deformation under 50 psi Plate Load (Water Table at 0.0 in., w/out Limerock, Test 10-13)
Deformation for Branch A-2-4 Soil, Plate Load Test 10-14
0.00
0.05
0.10
0.15
0.20
0.25
0.30
0.35
0.40
0.45
0.50
1 10 100 1000 10000 100000
Number of Cycles
Def
orm
atio
n, m
m
PermanentTotalResilient
( Plate Load : 50 psi w/ Limerock Base Layer, Base Clearance : 3 ft )
Figure F.131 Branch A-2-4 (23%) Soil, Deformation under 50 psi Plate Load (Water Table at 0.0 in., w/ Limerock, Test 10-14)

382
Deformation for Branch A-2-4 Soil, Plate Load Test 10-15
0.00
0.10
0.20
0.30
0.40
0.50
0.60
1 10 100 1000 10000 100000
Number of Cycles
Def
orm
atio
n, m
mPermanentTotalResilient
( Plate Load : 50 psi w/ Limerock Base Layer, Base Clearance : 2 ft )
Figure F.132 Branch A-2-4 (23%) Soil, Deformation under 50 psi Plate Load (Water Table at 12 in., w/out Limerock, Test 10-15)
Deformation for Branch A-2-4 Soil, Plate Load Test 10-16
0.00
0.05
0.10
0.15
0.20
0.25
0.30
0.35
1 10 100 1000 10000 100000
Number of Cycles
Def
orm
atio
n, m
m
PermanentTotalResilient
( Plate Load : 50 psi w/ Limerock Base Layer, Base Clearance : 2 ft )
Figure F.133 Branch A-2-4 (23%) Soil, Deformation under 50 psi Plate Load (Water Table at 12 in., w/ Limerock, Test 10-16)

383
Deformation for Branch A-2-4 Soil, Plate Load Test 10-17
0.00
0.05
0.10
0.15
0.20
0.25
0.30
0.35
0.40
0.45
1 10 100 1000 10000 100000
Number of Cycles
Def
orm
atio
n, m
mPermanentTotalResilient
( Plate Load : 50 psi w/ Limerock Base Layer, Base Clearance : 2 ft )
Figure F.134 Branch A-2-4 (23%) Soil, Deformation under 50 psi Plate Load (Water Table at 12 in., w/out Limerock, Test 10-17)
Deformation for Branch A-2-4 Soil, Plate Load Test 10-18
0.00
0.10
0.20
0.30
0.40
0.50
0.60
1 10 100 1000 10000 100000
Number of Cycles
Def
orm
atio
n, m
m
PermanentTotalResilient
( Plate Load : 50 psi w/ Limerock Base Layer, Base Clearance : 1 ft )
Figure F.135 Branch A-2-4 (23%) Soil, Deformation under 50 psi Plate Load (Water Table at 24 in., w/ Limerock, Test 10-18)

384
Deformation for Branch A-2-4 Soil, Plate Load Test 10-19
0.00
0.10
0.20
0.30
0.40
0.50
0.60
1 10 100 1000 10000 100000
Number of Cycles
Def
orm
atio
n, m
mPermanentTotalResilient
( Plate Load : 50 psi w/ Limerock Base Layer, Base Clearance : 1 ft )
Figure F.136 Branch A-2-4 (23%) Soil, Deformation under 50 psi Plate Load (Water Table at 24 in., w/out Limerock, Test 10-19)
Deformation for Branch A-2-4 Soil, Plate Load Test 10-20
0.00
0.20
0.40
0.60
0.80
1.00
1.20
1.40
1.60
1.80
1 10 100 1000 10000 100000
Number of Cycles
Def
orm
atio
n, m
m
PermanentTotalResilient
( Plate Load : 50 psi w/ Limerock Base Layer, Base Clearance : 1 ft )
Figure F.137 Branch A-2-4 (23%) Soil, Deformation under 50 psi Plate Load (Water Table at 24 in., w/ Limerock, Test 10-20)

385
Deformation for Branch A-2-4 Soil, Plate Load Test 10-21
0.00
0.10
0.20
0.30
0.40
0.50
0.60
0.70
1 10 100 1000 10000 100000
Number of Cycles
Def
orm
atio
n, m
mPermanentTotalResilient
( Plate Load : 50 psi w/ Limerock Base Layer, Base Clearance : 1 ft )
Figure F.138 Branch A-2-4 (23%) Soil, Deformation under 50 psi Plate Load (Water Table at 24 in., w/out Limerock, Test 10-21)
Deformation for Branch A-2-4 Soil, Plate Load Test 10-22
0.00
0.20
0.40
0.60
0.80
1.00
1.20
1.40
1.60
1.80
2.00
1 10 100 1000 10000 100000
Number of Cycles
Def
orm
atio
n, m
m
PermanentTotalResilient
( Plate Load : 50 psi w/ Limerock Base Layer, Base Clearance : 0 ft )
Figure F.139 Branch A-2-4 (23%) Soil, Deformation under 50 psi Plate Load (Water Table at 36 in., w/ Limerock, Test 10-22)

386
Deformation for Branch A-2-4 Soil, Plate Load Test 10-23
0.00
0.50
1.00
1.50
2.00
2.50
3.00
1 10 100 1000 10000 100000
Number of Cycles
Def
orm
atio
n, m
mPermanentTotalResilient
( Plate Load : 50 psi w/ Limerock Base Layer, Base Clearance : 0 ft )
Figure F.140 Branch A-2-4 (23%) Soil, Deformation under 50 psi Plate Load (Water Table at 36 in., w/out Limerock, Test 10-23)
Deformation for Branch A-2-4 Soil, Plate Load Test 10-24
0.00
0.20
0.40
0.60
0.80
1.00
1.20
1.40
1.60
1.80
2.00
1 10 100 1000 10000 100000
Number of Cycles
Def
orm
atio
n, m
m
PermanentTotalResilient
( Plate Load : 50 psi w/ Limerock Base Layer, Base Clearance : 0 ft )
Figure F.141 Branch A-2-4 (23%) Soil, Deformation under 50 psi Plate Load (Water Table at 36 in, w/ Limerock, Test 10-24)

387
Deformation for Branch A-2-4 Soil, Plate Load Test 10-25
0.00
0.20
0.40
0.60
0.80
1.00
1.20
1.40
1.60
1 10 100 1000 10000 100000
Number of Cycles
Def
orm
atio
n, m
mPermanentTotalResilient
( Plate Load : 50 psi w/ Limerock Base Layer, Base Clearance : 1 ft
Figure F.142 Branch A-2-4 (23%) Soil, Deformation under 50 psi Plate Load (Water Table at 24 in. (Drawdown), w/out Limerock, Test 10-25)
Deformation for Branch A-2-4 Soil, Plate Load Test 10-26
0.00
0.20
0.40
0.60
0.80
1.00
1.20
1.40
1.60
1.80
1 10 100 1000 10000 100000
Number of Cycles
Def
orm
atio
n, m
m
PermanentTotalResilient
( Plate Load : 50 psi w/ Limerock Base Layer, Base Clearance : 1 ft
Figure F.143 Branch A-2-4 (23%) Soil, Deformation under 50 psi Plate Load (Water Table at 24 in. Drawdown), w/ Limerock, Test 10-26)

388
Deformation for Branch A-2-4 Soil, Plate Load Test 10-27
0.00
0.20
0.40
0.60
0.80
1.00
1.20
1.40
1.60
1.80
1 10 100 1000 10000 100000
Number of Cycles
Def
orm
atio
n, m
mPermanentTotalResilient
( Plate Load : 50 psi w/ Limerock Base Layer, Base Clearance : 1 ft
Figure F.144 Branch A-2-4 (23%) Soil, Deformation under 50 psi Plate Load (Water Table at 24 in. (Drawdown), w/out Limerock, Test 10-27)
Deformation for Branch A-2-4 Soil, Plate Load Test 10-28
0.00
0.10
0.20
0.30
0.40
0.50
0.60
0.70
1 10 100 1000 10000 100000
Number of Cycles
Def
orm
atio
n, m
m
PermanentTotalResilient
( Plate Load : 50 psi w/ Limerock Base Layer, Base Clearance : 2 ft
Figure F.145 Branch A-2-4 (23%) Soil, Deformation under 50 psi Plate Load (Water Table at 12 in. (Drawdown), w/ Limerock, Test 10-28)

389
Deformation for Branch A-2-4 Soil, Plate Load Test 10-29
0.00
0.10
0.20
0.30
0.40
0.50
0.60
0.70
0.80
0.90
1 10 100 1000 10000 100000
Number of Cycles
Def
orm
atio
n, m
mPermanentTotalResilient
( Plate Load : 50 psi w/ Limerock Base Layer, Base Clearance : 1 ft
Figure F.146 Branch A-2-4 (23%) Soil, Deformation under 50 psi Plate Load (Water Table at 24 in. (Drawdown), w/out Limerock, Test 10-27)
Deformation for Branch A-2-4 Soil, Plate Load Test 10-30
0.00
0.10
0.20
0.30
0.40
0.50
0.60
1 10 100 1000 10000 100000
Number of Cycles
Def
orm
atio
n, m
m
PermanentTotalResilient
( Plate Load : 50 psi w/ Limerock Base Layer, Base Clearance : 1 ft
Figure F.147 Branch A-2-4 (23%) Soil, Deformation under 50 psi Plate Load (Water Table at 12 in. (Drawdown), w/ Limerock, Test 10-28)

390
Branch A-2-4 Resilient Deformation v.s. Load Cycles (20 psi )
0.00000
0.00100
0.00200
0.00300
0.00400
0.00500
0.00600
0.00700
0.00800
0.00900
0.01000
1 10 100 1000 10000 100000
Load Cycles
Res
ilien
t Def
orm
atio
n (in
ch)
Test 10-1 : Base Clearance 3 ft _1 Test 10-2 : Base Clearance 3 ft _2 Test 10-3 : Base Clearance 3 ft _3Test 10-4 : Base Clearance 3 ft _4 Test 10-5 : Base Clearance 2 ft _1 Test 10-6 : Base Clearance 2 ft _2Test 10-7 : Base Clearance 2 ft _3 Test 10-8 : Base Clearance 2 ft _4 Test 10-9 : Base Clearance 1 ft _1Test 10-10 : Base Clearance 1 ft _2 Test 10-11 : Base Clearance 1 ft _3
Figure F.148 Branch A-2-4 Soil, Deformation Summary under 20 psi Plate Load at Different Water Table Level
Branch A-2-4 Resilient Deformation v.s. Load Cycles (50 psi )
0.00000
0.00500
0.01000
0.01500
0.02000
0.02500
1 10 100 1000 10000 100000
Load Cycles
Res
ilien
t Def
orm
atio
n (in
ch)
Test 10-12 : Base Clearance 3 ft _1 Test 10-13 : Base Clearance 3 ft _2 Test 10-14 : Base Clearance 3 ft _3Test 10-15 : Base Clearance 2 ft _1 Test 10-16 : Base Clearance 2 ft _2 Test 10-17 : Base Clearance 2 ft _3Test 10-18 : Base Clearance 1 ft _1 Test 10-19 : Base Clearance 1 ft _2 Test 10-20 : Base Clearance 1 ft _3Test 10-21 : Base Clearance 1 ft _4 Test 10-22 : Base Clearance 0 ft _1 Test 10-23 : Base Clearance 0 ft _2Test 10-24 : Base Clearance 0 ft _3 Test 10-25 : Base Clearance 1 ft _1 (Drawdown) Test 10-26 : Base Clearance 1 ft _2 (Drawdown)Test 10-27 : Base Clearance 1 ft _3 (Drawdown) Test 10-28 : Base Clearance 2 ft _1 (Drawdown) Test 10-29 : Base Clearance 2 ft _2 (Drawdown)Test 10-30 : Base Clearance 2 ft _3 (Drawdown)
Figure F.149 Branch A-2-4 Soil, Deformation Summary under 50 psi Plate Load at Different Water Table Level
391
F.11 IRON BRIDGE A-2-6, 31% SOIL

392
Table F.34 Iron Bridge A-2-6 Soil Plate Load Test, 20 psi w/o Limerock
Permanent Total Resilient Permanent Total Resilient(mm) (mm) (mm) (mm) (mm) (mm)
1 0.1625 0.5023 0.3398 1 0.1220 0.3208 0.19884 0.2104 0.5437 0.3332 4 0.1482 0.3422 0.19405 0.2139 0.5631 0.3492 5 0.1517 0.3512 0.1995
10 0.2324 0.5885 0.3562 10 0.1639 0.3672 0.203425 0.2552 0.6017 0.3465 25 0.1797 0.3887 0.208950 0.2706 0.6194 0.3488 50 0.1901 0.3989 0.2088100 0.2841 0.6366 0.3525 100 0.1963 0.4046 0.2083200 0.2958 0.6498 0.3540 200 0.2044 0.4135 0.2090500 0.3111 0.6629 0.3518 500 0.2168 0.4224 0.2056
1000 0.3242 0.6734 0.3493 1000 0.2285 0.4319 0.20342000 0.3403 0.6868 0.3465 2000 0.2459 0.4461 0.20025000 0.3548 0.7006 0.3458 5000 0.2685 0.4627 0.1943
10000 0.3504 0.7051 0.3547 10000 0.2818 0.4709 0.189115000 0.3492 0.7260 0.3768 15000 0.2837 0.4711 0.187420000 0.3900 0.7537 0.3637 20000 0.2856 0.4720 0.186325000 0.3925 0.7451 0.3526 25000 0.2863 0.4715 0.185330000 30000 0.2874 0.4733 0.1858
Permanent Total Resilient Permanent Total Resilient(mm) (mm) (mm) (mm) (mm) (mm)
1 0.0374 0.1771 0.1397 1 0.0364 0.2373 0.20094 0.0526 0.1934 0.1408 4 0.0494 0.2371 0.18775 0.0539 0.1987 0.1448 5 0.0515 0.2442 0.1927
10 0.0596 0.2056 0.1460 10 0.0548 0.2475 0.192725 0.0682 0.2154 0.1472 25 0.0597 0.2521 0.192550 0.0754 0.2232 0.1478 50 0.0642 0.2547 0.1905100 0.0828 0.2298 0.1470 100 0.0669 0.2580 0.1911200 0.0893 0.2354 0.1461 200 0.0687 0.2612 0.1925500 0.0963 0.2422 0.1460 500 0.0702 0.2633 0.1931
1000 0.1057 0.2508 0.1451 1000 0.0704 0.2641 0.19382000 0.1195 0.2620 0.1424 2000 0.0724 0.2661 0.19375000 0.1354 0.2742 0.1388 5000 0.0846 0.2741 0.1894
10000 0.1525 0.2874 0.1349 10000 0.0882 0.2789 0.190715000 0.1618 0.2938 0.1320 15000 0.0962 0.2859 0.189720000 0.1662 0.2955 0.1294 20000 0.1011 0.2898 0.188725000 0.1699 0.2973 0.1274 25000 0.1026 0.2895 0.186930000 0.1719 0.2986 0.1268 30000 0.0934 0.2795 0.1861
Deformation with W.T. at 0 in., Test 11-3Load
Cycles
Deformation with W.T. at 0 in., Test 11-1Load
Cycles
Deformation with W.T. at 0 in., Test 11-2Load
Cycles
Deformation with W.T. at 0 in., Test 11-4Load
Cycles

393
Table F.34 Continued
Permanent Total Resilient Permanent Total Resilient(mm) (mm) (mm) (mm) (mm) (mm)
1 0.1754 0.3555 0.1801 1 0.0425 0.2840 0.24154 0.2193 0.3850 0.1657 4 0.0700 0.2699 0.19995 0.2229 0.3910 0.1681 5 0.0711 0.2727 0.2016
10 0.2330 0.4040 0.1710 10 0.0737 0.2732 0.199525 0.2507 0.4231 0.1724 25 0.0763 0.2735 0.197250 0.2637 0.4367 0.1729 50 0.0782 0.2735 0.1954100 0.2764 0.4491 0.1727 100 0.0794 0.2727 0.1933200 0.2874 0.4601 0.1726 200 0.0799 0.2718 0.1919500 0.3008 0.4710 0.1702 500 0.0804 0.2703 0.1898
1000 0.3108 0.4796 0.1688 1000 0.0810 0.2699 0.18892000 0.3221 0.4908 0.1687 2000 0.0824 0.2693 0.18695000 0.3420 0.5077 0.1657 5000 0.0912 0.2739 0.182610000 0.3604 0.5219 0.1615 10000 0.1048 0.2827 0.177915000 0.3738 0.5327 0.1589 15000 0.1191 0.2939 0.174820000 0.3804 0.5367 0.1563 20000 0.1281 0.2995 0.171325000 0.3904 0.5414 0.1510 25000 0.1233 0.2931 0.169830000 0.3983 0.5467 0.1484 30000 0.1227 0.2918 0.1692
Permanent Total Resilient(mm) (mm) (mm)
1 0.1527 0.3158 0.16304 0.1894 0.3346 0.14515 0.1915 0.3409 0.1494
10 0.1991 0.3502 0.151125 0.2116 0.3634 0.151850 0.2222 0.3735 0.1513100 0.2319 0.3820 0.1502200 0.2404 0.3893 0.1489500 0.2515 0.3979 0.1464
1000 0.2606 0.4041 0.14352000 0.2714 0.4122 0.14085000 0.2956 0.4304 0.134810000 0.3254 0.4578 0.132415000 0.3550 0.4843 0.129320000 0.3767 0.5037 0.127025000 0.3900 0.5152 0.125230000 0.3966 0.5164 0.1199
Deformation with W.T. at 12 in., Test 11-6Load
Cycles
Deformation with W.T. at 12 in., Test 11-7Load
Cycles
Deformation with W.T. at 12 in., Test 11-5Load
Cycles

394
Table F.34 Continued
Permanent Total Resilient Permanent Total Resilient(mm) (mm) (mm) (mm) (mm) (mm)
1 0.2354 0.4926 0.2573 1 0.1259 0.4935 0.36774 0.3011 0.5177 0.2167 4 0.1897 0.4814 0.29175 0.3035 0.5296 0.2261 5 0.1919 0.4877 0.295810 0.3213 0.5479 0.2266 10 0.1968 0.4949 0.298125 0.3492 0.5755 0.2263 25 0.2072 0.5007 0.293550 0.3752 0.6006 0.2255 50 0.2171 0.5085 0.2914
100 0.3999 0.6224 0.2224 100 0.2272 0.5151 0.2879200 0.4218 0.6427 0.2209 200 0.2374 0.5221 0.2847500 0.4449 0.6630 0.2181 500 0.2490 0.5334 0.28441000 0.4603 0.6765 0.2162 1000 0.2584 0.5409 0.28262000 0.4752 0.6886 0.2134 2000 0.2686 0.5494 0.28085000 0.4973 0.7075 0.2102 5000 0.2841 0.5652 0.281110000 0.5151 0.7225 0.2074 10000 0.2980 0.5760 0.278015000 0.5219 0.7274 0.2056 15000 0.3063 0.5822 0.275920000 0.5421 0.7471 0.2050 20000 0.3129 0.5897 0.276825000 0.5595 0.7627 0.2032 25000 0.3246 0.6009 0.276330000 0.5475 0.7504 0.2030 30000 0.3126 0.5861 0.2736
Permanent Total Resilient(mm) (mm) (mm)
1 0.3119 0.6071 0.29524 0.3890 0.6532 0.26425 0.3937 0.6652 0.271510 0.4139 0.6883 0.274425 0.4717 0.7531 0.281550 0.5061 0.7861 0.2801
100 0.5374 0.8164 0.2790200 0.5654 0.8415 0.2761500 0.6021 0.8745 0.27241000 0.6279 0.8979 0.26992000 0.6554 0.9239 0.26855000 0.6907 0.9567 0.266010000 0.6554 0.9225 0.267215000 0.6729 0.9377 0.264820000 0.6690 0.9318 0.262825000 0.6593 0.9245 0.265230000 0.6670 0.9324 0.2654
Deformation with W.T. at 24 in., Test 11-10Load
Cycles
Deformation with W.T. at 24 in., Test 11-8 Deformation with W.T. at 24 in., Test 11-9Load
CyclesLoad
Cycles

395
Table F.35 Iron Bridge A-2-6 Soil Plate Load Test, 50 psi w/ Limerock
Permanent Total Resilient Permanent Total Resilient(mm) (mm) (mm) (mm) (mm) (mm)
1 0.2507 0.4136 0.1629 1 0.1652 0.2943 0.12914 0.2969 0.4426 0.1457 4 0.1977 0.3172 0.11955 0.2995 0.4447 0.1452 5 0.1989 0.3216 0.1226
10 0.3094 0.4578 0.1484 10 0.2047 0.3278 0.123125 0.3255 0.4757 0.1501 25 0.2157 0.3393 0.123650 0.3402 0.4891 0.1490 50 0.2254 0.3481 0.1228
100 0.3538 0.5010 0.1473 100 0.2353 0.3562 0.1209200 0.3614 0.5078 0.1464 200 0.2408 0.3608 0.1201500 0.3830 0.5260 0.1430 500 0.2566 0.3751 0.1185
1000 0.4010 0.5419 0.1409 1000 0.2700 0.3869 0.11692000 0.4190 0.5579 0.1389 2000 0.2857 0.4019 0.11625000 0.4912 0.6283 0.1371 5000 0.3152 0.4298 0.114610000 0.5391 0.6745 0.1354 10000 0.3344 0.4474 0.113015000 0.5537 0.6874 0.1338 15000 0.3572 0.4680 0.110820000 0.5636 0.6955 0.1319 20000 0.3640 0.4736 0.109625000 0.5749 0.7037 0.1288 25000 0.3726 0.4820 0.109430000 0.5848 0.7109 0.1261 30000 0.3733 0.4844 0.1112
Permanent Total Resilient(mm) (mm) (mm)
1 0.1770 0.3210 0.14404 0.2139 0.3462 0.13225 0.2162 0.3496 0.1335
10 0.2227 0.3559 0.133325 0.2321 0.3730 0.140950 0.2393 0.3805 0.1413
100 0.2479 0.3880 0.1401200 0.2527 0.3924 0.1398500 0.2635 0.4010 0.1375
1000 0.2671 0.4036 0.13652000 0.2815 0.4167 0.13525000 0.3173 0.4496 0.132410000 0.3488 0.4836 0.134815000 0.3721 0.5009 0.128820000 0.4017 0.5298 0.128125000 0.3963 0.5229 0.126630000 0.3990 0.5231 0.1241
Deformation with W.T. at 0 in., Test 11-11Load
Cycles
Deformation with W.T. at 0 in., Test 11-12Load
Cycles
Deformation with W.T. at 0 in., Test 11-13Load
Cycles

396
Table F.35 Continued
Permanent Total Resilient Permanent Total Resilient(mm) (mm) (mm) (mm) (mm) (mm)
1 0.1100 0.2517 0.1416 1 0.1774 0.3225 0.14514 0.1418 0.2762 0.1345 4 0.2205 0.3564 0.13595 0.1436 0.2762 0.1326 5 0.2221 0.3648 0.142710 0.1490 0.2826 0.1336 10 0.2283 0.3732 0.145025 0.1595 0.2939 0.1343 25 0.2394 0.3847 0.145350 0.1679 0.3018 0.1339 50 0.2494 0.3946 0.1452100 0.1757 0.3099 0.1342 100 0.2609 0.4036 0.1427200 0.1803 0.3147 0.1345 200 0.2659 0.4085 0.1426500 0.1938 0.3279 0.1342 500 0.2833 0.4229 0.1396
1000 0.2058 0.3392 0.1334 1000 0.2896 0.4287 0.13912000 0.2133 0.3457 0.1325 2000 0.2847 0.4221 0.13735000 0.2345 0.3644 0.1299 5000 0.3250 0.4597 0.134710000 0.2514 0.3784 0.1270 10000 0.3333 0.4667 0.133415000 0.2730 0.3984 0.1254 15000 0.3592 0.4910 0.131920000 0.2833 0.4073 0.1241 20000 0.3807 0.5116 0.130925000 0.2891 0.4124 0.1233 25000 0.3970 0.5275 0.130630000 0.2979 0.4202 0.1223 30000 0.4072 0.5377 0.1305
Permanent Total Resilient(mm) (mm) (mm)
1 0.1505 0.3055 0.15504 0.1751 0.3245 0.14945 0.1768 0.3269 0.150110 0.1836 0.3351 0.151525 0.1979 0.3491 0.151250 0.2090 0.3600 0.1510100 0.2196 0.3708 0.1513200 0.2259 0.3774 0.1515500 0.2435 0.3947 0.1512
1000 0.2562 0.4074 0.15112000 0.2710 0.4210 0.15005000 0.3232 0.4718 0.148610000 0.3500 0.4977 0.147815000 0.3783 0.5269 0.148520000 0.4036 0.5512 0.147725000 0.4291 0.5770 0.147930000 0.4350 0.5822 0.1472
Deformation with W.T. at 12 in., Test 11-14Load
Cycles
Deformation with W.T. at 12 in., Test 11-16Load
Cycles
Deformation with W.T. at 12 in., Test 11-15Load
Cycles

397
Table F.35 Continued
Permanent Total Resilient Permanent Total Resilient(mm) (mm) (mm) (mm) (mm) (mm)
1 0.1724 0.3845 0.2121 1 0.2416 0.4554 0.21384 0.2211 0.4210 0.1998 4 0.2882 0.4848 0.19665 0.2259 0.4272 0.2013 5 0.3074 0.5108 0.2034
10 0.2377 0.4421 0.2044 10 0.3060 0.5065 0.200525 0.2614 0.4665 0.2051 25 0.3313 0.5386 0.207350 0.2818 0.4867 0.2048 50 0.3579 0.5626 0.2047100 0.3035 0.5061 0.2026 100 0.3838 0.5876 0.2039200 0.3152 0.5171 0.2019 200 0.3847 0.5886 0.2039500 0.3470 0.5467 0.1997 500 0.4249 0.6243 0.1994
1000 0.3686 0.5678 0.1993 1000 0.4479 0.6501 0.20232000 0.3915 0.5896 0.1981 2000 0.4761 0.6784 0.20235000 0.4267 0.6236 0.1969 5000 0.5110 0.7163 0.205410000 0.4675 0.6637 0.1962 10000 0.5699 0.7750 0.205215000 0.5040 0.6996 0.1956 15000 0.6000 0.8062 0.206220000 0.5244 0.7200 0.1956 20000 0.6264 0.8290 0.202525000 0.5367 0.7328 0.1961 25000 0.6495 0.8604 0.210930000 0.5470 0.7431 0.1961 30000 0.6635 0.8724 0.2090
Permanent Total Resilient(mm) (mm) (mm)
1 0.1913 0.4435 0.25234 0.2548 0.5028 0.24805 0.2592 0.5028 0.2436
10 0.2751 0.5226 0.247525 0.3033 0.5557 0.252550 0.3312 0.5831 0.2519100 0.3609 0.6127 0.2518200 0.3784 0.6297 0.2514500 0.4234 0.6742 0.2508
1000 0.4528 0.7043 0.25152000 0.4830 0.7366 0.25365000 0.5288 0.7844 0.255710000 0.5928 0.8477 0.254915000 0.6384 0.8950 0.256620000 0.6763 0.9325 0.256225000 0.7040 0.9590 0.255030000 0.7226 0.9777 0.2551
Deformation with W.T. at 24 in., Test 11-19Load
Cycles
Deformation with W.T. at 24 in., Test 11-17 Deformation with W.T. at 24 in., Test 11-18Load
CyclesLoad
Cycles

398
Table F.35 Continued
Permanent Total Resilient Permanent Total Resilient(mm) (mm) (mm) (mm) (mm) (mm)
1 0.2966 0.6924 0.3958 1 0.3525 0.7931 0.44064 0.3589 0.7438 0.3848 4 0.4673 0.9039 0.43665 0.3650 0.7419 0.3770 5 0.4782 0.9191 0.4409
10 0.3890 0.7794 0.3904 10 0.5262 0.9856 0.459425 0.4462 0.8579 0.4117 25 0.6333 1.1173 0.484050 0.5128 0.9373 0.4245 50 0.7495 1.2481 0.4986
100 0.5981 1.0381 0.4399 100 0.8891 1.3989 0.5097200 0.6545 1.1023 0.4478 200 0.9766 1.4936 0.5170500 0.8261 1.2983 0.4722 500 1.2330 1.7686 0.5356
1000 0.9632 1.4572 0.4940 1000 1.4312 1.9870 0.55582000 1.1401 1.6672 0.5271 2000 1.6793 2.2657 0.58655000 1.5329 2.1283 0.5954 5000 2.2034 2.9239 0.720510000 2.1296 2.7882 0.6586 10000 2.9450 3.6676 0.722615000 2.6131 3.3089 0.6958 15000 3.5782 4.3355 0.757220000 3.0115 3.7200 0.7084 20000 4.0890 4.8614 0.772425000 3.3506 4.0752 0.7245 25000 4.4685 5.2544 0.785930000 3.6274 4.3606 0.7332 30000 4.7758 5.5703 0.7945
Permanent Total Resilient(mm) (mm) (mm)
1 0.2951 0.6850 0.39004 0.3891 0.7772 0.38825 0.3954 0.7772 0.3818
10 0.4224 0.8189 0.396425 0.4855 0.8999 0.414450 0.5559 0.9824 0.4265
100 0.6441 1.0809 0.4369200 0.7001 1.1423 0.4422500 0.8604 1.3164 0.4560
1000 0.9686 1.4356 0.46692000 1.0796 1.5561 0.47655000 1.2400 1.7315 0.491510000 1.4296 1.9366 0.507015000 1.5424 2.0587 0.516420000 1.6466 2.1719 0.525425000 1.7245 2.2573 0.532730000 1.8049 2.3455 0.5406
Load Cycles
Load Cycles
Deformation with W.T. at 36 in., Test 11-22Load
Cycles
Deformation with W.T. at 36 in., Test 11-20 Deformation with W.T. at 36 in., Test 11-21

399
Table F.35 Continued
Permanent Total Resilient Permanent Total Resilient(mm) (mm) (mm) (mm) (mm) (mm)
1 0.2626 0.5483 0.2857 1 0.3532 0.6970 0.34384 0.3197 0.5983 0.2786 4 0.4434 0.7767 0.33335 0.3253 0.5991 0.2738 5 0.4477 0.7767 0.329010 0.3424 0.6237 0.2813 10 0.4727 0.8166 0.343925 0.3727 0.6601 0.2874 25 0.5199 0.8770 0.357150 0.4040 0.6906 0.2866 50 0.5676 0.9302 0.3626100 0.4378 0.7264 0.2886 100 0.6251 0.9913 0.3663200 0.4589 0.7495 0.2906 200 0.6601 1.0281 0.3680500 0.5166 0.8119 0.2952 500 0.7572 1.1238 0.36651000 0.5576 0.8546 0.2970 1000 0.8188 1.1928 0.37402000 0.5997 0.8993 0.2996 2000 0.8870 1.2612 0.37425000 0.6584 0.9619 0.3035 5000 0.9774 1.3500 0.372610000 0.7207 1.0256 0.3049 10000 1.0773 1.4430 0.365615000 0.7618 1.0665 0.3048 15000 1.1552 1.5143 0.359120000 0.7995 1.1041 0.3047 20000 1.2089 1.5713 0.362425000 0.8284 1.1325 0.3041 25000 1.2569 1.6165 0.359630000 0.8432 1.1504 0.3072 30000 1.2906 1.6497 0.3592
Permanent Total Resilient(mm) (mm) (mm)
1 0.2938 0.5964 0.30274 0.3555 0.6459 0.29045 0.3595 0.6478 0.288310 0.3749 0.6656 0.290725 0.4101 0.7068 0.296750 0.4458 0.7458 0.3000100 0.4891 0.7920 0.3029200 0.5164 0.8213 0.3049500 0.5789 0.8919 0.31301000 0.6395 0.9527 0.31322000 0.6999 1.0230 0.32325000 0.7890 1.1208 0.331810000 0.8577 1.1893 0.331515000 0.9217 1.2539 0.332220000 0.9704 1.2989 0.328525000 1.0023 1.3304 0.328130000 1.0347 1.3625 0.3278
Deformation with W.T. at 24 in. (Drawdown), Test 11-23 Deformation with W.T. at 24 in. (Drawdown), Test 11-24
Load Cycles Load Cycles
Deformation with W.T. at 24 in. (Drawdown), Test 11-25
Load Cycles
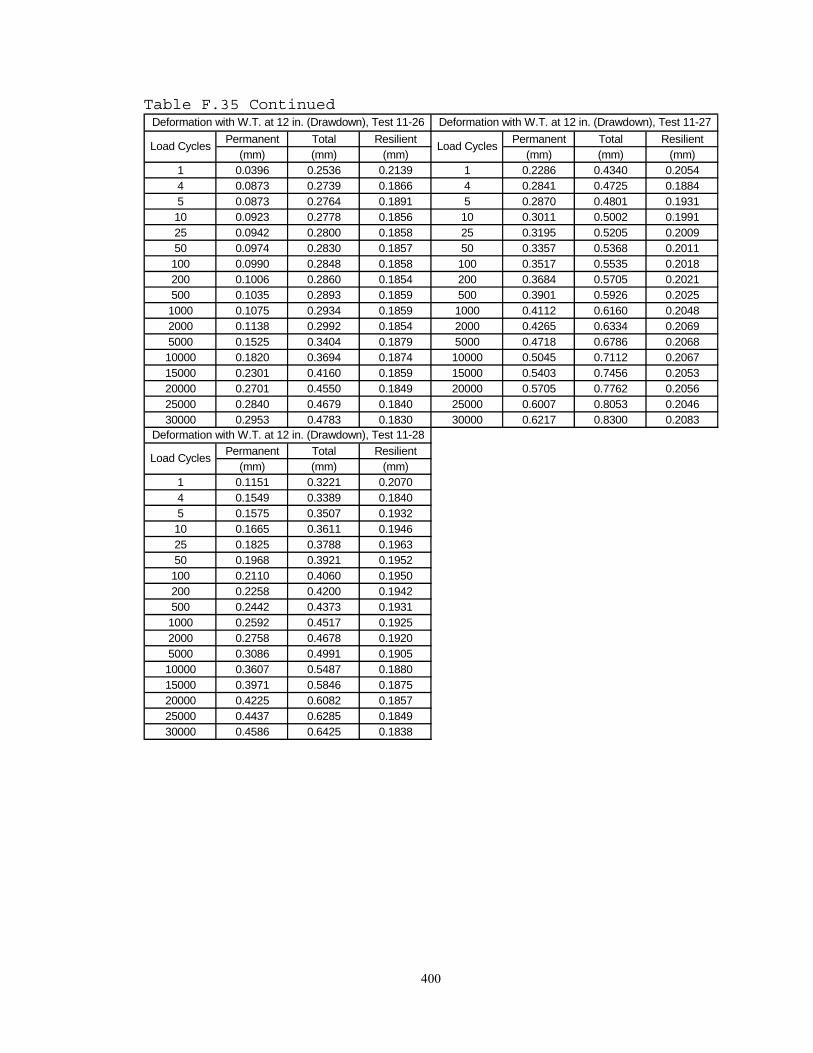
400
Table F.35 Continued
Permanent Total Resilient Permanent Total Resilient(mm) (mm) (mm) (mm) (mm) (mm)
1 0.0396 0.2536 0.2139 1 0.2286 0.4340 0.20544 0.0873 0.2739 0.1866 4 0.2841 0.4725 0.18845 0.0873 0.2764 0.1891 5 0.2870 0.4801 0.193110 0.0923 0.2778 0.1856 10 0.3011 0.5002 0.199125 0.0942 0.2800 0.1858 25 0.3195 0.5205 0.200950 0.0974 0.2830 0.1857 50 0.3357 0.5368 0.2011100 0.0990 0.2848 0.1858 100 0.3517 0.5535 0.2018200 0.1006 0.2860 0.1854 200 0.3684 0.5705 0.2021500 0.1035 0.2893 0.1859 500 0.3901 0.5926 0.20251000 0.1075 0.2934 0.1859 1000 0.4112 0.6160 0.20482000 0.1138 0.2992 0.1854 2000 0.4265 0.6334 0.20695000 0.1525 0.3404 0.1879 5000 0.4718 0.6786 0.206810000 0.1820 0.3694 0.1874 10000 0.5045 0.7112 0.206715000 0.2301 0.4160 0.1859 15000 0.5403 0.7456 0.205320000 0.2701 0.4550 0.1849 20000 0.5705 0.7762 0.205625000 0.2840 0.4679 0.1840 25000 0.6007 0.8053 0.204630000 0.2953 0.4783 0.1830 30000 0.6217 0.8300 0.2083
Permanent Total Resilient(mm) (mm) (mm)
1 0.1151 0.3221 0.20704 0.1549 0.3389 0.18405 0.1575 0.3507 0.193210 0.1665 0.3611 0.194625 0.1825 0.3788 0.196350 0.1968 0.3921 0.1952100 0.2110 0.4060 0.1950200 0.2258 0.4200 0.1942500 0.2442 0.4373 0.19311000 0.2592 0.4517 0.19252000 0.2758 0.4678 0.19205000 0.3086 0.4991 0.190510000 0.3607 0.5487 0.188015000 0.3971 0.5846 0.187520000 0.4225 0.6082 0.185725000 0.4437 0.6285 0.184930000 0.4586 0.6425 0.1838
Deformation with W.T. at 12 in. (Drawdown), Test 11-28
Load Cycles
Deformation with W.T. at 12 in. (Drawdown), Test 11-26 Deformation with W.T. at 12 in. (Drawdown), Test 11-27
Load Cycles Load Cycles

401
Table F.36 Summary of Deformation for Iron Bridge A-2-6 (31%) Soil, 20 psi Plate Load w/o Limerock Base Layer
Test No. 11-1 11-2 11-3 11-4 11-5 11-6 11-7 11-9 11-10 11-11
Test Date 7/26/2005 7/25/2005 7/27/2005 8/4/2005 9/16/2005 9/22/2005 9/23/2005 12/9/2005 12/13/2005 12/14/2005
Loads (psi) 20 20 20 20 20 20 20 20 21 22
Limerock Layer No No No No No No No No No No
0 0 0 0 12 12 12 24 24 24
1 0.01338 0.00783 0.00550 0.00791 0.00709 0.00951 0.00642 0.01013 0.01447 0.01162
4 0.01312 0.00764 0.00554 0.00739 0.00652 0.00787 0.00571 0.00853 0.01148 0.01040
5 0.01375 0.00785 0.00570 0.00759 0.00662 0.00794 0.00588 0.00890 0.01165 0.01069
10 0.01402 0.00801 0.00575 0.00759 0.00673 0.00786 0.00595 0.00892 0.01174 0.01080
25 0.01364 0.00823 0.00579 0.00758 0.00679 0.00776 0.00598 0.00891 0.01156 0.01108
50 0.01373 0.00822 0.00582 0.00750 0.00681 0.00769 0.00596 0.00888 0.01147 0.01103
100 0.01388 0.00820 0.00579 0.00752 0.00680 0.00761 0.00591 0.00876 0.01134 0.01098
200 0.01394 0.00823 0.00575 0.00758 0.00680 0.00755 0.00586 0.00870 0.01121 0.01087
500 0.01385 0.00809 0.00575 0.00760 0.00670 0.00747 0.00576 0.00859 0.01120 0.01072
1000 0.01375 0.00801 0.00571 0.00763 0.00665 0.00744 0.00565 0.00851 0.01113 0.01063
2000 0.01364 0.00788 0.00561 0.00763 0.00664 0.00736 0.00554 0.00840 0.01106 0.01057
5000 0.01361 0.00765 0.00547 0.00746 0.00652 0.00719 0.00531 0.00828 0.01107 0.01047
10000 0.01396 0.00744 0.00531 0.00751 0.00636 0.00701 0.00521 0.00816 0.01094 0.01052
15000 0.01484 0.00738 0.00520 0.00747 0.00626 0.00688 0.00509 0.00809 0.01086 0.01042
20000 0.01432 0.00734 0.00509 0.00743 0.00615 0.00674 0.00500 0.00807 0.01090 0.01035
25000 0.01388 0.00729 0.00502 0.00736 0.00595 0.00669 0.00493 0.00800 0.01088 0.01044
30000 0.00732 0.00499 0.00733 0.00584 0.00666 0.00472 0.00799 0.01077 0.01045Average from 10,000
Cycles 0.01425 0.00735 0.00512 0.00742 0.00611 0.00680 0.00499 0.00806 0.01087 0.01044
No.of Plate Load Cycles W ater Table (in. above Embankment)
Resilient Deformation (in.) for Iron Bridge A-2-6 Soil

402
Table F.37 Summary of Deformation for Iron Bridge A-2-6 (31%) Soil, 50 psi Plate Load w/ Limerock Base Layer
Test No. 11-11 11-12 11-13 11-14 11-15 11-16 11-17 11-18 11-19 11-20 11-21 11-22 11-23 11-24 11-25 11-26 11-27 11-28
Test Date 3/9/06 3/10/06 3/13/06 5/18/06 5/19/06 5/22/06 8/1/06 8/2/06 8/3/06 10/19/06 10/20/06 10/23/06 1/9/07 1/10/07 1/11/07 4/2/07 4/3/07 4/4/07
Loads (psi) 50 50 50 50 50 50 50 50 50 50 50 50 50 50 50 50 50 50
Limerock Yes Yes Yes Yes Yes Yes Yes Yes Yes Yes Yes Yes Yes Yes Yes Yes Yes Yes
0 0 0 12 12 12 24 24 24 36 36 36 24 24 24 12 12 12
1 0.00641 0.00508 0.00567 0.00558 0.00571 0.00610 0.00835 0.00842 0.00993 0.01558 0.01735 0.01535 0.01125 0.01354 0.01192 0.00842 0.00809 0.00815
4 0.00574 0.00470 0.00521 0.00529 0.00535 0.00588 0.00787 0.00774 0.00976 0.01515 0.01719 0.01528 0.01097 0.01312 0.01143 0.00735 0.00742 0.00724
5 0.00572 0.00483 0.00525 0.00522 0.00562 0.00591 0.00793 0.00801 0.00959 0.01484 0.01736 0.01503 0.01078 0.01295 0.01135 0.00745 0.00760 0.00761
10 0.00584 0.00485 0.00525 0.00526 0.00571 0.00596 0.00805 0.00789 0.00975 0.01537 0.01809 0.01561 0.01108 0.01354 0.01144 0.00731 0.00784 0.00766
25 0.00591 0.00487 0.00555 0.00529 0.00572 0.00595 0.00808 0.00816 0.00994 0.01621 0.01906 0.01632 0.01131 0.01406 0.01168 0.00732 0.00791 0.00773
50 0.00586 0.00483 0.00556 0.00527 0.00572 0.00595 0.00806 0.00806 0.00992 0.01671 0.01963 0.01679 0.01128 0.01428 0.01181 0.00731 0.00792 0.00769
100 0.00580 0.00476 0.00551 0.00528 0.00562 0.00596 0.00798 0.00803 0.00991 0.01732 0.02007 0.01720 0.01136 0.01442 0.01193 0.00732 0.00795 0.00768
200 0.00576 0.00473 0.00550 0.00529 0.00561 0.00596 0.00795 0.00803 0.00990 0.01763 0.02036 0.01741 0.01144 0.01449 0.01201 0.00730 0.00796 0.00765
500 0.00563 0.00466 0.00541 0.00528 0.00550 0.00595 0.00786 0.00785 0.00987 0.01859 0.02109 0.01795 0.01162 0.01443 0.01232 0.00732 0.00797 0.00760
1000 0.00555 0.00460 0.00537 0.00525 0.00548 0.00595 0.00785 0.00796 0.00990 0.01945 0.02188 0.01838 0.01169 0.01473 0.01233 0.00732 0.00806 0.00758
2000 0.00547 0.00457 0.00532 0.00521 0.00541 0.00590 0.00780 0.00796 0.00998 0.02075 0.02309 0.01876 0.01180 0.01473 0.01272 0.00730 0.00815 0.00756
5000 0.00540 0.00451 0.00521 0.00512 0.00530 0.00585 0.00775 0.00809 0.01007 0.02344 0.02836 0.01935 0.01195 0.01467 0.01306 0.00740 0.00814 0.00750
10000 0.00533 0.00445 0.00531 0.00500 0.00525 0.00582 0.00772 0.00808 0.01004 0.02593 0.02845 0.01996 0.01200 0.01439 0.01305 0.00738 0.00814 0.00740
15000 0.00527 0.00436 0.00507 0.00494 0.00519 0.00585 0.00770 0.00812 0.01010 0.02739 0.02981 0.02033 0.01200 0.01414 0.01308 0.00732 0.00808 0.00738
20000 0.00519 0.00431 0.00504 0.00488 0.00515 0.00581 0.00770 0.00797 0.01009 0.02789 0.03041 0.02068 0.01200 0.01427 0.01293 0.00728 0.00810 0.00731
25000 0.00507 0.00431 0.00498 0.00485 0.00514 0.00582 0.00772 0.00830 0.01004 0.02852 0.03094 0.02097 0.01197 0.01416 0.01292 0.00724 0.00805 0.00728
30000 0.00497 0.00438 0.00489 0.00481 0.00514 0.00579 0.00772 0.00823 0.01004 0.02887 0.03128 0.02128 0.01209 0.01414 0.01290 0.00720 0.00820 0.00724
Average from
10,000 Cycles
0.00517 0.00436 0.00506 0.00490 0.00517 0.00582 0.00771 0.00814 0.01006 0.02772 0.03018 0.02065 0.01201 0.01422 0.01298 0.00728 0.00811 0.00732
No.of Load Cycles
Resilient Deformation (in.) for Iron Bridge A-2-6 Soil
W ater Table (in. above Embankment)

403
Deformation for Iron Bridge A-2-6 Soil, Plate Load Test 11-1
0.00
0.10
0.20
0.30
0.40
0.50
0.60
0.70
0.80
1 10 100 1000 10000 100000
Number of Cycles
Def
orm
atio
n, m
mPermanentTotalResilient
( Plate Load : 20 psi, w/out Limerock Base Layer, Base Clearance : 3 ft )
Figure F.150 Iron Bridge A-2-6 (31%) Soil, Deformation under 20 psi Plate Load (Water Table at 0.0 in., w/out Limerock, Test 11-1)
Deformation for Iron Bridge A-2-6 Soil, Plate Load Test 11-2
0.00
0.05
0.10
0.15
0.20
0.25
0.30
0.35
0.40
0.45
0.50
1 10 100 1000 10000 100000
Number of Cycles
Def
orm
atio
n, m
m
PermanentTotalResilient
( Plate Load : 20 psi, w/out Limerock Base Layer, Base Clearance : 3 ft )
Figure F.151 Iron Bridge A-2-6 (31%) Soil, Deformation under 20 psi Plate Load (Water Table at 0.0 in., w/out Limerock, Test 11-2)

404
Deformation for Iron Bridge A-2-6 Soil, Plate Load Test 11-3
0.00
0.05
0.10
0.15
0.20
0.25
0.30
0.35
1 10 100 1000 10000 100000
Number of Cycles
Def
orm
atio
n, m
mPermanentTotalResilient
( Plate Load : 20 psi, w/out Limerock Base Layer, Base Clearance : 3 ft )
Figure F.152 Iron Bridge A-2-6 (31%) Soil, Deformation under 20 psi Plate Load (Water Table at 0.0 in., w/out Limerock, Test 11-3)
Deformation for Iron Bridge A-2-6 Soil, Plate Load Test 11-4
0.00
0.05
0.10
0.15
0.20
0.25
0.30
0.35
1 10 100 1000 10000 100000
Number of Cycles
Def
orm
atio
n, m
m
PermanentTotalResilient
( Plate Load : 20 psi, w/out Limerock Base Layer, Base Clearance : 3 ft )
Figure F.153 Iron Bridge A-2-6 (31%) Soil, Deformation under 20 psi Plate Load (Water Table at 0.0 in., w/out Limerock, Test 11-4)

405
Deformation for Iron Bridge A-2-6 Soil, Plate Load Test 11-5
0.00
0.10
0.20
0.30
0.40
0.50
0.60
1 10 100 1000 10000 100000
Number of Cycles
Def
orm
atio
n, m
mPermanentTotalResilient
( Plate Load : 20 psi, w/out Limerock Base Layer, Base Clearance : 2 ft )
Figure F.154 Iron Bridge A-2-6 (31%) Soil, Deformation under 20 psi Plate Load (Water Table at 12 in., w/out Limerock, Test 11-5)
Deformation for Iron Bridge A-2-6 Soil, Plate Load Test 11-6
0.00
0.05
0.10
0.15
0.20
0.25
0.30
0.35
1 10 100 1000 10000 100000
Number of Cycles
Def
orm
atio
n, m
m
PermanentTotalResilient
( Plate Load : 20 psi, w/out Limerock Base Layer, Base Clearance : 2 ft )
Figure F.155 Iron Bridge A-2-6 (31%) Soil, Deformation under 20 psi Plate Load (Water Table at 12 in., w/out Limerock, Test 11-6)

406
Deformation for Iron Bridge A-2-6 Soil, Plate Load Test 11-7
0.00
0.10
0.20
0.30
0.40
0.50
0.60
1 10 100 1000 10000 100000
Number of Cycles
Def
orm
atio
n, m
mPermanentTotalResilient
( Plate Load : 20 psi, w/out Limerock Base Layer, Base Clearance : 2 ft )
Figure F.156 Iron Bridge A-2-6 (31%) Soil, Deformation under 20 psi Plate Load (Water Table at 12 in., w/out Limerock, Test 11-7)
Deformation for Iron Bridge A-2-6 Soil, Plate Load Test 11-8
0.00
0.10
0.20
0.30
0.40
0.50
0.60
0.70
0.80
0.90
1 10 100 1000 10000 100000
Number of Cycles
Def
orm
atio
n, m
m
PermanentTotalResilient
( Plate Load : 20 psi, w/out Limerock Base Layer, Base Clearance : 1 ft )
Figure F.157 Iron Bridge A-2-6 (31%) Soil, Deformation under 20 psi Plate Load (Water Table at 24 in., w/out Limerock, Test 11-8)

407
Deformation for Iron Bridge A-2-6 Soil, Plate Load Test 11-9
0.00
0.10
0.20
0.30
0.40
0.50
0.60
0.70
1 10 100 1000 10000 100000
Number of Cycles
Def
orm
atio
n, m
mPermanentTotalResilient
( Plate Load : 20 psi, w/out Limerock Base Layer, Base Clearance : 1 ft )
Figure F.158 Iron Bridge A-2-6 (31%) Soil, Deformation under 20 psi Plate Load (Water Table at 24 in., w/out Limerock, Test 11-9)
Deformation for Iron Bridge A-2-6 Soil, Plate Load Test 11-10
0.00
0.20
0.40
0.60
0.80
1.00
1.20
1 10 100 1000 10000 100000
Number of Cycles
Def
orm
atio
n, m
m
PermanentTotalResilient
( Plate Load : 20 psi, w/out Limerock Base Layer, Base Clearance : 1 ft )
Figure F.159 Iron Bridge A-2-6 (31%) Soil, Deformation under 20 psi Plate Load (Water Table at 24 in., w/out Limerock, Test 11-10)

408
Deformation for Iron Bridge A-2-6 Soil, Plate Load Test 11-11
0.00
0.10
0.20
0.30
0.40
0.50
0.60
0.70
0.80
1 10 100 1000 10000 100000
Number of Cycles
Def
orm
atio
n, m
mPermanentTotalResilient
( Plate Load : 50 psi w/ Limerock Base Layer, Base Clearance : 3 ft )
Figure F.160 Iron Bridge A-2-6 (31%) Soil, Deformation under 50 psi Plate Load (Water Table at 0.0 in., w/ Limerock, Test 11-11)
Deformation for Iron Bridge A-2-6 Soil, Plate Load Test 11-12
0.00
0.10
0.20
0.30
0.40
0.50
0.60
1 10 100 1000 10000 100000
Number of Cycles
Def
orm
atio
n, m
m
PermanentTotalResilient
( Plate Load : 50 psi w/ Limerock Base Layer, Base Clearance : 3 ft )
Figure F.161 Iron Bridge A-2-6 (31%) Soil, Deformation under 50 psi Plate Load (Water Table at 0.0 in., w/ Limerock, Test 11-12)

409
Deformation for Iron Bridge A-2-6 Soil, Plate Load Test 11-13
0.00
0.10
0.20
0.30
0.40
0.50
0.60
1 10 100 1000 10000 100000
Number of Cycles
Def
orm
atio
n, m
mPermanentTotalResilient
( Plate Load : 50 psi w/ Limerock Base Layer, Base Clearance : 3 ft )
Figure F.162 Iron Bridge A-2-6 (31%) Soil, Deformation under 50 psi Plate Load (Water Table at 0.0 in., w/ Limerock, Test 11-13)
Deformation for Iron Bridge A-2-6 Soil, Plate Load Test 11-14
0.00
0.05
0.10
0.15
0.20
0.25
0.30
0.35
0.40
0.45
1 10 100 1000 10000 100000
Number of Cycles
Def
orm
atio
n, m
m
PermanentTotalResilient
( Plate Load : 50 psi w/ Limerock Base Layer, Base Clearance : 2 ft )
Figure F.163 Iron Bridge A-2-6 (31%) Soil, Deformation under 50 psi Plate Load (Water Table at 12 in., w/ Limerock, Test 11-14)

410
Deformation for Iron Bridge A-2-6 Soil, Plate Load Test 11-15
0.00
0.10
0.20
0.30
0.40
0.50
0.60
1 10 100 1000 10000 100000
Number of Cycles
Def
orm
atio
n, m
mPermanentTotalResilient
( Plate Load : 50 psi w/ Limerock Base Layer, Base Clearance : 2 ft )
Figure F.164 Iron Bridge A-2-6 (31%) Soil, Deformation under 50 psi Plate Load (Water Table at 12 in., w/ Limerock, Test 11-15)
Deformation for Iron Bridge A-2-6 Soil, Plate Load Test 11-16
0.00
0.10
0.20
0.30
0.40
0.50
0.60
0.70
1 10 100 1000 10000 100000
Number of Cycles
Def
orm
atio
n, m
m
PermanentTotalResilient
( Plate Load : 50 psi w/ Limerock Base Layer, Base Clearance : 2 ft )
Figure F.165 Iron Bridge A-2-6 (31%) Soil, Deformation under 50 psi Plate Load (Water Table at 12 in., w/ Limerock, Test 11-16)
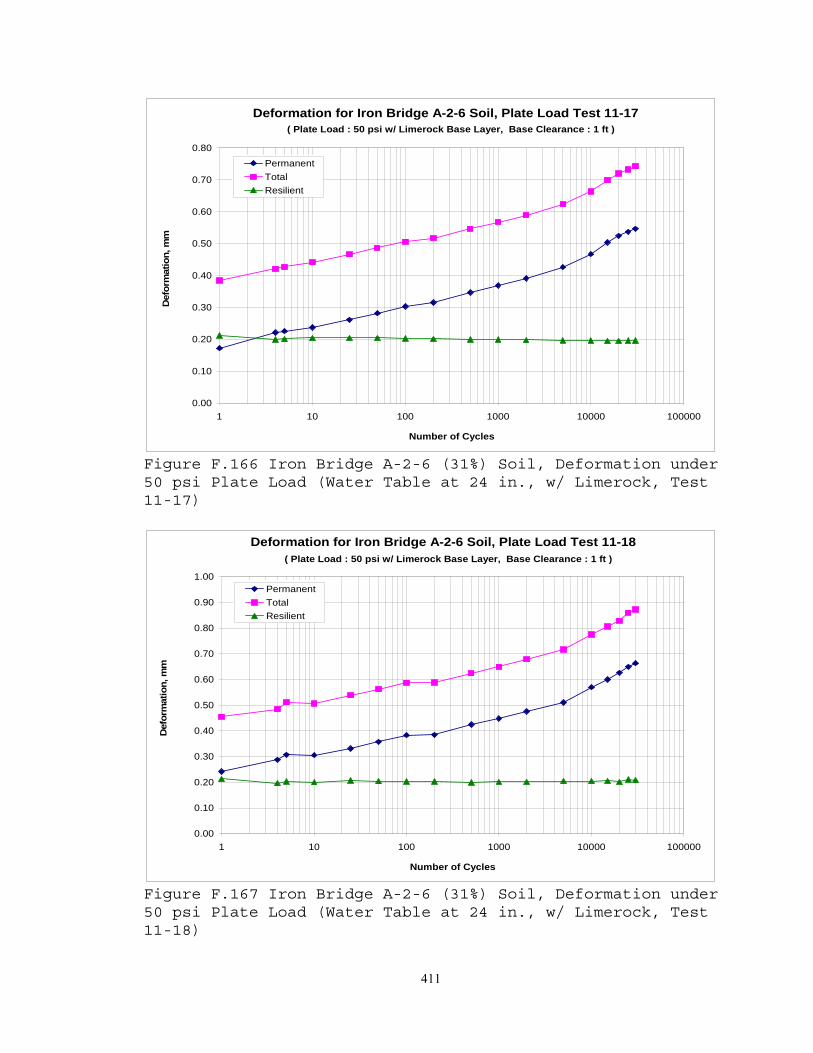
411
Deformation for Iron Bridge A-2-6 Soil, Plate Load Test 11-17
0.00
0.10
0.20
0.30
0.40
0.50
0.60
0.70
0.80
1 10 100 1000 10000 100000
Number of Cycles
Def
orm
atio
n, m
mPermanentTotalResilient
( Plate Load : 50 psi w/ Limerock Base Layer, Base Clearance : 1 ft )
Figure F.166 Iron Bridge A-2-6 (31%) Soil, Deformation under 50 psi Plate Load (Water Table at 24 in., w/ Limerock, Test 11-17)
Deformation for Iron Bridge A-2-6 Soil, Plate Load Test 11-18
0.00
0.10
0.20
0.30
0.40
0.50
0.60
0.70
0.80
0.90
1.00
1 10 100 1000 10000 100000
Number of Cycles
Def
orm
atio
n, m
m
PermanentTotalResilient
( Plate Load : 50 psi w/ Limerock Base Layer, Base Clearance : 1 ft )
Figure F.167 Iron Bridge A-2-6 (31%) Soil, Deformation under 50 psi Plate Load (Water Table at 24 in., w/ Limerock, Test 11-18)

412
Deformation for Iron Bridge A-2-6 Soil, Plate Load Test 11-19
0.00
0.20
0.40
0.60
0.80
1.00
1.20
1 10 100 1000 10000 100000
Number of Cycles
Def
orm
atio
n, m
mPermanentTotalResilient
( Plate Load : 50 psi w/ Limerock Base Layer, Base Clearance : 1 ft )
Figure F.168 Iron Bridge A-2-6 (31%) Soil, Deformation under 50 psi Plate Load (Water Table at 24 in., w/ Limerock, Test 11-19)
Deformation for Iron Bridge A-2-6 Soil, Plate Load Test 11-20
0.00
0.50
1.00
1.50
2.00
2.50
3.00
3.50
4.00
4.50
5.00
1 10 100 1000 10000 100000
Number of Cycles
Def
orm
atio
n, m
m
PermanentTotalResilient
( Plate Load : 50 psi w/ Limerock Base Layer, Base Clearance : 0 ft )
Figure F.169 Iron Bridge A-2-6 (31%) Soil, Deformation under 50 psi Plate Load (Water Table at 36 in., w/ Limerock, Test 11-20)

413
Deformation for Iron Bridge A-2-6 Soil, Plate Load Test 11-21
0.00
1.00
2.00
3.00
4.00
5.00
6.00
1 10 100 1000 10000 100000
Number of Cycles
Def
orm
atio
n, m
mPermanentTotalResilient
( Plate Load : 50 psi w/ Limerock Base Layer, Base Clearance : 0 ft )
Figure F.170 Iron Bridge A-2-6 (31%) Soil, Deformation under 50 psi Plate Load (Water Table at 36 in., w/ Limerock, Test 11-21)
Deformation for Iron Bridge A-2-6 Soil, Plate Load Test 11-22
0.00
0.50
1.00
1.50
2.00
2.50
1 10 100 1000 10000 100000
Number of Cycles
Def
orm
atio
n, m
m
PermanentTotalResilient
( Plate Load : 50 psi w/ Limerock Base Layer, Base Clearance : 0 ft )
Figure F.171 Iron Bridge A-2-6 (31%) Soil, Deformation under 50 psi Plate Load (Water Table at 36 in., w/ Limerock, Test 11-22)

414
Deformation for Iron Bridge A-2-6 Soil, Plate Load Test 11-23
0.00
0.20
0.40
0.60
0.80
1.00
1.20
1.40
1 10 100 1000 10000 100000
Number of Cycles
Def
orm
atio
n, m
mPermanentTotalResilient
( Plate Load : 50 psi w/ Limerock Base Layer, Base Clearance : 1 ft (drawdown))
Figure F.172 Iron Bridge A-2-6 (31%) Soil, Deformation under 50 psi Plate Load (Water Table at 24 in. (Drawdown), w/ Limerock, Test 11-23)
Deformation for Iron Bridge A-2-6 Soil, Plate Load Test 11-24
0.00
0.20
0.40
0.60
0.80
1.00
1.20
1.40
1.60
1.80
1 10 100 1000 10000 100000
Number of Cycles
Def
orm
atio
n, m
m
PermanentTotalResilient
( Plate Load : 50 psi w/ Limerock Base Layer, Base Clearance : 1 ft (drawdown))
Figure F.173 Iron Bridge A-2-6 (31%) Soil, Deformation under 50 psi Plate Load (Water Table at 24 in. (Drawdown), w/ Limerock, Test 11-24)

415
Deformation for Iron Bridge A-2-6 Soil, Plate Load Test 11-25
0.00
0.20
0.40
0.60
0.80
1.00
1.20
1.40
1.60
1 10 100 1000 10000 100000
Number of Cycles
Def
orm
atio
n, m
mPermanentTotalResilient
( Plate Load : 50 psi w/ Limerock Base Layer, Base Clearance : 1 ft (drawdown))
Figure F.174 Iron Bridge A-2-6 (31%) Soil, Deformation under 50 psi Plate Load (Water Table at 24 in. (Drawdown), w/ Limerock, Test 11-25)
Deformation for Iron Bridge A-2-6 Soil, Plate Load Test 11-26
0.00
0.10
0.20
0.30
0.40
0.50
0.60
1 10 100 1000 10000 100000
Number of Cycles
Def
orm
atio
n, m
m
PermanentTotalResilient
( Plate Load : 50 psi w/ Limerock Base Layer, Base Clearance : 2 ft (drawdown))
Figure F.175 Iron Bridge A-2-6 (31%) Soil, Deformation under 50 psi Plate Load (Water Table at 12 in. (Drawdown), w/ Limerock, Test 11-26)

416
Deformation for Iron Bridge A-2-6 Soil, Plate Load Test 11-27
0.00
0.10
0.20
0.30
0.40
0.50
0.60
0.70
0.80
0.90
1 10 100 1000 10000 100000
Number of Cycles
Def
orm
atio
n, m
mPermanentTotalResilient
( Plate Load : 50 psi w/ Limerock Base Layer, Base Clearance : 1 ft (drawdown))
Figure F.176 Iron Bridge A-2-6 (31%) Soil, Deformation under 50 psi Plate Load (Water Table at 12 in. (Drawdown), w/ Limerock, Test 11-27)
Deformation for Iron Bridge A-2-6 Soil, Plate Load Test 11-28
0.00
0.10
0.20
0.30
0.40
0.50
0.60
0.70
1 10 100 1000 10000 100000
Number of Cycles
Def
orm
atio
n, m
m
PermanentTotalResilient
( Plate Load : 50 psi w/ Limerock Base Layer, Base Clearance : 1 ft (drawdown))
Figure F.177 Iron Bridge A-2-6 (31%) Soil, Deformation under 50 psi Plate Load (Water Table at 12 in. (Drawdown), w/ Limerock, Test 11-28)

417
Iron Bridge A-2-6 Resilient Deformation v.s. Load Cycles (20 psi )
0.00000
0.00200
0.00400
0.00600
0.00800
0.01000
0.01200
0.01400
0.01600
1 10 100 1000 10000 100000
Load Cycles
Res
ilien
t Def
orm
atio
n (in
ch)
Test 11-1 : Base Clearance 3 ft _1 Test 11-2 : Base Clearance 3 ft _2 Test 11-3 : Base Clearance 3 ft _3Test 11-4 : Base Clearance 3 ft _4 Test 11-5 : Base Clearance 2 ft _1 Test 11-6 : Base Clearance 2 ft _2Test 11-7 : Base Clearance 2 ft _3 Test 11-8 : Base Clearance 1 ft _1 Test 11-9 : Base Clearance 1 ft _2Test 11-10 : Base Clearance 1 ft _3
Figure F.178 Iron Bridge A-2-6 Soil, Deformation Summary under 20 psi Plate Load at Different Water Table Level
Iron Bridge A-2-6 Resilient Deformation v.s. Load Cycles (50 psi )
0.00000
0.00500
0.01000
0.01500
0.02000
0.02500
0.03000
0.03500
1 10 100 1000 10000 100000Load Cycles
Res
ilien
t Def
orm
atio
n (in
ch)
Test 11-11 : Base Clearance 3 ft _1 Test 11-12 : Base Clearance 3 ft _2 Test 11-13 : Base Clearance 3 ft _3Test 11-14 : Base Clearance 2 ft _1 Test 11-15 : Base Clearance 2 ft _2 Test 11-16 : Base Clearance 2 ft _3Test 11-17 : Base Clearance 1 ft _1 Test 11-18 : Base Clearance 1 ft _2 Test 11-19 : Base Clearance 1 ft _3Test 11-20 : Base Clearance 0 ft _1 Test 11-21 : Base Clearance 0 ft _2 Test 11-22 : Base Clearance 0 ft _3Test 11-23 : Base Clearance 1 ft _1 (Drawndown) Test 11-24 : Base Clearance 1 ft _2 (Drawdown) Test 11-25 : Base Clearance 1 ft _3 (Drawdown)Test 12-26 : Base Clearance 2 ft _1 (Drawdown) Test 11-27 : Base Clearance 2 ft _2 (Drawdown) Test 11-28 : Base Clearance 2 ft _3 (Drawdown)
Figure F.179 Iron Bridge A-2-6 Soil, Deformation Summary under 50 psi Plate Load at Different Water Table Level

418
APPENDIX G
LAYERED SYSTEM THEORY
G.1 LAYERED SYSTEM
Flexible pavements are layered systems with better
materials on top and cannot be represented by a homogeneous
mass, so the use of Burmister’s layered theory is more
appropriate. Burmister (1943) (7) first developed solutions
for a two-layer system and then extended them to a three-
layer system. The theory of stresses and displacements in a
two-layer system was developed in accordance with the
methods of the mathematical theory of elasticity and is
presented in order to reveal some of the fundamental
relations existing between the physical factors, which
control the load-settlement relations, and in order to
provide a practical method of analysis for the design of
pavement. The theory reveals the controlling influence of
two important ratios on the load-settlement characteristics
of the “two-layer system”, namely: (1) the ratio 1/ hr of the
radius bearing area to the thickness of the reinforcing or
pavement layer; and (2) the ratio 12 / EE of the modulus of
the subgrade to that of the pavement. For practical design
purposes, the theoretical results have been evaluated

419
numerically and expressed in Basic Influence Curves, giving
values of the settlement coefficient wF in terms of these
basic ratios. The settlement coefficient is applied as a
simple multiplying or correction factor to the familiar
Boussinesq Equation for surface settlement at the center of
a circular flexible bearing area. The layer system theory
was adopted to calculate subgrade layer in test-pit.
G.1.1 Two-layer System Theory Assumptions and Conditions
Boussinesq solved the problem of stresses and
displacements in a uniform deposit for concentrated load
applied at the surface. The scientific approach for the
present problem of the stresses and displacements is a more
general case of a “two-layer system” by the methods of the
mathematical theory of elasticity, which is believed to be
correct. The general solution of the “two-layer” problem
required that the necessary assumptions of the theory of
elasticity be made, and that certain essential boundary and
continuity conditions be satisfied, but did not require any
radical simplifying assumptions beforehand as to the nature
of the distribution of stresses on the subgrade or of their
relation to displacements(Burmister, 1943)(Huang, 1993).

420
The “two-layer system”, illustrated in Figure N.1,
consists of a surface or pavement layer 1 of a certain
thickness 1h , which rests continuously upon and reinforces a
weaker subgrade layer 2. A surface load is applied,
uniformly distributed over a flexible bearing area of radius
r . The application of the theory of elasticity to the
solution of the problem required the following assumptions
and conditions:
The necessary assumptions of the theory of elasticity
were made that the soils of each of the two layers are
homogeneous, isotropic, elastic materials, for which Hooke’s
law is valid. While these assumptions are only imperfectly
satisfied in natural soil deposits, the evaluation of full-
scale load tests should yield average strength properties of
the soils, which are fairly representative within the range
of permissible settlements.
The surface reinforcing layer 1 is assumed to be
weightless and to be infinite in extent in the horizontal
direction, but of finite thickness 1h . The subgrade layer 2
is assumed to be infinite in extent both horizontally and
vertically downward.
The solution of the problem must satisfy certain
necessary boundary conditions, namely, that the surface of
layer 1 must be free of normal and shearing stresses outside

421
the limits of the loaded area, and that at infinite depth
the stresses and displacements in the subgrade layer 2 must
be equal to zero.
Most important of all, the solution for the “two-layer”
problem must satisfy certain essential continuity conditions
of stress for layer 1 and layer 2. It is assumed that the
two layers are continuously in contact and act together as
an elastic medium of composite nature. Furthermore, it is
assumed that the subgrade provides initially a continuous
uniform support for the pavement layer, which is really the
primary condition to be achieved in good construction
practice. Continuity requires that the normal and shearing
stresses and the vertical and horizontal displacements must
be equal in the two layers at the interface. Only in the
horizontal radial stress rσ will there be a discontinuity
across the interface. This follows from the fact that, since
the horizontal displacements 1u and 2u must be equal, the
radial stress 1rσ and 2rσ either side of the interface will
be different and must be determined by the modulii 1E and
2E , respectively.
In order to obtain a practical solution of the problem
and to reduce the complications, it was necessary to assume
that Poisson’s ratio was 0.35 in both layers. The value of

422
0.35 was used, because it was considered to be somewhat more
representative of the actual conditions in Florida pavement
conditions(Burmister, 1943)(Huang, 1993).
G.1.2 Mathematical Theory of Elasticity
The following are equations of elasticity for the
three-dimensional problem of axial symmetry.
(a) Equations of Equilibrium.
0=−+∂
∂+∂
∂rzr
rrzr θσστσ (G-1a)
0=+∂
∂+∂
∂rzrrzzrz τστ
(G-1b)
(b) Equations of Compatibility.
04 =∇ (G-2a)
⎥⎦
⎤⎢⎣
⎡∂∂+
∂∂+
∂∂=∇ 2
2
2
22 1
zrr r
(G-2b)
(c) Equations of Elasticity.
Stress
⎥⎦
⎤⎢⎣
⎡∂∂−∇−
∂∂= 2
22)2(
zzzφφμσ (G-3a)
⎥⎦
⎤⎢⎣
⎡∂∂−∇
∂∂= 2
22
rzrφφμσ (G-3b)
⎥⎦⎤
⎢⎣⎡
∂∂−∇
∂∂=
rrzφφμσθ
12 (G-3c)
⎥⎦
⎤⎢⎣
⎡∂∂−∇−
∂∂= 2
22)1(
zrrzφφμτ (G-3d)
Displacement

423
⎥⎦
⎤⎢⎣
⎡∂∂+
∂∂+∇−+=
rrrEW φφφμμ 1)21(1
2
22 (G-4a)
⎥⎦
⎤⎢⎣
⎡∂∂+−= 2
21rE
u φμ (G-4b)
After equation solving, there are two simple equations
for calculating vertical surface deflections.
(a) Flexible bearing area
22
2 )1(2 prFE
W μ−= (G-5)
(b) Rigid bearing area
22
2 )1( prFE
W μπ −= (G-6)
W -- Resilient deflection of surface
μ -- Poisson ratio
p -- Uniform pressure on the top layer
r -- Radius of uniform circular pressure on the top
2F -- Deflection factor decided by 21 / EE
1E -- Resilient modulus for first layer
2E -- Resilient modulus for second layer
In test-pit, we use Poisson ratio μ as 0.35, and the
rigid circular plate was adopted, so the Equation (G-6)
would be applied and simplified into following equation.
22
38.1 prFE
W = (G-7)
According to Equation (G-7), 2F can be solved for the
test-pit data. From the chart of 2F , the resilient modulus

424
for the upper layer can be obtained. This is a method to
calculate the upper layer resilient modulus if knowing the
lower layer modulus or lower layers equivalent modulus. By
hand calculate will cost inaccuracy for the chart reading of
2F . So ELSYM5 and KENLAYER programs were adopted to finish
this calculation(Burmister, 1943)(Huang, 1993).
G.1.3 Three-layer System
When there is a limerock layer on the top, the profile
of test-pit can be divided into three different layers. From
the top to bottom, they are limerock layer (layer 1),
subgrade layer (layer 2) and embankment layer (layer 3).
Because the three-layer system is very complex and cannot be
calculated by hand, ELSYM5 and KENLAYER programs were
adopted to calculate the subgrade layer modulus. The
embankment layer modulus was assumed as 11207 psi (77 Mpa)
in soaked condition.
G.2 KENLAYER PROGRAM THEORETICAL DEVELOPMENT
G.2.1 Elastic Multilayer System
Figure 6.2 shows an n-layer system in cylindrical
coordinates, the nth layer being of infinite thickness. The

425
modulus of elasticity and the Poisson ratio of the ith layer
are 1E and 1μ , respectively (Huang, 1993).
For axisymmetric problems in elasticity, a convenient
method is to assume a stress function that satisfies the
governing differential equation and the boundary and
continuity conditions. After the stress function is found,
the stresses and displacements can be determined (Timoshenko
and Goodier, 1951).
The governing differential equation to be satisfied is
a fourth-order differential equation. The stress function
for each layer has four constants of integration in Eq.(G-
2), iii CBA ,, and iD , where the subscript i is the layer number.
Because the stress function must vanish at an infinite
depth, the constants nA and nC should be equal to zero,
i.e., the bottom most layer has only two constants. For a n-
layer system, the total number of constants or unknowns is
4n-2, which must be evaluated by two boundary conditions and
4(n-1) continuity conditions. The two boundary conditions
are that the vertical stress under the circular loaded area
is equal to q and that the surface is free of shear stress.
The four conditions at each of the n-1 interfaces are the
continuity of vertical stress, vertical displacement, shear
stress, and radial displacement. If the interface is

426
frictionless, the continuity of shear stress and radial
displacement replaced by the vanish of shear stress both
above and below the interface. The equations to be used in
KENLAYER for computing the stresses and displacements in a
multilayer system under a circular loaded area are presented
later Huang, 1993).
G.2.2 Nonlinear Layers
It is well known that granular materials and subgrade
soils are nonlinear with an elastic modulus varying with the
level of stresses. The elastic modulus to be used with the
layered systems is the resilient modulus obtained from
repeated unconfined or triaxial compression tests. The
resilient modulus of granular materials increases with the
increase in stress intensity, while that of fine-grained
soils decreases with the increase in stress intensity. If
the relationship between the resilient modulus and the state
of stresses is given, a method of successive approximations
can be used. The nonlinear material properties, which have
been incorporated in KENLAYER, are described below (Huang,
1993).

427
G.2.3 Granular Materials
The resilient modulus of granular materials increases
with the increase in the first stress invariant. However,
KENLAYER employs a more popular relationship which is
described below.
A simple relationship between resilient modulus and the
first stress invariant can be expressed as
21
KKE θ= (G-8)
in which 1K and 2K are experimentally derived constants
and θ is the stress invariant, which can be either the sum
of three normal stresses, ,, yx σσ and zσ , or the sum of three
principal stresses, 21,σσ , and 3σ :
zyx σσσσσσθ ++=++= 321 (G-9)
Including the weight of a layered system gives
)21( 0Kzzyx ++++= γσσσθ (G-10)
in which γ is the average unit weight, z is the distance
below surface at which the modulus is to be determined, and
0K is the coefficient of earth pressure at rest. The reason
21,σσ , and 3σ are not used in Equation (G-10) is that they
may not be in the same direction as the geostatic stresses.
In contrast to other computer programs, KENLAYER uses the
soil mechanics sign convention for stresses and strains.
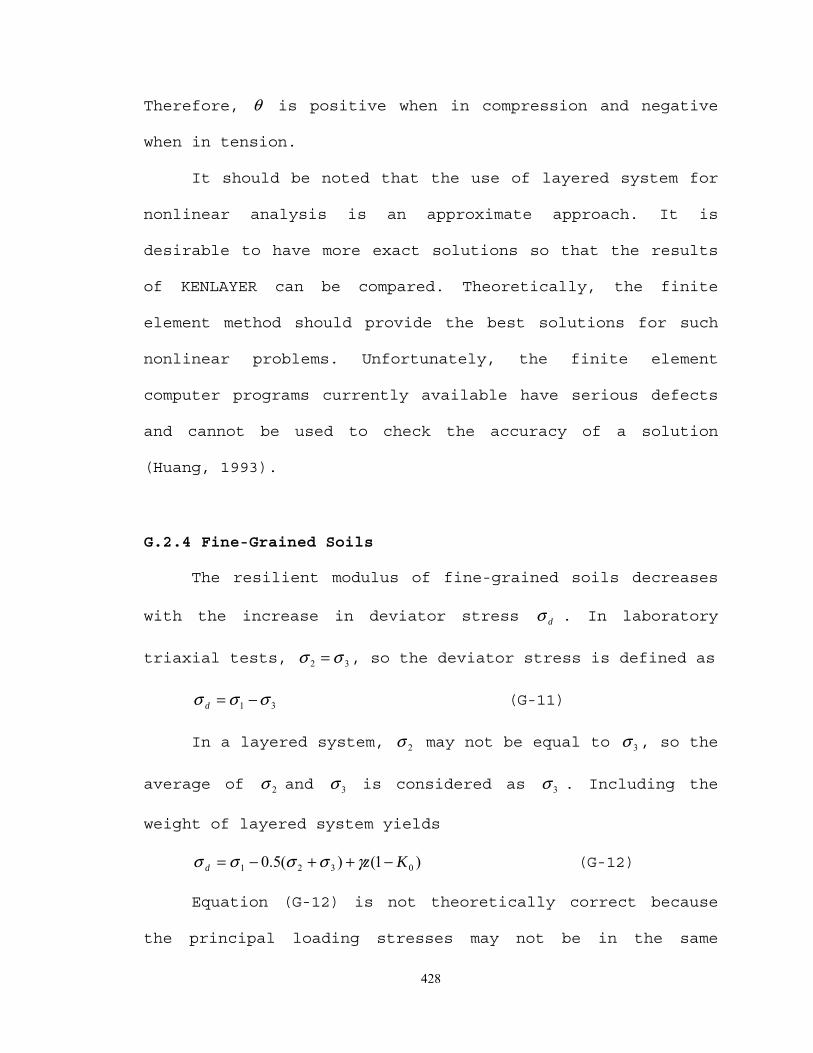
428
Therefore, θ is positive when in compression and negative
when in tension.
It should be noted that the use of layered system for
nonlinear analysis is an approximate approach. It is
desirable to have more exact solutions so that the results
of KENLAYER can be compared. Theoretically, the finite
element method should provide the best solutions for such
nonlinear problems. Unfortunately, the finite element
computer programs currently available have serious defects
and cannot be used to check the accuracy of a solution
(Huang, 1993).
G.2.4 Fine-Grained Soils
The resilient modulus of fine-grained soils decreases
with the increase in deviator stress dσ . In laboratory
triaxial tests, 32 σσ = , so the deviator stress is defined as
31 σσσ −=d (G-11)
In a layered system, 2σ may not be equal to 3σ , so the
average of 2σ and 3σ is considered as 3σ . Including the
weight of layered system yields
)1()(5.0 0321 Kzd −++−= γσσσσ (G-12)
Equation (G-12) is not theoretically correct because
the principal loading stresses may not be in the same
429
direction as the geostatic stresses. Since the loading
stresses in the subgrade are usually small and do not have
significant effect on the computed modulus, KENLAYER uses
the three normal stresses, ,, 21 σσ and 3σ in Equation (G-12).
If the point selected for computing the modulus is on the
axis of symmetry for a single tire or on the plane of
symmetry between two dual tires, the three normal stresses
and the three principal stresses are identical(Huang, 1993).
G.3 KENLAYER PROGRAM SUBROUTINES
KENLAYER consists of one main program and 18
subroutines. All variables are transferred from the main
program to the subroutines through arguments and no common
statements are used. Therefore, the program can be easily
modified if needed (Huang, 1993).
The main program is relatively short because its main
purpose is to call the various subroutines and conduct a
damage analysis, if desired. The subroutines can be divided
into six groups: data input, layered system, superposition
and principal stresses, nonlinear analysis, viscoelastic
analysis, and output.
For linear elastic systems, the flowchart of KENLAYER
program is simple as following:

430
ELAINP
LAYERS
SINOUT
STOP
ELAINP reads and writes input data for an elastic layered
system under single or multiple wheels. For multiple
wheels, the distance and direction cosines from each
specified point to each of the wheels are also
computed for later use. If a layer is nonlinear, the
elastic modulus is the assumed elastic modulus to be
used for the first iteration. If a layer is
viscoelastic, the elastic modulus may be assigned 0
or any value.
LAYERS computes the vertical displacement, four components of
stress, and four components of strains at different
radial and vertical distances under a single wheel.
SINOUT prints the vertical displacement, vertical stress,
radial stress, tangential stress, shear stress,
vertical strain, radial strain, tangential strain,
and shear strain under a single-wheel load and
determines the most critical strains for damage
analysis. The stresses and strains are positives when
in compression and negative in tension.

431
Figure G.1 Two-layer System
a a
qz1
z2
zn-2
H
r
z ∞
1μE1,
E2,
En-1,
En,
2μ
1−nμnμ
Figure G.2 An n-layer System in Cylindrical Coordinates
Stress distribution on the Subgrade
Equivalent Radius of Spread on the Subgrade
Surface
2r
Unit Pressure-P
Layer 1, 1E
Layer 2, 2E
1h