Embed Size (px)
Citation preview
Design Paper
Design and Statistical Issuesof the Hemodialysis (HEMO) Study
The HEMO Study Group,* Prepared by:Tom Greene, PhD, Gerald J. Beck, PhD,Jennifer J. Gassman, PhD, Frank A. Gotch, MD,John W. Kusek, PhD, Andrew S. Levey, MD,Nathan W. Levin, MD, Gerald Schulman, MD, andGarabed Eknoyan, MDCleveland Clinic Foundation, Cleveland, Ohio (T.G., G.J.B., J.J.G.),University of California at San Francisco, San Francisco, California (F.A.G.),National Institute of Diabetes and Digestive and Kidney Disease, Bethesda, Maryland(J.W.K.), New England Medical Center, Boston, Massachusetts (A.S.L.), Beth IsraelMedical Center, New York, New York (N.W.L), Vanderbilt University, Nashville, Tennessee(G.S.), Baylor College of Medicine, Houston, Texas (G.E.)
ABSTRACT: The Hemodialysis Study is a multicenter clinical trial of hemodialysis prescriptionsfor patients with end stage renal disease. Participants from over 65 dialysis facilitiesassociated with 15 clinical centers in the United States are randomized in a 2 3 2 factorialdesign to dialysis prescriptions targeted to a standard dose (equilibrated Kt/V 5 1.05)or a high dose (equilibrated Kt/V 5 1.45), and to either low or high flux membranes.The primary outcome variable is mortality; major secondary outcomes are defined basedon hospitalizations due to cardiovascular or infectious complications, and on the declineof serum albumin. The Outcome Committee, consisting of study investigators, uses ablinded review system to classify causes of death and hospitalizations related to themajor secondary outcomes. The dialysis dose intervention is directed by the Data Coordi-nating Center using urea kinetic modeling programs that analyze results from dialysistreatments to monitor adherence to the study targets, adjust suggested dialysis prescrip-tions, and assist in trouble-shooting problems with the delivery of dialysis. The studydesign has adequate power to detect reductions in mortality rate equal to 25% of
Address reprint requests to: Tom Greene, HEMO Study Data Coordinating Center, Department ofBiostatistics and Epidemiology, Wb4, Cleveland Clinic Foundation, 9500 Euclid Avenue, Cleveland, OH44195; (E-mail: [email protected]).
Received November 22, 1999; accepted February 10, 2000.* See Appendix for list of investigators.
Controlled Clinical Trials 21:502–525 (2000) Elsevier Science Inc. 2000 0197-2456/00/$–see front matter655 Avenue of the Americas, New York, NY 10010 PII S0197-2456(00)00062-3
HEMO Study Design 503
the projected baseline mortality rate for both of the interventions. Control Clin Trials2000;21:502–525 Elsevier Science Inc. 2000
KEY WORDS: Dialysis, renal failure, end stage renal disease, urea kinetic modeling, clinical trial
INTRODUCTION
End stage renal disease (ESRD) is a chronic condition in which kidneyfunction is impaired to the extent that the patient’s survival requires removalof toxins from the blood by dialysis therapy or kidney transplantation. ESRD isa rapidly growing health-care problem in the United States, with approximately304,000 prevalent and 79,000 incident patients in 1997 [1]. The prevalence andincidence rates are both increasing by approximately 5% per year. The estimateddirect monetary cost of treating ESRD exceeded $15.6 billion in 1997, and isincreasing [2].
Due in part to a limited availability of kidneys for transplantation, hemodial-ysis (HD) is the primary method of treatment and is currently used for approxi-mately 61% of U.S. ESRD patients. HD removes toxins from the body by extra-corporeal circulation of the blood through a semipermeable membrane, referredto as a dialyzer. The toxins are removed primarily by diffusion across themembrane to a dialysate solution which is circulated on the opposite side of themembrane. A surgically constructed vascular access connects the extracorporealcircuit to the patient’s vascular system. Treatments are almost always performedthree times per week in specially equipped dialysis facilities for 3–4 hoursper treatment.
In spite of numerous therapeutic advances since dialysis therapy becamewidespread in the 1960s, mortality and hospitalization rates of dialysis patientsremain high. In the U.S., median survival of dialysis patients is less than 4 years,and life expectancy is one-third to one-fifth of that of the general population atany given age [3]. Dialysis patients average approximately 1.4 hospital admis-sions per year for an average of 11 hospital days per patient. Reported mortalityrates of dialysis patients are higher in the United States than in most otherdeveloped countries [4]. It is not clear to what extent this is due to a greatertendency in the United States to provide dialysis to patients with higher comor-bidity, or to differences in the general medical care of dialysis patients betweenthe United States and other countries. In any case, the past two decades haveseen consistent increases in the mean age and the prevalence of comorbidconditions in the U.S. dialysis population [5].
In response to the increasing prevalence of ESRD and the poor outcome of dialy-sis patients, the National Institute of Digestive and Kidney Disease (NIDDK)of the National Institutes of Health (NIH) funded the Hemodialysis (HEMO)Study to determine if the mortality and morbidity of HD patients can be reducedby modifying the dose of dialysis and the type of membrane used for the removalof toxins from the blood. This paper summarizes the design and conduct of theHEMO Study. Particular attention is given to the approaches taken to confrontmethodological obstacles to achieving the objectives of the study.
504 HEMO Study Group
BACKGROUND AND RATIONALE OF THE INTERVENTIONS
The HEMO Study is designed to test two interventions: the dialysis dose(or Kt/V) intervention and the membrane flux intervention. The rationale forinvestigating these two interventions are described below. See [6] for addi-tional details.
Dialysis Dose Intervention
The NIH-funded National Cooperative Dialysis Study (NCDS), completedin 1981, was the only major clinical trial prior to the HEMO Study to examineprospectively the effect of dialysis dose on patient outcome. The NCDS usedthe concentration of urea in the blood (BUN) as a measure of the dose ofdialysis, with lower average BUNs indicating a higher dialysis dose. Urea is alow molecular weight solute, resulting from the catabolism of protein, whoseconcentration is widely used as a surrogate for the level of toxins in the blood.The NCDS showed that patients randomized to a low time-averaged BUNtarget had fewer comorbid events than patients randomized to a higher time-averaged BUN target [7–9].
After the NCDS, researchers observed that the interpretation of the averageBUN is confounded by variations in diet, as a low average BUN may indicateeither a high dialysis dose or a low protein intake in poorly nourished patients[10]. Due to this limitation, the dimensionless quantity spKt/V, which assessesdialysis dose independently of protein intake, is now widely used instead ofthe average BUN. In the expression spKt/V, K represents the dialyzer clearance,which is the rate of urea removal expressed as the volume of body watercleared of urea per unit time, t represents the total time of the dialysis treatment,and V represents the total volume of body water in which the urea is distributed.The prefix sp refers to the formulation of Kt/V using a one-compartment kineticmodel assuming a uniform distribution of urea throughout a “single pool” ofbody water. Under the one compartment model, spKt/V can be calculatedfrom readily available measurements, and is primarily determined from thereduction in the BUN from the beginning to the end of dialysis [11]. Post-hoccorrelational analyses of the NCDS found an increased rate of adverse eventswhen spKt/V was below 0.8, which led to a general recommendation thatspKt/V should be at least 1.0 [10].
During the 1980s and 1990s, technological improvements provided the possi-bility of high-efficiency dialysis with increased dialyzer clearance K, allowingfor levels of spKt/V which substantially exceed 1.0 within 3-5 hours of treatmentin most patients. Several observational studies have reported lower mortalityrates at levels of spKt/V greater than 1.2 or 1.4 than at 1.0 [12–15]. As a result,clinical practice guidelines now call for dialysis prescriptions to maintain spKt/V at or above 1.2 [16]. However, the observational studies suggesting benefitsof spKt/V of 1.2 or higher are subject to confounding by extraneous factors,and a benefit of such high levels of spKt/V has not been established in arandomized clinical trial.
Recently it has been recognized that the BUN increases sharply in the 30-60 minutes after dialysis (postdialysis rebound), reflecting a disequilibriumthat develops during dialysis because the concentration of urea in the peripheral

HEMO Study Design 505
Figure 1 Change in BUN during and after dialysis. Shown are BUN concentrationcurves during and after a dialysis session based on single-pool (dashed line)and double-pool (solid line) kinetic models. The greater fall in BUN duringdialysis and the rebound after dialysis results from urea disequilibrium withinthe patient. Cpre 5 BUN before dialysis, Cpost 5 BUN immediately after dialysis,Ceq 5 BUN 30 minutes after the end of dialysis, adjusted Ceq 5 Ceq aftersubtracting the effect of urea generation for 30 minutes.
blood declines more rapidly than in relatively poorly perfused regions suchas skeletal muscle that serve as a reservoir for urea [17–18]. As a result, spKt/V overestimates the “true” dialysis dose when it is based on the change inBUN from the beginning to the immediate end of dialysis (see Figure 1). Toavoid a bias due to variations in postdialysis rebound, dialysis dose in theHEMO Study is expressed in terms of equilibrated Kt/V (eKt/V), an alternativeformulation of Kt/V based on kinetic models which adjust for the disequilib-rium of urea during dialysis [19–20].
The dialysis dose intervention of the HEMO Study randomizes patients totarget eKt/V levels of 1.05 (standard Kt/V goal) or 1.45 (high Kt/V goal).Under high-efficiency dialysis, the average eKt/V is approximately 0.2 Kt/Vunits lower than spKt/V, so that these target levels correspond to spKt/Vvalues of approximately 1.25 and 1.65. The spKt/V of 1.25 is consistent withthe current recommended standard in the United States of spKt/V . 1.2, andis similar to the average levels of spKt/V achieved in the United States [19].The high Kt/V goal represents the highest dose achievable in a high percentageof patients within 4.5 hours per treatment using currently available technology.
506 HEMO Study Group
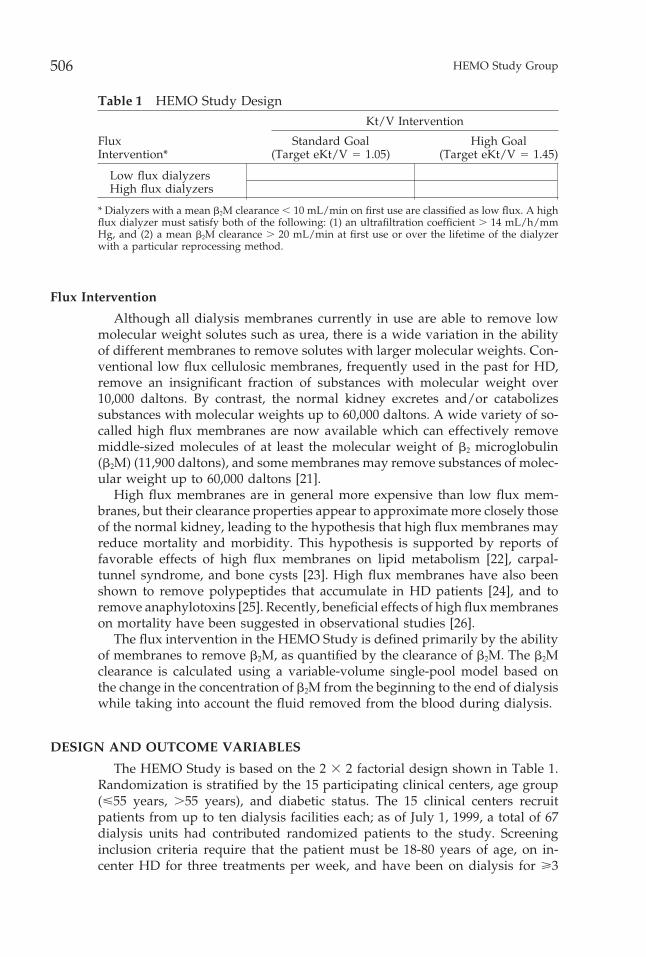
Table 1 HEMO Study DesignKt/V Intervention
Flux Standard Goal High GoalIntervention* (Target eKt/V 5 1.05) (Target eKt/V 5 1.45)
Low flux dialyzersHigh flux dialyzers
* Dialyzers with a mean b2M clearance , 10 mL/min on first use are classified as low flux. A highflux dialyzer must satisfy both of the following: (1) an ultrafiltration coefficient . 14 mL/h/mmHg, and (2) a mean b2M clearance . 20 mL/min at first use or over the lifetime of the dialyzerwith a particular reprocessing method.
Flux Intervention
Although all dialysis membranes currently in use are able to remove lowmolecular weight solutes such as urea, there is a wide variation in the abilityof different membranes to remove solutes with larger molecular weights. Con-ventional low flux cellulosic membranes, frequently used in the past for HD,remove an insignificant fraction of substances with molecular weight over10,000 daltons. By contrast, the normal kidney excretes and/or catabolizessubstances with molecular weights up to 60,000 daltons. A wide variety of so-called high flux membranes are now available which can effectively removemiddle-sized molecules of at least the molecular weight of b2 microglobulin(b2M) (11,900 daltons), and some membranes may remove substances of molec-ular weight up to 60,000 daltons [21].
High flux membranes are in general more expensive than low flux mem-branes, but their clearance properties appear to approximate more closely thoseof the normal kidney, leading to the hypothesis that high flux membranes mayreduce mortality and morbidity. This hypothesis is supported by reports offavorable effects of high flux membranes on lipid metabolism [22], carpal-tunnel syndrome, and bone cysts [23]. High flux membranes have also beenshown to remove polypeptides that accumulate in HD patients [24], and toremove anaphylotoxins [25]. Recently, beneficial effects of high flux membraneson mortality have been suggested in observational studies [26].
The flux intervention in the HEMO Study is defined primarily by the abilityof membranes to remove b2M, as quantified by the clearance of b2M. The b2Mclearance is calculated using a variable-volume single-pool model based onthe change in the concentration of b2M from the beginning to the end of dialysiswhile taking into account the fluid removed from the blood during dialysis.
DESIGN AND OUTCOME VARIABLES
The HEMO Study is based on the 2 3 2 factorial design shown in Table 1.Randomization is stratified by the 15 participating clinical centers, age group(<55 years, .55 years), and diabetic status. The 15 clinical centers recruitpatients from up to ten dialysis facilities each; as of July 1, 1999, a total of 67dialysis units had contributed randomized patients to the study. Screeninginclusion criteria require that the patient must be 18-80 years of age, on in-center HD for three treatments per week, and have been on dialysis for >3
HEMO Study Design 507
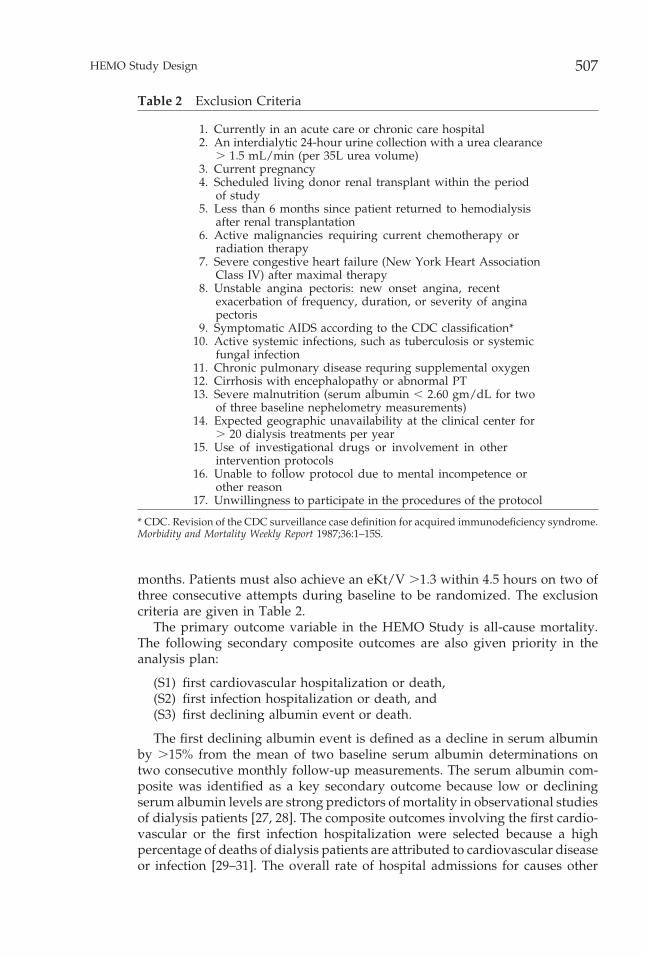
Table 2 Exclusion Criteria
1. Currently in an acute care or chronic care hospital2. An interdialytic 24-hour urine collection with a urea clearance
. 1.5 mL/min (per 35L urea volume)3. Current pregnancy4. Scheduled living donor renal transplant within the period
of study5. Less than 6 months since patient returned to hemodialysis
after renal transplantation6. Active malignancies requiring current chemotherapy or
radiation therapy7. Severe congestive heart failure (New York Heart Association
Class IV) after maximal therapy8. Unstable angina pectoris: new onset angina, recent
exacerbation of frequency, duration, or severity of anginapectoris
9. Symptomatic AIDS according to the CDC classification*10. Active systemic infections, such as tuberculosis or systemic
fungal infection11. Chronic pulmonary disease requring supplemental oxygen12. Cirrhosis with encephalopathy or abnormal PT13. Severe malnutrition (serum albumin , 2.60 gm/dL for two
of three baseline nephelometry measurements)14. Expected geographic unavailability at the clinical center for
. 20 dialysis treatments per year15. Use of investigational drugs or involvement in other
intervention protocols16. Unable to follow protocol due to mental incompetence or
other reason17. Unwillingness to participate in the procedures of the protocol
* CDC. Revision of the CDC surveillance case definition for acquired immunodeficiency syndrome.Morbidity and Mortality Weekly Report 1987;36:1–15S.
months. Patients must also achieve an eKt/V .1.3 within 4.5 hours on two ofthree consecutive attempts during baseline to be randomized. The exclusioncriteria are given in Table 2.
The primary outcome variable in the HEMO Study is all-cause mortality.The following secondary composite outcomes are also given priority in theanalysis plan:
(S1) first cardiovascular hospitalization or death,(S2) first infection hospitalization or death, and(S3) first declining albumin event or death.
The first declining albumin event is defined as a decline in serum albuminby .15% from the mean of two baseline serum albumin determinations ontwo consecutive monthly follow-up measurements. The serum albumin com-posite was identified as a key secondary outcome because low or decliningserum albumin levels are strong predictors of mortality in observational studiesof dialysis patients [27, 28]. The composite outcomes involving the first cardio-vascular or the first infection hospitalization were selected because a highpercentage of deaths of dialysis patients are attributed to cardiovascular diseaseor infection [29–31]. The overall rate of hospital admissions for causes other
508 HEMO Study Group
than repair or modification of the dialysis vascular access is also designatedas a key secondary outcome.
Other secondary objectives of the HEMO Study include the evaluation ofthe effects of the dialysis dose and flux interventions on rates of death orhospitalization due to specific cardiovascular and cerebrovascular causes andto specific classes of infection. The HEMO Study will also test the effects ofthe interventions on changes from baseline to follow-up in indices of nutritionalstatus, comorbidity, access-related problems, quality of life, and functionalstatus. The effects of the interventions on nutritional status are of particularinterest because nutritional markers have been found to be especially strongpredictors of patient outcome in observational studies of dialysis patients [27,28]. Nutritional variables of interest include biochemical measures such asserum albumin, serum creatinine, and serum bicarbonate and anthropometricmeasurements [32]. Observational studies have also reported associations be-tween Kt/V and a measure of protein catabolism derived from kinetic model-ing, the normalized protein catabolic rate (nPCR) [33]. In the metabolicallystable patient, nPCR is considered to reflect protein intake. As with Kt/V, nPCRis computed using urea kinetic modeling from the predialysis and postdialysisBUNs. The interpretation of correlations between Kt/V and nPCR from obser-vational studies is controversial due to the possibility of an artificially inducedcorrelation resulting from the computation of both Kt/V and nPCR from thesame BUN measurements [34, 35]. Nonetheless, these findings have contributedto a wide acceptance of the hypothesis that higher Kt/V leads to improvednutritional status, which in turn leads to improved outcome. The HEMO Studywill test the effects of Kt/V on measures of nutritional status, including nPCR,by comparing randomized treatment groups to avoid the potential biases ofprior observational studies.
DESIGN COMPLICATIONS
Recruitment Method
Due to limitations in the available financial resources, it was recognized thateach clinical center would be able to carry out the requirements of the HEMOStudy protocol for no more than 60 randomized patients at any one time, giving900 randomized patients among all 15 centers. Due to the rapidly changingtechnology of dialysis, it was also felt that to assure the relevance of the study’sfindings the completion date should be targeted no later than the fall of 2001,6.5 years after the start of randomization. Under the scenarios consideredin the power calculations (later in this paper), these constraints allowed forapproximately 3000 patient-years of follow-up, which would provide adequatepower to detect treatment effects no smaller than 33% of the projected mortalityrates in the standard Kt/V and low flux arms. However, results from observa-tional studies suggested effect sizes smaller than 30%.
To increase the patient-years of follow-up while limiting the number ofrandomized patients to 60 per center at any one time, a recruit-with-replacementplan was devised in which 900 patients are to be randomized in the first 1.5/2 years of the study. Subsequently, in all but the final year of follow-up, allpatients who die, terminate HD due to renal transplantation, switch to another

HEMO Study Design 509
type of dialysis, or transfer to a nonparticipating dialysis facility are replacedwith a newly randomized patient. The projected rate of such deaths or dropoutsexceeds 20% per year. The recruit-with-replacement strategy increases the pro-jected patient-years of follow-up to over 5000, providing adequate power todetect effects of approximately 25% while maintaining the restriction that theclinical centers would not be required to follow more than 900 randomizedpatients at any one time. The recruit-with-replacement strategy is particularlywell-suited to the HD setting where recruitment efforts are simplified by easypatient accessibility at scheduled dialysis treatments, and where the rates ofmortality and other types of dropout are high. One complication is the expecta-tion that a substantial fraction of replacement patients will be relatively newdialysis patients appearing in participating dialysis facilities after the supplyof prevalent patients has been exhausted. Randomization is stratified in randomblocks over calendar time to assure approximate balance in randomization atall stages of the study. Years of dialysis is a prespecified covariate in the primaryanalysis to prevent confounding of the treatment comparisons with variationsin the duration of prior dialysis for randomized patients as the study progresses.
Specification of Composite Secondary Outcomes
The designation of the “main” secondary composite outcomes S1, S2, andS3, as previously defined, is intended to further address the limitations inpower imposed by the constraints on the total patient-years of follow-up. Thecardiovascular composite outcome has a projected event rate approximately50% greater than that of mortality alone (Patrick Parfrey, personal communica-tion). A similar increase in event rates for the infection and declining albumincomposites is expected. Such an increase in event rate would allow detectionof effects on the secondary composite outcomes which are 15–20% smaller thanthe minimum detectable effects on mortality.
Determination of eKt/V
Increasing awareness of the deficiency of spKt/V in quantifying dialysisdose (due to postdialysis urea rebound) appeared in the renal community atapproximately the same time that the HEMO Study was designed. Unfortu-nately, in contrast to spKt/V, which is calculated from urea concentrations atthe beginning and end of dialysis, direct calculation of eKt/V requires themeasurement of blood urea concentration 30–60 minutes after the end of thedialysis treatment when the rebound is almost complete. It is not feasible torequire patients to routinely stay in the dialysis facility for an extended periodafter dialysis treatments. It was therefore essential to develop a method tomonitor eKt/V without requiring blood samples more than a few minutes afterthe end of dialysis.
To address this difficulty, several newly proposed methods for predictingeKt/V based on measurements of urea concentrations in the blood and/ordialysate during dialysis were investigated in 295 modeled dialysis sessionsconducted in 49 patients enrolled in the HEMO Pilot Study during 1994 [20].Fortunately, a simple approach derived from a regional blood flow urea kinetic
510 HEMO Study Group
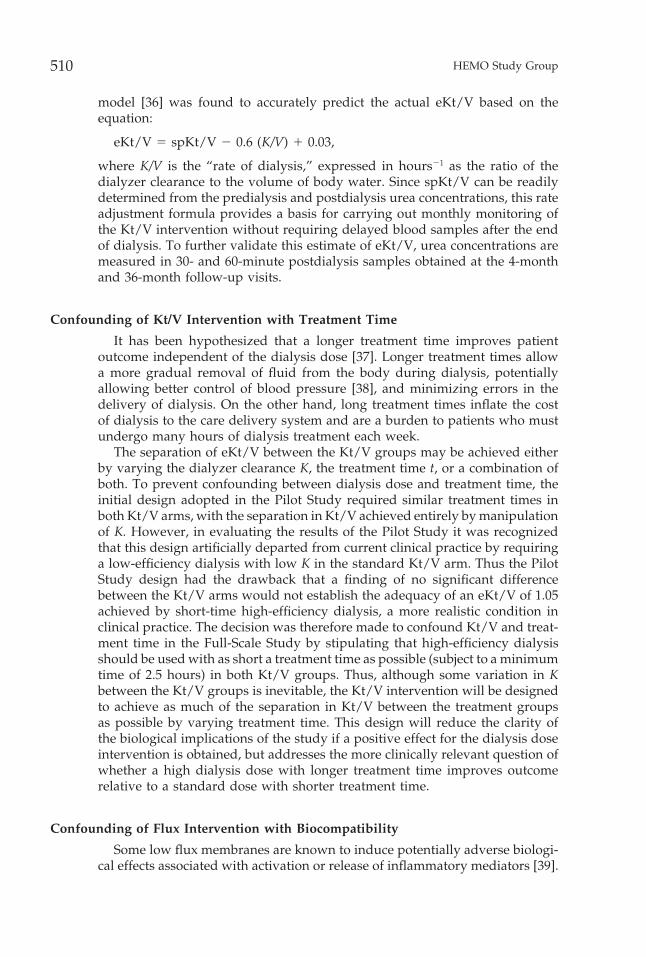
model [36] was found to accurately predict the actual eKt/V based on theequation:
eKt/V 5 spKt/V 2 0.6 (K/V) 1 0.03,
where K/V is the “rate of dialysis,” expressed in hours21 as the ratio of thedialyzer clearance to the volume of body water. Since spKt/V can be readilydetermined from the predialysis and postdialysis urea concentrations, this rateadjustment formula provides a basis for carrying out monthly monitoring ofthe Kt/V intervention without requiring delayed blood samples after the endof dialysis. To further validate this estimate of eKt/V, urea concentrations aremeasured in 30- and 60-minute postdialysis samples obtained at the 4-monthand 36-month follow-up visits.
Confounding of Kt/V Intervention with Treatment Time
It has been hypothesized that a longer treatment time improves patientoutcome independent of the dialysis dose [37]. Longer treatment times allowa more gradual removal of fluid from the body during dialysis, potentiallyallowing better control of blood pressure [38], and minimizing errors in thedelivery of dialysis. On the other hand, long treatment times inflate the costof dialysis to the care delivery system and are a burden to patients who mustundergo many hours of dialysis treatment each week.
The separation of eKt/V between the Kt/V groups may be achieved eitherby varying the dialyzer clearance K, the treatment time t, or a combination ofboth. To prevent confounding between dialysis dose and treatment time, theinitial design adopted in the Pilot Study required similar treatment times inboth Kt/V arms, with the separation in Kt/V achieved entirely by manipulationof K. However, in evaluating the results of the Pilot Study it was recognizedthat this design artificially departed from current clinical practice by requiringa low-efficiency dialysis with low K in the standard Kt/V arm. Thus the PilotStudy design had the drawback that a finding of no significant differencebetween the Kt/V arms would not establish the adequacy of an eKt/V of 1.05achieved by short-time high-efficiency dialysis, a more realistic condition inclinical practice. The decision was therefore made to confound Kt/V and treat-ment time in the Full-Scale Study by stipulating that high-efficiency dialysisshould be used with as short a treatment time as possible (subject to a minimumtime of 2.5 hours) in both Kt/V groups. Thus, although some variation in Kbetween the Kt/V groups is inevitable, the Kt/V intervention will be designedto achieve as much of the separation in Kt/V between the treatment groupsas possible by varying treatment time. This design will reduce the clarity ofthe biological implications of the study if a positive effect for the dialysis doseintervention is obtained, but addresses the more clinically relevant question ofwhether a high dialysis dose with longer treatment time improves outcomerelative to a standard dose with shorter treatment time.
Confounding of Flux Intervention with Biocompatibility
Some low flux membranes are known to induce potentially adverse biologi-cal effects associated with activation or release of inflammatory mediators [39].
HEMO Study Design 511
Such membranes are considered less “biocompatible” than most high flux mem-branes. This introduces a possible confound between flux and biocompatibility.
Among low flux membranes, the class referred to as unsubstituted cellulosicmembranes is regarded as being the least biocompatible, and has been associ-ated with higher mortality in an observational study of chronic HD patients[40]. Although unsubstituted cellulosic membranes were still widely used whenthe HEMO Full-Scale Study began in 1995, current trends suggest a decliningutilization of these dialyzers. These observations raised the concern that ifmorbidity/mortality is shown to be higher in the low flux arm, it would notbe clear whether the difference was due to the lower flux or to the lesserbiocompatability of the membranes. If unsubstituted cellulosic membranes arephased out of clinical practice by the time the study is completed, the implica-tions of a positive effect for the flux intervention would be diminished. Thedecision was therefore made to exclude unsubstituted cellulosic membranesfrom the study, with the understanding that this would reduce but not eliminatethe confound between flux and biocompatibility.
CONDUCT OF THE STUDY
Data Collection and Organization
Data collected by the 15 clinical centers is written on centrally producedstudy paper forms and then remotely key-entered by clinical center personnelvia the Internet into the central database located on a Sun System at the DataCoordinating Center (DCC). The central database is programmed in Oracle,and includes appropriate quality control mechanisms (see next section).
The staff at a clinical center usually includes a nephrologist principal investi-gator, one or more co-investigators who may be physicians at the participatingdialysis clinics, a full-time study coordinator, a part-time dietitian, and a part-time key entry person. The study coordinators and dietitians are responsiblefor data collection, patient instruction, and coordination with nonstudy nurses,technicians, and dietitians at each of the dialysis units associated with theircenter. In most cases blood samples are drawn by dialysis unit techniciansaccording to a standardized protocol under the supervision of the study coordi-nator. The participating centers, central facilities, and other investigators arelisted in the appendix.
Study Timeline
The Pilot Study was conducted in 49 patients during 1994 to assess thefeasibility of the study procedures and data collection forms and to investigatealternative strategies for kinetic modeling. Patient randomization for the Full-Scale Study began in May 1995. The recruitment plan called for 900 randomizedpatients to be accrued in the 18 months from May 1995 to November 1996. Inaccordance with the recruit-with-replacement strategy, the clinical centers arerequired to recruit additional patients to maintain a target of 900 concurrentlyactive patients until November 1, 2000. Including both initial and replacementpatients, a total of 1517 patients were randomized by July 1, 1999. Regularpatient follow-up is scheduled to terminate on November 1, 2001. The protocols
512 HEMO Study Group
for both the Pilot and Full-Scale studies were approved by an External AdvisoryCommittee and the Institutional Review Boards of the participating clinicalcenters prior to initiation of enrollment.
Baseline Procedures
Demographic and clinical information is obtained at the time of baselineenrollment for all study participants. During the 2–3 weeks after enrollment,patients are maintained on their usual dialysis prescriptions prior to study entryto allow an assessment of the condition of the patients prior to modification bythe study procedures. During this initial phase of baseline, two weekly kineticurea modeling sessions are conducted to assess baseline dialysis dose and otherkinetic parameters. Timed urine collections over 24–46 hours are performedfor patients with remaining urine output prior to one of these two kineticmodeling sessions to measure the residual urea clearance of the native kidney(Kru). Patients with Kru . 1.5 mL/min (per 35 L urea volume) are excludedfrom the study since residual kidney function complicates the interpretationof both the dialysis dose and flux interventions. The 1.5 mL/min cutoff repre-sents 2–3% of the urea clearance of a person with normal renal function. Patientssatisfying the Kru and other entry criteria (Table 2) are evaluated on the fullbattery of study assessments (Table 3), including hematological and biochemicalstudies from local laboratories, vascular access conditions, comorbidity, qualityof life, functional status, dietary intakes from 2-day food records, appetite,and anthropometry.
To confirm that the patients can attain the high Kt/V goal, at approximatelythe fourth week of baseline the DCC provides a modified dialysis prescriptionfor each patient to target an eKt/V of 1.45 (see kinetic modeling logistics below).Patients who achieve a delivered eKt/V > 95 1.30 for two of three consecutivemodeled dialyses, satisfy the entry criteria of Table 2, and complete all baselineprocedures within 14 weeks are eligible for randomization by the DCC aftersigning an informed consent.
Measurement Schedule
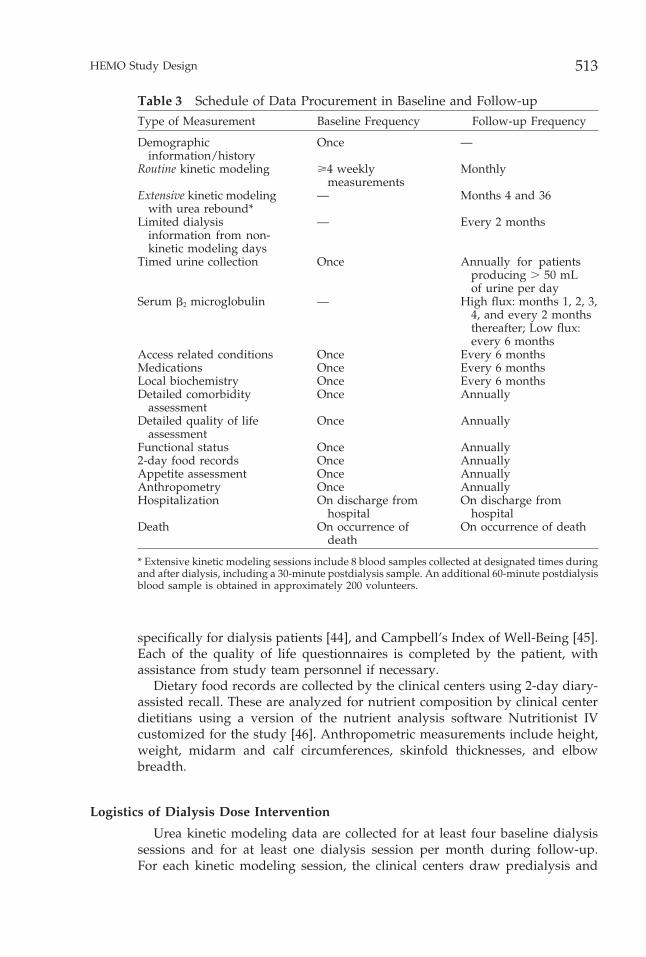
Table 3 summarizes the time schedule of the major study measurements inbaseline and follow-up after randomization. Once randomized, the regularfollow-up measurement schedule applies for each patient until death or dropoutdue to renal transplantation, a switch to an alternative method of dialysis otherthan HD, or transfer to a dialysis unit not participating in the study. Mortalityinformation for the primary analysis is collected regardless of renal transplanta-tion, therapy switches, or transfers.
The Index of Coexisting Disease (ICED) [41] is used to quantify the level ofcomorbidity at baseline, and annually throughout follow-up. The final ICEDscore is calculated based on separate indices of disease severity for each of 19disease categories and for each of nine physical impairments. Functional statusis also evaluated using the Karnofsky Index based on assessments by dialysisunit staff and study team [42]. Quality of life is evaluated using the Short Form-36 (SF-36) [43], in conjunction with the Kidney Disease and Quality of LifeQuestionnaire (KDQOL), an extended quality-of-life questionnaire developed
HEMO Study Design 513
Table 3 Schedule of Data Procurement in Baseline and Follow-upType of Measurement Baseline Frequency Follow-up Frequency
Demographic Once —information/history
Routine kinetic modeling >4 weekly Monthlymeasurements
Extensive kinetic modeling — Months 4 and 36with urea rebound*
Limited dialysis — Every 2 monthsinformation from non-kinetic modeling days
Timed urine collection Once Annually for patientsproducing . 50 mLof urine per day
Serum b2 microglobulin — High flux: months 1, 2, 3,4, and every 2 monthsthereafter; Low flux:every 6 months
Access related conditions Once Every 6 monthsMedications Once Every 6 monthsLocal biochemistry Once Every 6 monthsDetailed comorbidity Once Annually
assessmentDetailed quality of life Once Annually
assessmentFunctional status Once Annually2-day food records Once AnnuallyAppetite assessment Once AnnuallyAnthropometry Once AnnuallyHospitalization On discharge from On discharge from
hospital hospitalDeath On occurrence of On occurrence of death
death
* Extensive kinetic modeling sessions include 8 blood samples collected at designated times duringand after dialysis, including a 30-minute postdialysis sample. An additional 60-minute postdialysisblood sample is obtained in approximately 200 volunteers.
specifically for dialysis patients [44], and Campbell’s Index of Well-Being [45].Each of the quality of life questionnaires is completed by the patient, withassistance from study team personnel if necessary.
Dietary food records are collected by the clinical centers using 2-day diary-assisted recall. These are analyzed for nutrient composition by clinical centerdietitians using a version of the nutrient analysis software Nutritionist IVcustomized for the study [46]. Anthropometric measurements include height,weight, midarm and calf circumferences, skinfold thicknesses, and elbowbreadth.
Logistics of Dialysis Dose Intervention
Urea kinetic modeling data are collected for at least four baseline dialysissessions and for at least one dialysis session per month during follow-up.For each kinetic modeling session, the clinical centers draw predialysis and

514 HEMO Study Group
postdialysis blood samples and record information related to the dialysis ses-sion in the database. The blood samples are shipped via overnight mail to acentral biochemistry laboratory (CBL), which analyzes the samples for BUN,albumin, and b2M. The CBL electronically transmits a file containing the day’sresults to the DCC. Automated software at the DCC performs the kineticmodeling calculations and e-mails patient-specific reports which summarizeand interpret the results and provide instructions for future actions to theclinical centers.
The functions of the kinetic modeling reports transmitted by the DCCinclude:
1. Dialysis prescriptions. These reports specify multiple possible prescriptions,each targeted to the patient’s randomized eKt/V goal of 1.05 or 1.45.They are transmitted by the DCC to the clinical centers when a patientis randomized, and are updated as necessary throughout follow-up. Basedon a current estimate of the patient’s volume of urea distribution V, theprescription reports provide an array of combinations of blood flow rate,dialysate flow rate, dialyzer model, and treatment time which are consis-tent with the patient’s target eKt/V. To smooth out variations in estimatesof V from individual modeling sessions, the estimates of V are averagedover the latest four kinetic modeling sessions in the standard Kt/V armand the latest six modeling sessions in the high Kt/V arm. Extreme valuesare excluded if the coefficient of variation exceeds 10%.
2. Adherence of the clinical center to the DCC prescriptions. The adherence ofthe clinical center to the DCC prescription is assessed by comparingthe eKt/V prescribed by the clinical center to the target of 1.05 or 1.45corresponding to the patient’s randomized Kt/V group. If the clinicalcenter follows one of the options provided by the DCC prescription report,their prescribed eKt/V will match the 1.05 or 1.45 target to within a smallrounding error. However, clinical centers may fail to adhere to the DCCprescription reports for a variety of reasons, including an unwillingnessof the patient to remain in the dialysis clinic for the time required by theDCC prescription, inadequate blood flow in the patient’s vascular accessto achieve the required blood flow rate, or a desire by the patient or thepatient’s physician for a different dialysis dose than the study target.
3. Assessment of the dialysis dose actually delivered. Several measures of deliv-ered dialysis dose are reported, including spKt/V and eKt/V.
4. Identification of problems with the delivery of dialysis. Unusually large varia-tions in the modeled estimates of V are used to identify problems withthe delivery or the measurement of the dialysis dose. Problems indicatedby large variations in the estimated V include difficulties with blood flowdue to access stenosis or thrombosis which reduce the delivered dialysisdose, clotting of the dialyzer, errors in blood sampling, or incorrectlyreported treatment parameters.
Central Measurement of Dialyzer K0A
The capacity of a dialyzer to remove urea is characterized by a clearanceparameter denoted K0A. For a particular model of dialyzer to be used in the
HEMO Study Design 515
follow-up phase of the HEMO Study, at least five dialyzers of the same model,but different manufacturing lots, must be first submitted to a central laboratory(University of Utah) which measures the K0A using a standardized methodology[47]. A minimum average K0A of 500 mL/min is required for all dialyzermodels to maintain a relatively uniform level of high-efficiency dialysis in eachtreatment group. Dialyzer models must also satisfy criteria related to the fluxintervention, as described below.
Logistics of Flux Intervention
The conduct of the flux intervention is complicated by the practice of reuseof dialyzers for multiple dialysis sessions with reprocessing techniques thatalter the clearance of b2M. To maintain consistency with clinical practice in theUnited States, the HEMO Study allows dialyzers to be reused for up to 20dialyses after the first use. At the start of the study, it was expected thatreuse may increase or decrease b2M clearance depending on the dialyzer/reprocessing combination. However, the specific effects of each reprocessingmethod on each type of dialyzer were unknown. Since the number of dialyzer/reprocessing combinations was too large for each combination to be evaluatedprior to the study, a two-step process for approving dialyzers was established.This approval process is implemented by a subcommittee of the study investiga-tors (the Flux/Membrane Committee).
In the first step, dialyzers are tentatively approved based primarily on theirperformance at first use, before reprocessing. Approval is based on existingdata, or on data from special studies arranged by the Flux/Membrane Commit-tee if no existing data are available. To be approved for the low flux intervention,the mean of five independent b2M clearance measurements at first use mustbe ,10 mL/min. A dialyzer can be tentatively approved for the high fluxintervention if both of the following conditions are satisfied: (1) the ultrafiltra-tion coefficient (an index of water permeability) specified by the manufactureris > 14 mL/h per mm Hg, and (2) the mean of five first-use b2M clearancemeasurements is .20 mL/min. A dialyzer may also be tentatively approvedfor use with a specific reprocessing method in the high flux arm if it satisfiescondition (1) and the mean b2M clearance of five separate dialyzers exceeds20 mL/min when averaged over reuses 0, 5, 10, 15, and 20 with that reprocessingmethod. As of July 1, 1999, eight dialyzer models were approved for the lowflux arm, and 13 for the high flux arm.
In the second step of the approval process, the b2M clearances of all dialyzersused in the study are monitored as a function of the number of reuses for eachreprocessing technique. The Flux/Membrane Committee periodically reviewsthese data, and applies restrictions to particular dialyzer/reuse combinationsif it becomes clear that these combinations adversely affect the separation inb2M clearance between the flux groups.
Maintenance of Dietary Standards
Under the direction of a Nutrition Coordinating Center, the HEMO Studydietitians monitor the kinetically modeled nPCR and reported calorie intakeand recommend increased protein and energy intakes if nPCR , 1 g/kg/d
516 HEMO Study Group
or reported calorie intake , 28 kcal/g/d. The patient is offered nutritionalsupplements if the low values of nPCR or calorie intake persist followingintervention by the HEMO Study dietitian. Nutritional counseling and, if neces-sary, nutritional supplements, are also provided in response to formal actionitems triggered by a serum albumin decline of > 10% from the mean baselinevalue and by an undesired reduction of > 2.5 kg or 5% of postdialysis weightfor 2 consecutive months.
Classification of Outcomes
The Outcome Review Committee consisting of 10–12 study investigatorsis responsible for assuring a uniform classification of causes of death andhospitalizations which are relevant to the secondary composite outcomes speci-fied earlier.
For each death, the clinical center provides an initial classification and for-wards relevant documentation to the DCC. The documentation includes anarrative summary by the principal investigator of the events leading to thedeath, the U.S. Medicare Death Notification Form, the autopsy report (if avail-able), and the final discharge summary for patients who died in the hospital.The DCC assigns two members of the Outcome Review Committee to serveas primary reviewers, and sends them the obtained information along withrelevant data on demographics, comorbidity, and laboratory values from thestudy database. If the two Outcome Review Committee members agree witheach other on the primary cause of death, the agreed-upon classification is thefinal HEMO Study classification. If the two reviewers do not agree, documenta-tion is sent to the full Outcome Review Committee, and the final classificationis determined by a majority vote of the committee.
The clinical centers also provide initial classifications of hospitalizations.After discharge, the clinical center sends the DCC the ICD-9 code [48], thehospital discharge summary, and the local study team’s assessment of theprimary cause of the hospitalization using a classification system devised bythe HEMO Study. The DCC database checks each postrandomization hospital-ization to determine if it is a patient’s first cardiovascular or first infectionhospitalization. For these hospitalizations, the DCC sends one member of theOutcome Review Committee the compiled information and other pertinentdata. The reviewer classifies the hospitalization according to the study codingscheme. If the reviewer and the clinical center principal investigator agree asto the primary cause of the hospitalization, the common classification is re-garded as the final HEMO-Study classification. If agreement cannot be reached,documentation is sent to the full Outcome Review Committee, and the finalclassification is determined by a majority vote of the committee.
QUALITY CONTROL
In addition to standard quality control procedures implemented by the CBLand the clinical centers, the HEMO Study uses several additional quality controlmechanisms. Quality assurance for clinical center personnel includes centralannual training sessions where study coordinators are trained to carry outstudy procedures, including collection of kinetic modeling data, interpretation
HEMO Study Design 517
of kinetic modeling reports provided by the DCC, standardized coding ofcomorbidity information, and data collection for hospitalizations and deaths.Coordinators and key-entry personnel are trained and certified in forms com-pletion, data entry into the main study database, and error correction. HEMOStudy dietitians are trained to obtain diary-assisted dietary recalls, performnutritional counseling, and use the nutritional software package NutritionistIV. The dietitians are also certified to take anthropometry measurements. Sitevisits were conducted for each clinical center during the first 2 years of thestudy. These included detailed review of recruitment procedures and a dataaudit [49]. Site visits were also conducted to review procedures at the CBL andthe DCC.
The DCC provides monthly reports which monitor the performance of theclinical centers with regard to recruitment, adherence to the kinetic modelingand flux interventions, completeness of data collection and key entry, andadherence to standards of general medical care specified in the protocol. Asdescribed earlier, the kinetic modeling reports provide feedback on difficultieswith the dialysis dose intervention on an individual patient basis. Every secondmonth the clinical centers provide selected information for two nonmodeleddialysis sessions, which are randomly selected by the DCC, to evaluate whetherresults reported for modeled dialysis sessions are similar to dialysis sessionswithout kinetic modeling.
Re-key verification is required for entry of forms into the central Oracledatabase. The central database implements range checks on most items andincludes consistency checks within and between forms. To monitor the accuracyof coding of diet diaries, the DCC annually selects a random 5% sample ofdiary-assisted dietary recalls for reanalysis by the NCC. Deviations exceeding10% on selected dietary variables are identified and discussed between thedietitian who collected the data and the NCC for resolution of ambiguities.
External split-sample quality control of the CBL is conducted by each clinicalcenter on two kinetic modeling sessions per year. The predialysis and postdial-ysis blood samples are split and shipped separately to the CBL by the clinicalcenter, and the duplicate results are compared.
STATISTICAL ANALYSES
Primary Analysis
The primary statistical analysis will be conducted using Cox regression totest the effectiveness of the treatment interventions on duration of survivalfrom the date of randomization. The Cox regression model includes indicatorvariables to represent the effects of the treatment interventions and baselinecovariates to control for previously identified prognostic factors. The covariatesspecified for the primary analysis are: (1) age at randomization, (2) diabeticstatus (diabetic versus nondiabetic), (3) sex, (4) race (black versus nonblack),(5) years of dialysis at randomization, (6) a comorbidity index constructed fromthe ICED scale with diabetes excluded, (7) baseline serum albumin, and (8) theinteraction between baseline serum albumin and time since randomization.The analysis will be stratified by clinical center. Most of these covariates have
518 HEMO Study Group
been identified as predictors of survival in previous studies using large data-bases for patients with ESRD (e.g., the United States Renal Data System (USRDS)and the Patient Statistical Profile system for National Medical Care, Inc. [27]).The interaction term with baseline serum albumin is included due to the expec-tation that the baseline serum albumin measurements may be more stronglyassociated with the patients’ survival rate shortly after randomization thanlater in follow-up.
In accordance with the 2 3 2 factorial design, both the main effects of theKt/V and flux interventions and the interaction between these interventionswill be tested, recognizing that the power to detect an interaction between theinterventions is limited [50]. Under an intent-to-treat strategy, patients will beanalyzed according to their randomized groups regardless of compliance. Inaddition, survival of patients who transfer to nonparticipating centers or tomodes of dialysis other than HD will be analyzed without censoring. Underthis approach, effects on survival of transfers or switches in modality of dialysistherapy are interpreted as consequences of the degree of patient compliancewith the respective treatment interventions. This strategy will reduce the statis-tical power of treatment comparisons if the effects of the original HD interven-tions do not persist following transfer. However, censoring transfers and dial-ysis modality switches would have risked introducing bias in the treatmentcomparisons, since the decision to switch or transfer may be related to theprognosis of the patient.
A related complication is that published rates of renal transplantation [51]suggest that approximately 10% of HEMO Study patients are likely to receivecadaveric renal transplants during follow-up. Cadaveric renal transplantationis largely determined by the serendipitous availability of a viable kidney, andin this respect may not be strongly related to health status for most patients.Thus survival will be censored at the time of renal transplantation. However,since renal transplants are not provided to patients in exceptionally poor health,the decision to censor transplants may lead to an underestimation of a beneficialeffect of an intervention if a disproportionate number of the healthier patientson that intervention receive renal transplants and are thus censored. The inclu-sion of baseline prognostic factors in the Cox model will help to control forbias due to associations of transplantation with baseline patient characteristics.
Secondary Analyses
Similar Cox regression models including the same baseline covariates willbe used to test the effects of the interventions on the cardiovascular, infection,and declining serum albumin composite outcomes defined earlier. Becausehospitalization and serum albumin data are not collected after transfer ormodality switches, the analyses of the secondary composite outcomes will becensored at these events. Non-access hospitalization rates will be analyzedusing Poisson regression and with multivariate generalizations of the Coxmodel [52, 53].
Interactions of both interventions with various patient factors which havebeen suggested in the literature will be tested. In particular, it has been sug-gested that higher levels of Kt/V are necessary in whites (as compared withblacks) [54], females and smaller patients [55], and in patients with higher
HEMO Study Design 519
levels of comorbidity such as diabetes [13]. Other possible interactions includea smaller beneficial effect of the dialysis dose and flux interventions in patientswho retain some level of native residual renal function. Such tests for interac-tions will be interpreted with caution due to the limitations in statistical powerand inflation of type I error rates due to multiple tests.
Longitudinal methods will be used to relate the treatment interventions tochanges in continuous outcomes (e.g., anthropometric measures, dietary intakevariables, biochemical and kinetic measures of nutritional status, quality of lifeindices) and ordinal outcomes (e.g., the ICED score) [56, 57]. Methods whichaccount for informative censoring will be used to control for bias in estimatedchanges in other outcomes resulting from censoring due to deaths and drop-outs [58].
Interim Analyses
Formal interim analyses are presented annually to the External AdvisoryCommittee to monitor patient safety, review the conduct of the study, anddetermine if one or both arms of the study should be terminated early due toclear evidence of a benefit of one of the interventions. The spending functionapproach of Lan and DeMets [59] as adapted to survival data has been usedto construct a formal stopping rule based on an O’Brien-Fleming boundary.
POWER ANALYSIS
Assumptions
Estimates of the power for the primary analysis of mortality were derivedusing a data set provided by the Health Care Financing Administration (HCFA)with data on mortality, transfers, and modality switches over a 5-year periodfor all U.S. dialysis patients entitled to medicare on January 1, 1986. These datawere used to model the expected event rates in the HEMO Study with Coxregression equations relating the rates of mortality, renal transplantation, anddialysis modality switches to five of the prognostic factors: age, gender, race,years of dialysis, and diabetic status. Separate Cox regressions were obtainedfor the originally randomized patients (assumed to represent a prevalencesample) and the later replacement patients (assumed to correspond to newdialysis patients with ESRD for 3–12 months). The baseline hazard functionsin the Cox regressions for mortality in the HCFA data set were approximatelyconstant over time for both the prevalent patients and the new dialysis patients.Thus, constant hazard rates were assumed for mortality. On the other hand,decreasing baseline hazard functions were observed for the rates of renal trans-plantation and modality switches. The Cox regression models were updatedby multiplying the estimated hazard functions by constant factors to bring theoverall event rates into accordance with an updated survey of U.S. dialysispatients provided in the 1995 USRDS Annual Data Report [51]. Estimates ofthe prevalence of risk factors for the HEMO Study were adjusted based on asurvey conducted at the start of the Full-Scale Study in the dialysis units par-ticipating in the HEMO Study.
520 HEMO Study Group
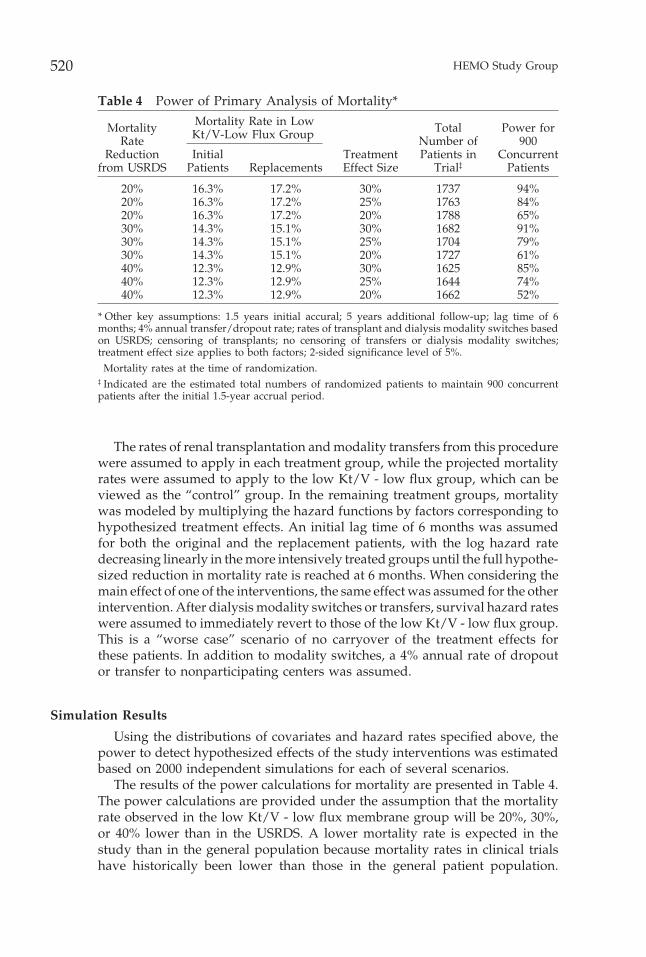
Table 4 Power of Primary Analysis of Mortality*Mortality Rate in LowMortality Total Power forKt/V-Low Flux Group†
Rate Number of 900Reduction Initial Treatment Patients in Concurrent
from USRDS Patients Replacements Effect Size Trial‡ Patients
20% 16.3% 17.2% 30% 1737 94%20% 16.3% 17.2% 25% 1763 84%20% 16.3% 17.2% 20% 1788 65%30% 14.3% 15.1% 30% 1682 91%30% 14.3% 15.1% 25% 1704 79%30% 14.3% 15.1% 20% 1727 61%40% 12.3% 12.9% 30% 1625 85%40% 12.3% 12.9% 25% 1644 74%40% 12.3% 12.9% 20% 1662 52%
* Other key assumptions: 1.5 years initial accural; 5 years additional follow-up; lag time of 6months; 4% annual transfer/dropout rate; rates of transplant and dialysis modality switches basedon USRDS; censoring of transplants; no censoring of transfers or dialysis modality switches;treatment effect size applies to both factors; 2-sided significance level of 5%.† Mortality rates at the time of randomization.‡ Indicated are the estimated total numbers of randomized patients to maintain 900 concurrentpatients after the initial 1.5-year accrual period.
The rates of renal transplantation and modality transfers from this procedurewere assumed to apply in each treatment group, while the projected mortalityrates were assumed to apply to the low Kt/V - low flux group, which can beviewed as the “control” group. In the remaining treatment groups, mortalitywas modeled by multiplying the hazard functions by factors corresponding tohypothesized treatment effects. An initial lag time of 6 months was assumedfor both the original and the replacement patients, with the log hazard ratedecreasing linearly in the more intensively treated groups until the full hypothe-sized reduction in mortality rate is reached at 6 months. When considering themain effect of one of the interventions, the same effect was assumed for the otherintervention. After dialysis modality switches or transfers, survival hazard rateswere assumed to immediately revert to those of the low Kt/V - low flux group.This is a “worse case” scenario of no carryover of the treatment effects forthese patients. In addition to modality switches, a 4% annual rate of dropoutor transfer to nonparticipating centers was assumed.
Simulation Results
Using the distributions of covariates and hazard rates specified above, thepower to detect hypothesized effects of the study interventions was estimatedbased on 2000 independent simulations for each of several scenarios.
The results of the power calculations for mortality are presented in Table 4.The power calculations are provided under the assumption that the mortalityrate observed in the low Kt/V - low flux membrane group will be 20%, 30%,or 40% lower than in the USRDS. A lower mortality rate is expected in thestudy than in the general population because mortality rates in clinical trialshave historically been lower than those in the general patient population.
HEMO Study Design 521
Depending on the mortality rate reduction in the low Kt/V - low flux groupfrom the USRDS, the power to detect an annual mortality rate reduction of30% ranges from 85–94%, and the power to detect an annual mortality ratereduction of 25% ranges from 74–84%.
SUMMARY
The HEMO Study is the first randomized multicenter clinical trial addressinghemodialysis delivery since the NCDS was completed in 1981. The study usesa 2 3 2 factorial design to investigate the effects on mortality and morbidityof two factors related to the dialysis prescription: dialysis dose (or Kt/V) andmembrane flux. Approaches taken to confront several methodological obstaclesto achieving the objectives of the study were reviewed. To deal with constraintson resources, a recruitment scheme was devised in which patients who die ordrop out are replaced by newly randomized patients to maintain a target of900 concurrently active randomized patients over 5 years after a 1.5-year accrualperiod. To maximize clinical relevance, dialysis dose and treatment time areconfounded in the design of the dialysis dose intervention, and a class ofmembranes with low biocompatability was excluded from the low flux arm ofthe study. Urea kinetic modeling results from a Pilot Study were used to devisenew methods for monitoring and adjusting dialysis dose in the Full-Scale Study.The design has adequate power to detect mortality rate reductions of 25% forboth interventions. Presentation of the primary results of the trial is plannedshortly after the end of patient follow-up in late 2001.
The HEMO Study is supported by grants from the National Institute of Digestive and KidneyDiseases. Some study dialyzers have been provided by Baxter Healthcare Corporation (McGawPark, IL) and Fresenius Medical Care-North America (Lexington, MA). Nutritional supplementshave been provided by Ross Laboratories (Columbus, OH) and vitamins by R&D Labs, Inc. (Marinadel Rey, CA).
REFERENCES1. United States Renal Data System, USRDS 1999 Annual Report, Chapter II: Incidence
and Prevalence of ESRD. Bethesda MD: The National Institutes of Health, NationalInstitute of Diabetes and Digestive and Kidney Diseases; 1999:25–38.
2. United States Renal Data System, USRDS 1999 Annual Report, Chapter X: TheEconomic Cost of ESRD and Medicare Spending for Alternative Modalities of Treat-ment. Bethesda MD: The National Institutes of Health, National Institute of Diabetesand Digestive and Kidney Diseases; 1999:145–164.
3. United States Renal Data System, USRDS 1999 Annual Report, Chapter V: PatientMortality and Survival. Bethesda MD: The National Institutes of Health, NationalInstitute of Diabetes and Digestive and Kidney Diseases; 1999:73–88.
4. Held PJ, Brunner F, Odaka M, et al. Five-year survival for end-stage renal diseasepatients in the United States, Europe and Japan, 1982 to 1987. Am J Kidney Dis 1990;5:451–457.
5. Collins A, Hanson G, Umen A, Kjellstrand C, Keshaviah P. Changing risk factordemographics in end-stage renal disease patients entering hemodialysis and theimpact on long-term mortality. Am J Kidney Dis 1990;15:422–432.
6. Eknoyan G, Levey AS, Beck GJ, et al. The Hemodialysis (HEMO) Study: Rationalefor selection of interventions. Semin Dial 1996;9:24–33.
522 HEMO Study Group
7. Parker TF, Laird NM, Lowrie EG. Comparison of the study groups in the NationalCooperative Dialysis Study and a description of morbidity, mortality and patientwithdrawal. Kidney Int 1983;23(Suppl):S42–S49.
8. Harter HR. Review of significant findings from the National Coorperative StudyDialysis Study and recommendations. Kidney Int 1983;23(Suppl 13):S107–S112.
9. Lowrie EG, Laird NM, Parker TF, Sargent JA. Effect of the hemodialysis prescriptionon patient morbidity: Report of the National Coorperative Dialysis Study. New EnglJ Med 1981;305:1176–1180.
10. Gotch FA, Sargent JA. A mechanistic analysis of the National Cooperative DialysisStudy (NCDS). Kidney Int 1985;28:526–534.
11. Depner TA. Prescribing Hemodialysis: A guide to urea kinetic modeling. Boston: KluwerAcademic Publishers; 1991.
12. Hakim RM, Breyer J, Ismail N, Schulman G. Effects of dose of dialysis on morbidityand mortality. Am J Kidney Dis 1994;23:661–669.
13. Collins A, LIao M, Umen A. Urea index (Kt/V) and other predictors of hemodialysispatient survival. Am J Kidney Dis 1994;23:272–282.
14. Parker TF, Husni L, Huang W, Lew N, Lowrie EG. Survival of hemodialysis patientsin the United States is improved with a greater quantity of dialysis. Am J KidneyDis 1994;23:670–680.
15. Held PJ, Port FK, Wolfe RA, et al. The dose of hemodialysis and patient mortality.Kidney Int 1996;50:550–556.
16. National Kidney Foundation-Dialysis Outcomes Quality Initiative. Clinical practiceguidelines for hemodialysis adequacy. Am J Kidney Dis 1997;30(Suppl):S22–S63.
17. Pedrini LA, Zereik S, Rasmy S. Causes, kinetics and clinical implications of post-hemodialysis urea rebound. Kidney Int 1988;34:817–825.
18. Spiegel DM, Parker PL, Babcock S, Contiguglia R, Klein M. Hemodialysis urearebound: The effect of increasing dialysis efficiency. Am J Kidney Dis 1995;25:226–229.
19. Depner T, Beck G, Daugirdas J, Kusek J, Eknoyan G. Lessons from the Hemodialysis(HEMO) Study: An improved measure of the actual dialysis dose. Am J KidneyDis 1999;33:142–149.
20. Daugirdas JT, Depner TA, Gotch FA, et al. Comparison of methods to predictequilibrated Kt/V in the HEMO Pilot Study. Kidney Int 1997;52:1395–1405.
21. Ikizler TA, Flakoll PJ, Parker RA, Hakim RM. Amino acid and albumin losses duringhemodialysis. Kidney Int 1994;46:830–837.
22. Josephson MA, Fellner SK, Dasgupta A. Improved lipid profiles in patients undergo-ing high flux hemodialysis. Am J Kidney Dis 1992;20:361–366.
23. Van Ypersele de Strihou C. Beta-2-microglobulin amyloidosis: Effect of ESRD treat-ment modality and dialysis membrane type. Nephrol Dial Transplant 1996;11(Suppl 2):147–149.
24. Makita Z, Radoff S, Rayfield EJ, et al. Advanced glycosylation end products inpatients with diabetic nephropathy. New Engl J Med 1991;325:836–842.
25. Jorstad S, Smeby LC, Balstad T, Wideroe TE. Generation and removal of anaphylotox-ins during hemofiltration with 5 different membranes. Blood Purif 1988;6:325–335.
26. Leypoldt JK, Cheung AK, Carroll CE, et al. Effect of dialysis membranes and middlemolecule removal on chronic hemodialysis patient survival. Am J Kidney Dis 1999;33:349–355.
27. Lowrie EG, Lew NL. Death risk in hemodialysis patients: The predictive value ofcommonly measured variables and an evaluation of death rate differences betweenfacilities. Am J Kidney Dis 1990;15:458–482.
28. Owen WF Jr, Lew NL, Liu Y, Lowrie EG, Lazarus JM. The urea reduction ratio andserum albumin concentration as predictors of mortality in patients undergoinghemodialysis. New Engl J Med 1993;329:1001–1006.
HEMO Study Design 523
29. Rostand SG, Brunzell JD, Cannon RO, Victor RG. Cardiovascular complications inrenal failure. J Am Soc Nephrol 1991;2:1053–1062.
30. Parfrey PS, Harnett JD, Barre PE. The natural history of myocardial disease indialysis patients. J Am Soc Nephrol 1991;2:2–12.
31. United States Renal Data System, USRDS 1999 Annual Report, Chapter VI: Causesof Death. Bethesda MD: The National Institutes of Health, National Institute ofDiabetes and Digestive and Kidney Diseases; 1999:89–100.
32. Hakim RM, Levin N. Malnutrition in hemodialysis patients. Am J Kidney Dis 1993;21:124–137.
33. Lindsay RM, Spanner E. A hypothesis: The protein catabolic rate is dependentupon the type and amount of treatment in dialyzed uremic patients. Am J KidneyDis 1989;5:382–389.
34. Stein A, Walls J. The correlation between Kt/V and protein catabolic rate—a self-fulfilling prophecy. Nephrol Dial Transplant 1994;9:743–745.
35. Greene T, Depner TA, Daugirdas JT. Mathematical coupling and the associationbetween Kt/V and PCRn. Semin Dial 1999;12 (Suppl):S20–S28.
36. Daugirdas JT, Schneditz D. Overestimation of hemodialysis dose (delta Kt/V) de-pends on dialysis efficiency (K/V) by regional blood flow and conventional 2-poolurea kinetic analyses. ASAIO J 1995; 41: M719–M724.
37. Charra B. Does empirical long slow dialysis result in better survival? ASAIO J 1993;39:819–822.
38. Charra B, Calemard E, Ruffet M, et al. Survival as an index of adequacy of dialysis.Kidney Int 1992;41:1286–1291.
39. Schulman GM, Hakim RM. Recent advances in the biocompatibility of haemodialysismembranes. Nephrol Dial Transplant 1991;2(Suppl 6):10–13.
40. Hakim RM. Assessing the adequacy of dialysis. Kidney Int 1990;37:822–832.
41. Greenfield S, Nelson E. Recent developments and future issues in the use of healthstatus assessment measures in clinical settings. Med Care 1992;30:23–41.
42. McClellan WM, Anson C, Birkeli K, Tuttle E. Functional status and quality of life:Predictor of early mortality among patients entering treatment for end-stage renaldisease. J Clin Epidemiol 1991;44:83–89.
43. Ware JE, Sherbourne CD. The MOS 36-Item Short-Form Health Survey (SF-36). MedCare 1992;30:473–481.
44. Hays RD, Kallich JD, Mapes DL, Coons SJ, Carter WB. Development of the kidneydisease quality of life (KDQOLTM) instrument. Qual Life Res 1994;3:239–338.
45. Campbell A, Converse PE, Rodgers WL. The quality of life of hemodialysis andtransplant patients. Kidney Int 1982;22:286–291.
46. Nutritionist IV For Windows. First DataBank Division, The Hearst Corporation; 1995.
47. Leypoldt JK, Cheung AK, Agodoa LY, et al. Hemodialyzer mass transfer coefficientsfor urea increase at high dialysate flow rates. The Hemodialysis (HEMO) Study.Kidney Int 1997;51:2013–2017.
48. Longenecker JC, Klag MJ, Coresh J, et al. Validation of comorbid conditions on theESRD medical evidence report by medical record review: The CHOICE Study. J AmSoc Nephrol 2000;11:520–529.
49. Ornt D, Kusek JW, Dockery J, et al. Assessment of data quality in an NIH-sponsoredmulticenter clinical trial: The HEMO Dialysis (HEMO) Study. Second Joint Meetingfor Clinical Trials and International Society for Clinical Biostatistics; 1997; BostonMA.
50. Pocock SJ, Hughes MD, Lee RJ. Statistical problems in the reporting of clinical trials.New Engl J Med 1987;317:426–432.
524 HEMO Study Group
51. United States Renal Data System, USRDS 1995 Annual Report. Bethesda MD: TheNational Institutes of Health, National Institute of Diabetes and Digestive andKidney Diseases; 1995.
52. Wei LJ, Lin DY, Weissfeld L. Regression analysis of multivariate incomplete failuretime data by modeling marginal distributions. J Am Stat Assoc 1989;84:1065–1073.
53. Anderson PK, Gill RD. Cox’s regression model for counting processes: A largesample study. Ann Stat 1982;10:1100–1120.
54. Owen WF Jr., Chertow GM, Lazarus JM, Lowrie EG. Dose of hemodialysis andsurvival differences by race and sex. JAMA 1998;280:1764–1768.
55. Kopple JD, Zhu X, Lew NL, Lowrie EG. Body weight-for-height relationships predictmortality in maintenance hemodialysis patients. Kidney Int 1999;56:1136–1148.
56. Laird NM, Ware JH. Random-effects models for longitudinal data. Biometrics1982;38:963–974.
57. Liang KY, Zeger SL. Longitudinal data analysis using generalized linear models.Biometrika 1982;73:13–22.
58. Follman D, Wu M. An approximate generalized linear model with random effectsfor informative missing data. Biometrics 1995;51:151–168.
59. Lan KKG, DeMets DL. Discrete sequential boundaries for clinical trials. Bio-metrika 1983;70:669–673.
APPENDIX: HEMO Study InvestigatorsBeth Israel Medical Center - N. Levin, A. Kaufman, J. Burrowes, S. Gibbons,
M. DeVita, I. Meisels, S. Patel, J. Uribarri; Brigham and Women’s Hospital - E.Milford, G. Chertow, T. Steinman, M. Williams, A. Bullard, J. Rehm-McGilli-cuddy; Duke University - S. Schwab, D. Butterly, M. Berkoben, W. Owen, S.Minda, D. Bartholomay, L. Poe, A. Brandenburg; Emory University - J. Bailey,E. Macon, B. Maroni, I. Brumfield, G. Carmichael, J. Miller; Lankenau Hospitaland Medical Research Center - B. Teehan, R. Benz, J. Brown, C. Bergen, J. Butler;New England Medical Center - A. Levey, K. Meyer, A. Martin, C. Moleske, L.Uhlin, N. Athienites, R. Chawla, G. Narayan, J. Strom, N. Aurigemma, D.Miskulin, M. Sarnak; University of Alabama at Birmingham - M. Allon, E. Rutsky,J. Lewis, J. Forehand, J. Dockery, W. Perdue, J. Jordan, L. Leith, S. Wade Patrick,N. Miller, D. Dunston, D. Gregg; University of California, Davis - T. Depner, G.Kaysen, S. Garcia, M. Powers; University of Illinois - J. Daugirdas, P. Balter, C.Carey, A. Frydrych, S. Haynes, B. McQuiston; University of Rochester- D. Ornt,J. Holley, W. Choudhry, M. Schiff, S. Silver, N. Ferris, S. Moser, D. Novak, J.Pata; University of Texas Southwestern Medical Center - R. Toto, J. Krivacic, C.Wright; University of Utah - A. Cheung, J. Leypoldt, S. Beddhu, C. Kablitz, K.Allen, J. Davis, R. Deeter, J. Gilson, L. Sala, S. Ware; Vanderbilt University - G.Schulman, J. Lewis, M. Faulkner, P. Hopkins, L. Kitchen, S. McLeroy, P. Rickard,M. Sika; Wake Forest University- M. Rocco, J. Burkart, P. Green, L. Hagan, S.Irving-Crawford, D. Poole, T. Young; Washington University - J. Delmez, D.Coyne, D. Windus, J. Audrain, R. Creaghan, K. Giles, K. Norwood; NationalInstitute of Diabetes and Digestive and Kidney Diseases - L. Agodoa, J. Briggs, P.Kimmel, J. Kusek, R. Star; Health Care Financing Administration - J. Greer; SteeringCommittee Chair- G. Eknoyan; Data Coordinating Center (Cleveland Clinic Founda-tion) G. Beck, J. Gassman, T. Greene, R. Heyka, M. Drabik, B. Larive, H. Litowitz,L. Paranandi, C. Rasmussen, L. Tuason, B. Weiss, K. Wiggins, G. Yan; NutritionCoodinating Center (New England Medical Center)- J. Dwyer, J. Leung, P. Cunniff,R. Henry; Central Biochemistry Laboratory (SPECTRA EAST) J. Zazra, B. Calabro,

HEMO Study Design 525
F. Wawra; Baxter Healthcare Corporation -W. Clark, G. Kunas; Fresenius MedicalCare - North America- P. Peterson, B. Rogers; Rand - R. Hays; R&D Labs, Inc. -R. Makoff; Ross Products Division, Abbott Laboratories- D. Cockram; Consultants -W. Chumlea, F. Gotch, M. Keen; External Advisory Committee - R. Blantz, W.Harmon, L. Hunsicker, J. Kopple, W. Mitch, A. Nissenson, J. Stokes, W. Vollmer,R. Wolfe.