Embed Size (px)
Citation preview

DESIGN AND FABRICATION OF A NOVEL SPINNING FLUIDISED BED
(REKABENTUK DAN FABRIKASI LAPISAN TERBENDALIR BERPUTAR
NOVEL)
MOHD ROZAINEE BIN TAIB
RESEARCH VOT NO:
72225
Jabatan Kimia
Fakulti Kejuruteraan Kimia & Kejuruteraan Sumber Asli
Universiti Teknologi Malaysia
2003

ii
ACKNOWLEDGEMENTS
The project team wishes to acknowledge the IRPA (Intensification Research
on Priority Areas) Grant through Vot No. 72225 for sponsoring this research. Also,
we would like to express our most sincere gratitude to BERNAS and Syarikat
KIARA Sdn. Bhd., the fabricator of the prototype, for the successful development of
the spinning fluidised bed system. We are also grateful to the CFD Research (S) Pte
Ltd in Singapore for their technical support during our computational fluid dynamics
modelling works.
Our special thanks goes to the Research Management Centre (RMC), UTM
and the Faculty of Chemical Engineering & Natural Resources Engineering
(FKKKSA), UTM for providing all the necessary facilities and support for carrying
out this research project.

iii
ABSTRACT
DESIGN AND FABRICATION OF A NOVEL SPINNING FLUIDISED BED
(Keywords: design, fluidised bed, computational fluid dynamics, rice husk)
Existing vertical spinning fluidised bed (SFB) have several drawbacks, such as non-uniform radial and axial bed fluidisation, feeding and ash accumulation problems. The purpose of this research, therefore is to develop a prototype of the horizontal SFB combustor capable of overcoming these drawbacks. The scopes of the research include engineering design of the prototype, computational fluid dynamics (CFD) modelling and set-up/commissioning of the developed prototype. Under this research, a prototype of the horizontal SFB has been successfully developed and is able to overcome the inherent weakness in vertical SFB. The innovative secondary chamber provides more freeboard for more complete combustion and acts as particulate control device. The prototype is suitable for burning low-density materials (rice husk, fibrous materials), which are difficult to be burnt in conventional fluidised bed by imparting a higher centrifugal force. There is also no limit to the amount of air throughput and combustion is only limited by the kinetics in which each different type of waste burns. Results from the CFD modelling narrowed down the parameters to be tested on the SFB in future experimental works, as well as providing design improvements on the current SFB design. Due to its compactness and versatility in burning a wide range of waste, the SFB prototype has the potential to be utilised as small-scale on-site waste incineration facility and high-efficiency gas burner for high-loading waste gas streams in chemical plants or refineries. The whole system is mountable to a truck and can be transported to waste sources such as rice mills, sawmills, wastewater treatment plants to incinerate waste. The full performance on the developed SFB during combustion of various types of wastes is outside the scope of the current research and therefore, is subjected to future experimental works.
Key researchers:
Assoc. Prof. Dr Mohd Rozainee bin Taib Ms Ngo Saik Peng Mr Lim Sin Yang
Mr Simon Looi Yat Seong
E-mail: [email protected] Tel. No.: 07-5535578 Vot No.: 72225

iv
ABSTRAK
REKABENTUK DAN FABRIKASI LAPISAN TERBENDALIR BERPUTAR
NOVEL
(Kata kunci: rekabentuk, lapisan terbendalir, permodelan komputer dinamik bendalir, sekam padi)
Lapisan terbendalir berputar menegak yang sedia ada memilik beberapa kelemahan, misalnya ketidakseragaman perbendaliran secara jejarian dan paksian berserta masalah penyuapan bahan dan pengumpulan abu. Oleh itu, matlamat penyelidikan ini adalah untuk membangunkan suatu prototaip lapisan terbendalir berputar mendatar yang mampu mengatasi kelemahan-kelemahan tersebut. Skop penyelidikan ini melibatkan rekabentuk kejuruteraan prototaip yang dicadangkan, permodelan komputer dinamik bendalir dan pengesahan fungsi prototaip yang telah dibangunkan. Di bawah projek penyelidikan ini, suatu prototaip lapisan terbendalir berputar mendatar yang mampu mengatasi segala kelemahan dalam lapisan terbendalir berputar menegak telah berjaya dibangunkan. Kebuk pembakaran sekunder yang merupakan inovasi kepada teknologi ini membolehkan proses pembakaran yang lebih lengkap di samping bertindak sebagai alat kawalan partikel. Prototaip ini sesuai untuk membakar bahan berketumpatan rendah (sekam padi, bahan berserat) yang amat sukar dibakar dalam lapisan terbendalir konvensional dengan mengenakan daya emparan yang tinggi. Juga, berbanding dengan lapisan terbendalir konvensional, lapisan terbendalir berputar tidak mempunyai had kadar suapan udara dan pembakaran hanya dihadkan oleh kinetik pembakaran bagi setiap jenis bahan yang dibakar. Keputusan daripada permodelan komputer dinamik bendalir berjaya mengurangkan parameter yang perlu dikaji dalam kerja eksperimen ke atas prototaip ini. Memandangkan rekabentuknya yang padat berserta dengan keserbabolehannya dalam membakar pelbagai jenis sisa buangan, prototaip ini mempunyai potensi yang tinggi untuk digunakan sebagai sistem insinerasi setempat berskala kecil dan juga sistem pembakar gas berkecekapan tinggi untuk kilang kimia. Seluruh sistem prototaip ini boleh dimuatkan ke atas trak dan dibawa ke sumber sisa buangan seperti kilang pemprosesan padi, kilang papan dan pusat pemulihan air buangan untuk membakar sisa buangan. Prestasi sepenuh prototaip ini dalam membakar pelbagai jenis sisa buangan adalah di luar skop penyelidikan ini dan oleh yang demikian, adalah di bawah skop penyelidikan pada masa akan datang.
Penyelidik utama:
Prof. Madya Dr Mohd Rozainee bin Taib Cik Ngo Saik Peng En. Lim Sin Yang
En. Simon Looi Yat Seong
E-mail: [email protected] Tel. No.: 07-5535578 Vot No.: 72225

v
TABLE OF CONTENTS
CHAPTER TITLE PAGE
ACKNOWLEDGEMENTS ii
ABSTRACT iii
ABSTRAK iv
TABLE OF CONTENTS v
LIST OF TABLES xi
LIST OF FIGURES xiv
LIST OF SYMBOLS xxiii
LIST OF APPENDICES xxix
LIST OF ATTACHMENTS xxx
CHAPTER I INTRODUCTION 1
1.1 Purpose of Research 1
1.2 Introduction to Spinning Fluidised Bed
(SFB) 1
1.3 Justifications and Objectives of Research
2
1.4 Scopes of Research 4
1.5 Expected Outputs
5
1.6 Layout of the Report
5

vi
CHAPTER II LITERATURE REVIEW 7
2.1 Advantages of Spinning Fluidised Bed 7
2.2 Advantages of Horizontal SFB 9
2.2.1 Uniform Axial Bed Thickness 9
2.2.2 Uniform Radial Bed Fluidisation 10
2.2.3 Feeding Problems in a Vertical SFB 11
2.2.4 Ash Accumulation 11
2.2.5 Potential to Control Particulate Emissions 12
2.2.6 Possible Enhanced Mixing 12
2.3 Unique Advantages of the SFB Freeboard 13
2.4 Fluidisation
13
2.4.1 Fluidisation in a Conventional Vertical
Fluidised Bed 13
2.4.2 Fluidisation in a SFB
16
2.4.2.1 The Surface and Critical Minimum
Fluidising Velocities (Umfs and Umfc) 18
2.4.2.2 Pressure Drop
20
2.5 Physical Properties of Sand Granules
22
2.5.1 Particle Size and Size Distribution
22
2.5.2 Bed Voidage (ε)
23
2.5.3 Particle Sphericity (φs)
23
2.5.4 The Geldart Classification of
Particles 24

vii
CHAPTER III DETERMINATION OF PARTICLE
PROPERTIES 26
3.1 Measurement of Rice Husk Properties
26
3.1.1 Proximate Analysis
26
3.1.2 Ultimate Analysis
26
3.2 Measurement of the Physical Properties of
Sand 27
3.2.1 Particle Size, Particle Density and Bed
Voidage 27
3.2.2 Minimum Fluidising Velocity (Umf) and
Particle Sphericity (φs) 28
3.3 Properties of Rice Husk and Sand Granules 28
3.3.1 Properties of Rice Husk 28
3.3.2 Physical Properties of Sand 30
3.3.2.1 Particle Size, Densities and Bed Voidage 30
3.3.2.2 Minimum Fluidising Velocity and Particle
Sphericity 31
CHAPTER IV DESIGN AND DEVELOPMENT OF THE PROTOTYPE
HORIZONTAL SFB COMBUSTOR 33
4.1 Design of the Horizontal SFB Combustor 33
4.2 Calculation of Combustion Air Requirement 35
4.3 Determination and Optimisation of Design
Parameters 37
4.3.1 Sand Size 37
4.3.2 Operating Temperature Range
38
4.3.3 Limitations in the Design of the SFB
Combustor 39

viii
4.3.3.1 Size of the SFB Combustor
39
4.3.3.2 Tapering Angle (θ)
40
4.3.3.3 Bed Depth (H)
42
4.3.3.4 Air Feed Rate
42
4.3.3.5 Spinning Speed
43
4.3.3.6 Rice Husk Feed
43
4.3.4 Combustor Dimensions for Uniform
Fluidisation 44
4.3.4.1 Determination of Combustor Size and
Optimum Bed Depth (H) 44
4.3.4.2 Determination of Optimum Tapering Height
(X) 48
4.3.4.3 Spinning Speed, Fluidising Air Feed Rate
and Rice Husk Feed Rate 50
4.3.4.4 Optimum Bed Depth for the Scaled Down
SFB Combustor 58
4.3.4.5 Determination of the Optimum Angle of
Tapering 60
4.3.5 Terminal Velocity of Rice Husk
66
4.3.6 Secondary Chamber Design
69
4.4 The Proposed SFB Combustor System 70

ix
CHAPTER V THREE-DIMENSIONAL COMPUTATIONAL FLUID
DYNAMICS MODELLING OF THE SFB
COMBUSTOR 73
5.1 Introduction 73
5.2 Model Set-Up 74
5.2.1 Factors Influencing the Choice of Grid 74
5.2.2 Grid Optimisation 76
5.3 Governing Equations and Numerical
Solution 77
5.3.1 Mathematical Model of the Gas Phase
77
5.3.2 Equation of Motion for a Particle
81
5.3.3 Mathematical Model for Reactive Chemistry
83
5.3.3.1 Single Phase Reacting Flows
83
5.3.3.2 Mixture Fraction / PDF Modelling
Approach for Particle Combustion 87
5.3.4 Modelling and Solution Procedures 91
5.4 Numerical Approach
92
5.5 Fluid Dynamics Feature of the SFB
Freeboard 92
5.6 Analysis of Modelling Results
94
5.6.1 Modelling of Air Flow Profiles in the SFB
Freeboard 95
5.6.1.1 Effect of Internal Baffles and Cowling
97
5.6.2 Modelling of Particle Trajectory in the SFB
Freeboard 99

x
5.6.2.1 Effect of Particle Diameter
101
5.6.2.2 Effect of Spinning Speed
108
5.6.2.3 Effect of Air Feed Rate
110
5.6.3 Gaseous Combustion 112
5.6.3.1 Effect of Tapering in the Primary Chamber
of SFB 113
5.6.3.2 Effect of Combustor Rotating Speed
115
a) Effect on Combustion Intensity
115
b) Effect on CO Burnout
117
c) Gas Phase Combustion in the Primary
and Secondary Chamber 119
5.6.4 Particle Combustion 121
5.6.4.1 Thermogravimetric Analysis of Rice
Husk 121
a) TGA in a Reducing (Nitrogen)
Environment 122
b) Comparisons of TGA in Reducing
(Nitrogen) and Oxidising (Air)
Environments 123
5.6.4.2 Biomass Particle Combustion
124
a) Mechanism of Biomass
Combustion
124
b) Controlling Factor in Particle Combustion 126
c) Char Combustion Mechanisms
126
5.6.4.3 Modelling of Rice Husk Particle

xi
Combustion in the SFB Combustor 127
a) Effect of Temperature on the Quality of
Rice Husk Ash 128
b) Effect of Combustor
Temperature
129
c) Effect of Combustor Rotating
Speed 131
CHAPTER VI COMMISSIONING AND DELIVERY OF THE
DEVELOPED SFB COMBUSTOR 133
6.1 Commissioning of the SFB Combustor
System Components 133
6.2 Delivery of the SFB Combustor System
134
CHAPTER VII CONCLUSIONS AND RECOMMENDATIONS 135
7.1 Conclusions 135
7.1.1 The Developed SFB Combustor Design
135
7.1.2 Computational Fluid Dynamics
Modelling on the
Developed SFB Combustor 136
7.1.2.1 Hydrodynamics in the SFB
Combustor 136
7.1.2.2 Optimum Operational Range for
Combustion of Rice
Husk 137

xii
7.1.2.3 Recommendations for Design
Improvement 138
7.1.3 Commissioning and Delivery of the SFB Combustor 140
7.2 Recommendations for Future Research Works 140
REFERENCES 143
FIGURES
PLATES
APPENDICES
ATTACHMENTS

xi
LIST OF TABLES
TABLE NO. TITLE PAGE
3.1 Rice husk analysis 29
3.2 Physical properties of sand 31
3.3 Size distribution of sand particles with a mesh size of
20/30 32
4.1 Fluidisation conditions and air feed requirements at
ambient (30oC) for different bed depths and rotating speeds
in the primary chamber (length 400 mm, ID 800 mm,
tapered height 300 mm, tapered angle 60o) 47
4.2 Fluidisation conditions and air feed requirements at
ambient (30oC) for different bed depths and rotating speeds
in the RFB primary chamber (length 400 mm, ID 800 mm,
tapered angle 60o, bed depth 200 mm) 48
4.3 Fluidisation conditions and air feed requirements at
different rotating speeds for a RFB operated at 30oC
(primary chamber length 400 mm, ID 800 mm, tapered
angle 60o, bed depth 200 mm) 55
4.4 Fluidisation conditions, air feed requirements and
stoichiometric rice husk feed rates at different rotating
speeds for a RFB operated at 800oC (primary chamber
length 400 mm, ID 800 mm, tapered angle 60o, bed depth
200 mm) 55
4.5 Dimensions and operating conditions of the initial RFB

xii
combustor and the scaled down RFB combustor 56
4.6 Fluidisation conditions and air feed requirements at
different rotating speeds for a RFB operated at 30oC
(primary chamber length 300 mm, ID 600 mm, tapered
angle 60o, bed depth 150 mm) 57
4.7 Fluidisation conditions, air feed requirements and
stoichiometric rice husk feed rates at different rotating
speeds for a RFB operated at 800oC (primary chamber
length 300 mm, ID 600 mm, tapered angle 60o, bed depth
150 mm) 57
4.8 Fluidisation conditions and air feed requirements at
ambient (30oC) for different bed depths and rotating speeds
in the RFB primary chamber (length 300 mm, ID 600 mm,
tapered height 225 mm, tapered angle 60o) 60
4.9 Fluidisation conditions and air feed requirements at
ambient (30oC) for tapering angles and rotating speeds in
the RFB primary chamber (length 300 mm, ID 600 mm,
tapered height 225 mm, bed depth 150 mm) 62
4.10 Fluidisation conditions and air feed requirements at
ambient (30oC) for different tapering angles, tapering
heights and rotating speeds in the RFB primary chamber
(length 300 mm, ID 600 mm, bed depth 150 mm) 64
4.11 Fluidisation conditions, air feed requirements and
stoichiometric rice husk feed rates for a RFB tapered at
different heights and angles while operating at 800oC
(primary chamber length 300 mm, ID 600 mm, bed depth
150 mm) 65
4.12 Fluidising velocities at the bed surface of the RFB
operating at 3 Umfs (primary chamber length 300 mm, ID
600 mm, tapering height 225 mm, tapering angle 60o, bed
depth 150 mm, sand size 600 – 850 µm) 68
5.1 Particle ejection velocities at different operating
conditions 100

xiii
5.2 Accumulation of ash particles in the fluidised bed of
depth 150 mm in the modified RFB combustor (primary
chamber length 300 mm, ID 600 mm, tapered angle 60o,
front tapering height 225 mm, rear tapering height 200 mm)
operating at 800oC 104
5.3 Estimated saltation velocities of rice husk ash of
different sizes in the modified RFB (with rear tapering
height of 200 mm) at various g-loadings (air inlet to
establish 3 Umfs at bed surface, bed depth 150 mm,
operating temperature 800oC) 106
5.4 Chemical properties of wheat straw and rice husk 125

xiv
LIST OF FIGURES
FIGURE NO. TITLE
1.1 A rotating fluidised bed
2.1 Combustion intensity in the bed burning methane at 200
RPM (Rozainee, 1998)
2.2 Combustion intensity in the bed burning methane at 400
RPM (Rozainee, 1998)
2.3 Vectors of the tangential velocity component in the RFB
freeboard
2.4 Behavioural changes of bed with gas velocity in a
conventional fluidised bed (Howard, 1989)
2.5 System configurations at different stages of aeration rate
2.6 Two types of pressure drop vs. gas velocity curves in a
RFB, a plateau or a maximum (Chen, 1987)
2.7 Pressure drop in a RFB as a function of air velocity for
various initial bed thickness (Kao et al., 1987)
2.8 Voidage of randomly packed bed of uniformly sized
particles increases as particles become less spherical
(Brown, 1950)
2.9 A powder classification diagram (Geldart, 1972)
3.1 Minimum fluidisation velocity (Umf) of 0.60 – 0.85 mm
sand in a conventional fluidised bed at room temperature
4.1 Tapered section geometry in the primary chamber of the
RFB
4.2 Schematic diagram of the proposed dimensions of the novel
horizontal rotating fluidised bed combustor

xv
4.3 Schematic diagram of the scaled down novel horizontal
rotating fluidised bed combustor
4.4 Radial velocity profile of air flow in the primary chamber
of the scaled down RFB at different g-loadings (entering air
flow at 1 Umfc, 30oC)
4.5 Profiles of cross sectional area for airflow at bed surface (of
depth 150 mm) with changes in the radius of the primary
chamber of the scaled down RFB
4.6 Chart for determining the terminal velocity of particles
falling through fluids (Haider and Levenspiel, 1989)
4.7 Terminal velocity of rice husk at different temperatures and
g-loadings (for g-loadings of 5 – 15, the terminal velocities
were evaluated at the bed surface of the RFB with bed
depth of 150 mm, ID 600 mm and tapered at 60o)
4.8 Blueprint of the prototype novel horizontal tapered rotating
fluidised bed combustor
4.9 Experimental set-up of the novel horizontal rotating
fluidised bed system
5.1 Velocity vectors of air at the axisymmetric plane of the
proposed RFB with grid node size interval of 10 (211
RPM, 3 Umfc @ room temperature)
5.2 Velocity vectors of air at the axisymmetric plane of the
proposed RFB with grid node size interval of 20 (211
RPM, 3 Umfc @ room temperature)
5.3 Contours of velocity magnitude at the axisymmetric plane
of the proposed RFB (211 RPM, 3 Umfc @ room
temperature) utilising the standard εκ − turbulence model
5.4 Velocity vectors at the axisymmetric plane of the proposed
RFB (211 RPM, 3 Umfc @ room temperature) utilising the
standard εκ − turbulence model
5.5 Contours of velocity magnitude at the axisymmetric plane
of the proposed RFB (211 RPM, 3 Umfc @ room
temperature) utilising the RNG εκ − turbulence model

xvi
5.6 Velocity vectors at the axisymmetric plane of the proposed
RFB (211 RPM, 3 Umfc @ room temperature) utilising the
RNG εκ − turbulence model
5.7 Algorithm for the solution of a non-adiabatic two-mixture-
fraction case in pre-PDF and FLUENT
5.8 Three-dimensional computation grid of a tapered horizontal
RFB combustor
5.9 Flow regions in a RFB (Levy et al., 1981)
5.10 Variation in tangential velocity component in the RFB
5.11 Velocity vectors of air in a tapered horizontal RFB (211
RPM, 3 Umfc @ room temperature)
5.12 Contours of static pressure in a tapered horizontal RFB
(211 RPM, 3 Umfc @ room temperature)
5.13 Contours of static pressure in an untapered horizontal RFB
(211 RPM, 3 Umfc @ room temperature)
5.14 Velocity vectors of air in an untapered horizontal RFB (211
RPM, 3 Umfc @ room temperature)
5.15 Trajectory of tracer particle in a tapered horizontal RFB
(211 RPM, 3 Umfc @ room temperature)
5.16 Velocity vectors of air in a tapered horizontal RFB (211
RPM, 3 Umfc @ room temperature) with baffles in the
secondary chamber (500 mm × 50 mm × 5 mm)
5.17 Trajectory of tracer particle in a tapered horizontal RFB
(211 RPM, 3 Umfc @ room temperature) with baffles in the
secondary chamber (500 mm × 50 mm × 5 mm)
5.18 Velocity vectors of air in a tapered horizontal RFB (211
RPM, 3 Umfc @ room temperature) with baffles in the
secondary chamber (500 mm × 75 mm × 5 mm)
5.19 Trajectory of tracer particle in a tapered horizontal RFB
(211 RPM, 3 Umfc @ room temperature) with baffles in the
secondary chamber (500 mm × 75 mm × 5 mm)

xvii
5.20 Velocity vectors of air in a tapered horizontal RFB (211
RPM, 3 Umfc @ room temperature) with baffles in the
secondary chamber (500 mm × 100 mm × 5 mm)
5.21 Trajectory of tracer particle in a tapered horizontal RFB
(211 RPM, 3 Umfc @ room temperature) with baffles in the
secondary chamber (500 mm × 100 mm × 5 mm)
5.22 Velocity vectors of air in a tapered horizontal RFB (211
RPM, 3 Umfc @ room temperature) with cowling (60o-cone)
placed 50 mm from primary chamber exit
5.23 Trajectory of tracer particle in a tapered horizontal RFB
(211 RPM, 3 Umfc @ room temperature) with cowling (60o-
cone) placed 50 mm from primary chamber exit
5.24 Velocity vectors of air in a tapered horizontal RFB (211
RPM, 3 Umfc @ room temperature) with cowling (60o-cone)
placed 100 mm from primary chamber exit
5.25 Trajectory of tracer particle in a tapered horizontal RFB
(211 RPM, 3 Umfc @ room temperature) with cowling (60o-
cone) placed 100 mm from primary chamber exit
5.26 Particle size distribution of rice husk ash obtained from
combustion of rice husk in a conventional fluidised bed
5.27 Trajectory of rice husk ash particle (Dp = 5 µm) ejected by
bubble eruption on bed surface in a tapered horizontal RFB
operating at 15-g loading (211 RPM) and 3 Umfc @ room
temperature
5.28 Velocity vectors of air in a tapered horizontal RFB (211
RPM, 3 Umfc @ room temperature) showing the formation
of recirculating zones near the primary chamber exit
5.29 Trajectory of rice husk ash particle (Dp = 10 µm) ejected by
bubble eruption on bed surface in a tapered horizontal RFB
operating at 15-g loading (211 RPM) and 3 Umfc @ room
temperature
5.30 Trajectory of rice husk ash particle (Dp = 25 µm) ejected by
bubble eruption on bed surface in a tapered horizontal RFB

xviii
operating at 15-g loading (211 RPM) and 3 Umfc @ room
temperature
5.31 Trajectory of rice husk ash particles (Dp = 50 µm and 1
mm) ejected by bubble eruption on bed surface in a tapered
horizontal RFB operating at 15-g loading (211 RPM) and 3
Umfc @ room temperature
5.32 Proposed modification to the RFB combustor to allow for
spill-over of ash particles from the bed
5.33 Contours of velocity magnitude in a tapered horizontal
RFB modified for ash spillover operating at 5-g loading
(122 RPM) and 3.5 Umfs @ 800oC with a bed depth of 150
mm
5.34 Contours of velocity magnitude in a tapered horizontal
RFB modified for ash spillover operating at 10-g loading
(173 RPM) and 3.5 Umfs @ 800oC with a bed depth of 150
mm
5.35 Contours of velocity magnitude in a tapered horizontal
RFB modified for ash spillover operating at 15-g loading
(211 RPM) and 3.5 Umfs @ 800oC with a bed depth of 150
mm
5.36 Trajectory of spillover ash of different sizes in the tapered
horizontal RFB modified for ash spillover operating at 5-g
loading (122 RPM) and 3.5 Umfs @ 800oC with a bed depth
of 150 mm
5.37 Trajectory of spillover ash of different sizes in the tapered
horizontal RFB modified for ash spillover operating at 10-g
loading (173 RPM) and 3.5 Umfs @ 800oC with a bed depth
of 150 mm
5.38 Cumulative plot for screen analysis of rice husk ash
5.39 Plot of gas/particle residence time versus bed rotating speed
(g-loading)
5.40 Trajectory of rice husk ash particle (Dp = 25 µm) ejected by
bubble eruption on bed surface in a tapered horizontal RFB

xix
operating at 5-g loading (122 RPM) and 3 Umfc @ room
temperature
5.41 Trajectory of rice husk ash particle (Dp = 25 µm) ejected by
bubble eruption on bed surface in a tapered horizontal RFB
operating at 10-g loading (173 RPM) and 3 Umfc @ room
temperature
5.42 Trajectory of rice husk ash particle (Dp = 25 µm) ejected by
bubble eruption on bed surface in a tapered horizontal RFB
operating at 15-g loading (211 RPM) and 3 Umfc @ room
temperature
5.43 Trajectory of rice husk ash particle (Dp = 10 µm) ejected by
bubble eruption on bed surface in a tapered horizontal RFB
operating at 15-g loading (211 RPM) and 1 Umfc @ room
temperature
5.44 Trajectory of rice husk ash particle (Dp = 10 µm) ejected by
bubble eruption on bed surface in a tapered horizontal RFB
operating at 15-g loading (211 RPM) and 2 Umfc @ room
temperature
5.45 Normal flame velocities for different methane
concentrations in air (Sarkar, 1990)
5.46 Unsustainable combustion of premixed methane/air
mixture in a fluidised bed with mixture inlet velocity of 0.5
m/s
5.47 Unsustainable combustion of premixed methane/air
mixture in a stationary horizontal RFB without tapered
ends with mixture inlet velocity of 0.5 m/s
5.48 Velocity contours inside a stationary horizontal RFB
without tapered ends showing that mixture velocities inside
most of the combustor exceeded the normal flame velocity
(9.5% methane in air) of 0.36 m/s for mixture inlet velocity
of 0.5 m/s

xx
5.49 Sustainable combustion of premixed methane/air mixture in
a stationary horizontal RFB with tapered ends with mixture
inlet velocity of 0.5 m/s
5.50 Velocity contours inside a stationary horizontal RFB with
tapered ends showing that mixture velocities inside most of
the combustor were less than the normal flame velocity
(9.5% methane in air) of 0.36 m/s for mixture inlet velocity
of 0.5 m/s
5.51 Sustainable combustion of premixed methane/air mixture in
a stationary horizontal RFB with tapered ends with mixture
inlet velocity of 2 m/s
5.52 Velocity contours inside a stationary horizontal RFB with
tapered ends showing that presence of low velocity regions
(0 – 0.36 m/s) for mixture inlet velocity of 2 m/s
5.53 Temperature contours of premixed methane/air mixture in a
tapered horizontal RFB operating at 5-g loading (122 RPM)
and mixture inlet velocity of 2 m/s
5.54 Temperature contours of premixed methane/air mixture in a
tapered horizontal RFB operating at 10-g loading (172
RPM) and mixture inlet velocity of 2 m/s
5.55 Temperature contours of premixed methane/air mixture in a
tapered horizontal RFB operating at 15-g loading (211
RPM) and mixture inlet velocity of 2 m/s
5.56 Contours of CO mole fraction during the combustion of
premixed methane/air mixture in a stationary tapered
horizontal RFB (mixture inlet velocity of 2 m/s)
5.57 Contours of CO mole fraction during the combustion of
premixed methane/air mixture in a tapered horizontal RFB
operating at 5-g loading (122 RPM) and mixture inlet
velocity of 2 m/s
5.58 Contours of CO mole fraction during the combustion of
premixed methane/air mixture in a tapered horizontal RFB
operating at 10-g loading (173 RPM) and mixture inlet
velocity of 2 m/s

xxi
5.59 Contours of CO mole fraction during the combustion of
premixed methane/air mixture in a tapered horizontal RFB
operating at 15-g loading (211 RPM) and mixture inlet
velocity of 2 m/s
5.60 Contours of CO/CO2 mole ratio during the combustion of
premixed methane/air mixture in a tapered horizontal RFB
operating at 5-g loading (122 RPM) and mixture inlet
velocity of 2 m/s
5.61 Contours of CO/CO2 mole ratio during the combustion of
premixed methane/air mixture in a tapered horizontal RFB
operating at 10-g loading (173 RPM) and mixture inlet
velocity of 2 m/s
5.62 Contours of CO/CO2 mole ratio during the combustion of
premixed methane/air mixture in a tapered horizontal RFB
operating at 15-g loading (211 RPM) and mixture inlet
velocity of 2 m/s
5.63 CO emission levels in the exhaust gases from the RFB
combustor during the combustion of methane (9.5%
methane in air) at different rotating speeds
5.64 Velocity vectors at the axisymmetric plane of the RFB
during methane combustion (9.5% methane in air, inlet
veloc. = 2 m/s) at different rotating speeds
5.65 Thermogravimetric analysis of rice husk in a reducing
environment (N2) (heating value 10.0oC/min)
5.66 Temperature profile and the conversion of rice husk
particles in a RFB operating at 5-g loading (122 RPM) and
500oC
5.67 Temperature profile and the conversion of rice husk
particles in a RFB operating at 5-g loading (122 RPM) and
600oC
5.68 Temperature profile and the conversion of rice husk
particles in a RFB operating at 5-g loading (122 RPM) and
700oC

xxii
5.69 Effect of combustor operating temperature [RFB @ 5-g
loading (122 RPM)] on the combustion reaction time of
rice husk particles
5.70 Temperature profile and the conversion of rice husk
particles in a RFB operating at 10-g loading (173 RPM)
and 700oC
5.71 Temperature profile and the conversion of rice husk
particles in a RFB operating at 12.5-g loading (192 RPM)
and 700oC
5.72 Temperature profile and the conversion of rice husk
particles in a RFB operating at 15-g loading (211 RPM)
and 700oC
5.73 Effect of combustor rotating speed (RFB @ 700oC) on the
combustion reaction time of rice husk particles

xxiii
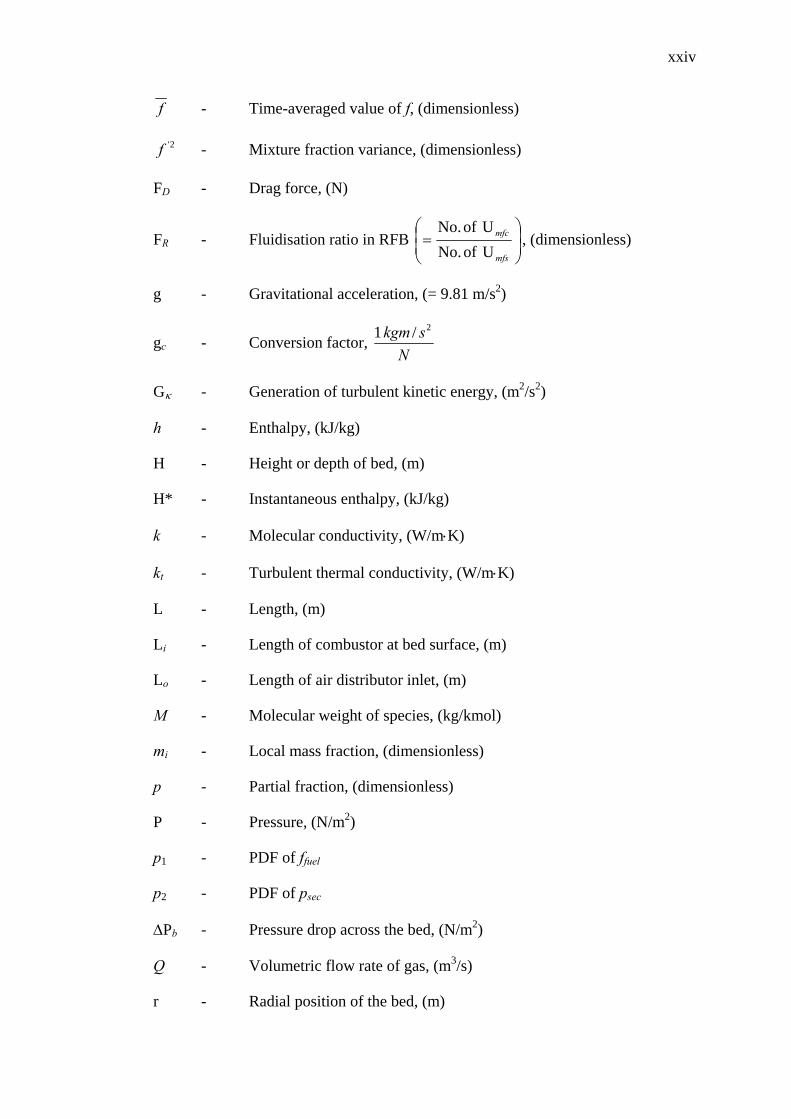
LIST OF SYMBOLS
A - Empirical constant in Magnussen and Hjertager (1976) model, (= 4.0)
Ak - Pre-exponential factor, (1/s)
Ar - Archimedes number ( )
⎟⎟⎠
⎞⎜⎜⎝
⎛ −= 2
3
f
mfpf gdµρρρ
, (dimensionless)
At - Cross sectional area of columnar fluidised bed, (m2)
B - Empirical constant in Magnussen and Hjertager (1976) model, (= 0.5)
C - Molar concentration of each species, (kmol/m3)
CD - Drag coefficient, (dimensionless)
cp - Mixture heat capacity, (kJ/K)
D - Molecular diffusion coefficient in gas phase, (m2/s)
db - Bubble diameter, (m)
Dc - Column diameter, (m)
Di - Gas orifice inlet diameter, (m)
dm, dp - Particle diameter, (mm)
dpi - Arithmetic mean of screen apertures, (mm)
Dvs - Volume-surface mean diameter, (mm)
Ek - Activation energy for the reaction (J/kmol)
f - Mixture fraction, (dimensionless)
xxiv
f - Time-averaged value of f, (dimensionless)
2'f - Mixture fraction variance, (dimensionless)
FD - Drag force, (N)
FR - Fluidisation ratio in RFB ⎟⎟⎠
⎞⎜⎜⎝
⎛=
mfs
mfc
Uof No. Uof No.
, (dimensionless)
g - Gravitational acceleration, (= 9.81 m/s2)
gc - Conversion factor, N
skgm 2/ 1
Gκ - Generation of turbulent kinetic energy, (m2/s2)
h - Enthalpy, (kJ/kg)
H - Height or depth of bed, (m)
H* - Instantaneous enthalpy, (kJ/kg)
k - Molecular conductivity, (W/m⋅K)
kt - Turbulent thermal conductivity, (W/m⋅K)
L - Length, (m)
Li - Length of combustor at bed surface, (m)
Lo - Length of air distributor inlet, (m)
M - Molecular weight of species, (kg/kmol)
mi - Local mass fraction, (dimensionless)
p - Partial fraction, (dimensionless)
P - Pressure, (N/m2)
p1 - PDF of ffuel
p2 - PDF of psec
∆Pb - Pressure drop across the bed, (N/m2)
Q - Volumetric flow rate of gas, (m3/s)
r - Radial position of the bed, (m)

xxv
R - Universal gas constant (J/kmol⋅K)
rc - Radius of viscous core, (m)
rE - Radius of exit port, (m)
Re - Reynolds number ⎟⎟⎠
⎞⎜⎜⎝
⎛=
f
pf Udµ
ρ, dimensionless
ri - Inner radius of the bed, (m)
Ri - Mass rate of creation or depletion by chemical reaction, (kg/m3⋅s)
ro - Outer radius of the bed, (m)
rpf - Interface of the fluidised and packed bed, (m)
Sct - Turbulent Schmidt number, t
t
ρDµ
T - Temperature, (K)
t - Time, (s)
U - Fluidising gas velocity, (m/s)
u - Velocity component or velocity component in x-direction, (m/s)
Ub - Bubble velocity in the bed, (m/s)
ui - Time average velocity component, (m/s)
'iu - Fluctuating component of ui, (m/s)
'iu - Instantaneous velocity component, (m/s)
Umf - Minimum fluidisation velocity, (m/s)
Umfc - Critical minimum fluidisation velocity, (m/s)
Umfs - Surface minimum fluidisation velocity, (m/s)
Uo - Superficial gas velocity or fluidising gas velocity at the distributor,
(m/s)
ut - terminal velocity, (m/s)
v - Velocity component in y-direction, (m/s)

xxvi
w - Velocity component in z-direction, (m/s)
W - Weight of the bed, (N)
x - Coordinate or tapering height, (m)
X - Height of tapering, (m)
xi - Mass fraction of the i-th size range in the particles screen analysis,
(dimensionless)
y - Coordinate, (m)
z - Coordinate, (m)
Greek Letters
αε - Inverse effective Prandtl number for turbulent dissipation rate,
(dimensionless)
ακ - Inverse effective Prandtl number for turbulent kinetic energy,
(dimensionless)
αs - Swirl constant, (dimensionless)
δ - Empirical constant, (dimensionless)
ε - Turbulent dissipation rate, (m2/s3)
ε, εmf - Bed voidage, (dimensionless)
iφ - Instantaneous species concentration, density or temperature,
(kmol/m3, kg/m3 or K)
φs - Particle sphericity, (dimensionless)
γ - Cone angle, (o)
η - Rate exponent in Arrhenius equation, (dimensionless)
κ - Turbulent kinetic energy, (m2/s2)
µ - Dynamic fluid viscosity, (kg/m⋅s)
µf - Fluid viscosity, (kg/m⋅s)

xxvii
µt - Turbulent viscosity, (kg/m⋅s)
0tµ - Turbulent viscosity for high-Reynolds-number limit
⎟⎟⎠
⎞⎜⎜⎝
⎛=
εκρ
2
0845.0 , (kg/m.s)
θ - Tapering angle, (o)
ρ - Density of gas, (kg/m3)
ρb - Bulk density, (kg/m3)
ρf - Fluid density, (kg/m3)
ρp - Particle density, (kg/m3)
ω - Angular velocity, (rad/s)
Ω - Swirl angular velocity, (rad/s)
Ωc - Characteristic swirl number, (dimensionless)
Subscripts
i - i-direction or chemical species i
j - j-direction or chemical species j
k - k-direction or chemical species k
t - Turbulent conditions
P - Product
R - Reactant
m - Mixture
fuel - Fuel
sec - Secondary fuel

xxviii
Abbreviation
CFD - Computational Fluid Dynamics
ID - Inner Diameter
PDF - Probability Density Function
RFB - Rotating Fluidised Bed
RPM - Revolution per minute

xxix
LIST OF APPENDICES
APPENDIX TITLE
A Tender document for the design, development, supply, delivery, installation and commissioning of a novel spinning fluidised bed
xxx
LIST OF ATTACHMENTS
ATTACHMENT TITLE
I Video footage of the test runs on the developed SFB combustor system
II Video footage of the delivery of the SFB combustor system
to Universiti Teknologi Malaysia III Papers presented at seminars/symposiums under the
research fund IV User’s manual for the SFB combustor system

CHAPTER I
INTRODUCTION
1.1 Purpose of Research
The purpose of this research is to design and develop a prototype of the
novel horizontal spinning fluidised bed (SFB) combustor.
1.2 Introduction to Spinning Fluidised Bed
High heat and mass transfer rates, temperature homogeneity and high
flowability of particles with which fluidised bed is widely known for, are important
features for continuous operating, large-scale solid reacting systems. As such, this
technology has wide applications in many industrial processes, such as fluidised
cracking catalyst (FCC) and fluid coking (Chen, 1987). However, most of these
processes are limited to the use of vertical fluidised beds.
As the aeration rate is increased in a vertical fluidised bed to a point where
the gravitational force on the particles is balanced off by the fluid drag exerted by
the interstitial gas flow, the particles start to fluidise. One significant drawback of
this system is that upon the introduction of a large excess amount of aeration, the gas
forms large bubbles or slugs that rise through the bed in rapid succession. This
extensive bypassing of gas results in poor gas-solid contact. This is where the

2
relatively new concept of centrifugal or spinning fluidised bed came into play. It has
the advantage of higher gas throughput, a significant feature in coal combustion and
drying where a high superficial velocity is desirable.
A centrifugal fluidised bed is a cylindrical bucket rotating about its axis of
symmetry, as can be seen from Figure 1.1. The centrifugal force causes the
fluidisation materials to impact the wall, which serves as the gas distributor.
Fluidising gas is introduced in the inward direction of the radius through the porous
or perforated wall. The main adjustable parameter in a centrifugal fluidised bed is
the body force that is largely determined by the rotation speed and the bucket radius.
This is in contrary with the presence of only the fixed gravitational force in a vertical
fluidised bed. When the drag force exerted by the fluidising medium is equal to the
effective weight of the particles in the centrifugal field, the particles start to fluidise.
The rate of gas flowing through the bed can be increased proportionally to the g-
level produced by the rotation. Thus, the bed particles are able to withstand a large
amount of aeration without serious formation of bubbles by using a strong
centrifugal force much greater than gravity. Consequently, gas-solid contact at high
aeration rate is improved. The intensely turbulent intimate mixing between particles
and fluid in a SFB is beneficial to gain a high combustion efficiency (Wong et al.,
2000).
1.3 Justification and Objectives of Research
The novel technology of SFB has a good potential in the incineration of
waste materials such as sludge with high combustion efficiency, flexible waste
throughput and satisfactory flue gas emissions. However, as reported by Rozainee
(1998) in his studies on sludge incineration in a vertical SFB, the combustor has
several weaknesses which could be overcome by projecting it on a horizontal axis.
These weaknesses include non-uniform fluidisation in the axial and radial directions,
as well as problems associated with feeding and ash accumulation inside the
combustor. Hence, the purpose of this research is to design a prototype of the novel
horizontal SFB combustor (Figure 1.2) that is capable of overcoming the inherent

3
drawbacks in a vertical SFB. The base case design of the proposed horizontal SFB is
based on using rice husk as the feed material. Nonetheless, once developed, the
application of the prototype could be extended to other types of waste materials.
Rice husk was chosen as the basis for the design of the prototype SFB due to
the huge amount generated from rice milling processes. Up to August 2001, the
annual paddy output was reported to be 2.14 million tonnes (Department of
Statistics, Malaysia) and considering rice husk accounted for 22% of this value, the
amount of rice husk generated was approximately 0.47 million tonnes. Left to rot
slowly in the field or burnt in the open, these practices clearly pose serious
environmental problems. Rice husk, having a calorific value of 13 MJ/kg, is a good
renewable energy source. Apart from solving its disposal problems, combustion
offers the potential for energy recovery from this waste. In addition, the resulting ash
has high commercial value due to its very high silica content (> 95%) (Huang et al.,
2001). However, since most rice mills operate as small-scale industries, application
of permanent combustion systems for energy recovery and disposal purposes is not
cost effective. Therefore, the need arises to develop a small scale waste incineration
system to cater for such situations without tolerating in terms of combustion
efficiency and pollution emissions. The proposed SFB prototype has the potential to
fit into these requirements due to its compact design, relatively shorter start-up time
and versatility in handling different types of wastes at different operating conditions.
The objectives of this research are:-
a) To determine the optimum combustor geometry that could overcome the
weaknesses associated with a vertical SFB, such non-uniform axial and
radial bed fluidisation, ash accumulation and feeding problems,
b) To investigate the behaviour of the proposed combustor with regard to fluid
flow profiles, particle trajectories, and gas-phase and solid particles
combustion characteristics at various operating conditions through CFD
modelling,

4
c) To determine the suitable operational range for cold and hot commissioning
on the proposed system, such as rotating speeds, air feed rates and combustor
temperatures, and
d) To investigate the limitations on the proposed system and ways to overcome
them.
1.4 Scopes of Research
To achieve the objectives outlined in Section 1.3, the scopes of this research
are as follows:-
a) To determine the optimum design parameters, such as sand size for use in
design calculations, operating temperature range, rotating speed, bed
thickness, fluidising air feed rate and rice husk feed rate to be used in sizing
up the horizontal SFB,
b) To determine the optimum combustor dimensions, such as diameter, length
and incorporation of any innovative features to eliminate the reported
weaknesses in a vertical SFB,
c) To investigate the fluid flow profiles, ash entrainment behaviour, gas-phase
combustion and rice husk particle combustion in the developed SFB
prototype through CFD modelling with the commercial CFD code of
FLUENT,
d) To determine the optimum operating parameters for combustion of rice husk
in the SFB prototype, such as operating temperature, rotating speed, air input
and feeding rate,
e) Fabrication of the proposed design of the novel horizontal SFB prototype
combustor,
f) Trial runs on the developed SFB prototype to determine its operability, and
g) To investigate the weaknesses in the proposed design of the developed SFB
prototype and to propose design improvements based on results from CFD
modelling and trial runs on the combustor.
5
1.5 Expected Outputs
The outputs expected from this research are:-
a) A prototype rig of the novel horizontal SFB combustor,
b) The optimum operating parameters for combustion of rice husk in the
proposed prototype, and
c) Design improvements on the developed prototype to enhance its performance
for future experimental works involving combustion of waste materials.
1.6 Layout of the Report
This report describes the research work to design and develop a novel
horizontal SFB for combustion of biomass wastes such as rice husk. This work
includes the design procedures for a prototype of the SFB and the investigation of its
hydrodynamics features through computational fluid dynamics modelling. The
applications of the proposed system in gaseous and solids combustion are also
conducted through modelling studies to investigate their combustion characteristics.
Chapter 2 reviews the fundamental theories of fluidisation in a conventional
fluidised bed before extending to the more complex fluidisation theories in a SFB.
This chapter also discusses the advantages of the proposed horizontal SFB over the
vertical SFB and conventional fluidised bed.
Chapter 3 includes the methodology to study the properties of rice husk as
feed and sand granules as bed media for use in sizing up the prototype SFB. The
results from the determination of rice husk and sand granules properties that will be
used in the design and modelling studies are also included.
Results obtained from the research are discussed in three stages (Chapter 4 to
Chapter 6) owing to the wide scope of research works involved, which include

6
engineering design calculations, computational fluid dynamics modelling and
commissioning of the developed horizontal SFB prototype.
Chapter 4 presents the procedures to perform design calculations in the
course of determining the geometry of the proposed horizontal SFB. Discussions on
the reasons for choosing certain dimensions and operating parameters for the
proposed combustor are also included.
Chapter 5 deals with computational fluid dynamics studies on the proposed
novel horizontal SFB carried out in a three-dimensional frame. Flow behaviours,
particle trajectories and combustion characteristics of gaseous mixture and rice husk
particles in the proposed system are investigated at different combination of air feed
rates, rotating speed and combustor temperatures. Also included in this chapter are
the discussions on the recommendable operational ranges and modifications for the
current combustor design.
Chapter 6 provides discussions on the trial experimental runs on the
prototype SFB combustor carried out at the fabricator’s premises. Included in this
chapter are visuals (photos and video clips), detailed technical specifications and
manuals for operating the developed SFB prototype.
Chapter 7 gives the conclusion derived from this study and proposes some
recommendations for future studies on the developed prototype of the horizontal
SFB.

CHAPTER II
LITERATURE REVIEW
2.1 Advantages of Rotating Fluidised Bed
Performance of a SFB has been investigated by Takahashi et al. as early as
1984. Lately, this technology is gaining increasing research interests, mainly due to
the various advantages it offers in comparison with the conventional fluidised bed
technology, such as:-
a) By changing the rotating speed of the bed, the minimum fluidising velocity
can be achieved at almost any gas flow rate. Thus, fluidisation of particles at
a desired gas flow rate can be controlled by adjustments of the rotational
speed of the cylinder. It is termed versatile due to its ability to burn different
type of wastes, which may require a different rate of fluidising air. A higher
turndown ratio can also be achieved as this feature allows the incinerator to
accommodate different rate of waste feeding.
b) The SFB can accommodate a much higher gas flow rate per unit area of the
distributor than is possible in a conventional fluidised bed that operates only
against the force of gravity by the use of a strong centrifugal field. Serious
formation of large bubbles can be suppressed by increasing the rotating
speed of the cylinder in conjunction with the fluidising gas flow rate.

8
c) The absence of gravitational field or the presence of rocking motion will not
affect the operation of the SFB. Therefore, it can be utilised in spacecrafts,
ships, trains and trucks where the application of conventional fluidised bed is
difficult, if not impossible.
d) Due to the cylindrical geometry and small surface area of the distributor, the
size of the SFB is much smaller and more compact than the conventional
fluidised bed.
e) Relatively shorter start-up time as compared to the conventional fluidised
bed.
f) Higher combustion intensity. The throughput and therefore the combustion
intensity varies approximately as the square-root of the g-loading and is thus
proportional to the RPM. Hence, operating the SFB at about 100-g would
give a combustion intensity of the order of 100 MW/m3, which is almost an
order of magnitude higher than a conventional fluidised bed (Swithenbank et
al., 1997). Operating at higher rotational speed led to higher combustion
intensity as depicted in Figures 2.1 – 2.2 generated using CFD (Rozainee,
1998). Nonetheless, in the combustion of waste such as sewage sludge, the
rotating speed is operated at a relatively low g level (ranging from 5- to 20-g
loading) to give a more modest pressure drop across the bed.
g) Higher combustion efficiency. The intensely turbulent intimate mixing of
feed particles and air in the rotating fluidised bed has led to combustion
efficiency in the excess of 99% as claimed by Metcalfe and Howard (1977).
Conventional solid waste incinerators, in comparison, typically achieve
combustion efficiency only in the vicinity of 93 – 95% (Houthon, 1993).
High combustion efficiency is crucial for the improvement in ash quality as
well as reduction in the amount of pollutants by minimising dioxin/furan
emissions.
h) Ability to accommodate larger-sized solid fuel particles. Capital investment
and energy consumption required for size reduction during the feed pre-

9
treatment stage are thus reduced. Efforts for removing fines and ashes from
the exhaust gas is minimised as well (Fan, 1978).
i) Good combustion performance achievable with small particles. Broughton
(1975) found that stable combustion was impossible to be sustained within a
shallow fluidised bed of silica sand of particle sizes less than 246 µm.
Radiative heat loss in a shallow fluidised bed is significantly larger than that
of a SFB due to its higher geometrical viewfactor. Consequently, as the heat
retained in a SFB is higher, the length of the preheat and reaction zones is
shortened, thereby reducing the possibility of gas bypassing the bed.
However, there are several limitations to the vertical SFB technology. Non-
uniformity in axial bed thickness and radial fluidisation, as well as feeding problems
are inherent in the vertical SFB, as shown by Rozainee (1998) in his studies. The
horizontal SFB technology offers the potential to solve these problems. It is a
variation from the vertical SFB technology whereby the cylindrical bucket is
rotating about a horizontal axis of symmetry instead of a vertical one.
2.2 Advantages of Horizontal SFB
The horizontal SFB offers numerous advantages over the vertical SFB,
which makes it an important field of study. Important advantageous features of the
horizontal SFB are outlined in the following sections.
2.2.1 Uniform Axial Bed Thickness
The inner free surface of the bed in a vertical SFB operating at low rotational
speeds will tend to take the shape of a paraboloid of revolution. At high rotational
speeds, the bed is almost a cylindrical annulus (Levy et al., 1978; and Demircan,

10
1979). This is explicable by the fact that at low rotational speeds, the net centrifugal
force acting on the bed particles could not overcome the force of gravity, hence
causing the particles to accumulate near the bottom of the cylinder. This will lead to
a non-uniform axial bed fluidisation as the bed is thin at the top and thick at the
bottom. With lower resistance to air flow, the thinner bed fluidises first although the
bottom of the bed may still remain packed. Increasing the fluidising air velocities in
an attempt to fluidise the whole length of the bed might result in an excessive
elutriation of particles from the top end. The horizontal SFB, on the other hand,
produces uniform axial bed thickness. The same types and magnitudes of forces act
on the particles for the whole length of the bed, resulting in uniform axial bed
thickness.
However, the net force of the centrifugal and gravitational acceleration
acting on the bed particles at the upper section is higher than at the lower section.
The particles from the upper section of the horizontal SFB might fluidise first.
Nonetheless, due to the rotating effect, bed particles at both the upper and lower
section of the SFB are changed constantly. Consequently, most of the bed particles
in the horizontal SFB will fluidise although the circumferential bed fluidisation
varies.
2.2.2 Uniform Radial Bed Fluidisation
Non-uniform radial bed fluidisation is typical of the SFB due to the curvature
effect. Complete bed fluidisation cannot be achieved at one fluidising velocity in a
SFB as opposed to the conventional fluidised bed. The difference in fluidisation
velocities for surface fluidisation (Umfs) and complete fluidisation (Umfc) increases as
the bed thickness is increased. Therefore, severe elutriation of particles from the bed
surface might result as the fluidising velocity is increased to achieve complete
fluidisation in a thick bed. These problems could be overcome by tapering the end
walls of the horizontal SFB in order to achieve complete fluidisation of the bed
materials at one fluidising velocity. With a tapered bed, the fluidising velocities
could be made to increase with the bed radius so that they could match the

11
centrifugal force, which also increased with the bed radius. FR (the ratio of
fluidising velocity near the SFB wall to the fluidising velocity at the bed surface)
could be manipulated to reach a value of near unity, depending on the angle of the
tapered ends as the cross sectional area at the surface is larger than at the wall.
Thus, with a particular air flow rate, the fluidising velocity is decreased as the air
flows radially inward.
2.2.3 Feeding Problems in a Vertical SFB
A vertical SFB has an exhaust gas outlet at the top which doubles as the feed
inlet. The limited opening area and strong upward velocity of effluent gases rushing
out of the combustor posed serious feeding problems especially when the throughput
rate is high. The horizontal SFB eliminates these problems as one end of the
combustor will accommodate waste feeding while the exhaust gas exits at the other
end.
2.2.4 Ash Accumulation
Rice husk waste contains approximately 20% of ash (Mokhtar et al., 1986).
Continuous incineration of rice husk therefore will lead to significant ash
accumulation. In order to maintain a constant bed thickness, the ash has to be
removed. This is possible in a horizontal SFB by use of a weir plate. It is expected
that once the bed thickness exceeds the weir plate lip due to ash accumulation, the
bed materials from the bed surface will spill out. Ash particles have a lower density
than that of sand particles, thus the ash particles tend to accumulate above the bed of
sand particles. This is favourable, as most of the spillover particles will comprise
mainly of the unwanted ash particles.

12
2.2.5 Potential to Control Particulate Emissions
The inclusion of a secondary chamber in the horizontal SFB, besides
allowing for complete combustion of released volatiles and escaped unburnt
particles, also functions as a particulate control device. The particulates in the flue
gas are impacted to the wall of the combustor by the centrifugal force due to the
rotating action of the combustor. The wall of the secondary chamber will
accommodate some drilled holes to allow for the escape of the particulate materials.
These particles will eventually be collected in an ash pit.
2.2.6 Possible Enhanced Mixing
The presence of the tapered ends at the horizontal SFB walls might cause the
bed materials to exhibit spouting behaviour as observed in a spouted bed. This is
justified by the fact that the tapered sections have varying cross sectional areas
which is not dissimilar to that in a spouted bed. Khoshnoodi and Weinberg (1978)
explained that the ratio of column to gas orifice inlet diameter is usually in the order
of 10. At one point, the ratios of the cross sectional area at the bed surface to that at
the combustor wall might reach the magnitude of 10. When enough air is introduced
into the system, the column of bed materials with a cross sectional area similar to
that of the bottom of the tapered end might be lifted up by the entering air. This
signifies the onset of bed spouting behaviour which offers better mixing and heat
circulation (Mathur and Gishler, 1955) as compared to conventional fluidisation.
This phenomenon, coupled with the rapid mixing in the rotating fluidised bed, will
significantly enhance the rate of particles mixing in the combustor. The direct
beneficial effect of this is the increase in combustion efficiency in the horizontal
SFB with tapered ends.

13
2.3 Unique Advantages of the SFB Freeboard
A very important feature of the SFB is that the gases are imparted a
tangential velocity component (Figure 2.3) which accelerates due to the conservation
of momentum as the gases converge towards the exit. A swirling flame of volatiles
and CO emitted from the bed is therefore formed at the exit of the chamber. Both
experimental and modelling studies by Rozainee (1998) showed that the swirling
effects in the SFB freeboard resulted in a very efficient secondary combustion
process, and higher rotating speeds increased the efficiency of gas phase combustion
and the residence time of particles in the SFB freeboard. The intense gas mixing
which occurs in the shear layers of such burner resulted in a much higher freeboard
combustion intensity than is encountered in the freeboard of a static fluidised bed.
Furthermore, the effects of rotation caused the sand particles from the surface of the
bed to be returned to the bed. The huge freeboard, which is necessary to separate
elutriated particles and complete the gas phase combustion in a conventional
fluidised bed, is not necessary with a SFB.
2.4 Fluidisation
2.4.1 Fluidisation in a Conventional Vertical Fluidised Bed
The unit operation fluidisation is typified by the passage of a gas through a
packed bed of particles supported by a gas distributor such as a perforated or porous
plate. Due to the loss of mechanical energy brought about by the friction of the gas
flowing past the particles, a pressure drop over the bed height is observed. This
pressure drop rises in proportion with the increasing gas flow rate until it reached a
point where its value equals the net weight of the particles per unit cross sectional
area of the bed. This signifies the onset of fluidisation and the bed is said to be
‘incipiently’ fluidised. Beyond this point, the bed can in principle be lifted by the
gas flow.

14
The broad sequence of events that occurred in a bed of particles as the gas
flow rate is increased progressively from zero is depicted in Figure 2.4. Initially, no
changes in the appearance of the bed can be observed while the pressure drop rises
with flow rate, until it reached a maximum value at the point of incipient
fluidisation. Further increase in gas velocity will ‘unlock’ the fixed bed. This
literally means that there will be a slight decrease in pressure drop as the voidage
increases from εm ke εmf. The pressure drop will not increase further upon increasing
the velocity beyond the minimum fluidising velocity (Umf). The bed expands to
accommodate the extra gas flow at first until at some point, bubbles or particle-free
cavities are formed among the particles. These bubbles will then rise through the
bed, bursting when they reach the free surface. Particles are scattered into above the
bed region, from where they fall back to the bed. As a consequence, the bed exhibits
two phases, the bubble and particulate (continuous) phase.
Uniformity of the bed temperature and composition is thereby promoted by
the bubbling action, which causes the particles to mix continuously. Nevertheless,
this action can also lead to undesirable excessive bypass of unreacted fluidising gas.
Some particles will be entrained in the gas leaving the bed at sufficiently high
fluidising velocity. Progressive entrainment of particles proceeds with further
increase in fluidising velocity and the bed pressure drop is reduced until eventually,
all particles are blown out of the vessel.
The Ergun equation (1952) gives the pressure drop over the incipiently
fluidised bed.
m
f
m
fb UUd
) - 1(75.1 )d
) - 1(150LP
s
2
2s
2
φ
ρ
εε
+(φ
µ
εε
=∆
33 (2.1)
The value of dm referred to volume-surface mean diameter (Botterill et al., 1982).
From the definition of Umf, the minimum fluidisation occurs when;
(drag force by upward moving gas) = (weight of particles) (2.2)

15
gg ) -( ) - 1(LAWAP
cfpmfmftt b ρρε==∆ (2.3)
Re-arranging, we have;
c
fpmfmf
b
gg ) -)( - 1(
LP
ρρε=∆
(2.4)
Combination of Equations (2.1) and (2.4) results in:
222
3
3
d) - 1(75.1
d) - 1(
150 d g ) -(
2322 µ
ρ
εφε
+µ
ρ
εφ
ε=
µ
ρρρ
f
mmff
mfsf
mmff
mfs
mf
f
mfpf UU (2.5)
The left hand side of Equation (2.5) is a dimensionless group known as the
Archimedes Number, Ar:
2µ
ρρρ=
f
mfpfAr d g ) -( 3
(2.6)
The Reynolds Number at incipient fluidisation is defined as:
d
Ref
mmffmf
Uµ
ρ= (2.7)
Thus, at minimum fluidising velocity,
23 Re) - 1(75.1Re
) - 1(150 mf
mfsmf
mfs
mfArεφ
ε+
εφ
ε= 32 (2.8)
Wen and Yu (1966) noted that, for their particular range of materials,

16
0.11) - 1(
≈εφ
ε32mfs
mf and 1413 ≈
εφ mfs
Inserting these values into the Ergun equation and solving for the positive root of
Remf,
Remf = (33.72 + 0.0408 Ar)1/2 – 33.7 (2.9)
In theory, Equation (2.8) can be used to calculate the minimum fluidising
velocity Umf expressed in terms of Ar and Remf, provided accurate values of εmf and
dm can be obtained. However, the problems associated with the determination of the
properties of particles add to the complexity of the prediction of fluidising velocity.
Variation of εmf for particles in different size ranges with bed temperature can be
very unpredictable. Particles in the size ranges of 40 – 500 µm and density range of
1400 – 4000 kg/m3 (Geldart-B particles) have εmf values that vary with temperature
in a highly complex manner and are not easily predictable, as shown by Botterill et
al. (1982). On the contrary, dense and larger particles (Ar ≥ 26 000 and Remf ≥ 12.5)
did not seem to show an increase in εmf with bed temperature (Botterill et al., 1982).
In determining the minimum fluidising velocity, the best procedure is to
make a direct experimental measurement of pressure drop across the bed at
gradually decreasing gas velocity (Howard, 1989). This value of Umf can be
different from that obtained if the gas velocity is increased instead as the latter will
result in hysteresis loops in the pressure drop versus gas velocity plot. Umf is defined
as the intersection of the fixed pressure drop line with the (W/At) or horizontal line
in the plot similar to that of Figure 2.4.
2.4.2 Fluidisation in a SFB
One important criterion of the rotating fluidised bed is that the granules in
the cylinder are gradually fluidised layer by layer from the free surface outward at

17
increasing radius as the gas velocity is increased. The aeration corresponding to the
initial fluidisation of the inner surface and the complete fluidisation are termed the
surface fluidising velocity, Umfs and the critical fluidising velocity, Umfc respectively.
Chen (1987) noted that the gas superficial velocity in a SFB is a function of the
position of bed radius, r. Therefore, the fluid drag, centrifugal force and gas inertia
are all functions of position r, and the three forces cannot balance one another at all
levels at one aeration rate. The fluid drag, in conjunction with the superficial gas
velocity, decreases with respect to r ⎟⎠⎞
⎜⎝⎛ =
rLQUπ2
. The centrifugal force, on the
other hand, increases monotonously with respect to r. The system configurations at
different stages of aeration are shown in Figure 2.5.
Theoretical analysis developed by Chen (1987) showed that the pressure
drop in the fixed bed region is given by the following equation:-
32
222
2
21 r
rUr
rrU
rrU
drdP oof
foooo
ερ
ωρ ++⎟⎠⎞
⎜⎝⎛Φ+⎟
⎠⎞
⎜⎝⎛Φ= (2.10)
where
( )( )23
2
11 150
psdφεµε−
=Φ , ( )
ps
f
dφερε
32
1 75.1 −=Φ
This equation is a derivation from the Ergun equation. Meanwhile, the pressure drop
in the fluidised bed region is:-
( )drd
rrU
rrU
rrdrdP oofoof
fpε
ερ
ερ
ωερωερ 22
22
3
2222 1 +++−= (2.11)
It has to be emphasised that the major difference between the present
momentum balance and those reported in the literature is that the voidage is treated
as a variable. Although this assumption leads to additional numerical complexity of
the problem, it is essential in obtaining a good estimation of the overall pressure

18
drop. A considerable change in pressure drop results with just slight changes in
voidage as the first and second drag coefficients, 1Φ and 2Φ are both very sensitive
functions of voidage.
In a practical point of view, both equations (2.10 and 2.11) can be further
simplified. In the fixed bed region (Equation 2.10), the major contribution to the
pressure profile is the drag force per unit volume of fluid, which are represented by
the first two terms on the right hand side. In the fluidised bed region, however, the
major contribution is the total mass of particles (the first term on the right hand side
of Equation 2.11). The remaining terms, including the effect of inertia and variable
porosity, contribute less than 1% of the total pressure drop (Kao et al., 1987) and
thus can be neglected. Hence, in the fixed bed region Equation (2.10) reduces to;
2
21 ⎟⎠⎞
⎜⎝⎛Φ+⎟
⎠⎞
⎜⎝⎛Φ=
rrU
rrU
drdP oooo (2.12)
while Equation (2.11) in the fluidised bed region reduces to;
( )( ) 2 1 ωερρ rdrdP
fp −−= (2.13)
2.4.2.1 The Surface and Critical Minimum Fluidising Velocities (Umfs and Umfc)
The fluidising phenomenon in a SFB varies significantly from that of a
conventional vertical fluidised bed, which is completely fluidised at a certain
aeration rate. The SFB fluidise layer by layer from the inner surface outward. The
inner surface of the bed will first experiences fluidisation and the gas velocity at
which this occurs is the surface minimum fluidising velocity, Umfs. Its value can be
calculated by equating the local pressure drop across both the fluidised and packed
bed using Equations (2.12) and (2.13) evaluated at r = ri. A quadratic equation
results;

19
( )( ) ( )[ 0 1 212
22 =−−−Φ⎟⎟
⎠
⎞⎜⎜⎝
⎛+Φ⎟⎟
⎠
⎞⎜⎜⎝
⎛ωερρ ifp
i
oo
i
oo r
rr
Urr
U ] (2.14)
Solving for Uo (positive root);
( )( )
2
2
22
2
2
11
2
1 4
Φ⎟⎟⎠
⎞⎜⎜⎝
⎛
−−⎟⎟⎠
⎞⎜⎜⎝
⎛Φ+⎟⎟
⎠
⎞⎜⎜⎝
⎛ Φ+⎟⎟
⎠
⎞⎜⎜⎝
⎛ Φ−
=
i
o
ifpi
o
i
o
i
o
o
rr
rrr
rr
rr
Uωερρ
(2.15)
where Uo = Umfs.
The critical fluidising velocity, Umfc (the velocity at which the whole bed is
fluidised) can be calculated in a similar manner by use of Equation (2.12) and (2.13)
evaluated at r = ro. The positive root obtained for Uo is;
( )( )2
22
211
2
1 4
Φ
−−Φ+Φ+Φ−=
ωερρ ofpo
rU (2.16)
where Uo = Umfc in this case.
The bed porosity (ε ) to be used in both calculations is the bed voidage at the
packed condition ( oε ).
The difference between Umfs and Umfc increases with the depth of the particle
bed. Thus, in an extremely shallow bed where ri ≈ ro, these two velocities are
indistinguishable (Umfs ≈ Umfc). The indication of this is that the conventional
concept of fluidisation at one aeration rate still holds for a SFB with a shallow bed.

20
2.4.2.2 Pressure Drop
Two types of pressure drop versus superficial gas velocity were reported in
the literature. As shown in Figure 2.6, one exhibits a plateau (Metcalfe and Howard,
1977) while the other a maximum (Fan et al., 1985). Based on theoretical studies in
which particle loss due to elutriation was unaccounted for, Chen (1987) proposed
that the pressure drop should reach a plateau after the critical minimum fluidising
velocity. The condition whereby flattening of the pressure drop curve beyond the
minimum fluidising velocity occurs, is similar to that of conventional fluidised beds.
The fundamental difference between a SFB and a conventional fluidised bed
could be established through the observation of their pressure drop profiles.
Regardless of whether the pressure drop exhibits a plateau or a maximum, the fact
that fluidisation in a SFB occurs layer by layer resulted in the absence of hysteresis
loops. Nevertheless, the definition of the intersection of the extrapolations from the
region of fixed bed and fluidised bed as the minimum fluidising velocity, used in
conventional fluidised beds, still holds for SFB. A number of studies have adopted
this approach, such as Demircan et al. (1978) and Takahashi et al. (1984).
Bed thickness has significant influence on the pressure drop profile in the
SFB due to the layered fluidisation phenomenon. This has led to further studies by
Kao et al. (1987). It was found that beyond the critical minimum fluidising velocity,
the pressure drop reached a plateau for thin beds, but a maximum for thicker beds
(Figure 2.7). Umfc is much higher than Umfs for thicker beds. Therefore, at Umfc, the
drag force is higher than the centrifugal force at the bed surface. As a consequence,
the drag force of the air continuously carries particles at the surface out of the bed,
until a point is reached where it is balanced off by the centrifugal force of the
remaining particles. As described by Takahashi et al. (1984) and Fan et al. (1985),
the pressure drop curve for thick beds exhibits a maximum as opposed to a plateau
observed in thin beds. This could be attributed to the loss of particles due to
elutriation in thick beds, which reduces the effective weight of the particles, hence
the corresponding decrease in pressure drop.

21
Depending on the superficial velocity, Uo (based on the outside radius, ro),
the pressure drop across the bed could be determined at different stages of
fluidisation.
Case I: Uo < Umfs
The whole bed remains packed at this stage since the superficial air velocity, Uo is
less than the surface minimum fluidising velocity, Umfs. Using Equation (2.12), the
pressure drop is calculated as;
⎟⎟⎠
⎞⎜⎜⎝
⎛−Φ+⎟⎟
⎠
⎞⎜⎜⎝
⎛Φ=∆
oioo
i
ooo rr
rUrr
rUP 11ln 2221 (2.17)
Equation (2.17) is applicable for the evaluation of ∆P at Umfs by replacing Uo with
Umfs.
Case II: Umfs < Uo < Umfc
At this stage, the bed is partially fluidised. Thus, the pressure drop is a combination
of pressure drop for the packed bed and the fluidised bed;
( ) ( ) ( ) ⎟⎟⎠
⎞⎜⎜⎝
⎛−Φ+⎟
⎟⎠
⎞⎜⎜⎝
⎛Φ+−−−=∆
opfoo
pf
oooipffp rr
rUrr
rUP 11ln 1 2221
222 ρρωρρε (2.18)
where rpf is the interface of the fluidised and packed beds and can be calculated by
equating Equations (2.12) and (2.13) at a certain gas velocity, Uo.
Case III: Uo ≥ Umfc
This is the stage where the bed is completely fluidised. The bed pressure drop is the
effective weight of the bed and is calculated by using Equation (2.13);
( ) ( ) ⎟⎟⎠
⎞⎜⎜⎝
⎛ −−−=∆
2 1
222 io
fprrP ωρρε (2.19)

22
2.5 Physical Properties of Sand Granules
Particle fluidisation depends largely on the properties of the fluidising
materials. Generally, good media properties include high resistance to attrition,
thermally stable in the operational temperature range, generate acceptable pressure
drop and has a combination of particle density, size distribution and shape which
gives good fluidising characteristics. Utilisation of sand as the bed media in
fluidised bed combustors is commonplace, as it possessed all of the properties as
mentioned above.
Physical properties such as particle size, size distribution, density, bed
voidage and sphericity have significant influence on the fluidisation of particles.
2.5.1 Particle Size and Size Distribution
One fixed value of diameter does not exist for materials with irregular sizes.
Instead, a mean diameter, which could well represent the size distribution of the
materials, is more appropriate for such condition. There are different types of mean
diameter to characterise the size distribution of irregular materials, and each differs
from the other based on different definitions used (McCabe et al., 1993). The
weight mean diameter is often used, as given by the equation below:-
Weight mean diameter, Dw = (2.20) ∑=
n
ipiiDx
1
However, for fluidisation studies, the volume-surface mean diameter (Botterill et al.,
1982) is to be used.
Volume-surface mean diameter, Dvs = ∑
=
n
ipii Dx
1)/(
1 (2.21)

23
where
xi = mass fraction
Dpi = arithmetic mean diameter of screen apertures
2.5.2 Bed Voidage (ε)
The voidage of a bed of particles, ε, is the ratio of the volume of voids in the
bed to the total volume (voids plus solids) of the bed. Its value is largely dependable
on the shape of particles, particle size distribution (as fine particles tend to fill the
voids between larger particles), the ratio of particle size to bed diameter, particle
arrangement pattern in the bed and size of the bed (different sections in the bed have
different values of voidage). Thus, the practice of voidage prediction from the
geometry of single particles is unreliable. Determination of voidage through
experiments, such as by comparing the bulk density (ρb) of bed particles with the
true density of particle (ρp) (Howard, 1989), gives more reliable measurements.
⎟⎟⎠
⎞⎜⎜⎝
⎛−=
p
b
ρρε 1 (2.22)
2.5.3 Particle Sphericity (φs)
Quantification of a non-spherical particle is given by the sphericity, φs which
is defined as:-
particle theof area surface
particle theas volumesame theof sphere a of area surface=sφ (2.23)

24
Sand particles, being non-spherical, have sphericities ranging from 0.53 to
0.86 (Kunii and Levenspiel, 1991). Brown (1950) observed an inverse relationship
between the bed voidage and particle sphericity (Figure 2.8).
Difficulties in measuring the sphericity of irregular particles has led to
recommendations by Kunii and Levenspiel (1991) and Howard (1989) that the
sphericity be measured from a minimum fluidising velocity experiment. By
measuring the bulk density ρb of a loosely packed bed of particles and particle
density ρp, the voidage at minimum fluidisation (εmf) can be determined using
Equation (2.22). Subsequent calculation of the Archimedes and Reynolds Numbers
(Ar and Remf) are possible, and along with Umf, fluid viscosity µf and density ρf, and
the mean particle diameter dm, they are then substituted into Equation (2.8). The
sphericity φs can then be solved from Equation (2.8).
2.5.4 The Geldart Classification of Particles
Four categories of particle behaviour have been forwarded by Geldart (1972)
based on his observation on bed fluidisation behaviour at ambient conditions. As
shown in Figure 2.9, the classification relates the influence of particle mean size and
particle density to the bed behaviour. The classification, from the smallest to the
largest particles, is described as follows:-
a) Category C
Particles with a mean particle size of less than 30 µm (< 30 µm) or a low density are
included in this category. Fluidisation is extremely difficult because the particles
exhibit greater inter-particle forces than the forces resulting from the action of
fluidising gas. This explains the channelling phenomenon that tends to take place,
where a low resistance channel will form in the bed by the upward moving gas. The
channel will expand in conjunction with the increase in gas velocity and this leads to
non-uniformity in gas distribution in the bed. As a consequence, the bed will not

25
fluidise. Nevertheless, this situation could be overcome by using a rotating
distributor plate. Examples of particles in this category are flour and talcum powder.
b) Category A
The particle sizes in this category ranged from 20 – 100 µm and have a relatively
low density (< 1400 kg/m3). The particles fluidise easily, where fluidisation is
smooth at low gas velocities and exhibits controlled bubbling at high gas velocities,
with the presence of favourable small bubbles. Bed expansion is stable until the
minimum fluidising velocity is reached. However, mixing is limited.
c) Category B
The particle in this size range is characterised by their sandlike properties, with a
size range between 40 – 500 µm and density in the range of 1400 – 4000 kg/m3. In
general, fluidising behaviour for these particles is good with vigorous bubbling
action and bubble enlargement upon reaching the bed surface. Bed expansion,
however, is less stable as compared to Category A particles.
d) Category D
This category includes large (size more than 600 µm) and dense particles.
Fluidisation is difficult for deep bed of these particles. Their behaviour is erratical
and unpredictive, giving large exploding bubbles or severe channelling, as well as
spouting when the gas distribution is uneven. Mixing of particles in this category in
the freely bubbling condition is inferior to those of categories A and B.

CHAPTER III
DETERMINATION OF PARTICLE PROPERTIES
3.1 Measurement of Rice Husk Properties
3.1.1 Proximate Analysis
Rice husk samples obtained from the nearby rice mill in Muar were
subjected to proximate analysis to determine its gross calorific value (GCV) and
contents of moisture, ash, volatile matters and fixed carbon. The American Society
of Testing Materials (ASTM) methods were employed in this study:-
a) Moisture - ASTM D 3173
b) Ash - ASTM D 3174
c) Volatile matters - ASTM D 3175
d) GCV - ASTM D 240 – 76 (1980)
3.1.2 Ultimate Analysis
Ultimate analysis includes the determination of elemental components in the
rice husk samples, such as C, H, N, S and O. The UOP Method 866 – 86
(determination of carbon, hydrogen and nitrogen by oxidative pyrolysis) was
employed. The content of O is found by the differential method, whereby the

27
subtraction of the sum of C, H, N, S and ash will give the amount of O present in the
sample.
3.2 Measurement of the Physical Properties of Sand
Physical properties of sand granules, to be used as the fluidising media, were
studied. Properties to be determined included density, voidage, particle size and
sphericity, all of which have significant effects on particle fluidisation.
3.2.1 Particle Size, Particle Density and Bed Voidage
The commercial silica sand granules marketed as 20/30 sand under the Tyler
Standard Screen Scale has a size range of 600 – 850 µm. Its mean particle diameter,
therefore, is 725 µm. The sand granules were first subjected to screen analysis to
determine its size distribution. Test sieving were carried out in a sieve shaker
manufactured by Pascall Engineering Co. Ltd. Approximately 500 g of sand was
sieved for approximately 30 minutes. The sand was sieved into five size ranges:
0.30 – 0.50 mm, 0.50 – 0.71 mm, 0.71 – 1.00 mm, 1.00 – 1.18 mm and 1.18 – 2.00
mm.
A sand sample was loosely filled in a 100 ml graduated cylinder to give its
bulk volume. The mass of the sand over its bulk volume gave the bulk density of
the sand. The water displacement method was used to determine the particle density
of the sand. The mass of sand divided by the volume of water displaced gave the
particle density of the sand. The voidage was then determined from Equation (2.22).

28
3.2.2 Minimum Fluidising Velocity (Umf) and Particle Sphericity (φs)
Fluidisation studies in a conventional fluidised bed were performed to determine
Umf, which is then used to determine the particle sphericity. The latter parameter,
together with the physical properties of sand determined earlier, is important for
subsequent design calculations.
A small columnar fluidised bed of 80 mm ID made of glass with a
flat perforated distributor plate at the bottom was used to determine the minimum
fluidising velocity, Umf of the sand granules. Hole area of the distributor plate is 3%
of the total plate surface area with each hole having a diameter of 1 mm.
Measurement of bed pressure drop was by means of a water manometer. A
rotameter was used to measure the volumetric flow rate of air supply from the
compressor. The fluidising air was first dried in an air filter to prevent the air
humidity from interfering with the fluidisation process.
Approximately 1 kg of sand was charged into the column, which gave a bed
depth of approximately 16 cm. The bed was initially fluidised in a vigorous manner
in order to break down any packing of the particles. The gas velocity was then
decreased in increments of 10 L/min and the corresponding pressure drop recorded.
For determination of Umf, the pressure drop of the bed was plotted against the gas
velocity. The volumetric flow rates divided by the bed cross sectional area gave the
gas velocities required.
3.3 Properties of Rice Husk and Sand Granules
3.3.1 Properties of Rice Husk
Proximate analysis performed on the rice husk samples (Table 3.1) showed
that they were mainly constituted by volatile matters. Therefore, combustion of rice
husks is predicted to be controlled by volatile-burning, where heat transfer

29
predominates the drying and subsequent de-volatilisation processes. The
understanding of this was crucial in determining the amount of air to be fed into the
combustor. As in this case where pyrolysis occurs, air feed at stoichiometric or
slightly below stoichiometric is favored. Excess air will only extinguished the flame
as pyrolysis is an endothermic reaction.
The elemental components in rice husk, obtained through ultimate analysis
were important for the purpose of mass and energy balances. The results obtained
were in good agreement with reported literature findings (Mokhtar et al., 1986).
These results will later be used in CFD modelling of the combustion of rice husk
particles in the proposed RFB design.
Table 3.1: Rice husk analysis
Proximate Analysis
Moisture
Volatile matters
Fixed carbon
Ash
Gross Calorific Value (MJ/kg)
Ultimate Analysis (dry basis)
C
H
O
N
Ash
Weight %
10.1
64.1
11.1
14.7
13.3
37.8
5.0
40.3
0.6
16.3
Ash accumulation from the combustion of rice husk could be significant and
this could interfere with the fluidisation process in the primary chamber. However,
since the particle density of rice husk ash is 1590 kg/m3, which is approximately
35% lower than the particle density of sand granules (2430 kg/m3), the ash is

30
expected to form a layer above the sand granules. Thus, removal of this ash from
the bed is possible with the inclusion of a weir plate at the primary chamber. Once
the bed thickness exceeds the weir plate lip due to ash accumulation, the top layer of
ash near the bed surface will spill out. Bed thickness in the fluidised bed could
therefore be maintained.
Biomass materials such as rice husk offers the potential of renewable energy
sources with their relatively high GCV (13 MJ/kg) and considering the abundance of
available biomass residues (approximately 20.8 million tonnes) in the country.
Utilisation of such renewable energy resources could contribute to some 10 to 12
percent of the national energy consumption as the potential capacity of biomass-
based power generation is estimated at 700 MW (NSTP, 13 June 2000). In
addition, the growing problems of rice husk disposal in the country (estimated
annual production of 470 kilotons corresponding to the annual paddy output of
2,142 kilotons at 2001, as stated by the Department of Statistics Malaysia) could be
taken care of.
Results from the ultimate analysis on rice husk samples indicated the absence
of chlorine and sulfur. Therefore, combustion of rice husks will not result in the
release of acid gases such as hydrogen chloride (HCl) or sulfur dioxide (SO2).
Preventive measures, such as injection of limestone granules into freeboard region
of the fluidised bed to absorb such gases, are not necessary.
3.3.2 Physical Properties of Sand
3.3.2.1 Particle Size, Densities and Bed Voidage
The physical properties of sand granules were as shown in Table 3.2. The
mean particle diameter was given by the volume-surface mean diameter from screen
analysis.

31
Table 3.2: Physical properties of sand
Physical Properties Values
Size range (µm) 600 – 850
ρb (kg/m3) 1457.8
ρp (kg/m3) 2429.7
ε 0.40
dp mean (mm) 0.672
*cp (J/g • K) 0.8
Note: * Taken from Perry et al. (1997).
These particles fall into Category D according to the Geldart Classification
of particles (Geldart, 1972) with their diameter in the excess of 600 µm. They are
difficult to fluidise and tend to produce large exploding bubbles that lead to severe
channelling and spouting behaviour.
3.3.2.2 Minimum Fluidising Velocity and Particle Sphericity
The value of Umf was found at 0.31 m/s from the pressure drop plot (Figure
3.1). This value is in good agreement with the calculated value of 0.30 m/s from
Equation (2.9) using Wen and Yu constants (1966). Thus, the sphericity of the sand
particles was 0.89. The mean diameter used in the sphericity calculations was the
arithmetic mean diameter as size distribution studies indicated that the sand granules
was mainly constituted by particles in the range of 0.5 – 0.71 mm and 0.71 – 1.00
mm (Table 3.3). Therefore, the arithmetic mean diameter of 0.73 mm was found to
represent the size of the sand granules better than the volume-surface mean diameter
of 0.67 mm. The value of sphericity was found at 0.90 (normal packing) from the
plot developed by Brown (1950) as in Figure 2.8, another good agreement with the
experimental value.
However, one salient feature worth noticing on the value of sphericity
obtained was that it was fairly high compared to the range of sphericities as reported
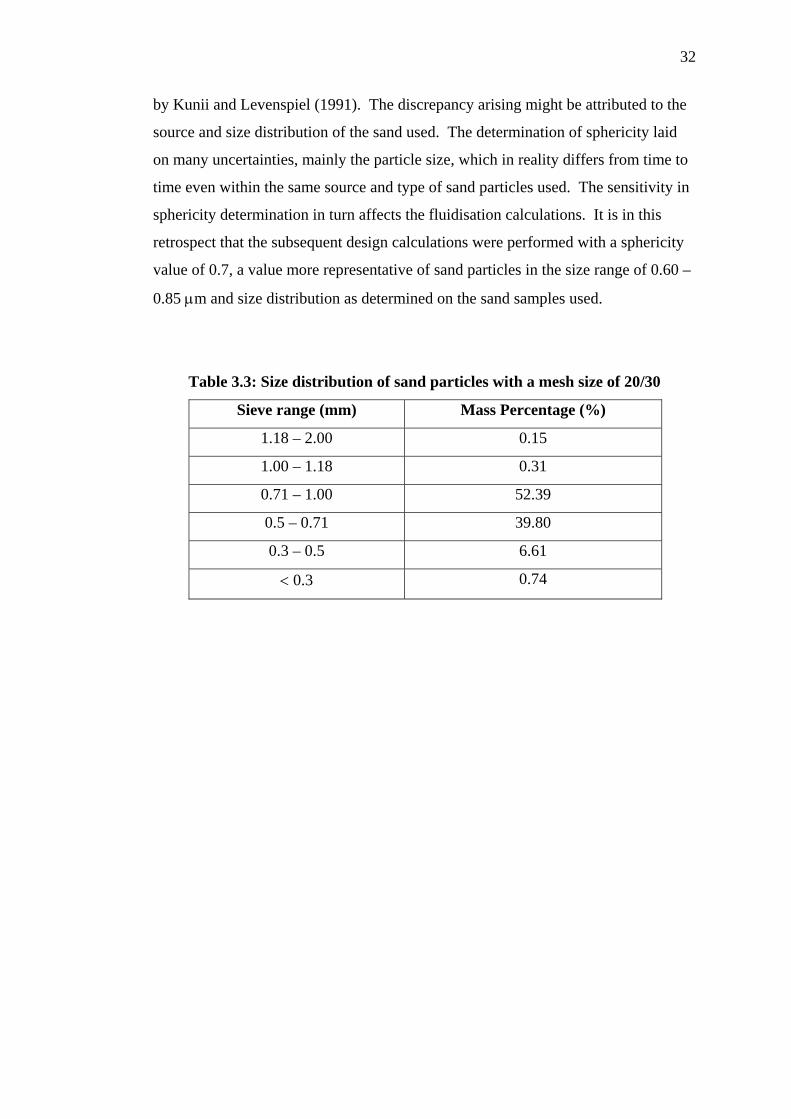
32
by Kunii and Levenspiel (1991). The discrepancy arising might be attributed to the
source and size distribution of the sand used. The determination of sphericity laid
on many uncertainties, mainly the particle size, which in reality differs from time to
time even within the same source and type of sand particles used. The sensitivity in
sphericity determination in turn affects the fluidisation calculations. It is in this
retrospect that the subsequent design calculations were performed with a sphericity
value of 0.7, a value more representative of sand particles in the size range of 0.60 –
0.85 µm and size distribution as determined on the sand samples used.
Table 3.3: Size distribution of sand particles with a mesh size of 20/30
Sieve range (mm) Mass Percentage (%)
1.18 – 2.00 0.15
1.00 – 1.18 0.31
0.71 – 1.00 52.39
0.5 – 0.71 39.80
0.3 – 0.5 6.61
< 0.3 0.74

CHAPTER IV
DESIGN AND DEVELOPMENT OF THE PROTOTYPE HORIZONTAL
SFB COMBUSTOR
4.1 Design of the Horizontal SFB Combustor
The proposed design of the horizontal SFB combustor was aimed at
overcoming the weaknesses inherent in a vertical SFB. These weaknesses include:-
a) Non-uniform axial bed thickness. At low rotational speeds, the bed in a
vertical SFB tends to take the shape of a paraboloid of revolution. Increasing
the fluidising velocity in order to fluidise the thicker bed at the bottom end
results in excessive elutriation of particles from the top of the bed.
b) Non-uniform radial bed fluidisation. Due to the curvature effect, complete
fluidisation cannot be achieved at one fluidising velocity in a SFB. The ratio
of Umfc/Umfs increases with thicker beds and attempts at increasing the
fluidising velocity to fluidise particles near the wall lead to severe elutriation
from the bed surface.
c) Feeding problems. The vertical SFB have only one outlet functioning both
as feed inlet and exhaust outlet. The strong upward velocity of effluent gases
tends to blow out the feed materials, especially waste with low density such
as rice husk.
d) Ash accumulation. The resulting ash from continuous combustion of waste
materials needs to be removed in order to maintain a constant bed thickness.

34
Removal of ash from a vertical SFB is complicated due to the presence of
only one outlet.
Apart from eliminating the disadvantages discussed earlier, the prototype of
the horizontal SFB was engineered to achieve higher combustion efficiency in the
gas phase and to control particulate emissions through inclusion of a secondary
chamber. The parameters that need to be determined and optimised in the design
stage of the combustor are:-
i) Sand size for use in design calculations,
ii) Operating temperature range for sizing of combustor,
iii) Combustor dimensions (diameter and length),
iv) Tapered section geometry (tapering height and degree of tapering),
v) Bed depth,
vi) Rotating speed of combustor,
vii) Fluidising air feed rate, and
viii) Rice husk feed rate.
The inclusion of the tapering ends in the primary chamber of the proposed
SFB was aimed at achieving uniform fluidisation in the radial direction. It is
important to note that the tapering effect does not alter the ratio of Umfc/Umfs as both
values depend on the radius only. Thus, this ratio will remain the same for a certain
bed depth in a SFB with or without the tapered ends. The tapering effect only alters
the fluidisation number at the wall (no. of Umfc) over the fluidisation number at the
bed surface (no. of Umfs). For simplification reasons, this term will be represented
by the symbol FR. As an example, in an untapered SFB, a Umfc/Umfs ratio of 3
indicates that when the fluidising velocity at the bed surface is 3 Umfs, the fluidising
velocity near the SFB wall is just 1 Umfc. FR, in this case, is therefore 1/3, which is
also the inverse value of Umfc/Umfs. The tapering effect, on the other hand, could
equalise FR. Manipulation of the cross sectional area for radial airflow could be
performed by changing the tapering height and tapering angle to reduce the air
velocity in the radial direction inwards until a condition is reached whereby this ratio
approaches unity (for a certain bed depth).

35
All parameters in the design were interrelated. For example, changing the
angle of tapering resulted in a change in FR for a certain bed depth although
Umfc/Umfs remains the same. Changing the bed depth while maintaining the same
angle of tapering also changed the ratio of Umfc/Umfs and subsequently the value of
FR. The air inputs to achieve a certain fluidising velocity also depend on the rotating
speed and size of the combustor. Thus, Excel spreadsheets were constructed to give
a clear picture of the effects arising from the modifications of each parameter. The
base case design was based on using rice husks as the feed material.
4.2 Calculation of Combustion Air Requirement
Mass balance was conducted to determine the amount of stoichiometric air
feed required for the complete combustion of rice husk. Taking 100 g of feed as a
basis of calculation, the procedures to calculate the required amount of air were
outlined as follows:-
Rice husk feed on wet basis: 100g
H2O = 10.10 g Ash = 14.70 g C = 33.98 g H = 4.50 g O = 36.18 g N = 0.54 g Ash
Combustor
Flue gas (mol)
Air feed (mol)
C = 33.98 g ≡ 2.83 mol
H = 4.50 g ≡ 4.50 mol
O = 36.18 g ≡ 2.26 mol
Assuming complete combustion, carbon and oxygen in the feed will be oxidised in
the following manner:-

36
C + O2 → CO2
4H + O2 → 2 H2O
∴ 1 mol C ≡ 1 mol O2
1 mol H ≡ 0.25 mol O2
Stoichiometric oxygen requirement:-
2.83 mol C ≡ 2.83 mol O2
4.50 mol H ≡ 1.13 mol O2
2.26 mol O ≡ (-) 1.13 mol O2
Amount of oxygen required = 2.83 mol
Stoichiometric air requirement = 22
O mol 83.2O mol 0.21
air mol 1×
= 13.48 mol
Air feed at ambient (30oC) = K 273K 303
molL 22.414mol 48.13 ××
= feed kg
m 3.353 @feed g 100
L 3.335 3
Hence theoretically, 3.35 m3 of air (at 30oC) is required for the complete
combustion of 1 kg of rice husk. However, in actual combustion operation, excess
air is required in order to facilitate the complete oxidation of the char fraction. Rice
husk particles consist primarily of volatiles (64 wt% on wet basis) with a small
amount of char (11 wt% on wet basis). Combustion of high-volatile materials is
heat-transferred controlled, whereas combustion of materials with high char content
(such as coal) is mass-transferred controlled. In the former case, combustion occurs
when the volatiles inside the materials are released into the combustor, where they
will then be burnt to completion. The burning of these volatiles releases heat into
the combustor necessary to sustain the combustion process. The devolatilisation
process is an endothermic process and the presence of a high amount of excess air

37
will lower the combustor temperature to the point of quenching the flame and
suppressing the devolatilisation process. On the contrary, high-char content
materials require a high amount of excess air in order to oxidise the chars, thereby
releasing the heat into the combustor. Taking these considerations into account, it is
suggested that for the combustion of rice husk, a stoichimetric amount of air is fed
as primary air while some excess air is fed as secondary air into the freeboard region
for the resulting char skeletons to burn to completion. The amount of excess air
required is based on the guideline value of achieving a final flue gas composition of
higher than 6% oxygen level (Environment Agency, 1996), usually around 8%
taking into account the operational safety margin.
4.3 Determination and Optimisation of Design Parameters
4.3.1 Sand Size
Commercial silica sand granules are to be used as the bed media in the
proposed SFB combustor. The size of sand needs to be selected for the purpose of
design calculations. Larger particles (Geldart Type D) are undesirable in
fluidisation studies as they produce large exploding bubbles and severe channelling.
Mixing is also limited and this leads to poor combustion of waste. The use of
Geldart-B particles is favourable due to its good fluidising behaviour characterised
by vigorous bubbling action and bubble enlargement upon reaching the bed surface.
Fluidisation of particles in a SFB can be achieved at any fluidising air flow rate by
changing the rotating speed of the bed. However, the amount of airflow is limited
by the stoichiometric requirements of combustion. Certain conditions may arise
whereby the optimum air supply for combustion might not be enough to completely
fluidise the bed. Therefore, in order to achieve bed fluidisation at a lower fluidising
air flow rate, it is desirable to choose particles of smaller size. On the other hand,
the minimum size of bed particles is also limited by the diameter of the distributor
holes. Particles that are too small might be centrifuged out of the bed when
operating at low fluidising air flow rates. It has been shown by Rozainee (1998) that
sand particles as small as 0.5 mm could be used with distributor plate having hole
38
diameter of 1 mm. Silica sand with a size range of 600 – 850 µm available
commercially is suitable for use as the bed media. Screen analysis to determine the
particle size distribution of this sand size showed that it consists mostly of particles
in the range of 0.5 – 1.00 mm, denoting a mixture of Geldart-B and Geldart-D
particles. The arithmetic mean diameter for this range of sand size, which at 0.73
mm, is more representative than the volume surface mean diameter of 0.67 mm.
Therefore, this value will be used in the design calculations.
Hence: The chosen sand size is 600 – 850 µm having an arithmetic mean
diameter of 0.73 mm.
4.3.2 Operating Temperature Range
Industrial processes for biomass processing are usually designed for
temperatures above 600oC (Mansaray and Ghaly, 1998). At higher temperatures, the
char could be converted through heterogeneous reactions at appreciable conversion
rates to gaseous components (water, carbon dioxide and oxygen). In addition, the
oxidation of volatile pyrolysis products in the presence of air at higher temperatures
results in flaming combustion. Oxidation of char, therefore, is further enhanced.
Moreover, the temperature of a fluidised bed is usually maintained at approximately
850oC in order to sustain the combustion process. On the other hand, in-depth
understanding of the hydrodynamic features of a combustor system needs to be
carried out at ambient temperature (30oC) before moving on to the more complex
combustion studies. Experimental works carried out at ambient is important in
determining good mixing behaviour to be used during combustion studies.
Therefore, calculations for the design of the horizontal SFB need to be conducted for
the both extremes of the temperature range. Cold commissioning of the combustor
will be carried out 30oC so this temperature represented the lower extreme.
Meanwhile, hot commissioning is targeted at 800oC, and this temperature
represented the upper extreme. Due to volume expansion of gas with increasing
temperature, these measures were necessary to ensure that the fluidising air to be

39
supplied to the combustor during cold and hot runs at designated fluidising
velocities is within the capacity of the selected blower unit.
4.3.3 Limitations in the Design of the SFB Combustor
Optimising the dimensions and operating parameters for the design of the
horizontal SFB combustor was made difficult by the complex manner in which all
parameters were interrelated. However, several limitations need to be imposed
during the optimisation process in order to address the drawbacks associated with a
vertical SFB and to achieve good fluidisation behaviour in the proposed SFB
combustor. These limitations also aids in narrowing down the range of values at
which each parameter need to be investigated and were discussed in the following
sections.
4.3.3.1 Size of the SFB Combustor
One of the original intentions of the research was to come up with a highly
compact system with good mobility to cater for small-scale onsite waste
incineration. The combustor should be huge enough to be able to maintain the
thermal stability of the system and render waste feeding justifiable, yet small enough
to occupy a lorry or truck for easy deployment from site to site. Thus, the
combustor is expected to occupy a floor area of approximately 4 m2 (2 m × 2 m).
The length of combustor, therefore, should be in the vicinity of 1 m considering the
need for installation of auxiliary equipment such as the feeding and ash collection
systems.
The cylindrical combustor is to be partitioned into the primary and secondary
chambers. The volume of the primary chamber, after accounting for the volume lost
due to tapering and less that occupied by the bed media, should be sufficient to

40
allow for continuous feeding of waste materials while maintaining sufficient
residence time for de-volatilisation process to occur. In addition, there should be
some free space at the central core of the cylinder as freeboard region for the
evolved gases to proceed to the secondary chamber to complete the combustion
process. The diameter of the combustor, therefore, should be as big as possible but
is limited by the combustor length. In most rotating combustion systems, in
particular rotary kilns, the length to diameter (L/D) ratio usually ranges from 2.5:1 to
4:1 (Niessen, 1995). Having a ratio of L/D less than unity might affect the structural
stability of the combustor. The minimum limit of L/D ratio is unity, and thus, the
diameter of the combustor should not exceed its length.
The secondary chamber, on the other hand, is a thoroughly hollow chamber
and is where most of the unburnt volatiles released earlier burn to completion. It
should have a larger volume compared to the primary chamber. A minimum
residence time of flue gas of two seconds will be used as a guideline value for
design purposes.
Hence: The length of the whole SFB combustor should be designated at
approximately 1 m. The combustor diameter should not exceed its length and the
secondary chamber should have a larger volume than the primary chamber.
4.3.3.2 Tapering Angle (θ)
The entire circumference of both ends of the primary chamber wall was
tapered with the main target of equalising the rate of fluidisation. Tapering angles in
this combustor was based on the conical section design of a spouted bed. Too small
a cone angle will lead to the formation of dead zones as shown in shallow spouted
bed studies (José et al., 1996). Since the symmetrical sections of the tapered
primary chamber resembled a shallow spouted bed, optimising the angle to ascertain
the maximum threshold value that avoids the creation of dead zones in the primary
chamber is not unjustifiable. Spouting stability in a spouted bed depends largely on

41
particle size and size distribution, gas flow rate, bed height, cone angle, gas inlet
diameter (Di) and column diameter (Dc) (Mathur and Gishler, 1955), in which the
latter three are of interest in the present SFB design. Therefore, it is predicted that
fluidisation in the primary chamber may exhibit some spout-like behaviour due to
the inclusion of the tapered sections. The width of opening at the combustor wall to
the free untapered section should be in certain ratios, consistent with those present in
a spouted bed.
It is worthy to note that the limit of cone angle for most materials in a
spouted bed is in the region of 70o (Hunt and Brennan, 1965 and Elperin et al.,
1967). It was further reported by José et al. (1996) that for cone angle, γ in the range
of 60o to 150o, the limits of stability in the bed could be maintained as long as Di/Dc
< 0.4 and 2 < Di/dp < 60. Superimposing these parameters to the case of the SFB
combustor, Di is the length of the distributor inlet while Dc is the length of the
primary chamber at the interface of the bed surface. Meanwhile, the angle of
tapering as measured from the horizontal axis should range from 15o to 60o.
Instability in the bed is characterised by the formation of large bubbles for small
particles and the elevation of the whole bed without the spout opening for large
particles. On the other hand, the tapering angle is limited by the available tapering
height (X) as measured from the wall of the combustor to the edge of either the feed
inlet (Xin,max) or the exhaust outlet (Xout,max) (Figure 4.1) while ensuring sufficient
opening at the distributor plate for the fluidising gas to enter. Since the conical
section in a spouted bed is symmetrical in design, the width of both the feed inlet
and exhaust outlet of the SFB should therefore be equal in order for the tapering
height, X to be maximised.
Hence: The range of tapering angle, θ to be investigated was limited to 15o –
60o while ensuring that Di/Dc < 0.4 and 2 < Di/dp < 60, where Di is the length of the
distributor inlet and Dc is the length of the primary chamber at the interface of the
bed surface. The angle of tapering, θ is maximum when the whole length of the
available height of tapering, X is utilised while simultaneously maintaining a
sufficient distributor width as fluidising air inlet. For symmetry in tapering, the
width of both the feed inlet and exhaust outlet should be similar.
42
4.3.3.3 Bed Depth (H)
The ratio of Umfc/Umfs is higher for thicker beds. Although shallower beds
give more uniform fluidisation in the radial direction, a sufficient bed thickness
should be used in order for combustion process to occur in the bed. This is crucial
as the heat evolved from combustion process in the bed is required for maintaining
its thermal stability. The bed should not be too deep so as to allow for bed
expansion during fluidisation. Moreover, too deep a bed will reduce the free volume
available to accommodate the feed materials, evolved volatiles as well as the
resulting chars and ash. Rice husk contains approximately 15% of ash, which might
lead to severe ash accumulation the bed. A bed thickness ranging of one-tenth
(1/10) to two-third (2/3) of the combustor radius should be sufficient to satisfy these
criteria.
Hence: The bed thickness to be investigated ranged from one-tenth (1/10) to
two-third (2/3) of the combustor radius.
4.3.3.4 Air Feed Rate
To ensure stable fluidisation, fluidising velocities should be at least 3 Umfs at
the bed surface, and 2 Umfc near the combustor wall (Rozainee, 1998). Thus, the
surface fluidising velocities investigated during the design of the SFB combustor
were set at 3 – 3.5 Umfs while the corresponding Umfc observed so much so that FR is
maintained at near unity for all rotating speeds.
Hence: The fluidising air should be at least 2 Umfc at the combustor wall and
3 Umfs at the bed surface.

43
4.3.3.5 Rotating Speed
Contrary to conventional fluidised bed, the operation of the SFB is no longer
limited by the amount of air throughput. Fluidisation can be achieved at higher gas
flow rates by increasing the g-level in the bed through increase in bed rotating
speeds. The amount of fluidising air to be used depends on the amount of waste
feed, and a point is reached whereby the kinetics in waste combustion limits the
amount of feed that the combustor could accommodate. This has direct relation with
the free volume of the primary chamber. Increasing the feed beyond this limit
results in incomplete combustion and accumulation of unburnt materials in the bed.
These conditions are detrimental to the operation of combustor in that the
temperature of the bed might drop too low to the point of quenching the combustion
process. Therefore, for a certain size of free volume in the primary chamber, there
exists a maximum value of waste feed in order for the waste to burn to completion.
Taking into the account that the fluidising velocities should be maintained in the
excess of 2 Umfc to establish sufficient turbulence inside the bed crucial in attaining
good mixing behaviour, there is also a limit of to the amount of fluidising air. This
in turn sets the maximum speed at which the bed could be rotated. The maximum
rotating speed can be determined by first investigating the maximum amount of
waste that could be accommodated by the free volume of a certain size of primary
chamber. This allows for the subsequent determination of the maximum flow rate of
fluidising air at stoichiometric conditions, and finally the maximum rotating speed
could be back-tracked while maintaining fluidisation at approximately 2 Umfc.
Hence: The kinetics of combustion limits the amount of waste feed to a
certain size of the SFB primary chamber. This sets a limit to the amount of
fluidising air input, which in turn limit the rotating speed of the bed.
4.3.3.6 Rice Husk Feed
Results from proximate and ultimate analyses of rice husk samples were used
to carry out mass balance calculations in order to determine the rate of rice husk

44
feeding. Materials with high volatile matters such as rice husk favour air feed at
stoichiometric or substoichiometric condition since combustion of such materials are
dominated by the drying and de-volatilisation processes. These processes are heat-
transfer controlled and therefore feeding of more air will only lead to the undesirable
condition of lower rate of heat transfer. Materials with high content of char, on the
other hand, favour higher feeding rate of air as the mass transfer phenomenon
predominates. Air should be supplied to the burning materials in sufficient rate in
order for combustion to be sustained while maintaining the minimum requirements
of fluidisation (2 Umfc at wall, 3 Umfs at bed surface). The phenomenon of volume
expansion of gas with temperature should be taken into account. As the fluidising
air at ambient (30oC) enters the hot combustor, the gas expands accordingly with the
temperature of the bed. The amount of rice husk feed, therefore, should be
determined in such a manner that the fluidising air is sufficient to allow for its
stoichiometric combustion and for maintaining the minimum fluidisation
requirements at a temperature of 800oC, the highest limit of temperature intended for
operation of the SFB combustor.
Hence: By maintaining the SFB at 800oC, the air input for maintaining the
minimum requirements for good fluidisation behaviour (2 Umfc and 3 Umfs) is
determined and this value of air input is in turn used to calculate the amount of rice
husk feed for its stoichiometric combustion.
4.3.4 Combustor Dimensions for Uniform Fluidisation
4.3.4.1 Determination of Combustor Size and Optimum Bed Depth (H)
Observing the limitations that the whole length, L of the SFB combustor
should be approximately 1 m with a minimum L/D ratio of 1, the cylinder of the
SFB combustor was first designated at a length of 800 mm with an ID of 800 mm.
The whole combustor was partitioned equally to form a primary chamber and a
secondary chamber. Fluidisation occurs in the primary chamber and thus,
investigations on the ways to achieve good fluidisation behaviour was focused in the

45
primary chamber. These comprise the determination of the optimum angle of
tapering (θ), tapering height (X) and bed depth (H). Design of the secondary
chamber will be dwelled in later sections. In addition, to study the maximum bed
depth attainable while achieving good fluidisation behaviour in the bed (2 Umfc at the
wall, 3 Umfs at the bed surface), both the tapering angle, θ and tapering height, X
were maximised in this stage. Optimisation of the tapering height and tapering
angle will be investigated in Section 5.3.4.2 and Section 5.3.4.5, respectively. For
the current combustor size having a feed inlet with an ID of 200 mm, X is 300 mm
and θ is 60o. Further, the relevant design calculations were conducted at ambient
conditions (30oC). Design calculations at combustion temperature of 800oC will
also be investigated further in later sections. The proposed dimensions of the SFB
were depicted in Figure 4.2.
The bed depths were varied from 50 mm (approximately one-tenth of the
combustor radius) to 300 mm and the rotating speeds ranging from 5- to 25-g
loadings (which gave RPMs of 106 – 236). The important parameters to be
observed due to the variations in bed depths were FR, fluidising air feed
requirements and the ratio of Lo/Li, where Lo is the length of the air distributor inlet
and Li is the length of the combustor at the bed surface. The ratio of Lo/Li is
consistent with the ratio of Di/Dc in a spouted bed and is important in the SFB
design as it reflects the stability of the bed fluidisation to a certain extent. This is
because the tapered section geometry resembled that of the conical section of a
spouted bed.
The fluidising conditions and air feed requirements at ambient for different
bed depths and rotating speeds in the primary chamber (length 400 mm, ID 800 mm)
were as shown in Table 4.1. For comparison purposes, the ratio of Umfc/Umfs, which
gave indication on FR in an untapered SFB, was also included. For a shallow bed
(50 mm), the ratio of Umfc/Umfs approached unity (ranging from 1.24 – 1.26) for all
rotating speeds. For deeper beds, this ratio got larger and larger, indicating highly
non-uniform radial bed fluidisation. For example, the ratio of Umfc/Umfs is
approximately 3 for a bed depth of 200 mm at all rotating speeds ranging from 5- to
25-g loadings. FR, in this case, is therefore approximately 0.30. This means that

46
when the sand near the wall reached sufficient turbulence conditions of 2 Umfc, the
fluidising velocity at the bed surface had reached 6 Umfs, leading to high potential of
particle elutriation from the bed surface. Tapering the walls at 60o, on the other
hand, significantly increased FR so that their values approach unity. Judging the
significance of maintaining the fluidising velocities at 2 Umfc near the wall and 3 Umfs
at the bed surface, the minimum acceptable value of FR is 2/3 or 0.67. It was
obvious from Table 4.1 that increasing the bed depth beyond 200 mm resulted in the
values of FR dropping too low to less than the minimum limit of 0.67.
The air feed requirements to maintain 3 Umfs at the bed surface were
observed to be lowered as the bed depths were increased. Tapering the end walls of
the primary chamber resulted in the increase in cross sectional area as the air moved
radially inward. Consequently, the air velocity is lowered in the radial direction
inwards so much so that sufficient fluidising velocity (2 Umfc) is reached at the SFB
wall while simultaneously keeping the surface fluidising velocity in the vicinity of 3
Umfs. Since the centrifugal force increases with radius, the deeper the bed (which
means smaller bed radius), the lower the value of Umfs. At a rotational speed of 5-g
loading, for instance, Umfs is 0.24 m/s for a bed depth of 200 mm, decreasing to 0.14
m/s when the bed depth is increased to 250 mm. Therefore, to maintain a condition
of 3 Umfs at the bed surface required less air input for a deeper bed. At 5-g loadings,
an air input of 494.5 m3/hr was required for a 250 mm bed (to maintain 3 Umfs at the
bed surface) compared to 925.5 m3/hr for a 200 mm bed. Thus, deeper beds were
favourable. Reaching a compromise in terms of fluidising air inputs and fluidising
condition (FR), a bed depth of 200 mm was chosen. Beds deeper than 200 mm, such
as 250 mm and 300 mm had too low a value of FR in the sense that when the
fluidising velocity reached 3 Umfs at the bed surface, the values of Umfc were only 1.2
– 1.5 Umfc and approximately 0.5 Umfc respectively, at all the rotating speeds
investigated. These low values of Umfc were evidently were not high enough to
achieve sufficient turbulence in the bed. The ratio of Lo/Li, which gave indication of
the bed stability, was also within the desired limit of less than 0.4 (at 0.19) for the
chosen bed depth of 200 mm.
Hence: The chosen bed depth for the SFB combustor (length 800 mm, ID
800 mm) having a primary chamber of length 400 mm is 200 mm.

47
Table 4.1: Fluidisation conditions and air feed requirements at ambient (30oC)
for different bed depths and rotating speeds in the primary chamber
(length 400 mm, ID 800 mm, tapered height 300 mm, tapered angle 60o)
g-loading
Lo (m)
Li (m)
Umfc/Umfs
FR (untapered)
FR(tapered)
Air flow rate, Q @ 3 Umfs, 30oC
(m3/hr)
Lo/Li
Bed height = 50 mm 5 1.26 0.79 1.44 1,715.18 10 1.25 0.80 1.45 2,830.74 15 0.0534 0.1112 1.25 0.80 1.46 3,724.51 0.4820 1.24 0.80 1.46 4,492.10 25 1.24 0.81 1.47 5,175.44
Bed height = 100 mm 5 1.66 0.60 1.43 1,702.62 10 1.63 0.61 1.46 2,837.22 15 0.0534 0.1690 1.61 0.62 1.47 3,751.53 0.3220 1.60 0.62 1.48 4,538.88 25 1.60 0.63 1.48 5,240.91
Bed height = 200 mm 5 3.42 0.29 0.78 925.50 10 3.27 0.31 0.81 1,583.38 15 0.0534 0.2845 3.20 0.31 0.83 2,123.18 0.1920 3.15 0.32 0.84 2,592.11 25 3.12 0.32 0.85 3,012.38
Bed height = 250 mm 5 5.78 0.17 0.42 494.47 10 5.43 0.18 0.44 862.22 15 0.0534 0.3422 5.25 0.19 0.46 1,168.58 0.1620 5.13 0.19 0.47 1,436.78 25 5.05 0.20 0.48 1,678.30
Bed height = 300 mm 5 12.25 0.08 0.15 181.74 10 11.20 0.09 0.17 325.33 15 0.0534 0.4000 10.66 0.09 0.18 447.89 0.1320 10.32 0.10 0.18 556.59 25 10.08 0.10 0.19 655.30

48
4.3.4.2 Determination of Optimum Tapering Height (X)
Having determined the optimum bed depth at 200 mm, the effect of varying
the tapering height, X on the fluidising conditions and air feed requirements in the
SFB (length 800 mm, ID 800 mm, primary chamber length 400 mm) was further
investigated. Realising that X is maximum at 300 mm, the tapering height was
varied from 100 mm to 300 mm while maintaining the tapering angle at 60o. Similar
to earlier procedures in determining the optimum bed depth, calculations were
performed at an ambient temperature of 30oC and at rotating speeds ranging from 5-
to 25-g loadings. The results were tabulated in Table 4.2.
Table 4.2: Fluidisation conditions and air feed requirements at ambient (30oC)
for different bed depths and rotating speeds in the SFB primary chamber
(length 400 mm, ID 800 mm, tapered angle 60o, bed depth 200 mm)
g-loading
Lo (m)
Li(m)
Umfc/Umfs
FR(untapered)
FR
(tapered)
Air flow rate, Q @ 3 Umfs, 30oC
(m3/hr)
Lo/Li
Tapering height = 100 mm 5 3.42 0.29 0.26 1,715.18 10 3.27 0.31 0.28 2,830.74 15 0.2845 0.5155 3.20 0.31 0.28 3,724.51 0.55 20 3.15 0.32 0.29 4,492.10 25 3.12 0.32 0.29 5,175.44
Tapering height = 200 mm 5 3.42 0.29 0.35 1,702.62 10 3.27 0.31 0.36 2,837.22 15 0.1690 0.4000 3.20 0.31 0.37 3,751.53 0.42 20 3.15 0.32 0.38 4,538.88 25 3.12 0.32 0.38 5,240.91
Tapering height = 300 mm 5 3.42 0.29 0.78 925.50 10 3.27 0.31 0.81 1,583.38 15 0.0534 0.2845 3.20 0.31 0.83 2,123.18 0.19 20 3.15 0.32 0.84 2,592.11 25 3.12 0.32 0.85 3,012.38

49
From Table 4.2, it could be observed that, for a tapering height of 100 mm,
FR was way too low (in the vicinity of 0.30) in order to achieve good fluidisation in
the bed. For the bed depth of 200 mm, when the surface of the bed was fluidising at
3 Umfs, the bed particles near the wall were barely fluidised (at less than 1 Umfc) at all
rotating speeds. Increasing the tapering height to 200 mm resulted in the slight
increase in this ratio for the same bed depth. However, this increase was still not
sufficient, as can be demonstrated by taking the example of a bed rotating at 5-g
loading, whereby a condition of 3 Umfs at the bed surface resulted in the bed near the
wall fluidising at only 1 Umfc, which was clearly not sufficient for good mixing
behaviour in the bed. Increasing the tapering height to 300 mm, which is also the
maximum tapering height allowable by the combustor geometry, on the other hand,
gave the desired value of FR of more than the minimum limit of 0.67. Operating the
SFB again at the same bed depth and rotating speed as the previous case with X at
300 mm resulted in a wall fluidising velocity of 2.34 Umfc when the surface
fluidising velocity was designated at 3 Umfs. Changes in rotating speeds only
resulted in slight difference in FR. This value of wall fluidising velocity in the
excess of 2 Umfc attainable in the 200 mm bed due to a tapering height of 300 mm
clearly showed good mixing in the bed could be achieved while maintaining a fairly
uniform radial bed fluidisation. Another advantage of maximising the tapering
height was the reduction in the air feed requirements. This was because as the
tapering height was increased (while keeping the angle at 60o), the length for radial
airflow at the bed surface (Li) was decreased accordingly. For example, with a
tapering height of 200 mm, Li is 400 mm but decreases to 284.5 mm when the
tapering height is increased to 300 mm. This in turn resulted in a smaller surface
area for airflow at the bed interface. Therefore, lesser amount of air was required to
fluidise these particles to the same fluidising conditions (for example 3 Umfs). For
instance, 1702.1 m3/hr of air was required to fluidise the bed to 3 Umfs (bed depth
200 mm) at 5-g loading with a tapering height of 200 mm. The amount of fluidising
air required to achieve the same fluidising condition at the same operating speed was
reduced by 45.6% to 925.5 m3/hr when the tapering height was increased to 300
mm. It should also be noted that the higher amount of air in the former case only
fluidise the bed near the distributor wall to approximately 1 Umfc, while the latter to a
fluidising velocity in the excess of 2 Umfc.

50
Hence: The chosen tapering height, X for the SFB combustor (length 800
mm, ID 800 mm) having a primary chamber of length 400 mm is 300 mm.
4.3.4.3 Rotating Speed, Fluidising Air Feed Rate and Rice Husk Feed Rate
Determination of the range of feasible operating conditions for the proposed
design of the SFB such as rotating speed, fluidising air feed rate and rice husk feed
rate had to be investigated collectively since all three parameters have significant
influence on each other. To determine the maximum rotating speed at which the
combustor can be operated at required the knowledge of the chemical kinetics of rice
husk combustion, that is, the minimum time for the combustion process to reach
completion. This is because the fluidising air input into a SFB can be manipulated
through adjustment in the rotating speed while being able to maintain the desired
fluidising conditions. The fluidising conditions being held constant, the higher the
rotating speed, the higher the air input required. Preliminary investigations into the
combustion of rice husk conducted in a laboratory scale conventional fluidised bed
maintained at a temperature of approximately 600oC and operating at 2.5 – 3 Umf
showed rice husk were burnt to completion in a rapid manner, taking less than 1
minute in order for the ash to be observed. Increasing the combustor temperature to
750oC further reduced the burnout time to less than 0.5 minute. Mathematical
modelling using the FLUENT program code (Section 6.6.4.3) for the combustion of
rice husk particles in a SFB showed that when rotating at 5-g loading, complete
combustion of the particles could be achieved at approximately 1.3 minutes at 600oC
and less than 0.5 minute at 700oC. Therefore, taking into account the margin of
safety due to fluctuations in bed temperature, the residence time of rice husk in the
primary chamber of the proposed SFB should not be less than 1.5 minutes.
Imposing this restriction set the maximum value of rice husk feed that the SFB
combustor could accommodate, which in turn set a limit to the maximum amount of
fluidising air that can be fed as combustion air. Subsequently, the combustor can
only be rotated up to a certain level of g-loading since the maximum air input have
to balance not only the conditions of being in stoichiometric amount for the

51
combustion of the maximum rice husk feed rate but also satisfying the conditions of
good mixing behaviour in the bed (2 Umfc near wall, 3 Umfs at bed surface).
From earlier findings, the initial SFB design (total length 800 mm, ID 800
mm, primary chamber length 400 mm, feed inlet ID 100 mm, tapering height 300
mm, tapering angle 60o) should be operated at a bed depth of 200 mm in order to
achieve uniform radial bed fluidisation. However, the previous investigations were
limited to operation at ambient conditions (30oC). Therefore, in this section,
calculations were performed for operations of the combustor for both cold
commissioning (at 30oC) and hot commissioning (at 800oC). Calculations for hot
commissioning enabled the determination of the rate of rice husk feed and also the
estimated residence time of rice husk in the combustor at each rotating speed as well
as the amount of air to be fed at ambient. Calculation results for cold
commissioning and hot commissioning were shown in Table 4.3 and Table 4.4
respectively.
From Table 4.3, it was found that for rotating speeds up to 15-g loading at
ambient operation, air feed rates as high as 2000 m3/hr need to be supplied to the
primary chamber at very high pressure drops (as high as 3.3 m H2O) in order to
maintain a minimum turbulence conditions of 3 Umfs at the bed surface and at least 2
Umfc near the combustor wall. Such high air inputs coupled with high pressure drops
could only be supplied by blowers that could overcome huge drops in pressure.
Capital investments for such blowers are huge, and the higher the capacity, the
higher its cost. Apart from that, the produce a huge discharge volume
(approximately 35 m3/min) with a pressure drop up to 4 m H2O, blowers such as
those available commercially need to be operated up to a rotating speed of 2000
RPM. Operating the blower unit at very high RPMs incurred higher operating costs
as well as resulting in the rapid wear and tear of the fan blades. Therefore, in order
to reduce the capacity of the blower unit required, the current dimension of the
combustor need to be scaled down.
When operating at 800oC and 3.5 Umfs, the fluidisation behaviour (FR)
remained more or less the same in the current design of the SFB as when it was
operated at 30oC. Values of these ratio remained above the minimum limit of 0.67

52
(Table 4.3 and Table 4.4) for all rotating speeds. Due to the nature of volume
expansion of gas with temperature, the fluidising air input to the bed operating at
800oC was reduced by a factor of 3.54 (= 1073K / 303K) when the air is fed at
ambient (30oC). Thus, the air feed requirements for rotating speeds up to 25-g
loading was only 750 m3/hr (at 30oC). The corresponding rice husk feed rates for
stoichiometric combustion ranged from 48.0 to 224.5 kg/hr (Table 4.4) for rotating
speeds ranging from 5- to 25-g loadings. The volume of the primary chamber is
0.103 m3 and after taking into account the volume occupied by the sand bed of depth
200 mm, the free volume (please refer to Appendix A for calculation steps) available
for waste is 0.044 m3. The residence time of rice husk in the primary chamber could
be estimated through the following formula:-
bρrateFeedvolumeCombustor τEstimated ×= (4.1)
where in this case, the combustor volume referred to the free volume in the primary
chamber, feed rate is the rate of rice husk feeding to maintain fluidising velocity of
3.5 Umfs at the bed surface at 800oC and ρb is the bulk density of rice husk. It was
found from Table 4.4 that the estimated residence times of rice husk in the primary
chamber were all in the excess of 1 minute and therefore should be sufficient in
order for the waste to burn to completion. Operating at lower rotating speed (such
as 5-g loading giving a RPM of 106) required lesser amount of rice husk feed,
leading to higher residence time of solid (5.9 minutes).
The air feed requirements were within operational boundaries (less than 1000
m3/hr even a rotating speed as high as 25-g loading) for the current design of the
SFB operating at 800oC. Burning time, in the excess of 1.5 minutes, was also
sufficient when operating up to 20-g loadings. However, as discussed earlier, the air
feed requirements when operating the bed at ambient even up to 15-g loading was
way too high. The high capacity and pressure drop requirement for the air blower
unit rendered this geometry infeasible in terms of blower capital and operating costs.
Therefore, the combustor was then scaled down to an inner diameter of 600 mm.
The total length was still maintained, but the primary chamber length was scaled
down proportionately with the combustor inner diameter to 300 mm. Similarly, the

53
bed depth was proportionately scaled down to 150 mm. The optimum bed depth for
this combustor size will be determined in Section 5.3.4.4. The feed inlet diameter
was also scaled down proportionately to 150 mm, resulting in a maximum tapering
height of 225 mm. The difference in dimensions between the initial SFB combustor
and its scaled down version was shown in Table 4.5 while the schematic diagram of
the scaled down SFB was shown in Figure 4.3.
The angular velocity (ω) varies with the bed radius (r) according to the
relationship ω ∝ (r)-0.5. Since the ratio of (ro/ri) for both the initial combustor and
scaled down combustor remained unchanged due to the proportional scaling and also
the fact that ω for a certain g-loading for both combustors follows the relationship as
mentioned above, the value of Umfs for both combustors remained unchanged as
well. On the other hand, the surface area at the bed surface was reduced as much as
44% (from 0.134 m2 to 0.076 m2) due to the scaling down. Therefore, the air feed
rate was reduced significantly, whereby at 15-g loading and 3 Umfs, the air feed
requirement was just 1194.3 m3/hr at ambient (Table 4.6). The significant reduction
in air feed requirements, coupled with lower pressure drops, made the choice of the
scaled down combustor geometry feasible. A blower with a smaller capacity is thus
required, and this translates to significant reduction in terms of capital and operating
costs. Also, due to limitations in terms of capital investment, a blower unit having a
capacity of up to 1200 m3/hr while being able to overcome a pressure drop of up to 4
m H2O, which cost approximately RM 50,000, was chosen. During cold
commissioning at 30oC, the scaled down SFB combustor could be operated up to a
rotating speed of 15-g loading using air supplied from this blower. Hot
commissioning, on the other hand, could be carried out at higher rotating speeds due
to the nature of gas volume expansion with increasing temperature (V∝ T).
Nevertheless, chemical kinetics in rice husk combustion determined the maximum
allowable feed rate of rice husk to the combustor. Subsequently, there existed a
limit to the rate of air inputs to maintain certain fluidisation behaviour in the bed.
This in turn set the highest limit of rotating speeds allowable that ensured complete
combustion of all the rice husk feed. From Table 4.7 and realising that the cut-off
residence time (for the rice husk to stay in the primary chamber) of 1.5 minutes is
required, it was found that rotating the SFB up to 15-g loadings. Estimated

54
residence time of rice husk in the primary chamber when operating at 15-g loading
is 1.52 minutes. As a margin of safety, the bed should be operated only up to 15-g
loadings.
As a result of tapering at 60o, the length of the primary chamber wall meant
as airflow inlet was reduced to 40.1 mm. Consequently, the entering air velocity is
reduced as the air moves radially inward. This condition was best illustrated in
Figure 4.4 whereby the velocity profile of airflow entering at 1 Umfc and 30oC
(ambient) and at different g-loadings was evaluated. All five curves were fairly flat
in the region with the radius ranging from 0.125 m to 0.225 m. However, the
velocity gradients beyond 0.25 m till the end wall of the primary chamber were very
steep. This phenomenon is due to the length of the airflow interface being reduced
progressively as the radius is increasing as a result of the inclusion of the tapered
ends. Hence, the curve for the area of the airflow interface versus the chamber
radius exhibited a maximum parabolic curve as in Figure 4.5, as the decreasing
values of interface length and increasing values of radius balance each other.
Nevertheless, the overall distinctive effect is that the cross sectional area is increased
(to a certain extent, where it began decreasing slightly) as the air flows radially
inward. This desirable condition leads to uniform radial fluidisation in the rotating
fluidised bed. In addition, the higher the rotating speed, the greater the decrease in
air flow as demonstrated by the steeper velocity gradients with increasing g-loadings
in Figure 4.4. The fluidising number at the bed surface (no. of Umfs) at this entering
air flow rate were approximately 1.2 for all rotating speeds, another means of
proving that the inclusion of the tapered ends equalised the fluidisation at the wall
and at the bed surface.
Hence: The ID of the SFB combustor was scaled down from 800 mm to 600
mm while the length of the primary chamber was proportionately scaled to 300 mm.
The entire length of the combustor remained at 800 mm. The feasible rotating
speeds for combustion of rice husk in the SFB at 800oC was up to 15-g loading.

55
Table 4.3: Fluidisation conditions and air feed requirements at different rotating speeds for a SFB operated at 30oC
(primary chamber length 400 mm, ID 800 mm, tapered angle 60o, bed depth 200 mm)
g-loading
Rotational speed (RPM)
Umfs(m/s)
Umfc(m/s)
FR(untapered)
Operating Umfs
No. of Umfcnear wall at
operating Umfs
FR(tapered)
Air flow rate, Q @ operating Umfs,
30oC (m3/hr)
∆Pmax(m H2O)
5 105.70 0.24 0.82 0.29 2.33 0.78 925.50 1.09 10 149.49 0.41 1.34 0.31 2.44 0.81 1,583.38 2.19 15 183.08 0.55 1.76 0.31 3.00 2.50 0.83 2,123.18 3.28 20 211.41 0.67 2.12 0.32 2.53 0.84 2,592.11 4.37 25 236.36 0.78 2.43 0.32 2.56 0.85 3,012.38 5.47
Table 4.4: Fluidisation conditions, air feed requirements and stoichiometric rice husk feed rates at different rotating speeds for a SFB
operated at 800oC (primary chamber length 400 mm, ID 800 mm, tapered angle 60o, bed depth 200 mm)
g-
loading
Umfs(m/s)
Umfc(m/s)
FR(untapered)
Operating
Umfs
No. of Umfcnear wall at
operating Umfs
FR(tapered)
Air flow rate, Q@ operating Umfs, 800oC
(m3/hr)
Air flow rate, Q @ operating
Umfs, 30oC
(m3/hr)
Rice husk feed rate@ 3.5 Umfs, 800oC
(kg/hr)
Burnout time
of rice husk
(min)
5 0.13 0.50 0.25 2.37 0.68 568.91 160.65 47.97 5.86
10 0.25 0.96 0.26 2.41 0.69 1,117.73 315.63 94.24 2.98
15 0.37 1.40 0.26 3.50 2.44 0.70 1,648.45 465.50 138.99 2.02
20 0.48 1.81 0.26 2.47 0.71 2,162.75 610.73 182.36 1.54
25 0.59 2.21 0.27 2.49 0.71 2,662.06 751.73 224.46 1.25

56
Table 4.5: Dimensions and operating conditions of the initial SFB combustor
and the scaled down SFB combustor
Dimension / Operating Condition Initial SFB Scaled down SFBTotal combustor length, L (mm) 800 800
Inner diameter, ID (mm) 800 600 Primary chamber length (mm) 400 300
Secondary chamber length (mm) 400 500 Feed inlet diameter (mm) 200 150
Exhaust outlet diameter (mm) 200 150 Tapering height, X (mm) 300 225
Tapering angle, θ ( o ) 60 60 Distributor inlet width, Lo (mm) 53.4 40.1
Bed depth, H (mm) 200 150

57
Table 4.6: Fluidisation conditions and air feed requirements at different rotating speeds for a SFB operated at 30oC
(primary chamber length 300 mm, ID 600 mm, tapered angle 60o, bed depth 150 mm)
g-loading
Rotational speed (RPM)
Umfs(m/s)
Umfc(m/s)
FR(untapered)
Operating Umfs
No. of Umfcnear wall at
operating Umfs
FR(tapered)
Air flow rate, Q @ operating Umfs, 30oC
(m3/hr)
∆Pmax(m H2O)
5 122.05 0.24 0.82 0.29 2.33 0.78 520.60 0.82 10 172.61 0.41 1.34 0.31 2.44 0.81 890.65 1.64 15 211.41 0.55 1.76 0.31 3.00 2.50 0.83 1,194.29 2.46 20 244.11 0.67 2.12 0.32 2.53 0.84 1,458.06 3.28 25 272.92 0.78 2.43 0.32 2.56 0.85 1,694.46 4.10
Table 4.7: Fluidisation conditions, air feed requirements and stoichiometric rice husk feed rates at different rotating speeds for a SFB
operated at 800oC (primary chamber length 300 mm, ID 600 mm, tapered angle 60o, bed depth 150 mm)
g-loading
Umfs(m/s)
Umfc(m/s)
FR(untapered)
Operating
Umfs
No. of Umfcnear wall at
operating Umfs
FR (tapered)
Air flow rate, Q @ operating Umfs, 800oC
(m3/hr)
Air flow rate, Q
@ operating Umfs, 30oC
(m3/hr)
Rice husk feed rate @ 3.5 Umfs, 800oC
(kg/hr)
Burnout time
of rice husk
(min)
5 0.13 0.50 0.25 2.37 0.68 320.01 90.37 26.98 4.40 10 0.25 0.96 0.26 2.41 0.69 628.73 177.54 53.01 2.24 15 0.37 1.40 0.26 3.50 2.44 0.70 927.25 261.84 78.18 1.52 20 0.48 1.81 0.26 2.47 0.71 1,216.55 343.54 102.58 1.16 25 0.59 2.21 0.27 2.49 0.71 1,497.41 422.85 126.26 0.94

58
4.3.4.4 Optimum Bed Depth for the Scaled Down SFB Combustor
With the SFB combustor scaled down to an ID of 600 mm and primary
chamber length of 300 mm, the optimum bed depth of 200 mm determined for the
initial combustor dimensions (ID 800 mm, primary chamber length 400 mm) was no
longer valid. Determination of the optimum bed depth applicable for the scaled
down SFB was thus carried out.
The bed depths in the primary chamber with an ID of 600 mm were varied
from 50 mm to 200 mm. The effect of varying the bed depths on the fluidising
conditions and air feed requirements were shown in Table 4.8. Similar to the initial
SFB combustor, shallow bed (50 mm) in the scaled down SFB had a Umfc/Umfs ratio
that approached unity (ranging from 1.34 – 1.38 for rotating speeds of 5- to 25-g
loadings) even without the tapering effect. The value of FR in this shallow bed, is
approximately 0.74. The value of Umfc is thus always lower than the value of Umfs in
an untapered SFB. Inclusion of the tapering end walls increased this ratio to
approximately 1.50, indicating that the fluidising velocity near the wall (Umfc) is
higher than the fluidising velocity at the bed surface (Umfs). However, beyond a bed
depth of 150 mm, FR decreased to a value of less than one in the tapered SFB.
The range of fluidising velocities for good mixing behaviour in a SFB is in
the excess of 2 (either Umfc or Umfs). Using a shallow bed such as 50 mm, resulted in
a fairly uniform fluidising velocity at the combustor wall (Umfc) and at the bed
surface (Umfs). For instance, operating at a bed depth of 50 mm at 10-g loading in
the scaled down tapered SFB gave a wall fluidising velocity of 4.5 Umfc when the
surface fluidising velocity is 3 Umfs. Therefore, the required turbulence conditions
for good mixing behaviour could be fulfilled using such a shallow bed. However,
during combustion of solid particles such as rice husk, it is desirable for the waste to
burn in the bed so that the heat released is stored in the bed. Since shallower beds
have limited depths for these particles to penetrate and burn inside the bed, deeper
beds are necessary. In addition, the higher turbulence conditions near the wall (with
the wall fluidising velocity in the excess of 2 Umfc) might make it difficult for these
particles to penetrate deeper into the bed.

59
Increasing the bed depth to 100 mm resulted in a value of FR of
approximately 1.3 for all rotating speeds (ranging from 5- to 25-g loadings). This
value is still within the acceptable limits to achieve good mixing behaviour in the
bed. Operating at this bed depth at 10-g loading, for instance, resulted in a wall
fluidising velocity 3.9 Umfc when the surface fluidising velocity is 3 Umfs. However,
operating at this bed depth required high air inputs, up to 1900 m3/hr (at 30oC) when
rotating up to a speed of 15-g loading (211 RPM) in order to maintain the surface
fluidising velocity at the minimum requirement of 3 Umfs. It should be noted that,
while keeping the fluidising velocity at the bed surface constant at 3 Umfs, the deeper
the bed, the less air input is required. This is due to the decrease in Umfs when the
bed depth increases, as had been discussed in Section 5.3.4.1. However, there is a
limit to operating deeper beds without sacrificing in terms of uniformity in radial
fluidisation while simultaneously gaining advantage of the lower air feed
requirements. Increasing the bed depth to 200 mm (two-third of the radius of the
scaled down SFB) resulted in the ratio of Umfc/Umfs dropping too low a point
whereby variation in the fluidisation in the radial direction is very high. For
example, at a bed depth of 200 mm, rotating the bed at 5-g loading gave a value of
FR of 0.31. Operating this bed at the minimum requirement of 2 Umfc resulted in the
fluidising velocity at the bed surface, Umfs being too high (at 6.45 Umfs), which poses
a significant potential for severe particle elutriation. Therefore, reaching a balance
between uniform fluidisation in the radial direction as well as lesser air feed
requirements, the bed depth of 150 mm was chosen for the scaled down combustor.
Moreover, the ratio of Li/Lo and Lo/Dp (consistent with Di/Dc and Di/Dp in a spouted
bed) are 0.19 and 55 respectively, and are still within the stability limits of the bed
provided the tapering effect resulted in the bed behaving like a spouted bed.
Nevertheless, further experimental investigations need to be carried out in order to
proved whether the bed in the SFB behaved as like a spouted bed.
Hence: Chosen bed depth for the scaled down SFB combustor (primary
chamber length 300 mm, ID of 600 mm, tapered height 225 mm and tapered angle
60o) was 150 mm.

60
Table 4.8: Fluidisation conditions and air feed requirements at ambient (30oC)
for different bed depths and rotating speeds in the SFB primary chamber
(length 300 mm, ID 600 mm, tapered height 225 mm, tapered angle 60o)
g-loading
Lo (m)
Li (m)
Umfc/Umfs
FR (untapered)
FR (tapered)
Air flow rate, Q @ 3 Umfs, 30oC
(m3/hr)
Lo/Li
Bed height = 50 mm 5 1.38 0.73 1.48 989.41 10 1.36 0.73 1.50 1,637.87 15 0.0401 0.0978 1.35 0.74 1.50 2,158.32 0.4120 1.35 0.74 1.51 2,605.67 25 1.34 0.74 1.51 3,004.10
Bed height = 100 mm 5 2.04 0.49 1.27 848.17 10 1.99 0.50 1.30 1,424.04 15 0.0401 0.1556 1.97 0.51 1.32 1,890.36 0.2620 1.95 0.51 1.33 2,292.84 25 1.94 0.52 1.34 2,652.19
4.3.4.4.1 Bed height = 150 mm 5 3.42 0.29 0.78 520.60 10 3.27 0.31 0.81 890.65 15 0.0401 0.2134 3.20 0.31 0.83 1,194.29 0.1920 3.15 0.32 0.84 1,458.06 25 3.12 0.32 0.85 1,694.46
Bed height = 200 mm 5 7.18 0.14 0.31 210.25 10 6.69 0.15 0.34 369.47 15 0.0401 0.2711 6.44 0.16 0.35 503.01 0.1520 6.28 0.16 0.36 620.33 25 6.17 0.16 0.37 726.21
4.3.4.5 Determination of the Optimum Angle of Tapering
From earlier discussions, it was noted that the tapering angle in the primary
chamber of the SFB should range from a minimum of 15o to a maximum of 60o.
Previous calculations to determine the optimum bed depth and tapering height, as
well as the range of feasible air inputs and rotating speeds for the SFB design, were
based on a SFB that was tapered at the maximum angle of 60o. Having proved that

61
the scaled down SFB dimensions gave feasible combinations of air inputs, rotating
speeds and rice husk feed rates both during hot and cold commissioning, it will be
used during the process of optimising the tapering angle. Also, it have been proven
that using a bed depth of 150 mm (Section 5.4.4.4) was beneficial in attaining
uniform radial bed fluidisation while keeping the air feed requirements within
feasible range. Thus, optimisation of the tapering angle will be carried out by using
a bed depth of 150 mm. It should further be noted that, for the maximum length of
the SFB primary chamber of 300 mm, there is a minimum value at which the
tapering angle should be designated. For example, using a maximum tapering
height of 225 mm, the tapering angle should be more than 56.3o. The minimum
value of 56.3o is based on using all of the available primary chamber length (at 150
mm since the tapered section should be symmetrical in geometry), leaving no space
as air feed inlet. Therefore, taking into account that a sufficient length of the
primary chamber is to be designated as the air inlet, the minimum tapering angle
available for a tapering height of 225 mm should be more than 56.3o. In addition,
the process of optimising the tapering angle was focused on achieving a uniform
radial bed fluidisation and a feasible range of air inputs at different rotating speeds
with calculations carried out at ambient conditions (30oC). Results on value of FR at
ambient temperature is sufficient to give insight on the uniformity in radial bed
fluidisation at higher temperatures such as 800oC since this ratio remained more or
less the same at both temperatures. For example, for the scaled down SFB (primary
chamber length 300 mm, ID 600 mm, tapering height 225 m and tapering angle 60o)
operating at 5-g loading and 30oC with a bed depth of 150 mm resulted in a value of
FR of 0.78. Operating the same SFB at the same operating conditions but at a
temperature of 800oC gave a value of FR of 0.68.
Choosing a tapering angle of 60o when X is 225 mm gave an air inlet length
of 40.1 mm (Case I). Results from the previous section showed that these
combinations of tapering height and angle resulted in not only a fairly uniform radial
bed fluidisation but also a combination of feasible range of air inputs, rotating
speeds and rice husk feed rates for good combustion behaviour. To prove that the
tapering angle should not be increased beyond 60o, the tapering angle in the current
SFB was increased to 70o (Case II). The fluidisation behaviour and air feed
requirements in order to maintain 3 Umfs at the bed surface was shown in Table 4.9.

62
Table 4.9: Fluidisation conditions and air feed requirements at ambient (30oC)
for tapering angles and rotating speeds in the SFB primary chamber
(length 300 mm, ID 600 mm, tapered height 225 mm, bed depth 150 mm)
g-loading
Lo
(m)
Li
(m)
Umfc/Umfs
FR(untapered)
FR (tapered)
Air flow rate, Q @ 3 Umfs, 30oC
(m3/hr)
Lo/Li
CASE I : Tapering angle = 60o
5 3.42 0.29 0.78 520.60 10 3.27 0.31 0.81 890.65 15 0.0401 0.2134 3.20 0.31 0.83 1,194.29 0.1920 3.15 0.32 0.84 1,458.06 25 3.12 0.32 0.85 1,694.46
CASE II : Tapering angle = 70o
5 3.42 0.29 0.26 598.78 10 3.27 0.31 0.28 1,024.41 15 0.1362 0.2454 3.20 0.31 0.28 1,373.65 0.5620 3.15 0.32 0.29 1,677.03 25 3.12 0.32 0.29 1,948.93
It was evident from Table 4.9 that increasing the tapering angle to 70o while
keeping the tapering height constant at 225 mm in the scaled down SFB resulted in a
highly non-uniform radial bed fluidisation. Tapering the SFB at 60o resulted in the
wall fluidising velocity being approximately 2.5 Umfc for all rotating speeds when
the surface fluidising velocity was designated at 3 Umfs. Increasing the tapering
angle to 70o resulted in a drastic decrease in FR to a value of less than 0.3. This is
undesirable in the sense that when the bed surface is already fluidising at a velocity
of 3 Umfs, the bed particles near the wall barely fluidise since the wall fluidising
velocity is less than 1 Umfc. Increasing the tapering angle also resulted in higher air
feed requirements in order to maintain 3 Umfs at the bed surface for the same bed
depth of 150 mm. This can be attributed to the bigger cross sectional area for
airflow at the bed surface when tapering at 70o (0.231 m2) compared to tapering the
SFB at 60o (0.201 m2) with the same tapering height of 225 mm. This 15%
reduction in surface area was also reflected in the air feed requirements, whereby
operating the SFB tapered at 60o at 5-g loading, for example, required 520.6 m3/hr
(at 30oC) of air input while 598.8 m3/hr (at 30oC) of air was required when the
tapering angle was increased to 70o for the same operating conditions. In addition,
the ratio of Lo/Li for a SFB tapered at 70o was 0.56, which had exceeded the limit of

63
0.4. Therefore, increasing the tapering angle from 60o to 70o not only resulted in a
highly non-uniform radial fluidisation but also higher air feed requirements.
To investigate the effect of tapering the SFB at different angles, the tapering
height had to be varied as well for the reason discussed previously regarding the
limit of tapering angle at a certain tapering height. Reducing the tapering height
from 225 mm to 200 mm shifted the minimum limit of tapering angle to 53.1o. To
allow for sufficient length for air inlet, the feasible tapering angle for this tapering
height is in the excess 60o. Since the effects of tapering at an angle of 60o had been
studied extensively in the previous section and that increasing the angle beyond 70o
is detrimental to fluidisation in the radial direction, investigations on the optimum
tapering angle at a tapering height of 200 mm were abandoned. To study the effect
of tapering at angles of 50o and 40o, the tapering height should be reduced to 150
mm and 100 mm respectively. Maintaining the bed depth at 150 mm, the effects of
changing the tapering angle (and corresponding tapering height) were presented in
Table 4.10.
Tapering the SFB at a height of 150 mm and angle of 50o (Case III) resulted
in FR being approximately one. Decreasing the tapering height to 100 mm while
maintaining the same angle of 50o (Case IV) resulted in very low values of this ratio
(in the vicinity of 0.5). These values were clearly lower than the acceptable limit of
0.67. However, decreasing the tapering angle to 40o while maintaining the tapering
height at 100 mm (Case V) also resulted in equal fluidisation at the bed surface and
near the combustor wall (FR ≈ 1). However, decreasing the tapering height from 150
mm to 100 mm and the tapering angle from 50o to 40o resulted in the increase in Li
(the length of the combustor at the bed surface) at a constant bed depth of 150 mm
from 300 mm to 419.2 mm. Thus, the cross sectional area for airflow at the bed
surface was increased by approximately 40% to 0.395 m2. This increase in surface
area led to an increase in air feed requirements (at a similar percentage) in order to
reach a condition of 3 Umfs. Since, all three cases of I, III and V gave desirable
values of FR and range of air feed requirements when operated at ambient conditions
(30oC), the optimisation of the tapering angle was further extended to include

64
operation at combustion temperature (800oC). The results obtained were tabulated
in Table 4.11.
Table 4.10: Fluidisation conditions and air feed requirements at ambient (30oC)
for different tapering angles, tapering heights and rotating speeds in the SFB
primary chamber (length 300 mm, ID 600 mm, bed depth 150 mm)
g-loading
Tapering height, X
(m)
Lo(m)
Li(m)
FR(tapered)
Air flow rate, Q @ 3 Umfs, 30oC
(m3/hr)
Lo/Li
CASE III : Tapering angle = 50o
5 0.91 732.00 10 0.95 1,252.33 15 0.15 0.0483 0.3000 0.97 1,679.28 0.16 20 0.99 2,050.16 25 1.00 2,382.57
CASE IV : Tapering angle = 50o
5 0.42 936.74 10 0.44 1,602.61 15 0.1 0.1322 0.3839 0.45 2,148.97 0.34 20 0.46 2,623.59 25 0.47 3,048.97
CASE V : Tapering angle = 40o
5 0.99 1,022.79 10 1.04 1,749.83 15 0.1 0.0616 0.4192 1.06 2,346.38 0.15 20 1.08 2,864.59 25 1.09 3,329.05

65
Table 4.11: Fluidisation conditions, air feed requirements and stoichiometric rice husk feed rates for a SFB tapered at different heights
and angles while operating at 800oC (primary chamber length 300 mm, ID 600 mm, bed depth 150 mm)
g-loading
Tapering height, X
(m)
Operating
Umfs
No. of Umfcnear wall atoperating
Umfs
FR (tapered)
Air flow rate, Q @ operating Umfs, 800oC
(m3/hr)
Air flow rate, Q @ operating Umfs,
30oC (m3/hr)
Rice husk feed rate
@ 3.5 Umfs, 800oC (kg/hr)
Primary chamber
volume, Vc(m3)
Vfree
(Vc – Vsand)(m3)
Rice husk
burnout time (min)
CASE I : Tapering angle, θ = 60o
5 2.37 0.68 320.01 90.37 26.98 4.40 10 2.41 0.69 628.73 177.54 53.01 2.24 15 0.225 3.5 2.44 0.70 927.25 261.84 78.18 0.04356 0.01866 1.52 20 2.47 0.71 1,216.55 343.54 102.58 1.16 25 2.49 0.71 1,497.41 422.85 126.26 0.94
CASE III : Tapering angle, θ = 50o
5 2.77 0.79 449.97 127.06 37.94 3.56 10 2.81 0.80 884.04 249.64 74.54 1.81 15 0.150 3.5 2.85 0.81 1,303.80 368.17 109.93 0.05521 0.02121 1.23 20 2.88 0.82 1,710.57 483.04 144.23 0.94 25 2.91 0.83 2,105.49 594.56 177.53 0.76
CASE V : Tapering angle, θ = 40o
5 3.03 0.87 628.72 177.54 53.01 3.56 10 3.07 0.88 1,235.23 348.81 104.15 1.81 15 0.100 3.5 3.12 0.89 1,821.74 514.43 153.60 0.06489 0.02964 1.23 20 3.15 0.90 2,390.10 674.93 201.53 0.94 25 3.19 0.91 2,941.90 830.75 248.05 0.76

66
From Table 4.11, decreasing the tapering angle from 60o to 40o resulted in
more uniform radial bed fluidisation, as can be seen from the value of FR, which was
approaching unity (Case V). However, the smaller the angle of tapering, the wider
the length of the primary chamber as the air moves radially inward. And since the
bed depth was maintained at 150 mm at all three cases investigated, the cross
sectional area for airflow at the bed surface is the biggest for the smallest tapering
angle. For instance, tapering at 40o gave a cross sectional area for airflow at the bed
surface of 0.395 m2. This value was reduced to 0.283 m2 and 0.201 m2 when the
tapering angles were increased to 50o and 60o, respectively. Therefore, to maintain
fluidisation at 3 Umfs at the bed surface, higher air feed rates were required when
tapering the bed smaller angles. Increase in air feed requirements led to a direct
increase in waste inputs. Although the free volume in the primary chamber is bigger
when tapering at smaller angles, the higher rice husk feed rates when tapering at
smaller angles resulted in lower residence times of feed particles in the primary
chamber. Operating at 15-g loading, for example, gave an estimated rice husk
residence time of less than 1.5 minutes (at 1.2 minutes) for both SFB tapered at 50o
and 40o. Taking into account the lower air feed requirements and higher residence
times of feed in the primary chamber when tapering at bigger angles, it was
concluded that 60o is the optimum angle of tapering for the SFB.
Hence: The optimum angle of tapering in the SFB is 60o.
4.3.5 Terminal Velocity of Rice Husk
Operating the fluidised bed at fluidising velocities exceeding the terminal velocities
of particles will result in the elutriation of particles from the bed. Thus, the terminal
velocity, ut is the highest velocity at which a fluidised bed could be operated at to
prevent particles from being blown out of the bed. The terminal velocity of a
particle could be estimated from the following expression (McCabe et al., 1993):-

67
( )
Df
fppt C
gdu
ρρρ
34 −
= (4.2)
in which the drag coefficient, CD has to be determined experimentally. The terminal
velocity of non-spherical particles could be determined from the following
dimensionless expressions from Haider and Levenspiel (1989) and as cited by Kunii
and Levenspiel (1991):-
( ) 3
1
2 ⎥⎦
⎤⎢⎣
⎡ −=
µgρρρ
dd gpgp
*p (4.3)
( )31
2
⎥⎥⎦
⎤
⎢⎢⎣
⎡
−=
gρρµρ
uugp
g* (4.4)
Determination of ut using these expressions required the reference of Figure 4.6,
which is the graphical representation of the expression for CD developed by Haider
and Levenspiel (1989).
Low-density materials, such as rice husk, have very low values of terminal velocity.
Rice husk has a boat-like shape and its sphericity (as determined from the method
suggested in Section 2.5.3) was 0.19. Hence, the curve representing particles with
disk-like shape of sphericity 0.230 could be used to estimate its terminal velocity.
The terminal velocity for rice husk particles under the influence of gravity was
determined to be less than 1.5 m/s (Figure 4.7) for temperature ranging from 30oC to
800oC. Therefore, operating a conventional fluidised bed at a minimum requirement
of 3 Umf, for example, might result in sufficient air velocity to blow these particles
out of the bed before combustion could take place. For example, for the chosen sand
size (600 – 850 µm), operating at 3 Umf in a conventional fluidised gives a fluidising
velocity of 0.93 m/s. At combustion temperatures ranging from 600 – 800oC, the
terminal velocity of rice husk is approximately 1.3 m/s. Hence, the operating range
of fluidising velocities in a conventional fluidised bed is very narrow. The terminal
velocity of particles in a SFB, on the other hand, is higher due to the higher g-level,
which could be manipulated by adjustment of the rotating speed. The gravitational

68
term (g) in both Equations (5.3) and (5.4) is replaced by radial acceleration (ar) for
application in a SFB. The radial acceleration in the irrotational flow region of the
freeboard (Chevray et al., 1980) and evaluated at the inner radius of the bed is given
by:-
ar = r ω2 (4.5)
For the proposed SFB (primary chamber length 300 mm, ID 600 mm,
tapering height 225 mm and tapering angle 60o) operated at a bed depth of 150 mm,
the terminal velocities of rice husk evaluated at the bed surface and at different g-
loadings were also shown in Figure 4.7. It was evident from Figure 4.7 that
increasing the g-loadings at which the SFB is rotated at elevated the terminal
velocities to higher values. During operation of the SFB, the surface fluidising
velocity is maintained at 3 Umfs. These fluidising velocities, at different rotating
speeds at temperatures of cold and hot commissioning (30oC and 800oC,
respectively), were tabulated in Table 4.12.
Table 4.12: Fluidising velocities at the bed surface of the SFB operating at 3
Umfs (primary chamber length 300 mm, ID 600 mm, tapering height 225 mm,
tapering angle 60o, bed depth 150 mm, sand size 600 – 850 µm)
Fluidising velocity (at 3 Umfs) at different temperature Rotating speed (g-loading) 30 (oC) 800 (oC)
5 0.72 0.38 10 1.23 0.74 15 1.65 1.10
These fluidising velocities were much lower than the terminal velocities of
rice husk for both operating temperatures at all rotating speeds. It should also be
noted that the air velocity is further reduced progressively as the air moves radially
inward due to the tapering effect in the proposed SFB. Thus, rice husk particles will
remain in the primary chamber to be burnt instead of being blown out by the
fluidising air. These findings, apart from reiterating the advantages of a SFB over a
conventional fluidised bed, also proved that:-

69
a) Elutriation of low-density materials from the SFB could be prevented by
increasing its rotating speed, which will increase their terminal velocities,
and
b) Inclusion of the tapering section in the primary chamber of the proposed
SFB, which decreases the fluidising velocity in the radial direction inwards,
aids in preventing waste particles from being blown out of the freeboard
region before completing the combustion process.
4.3.6 Secondary Chamber Design
The proposed SFB combustor has a secondary combustion chamber, which
is projected at the same axis of rotation as the primary chamber. It has a much
bigger volume than the primary chamber (ID 600 mm and length 500 mm). The aim
of incorporating the secondary chamber are:-
i) To complete combustion in the gas phase at higher combustion
efficiency due to the higher turbulence induced by the swirling flows,
and
ii) To act as a particulate control device by removing ash through holes
drilled at the circumference of the chamber wall.
During the combustion process, especially of materials with high-volatile
content, the hot fluidised bed in the primary chamber acts as a heat source to
pyrolyse the waste materials. Thereafter, depending on the density of the resulting
chars and the mixing pattern inside the fluidised bed, the chars will either be burnt
inside the bed or at the freeboard region (central core of the primary chamber). It is
desirable that these chars burn inside the bed in order for the bed temperature to be
maintained. However, in the event that these chars be ejected to the freeboard
region by bubble eruption at the bed surface and be blown out of the primary
chamber even before complete conversion has occurred, the presence of the
secondary chamber will ensure that they burnt to completion and not be blown out
of the combustor together with the flue gas. Thus, the presence of products of

70
incomplete combustion (PICs) in the flue gas could be minimised. In addition,
given the small volume of freeboard region in the primary chamber, the evolved
volatiles has sufficient residence time to be burnt to completion as they proceed to
the secondary chamber.
Accumulation of ash in the fluidised bed during the combustion of rice husk
could be significant due to its high content of ash (14.7%). This will consequently
lead to the increase in bed depth that will interfere with the fluidisation process. The
rear end of the tapered section in the primary chamber, apart from separating the
secondary chamber from the primary chamber, also acts as a weir plate for the
spillover of ash from the sand bed once its thickness exceeded the height of the
plate. The spillover ash will then proceed to the secondary chamber, where the
high-degree of swirling flows will drive these particles to the wall region. Thereon,
holes incorporated at the wall of the secondary chamber allow for the escape of
these ash particles that will subsequently be collected in an ash pit. It is expected
that the secondary chamber will work as a cyclone in removing these ash particles,
resulting in minimised emissions of particulate matters in the exhaust gas. Hence, a
cyclone might not be needed to collect the resulting fly-ash and to control particulate
emissions from the flue gas in order to comply with existing regulations.
4.4 The Proposed SFB Combustor System
The SFB combustor will be fabricated using suitable materials (such as
stainless steel) that are able to withstand temperatures of up to 1200oC. The system
is equipped with a variable speed motor assembly capable of rotation of up to 1000
RPM, which give g-loadings of up to 335. Both the primary and secondary
combustion chambers should be jacketed and insulated. Appropriate insulation
materials should be used to minimise heat loss to the surroundings. A customised
insulation clamper should also be included for rotary motion and should be able to
seal the air, so that pressurised air of up to 4 m H2O could be supplied into the
rotating combustor.

71
Waste materials are fed via a feed hopper into the primary chamber using screw
conveyor with a diameter of 100 mm at an adjustable speed of up to 150 RPM. The
screw conveyor is equipped such that it is jacketed for secondary air inlet.
Fluidising gas enters through a perforated distributor plate (3% hole area
distributed equally) from an airtight seal jacketed around the cylindrical primary
combustion chamber. The fluidising gas is supplied by a blower that is able to
withstand very high-pressure drop (up to 4m H2O) with a maximum capacity of
1200 m3/hr (at ambient temperature). The secondary air blower has a capacity of
250 m3/hr and able to withstand pressure drop up to 1 m H2O. The secondary
chamber acts as a freeboard where complete combustion of the volatile matters in
the flue gas takes place. It was designed to allow for a minimum residence time of
flue gas of two seconds, consistent with existing regulations for incineration of
waste. Secondary combustion air is fed through the pipe jacketing the screw
conveyor, penetrating through the freeboard area of the primary chamber to the
secondary chamber.
The combustor will be operated with excess air level in the range of 60% to
100% depending on the types of waste in order to comply with the regulations of 6%
oxygen level in the flue gas. Spillover ash particles from the weir plate lip will be
collected in an ash pit located downstream of the combustor. A long reach torch
will ignite the materials in the primary chamber. Chromel/alumel (Type-K)
thermocouples (with jacketed sleevings) to record temperatures in the primary
combustion chamber (located 50 mm, 100 mm and 200 mm from the combustor
wall) as well as the flue gas temperature at the secondary combustion chamber are
connected via a rotating slip rings assembly to the display instruments. The primary
burner should be able to withstand high-pressure drop in the primary combustion
chamber while the secondary burner should be able to maintain temperatures in the
secondary combustion chamber of up to 1200oC. The blueprint of the prototype
tapered horizontal SFB combustor was shown in Figure 4.8.
Further development will involve energy recovery through a heat exchanger
to preheat the primary air prior to entering the primary combustion chamber to

72
minimise the consumption of auxiliary fuel. The proposed experimental set-up for
the entire system was shown in Figure 4.9.

CHAPTER V
THREE-DIMENSIONAL COMPUTATIONAL FLUID DYNAMICS
MODELLING OF THE SFB COMBUSTOR
5.1 Introduction
Computational fluid dynamics modelling was carried out to verify the design
of the proposed horizontal SFB combustor with tapered ends and to determine the
suitable range of operating parameters for optimum operation of the combustor. The
application of CFD to combustor design is widespread in all the new research and
development techniques in combustion technology (Nasserzadeh et al., 1993). In
particular, the use of the commercial code FLUENT is extensive due to its ability in
replicating actual trends observed experimentally. FLUENT is a powerful general-
purpose computer program for modelling fluid flow, heat transfer and chemical
reaction. The basic approach utilised is that of solving the conservation equations
for mass, momentum, energy and chemical species using a control volume based
finite difference method. Researchers such as Nasserzadeh et al. (1993) and
Rozainee (1998) had proven the validity of the results obtained through modelling in
FLUENT. In their study of the flows and combustion profiles in a municipal solid
waste (MSW) incinerator, Nasserzadeh et al. (1993) found that the program was
capable in predicting all the major features of the incinerator flow and temperature
fields. On the other hand, Rozainee (1998) showed that modelling results had
correctly indicated the trends in gaseous combustion and particle trajectories in a
vertical SFB. Hence, the results obtained in this modelling works could be utilised
with a very high level of confidence.

74
The scopes of modelling of the horizontal SFB combustor are:-
a) determination of the flow profiles in the combustor to investigate the flow
patterns and to provide a basis for design improvements,
b) investigation into the trajectories of particles of different sizes at different
combination of operating conditions (air inputs, rotating speeds) to provide
insight into the ash accumulation and entrainment behaviour,
c) simulation of gaseous combustion to determine the optimum operating
parameters for bed starting-up and for efficient gas-phase combustion, and
d) simulation of rice husk combustion to determine the allowable range of
operating parameters for optimum and efficient combustion.
5.2 Model Set-Up
The modelling domains were created using the GAMBIT software package
(pre-processor for CFD packages). GAMBIT is a versatile software package
designed to help analyst and designer build and mesh models for CFD and other
scientific applications. Although the basic steps of building and meshing a model
are made simple and intuitive, it is capable to accommodate a wide range of
modelling applications.
5.2.1 Factors Influencing the Choice of Grid
Although FLUENT can use grid comprising of triangular or quadrilateral
cells (or a combination of the two) in 2D, and tetrahedral, hexahedral, pyramid or
wedge cells (or a combination of these) in 3D, the choice of mesh type depended
largely on specific application. The choice of mesh type, in turn, is largely
controlled by the following issues:-

75
i) Set-up time
ii) Computational Expense
iii) Numerical diffusion
Although not impossible, the creation of structured grids (consisting of
quadrilateral or hexahedral elements) for complex geometries can be extremely
time-consuming. The major motivation for using unstructured grids employing
triangular or tetrahedral cells, therefore, lies in the significant savings in set-up time.
Savings in time apart, the geometry involved in the present modelling cases was
relatively complex, rendering the implementation of the unstructured grid practical.
A triangular/tetrahedral mesh can often be created with far fewer cells than
the equivalent mesh consisting of quadrilateral/hexahedral elements. This has direct
effect on the expense of computation as a triangular/tetrahedral mesh allows cells to
be clustered in selected regions of the flow domain, whereas structured
quadrilateral/hexahedral meshes will generally force cells to be placed in regions
where they are not needed. However, quadrilateral/hexahedral elements permit a
much larger aspect ratio than triangular/tetrahedral cells. Aspect ratio is the measure
of the stretching of the cell. A large aspect ratio in triangular/tetrahedral cell will
invariably affect the skewness of the cell, an undesirable trait as it impedes accuracy
and convergence. Thus, the practice of using high-aspect-ratio
quadrilateral/hexahedral cells is recommendable for simple geometry as the mesh is
likely to have far fewer cells than if triangular/tetrahedral cells were used.
Numerical diffusion is a dominant source of error in multidimensional
modelling. The amount of numerical diffusion is inversely related to the resolution
of the mesh and is minimised when the flow is aligned with the mesh. The flow in a
domain using quadrilateral/hexahedral cells can be aligned with the mesh in simple
flows, but not if triangular/tetrahedral cells are used instead.
Another factor to be considered is the inclusion of swirling motion, which generates
steep gradients in the flow domain. Typically, rotating boundary layers may be very
thin, and the FLUENT model will require a very fine grid near a rotating wall. In
addition, swirling flows will often involve steep gradients in the circumferential

76
velocity (eg, near the centreline of a free-vortex type flow), and thus require a fine
grid for accurate resolution.
5.2.2 Grid Optimisation
Numerical errors in computation during the modelling works are largely
determined by the quality of the grid generated. This necessitates the use of a more
refined grid. Nonetheless, the computing time involved in order to reach converged
solutions should also be taken into account as it highly depends on the size of the
grid cells. Finer grid cells are able to capture thinner layer in the gradients of the
flow variables, thereby able to give a more accurate solution to the problem. For a
fixed size of a modelling domain, the smaller the size of the grid cells, the bigger the
amount of the cells at which the governing equations should be solved for. As the
choice of grid determined in early stages of the cold-flow modelling will be applied
in subsequent non-isothermal reacting flows, it is imperative to optimise the size of
the grid to be used. The purpose of the optimisation process is to determine an
acceptable grid size that is able to reach a balance between the amount of computing
time and the accuracy in the solution of the flow variables.
The geometry of the proposed horizontal SFB with tapered ends is complex
due to the presence of the tapered section in the primary chamber. In the modelling
domain, both end walls of the primary chamber are oblique to the chamber axis
whereas the secondary chamber is a cylinder. With the foresight that future
improvements, if any, on the design of the proposed SFB might be necessary, it is
therefore crucial to select a consistent meshing scheme so that any changes observed
in the flow variables of the solved cases is due only to the changes applied to the
design. The TGrid meshing scheme satisfied this criterion in terms of its ability to
mesh any complex geometry especially those with the presence of internal structure
such as baffle. It is an unstructured form of meshing scheme that creates a mesh
consisting primarily of tetrahedral mesh elements but which may also contain
hexahedral, pyramidal and wedge mesh elements. Therefore, this meshing scheme
was chosen.

77
In the optimisation process, the spacing between the nodes in the mesh was
varied. Nodes are points at which flow variables are to be calculated from the
governing equations. The dimensions of the grid generated are similar to the actual
dimensions of the proposed SFB prototype. The modelling domain created was a
90o slice of the entire SFB due to its axisymmetrical nature. By setting the boundary
condition at the axisymmetric plane as periodic to represent rotational movement,
the solution for the flows in the SFB could be obtained at fraction of the time
required if the entire rig were to be modelled. It was found that decreasing the
interval size of the nodes by half from 20 to 10 resulted in a slight increase in the
amount of grid cells (from 32 509 to 32 578). The slight increase was not in
proportion to the reduction in interval size due the random order in which cells were
placed in the TGrid meshing scheme. The velocity vectors captured in the
axisymmetric plane for both grids were in good agreements with each other, as
shown in Figure 5.1 and Figure 5.2 (for node size interval of 10 and 20
respectively). Reducing the interval size further to 1 resulted in the same amount of
grid cells as that of an interval size of 10 (at 32 578). However, solving for the flow
variables in this grid was highly unstable, with residuals that did not show the
decreasing trend. With the choice of grid with interval sizes of 20 and 10, the
former was chosen based on the lesser computing time involved.
5.3 Governing Equations and Numerical Solution
5.3.1 Mathematical Model of the Gas Phase
Prediction of the isothermal flow field in the computational grid is through solution
of the equations for the conservation of mass and momentum in their time averaged
form.
Conservation of mass (incompressible flow):-
( ) 0=∂∂
ii
ρ ux
(5.1)

78
The velocity at any one point in turbulent flows is taken as the sum of the mean
(ensemble-averaged) and fluctuating components:- 'iii uuu += (5.2)
Substituting expression of this form into the instantaneous momentum equations
yields the ensemble-averaged momentum equation:-
( ) ( 'j
'i
jiij
l
l
i
j
j
i
jji
j
uuρxx
Pxu
xu
xu
µx
uux
−∂∂
+∂∂
−⎪⎭
⎪⎬⎫
⎪⎩
⎪⎨⎧
⎥⎥⎦
⎤
⎢⎢⎣
⎡
∂∂
−⎟⎟⎠
⎞⎜⎜⎝
⎛
∂
∂+
∂∂
∂∂
=∂∂ δρ
32 ) (5.3)
A turbulence model is required since the process of Reynolds decomposition and
time averaging results in unknown correlations of the fluctuating velocity
components. Using the εκ − model, the second order tensor of “Reynold stresses”
or ( )'j
'iuuρ− (incorporating the effect of turbulence) is modelled using the
Boussinesq hypothesis. The Reynold stresses is related to the mean velocity
gradients via:-
( ) ⎟⎟⎠
⎞⎜⎜⎝
⎛
∂
∂+
∂∂
−⎟⎟⎠
⎞⎜⎜⎝
⎛∂∂
+=i
j
j
itij
i
it
'j
'i x
uxu
µδxu
µρκuuρ32 (5.4)
For swirling flows in a SFB, the RNG (renormalization group) εκ − model
was used. Belonging to the εκ − family of models, the model equations in their
RNG form are similar to those for the standard εκ − model. The standard εκ −
model is widely applied in engineering practice (Tobiś, 2000). However, several
researchers (Sloan et al., 1986; Sturgess and Syed, 1985; Srinivasan and Moagia,
1980) noted through Xia et al. (1998) that its performance is less satisfactory for
swirling flows as it poorly predicts the size and strength of recirculating zones. It
tends to produce an excessive solid-body component type of rotation for swirling
flows. This was proved in the initial investigations into the airflow profile in the
SFB operated at 15-g loading and 3 Umfc (at room temperature) as shown in Figure
5.3. The steep velocity gradients in the swirling flows in the SFB (especially in the
secondary chamber) were not fully captured using the standard εκ − model. As a

79
result, the flows in secondary chamber tend to approach that of a solid body rotation
type of movement, with velocity vectors of the airflow (Figure 5.4) near the vortex
regions moving primarily in the circumferential direction due to the rotational
movement. According to Lilley and Chigier (1971), this phenomenon might be
attributed to the isotropic eddy viscosity assumption in the standard εκ − model.
The RNG εκ − model, on the other hand, takes better account of the effect of extra
strain rates, as indicated by Hanjalic (1994) through Xia et al. (1998). This can be
observed from Figure 5.5, which showed improvements in the stepping of velocity
gradients especially in the vortex regions for the SFB operated at the same operating
conditions but using the RNG εκ − model instead of the standard εκ − model.
The swirling flows in these free vortex regions were no longer moving as a solid
body rotation, but found to moving as recirculating flows (Figure 5.6). This is
because the RNG εκ − model takes into account the effect of swirl on turbulence,
thus enhancing the accuracy for swirling flows. In general, turbulence in swirling
flows is affected by rotation or swirl in the mean flow. The RNG model in
FLUENT provides an option to account for the effects of swirl or rotation by
modifying the turbulent viscosity appropriately. A differential form of the relation
for effective viscosity was employed, yielding an accurate description on how the
effective turbulent transport varies with the effective Reynolds number.
The turbulent viscosity, tµ was computed from the functional form:-
⎟⎠⎞
⎜⎝⎛ Ω=
εκαµµ ,,0 cstt f (5.5)
where
0tµ = ε
κρ2
0845.0
cΩ = characteristic swirl number (evaluated within
FLUENT)
sα = swirl constant
(0.05 for mildly swirling flow; 0.07 for swirl-
dominated flow)

80
The values of turbulent kinetic energy, κ and its rate of dissipation, ε were
determined by numerical integration of the system of differential equations (5.6) and
(5.7):-
( ) ρεκµα κκ −+⎟⎟⎠
⎞⎜⎜⎝
⎛∂∂
∂∂
=∂∂ G
xxκρu
x it
ii
i
(5.6)
( ) RκερC
κεGC
xεµα
xερu
x εκεi
tεi
ii
−−+⎟⎟⎠
⎞⎜⎜⎝
⎛∂∂
∂∂
=∂∂ 2
21 (5.7)
The term represents the generation of turbulent kinetic energy due to the mean
velocity gradients, given by:-
κG
i
j'j
'i x
uuuρG
∂
∂−=κ (5.8)
or, consistent with the Boussinesq hypothesis,
i
j
i
j
j
it x
uxu
xu
G∂
∂⎟⎟⎠
⎞⎜⎜⎝
⎛
∂
∂+
∂∂
= µκ (5.9)
The effects of rapid strain and streamline curvature is given by the last term in
equation (5.7), where
κε
η
ηρη 2
3
3
012.0138.4
10845.0
+
⎟⎠⎞
⎜⎝⎛ −
=R (5.10)
and
η = εκS
= modulus of the mean rate-of-strain tensor S

81
= mean strain rate, ijS⎥⎥⎦
⎤
⎢⎢⎣
⎡⎟⎟⎠
⎞⎜⎜⎝
⎛
∂
∂+
∂∂
i
j
j
i
xu
xu
21
For high Reynolds number, the values of the inverse Prandtl numbers for κ and ε
( εκ )αα and are approximately 1.393. The coefficients and are empirical
constants having the following values:-
ε1C ε2C
42.11 =εC and 68.12 =εC
5.3.2 Equation of Motion for A Particle
FLUENT predicted the trajectory of a discrete phase particle by integrating
the force balance on the particle, which is written in a Langrarian reference frame.
This force balance equates the particle inertia with the forces acting on the particle,
and can be written (for the x direction in Cartesian coordinates) as
( ) ( )x
p
pxpD
p Fg
uuFdt
du+
−+−=
ρρρ
(5.11)
where FD(u – up) is the drag force per unit particle mass and
24Re18
2D
ppD
CD
Fρ
µ= (5.12)
Here, u is the fluid phase velocity, up is the particle velocity, µ is the molecular
viscosity of the fluid, ρ is the fluid density, ρp is the density of the particle, and Dp is
the particle diameter. Re is the relative Reynolds number, which is defined as
µ
uuρD pp −=Re (5.13)

82
The drag coefficient, CD can be taken from either
232
1 ReReaa
aCD ++= (5.14)
where a’s are constants that apply for smooth spherical particles over several ranges
of Re given by Morsi and Alexander (1972) or
( )Re
ReRe1
Re24
4
31
2
++=
bb
bC bD (5.15)
where
b1 = 2.3288 – 6.4581φ + 2.4486φ2
b2 = 0.0964 + 0.5565φ
b3 = 4.905 – 13.8944φ + 18.4222φ2 – 10.2599φ3
b4 = 1.4681 + 12.2584φ – 20.7322φ2 + 15.8855φ3
which is taken from Haider and Levenspiel (1989) for nonspherical particles. The
shape factor, φ, is defined as
Ss
=φ (5.16)
where s is the surface area of a sphere having the same volume as the particle, and S
is the actual surface area of the particle.
The additional force term, Fx in Equation (5.11) includes the Coriolis and
centrifugal forces acting on the particle arising from the rotational movement of the
SFB. For rotation defined about the x axis, the forces on the particles in the
Cartesian x and y direction can be written as

83
⎟⎟⎠
⎞⎜⎜⎝
⎛−Ω+Ω⎟
⎟⎠
⎞⎜⎜⎝
⎛− z
ppz
p
uuyρρ
ρρ
,2 2 1 (5.17)
where uz,p and uz are the particle and fluid velocities in the Cartesian z direction, and
⎟⎟⎠
⎞⎜⎜⎝
⎛−Ω−Ω⎟
⎟⎠
⎞⎜⎜⎝
⎛− y
ppy
p
uuzρρ
ρρ
,2 2 1 (5.18)
where uy,p and uy are the particle and fluid velocities in the Cartesian y direction.
The trajectory equations were solved by stepwise integration over discrete
time steps. Integration in time of Equation (5.11) yielded the velocity of the particle
at each point along the trajectory, with the trajectory itself predicted by
pudtdx
= (5.19)
pvdtdy
= (5.20)
pwdtdz
= (5.21)
The particle phase was assumed to be sufficiently dilute, thus rendering negligible
effects on the continuous phase.
5.3.3 Mathematical Model for Reactive Chemistry
5.3.3.1 Single Phase Reacting Flows
Governing equations for modelling of single phase reacting flows were presented as
follows:-

84
Conservation equation for enthalpy:-
( ) hj i
jj
ip
t
ii
i
Sxm
hxh
ckk
xhρu
x+
⎥⎥⎦
⎤
⎢⎢⎣
⎡⎟⎟⎠
⎞⎜⎜⎝
⎛∂
∂−
∂∂
⎟⎟⎠
⎞⎜⎜⎝
⎛ +∂∂
=∂∂ ∑ (5.22)
where
k = molecular conductivity
tk = turbulent thermal conductivity
pc = mixture heat capacity, ⎥⎦
⎤⎢⎣
⎡= ∑
jpjjCm
hS = enthalpy source term due to chemical reaction
= ⎥⎥⎦
⎤
⎢⎢⎣
⎡⎟⎟⎠
⎞⎜⎜⎝
⎛+= ∑ ∫
jj
T
T p,jj
oj RdTc
Mh ref
jref
with being the enthalpy of formation
of species j and being the volumetric rate of creation of species j
ojh
jR
Conservation of chemical species in turbulent flows:-
( ) ii
i
ct
ti,m
iii
i
Rxm
Sµ
ρDx
mρux
+∂∂
⎟⎟⎠
⎞⎜⎜⎝
⎛+
∂∂
=∂∂ (5.23)
where
im = local mass fraction of chemical species i
iR = mass rate of creation or depletion by chemical reaction
miD , = diffusion coefficient of i in the mixture
ctS = turbulent Schmidt number, t
t
ρDµ (with a default setting of 0.7)
The source of chemical species i due to reaction, is computed as the sum of the
reaction sources over the N
iR
R reactions that the species may participate in:-

85
ki
N
kii
R
RMR,1
∑=
∧
= (5.24)
where
iM = molecular weight of species i
kiR ,
∧
= molar rate of creation/destruction of species i in reaction k
The reaction rate, is controlled either by an Arrhenius kinetic rate expression or
by the mixing of the turbulent eddies containing fluctuating species concentration.
kiR ,
∧
Arrhenius reaction rate:-
∏⎟⎠⎞
⎜⎝⎛−−=
N
tsreacjj
kk
kikiki
kjCRTE
ATMRtan
,,,
,exp ηβυ (5.25)
where
ki,υ = molar stoichiometric coefficient of species i in reaction k
(positive value or reactants, negative value for products)
iM = molecular weight for species i (kg/kmol)
kβ = temperature exponent (dimensionless)
kA = pre-exponential factor (consistent units)
kE = activation energy for the reaction (J/kmol)
R = universal gas constant (J/kmol-K)
jC = molar concentration of each reactant j (kmol/m3)
kj ,η = rate exponent for reactant j in reaction k
Input values for ki,υ , kj ,η , kβ , and are user-specified or retrieved from the
database during problem definition in FLUENT.
kA kE

86
The influence of turbulence on the reaction rate is taken into account by
employing the Magnussen and Hjertager (1976) model. In this model, the rate of
reaction, is given by the smaller (limiting value) of the following two
expressions:-
kiR ,
RkR
Rikiki M
mAMR,
,, υκερυ= (5.26)
j
N
jkj
Pikiki
M
mABMR
∑∑=
,
,,
υκερυ (5.27)
where
Pm = mass fraction of any product species P
Rm = mass fraction of a particular reactant R
R = reactant species giving the smallest value of kiR ,
A = empirical constant (= 4.0)
B = empirical constant (= 0.5)
The eddy dissipation model relates the rate of reaction to the rate of
dissipation of the reactant- and product-containing eddies. The time scale of the
turbulent eddies is represented by κε , following the eddy dissipation model of
Spalding (1970). In turbulent reacting flows, reaction rates from the Arrhenius
expression and eddy dissipation model are calculated within FLUENT. The slowest
(limiting) rate is then used as the controlling reaction rate, whereupon the
contributions to the source terms in the species and energy conservation equations
are calculated from.
In modelling of reacting gas flow, the fluid density is calculated based on the
ideal gas law for an incompressible flow:-

87
∑=
i
i
Mm
RT
Pρ (5.28)
where R is the universal gas constant, i
i
Mm
provides the molecular weight of the
local mixture and is the input value of the operating pressure. P
5.3.3.2 Mixture Fraction / PDF Modelling Approach for Particle Combustion
The mixture fraction / PDF modelling approach involves the solution of
transport equations for one or two conserved scalars (the mixture fractions).
Through this approach, instead of solving the transport equations for individual
species, the individual component concentrations for a certain species of interest are
derived from the predicted mixture fraction. Therefore, the usually unknown
reaction mechanisms need not be explicitly user-defined but is treated using certain
system chemistry calculations (eg the flame sheet approximation, equilibrium
assumption and non-equilibrium chemistry). Physical properties of chemical species
and equilibrium data are retrieved from the chemical database while the interaction
of turbulence and chemistry is accounted for with a probability density function or
PDF.
The PDF modelling approach is specifically developed for reaction processes
in which turbulence mixing is the limiting rate for reaction progress. By allowing
intermediate species formation, dissociation effects and the coupling between
turbulence and chemistry to be accounted for in a rigorous way, this method is
computationally efficient by making the solution of a large number of species
transport equations unnecessary. The basis of the mixture fraction approach is that
under a certain set of simplifying assumptions, the instantaneous thermochemical
state of the fluid is related to a conserved scalar quantity known as the mixture
fraction, f. Being a conserved scalar quantity, the value of f at each point in the flow

88
domain is computed in FLUENT through the solution of the conservation equation
for mean (time-averaged) value of f in the turbulent flow field, f :-
( ) mit
t
ii
i
Sxf
σµ
xfρu
x+⎟⎟
⎠
⎞⎜⎜⎝
⎛∂∂
∂∂
=∂∂ (5.29)
where Sm represents the transfer of mass from reacting particles into the gas phase.
In addition to solving the conservation equation for the mean mixture
fraction, a conservation equation for the mixture fraction variance, 2'f is also
solved:-
( ) 2
222 '
di
tgi
'
t
t
i
'i
i
fκερC
xfµC
xf
σµ
xfρu
x−⎟⎟
⎠
⎞⎜⎜⎝
⎛∂∂
+⎟⎟⎠
⎞⎜⎜⎝
⎛
∂∂
∂∂
=∂∂ (5.30)
where the constants tσ , and take the values of 0.7, 2.86 and 2.0,
respectively. The mixture fraction variance is used in the closure model describing
the turbulence-chemistry interactions.
gC dC
Calculation of a single conserved scalar field, f enables the derivation of
other important scalars (individual species mole fractions, density and temperature)
without the need to solve their respective transport equations. Provided the
description of the reacting system chemistry, the mixture fraction value at each point
in the flow field can be used to compute the instantaneous values of these scalars. If
a secondary stream is included in a non-adiabatic system, the instantaneous values
will depend on the instantaneous fuel mixture fraction, ffuel, the secondary partial
fraction, psec and the enthalpy, H*:-
( )*fuelii ,H,pf secφφ = (5.31)
where iφ represents the instantaneous species concentration, density or temperature,
while H* is given by:-

89
( )∑ ∫∑ ⎥⎦⎤
⎢⎣⎡ +==
' ''
'
'','''*
i
T
T refoiipi
iii
irefi
ThdTcmHmH (5.32)
The non-adiabatic model is required in particle-laden flows (particle combustion
systems) since such flows include heat transfer to the dispersed phase.
The functional relationship between iφ (species, density and temperature)
and mixture fraction depend on the description of the system chemistry. For
modelling of rice husk particle combustion in which the formation of intermediate
species takes place, the equilibrium assumption chemistry model is appropriate.
With this model, no specific reaction mechanism and specific reaction rates are
required. Only important chemical species that will be present in the system need to
be defined. Prediction of the mole fraction of each species will then be carried out
by FLUENT based on chemical equilibrium.
However, FLUENT prediction of the turbulent reacting flow is concerned
with the prediction of the time-averaged values of the scalars in Equation (5.31).
The next step, hence, is to relate these instantaneous values to their respective time-
averaged values based on the turbulence-chemistry interaction model, which in this
case applies the PDF approach as its closure model since the mixture fraction / PDF
modelling approach is used.
The probability density function, written as p(f), describes the fraction of
time that the fluctuating variable f takes on a value between f and f + ∆f. Expressed
mathematically, it takes on the following form:-
( ) ∑∞→=
iiTτ
T∆ffp 1lim (5.33)
where is the fraction of time that f spends in the iτ f∆ band.

90
The probability density function, p(f) which describes the temporal
fluctuations of f in the turbulent flow is used to compute time-averaged values of
variables that depend on f. Time-averaged values of species mole fractions and
temperature can be computed, in a non-adiabatic system with a secondary stream,
as:-
( ) ( ) ( ) secsec21*
sec
1
0
1
0 ,, dpdfppfpHpf fuelfuelfuelii ∫ ∫= φφ (5.34)
where p1 is the PDF of ffuel, p2 is the PDF of psec, and *H is the time-averaged
enthalpy solved from:-
( ) hk
iik
ip
t
i
*i
i
Sxu
xH
ck
xHρu
x+
∂∂
+⎟⎟⎠
⎞⎜⎜⎝
⎛
∂∂
∂∂
=∂∂ τ
*
(5.35)
where Sh accounts for source terms due to radiation, heat transfer to wall boundaries,
and heat exchange with the second phase.
In a similar form, the true time-averaged fluid density is computed as:-
( ) ( )( ) sec
1
0
1
0 *sec
sec21 ,,
1 dpdfHpfρ
ppfpρ fuel
fuel
fuel∫ ∫= (5.36)
In Equation (5.36), ( )*sec , Hpfρ fuel, is the instantaneous density obtained
using the instantaneous species mole fractions and temperature in the gas law
equation. Using equations (5.34) and 5.36), the shape of the function p1(ffuel) and
p2(psec) need to be specified in order to determine the local time-averaged state of the
fluid at all points in the flow field. In FLUENT, the shape of the PDF, p(f), is
described by either the double delta function or the β-function. Since the β-function
is thought to represent most closely experimentally observed PDF’s than the easily
computed but less accurate double delta function, it is used in the present modelling
study. The β-function PDF shape is given by the following function of f and 2'f :-

91
( ) ( )( )∫ −−
−−
−−
=dfff
fffp 11
11
11
βα
βα
(5.37)
where
( )⎥⎥⎦
⎤
⎢⎢⎣
⎡−
−= 11
2'ffffα and ( ) ( )
⎥⎥⎦
⎤
⎢⎢⎣
⎡−
−−= 11 1
2'ffffβ
5.3.4 Modelling and Solution Procedures
For the two-mixture-fraction (secondary stream) case, the preprocessor
prePDF calculates the instantaneous values for the temperature, density and species
mole fractions (Equation 5.31) and stores them in the look-up tables. For the non-
adiabatic case with two mixture fractions, the 3D look-up table contains the physical
properties as functions of the fuel mixture fraction, the secondary partial fraction and
the instantaneous enthalpy. The PDF functions p1 and p2 of the fuel mixture fraction
and the secondary partial fraction, respectively, are calculated inside FLUENT from
the values of the fractions and their variances. The PDF integrations for calculating
the mean values for the properties are also performed inside FLUENT (using
Equation 5.34 together with Equation 5.36). The instantaneous values required in
the integrations are obtained from the look-up tables. The algorithm for solving a
non-adiabatic two-mixture-fraction case was depicted in Figure 5.7.
For two-mixture-fraction problems, the 3D look-up table allows FLUENT to
determine the instantaneous values for the scalar properties from instantaneous
values of ffuel, psec and H*. The three-dimensional table is the visual representation of
Equation (5.31). These instantaneous values are used to perform the integration of
Equation (5.34).
92
5.4 Numerical Approach
The FLUENT computer code (version 5.3 and version 5.5) together with
calculation data from the equations of fluidisation in a SFB to provide boundary
conditions, were used to model the fluid flows and trajectories of particles in a SFB
at various operating conditions. Judging from the symmetry in geometry of the SFB
and computational efforts, only a quarter of the entire SFB combustor was modelled.
The boundary condition at the axisymmetrical cross sectional area was set as
periodic to represent rotational movement (Figure 5.8). The model consisted of an
unstructured grid of 32 509 cells employing the TGrid meshing scheme, consisting
primarily of tetrahedral cells, with hybrid (hexahedral, pyramidal and wedge) cells
being placed at appropriate locations. The axis of rotation was set at the x direction
in the Cartesian coordinates. The flow profiles in the model were first established in
an isothermal condition after which ash particles of various sizes were injected and
their respective trajectories charted. Air at ambient temperature and certain flow
rates consistent with the desired operating conditions entered radially through the
distributor plate. However, velocity vectors of the airflow were imparted a
tangential component upon entering the porous or perforated distributor plate due to
frictional force. The default convergence criteria were that iterations were
performed until the scaled residuals decrease to a value of 10-3 for all equations
except for energy, whereby the value of 10-6 applies.
5.5 Fluid Dynamics Feature of the SFB Freeboard
Flow field in the freeboard of the SFB is divided into three distinct regions
(Figure 5.9) and is affected, in general, by cylinder geometry, bed rotating speed and
fluid flow rate. In Region 1, the tangential velocity component varies inversely with
radius to maintain a constant angular momentum in gas. The flow in this region is
irrotational, very similar to the free vortex flow. Region 2 consists of regions
whereby the fluid is in contact with the top and bottom end walls and moving as a
rigid body. The tangential velocity component is proportional to the radius

93
( ). The radial variation in pressure in the end wall boundary layers (Region
2) is determined by radial variations in in Region 1. Axial differences in
tangential velocity between Region 1 and Region 2 results in positive radial pressure
gradients. Hence, there are net radial flows inward along the end walls towards axis
of rotation. Near the axis of rotation, viscous effect limits the
rut ∝
tu
r1 increase in (as
in Region 1). A region of solid body rotation is thus established (Region 3). With
decreasing radial position, the tangential velocity component started to decrease,
until it becomes zero at the axis of rotation. The variation in the tangential velocity
component in the SFB was given by Figure 5.10.
tu
The extent of Region 1 and Region 3 is determined by ratio of tangential to
radial initial component of momentum (Equation 5.38). The higher the ratio, the
greater the extent of rotational core (Region 3). On the other hand, the lower the
ratio, the higher the extent of free vortex region (Region 1).
( )( )ir
it
i
m
ruru
rr
05.0= ; Hr
Qui
r π2−= and it ru ω= (5.38)
where = volumetric flow rate of gas Q
= inner radius of bed ir
H = height of bed
Radius of the viscous core, corresponds to the location of maximum .
For SFB with small values of bed length-to-diameter
cr tu
⎟⎠⎞
⎜⎝⎛
DH ratios, the locations of
the exit port and maximum tangential velocity are nearly coincident . ( )cmE rrr ≈≈
The velocity distribution of the tangential, axial and radial components in the
SFB were given by the following equations:-

94
Tangential component
Viscous core : ( ) rHr
Qrui
t 242
2
100πω
= ; mrr ≤≤0 (5.39)
Irrotational region : ( )rr
ru it
2 ω= ; im rrr ≤≤ (5.40)
Axial component
Viscous core : ( ) zHr
Qzum
z 2π= ; mrr ≤≤0 (5.41)
Irrotational region : ( ) 0=zuz ; im rrr ≤≤ (5.42)
Radial component
Viscous core : ( ) rHr
Qrum
r 22π−= ; mrr ≤≤0 (5.43)
Irrotational region : ( )rH
Qrur π2−= ; im rrr ≤≤ (5.44)
5.6 Analysis of Modelling Results
Results from the computer modelling were held in storage arrays of very
large size representing complicated three-dimensional distribution. Hence,
presentation of the data in an intelligible form demanded almost as much efforts as
the computations themselves. To facilitate interpretation of results, vector plots,
isometric projections and contour lines had been employed. In the discussion of the
modelling results, the SFB combustor referred to the proposed design of the tapered
horizontal SFB as determined in Chapter V, unless otherwise stated.

95
5.6.1 Modelling of Airflow Profiles in the SFB
Fluid flow profiles inside a combustor affect the distribution of unburnt
gaseous components as well as the trajectories of particles. Such flow profiles,
which could be captured and studied through CFD package such as FLUENT, are
useful in providing information on how the flow behave inside the combustor.
Moreover, the formation of undesirable dead zones inside the combustor could be
determined so that design modifications could be made to the combustor to rectify
the design drawbacks. The distribution of unburnt gases inside the combustor, on
the other hand, could in turn provide insight into the efficiency of combustion in the
gas phase. Meanwhile, the trajectories of particles inside the combustor serve to
provide information on the entrainment of particles from the combustor. Thus, a
cold flow model of the proposed SFB combustor was established to simulate the
airflow behaviour inside the combustor. The fluidising velocity at the distributor
inlet of the SFB was designated at 3 Umfc to satisfy the requirement to establish
sufficient turbulence inside the bed. The rotating speed of the SFB was set at 15-g
loading, which gave a rotational speed of 211 RPM.
Modelling of flow field profiles in the horizontal tapered SFB showed that
regions of recirculating flows were dominant in the secondary chamber, especially
near the entrance of the secondary chamber (Figure 5.11). This was due to the rapid
convergence of fluid to the primary chamber exit (effect of the tapered end walls)
followed by sudden expansion in flow as the fluid entered the secondary chamber,
resulting in the formation of eddies behind the expansion region. This phenomenon
was also observed by Xia et al. (1998) in their numerical and experimental study of
swirling flow in a model combustion chamber with an inlet that is oblique to the
chamber axis. They observed that a corner recirculation zone appeared just behind
the expansion region adjacent to the air inlet, as had been observed in the present
SFB model. Contours of static pressure inside the tapered horizontal SFB (Figure
5.12) showed that regions of low static pressure were mainly concentrated at the exit
of the primary chamber only. This was in contrast to the pressure profiles in the
untapered horizontal SFB, whereby regions of low static pressure stretched from the
primary chamber exit till the secondary chamber exit and concentrated along the
central core of the secondary chamber (Figure 5.13). According to Bernoulli

96
equation for flow along a streamline, simplified for inviscid, incompressible, steady
flow without heat addition and with negligible change in height, the sum of static
pressure and dynamic pressure gives the total pressure of a system, in which the total
pressure is a constant. Therefore, due to the conservation of mechanical energies
within the fluid, the region of low static pressure coincided with the region of high
velocity as the momentum of the ordered motion of the gas in the flow direction
resulted the increase in dynamic pressure (density times the square of velocity
divided by two) and the decrease in static pressure. In a tapered SFB, regions of low
static pressure at the secondary chamber entrance expanded radially outward nearly
halfway through the secondary chamber radius (Figure 5.12). This resulted in the
airflow being directed to the free vortex region of the secondary chamber upon exit
from the primary chamber. On the other hand, the low-static-pressure region in the
untapered SFB, which did not expand at the entrance of the secondary chamber,
resulted in the air rushing along the central core of the secondary chamber without
any flow expansion (Figure 5.14). The expansion of airflow to the wall regions of
the secondary chamber as observed in the tapered SFB showed that in actual
combustion operations, the unburnt gaseous components could be distributed rather
uniformly to the entire secondary chamber. Thus, the residence time of these
gaseous components is higher compared to the case whereby the gases were rushing
along the central core of the secondary chamber straight to the exit of the secondary
chamber. Higher residence time of gases, which allows for more complete
combustion to take place, will result in higher combustion efficiency. In addition,
modelling results obtained on the airflow profiles in the tapered SFB indicated that
no internal device such as a cowling is required to diverge the airflow to the wall
regions of the secondary chamber upon its exit from the primary chamber.
Deeper understanding of the flow structure inside the SFB could be obtained
through injection of tracer particles into the established flow field to enable visual
observation of the directions of flow. Therefore, tracer particles (rice husk ash; Dp =
10 µm and ρp = 1590 kg/m3) were injected into the established flow field of the
tapered SFB. Results showed that the existence of recirculating regions might be
detrimental to the operation of the combustor as particles could be trapped in the
eddies and remained there infinitely (Figure 5.15). This, apart from restricting

97
mixing in the entire chamber, will ultimately cause the flow to be heavily-laden with
particles. The need for improvement to this situation prompted the study on the
effect of inclusion of internal baffles or cowling in the secondary chamber to
breakthrough the current limitation of the SFB with a hollow secondary chamber.
5.6.1.1 Effect of Internal Baffles and Cowling
With the aim of minimising the formation of eddies and increasing the
swirling flows in the secondary chamber, investigations had been made to determine
the effect of the inclusion of baffles or cowling on the flow field profiles. In the
case of baffles inclusion, four internal baffles (500 mm long, 5 mm thick) were
placed co-centrally and 90o apart from each other on the secondary chamber wall.
The width of the baffles was varied from 50 mm to 75 mm and 100 mm. As for the
case of the inclusion of a cowling (60o-cone with a height of 200 mm located co-
axially with the horizontal SFB), the cowling was either placed 50 mm or 100 mm
from the primary chamber exit. In all cases, tracer particles (rice husk ash; Dp = 10
µm and ρp = 1590 kg/m3) were injected to give information on particle trajectories,
serving to provide a supplement to the overall understanding of the flow field
structure of the combustor. The operating conditions were kept constant at 15-g
loading (giving a rotational speed of 211 RPM) and 3 Umfc (at room temperature of
300 K).
Modelling results showed that the inclusion of baffles of all three widths (50
mm, 75 mm and 100 mm) were successful in breaking eddies near the primary
chamber exit (Figures 5.16, 5.18 and 5.20). The tracer particles were no longer
trapped in the recirculating regions (Figures 5.17, 5.19 and 5.21). In the case of
baffles with width of 50 mm and 75 mm, the tracer particles were blown out of the
combustor in less than 0.3 s. Although the recirculating zones were minimised in
both cases (Figure 5.16 and Figure 5.18), flow field profiles in the SFB with baffles
of width 50 mm showed two desirable traits. The tracer particles in this case
exhibited a significantly higher degree of swirl in the secondary chamber (Figure

98
5.17), especially near the exit of the combustor, compared to the case of the 75 mm-
wide baffles (Figure 5.19). In addition, this phenomenon was enhanced by another
desirable trait, its higher residence time (0.278 s) compared to the latter case (0.253
s), representing an increment of approximately 10%.
When the baffles width was increased to 100 mm, the recirculating zones
were less profound (Figure 5.20). It was initially speculated that with less eddy
formation and wider baffles, the degree of swirling flows in the secondary chamber
would be higher. However, it turned out that the contrary was true as the trajectory
of the tracer particles showed that they were heading straight to the exit without any
degree of swirling. Also, their residence time were the lowest, at 0.201 s (Figure
5.21).
Inclusion of a cowling into the secondary chamber of the SFB also
successfully minimised the formation of eddies, to the level sufficient as to eliminate
tracer particles from being trapped inside the recirculating zones. Figure 5.22 and
Figure 5.23 showed respectively, the airflow profile and trajectories of tracer
particles in the tapered SFB with a cowling placement of 50 mm from the primary
chamber exit. For the case of cowling placement at 100 mm from the primary
chamber exit, the results on the airflow profile and particle trajectories were shown
in Figure 5.24 and Figure 5.25, respectively. Cowling placed farther down the exit
of the primary chamber (100 mm distance) shifted the recirculating regions farther
downstream (Figure 5.24) in comparison with the case whereby the cowling was
placed at a distance of 50 mm from the primary chamber exit (Figure 5.22). The
former situation resulted in the tracer particles being directed by the cowling to the
free vortex region of the flow having high axial velocity. Thus, they were blown out
rapidly from the combustor after 0.22 s (Figure 5.25). This phenomenon was also
observed when the cowling was placed farther upstream (50 mm distance), but in
this case the residence time of the tracer particles were higher (0.28 s, Figure 5.23)
due to the longer distance they had to travel to the exit of the combustor.
Without tolerating in terms of particle residence time, the case whereby 50
mm-wide baffles were included in the secondary chamber provided a basis for
design improvements for the tapered horizontal SFB. The significantly high degree

99
of swirling exhibited by the tracer particles (Figure 5.17) compared to other cases
served to promote better mixing of unburnt matters such as char with the combustion
air in the secondary chamber. The “t” paramount in combustion – turbulence, was
hence provided. Sacrifices in term of residence time were not made as the tracer
particles in the present case had among the highest residence time compared to other
case studies.
Hence: Incorporation of four internal baffles (500 mm × 50 mm × 5 mm)
onto the secondary chamber wall of the SFB was successful in reducing the
recirculating zones near the entrance of the secondary chamber.
5.6.2 Modelling of Particle Trajectory in the SFB Freeboard
The trajectories of particles inside the SFB combustor may vary according to
the type and size of particles as well as the operating conditions (fluidising air
velocity and rotating speed). Of particular interest is the trajectory of ash particles,
as knowledge of their trajectories at different particle sizes and operating conditions
could provide insight into the accumulation of ash in the bed and also their
elutriation behaviour.
Ejection of particles from the bubbling fluidised bed into the freeboard
region is the result of bubble eruption on the bed surface. It was reported by
Rozainee (1998) that the initial velocity of ejected particles is independent of the
size and density of the particles, being largely dependant on the size and rise
velocity of the bubble (Caram et al., 1984). It was further reported that if the ejected
particles were from bubble wakes, the particle ejection velocity could be as high as
2.5 times the bubble rise velocity (Vm = 2.5 Ub) (Pemberton and Davidson, 1986).
In a SFB, the velocity of bubble swarms can be estimated by the following
equation by Subzwari (1983):-

100
bmfb rdUUU ω 71.0+−= (5.45)
where
bU = bubble velocity
U = fluidising velocity
mfU = minimum fluidising velocity
bd = bubble diameter
r = radial position
All parameters for Equation (5.45) were evaluated at the radial position of
the bed surface (r = ri) since the values of fluidising velocity and minimum fluidising
velocity in a SFB are dependent upon the radial position. With a bed thickness of
150 mm made up of 0.725 mm sand in the horizontal SFB combustor (ID = 300
mm) operating at room temperature, the corresponding parameters were evaluated
and presented in Table 5.1.
Table 5.1: Particle ejection velocities at different operating conditions
g-
loading
ω
(rad/s) No. of Umfc
Umf
(Umfs @ r = ri)
U
(m/s)
Ub
(m/s)
2.5 x Ub
(m/s)
up
(m/s)
vp
(m/s)
wp
(m/s)
1 0.31 0.57 1.41 0 -1.41
2 0.62 0.87 2.18 0 -2.18
5
12.79
3
0.24
0.92 1.18 2.95 0 -2.95
1.92
1 0.50 0.80 1.99 0 -1.99
2 1.01 1.30 3.25 0 -3.25
10
18.08
3
0.41
1.51 1.81 4.51 0 -4.51
2.71
1 0.66 0.97 2.43 0 -2.43
2 1.32 1.63 4.08 0 -4.08
15
22.15
3
0.55
1.98 2.29 5.73 0 -5.73
3.32
In estimating the bubble velocity, the bubble diameter was assumed to be 20
mm, a value obtained by Rozainee (1998) from his visual observation of the
bubbling bed in a Perspex SFB. Consistent with the prediction of particle ejection

101
velocity by Pemberton and Davidson (1986), the maximum ejected particles
velocities at each operating condition was evaluated. The eruption of bubbles was
assumed to have ejected the particles in the radial direction only. Therefore, the
axial velocity of the ejected particles was assumed to be zero. Also, the ejected
particles have a tangential velocity component due to the solid body rotation effect
of the rotating beds.
For the sake of tracking their trajectories, the particles were assumed to be
ejected singly into the freeboard region. Thereon, the particles were acted upon by
the centrifugal force, which tended to return them to the bed. At the same time, the
drag force acting in the direction of the gas velocity relative to the particle, tended to
bring them towards the centre. In addition, in a frame of reference rotating with the
bed, the Coriolis force acted on the particles in such a way as to tend to displace
them in a direction normal to their velocity and in the direction of rotation (Chevray
et al., 1980).
5.6.2.1 Effect of Particle Diameter
Accumulation of ash inside the fluidised bed in the primary chamber of the
SFB could be significant due to the high content of ash in rice husk (14.7%).
Therefore, the purpose of investigating the effect of particle diameter on the
trajectories of rice husk ash particles in the SFB was to gain information on the sizes
of particles that will be retained or blown out from the fluidised bed in the primary
chamber. With the knowledge of the rate of feeding and the size distribution of rice
husk ash, the rate of ash accumulation in the bed could be determined.
Subsequently, the time for spillover of ash through the weir plate in order to
maintain the bed depth could be estimated.
To determine the size distribution of rice husk ash, approximately 100 g of
fly-ash obtained from the combustion of rice husk in a conventional fluidised bed
was subjected to screen analysis. Rice husk ash has a fluffy texture with a bulk
density of 141.4 kg/m3. Screen test results showed that rice husk ash consisted

102
mostly of particles in the size range of 125 – 300 µm (Figure 5.26). Rice husk burns
according to the shrinking core model, whereby a char skeleton remains after the
evolution of volatiles. After the char ignites and burns, the resulting ash still takes
the shape of the skeleton. These skeletons are brittle and break easily. Therefore,
during the operation of the fluidised bed, more fine ash particles are to be expected
as the turbulent mixing inside the bed further breaks down these ash skeletons.
Nonetheless, current results on the size distribution of these ash particles were
acceptable and more or less representative of the actual size distribution as the
shaking motion during the screening test further broke down the ash particles,
similar to the motion induced by the fluidising bed materials.
To study the effect of particle diameters on the trajectories of particles
ejected into the freeboard region due to bubble eruption at the bed surface, the
horizontal SFB was operated at 15-g loading (211 RPM) and 3 Umfc (5.28 m/s @
room temperature). The particles used were rice husk ash particles having a particle
density of 1590 kg/m3. The particles were assumed to be ejected from the bed
surface of the 150 mm thick bed, mid-length of the primary chamber (x = 150 mm).
It was found that, at these operating conditions, the particle trajectories were
distinguishable with five particle diameters (5 µm, 10 µm, 25 µm, 50 µm and 1
mm).
As shown in Figure 5.27, particles with a diameter of 5 µm moved radially
inward inside the primary chamber due to high initial radial velocity. High axial
velocity at the exit of the primary chamber (as high as 3.76 m/s, Figure 5.28) then
caused the particles to be blown into the secondary chamber, after which they were
blown out from the combustor at less than 0.02 s. Particles with a diameter of 10
µm were recirculating infinitely at regions just after the exit from the primary
chamber (Figure 5.29). Particles of this size were trapped in the recirculating zones
near the front wall of the secondary chamber of the horizontal SFB (Figure 5.28).
Particles with a diameter of more than 25 µm remained in the primary chamber
without entering the secondary chamber. Ash particles with diameters of 25 µm and
50 µm were moving with the swirling flows in the primary chamber in helical
trajectories, with the latter having a helical trajectory of larger radius due to higher

103
particle mass (Figure 5.30 and Figure 5.31). Particles having a diameter of 1 mm
were returned to the bed rapidly due to higher momentum. This phenomenon
indicated that at the designated operating conditions, the drag force of the fluid was
not sufficient to entrain the particles from the bed surface into the freeboard region.
For optimum operation of the SFB, an air feed rate of 3 Umfc was usually
required in order to establish sufficient turbulence inside the bed. Particles with
sizes of more than 25 µm (> 25 µm) were found to be retained inside the primary
chamber of the SFB up to air feed rates of 3 Umfc. Screen analysis showed that
approximately 0.1% of rice husk ash consisted of particles with a size of less than 20
µm. Hence, based on the modelling results, it could be said that nearly all of the ash
will be retained in the bed. According to the proposed design of the SFB, the
primary chamber volume available after accounting for the volume of sand bed (of
depth 150 mm) is 0.01866 m3. Once the bed depth exceeded 225 mm (height of the
weir plate lip or height of the tapered section at the rear end of the primary
chamber), the ash will spill over to the secondary chamber. However, for a bed of
depth 150 mm, the accumulation of materials inside the bed will be too much before
the bed reaches a depth of 225 mm. This condition, apart from interfering with the
fluidisation process (a deeper bed will alter the value of FR), will also reduce the
volume to accommodate the rice husk feed. There is also a possibility whereby the
ash will spill over from the front end of the tapered section where the screw feeder is
located and enters the piping for secondary air. To prevent these undesirable
conditions from occurring, the height of the tapered section near the primary
chamber exit should be reduced to less than 225 mm while maintaining the angle of
tapering at 60o, for instance to 200 mm. With this modification (as shown in Figure
5.32), once the bed depth exceeded 200 mm, the ash will spill over from the bed to
the secondary chamber. Based on the calculations of the free volume in the primary
chamber as presented in Appendix A, it was found that the free volume with the
suggested design modification (bed depth remained the same at 150 mm) increased a
little to 0.019 m3. Applying the same calculation procedures as in Appendix A, the
volume that could be occupied by ash before the spillover occurs is 0.010 m3. The
time before the ash spill over to the secondary chamber and the accumulation rate of

104
rice husk in the bed at different rotating operating conditions were shown in Table
5.2.
Table 5.2: Accumulation of ash particles in the fluidised bed of depth 150 mm
in the modified SFB combustor (primary chamber length 300 mm, ID 600 mm,
tapered angle 60o, front tapering height 225 mm, rear tapering height 200 mm)
operating at 800oC
g-loading
Rice husk feed at
stoichiometric at 3.5 Umfs
(kg/hr)
Time for ash
spillover
(min)
Rate of ash
accumulation
(mm/min)
5 26.98 21.49 1.16
10 53.01 10.94 2.29
15 78.18 7.42 3.37
The time for ash spillover and rate of ash accumulation in the modified SFB
was estimated without accounting for the volume occupied by the rice husk feed.
Thus, in actual operations, the time for ash spillover will be lower than those shown
in Table 5.2. It could be observed from Table 5.2 that the higher the rotating speed,
the higher the rate of ash accumulation in the bed due to the higher rice husk feed
rate. For instance, the rate of ash accumulation in the bed is 3.37 mm/min for the
SFB operated at 15-g loading, which was three times the rate when it was operated
at 5-g loading (at 1.16 mm/min). The higher rice husk feed corresponded to the
higher air feed rate required at higher rotating speed to establish a condition of 3.5
Umfs.
Once the ash spill over from the weir plate lip into the secondary chamber,
their trajectories at the wall regions will depend on their saltation velocities.
Saltation velocity is the minimum superficial air velocity required for the transport
of particles without the formation of a particle layer at the bottom of the transporting
domain in flows under gravitational force. The empirical Rizk saltation correlation,
valid for relatively dilute transport, and as cited by Hong et al. (1995) is as follows:-

105
( )
5.21.1
5.096.144.1101*
+
+ ⎥⎦
⎤⎢⎣
⎡=
p
p
d
sad gD
um (5.46)
where dp refers to particle diameter in mm, usa the saltation velocity and m* the
solids loadings ratio (qs/qg), with qs being the mass flow rate of solid and qg the mass
flow rate of gas. Superimposing the saltation effect to flows under centrifugal force,
such as swirling flows in the SFB, the saltation velocity refers to the superficial gas
velocity at which a particle begins to separate from the gas phase and form a layer
along the entire circumference of the transporting domain. The Rizk correlation,
therefore, could be modified for application in swirling flows by replacing the
gravitational term with that of the radial acceleration (Equation 5.5). The resulting
correlation, modified for swirling flows, is as follows:-
( )
5.21.1
5.0296.144.1101*
+
+⎥⎥⎦
⎤
⎢⎢⎣
⎡=
p
p
d
sad Dr
um
ω (5.47)
Thus, it is expected that the spillover ash will form a layer along the entire
circumference of the secondary chamber wall. Holes incorporated at certain
intervals around the wall, will therefore allow for the escape of these ash particles.
To determine if the ash particles will lose their momentum upon impacting the wall
and be deposited to form the ash layer, their saltation velocities, which depend on
particle diameter, gas and solids loadings, combustor diameter and centrifugal force,
will be calculated based on modelling results on the airflow profiles and trajectories
of spillover ash particles.
To capture the velocity contours and particle trajectories of spillover ash near
the wall of the secondary chamber, CFD modelling was carried out by injecting ash
particles of various sizes near the weir plate lip into the modified SFB flow field
established at 800oC at various g-loadings with air inlet consistent to give a
fluidising condition of 3.5 Umfs at the bed surface of depth 150 mm (or
approximately 2.5 Umfc). The particles were assumed to have zero velocity
components in the axial and radial directions, except in the tangential direction
owing to solid body rotation effect of the rotating beds. Further, the mass flow rate

106
of ash (qs) in the secondary chamber was assumed to be equal to the generation rate
of ash at certain g-loadings. The average mass flow rate of air (qg) in the secondary
chamber could be estimated from the modelling study, which could then be inserted
into the modified Rizk correlation (Equation 5.47) to calculate the saltation
velocities for ash particles of various sizes at various g-loadings. Consequently, the
determination whether the ash will be deposited at the wall regions and the location
where each differently-sized particle will deposit could be estimated. The latter
could be used for designing the diameter and placing of holes on the secondary
chamber wall for the escape of ash particles.
The saltation velocities of rice husk ash particles of various sizes at various
g-loadings were as shown in Table 5.3.
Table 5.3: Estimated saltation velocities of rice husk ash of different sizes in the
modified SFB (with rear tapering height of 200 mm) at various g-loadings (air
inlet to establish 3.5 Umfs at bed surface, bed depth 150 mm, operating
temperature 800oC)
Estimated saltation velocity (m/s) at different g-loading Dpi (mm)
5-g loading 10-g loading 15-g loading
0.010 15.57 22.06 27.03
0.037 15.92 22.56 27.64
0.058 16.21 22.97 28.14
0.067 16.33 23.14 28.35
0.081 16.51 23.39 28.66
0.098 16.74 23.72 29.06
0.116 16.98 24.05 29.47
0.213 18.26 25.87 31.70
0.400 20.72 29.35 35.96
0.605 23.35 33.07 40.51
0.855 26.44 37.44 45.87
1.090 29.22 41.37 50.69
1.590 34.71 49.14 60.20
Note: m* ~ 0.15 at all g-loadings

107
Modelling results showed that the velocity contours in the secondary
chamber were lower than the saltation velocities (Figures 5.33 – 5.35) and thus, the
ash particles will be deposited at the wall regions. It was also observed that larger-
sized ash particles were deposited more rapidly due to their higher momentum
(Figure 5.36). Smaller-sized ash particles were transported further downstream
before being deposited. Furthermore, the expansion in airflow in the vicinity of the
primary chamber exit aided in directing these particles to the wall regions. Ash
particles of sizes less than 400 µm were deposited on the wall regions in the
secondary chamber with trajectories similar to that shown in Figure 5.37 at all
rotating speeds investigated (5- to 15-g loadings). Except for the modified SFB
operating at 5-g loading, ash particles of with a size of 10 µm were blown further
downstream of the secondary chamber before hitting the wall near the SFB outlet
and be deposited there (Figure 5.36). According to the cumulative plot (Figure
5.38), approximately 95% of the rice husk ash sample consisted of particles with
sizes of less than 400 µm. Thus, it was speculated that most of the spillover ash
were deposited at positions less than mid-length of the secondary chamber wall.
Therefore, holes intended for the escape of these ash particles should be
concentrated at this region. Particles with sizes in the excess of 400 µm (about 5%
of the ash) collided with the wall regions near the weir plate lip as soon as they
spilled over. However, due to the motion of particles spilling over the weir plate lip,
these particles will be pushed out further into the secondary chamber and be
deposited at the wall regions.
Sand particles have a particle density of 2430 kg/m3. Modelling results on
the trajectories of ash particles with different sizes could still be used to provide
information on the bed entrainment behaviour in the SFB as bubble eruption on the
bed surface also throw the sand particles into the freeboard region. It is expected
that due to the higher density, with the same particle size, sand particles will have a
higher momentum compared to the ash particles. It was determined from the
previous modelling study that particles of sizes more than 25 µm will be retained in
the primary chamber of the SFB. This finding is important, as the entrainment of
bed media from the primary chamber could be minimised. Entrainment of bed
108
particles is highly undesirable as it leads to a drop in bed pressure due to the loss of
mass. Also, higher mass loss necessitates the frequent topping-up of bed media.
Subsequently, the temperature of the bed will drop during combustion operations
due to the addition of fresh bed materials, with the extent in temperature drop being
dependant on the amount of bed materials to be compensated due to entrainment.
Thus, the combustion process will be interrupted due to the lag in combustion
process, resulting in increase of combustion reaction time. Particles with sizes of
more than 1 mm (> 1 mm), on the other hand, were rapidly returned to the bed due
to higher momentum. This is also crucial to the operation of a centrifugal fluidised
bed by ensuring that the heat evolved from the combustion process into the
freeboard region is transferred back to the bed through these particles. Thermal
stability of the bed could therefore be maintained.
Hence: To prevent the bed from being too thick due to ash accumulation and
also the spillover of ash from the front end of the tapered section, the tapering height
at the rear end of the tapered section in the primary chamber should be reduced from
225 mm to 200 mm.
5.6.2.2 Effect of Rotating Speed
The entrainment behaviour of the SFB combustor, apart from being
influenced by the particle size, also varies according to the combustor rotating
speed. The purpose of investigating the effect of rotating speed on the trajectory of
particles in the SFB is to determine the applicable range of rotating speeds that could
maximise the residence time of particles such as char in the primary chamber.
Higher residence time of char particles in the primary chamber allows for more
complete combustion to take place, thus minimising the emissions of products of
incomplete combustion (PICs) in the flue gas.
The effect of rotating speed on the trajectories of ash particles entrained into
the freeboard region by bubble eruption at the bed surface was investigated by

109
operating the horizontal SFB at 5-g, 10-g and 15-g loadings with air feed rates of 3
Umfc. At these g-loadings, the air feed rates to establish operating conditions of 3
Umfc were 2.46 m/s, 4.02 m/s and 5.28 m/s (at room temperature) respectively. The
size of particle chosen was 25 micron as particles of this size were the biggest
particle (as determined in Section 6.6.2.1) that will be retained in the primary
chamber due to the swirling flows. As such, it provided insight as to the effect of
changing the rotating speed on the particle residence time in the primary chamber.
Besides, another intention was to determine the return of these particles to the bed.
Smaller sized particles (5 – 10 µm) were rapidly blown out from the primary
chamber into the secondary chamber. Larger sized particles (> 50 µm), on the other
hand, tended to move towards the distributor plate, similar to that observed for
particles of 1 mm as in Figure 5.31.
The particle residence time was found to be decreasing as the bed rotating
speeds were increased. This may sound ironic but it should be noted that the air feed
rate was increased accordingly with the increase in rotating speed with the aim of
maintaining a fluidising condition of 3 Umfc. If the air feed rates were to be kept
constant while increasing the rotating speeds, the residence time of particles will
found to be higher with the increase in rotating speed. With a higher degree of
rotational movement, the higher centrifugal force imparted onto the particles could
counterbalance the constant drag force from the fluidising air. Thus, the net force to
elutriate the particles out of the combustor will be lower at higher rotating speed,
resulting in higher residence time of particles in the combustor.
As discussed earlier, the increase in bed rotating speeds resulted in higher air
feed rates in order to maintain operating conditions of 3 Umfc. Hence, in the present
cases, the gas residence time in the primary chamber varies inversely with the bed
rotating speed (Figure 5.39). Although the particle trajectories were quite similar in
all three cases (Figures 5.40 – 5.42), the residence time in the primary chamber
decreased from 0.412 s to 0.292 s and 0.235 s as the rotating speeds were increased
from 5-g, 10-g and 15-g loadings respectively. The air feed rate to the primary
chamber has to be maintained at about 3 Umfc to establish turbulence conditions
crucial in attaining good mixing behaviour inside the bed. Therefore, it was

110
recommendable that the bed be operated at low rotating speeds in order to increase
the particle residence time. Also apparent was the observation that particles in all
three cases were hovering near the surface of the sand bed at a radial position of r =
0.15 m.
Operating at higher rotating speeds led to a reduction in particle residence
time in the primary chamber due to the increase in air feed rates (at 3 Umfc). To
obtain a higher residence time of particles, the SFB should be rotated at lower
speeds (i.e. 5- to 10-g loadings). It is desirable to operate the SFB at lower rotating
speeds because when the combustor was rotated at a higher speed, the corresponding
air feed rates to maintain a condition of 3 Umfc also increased. With the higher drag
force from the higher air feed rates, the residence time of particles in the primary
chamber was lowered. This undesirable trait will reduce the duration for particles
such as chars to complete their oxidation.
Hence: Due to the corresponding increase in air input with rotating speed (to
maintain fluidising condition of 3 Umfc) which will lower the residence time of
particles in the primary chamber, it is recommended that the SFB be operated at low
rotating speeds (5- to 10-g loadings).
5.6.2.3 Effect of Air Feed Rates
The presence of a lot of fine particles (Geldart-C particles with sizes less
than 30 µm) in the fluidised bed could interfere with the stability of fluidisation due
to the high interparticle forces. Therefore, it is desirable to remove these fine
particles from the bed. A SFB could be operated at a fluidising velocity of 2 – 3
Umfc while being able to provide sufficient turbulence conditions in the bed. As
determined from earlier studies, particles with sizes of less than 25 µm will be
retained in the primary chamber. In this section, the trajectories of particles smaller
than this size will be investigated at different fluidising air inputs to determine the
air feed rate that is sufficient to entrain these fine particles from the primary

111
chamber. This finding is important, as the minimum air input to elutriate these fine
particles from the bed could be determined.
The effect of air feed rates on the trajectories of rice husk ash particles was
investigated by operating the horizontal SFB at 1 – 3 Umfc while keeping the rotating
speed constant at 15-g loading (211 RPM). Particles having a size of 10 µm were
chosen since particles of this size are classified as Geldart-C and exhibited
significantly different trajectories due to the change in air feed rates. Similar to
earlier cases, smaller sized particles (5 µm) were rapidly blown out from the primary
chamber while larger sized particles (> 25 µm) were either moving with the swirling
flows in the primary chamber or were impacted towards the distributor.
Figure 5.43 and Figure 5.44 clearly showed that particles of size 10 µm were
captured and remained in circular orbits in the primary chamber. However, the
circular orbit of the case whereby the air input was 2 Umfc had a fairly constant
diameter (Figure 5.44). This, in part, was due to the increase in drag force with the
increase in air feed rate, resulting in the net balancing between the centrifugal force
(from the rotational effect) and drag force (from the fluidising air) on the particles.
Lower drag force in the case of an air feed rate of 1 Umfc resulted in a helical particle
trajectory with a diverging trend (Figure 5.43). Air feed rate of 3 Umfc was sufficient
to blow out the 10-µm particles from the primary chamber (Figure 5.29). In
addition, consistent with earlier explanation, the particle helical trajectory had a
converging trend due to the much higher drag force from the air feed rate of 3 Umfc.
The residence times of the 10 µm-particles in the primary chamber were also
observed to be decreasing from 0.325 s to 0.168 s and 0.0647 s as the air feed rates
were increased from 1- to 2- and 3 Umfc respectively.
For particles with sizes in the range of 10 – 25 µm, air feed rates exceeding 3
Umfc were required to generate sufficient drag force to blow them out of the primary
chamber. Particle in this size range consisted primarily of fines in the fluidised bed
(sand, char and ash), produced through perpetual attrition between the bed particles
during fluidisation. The presence of a large amount of fines in the bed is detrimental
to the operation of fluidised bed. The interparticle forces present among these fine

112
particles will cause the fluidised bed to behave erratically consistent with particles
classified as Geldart-C. The entrainment of these particles from the primary
chamber to the secondary chamber of the SFB proved beneficial, as they can then be
collected through holes incorporated at the end walls of the secondary chamber as
part of the particulate emission control measure.
Hence: To remove fine particles (< 25 µm) from the bed, the SFB should be
operated at a fluidising velocity exceeding 3 Umfc.
5.6.3 Gaseous Combustion
Modelling of methane combustion was performed to illustrate the effect of
tapering and bed rotating speed on the gas-phase combustion in the tapered
horizontal SFB. The combustion of methane was modelled using a two-step
reaction mechanism:-
2 CH4 + 3 O2 → 2 CO + 4 H2O
2 CO + O2 → 2 CO2
Since both methane and air will enter the SFB combustor through the same
inlet jacketed around the combustor, both gases were pre-mixed before being fed
into the SFB. The pre-mixed methane/air mixture entering the combustors at 300 K
was at a stoichiometric composition of 9.5% methane. At this concentration, the
normal flame velocity, defined as the velocity at which the flame front moves in the
direction of the unburned gases, was approximately 0.36 m/s (Figure 5.45). With
the wall boundary condition of the combustor set at zero heat flux, the temperature
predicted was the adiabatic flame temperature of the system. The adiabatic flame
temperature of a stoichiometric mixture of methane/air is approximately 2200 K.
The higher temperature (beyond the 2200 K) captured in the contours of the
modelling results was due to the utilisation of a constant default value of mixture
heat capacity. In actual, the heat capacities (especially for gases) are strict functions

113
of temperature and are often expressed in the polynomial form. However, it should
be stressed here that the aim of the current investigations were to determine the
sustainability and extent of gaseous combustion at different designs and rotating
speeds of the SFB, and not the intimate details of the combustion characteristics of
methane/air mixture. Hence, extra efforts to search for the appropriate heat capacity
to be applied in the modelling study are unwarranted.
5.6.3.1 Effect of Tapering in the Primary Chamber of SFB
To study the effect of tapering in the primary chamber of the horizontal SFB,
methane combustion was first simulated in an untapered SFB and then in a SFB with
tapered end walls. Apart from the tapered section, both combustors have the same
dimensions.
Pre-mixed methane/air mixture entered both stationary SFB combustors at
0.5 m/s. The choice of this value of inlet velocity lay in the fact that it was higher
than the normal flame velocity of 9.5% methane mixture in air. Since both
combustors were not rotating (0 RPM), flow recirculation in the freeboard regions
was virtually non-existent. Also, since the rate of turbulence was very low, it was
speculated that the value of flame velocity at the designated operating conditions
was close to the normal flame velocity. As such, if the velocity profiles in any of the
combustors exceed 0.36 m/s, the flame could not propagate and will ultimately be
quenched. To illustrate this phenomenon, methane combustion was modelled in a
fluidised bed. Results showed that combustion was barely sustainable in the
fluidised bed (Figure 5.46) due to flame-quenching as the mixture velocity inside the
chamber was higher than 0.36 m/s. Combustion was concentrated at very small
regions adjacent to the top wall of the chamber.
Modelling results showed that without the tapering effect, combustion could
not be sustained in the SFB (Figure 5.47). To maintain flame stability, the velocity
of the gas mixture had to be lower than the flame velocity of the mixture. Velocity
contours inside the untapered SFB (Figure 5.48) showed that the velocities in nearly

114
the entire combustor were more than 0.36 m/s. Since the unburned gas mixture
moved faster than the flame front or flame velocity, the mixture could not be ignited.
Consequently, flame propagation was terminated and combustion process did not
take place.
Methane combustion, on the other hand, was sustainable in the tapered SFB.
Although the inlet velocity of 0.5 m/s was higher than the normal flame velocity,
this value was progressively reduced as the mixture moved radially inward. The
tapering effect resulted in increasing cross sectional area of the fluid interface with
the decrease in radius. This in turn, caused the velocity of the mixture to decrease as
it moved from the distributor inlet towards the central core region. According to
Figure 5.49 and Figure 5.50, the region of intense combustion coincided with
regions of low velocity. This was the region spanning from the front wall to
approximately mid-length of the primary chamber. In the secondary chamber, this
was the free vortex region adjacent to the exit from the primary chamber. Velocities
at these regions were no more than 0.16 m/s, which was less than half the normal
flame velocity of the 9.5% methane mixture in air. Thus, the mixture was ignitable
and these low velocity regions enabled the propagation of flame to the unburned
mixture.
At the regions of higher velocities (0.3 – 0.6 m/s) near the right tapered
section of the primary chamber, the flame could no longer travel as fast as the rate at
which the unburned mixture was travelling. Flame propagation in these regions was
terminated, resulting in ‘dead’ regions (blue-coloured region in Figure 5.49) in
which flame extinction took place.
Hence: Inclusion of the tapered end walls in the primary chamber of the SFB
allowed combustion of premixed methane/air mixture to take place even for a
stationary SFB and mixture inlet velocity that exceeded the normal flame velocity of
the mixture (0.36 m/s).

115
5.6.3.2 Effect of Combustor Rotating Speed
Methane combustion was simulated in the tapered horizontal SFB at
different rotating speeds to investigate its effect on the gas-phase combustion
(combustion intensity and carbon burnout rate). The primary purpose of this study
is to determine applicable rotating speed during bed starting-up that could result in
uniform heating of the 150 mm thick bed. In all cases, pre-mixed methane/air
mixture entered the combustor at 300 K with an inlet velocity of 2 m/s. The bed
rotating speed was increased from 0 RPM to 122-, 173- and 211 RPM, to give g-
loadings of 0, 5, 10 and 15 respectively.
a) Effect on Combustion Intensity
Figure 5.51 showed that combustion took place in the non-rotating SFB although the
inlet velocity was as high as 2 m/s. Since the overall turbulence in the stationary
SFB was expected to be low, the flame velocity was assumed to be close to that of
the normal flame velocity (0.36 m/s). The unique tapering feature of the SFB
rendered combustion sustainable due to the progressive reduction of mixture
velocity as it moved radially inward. At the present operating conditions, there
existed regions of low velocities (0 – 0.36 m/s, Figure 5.52) sufficient to enable the
flame front to move faster than the unburned gas mixture. The gas mixture in this
region was ignited and ultimately led to the propagation of flame to the rest of the
combustor. Nonetheless, turbulence rate at the central core region of the primary
chamber might be quite high as the gases converged towards the exit. Thus, the
flame velocity at this region was expected to be higher, explaining the sustenance of
combustion in this high-velocity region. However, combustion was not intense,
largely due to flame quenching at regions with high velocities particularly at the
tapered section near the primary chamber exit.
It was reported by Ishizuka (1990) that a flame propagates rapidly in a
rotating flow. Rotation in the mean flow affects the turbulence in swirling flows,
with its rate varying proportionately with the degree of rotation. It is known that
large-scale turbulence exerts a dual influence on pre-mixed combustion (Kagan and
Sivashinsky, 2000). Moderately strong turbulence results in the extension of the

116
flame interface, leading to burning rate enhancement. As the flame propagates,
turbulence in the flow field causes a flame to “fold” and “stretch”, resulting in an
increase in the flame surface area. An overall higher burning rate, in turn, produces
a higher flow velocity in the unburned gas and consequently results in a continuous
acceleration of the propagating flame (Chan et al., 1996). Although it was widely
reported that swirl can substantially decrease the burning duration of a combustible
mixture (Zhang and Hill, 1996), leading to higher combustion efficiency, there
existed a limit at which excessive swirl can be detrimental. When that limit is
reached, flame quenching takes place due to high turbulent strain rate.
Modelling results showed that methane combustion was increasingly more
intense in the primary chamber of the SFB as the bed rotating speed was increased
from 5-g to 10- and 15-g loadings (Figures 5.53 – 5.55). This phenomenon was
expected as the rate of flow recirculation and turbulence increased with the increase
in bed rotating speed. The recirculating flow recirculated the combustion products
and the heat evolved to continually re-ignite the oncoming gas. In addition, flame
“stretching” and “folding” due to the increasing rate of turbulence in the combustor
led to an increase in flame velocity. Hence, the region of intense combustion
extended farther and farther towards the distributor plate at higher rotating speeds.
The extent of intensity in the combustion of premixed methane/air mixture at
different rotating speeds is important in the selection of appropriate rotating speed
during bed starting-up in order to achieve uniform pre-heat of the bed materials.
The bed materials will occupy the entire circumference of the distributor plate of the
SFB during fluidisation. The regions occupied by the bed are also the regions of
low combustion intensity due to the flow of unburnt gaseous mixture entering at
room temperature (300 K). At a rotational speed of 5-g loading, nearly half of the
entire bed thickness, at approximately 75 mm thick (Figure 5.53), will not be pre-
heated as the entering unburnt mixture was not ignited. As a result, the temperature
in these regions was still at room temperature and the whole bed of thickness 150
mm could not be pre-heated uniformly. Only the upper half of the bed will be
heated up.
When the rotating speed was increased to 10-g loading, the regions occupied
by the unburnt mixture reduced to approximately one-third of the entire bed

117
thickness, at 50 mm (Figure 5.54). The upper two third of the bed could be heated
up due to the higher combustion intensity with the increase in rotating speed
compared to the SFB rotated at 5-g loading. At 15-g loading, further increase in
combustion intensity reduced these low temperature regions to approximately one-
quarter of the entire bed thickness (Figure 5.55). Nearly the whole of the bed could
then be heated up. Although operating at higher rotating speeds led to more uniform
bed pre-heating, it should be noted that the higher the rotating speed, the higher the
extent of low temperature regions (1500 – 2500 K) in the central core of the
secondary chamber. The formation of these low temperature regions will be
discussed further in the following sections. Therefore, a compromise should be
reached in order to achieve uniform bed pre-heating while simultaneously
suppressing these low temperature regions to the minimum level.
It was long observed that for each gaseous pre-mixture, there is a certain
level of turbulence at which the flame velocity reaches a maximum (Kagan and
Sivashinsky, 2000). A further increase in the flow intensity leads to a drop in the
flame velocity, followed by flame disintegration and extinction. The overall burning
rate is lowered due to excessive flame stretching and rapid mixing of the burned
products and cold unburned mixture. As the velocity of the unburned gas increases,
the quenching by turbulence becomes more significant (Chan et al., 1996).
Nevertheless, results from modelling showed that combustion was still sustainable
even when the SFB was operated at a rotating speed of as high as 1000 RPM or 335
g-loadings.
Hence: To achieve more uniform pre-heating of the 150 mm thick bed, the
SFB should be operated at higher rotating speeds (10- to 15-g loadings).
b) Effect on CO Burnout
Apart from providing information on the extent of bed pre-heating in the primary
chamber, results from modelling of methane combustion in the SFB could provide
insight into the effect of rotating speed on the burnout of CO. Higher turbulence in
the combustor induced by the higher degree of rotational movement increase the rate

118
of mixing between the unburnt mixture with the products of combustion as well as
the heat source so that the unburnt mixture could be ignited.
In a stationary SFB, turbulence was low and mixing was limited. The
intermediate product of combustion, CO was largely concentrated in the central core
region of the combustor (Figure 5.56). With rotation, this product was dispersed to
the entire combustor by turbulence generated by the swirling flows. From
observation of the modelling results, regions of high CO-content were significantly
reduced in a SFB rotating at 122 RPM (Figure 5.57), being confined only to the
primary chamber compared to a stationary SFB. With increasing rotating speed
(Figure 5.58 and Figure 5.59), these regions were less profound and were confined
to regions adjacent to the distributor plate. Comparisons between Figures 5.57 –
5.59 showed that CO burnout was more rapid as the rotating speed was increased,
resulting in smaller regions occupied by CO in the primary chamber.
To further illustrate the more efficient gas-phase combustion due to the
increase in combustor rotating speed, contours of CO/CO2 product ratio in the SFB
were plotted. As expected, regions of high CO/CO2 product ratios were observed
near the distributor inlet in the primary chamber (Figure 5.60), but were found to be
less and less prominent as the rotating speed of the SFB was increased (Figure 5.61
and Figure 5.62). The enhanced mixing promoted by the increasing swirling flows
aided in the more rapid transfer of oxidants to the intermediate product (CO) to form
CO2. The levels of CO emissions in the exhaust gases were reduced drastically from
0.051% in a stationary SFB to less than 1 part per trillion when the same combustor
was rotated at 122 RPM. Further increase in bed rotating speeds resulted in a two
order magnitude drop in CO emission levels (Figure 5.63).
In FLUENT, the level of CO emissions from the exhaust outlet were
determined by custom definition of the following formula:-
ionmole fractOHfractionmoletrillionperpartCO
110 CO) (
2
12
−×
= (5.48)

119
where
28eightolecular w mixture maction CO mass fr action CO mole fr ×
= and
∑=
i weightmolecular ionmass fract
Mixture MW 1
Although rotating at higher rotating speeds resulted in smaller regions with
high CO/CO2 ratio near the distributor inlet, in actual combustion operations, these
regions will be occupied by the sand bed. Most of the unburnt gaseous components
are expected to be burnt in the freeboard region of the primary chamber and also in
the secondary chamber, and since CO was undetectable from the freeboard of the
primary chamber onwards, operating the SFB at higher rotational speed to achieve
higher CO burnout rate might not be necessary. The emission level of CO at 5-g
loading, in fact, was more than sufficient to comply with the existing regulations
applicable for burning wastes in incinerators (at 125 mg/Nm3 or 100 ppm).
Hence: Operating at a rotating speed as low as 5-g loading is sufficient to
achieve high rate of CO burnout in the SFB and emission level of CO that complied
with existing regulations.
c) Gas Phase Combustion in the Primary and Secondary Chambers
It was observed that regions of turbulence were concentrated at the primary chamber
of the SFB due to the tangential flow inlet. With the increase in bed rotating speed,
the increasingly high centrifugal force forced the swirling flow regions to move
radially outward (Figure 5.64). These, in turn, promoted good mixing and
recirculation of combustion products to the incoming unburned mixture. As a result,
the combustion intensity in the primary chamber increased with bed rotating speed.
In the secondary chamber, mixing was not good when the bed rotating speed
was increased. Low-temperature regions at the central core of this chamber
expanded farther upstream from the combustor outlet when the rotating speed was

120
increased from 5- to 10- and 15-g loading. These phenomena were due to the shift
in recirculating flows generated by eddy formation farther upstream to the region
adjacent to the primary chamber exit (Figure 5.64). The flows tended to move to
near-wall regions with higher rotating speeds. The higher the rotating speed, the
higher the degree of swirl in the primary chamber, resulting in the tendency of the
gas to diverge and be flung to the wall regions in the secondary chamber upon
discharge from the primary chamber. From thereon, the high axial velocity pushed
the gas out of the combustor. Hence, combustion products did not reach the central
core region, and without the heat source, combustion in this region could not be
sustained. Temperature in this region eventually dropped. As a consequence,
operating at higher rotating speeds will result in the formation of colder-flow regions
at the centre core of the secondary chamber. Nevertheless, the volume of these
colder-flow regions in the secondary chamber was considered to be quite small
compared to the overall volume of the secondary chamber. This condition is still
acceptable and thus does not warrant extra efforts in design improvement to
suppress these colder-flow regions.
In determining the optimum rotating speed as bed starting-up procedure for
the SFB and also to achieve high rate of CO burnout, the important findings
obtained in the modelling of methane combustion were reiterated as follows:-
i) The SFB should be rotated at rotating speeds of more than 10-g loadings to
achieve uniform pre-heating of bed materials,
ii) Operating the SFB at rotating speed as low as 5-g loading could result in
high rate of CO burnout and emissions level of CO that complied with
existing regulations, and
iii) The expansion of the colder flow regions in the secondary chamber when
operating at higher rotating speeds might not be detrimental to the overall
operation of the SFB due to the relatively smaller volume of these regions
compared to the volume of the secondary chamber.
Hence: Therefore, during bed starting-up, the rotating speed recommended
for the SFB is in the range of 10- to 15-g loading. For combustion operations, the

121
SFB could be rotated at as low as 5-g loading and still be able to achieve good CO
burnout rate and CO emission level that complied with existing regulations.
5.6.4 Particle Combustion
The combustion of rice husk in the tapered SFB combustor was modelled
using the mixture fraction / PDF approach in FLUENT (version 5.5). The mixture
fraction / PDF approach enabled the modelling of non-premixed turbulent
combustion by solving transport equations for one or two conserved scalars – the
mixture fractions. Use of this approach required the preparation of a PDF file with
the preprocessor, prePDF (version 3.3). The PDF file contained information that
relates species concentrations and temperatures to the mixture fraction values, and
was used by FLUENT to obtain these scalars during the solution procedure.
Chemical properties of rice husk for preparation of the PDF file were enclosed in
Appendix B. The temperature at the onset of rice husk de-volatilisation was set at
275oC, a value obtained from TGA analysis.
5.6.4.1 Thermogravimetric Analysis of Rice Husk
In-depth understanding on the basic mechanisms in rice husk combustion is
crucial in attaining high efficiency for its use as an energy source. More
importantly, these understandings affect the development of a more precise model at
a later stage (Ismail, 1996a; Ismail, 1996b), which appropriately describes the
intermediate processes occurring during combustion (Ismail et al., 1997). Accurate
characterisation of fuel is significant in the development of optimum design for
thermochemical conversion systems that can achieve high conversion, besides
ensuring compliance with strict environmental regulations (Mansaray and Ghaly,
1998b). Thermogravimetric analysis (TGA) is used to profile the mass loss due to
chemical and physical phenomena when a sample is subjected to high temperature.

122
a) TGA in a Reducing (Nitrogen) Environment
In general, the combustion profile of rice husk is divided into three stages (Ismail et
al., 1997):-
a) Evaporation of moisture content (50 – 150oC),
b) Rapid mass loss (300 – 380oC), and
c) Slow combustion but with ignition (> 400oC).
TGA has been performed on the rice husk samples in this study with a
heating rate of 10oC/min from ambient temperature to 800oC, in a reducing
environment. The use of an inert gas such as nitrogen serves the purpose of creating
an oxygen-free environment required for the pyrolysis process. According to
Mansaray and Ghaly (1998a), the rate of thermal degradation and the mass of
residue increase as the heating rate is increased.
Referring to the thermogram obtained (Figure 5.65), an initial slight weight
loss was observed between ambient temperature and about 100oC. The weight loss
could be probably contributed by the elimination of physically absorbed water in the
rice husk and superficial or external water bounded by surface tension, and also
probably due to the loss of light volatiles. The curve began to flatten out from
100oC to approximately 275oC, incurring very slight weight loss. Majority of the
mass loss was in the range of 275 – 375oC, referred to as the active pyrolysis zone.
This stage was indicated as the curve of mass loss in the thermogram. Studies
(Shafizadeh, 1968; Ramiah, 1970; Koufopanos et al., 1989; Bining dan Jenkins,
1992; Williams dan Besler, 1994; Vargheyi et al., 1994) have strongly proved that
this zone could be attributed to the evolution of volatiles that was generated during
primary decomposition of hemicellulose and cellulose. A major change in the slope
of the TGA could be observed at a temperature of 375oC, indicating the onset of the
second reaction zone. This zone ended at a temperature around 500oC, also called
the passive zone. Mass loss in this zone was contributed by the conversion of lignin
(Shafizadeh, 1968; Ramiah, 1970; Koufopanos et al., 1989; Bining and Jenkins,
1992; Williams dan Besler, 1994; Vargheyi et al., 1994).

123
At the end of the analysis (800oC), the final mass of the sample (supposedly
the ash content) was approximately 30% of the initial mass, which highly disagreed
with the ash content of 14.7% obtained from proximate analysis. The discrepancy
can be attributed to the presence of materials other than ash, such as char, a carbon
skeleton that results after evaporation of hemicellulose, cellulose and lignin
(volatiles). The heating environment has an influence on the composition of the
final mass. A reducing environment does not allow for complete conversion of
chars to take place due to the absence of oxygen required for oxidation. Hence, the
final mass in this study consisted of ash and unburnt chars.
Thermal degradation is influenced by the chemical composition of rice husk
(cellulose, hemicellulose and lignin) as different lignocellulose components have
different thermal characteristics. Studies have shown that decomposition begins
with hemicellulose (150 – 350oC), followed by cellulose (275 – 350oC) and lastly
lignin (250 – 500oC) (Ramiah, 1970; Shafizadeh dan DeGroot, 1976). Also, it was
suggested that the higher the content of cellulose, the higher the rate of organics
evaporation (devolatilisation).
According to Mansaray and Ghaly (1998b), thermal degradation of biomass
in the active zone occurs in two steps. The first thermal degradation step may be
attributed to the decomposition of hemicellulose and initial decomposition of
cellulose, while the second step comprises the final decomposition cellulose and
initial decomposition of lignin. They further concluded that the components of
hemicellulose and cellulose in rice husk played an important role in the evaporation
of volatiles, while lignin is responsible in the formation of char.
b) Comparisons of TGA in Reducing (Nitrogen) and Oxidising (Air)
Environments
TGA in a reducing environment proved useful in giving important insights into the
types of materials (cellulose, hemicellulose or lignin) lost at certain temperature
ranges. This was because the evolved volatiles were not immediately oxidised and
thus, did not interfere with actual mass loss contributed by each type of materials.
However, in actual operations, combustion is usually carried out in an oxidising
environment.

124
In an oxidising environment, a shift in temperature ranges corresponding to
each combustion stage was observed. Major weight loss due to the evolution of
volatiles and their subsequent oxidation was observed at approximately 230 –
330oC. The char oxidation stage took place at a temperature range of 300 – 500oC
(Mansaray and Ghaly, 1998a). Comparing the corresponding temperature for each
combustion stage, the onset temperature for devolatilisation in an oxidising
environment was found to be lower (~230oC) than that in a reducing environment
(~300oC). Similarly, the onset temperature for char combustion was found to be
lower (~300oC) compared to more than 400oC for a reducing environment. This can
be attributed to the presence of oxygen in the former case, which aided in the faster
ignition of char particles. Oxidation in a reducing environment was only supported
by atomic oxygen present as part of the chemical built of rice husk.
Beyond 700oC, no further weight loss was observed in a TGA carried out in
an oxidising environment (Mansaray and Ghaly, 1998a). The final mass obtained
consisted only of ash and not a combination of ash and unburnt chars, due to the
complete oxidation of chars in the presence of sufficient oxidising agent.
5.6.4.2 Biomass Particle Combustion
a) Mechanism of Biomass Combustion
The three stages involved in the combustion of biomass are (i) devolatilisation to
char and volatiles, (ii) combustion of volatiles and (iii) combustion of char. During
the devolatilisation stage, oxygen- and carbon-rich gases, mainly carbon monoxide
(CO) are released and the process is rapid due to the low calorific nature of these
biomass volatiles. In fluidised bed combustion, the combustion process was widely
believed to be limited by the char oxidation stage (Kulasekaran et al., 1998) as the
conversion of carbon to CO2 generates three times the heat released in comparison to
its conversion to CO. Due to their porous and highly disordered carbon structure,
chars from biomass are the most reactive of technical carbon materials (Henrich et

125
al., 1999). Apart from the highly microporous structure, their relatively high ash and
oxygen contents also results in a quicker burnout than analogous coal char. Ignition
temperatures of biomass chars are also shorter compared to coal chars as biomass
volatiles contain mainly CO, while coal volatiles contain a large amount of tar.
Complete combustion of biomass chars can be achieved in temperatures of more
than 377oC (650 K) given sufficiently long residence time of solid. According to Di
Blasi et al. (1999) in his study on the reactivities of biomass chars in air, the
temperature for complete conversion of wheat straw chars was 517oC while the
ignition temperature was as low as 146oC. However, a temperature of 385oC was
necessary to achieve the maximum combustion rate. Rice husk has similar
properties as wheat straw, as can be seen in Table 5.4. The relatively low
conversion temperature for biomass chars are also observed by Henrich et al. (1999).
In their char incineration tests in a small rotary kiln facility, complete char burnout
could be attained at temperatures down to approximately 600oC.
Table 5.4: Chemical properties of wheat straw and rice husk
Parameter Wheat Straw* Rice Husk#
Proximate Analysis (%)
Moisture 8.0 10.1
Volatile Matter 71.7 64.1
Fixed Carbon 15.1 11.1
Ash 5.2 14.7
Ultimate Analysis (% dry-ash-free)
Carbon (C) 47.7 45.2
Hydrogen (H) 6.0 6.0
Oxygen (O) 44.0 48.1
Nitrogen (N) 0.5 0.7
Calorific Value (MJ/kg) 19.25 17.7
Note: * - Jones et al. (2000)
# - from analysis

126
b) Controlling Factor in Particle Combustion
Depending on the combustor operating conditions, particle combustion may be
controlled by chemical reaction or transport phenomena. At low temperatures,
chemical reaction is a dominating factor but not at high temperatures, where
chemical kinetics are fast. At high temperatures, intra- and extra-particle mass
transfer resistance of the oxidising agent plays a major role in determining the
combustion rate. Combustion at these high temperatures regime, therefore, is
diffusion limited. It has been noted by Dutta and Wen (1977) through Di Blasi et al.
(1999) that for coal chars, combustion is diffusion limited for temperature above
650oC. It is expected that the temperature regime for diffusion-limited combustion
of biomass chars is lower as they are more reactive due to their more porous
structure.
c) Char Combustion Mechanisms
The resulting chars from the devolatilisation stage still contain some residue volatile
matters. Considering the close similarity in chemical properties between rice husk
samples in the study and wheat straw from literature (Jones et al, 2000), it can be
assumed that rice husk chars also possessed the same chemical properties as wheat
straw chars. In their study using the Functional-Group, Depolymerisation,
Vaporization, Cross-Linking (FG-DVC) pyrolysis model, it was predicted that
wheat straw chars consisted of 68.17% C, 15.12% H, 2.9% N and 13.91% O (dry-
ash-free basis). Hence, as the combustion of char progressed, some weight loss can
be attributed to the devolatilisation of these residual volatile matters (H and O).
According to Wornat et al. (1995), the char combustion stage can be split into three
further steps:-
i) devolatilisation of residue volatiles
ii) slight release of H and O accompanied by several inorganic transformations
iii) loss of other organic elements (C and N)
The first char combustion step corresponded to the loss of large amounts of
H and O. This can be attributed to the release of volatiles (eg CO, CO2, H2O and

127
other gases) resulting from the breakdown of weaker bonds within the char structure.
In addition, the volatiles released were found to consist primarily of CO, CO2 and
H2O, and not hydrocarbons due to the absence of visible volatile flame.
At the second char conversion step, steady but less dramatic release of H and
O continued. Several inorganic transformations took place, such as the vaporisation
of metals (particularly Na and K) as well as surface migration and coalescence of
these metals. Beyond a char conversion step of 50%, more drastic mass change was
observed due to the steady losses of C and N. The carbon-oxygen reaction during
this step was proposed by Hurt and Calo (2001) to proceed according to a three-step
semi-global mechanism:-
Adsorption : C + O2 → 2 C(O)
Surface reaction : C(O) + O2 → CO2 + C(O)
Desorption : C(O) → CO
5.6.4.3 Modelling of Rice Husk Particle Combustion in the SFB Combustor
The objective of the modelling study was to investigate the effects of
combustor temperature and rotating speed on the combustion characteristics of rice
husk particles. In actual, the heat of combustion evolved during the burning of rice
husk particles in the SFB is stored in the sand bed, which functioned to sustain
combustion by continuously igniting the incoming fresh feed. However, simulation
of a fully bubbling fluidised bed required the use of the multiphase Eulerian
(continuum) models, which are not available in the current version (5.3 and 5.5) of
the FLUENT program code. Different from the Langrarian (discrete particle)
models used in tracking individual particle trajectory in a modelling domain (Section
6.6.2), the Eulerian models consider all phases to be continuous and interpenetrating.
Hence, to investigate the rice husk combustion characteristics in the SFB, several
simplifications and assumptions made in the modelling study were:-

128
i) The temperature inside the SFB was assumed to be more or less uniform at a
certain value of interest after accounting for heat loss to the surrounding (at
approximately 20%, according to the first approximation factor of 0.80 for
heat loss to the surrounding suggested by Gaydon and Wolfhard, 1979) by
manipulating the air factors. Since a fluidised bed could not be simulated in
FLUENT to retain the heat of combustion, the air feed temperature was
designated at that value of interest to approximate the uniform temperature
inside the combustor,
ii) The composition of gases in the air feed corresponded to that of the air
factors used in order to approximate the actual gaseous components that are
present in the combustor during the combustion process, and
iii) Only the combustion profile of a discrete particle was tracked.
Having a Umf value of 0.5 m/s (Hao Liu et al., 1995), the sphericity, φs of the
rice husk particles was found to be 0.19. Also the volume-surface mean diameter
was calculated to be 1.6 mm (Mansaray and Ghaly, 1997). The air factors to reach a
certain operating temperature inside the SFB and the corresponding gaseous
components to be used in FLUENT were pre-determined using the FLAME program
code.
a) Effect of Temperature on the Quality of Rice Husk Ash
Operating temperatures in the SFB for combustion of rice husk were restricted to the
range of 500 – 700oC. A temperature of at least 500oC was required for the
complete oxidation of chars (Di Blasi et al., 1999). The range of temperature
investigated was also limited to less than 700oC to prevent structural changes to the
resulting ash. As cited by Lin et al. (1998), Kaupp (1984) and Schiefelbein (1989)
had indicated in their previous studies that physical structural transformation of
silica from its original amorphous state to a crystalline state occurs should the
oxidation of rice husks be carried out at a temperature beyond 700oC (973 K).
Residual carbons will be encapsulated inside the crystallised silica, making the
combined carbon unavailable for further oxidation reactions even at higher
temperatures. Furthermore, the combustion of rice husk should be complete at

129
700oC as TGA results (in an oxidising environment) (Mansaray and Ghaly, 1998a)
showed that no further mass changes took place beyond this temperature.
Hence: Temperature range selected for the investigation of rice combustion
characteristics in the SFB was 500 – 700oC.
b) Effect of Combustor Temperature
To study the effect of combustor temperature on the combustion characteristics of
rice husk particles, the rotating speed of the SFB was held constant at 122 RPM (5-g
loading). The combustor temperature was maintained at 500oC, 600oC and 700oC
after accounting for heat loss to the surrounding (~20%) while the air inputs in all
cases were that sufficient to yield a fluidising velocity of 2.5 Umfc at the distributor
plate or 3.5 Umfs at the bed surface (bed height = 0.15 m). The rice husk particles
were assumed to be ejected to the freeboard region in the SFB combustor by bubble
eruption at the bed surface.
From Figures 5.66 – 5.68, it could be observed that the duration for the
complete combustion of rice husk particles were significantly reduced as the
temperature in the combustor was increased from 500oC to 600oC and 700oC.
Conversion in the figures was defined as the change in particle mass at time t
divided by the initial mass of the particle. It only took less than 0.50 min (27 s)
(Figure 5.68) for the particles to complete the devolatilisation and char combustion
stages when the combustor temperature was maintained at 700oC. This was in
contrast with the duration of 1.35 min (81 s) at 600oC (Figure 5.67) and 5.88 min
(353 s) at 500oC (Figure 5.66), a significant reduction of 3 times and 13 times
respectively. Rapid and complete combustion of particles in the SFB is paramount
to its operation by ensuring that the heat evolved maintains the bed temperature,
besides preventing the bed temperature from dropping too low, which will
subsequently quench the combustion process. Moreover, accumulation of feed that
will subsequently reduce the freeboard volume can be prevented.
It was also observed from Figure 5.66 that at 500oC, the duration for the
release of volatiles (241 s) was approximately two times higher than the duration for

130
the burnout of char (110 s). This can be attributed to the fact that the combustion of
high-volatile content materials such as rice husk is heat transferred-controlled.
Hence, it is vital that the temperature inside the combustor is sufficiently high to
allow for the devolatilisation process to occur. From the TGA analysis, the release
of volatiles from rice husk took place at a temperature between 275oC and 375oC,
while char burning took place beyond 375oC (Figure 5.65). The combustor
temperature at 500oC therefore, was sufficient to allow for the complete combustion
of rice husk to occur, albeit very slowly in which the rate of devolatilisation was
controlling. When the temperature inside the combustor was increased (600oC and
700oC), the rate of char burnout, in turn become the dominating factor. Similar to
high carbon-content materials such as coal, the burnout of the resulting char particles
is controlled by the mass transfer of oxygen into and around the char particles
(diffusion limited). At 600oC and 700oC, the temperatures were high enough as to
allow for fast chemical kinetics to occur. The rate of char burnout, hence was
limited by the rate at which the oxidant was brought into contact with the surface of
the char particles. In other words, the combustion process was diffusion limited,
whereby heterogeneous mixing of the gaseous oxidant and solid char particles was
crucial. This explained the longer duration of char burnout compared to
devolatilisation experienced in the SFB combustor operating at temperatures above
600oC. Another feature observed from the combustor operating at more than 600oC
was that temperature no longer exerted a strong influence on the rate of char-
burnout. The reduction in char burnout time from 600 – 700oC was not as high as
that from 500 – 600oC (Figure 5.69) primarily because the mixing process inside the
combustor limited the rate of char burning. Thus, it was expected that the drop in
char burnout time will be insignificant even if the combustor temperature was
increased beyond 700oC unless other operating conditions were changed. To prove
this point, the combustor temperature was increased to 800oC for the same operating
conditions. As can be seen from Figure 5.69, the reduction in combustion reaction
time was very little from 700oC to 800oC. The combustion reaction time tend to
reach a plateau beyond the temperature of 700oC.
Hence: At the same operating conditions (rotating speed = 5-g loading @ 122
RPM, air feed rate = 3 Umfc), the reduction in combustion reaction time was very
huge with the increase in combustor temperature from 500oC to 600oC. Beyond

131
600oC, the decrease in combustion reaction time was insignificant due to diffusion-
controlled reactions.
c) Effect of Combustor Rotating Speed
In the study of the effect of rotating speed, the combustor temperature was held
constant at 700oC while the rotating speed was varied from 122 to 211 RPM (to give
g-loadings of 5- to 15-g). The value of 700oC was chosen as at this temperature,
chemical kinetics are fast, thus rendering the combustion rate to be diffusion-
controlled.
The temperature and conversion profiles of rice husk particles were
presented in Figures 5.70 – 5.72. Meanwhile, from Figure 5.73, there appeared to be
an optimum rotating speed for reduction in combustion reaction time for the rice
husk particles. The duration for devolatilisation remained more or less the same
(~10 s) for all rotating speeds. The rate of turbulence inside the combustor due to
the increase in swirl projected no influence at all to the rate of devolatilisation. This
can be attributed to the nature of the devolatilisation process, which is strongly
affected by temperature only. However, the duration for char combustion increased
beyond a rotating speed of approximately 170 RPM, and this contributed to the
overall increase in combustion reaction time. The duration of char combustion was
expected to be dominating over the duration of devolatilisation when operating at a
temperature of 700oC, in which the reaction was diffusion-limited with respect to
char burning. The existence of the optimum point was expected as in all swirling-
flow combustions, there appeared to be an optimum swirl intensity at which the
combustion reaction time was minimal. In their studies of swirling combustion of
pre-mixed natural gas in air, Zhang and Hill (1996) also proved that low to moderate
swirl was beneficial to combustion reaction time while excessive swirl led to
increment in combustion reaction time.
Also apparent from Figure 5.73 was the observation that the increase in
combustion reaction time became more pronounced at high swirl conditions.

132
Referring to Figure 5.72, one possible explanation was that at high swirl, there might
be augmented heat transfer between the particle and the hot gases in the combustor.
This effect might subsequently lead to the drop in temperature of the char particle to
the vicinity of 650oC for a period of approximately 6 s. Taking the conventional
assumption that rice husk chars have a cut-off temperature between kinetic-
controlled and diffusion-controlled combustion of 650oC (similar to coal chars), it
was speculated that the combustion of rice husk chars (in the SFB combustor
rotating at 211 RPM) entered the regime whereby chemical kinetics were slow. The
rate of char combustion, then, was kinetically-controlled until the temperature of the
char particles increased back to 700oC as combustion progressed and heat was
released within the char particles. Although the period of kinetic-controlled
combustion signified only about one-third of the total char burning duration at this
high swirl conditions, it should be noted that the same period represented a
significant one-half of the total char burning duration (~13 s) at lower swirls. Also,
in between the low-temperature band, some combustion time was somehow lost in
order for the temperature of the char particles to drop and then to increase again.
Excessive swirl in the SFB combustor, therefore, was detrimental to the combustion
of rice husk particles by significantly increasing the combustion reaction time.
Hence: Operating the SFB beyond 10-g loading (173 RPM) @ 700oC
resulted in the increase of combustion reaction time of rice husk.
Investigations on both the effects of combustor temperature and rotating
speed on the combustion characteristics of rice husk particles showed that the
combustion reaction time was reduced from 5.88 minutes at 500oC to 1.33 minutes
at 600oC, representing a significant reduction of approximately 4.4 times. Further
increase in temperature to 700oC led to a lower reduction in combustion reaction
time (to 0.44 minutes) due to diffusion-controlled reactions. Also, operating the
combustor beyond a rotating speed of 173 RPM (10-g loading) at 700oC resulted in
the increase in combustion reaction time from a minimum of 24.5 s at 173 RPM to
31.3 s at 211 RPM (15-g loading). Hence, in actual operation for burning of rice
husk particles, the SFB combustor should be operated at a temperature range of 600
– 700oC and a rotating speed of less than 10-g loading.

CHAPTER VI
COMMISSIONING AND DELIVERY OF THE DEVELOPED SFB
COMBUSTOR
6.1 Commissioning of the SFB Combustor System Components
Preliminary test-runs on the developed SFB combustor system was
performed at the fabricator’s premises on 24th to 25th July 2002 in order to assess the
functionality of the system as specified in the tender document (Appendix A). Due
to space and power limitations at the laboratory where the system is supposed to be
delivered (Block N12 of Faculty of Chemical Engineering & Natural Resources
Engineering, UTM Skudai, Johor), the test-runs were conducted at the fabricator’s
premises, as shown in the footages included in Attachment I. In general, operations
of the major components of the SFB prototype, such as:-
a) Spinning bed
b) Screw conveyor unit
c) Main blower unit with air heating
d) Secondary blower unit
e) Temperature monitoring in the primary chamber
f) Liquefied Petroleum Gas (LPG) Flame Pilot Burner
complied with the requirements specified in the tender document. The full
operational functions of the system, however, can only be assessed once proper
experimental works on the system commences. Since the scope of the current

134
research is for the design and development of the prototype SFB combustor, the
performance of the system during actual cold and hot commissioning, therefore, is
subjected to future research works. The major components of the SFB prototype
were shown in Plates 6.1 to Plate 6.9.
6.2 Delivery of the SFB Combustor System
The prototype of the SFB combustor system was delivered to the Faculty of
Chemical Engineering & Natural Resources Engineering, UTM Skudai, Johor on
27th August 2002. As mentioned earlier, due to space limitations at Block N12, the
SFB combustor was placed at Makmal Kerja Berat (Block N10) pending the
construction of a new laboratory building to accommodate the rig for future
experimental works. Footages of the SFB delivery to UTM premises were included
in Attachment II.

CHAPTER VI
CONCLUSIONS AND RECOMMENDATIONS
7.1 Conclusions
7.1.1 The Developed SFB Combustor Design
The prototype of the tapered horizontal SFB combustor was designed to
consist of a cylinder (ID 600 mm × 800 mm) partitioned into two sections - the
primary chamber and the secondary chamber. The primary chamber (300 mm in
length) will house the fluidised bed while the secondary chamber (500 mm in
length) was meant to ensure complete combustion in the gas phase and as a
particulate control device. The whole combustor is to be rotated co-axially on the
horizontal axis. The end walls of the primary chamber were tapered at 60o
(measured horizontally) to equalise the non-uniform radial bed fluidisation inherent
in centrifugal beds. A centrifugal bed fluidised layer by layer from the inner surface
outward. Tapering these end walls significantly increase the value of FR (ratio of the
number of Umfc near the SFB wall to the number of Umfs at the bed surface) from
approximately 0.3 in an untapered bed to nearly one (1) for a bed depth of 150 mm.
A minimum fluidising velocity of 2 Umfc or 3 Umfs are required in order to establish
sufficient turbulence inside the bed. For the proposed SFB dimensions, the tapering
angle and bed depth were found to be optimum at 60o and 150 mm, respectively
while simultaneously maintaining the desired fluidising conditions and ensuring that
the air feed requirements were within operational capability of the blower unit. The
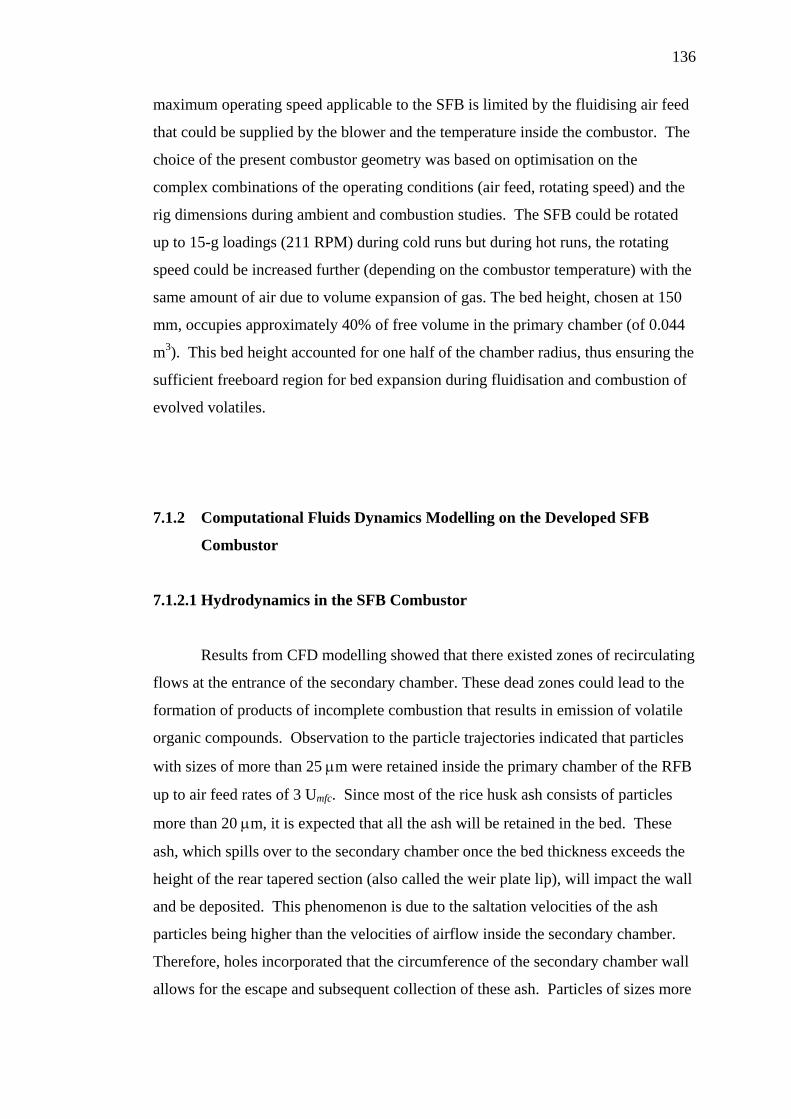
136
maximum operating speed applicable to the SFB is limited by the fluidising air feed
that could be supplied by the blower and the temperature inside the combustor. The
choice of the present combustor geometry was based on optimisation on the
complex combinations of the operating conditions (air feed, rotating speed) and the
rig dimensions during ambient and combustion studies. The SFB could be rotated
up to 15-g loadings (211 RPM) during cold runs but during hot runs, the rotating
speed could be increased further (depending on the combustor temperature) with the
same amount of air due to volume expansion of gas. The bed height, chosen at 150
mm, occupies approximately 40% of free volume in the primary chamber (of 0.044
m3). This bed height accounted for one half of the chamber radius, thus ensuring the
sufficient freeboard region for bed expansion during fluidisation and combustion of
evolved volatiles.
7.1.2 Computational Fluids Dynamics Modelling on the Developed SFB
Combustor
7.1.2.1 Hydrodynamics in the SFB Combustor
Results from CFD modelling showed that there existed zones of recirculating
flows at the entrance of the secondary chamber. These dead zones could lead to the
formation of products of incomplete combustion that results in emission of volatile
organic compounds. Observation to the particle trajectories indicated that particles
with sizes of more than 25 µm were retained inside the primary chamber of the RFB
up to air feed rates of 3 Umfc. Since most of the rice husk ash consists of particles
more than 20 µm, it is expected that all the ash will be retained in the bed. These
ash, which spills over to the secondary chamber once the bed thickness exceeds the
height of the rear tapered section (also called the weir plate lip), will impact the wall
and be deposited. This phenomenon is due to the saltation velocities of the ash
particles being higher than the velocities of airflow inside the secondary chamber.
Therefore, holes incorporated that the circumference of the secondary chamber wall
allows for the escape and subsequent collection of these ash. Particles of sizes more

137
than 1 mm were rapidly returned to the bed due to higher momentum and hence,
aided in the transfer of heat from the freeboard region back to the bed as they were
ejected from the bed surface. Finer particles (< 25 µm) were observed to be blown
out of the primary chamber with air inputs exceeding 3 Umfc. This helped in
separating fines (sand, ash or char) that were generated during the constant attrition
among these particles during fluidisation. The bed will behave erratically with the
presence of large amounts of fines due to the interparticle forces between them.
Tapering the primary chamber of the RFB was also beneficial to combustion of
premixed gas mixtures. Flame could be sustained inside the combustor even for
inlet mixture velocities far exceeding the normal flame velocity due to the
progressive reduction in velocity as the mixture moved radially inwards. Rotating
the tapered RFB at higher speeds increased the combustion intensity and the rate of
CO burnout. The rate of flow recirculation and turbulence increased when operating
at higher rotating speeds. The higher degree of recirculating flows recirculated the
combustion products and the heat evolved more rapidly to continually re-ignite the
oncoming unburnt mixture, resulting in more intense combustion. More rapid
mixing between reactants and oxidants at higher rotating speeds also led to a higher
rate of CO burnout and subsequently a reduction in CO emission level in the RFB
outlet.
7.1.2.2 Optimum Operational Range for Combustion of Rice Husk
The optimum operating temperature for combustion of rice husk was in the
range of 500 – 700oC. In fluidised bed applications, the combustion was widely
believed to be limited by the char combustion stage. The minimum temperature of
500oC was required for the complete combustion of chars while 700oC was the
highest temperature for the combustion of rice husk if the undesirable physical
transformation of the resulting ash from an amorphous to crystalline state is to be
prevented. For combustion of rice husk in the RFB, the combustion reaction time
was observed to be significantly reduced as the temperature in the combustor was
increased from 500oC to 600oC (from 5.88 minutes to 1.33 minutes). Beyond

138
600oC, chemical kinetics were fast and the reduction in combustion reaction time
was not as significant (combustion reaction time reduced to only 0.44 minute at
700oC). Combustion of rice husk at these temperatures was diffusion-controlled.
The combustion reaction time was also found to be increasing when the RFB were
operated at g-loadings in the excess of 10-g (173 RPM). At higher swirls (> 10-g
loadings), some degree of quenching was observed on the particle due to augmented
heat transfer between the particles and the hot gases. This might cause the char-
burning reactions to be kinetically-controlled for a certain period of time until the
heat evolved increased the temperature of the particle and shifted the reactions to the
diffusion-controlled regime.
7.1.2.3 Recommendations for Design Improvement
During modelling studies on the prototype of the RFB combustor, a number
of design and operational problems had been identified. The modelling results
provided a guide for specific modifications to the current design of the prototype.
Several recommendations to improve the design of the RFB combustor are as
follows:-
a) Inclusion of baffles
Near the primary chamber exit, zones of recirculating flows were formed due to the
sudden expansion of swirling gases from the tapered outlet of the primary chamber.
In actual combustion operations, particles such as ash could be trapped in these
zones and therefore could not be removed. Modelling results showed that the
inclusion of four internal baffles (500 mm long, 5 mm thick) placed co-centrally and
90o apart from each other on the secondary chamber wall could reduced the degree
of recirculating flows in these zones to the extent whereby particles were no longer
trapped. The presence of baffles with width ranging from 50 to 100 mm was
successful in breaking eddies formed near the primary exit. However, baffles with
width of 50 mm were found to increase the degree of swirling and residence time of

139
gases in the secondary chamber. Hence, the efficiency of gas-phase combustion in
this chamber could be increased.
b) Reducing the rear tapering height at the primary chamber
The initial designation of the tapering height at both ends of the primary chamber at
225 mm resulted in two operational problems. Firstly, the bed might be too thick
due to the ash accumulation during the combustion process before the ash layer at
the top of the bed spills over to the secondary chamber. Secondly, there is a
possibility of the ash layer spilling over into the piping for secondary air at the front
end of the primary chamber and resulted the obstruction of secondary airflow.
Therefore, it is recommended that the tapering height at the rear tapered section be
reduced to 200 mm so that the ash could spill over once the bed thickness increased
from 150 mm to 200 mm. Moreover, the spillover of ash from the front end of the
tapered section could be prevented.
c) Rotating the RFB at two different speeds
The limitation of operating the current design of the RFB is the amount of air input
to the primary chamber that could be supplied by the blower unit to fluidise the bed
media, which in turn, is determined by the rotating speed. Operating the RFB at
higher rotating speeds no doubt improved gas-phase combustion in the secondary
chamber, but that necessitates higher air feed to fluidise the bed which is beyond the
capacity of the blower. Modifications could be made by rotating the RFB at different
speeds (co-axially). The secondary chamber could be rotated at very high speeds
(up to 1000 RPM) without any influence to the fluidising state in the primary
chamber that is rotated at a lower speed. Computer simulations showed CO
emission levels in the exhaust gases were lowered by several times for a RFB
operating at two different speeds (15-g loading primary chamber, 30-g loading
secondary chamber) compared to a RFB operating at only one speed (15-g loadings
for primary and secondary chambers).

140
7.1.3 Commissioning and Delivery of the SFB Combustor
The prototype of the SFB combustor system was successfully delivered to
the premises of Universiti Teknologi Malaysia, Skudai after being commissioned at
the fabricator’s premises. Due to limitations of space and power requirements at the
laboratory, preliminary cold and hot experimental works could not be performed on
the prototype. Nonetheless, the functionality of the system had been proven and the
performance of the system will be subjected to future experimental works, which are
not included in the current research scopes.
7.2 Recommendations for Future Research Works
Several recommendations for future study on the developed tapered
horizontal RFB rig are as follows:-
a) Cold commissioning
Cold commissioning on the developed RFB rig should be carried out to investigate
its operational capability as designed, such as the applicable rotating speeds and
fluidising air inputs. Determination of the basic hydrodynamics of the rig
(minimum fluidising velocities, pressure drops, bed thicknesses, fluidisation
phenomena) should also be carried out and the results compared with theoretical
values. The information obtained from this study will provide a better
understanding on the behaviours and the optimum operating parameters of the RFB
rig before the more complicated combustion study is carried out.
b) Hot commissioning
Hot commissioning on the RFB rig include the determination of bed starting-up
procedures and combustion characteristics of rice husk. Apart from investigating
the suitable procedure for bed starting-up and the optimum operating parameters
applicable for rice husk combustion in the rig, the study should also covered

141
performance study (the determination of combustion efficiency, analysis of resulting
ash which will indicate the degree of char burning in the RFB, flue gas emissions).
Results from CFD modelling obtained from the current research such as the range of
rotating speeds and combustor temperatures applicable for good combustion
characteristics of rice husk in the RFB rig should be used as a basis for the proposed
combustion study.
c) Combustion of different types of waste materials
Apart from the combustion of rice husk, combustion of other types of waste such as
palm waste, municipal solid waste (MSW) and sludge could be carried out in the
RFB rig to study its versatility in burning different types of waste. In-depth
combustion study (determination of optimum operating parameters and combustor
performance) such as those proposed for the combustion of rice husk could be
extended to these types of waste. The suitable operating mode (starved or excess air
conditions) in burning different types of wastes should first be determined based on
mass and energy balances.
d) CFD modelling on the formation of pollutants such as NOx and soot
Computational fluids dynamics modelling could also be carried out to determine the
levels of pollution emissions from the developed RFB when operating at various
operating conditions (rotating speeds, fluidising air inputs, temperatures) and while
burning different types of waste. Results from the proposed modelling study could
provide insights into the conditions inside the rig leading to the formation of
pollutants such as NOx (thermal NOx, fuel NOx, prompt NOx) and soot. These
conditions include the formation of hot-spots, incomplete combustion of particles
and low particle residence time due to high air inputs.
e) Development of air pollution control (APC) systems
Results from combustion studies and CFD modelling on the levels of pollutant
emissions during combustion of different types of waste in the RFB rig could be
utilised in the selection of appropriate APC device to mitigate the pollution

142
problems. This work includes the design of the APC device and perhaps the
determination of the effectiveness of the proposed device in mitigating the levels of
pollutants through CFD modelling.
f) Energy recovery
Heat evolved from the combustion of different types of waste in the RFB rig could
be targeted for energy recovery. Experiments and simulation studies should be
carried out to determine the optimum design of the heat recovery system and the
optimum operating parameters for efficient energy recovery.
g) Techno-economic evaluation
The determination of the economics of the developed RFB technology and its
feasibility for commercialisation should also be conducted.

143
REFERENCES
Bining, A. S. and Jenkins, B. M. (1992). “Thermochemical reaction kinetics from
rice straw from an approximate integral technique.” ASAE Paper. No. 92-6029.
St. Joseph, MI.
Botterill, J. S. M.; Teoman, Y. and Yuriger, K. R. (1982). “The effect of operating
temperature on the velocity of minimum fluidisation bed voidage and general
behaviour.” Powder Technology. 31. pp 101 – 110.
Boubel, R. W. and Junge, D. G. (1971). “A study of fluidised bed filter subjected to
high radial acceleration.” AIChE Symp. Series. 69. No. 128. pp 138 – 141.
Broughton, J. (1975). “Gas combustion in shallow fluidised beds.” Applied Energy.
1. pp. 61 – 79.
Broughton, J. and Elliott, D. E. (1975). “Heat transfer and combustion in centrifugal
fluidised beds.” Inst. Chem. Eng. Symposium Series. No. 43. pp 11-1 to 11-5.
Brown, G. E.; Farkas, D. F. and De Marchena, E. S. (1972). “Centrifugal fluidised
bed.” Food Technology. Dec. 1972. pp 23 – 30.
Brown, G. G. (1950). “Unit Operations.” New York: Wiley.
Caram, H. S.; Efes, Z. and Levy, E. K. (1984). “Gas and particle motion induced by
a bubble eruption at the surface of a gas fluidized bed.” AIChE Symposium
Series. 80 (234). pp 103 – 106.
Chalchal, S.; Sheehan, T. V. and Steinberg, M. (1974). “Coal combustion and
desulphurisation in a RFB reactor.” BNL Report. No. 19308.
Chan, C. K.; Loesel Sitar, J. L.; Beauvais, R. and Mayinger, F. (1996). “Modelling
maximum flame speeds.” Nuclear Engineering and Design. 166. pp 463 – 469.

144
Chen, Y.M. (1987). “Fundamentals of a Centrifugal Fluidized Bed.” AIChE Journal.
Vol. 33. No. 5. pp 722 – 728.
Chevray, R.; Chan, Y. N. I.; and Hill, F. B. (1980). “Dynamics of bubbles and
entrained particles in the rotating fluidized.” AIChE Journal. 26. No. 3. pp 390 –
398.
Chevray, R.; Chan, Y. N.I. and Hill, F. B. (1980). “Dynamics of bubbles and
entrained particles in the rotating fluidized bed.” AIChE Journal. Vol. 26. No. 3.
pp 390 – 398.
Cohen, J. S. and Yang, T. C. S. (1995). “Progress in food dehydration.” Trends in
Food Science & Technology. Vol. 6. pp. 20 – 25.
Demircan, N. (1979). “Rotating Fluidized Bed Combustion.” University of
Sheffield: PhD Thesis.
Di Blasi, C.; Buonanno, F. and Branca, C. (1999). “Reactivities of some biomass
chars in air.” Carbon. Vol. 37. Issue 8. pp 1227 – 1238.
Dutta, S. and Wen, C. Y. (1977). “Reactivity of Coal and Char Em Dash 2. In
Oxygen-Nitrogen Atmosphere.” Ind Eng Chem Process Des Dev. Vol. 16. Issue
1. pp 31 – 37.
Edisham Mohd Sukor (1999). “Pemisahan Partikel Abu Sekam Padi Dengan
Menggunakan Siklon.” Universiti Teknologi Malaysia, Skudai: Final Year
Dissertation.
Elperin, I. T.; Zabrodsky, S. S.; Yefremtsev, V. S. and Mikhailik, V. D. (1967).
Collected papers on “Intensification of transfer of heat and mass in drying and
thermal processes.” Nauka i Tekhnika. 232. Minsk: BSSR.

145
Environment Agency (1996). “Integrated Pollution Control (IPC) Guidance Note,
Series 2 (S2): Waste Disposal and Recycling Sector, S2 5.01: Waste
Incineration.” London: IPC S2 5.01
Ergun, S. (1952). “Fluid flow through packed bed column.” Chem. Eng. Progress.
48. pp 89 – 94.
Fan, L. T. (1978). “Fluidization Bed Combustion in Centrifugal Field.” Energy
Communications. 4 (6). pp. 509 – 512.
Fan, L. T.; Chang, C. C.; and Yu, Y. S. (1985). “Incipient fluidization condition for
a centrifugal fluidized bed.” AIChE Journal. 31. No. 6. pp 999 –1009.
Farkas, D. F.; Lazar, M. E. and Butterworth, T. A. (1969). “The centrifugal fluidised
bed.” Food Technology. 23. pp 125 – 156.
Felder, R. M. and Rosseau, R. W. (1978). “ Elementary Principles of Chemical
Processes.” USA: John Wiley & Sons, Inc.
FLUENT 5 User’s Guide. (1998). Fluent Incorporated, Centerra Resource Park, 10
Cavendish Court, Lebanon NH 03766.
Gaydon, A. G. and Wolfhard, H. G. (1979). “Flames: Their Structure, Radiation and
Temperature.” 4th Ed. London: Chapman and Hall.
Geldart, D. (1972). “The effect of particle size and size distribution on the behaviour
of gas-fluidized beds.” Powder Technology. 6. pp 201 – 215.
Geldart, D. (1973). “Type of gas fluidization.” Powder Technology. 7. pp 285 – 292.
Haider, A. and Levenspiel, O. (1989). “Drag Coefficient and Terminal Velocity of
Spherical and Nonspherical Particles.” Powder Technology. 58. pp 63 – 70.

146
Hanjalic, K. (19947). “Advanced turbulence closure models, a view of current status
and future prospects.” International Journal of Heat and Fluid Flow. 15 (3).
No 3. pp 178.
Hao Liu, Zhijie Lin, Dechang Liu and Weiheng Wu. (1995). “Combustion
Characteristics of Rice Husk in Fluidised Beds.” Fluidised Bed Combustion.
Vol. 1. pp 615 – 618.
Hatch, L. P.; Regan, W. H. and Powell, J. R. (1960). “Fluidised bed for rocket
propulsion.” Nucleonics. 18. No. 12. pp102.
Henrich, E.; Bürkle, S.; Meza-Renken, Z. I. And Rumpel, S. (1999). “Combustion
and gasification kinetics of pyrolysis chars from waste and biomass.” Journal of
Analytical and Applied Pyrolysis. 49. pp 221 – 241.
Hong, J.; Shen, Y. and Tomita, Y. (1995). “Phase diagrams in dense phase
pneumatic transport”. Powder Technology. 84. pp 213 – 219.
Houthon, J. (1993). “Royal commission on environmental pollution, seventeenth
report: incineration of waste.” London: Her Majesty Stationery Office.
Howard, J. R. (1989). “Fluidized Bed Technology.” New York: Adam Hilger.
Huang, S.; Jing, S.; Wang, J. F.; Wang, Z. W and Jin, Y. (2001). “Silica white
obtained from rice husk in a fluidized bed.” Powder Technology. 117. pp 232 – 238.
Hunt, C. H. and Brennan, D. (1965). Aust. Chem. Eng. March 9.
Hurt, R. H. and Calo, J. M. (2001). “Semi-global intrinsic kinetics for char
combustion modeling.” Combustion and Flame. 125. pp 1138 – 1149.
Ishizuka, S. (1990). Combust. Flame. 82:176.

147
Ismail, A. F. (1996a). “Modelling of char structure influence on the self-ignition
temperature during coal gasification.” In Proceedings of First Trabzon
International Energy and Environmental Symposium. pp 721 – 726. Trabzon,
Turkey.
Ismail, A. F. (1996b). “2-D and 3-D Cellular models using erosion and dilation:
Development and applications.” Malaysian Journal of Computer Science. 9. pp
18 – 24.
Ismail, A. F.; Yusaf, T. F.; Mahdi, F. M. A. dan Shamsuddin, A. H. (1997).
“Combustion Processes of Rice Husk For Energy.” RERIC International Energy
Journal. Vol. 19. No. 2.
Jones, J. M.; Pourkashanian, M.; Williams, A. and Hainsworth, D. (2000). “A
comprehensive biomass combustion model.” Renewable Energy. 19. pp 229 –
234.
José, M. J. S.; Olazar, M.; Aguado, R.; and Bilbao, J. (1996). “Influence of the
conical section geometry on the hydrodynamics of shallow spouted beds.”
Chemical Engineering Journal. 62. pp. 113 – 120.
Kagan, L. and Sivashinsky, G. (2000). “Flame propagation and extinction in large-
scale vortical flows.” Combustion and Flame. 120. pp 222 – 232.
Kao, J.; Pfeffer, R. and Tardos, G. I. (1987). “On partial fluidisation in rotating
fluidizing beds.” Powder Technology. 33, No. 5. pp 858 – 861.
Kaupp, A. (1984). “Gasification of Rice Hulls: Theory and Practices.” Eschborn:
Deutsches Zentrum Fuer Entwicklungs Technologien (GATE).
Khoshnoodi, M. and Weinberg, F. J. (1978). “Combustion in Spouted Beds.”
Combustion and Flame. 33. pp 11 – 21.

148
Koufopanos, C. A.; Maschio, G. and Lucchesi, A. (1989). “Kinetic modelling of the
pyrolysis of biomass and biomass components.” Canadian Journal of Chemical
Engineering. 67 (1). pp 75 – 84.
Kroger, D. G.; Levy, E. K. and Chen, J. C. (1979). “Flow characteristics in a packed
and fluidized rotating beds.” Powder Technology. 24. pp 9 – 18.
Kulasekaran, S.; Linjewile T. M.; Agarwal, P. K. and Biggs, M. J. (1998).
“Combustion of a porous char particle in an incipiently fluidized bed.” Fuel.
Vol. 77. No. 14. pp 1549 – 1560.
Kunii, D. and Levenspiel, O. (1991). “Fluidization Engineering.” 2nd Ed. Boston:
Butterworth-Heinemann.
La Nauze, R. D. (1986). “A review of the fluidised bed combustion of biomass.”
Journal of the Institute of Energy.
Lazar, M. E. and Farkas, D. F. (1971). “The centrifugal fluidised bed drying studies
on piece form foods.” J. Food Science. 36. pp 315 – 319.
Levy, E. K., Martin, N. and Chen, J. (1978). “Minimum fluidization and start-up of
a centrifugal fluidized bed.” Fluidization – Proceedings of the Second
Engineering Foundation Conference (J.F. Davidson and D.L. Kearns, Eds).
Cambridge University Press. pp 71-80.
Levy, E. K.; Dodge, C. and Chen, J. C. (1976). “Parametric analysis of a centrifugal
fluidized bed coal combustor.” ASME paper. 76HT68. Presented at National
Heat Transfer Conference, Boulder Colorado.
Levy, E. K.; Martin, N. and Chen, J. C. (1977). “Centrifugal fluidised bed
combustion.” Proc. 5th Int. Fluidized Bed Combustion. Vol. 3. pp 288 – 296.

149
Levy, E. K.; Shakespeare, W. J.; Tabatabaie-Raissi, A. and Chen, C. J. (1981).
“Particle elutriation from centrifugal fluidized beds.” AIChE Symposium Series.
77. No. 205. pp 86 – 95.
Lilley, D. G. and Chigier, N. A. (1971). “Non-isotropic turbulent stress
distribution.” International Journal of Heat and Mass Transfer. 14. pp 573.
Lin, K. S.; Paul Wang, H.; Lin, C. J. and Ching I-Juch. (1998). “A process
development for gasification of rice husk.” Fuel Processing Technology. 55. pp
185 – 192.
Magnussen, B. F. and Hjertager, B. H. (1976). “On mathematical models of
turbulent combustion with special emphasis on soot formation and combustion.”
In 16th Symp. (Int’l) on Combustion. The Combustion Institute.
Mansaray, K. G. and Ghaly, A. E. (1997). “Physical and Thermochemical Properties
of Rice Husk”. Energy Sources. 19. pp 989 – 1004.
Mansaray, K. G. and Ghaly, A. E. (1998a). “Thermogravimetric Analysis of Rice
Husk in an Air Atmosphere.” Energy Sources. 20. pp 653 – 663.
Mansaray, K.G. and Ghaly, A. E. (1998b). “Thermal Degradation of Rice Husks In
Nitrogen Atmosphere.” Bioresource Technology. 65. pp 13 – 20.
Mathur, K. B. and Gishler, P. E. (1955). “Spouted Beds.” A. I. Ch. J. 1. pp 157.
McCabe, W. L.; Smith, J. C. and Harriot, P. (1993). “Unit Operations of Chemical
Engineering.” 5th Ed. New York: McGraw Hill.
Metcalfe, C. I. And Howard, J. (1977). “Fluidisation and combustion in a rotating
fluidised bed.” Applied Energy. 3. pp. 65 – 74.
Metcalfe, C. I. and Howard, J. R. (1978). “Towards higher intensity combustion:-
Rotating fluidised beds.” In Fluidization – Proceedings of the Second

150
Engineering Foundation Conference (J. F. Davidson and D. L. Keairns, Eds.).
Cambridge University Press.
Mokhtar, H.; Ab. Rashid, A. H.; Salleh, M. S. dan Ujang, Z. (1986). “Malaysian
Experience on Fluidised Bed Combustor for Agricultural Wastes.” Proc. ASEAN
Conf. on Energy from Biomass. pp 62 – 75.
Monthly Statistical Bulletin, Department of Statistics Malaysia. Mac 1999.
Morsi, S. A. and Alexander, A. J. (1972). “An Investigation of Particle Trajectories
in Two-Phase Flow Systems.” J. Fluid Mech. 55(2). pp 193 –208.
Nasserzadeh, V.; Swithenbank, J.; Schofield, C.; Scott, D. W.; Loader, A.; Leonard,
A.; Russell, R. and Winn, D. (1993). “Three-dimensional Modelling of the
Conventry MSW Incinerator Using Computational Fluid Dynamics and
Experimental Data.” Trans IChemE. Vol 71. Part B. pp 269 – 279.
Niessen, W. R. (1995). “Combustion and Incineration Processes: Applications in
Environmental Engineering.” 2nd Ed. New York: Marcel Dekker, Inc.
Pemberton, S. T. and Davidson, J. F. (1986). “Elutriation from fluidized beds –
1.Particle ejection from the dense phase into the freeboard.” Chemical
Engineering Science. 41. pp 243 – 251.
Perry, R. H.; Green, D. W. and Maloney, J. O. (Eds.) (1997). “Perry’s Chemical
Engineer’s Handbook.” 7th Edition. New York: McGraw-Hill.
Pfeffer, R. and Hill, F. B. (1978). “A feasibility study on the use of a RFB as a dust
filter.” BNL Report. No. 50990. Sept. 1978.
Ramiah, M. V. (1970). “Thermogravimetric and differential thermal analysis of
cellulose, hemicellulose and lignin.” Journal of Applied Polymer Science. 14. pp
1323 – 1337.

151
Rozainee (1998). “Incineration of Sludge Waste in a Novel Rotating Fluidized Bed.”
University of Sheffield: PhD Thesis.
Salib, P. F. (1984). “Rotating Fluidised Bed Coal Combustion.” University of
Sheffield: PhD Thesis.
Schiefelbein, G. F. (1989). “Biomass thermal gasification research. Recent results
from the United States DOE’s research program.” Biomass. Vol. 19. Issue 1 – 2.
pp 145 – 159.
Shafizadeh, F. (1968). “Pyrolysis and combustion of cellulosic materials.” Advanced
Carbohyrate Chemistry. 23. pp 419 – 474.
Shafizadeh, F. dan DeGroot, W. F. (1976). pp 1 – 18, in F. Shafizadeh, K. V.
Sarkanen and D. A. Tillman, eds. New York: Academic.
Shakespeare, W. J. (1977). “Analysis of power cycles with centrifugal fluidised bed
coal combustion.” Proc. Intersoc. Energy Conversion Conference. Washington
DC.
Shi, M. H.; Wang, H. and Hao, Y. L. (2000). “Experimental investigation of the heat
and mass transfer in a centrifugal fluidised bed dryer.” Chemical Engineering
Journal. Vol. 78. Iss. 2 – 3. pp 107 – 113.
Sloan, D. G.; Smith, P. J. and Smoot, L. D. (1986). “Modelling of swirl in turbulent
flow systems.” Prog. Energy Combust. Sci. 12. pp 163.
Spalding, D. B. (1970). “Mixing and chemical reaction in steady confined turbulent
flames.” In 13th Symp. (Int’l) on Combustion. The Combustion Institute.
Srinivasan, R. and Moagia, H. C. (1980). “Numerical computation of swirling
recirculating flow.” NASA CR. No. 165197.

152
Sturgess, G. J. and Syed, S. A. (1985). “Calculation of confined swirling flows.”
AIAA Paper. No. 85-0060.
Subzwari, M. P. (1983). “Atmospheric and Pressurized Rotating Fluidized bed
Combustion.” University of Sheffield: PhD Thesis.
Swithenbank, J.; Nasserzadeh, V.; Taib, R.; Stagg, D.; Moore, D.; Ward, M. and
Bone, J. (1997). “Incineration of Wastes in Novel High-Efficiency Tumbling and
Rotating Fluidized Bed Incinerator.” Journal of Environmental Engineering.
October 1997. pp 1047 – 1052.
Taib, M. R.; Nasserzadeh, V.; Swithenbank, J.; and Basire, S. (1997). “Process
intensification of sewage sludge disposal.” Proceedings in the 1st International
Symposium on Incineration and Flue Gas Treatment Technologies. Sheffield:
The University of Sheffield. July 1997.
Takahashi, T.; Tanaka, Z.; Itoshima, A.; and Fan, L. T. (1984). “Performance of a
rotating fluidized bed.” Journal of Chemical Engineering of Japan. 17. pp 333 –
336.
Tobiś, J. (2000). “Influence of bed geometry on its frictional resistance under
turbulent flow conditions.” Chemical Engineering Science. 55. pp 5359 – 5366.
Vargheyi, G., Szabo, P. and Antal, M. J. (1994). “Reaction kinetics of the thermal
decomposition of hemicellulose and cellulose in biomass materials.” In
Advances in Thermochemical Biomass Conversion, A. V. Bridgwater (ed.).
London: Blackie. pp. 760 – 770.
Wen, C. Y. and Yu, Y. H. (1966). “A generalized method for predicting the
minimum fluidising velocity.” AIChE Journal. Vol. 12. pp. 610 – 612.
Williams, P. T. and Besler, S. (1994). “Thermogravimetric analysis of the
components of biomass.” In Advances in Thermochemical Biomass Conversion,
A. V. Bridgwater (ed). London: Blackie. pp. 771 – 783.

153
Wong, W. Y.; Lu, Y.; Nasserzadeh, V. S.; Swithenbank, J.; Shaw, T. and Madden,
M. (2000). “Experimental investigation into the incineration of wool scouring
sludges in a novel rotating fluidised bed.” Journal of Hazardous Materials. Vol.
73. No. 2. pp 143 – 160.
Xia, J. L.; Yadigaroglu, G.; Liu, Y. S.; Schmidli, J. and Smith, B. L. (1998).
“Numerical and experimental study of swirling flow in a model combustor.” Int.
J. Heat Mass Transfer. Vol. 41. No. 11. pp 1485 – 1497.
Yeoh , A. K. and Ong, K. H. (1988). “Rice husk ash utilisation in Malaysia – SIRIM
Experience.” Presented at workshop on appropriate technologies on farm and
village level postharvest grain handling.
Zenz, F. A. and Othmer, D. F. (1960). “Fluidization and Fluid Particle Systems.”
New York: Van Nostrand Reinhold.
Zhang, DeHong and Hill, P. G. (1996). “Effect of swirl on combustion in a short
cylindrical chamber.” Combustion and Flame. 106. pp 318 – 332.

Fluidising air
Hollow drive shaft
Fluidising medium
ω
Distributor plate
Figure 1.1: A rotating fluidised bed

Sand
Secondary Chamber Primary Chamber
ω
High pressure fluidising air
Figure 1.2: Concept of a horizontal SFB combustor

Figure 2.1: Combustion intensity in the bed burning methane at 200 RPM (Rozainee, 1998)
Figure 2.2: Combustion intensity in the bed burning methane at 400 RPM (Rozainee, 1998)

Figure 2.3: Vectors of the tangential velocity component in the RFB freeboard (Rozainee, 1998)
Figure 2.4: Behavioural changes of bed with gas velocity in a conventional fluidised bed (Howard, 1989)

Stage I Low Aeration Packed Bed
Stage II Medium Aeration Partial Fluidisation
Stage III High Aeration
Complete Fluidisation
Packed Fluidised
Figure 2.5: System configurations at different stages of aeration rate
Figure 2.6: Two types of pressure drop vs. gas velocity curves in a RFB, a plateau or a maximum (Chen, 1987)

Figure 2.7: Pressure drop in a RFB as a function of air velocity for various initial bed thickness (Kao et al., 1987)
Figure 2.8: Voidage of a randomly packed bed of uniformly sized particles increases as particles become less spherical (Brown,
1950)

Figure 2.9: A powder classification diagram (Geldart, 1972)

0.0
5.0
10.0
15.0
20.0
25.0
0.00 0.10 0.20 0.30 0.40 0.50 0.60 0.70Air velocity (m/s)
Pres
sure
dro
p (c
m H
2O)
Figure 3.1: Minimum fluidisation velocity (Umf) of 0.60 – 0.85 mm sand in a conventional fluidised bed at room temperature
Lo,min
θmax
Primary Chamber
Xout,maxXin,max
Horizontal axis of symmetry
Figure 4.1: Tapered section geometry in the primary chamber of the horizontal RFB

100 mm
100 mm Secondary chamber
Thermocouples
Perforated plate
200 mm
200 mm
60o
Primary chamber
100 mm
Wire mesh
200 mm
400 mm400 mm
300 mm
53.4 mm
400 mm
Figure 4.2: Schematic diagram of the proposed dimensions of the novel horizontal rotating fluidised bed combustor
100 mm
60o
100 mm
225 mm
Primary chamber
Secondary chamber
500 mm
Wire mesh
Perforated plate
Horizontal axis
100 mm
150 mm150 mm
150 mm
40.1 mm
Thermocouples
300 mm
300 mm
Figure 4.3: Schematic diagram of the scaled down novel horizontal rotating fluidised bed combustor

0.00
0.50
1.00
1.50
2.00
2.50
3.00
0.075 0.100 0.125 0.150 0.175 0.200 0.225 0.250 0.275 0.300 0.325Radius (m)
Air
velo
city
(m/s
)
5 g 10 g 15 g 20 g 25 g
Figure 4.4: Radial velocity profile of air flow in the primary chamber of the scaled down RFB at different g-loadings (entering air flow at 1 Umfc, 30oC)
0.00
0.05
0.10
0.15
0.20
0.25
0.000 0.025 0.050 0.075 0.100 0.125 0.150 0.175 0.200 0.225 0.250 0.275 0.300 0.325
Radius (m)
CSA
for
airf
low
at b
ed su
rfac
e of
dep
th 1
50 m
m
Figure 4.5: Profiles of cross sectional area for airflow at bed surface (of depth 150 mm) with changes in the radius of the primary chamber of the scaled
down RFB

Figure 4.6: Chart for determining the terminal velocity of particles falling through fluids (Haider and Levenspiel, 1989)

0.00.51.01.52.02.53.03.54.04.55.0
0 100
Ter
min
al v
eloc
ity, U
t (m
/s)
Figure 4.7: Terminal velocity of rice husk at different temperatures and g-loadings (for g-loadings of 5 – 15, the terminal velocities were
evaluated at the bed surface of the RFB with bed depth of 150 mm, ID 600 mm and tapered at 60o)
1-g 5-g 10-g 15-g
200 300 400 500 600 700 800 900Temperature (oC)

Figure 4.8: Blueprint of the prototype novel horizontal tapered rotating fluidised bed combustor

Heat Exchanger
Tapered Bed
Flue gas
Auxiliary burner for air pre-
heating
Ash Pit
Porous distributor plate
Bearing
Primary air
Secondary Air
Pre-heated Primary Air
Opening for Ash Outlet
Spillover Ash Particles
60o
Bubbling Bed
Burner
Weir plate
Primary Air
Feed
Figure 4.9: Experimental set-up of the novel horizontal rotating fluidised bed system

Figure 5.1
Figure 5.2

Solid-body rotation movement of air in the secondary chamber
Figure 5.3
Air moving in the circumferential direction in the free vortex region of
the secondary chamber
Figure 5.4

Regions of recirculating flows
Figure 5.5
Stratification of flows in the free vortex region
Figure 5.6

Look-up Table
( )*sec ,, Hpf fuelii φφ =
FLUENT:
1. Solve fuelf , 2'fuelf , secp ,
2'secp , *H
2. Look up scalars iφ
3. Compute ( )fuelfp1
4. Compute ( )sec2 pp
prePDF:
Calculation: ( )*sec ,, Hpf fuelii φφ =
Figure 5.7: Algorithm for the solution of a non-adiabatic two-mixture-fraction case in pre-PDF and FLUENT
Figure 5.8: Three-dimensional computation grid of the tapered horizontal RFB combustor

r ro
Region 2
Region 1
Region 2
∼
Region 3
rc
ω rE
Z = L
Z = 0
Figure 5.9: Flow regions in a RFB (Levy et al., 1981)
z
vt
vt ∼ rvt ∼
vt = ωo
rc = rm
ro
ri
rE
Z = L
Z = 0
r
Figure 5.10: Variation in tangential velocity component in the RFB

Regions of recirculating flows
Figure 5.11
Regions of low static pressure expanded outwards
Figure 5.12

Low-static pressure regions concentrated along central core
Figure 5.13
Air rushing out along central core
Figure 5.14

Tracer particles caught infinitely in recirculating zones
Figure 5.15
Figure 5.16

Swirling of tracer particles near the RFB exit
Figure 5.17
Figure 5.18

Figure 5.19
Figure 5.20

Figure 5.21
Figure 5.22

Figure 5.23
Figure 5.24

Figure 5.25
0
5
10
15
20
25
30
35
0.020
0.020
- 0.05
3
0.053
- 0.06
3
0.063
- 0.07
1
0.071
- 0.09
0
0.090
- 0.10
6
0.106
- 0.12
5
0.125
- 0.30
0
0.300
- 0.50
0
0.500
- 0.71
0
0.710
- 1.00
0
1.000
- 1.18
0
1.180
- 2.00
0
Size range (mm)
Mas
s per
cent
(%)
Figure 5.26: Particle size distribution of rice husk ash obtained from combustion of rice husk in a conventional fluidised bed

Figure 5.27
Recirculating regions
Figure 5.28

Figure 5.29
Figure 5.30

Figure 5.31
100 mm
60o
100 mm
225 mm
Primary chamber
Secondary chamber
514.4 mm 28
Wire mesh
Perforated plate
40.1 mm
Thermocouples 150 mm
150 mm
200 mm
Horizontal axis
100 mm
5.6 mm
300 mm
Figure 5.32: Proposed modification to the RFB combustor to allow for spillover of ash particles from the bed

Figure 5.33
Figure 5.34

Figure 5.35
Figure 5.36

Figure 5.37


0.0
0.1
0.2
0.3
0.4
0.5
0.6
0.7
0.8
0.9
1.0
0.0 0.1 1.0 10.0
Particle diameter, Dp (mm)
Cum
ulat
ve fr
actio
n sm
alle
r th
an D p
C
umul
ativ
e fr
actio
n sm
alle
r th
an D
p
Figure 5.38: Cumulative plot for screen analysis of rice husk ash


0.10
0.15
0.20
0.25
0.30
0.35
0.40
0.45
0 5 10 15 20
g-loading
Res
iden
ce ti
me
(sR
esid
ence
tim
e (s
)
Figure 5.39: Plot of gas/particle residence time versus bed rotating speed (g-loading)
Gas residence time, tg Particle residence time, tp

Figure 5.40
Figure 5.41

Figure 5.42
Figure 5.43

Figure 5.44
Figure 5.45: Normal flame velocities for different methane concentrations in air (Sarkar, 1990)

Figure 5.46
Figure 5.47

Figure 5.48
Figure 5.49

Figure 5.50
Figure 5.51

Figure 5.52
Figure 5.53

Figure 5.54
Figure 5.55

Figure 5.56
Figure 5.57

Figure 5.58
Figure 5.59

Figure 5.60
Figure 5.61

Figure 5.62
1.0E-06
1.0E-05
1.0E-04
1.0E-03
1.0E-02
1.0E-01
1.0E+00100 120 140 160 180 200 220
Rotating Speed (RPM)
Lev
el o
f CO
Em
issi
ons (
part
per
trill
ion)
5-g
10-g
15-g
Figure 5.63: CO emission levels in the exhaust gases from the RFB combustor during the combustion of methane (9.5% methane in air) at
different rotating speeds

ω = 211 RPM (15-g loading)
ω = 173 RPM (10-g loading)
ω = 122 RPM (5-g loading)
Gradual shift of recirculating flow regions towards the
primary chamber exit
Increase in rotating speed
Figure 5.64: Velocity vectors at the axisymmetric plane of the RFB during methane combustion (9.5% methane in air, inlet veloc. = 2 m/s)
at different rotating speeds [Velocity vectors coloured by velocity magnitude (m/s)]

Figure 5.65: Thermogravimetric analysis of rice husk in a reducing environment (N2) (heating value 10.0oC/min)
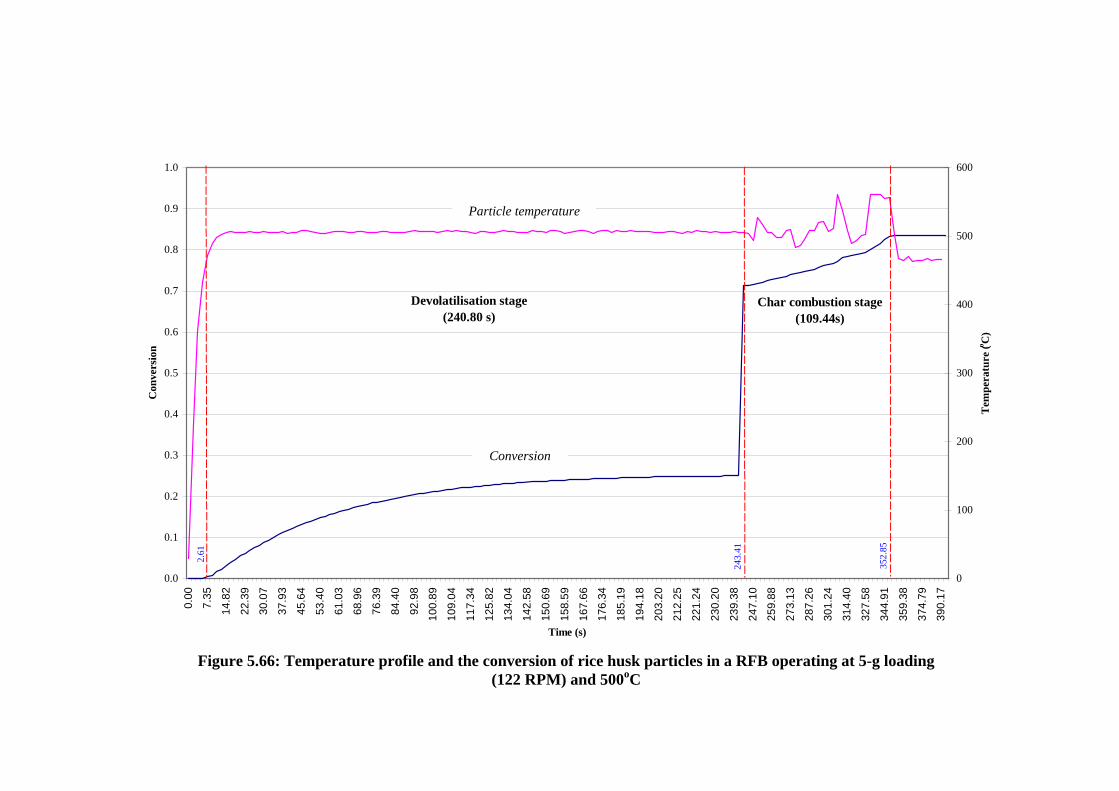
0.0
0.1
0.2
0.3
0.4
0.5
0.6
0.7
0.8
0.9
1.0
0.00
7.35
14.8
2
22.3
9
30.0
7
37.9
3
45.6
4
53.4
0
61.0
3
68.9
6
76.3
9
84.4
0
92.9
8
100.
89
109.
04
117.
34
125.
82
134.
04
142.
58
150.
69
158.
59
167.
66
176.
34
185.
19
194.
18
203.
20
212.
25
221.
24
230.
20
239.
38
247.
10
259.
88
273.
13
287.
26
301.
24
314.
40
327.
58
344.
91
359.
38
374.
79
390.
17
Time (s)
Con
vers
ion
0
100
200
300
400
500
600
Tem
pera
ture
(o C)
Devolatilisation stage(240.80 s)
Char combustion stage(109.44s)
2.61
243.
41
352.
85
Conversion
Particle temperature
Figure 5.66: Temperature profile and the conversion of rice husk particles in a RFB operating at 5-g loading (122 RPM) and 500oC

0.0
0.1
0.2
0.3
0.4
0.5
0.6
0.7
0.8
0.9
1.0
0.00
2.09
4.51
6.79
8.94
11.0
5
13.2
5
15.4
5
17.8
4
20.1
9
22.7
0
24.9
7
27.3
7
29.7
3
32.0
9
34.5
6
37.1
4
39.7
0
42.6
7
45.7
5
48.9
7
52.2
7
55.5
5
58.4
3
60.5
5
62.5
6
64.5
9
66.7
1
68.8
3
70.9
4
73.1
8
75.2
7
77.4
2
79.4
7
81.8
6
84.1
3
86.5
8
88.8
8
91.2
0
Time (s)
Con
vers
ion
0
100
200
300
400
500
600
700
Tem
pera
ture
(o C)
Devolatilisation stage(36.69 s)
Char combustion stage(40.15 s)
3.24
39.9
3
80.0
8
Conversion
Particle temperature
Figure 5.67: Temperature profile and the conversion of rice husk particles in a RFB operating at 5-g loading (122 RPM) and 600oC

0.0
0.1
0.2
0.3
0.4
0.5
0.6
0.7
0.8
0.9
1.0
0.00
0.39
1.03
1.66
2.29
2.86
3.46
4.09
4.72
5.34
5.96
6.64
7.29
8.01
8.70
9.27
9.88
10.5
7
11.2
8
11.9
8
12.8
9
13.7
5
14.7
3
15.7
1
16.6
8
17.5
8
18.4
4
19.4
4
20.4
5
21.4
3
22.4
1
23.3
8
24.3
4
25.2
7
26.2
3
27.1
8
28.1
2
29.0
6
30.0
0
Time (s)
Con
vers
ion
0
100
200
300
400
500
600
700
800
Tem
pera
ture
(o C)
Devolatilisation stage(9.46s)
Char combustion stage(14.94s)
2.24
11.7
0
26.6
4
Conversion
Particle temperature
Figure 5.68: Temperature profile and the conversion of rice husk particles in a RFB operating at 5-g loading (12RPM) and 700
2 oC

0
50
100
150
200
250
300
350
400
400 500 600 700 800
Combustor Temperature (oC)
Com
bust
ion
reac
tion
time
(s)
Undesirable change of
resulting silica in ash from
amorphous to crystallised state if bed operated
beyond this regime
Complete combustion of rice husk
Devolatilisation
Char burnout
Figure 5.69: Effect of combustor operating temperature [RFB @ 5-g loading (122 RPM)] on the combustion reaction
time of rice husk particles

0.0
0.1
0.2
0.3
0.4
0.5
0.6
0.7
0.8
0.9
1.0
0.00
0.55
1.23
1.98
2.67
3.35
4.13
4.91
5.61
6.38
7.17
7.99
8.80
9.60
10.4
6
11.2
3
12.0
9
12.8
0
13.5
0
14.4
3
15.6
7
16.8
6
17.7
5
18.5
9
19.5
7
20.5
1
21.5
6
22.5
0
23.4
7
24.4
8
25.5
8
26.6
9
27.8
1
28.9
2
30.0
4
31.1
5
32.2
6
33.3
8
34.4
9
Time (s)
Con
vers
ion
0
100
200
300
400
500
600
700
800
900
Tem
pera
ture
(o C)
Devolatilisation stage(9.68 s)
Char combustion stage(12.65 s)
2.17
11.8
5
24.5
0
Conversion
Particle temperature
Figure 5.70: Temperature profile and the conversion of rice husk particles in a RFB operating at 10-g loading
(173 RPM) and 700oC

0.0
0.1
0.2
0.3
0.4
0.5
0.6
0.7
0.8
0.9
1.0
0.00
0.51
1.15
1.77
2.41
2.99
3.67
4.32
5.00
5.80
6.54
7.22
7.90
8.57
9.26
9.96
10.6
8
11.4
6
12.2
8
13.3
2
14.9
3
15.7
5
16.6
3
18.0
5
19.2
6
20.6
6
22.1
1
23.4
8
24.9
0
26.2
9
27.6
4
28.9
4
30.2
7
31.6
4
33.0
3
34.3
9
35.7
4
37.0
7
38.4
2
Time (s)
Con
vers
ion
0
100
200
300
400
500
600
700
800
900
Tem
pera
ture
(oC
)
Devolatilisation stage(10.01 s)
Char combustion stage(13.73 s)
2.10
12.1
1
25.8
4
Conversion
Particle temperature
Figure 5.71: Temperature profile and the conversion of rice husk particles in a RFB operating at 12.5-g loading
(192 RPM) and 700oC

0.0
0.1
0.2
0.3
0.4
0.5
0.6
0.7
0.8
0.9
1.0
0.00
0.51
1.18
1.80
2.47
3.16
3.84
4.52
5.13
5.85
6.55
7.25
7.98
8.75
9.58
10.3
1
11.0
2
11.8
0
12.6
0
13.7
6
14.7
6
15.8
0
16.8
2
17.8
2
18.8
6
19.9
9
21.2
6
22.4
1
23.6
4
24.8
5
26.0
3
27.1
9
28.3
2
29.4
5
30.5
1
31.5
7
32.4
8
33.5
1
Time (s)
Con
vers
ion
0
100
200
300
400
500
600
700
800
Tem
pera
ture
(o C)
Devolatilisation stage(10.54 s)
Char combustion stage(18.70 s)
2.06
12.6
0
31.3
0
Low
-tem
pera
ture
ban
d -
po
ssib
le k
inet
ic-c
ontro
lled
com
bust
ion
Conversion
Particle temperature
Figure 5.72: Temperature profile and the conversion of rice husk particles in a RFB operating at 15-g loading
(211 RPM) and 700oC

0
5
10
15
20
25
30
35
0.0 2.5 5.0 7.5 10.0 12.5 15.0 17.5
Rotating speed (g-loading)
Com
butio
n re
actio
n tim
e (s
)
Devolatilisation
Char combustion
Total RH combustion time(devolatilisation + char combustion)
Minimum combustion reaction time at 10-g
loading
Figure 5.73: Effect of combustor rotating speed (RFB @ 700oC) on the combustion reaction time of rice husk


Pilot burner
Feed hopper
Control panel
SFB chambers
High-pressure blower
Plate 6.1: The prototype of the Spinning Fluidised Bed (SFB) combustor system

Flue gas outlet
Secondary chamber
Primary chamber
Plate 6.2: Spinning fluidised bed chambers

Plate 6.3: Primary blower unit

Heater unit
Air at ambient
temperature from primary
blower
Plate 6.4: Air pre-heating system

Thermocouples
Plate 6.5: Temperature sensors at the SFB primary chamber and pre-heated air supply
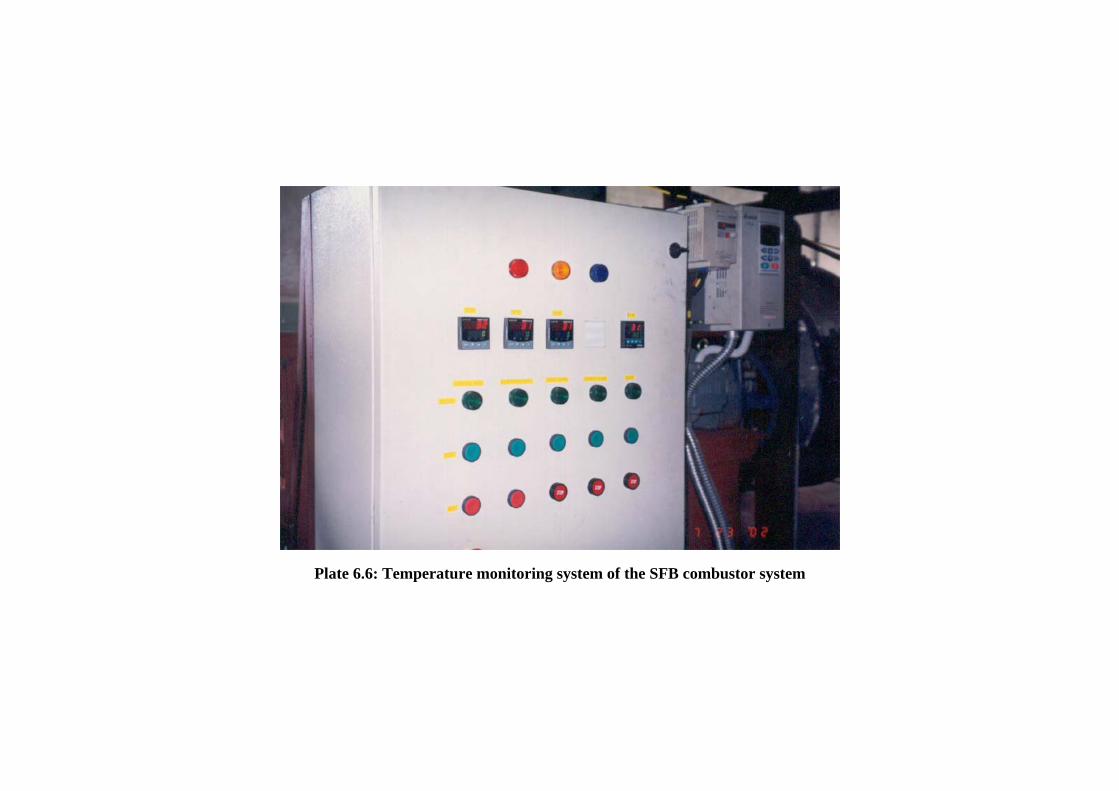
Plate 6.6: Temperature monitoring system of the SFB combustor system

Inverter control unit for spinning
bed
Inverter control unit
for screw conveyor
Plate 6.7: Inverter control units for the spinning bed chambers and screw conveyor

Pilot burner
Spinning bed
chamber
Plate 6.8: Liquefied Petroleum Gas (LPG) Flame Pilot Burner

Plate 6.9: Ignition of the pilot burner

APPENDIX A
TENDER DOCUMENT FOR THE DESIGN,
DEVELOPMENT, SUPPLY, DELIVERY, INSTALLATION AND COMMISSIONING OF A
NOVEL SPINNING FLUIDISED BED COMBUSTOR

ATTACHMENT I
VIDEO FOOTAGE OF THE TEST RUNS ON THE
DEVELOPED SFB COMBUSTOR SYSTEM
Note: CD (ID: SFB Test Run) attached at the back cover of report

ATTACHMENT II
VIDEO FOOTAGE OF THE DELIVERY OF THE SFB
COMBUSTOR SYSTEM TO UNIVERSITI TEKNOLOGI
MALAYSIA
Note: CD (ID: SFB Delivery I & II) attached at the back cover of report

ATTACHMENT III
PAPERS PRESENTED AT
SEMINARS/SYMPOSIUMS
UNDER THE RESEARCH
FUND

ATTACHMENT IV
USER’S MANUAL FOR THE
SFB COMBUSTOR SYSTEM

FAKULTI KEJURUTERAAN KIMIA DAN KEJURUTERAAN SUMBER ASLI UNIVERSITI TEKNOLOGI MALAYSIA
JADUAL PENENTUAN TEKNIKAL JABATAN : KEJURUTERAAN KIMIA, FAKULTI KEJURUTERAAN KIMIA DAN KEJURUTERAAN SUMBER ASLI
Bil. Nama dan Alat-alat Penentuan Spesifikasi Penender
TITLE: TENDER FOR THE DESIGN, DEVELOPMENT, SUPPLY, DELIVERY, INSTALLATION AND COMMISSIONING OF A NOVEL SPINNING FLUIDISED BED FOR THE DEPARTMENT OF CHEMICAL ENGINEERING, FACULTY OF CHEMICAL ENGINEERING& NATURAL RESOURCES ENGINEERING, UNIVERSITI TEKNOLOGI MALAYSIA, SKUDAI, JOHOR. SCOPE: In order to cope with the increasing demand for waste incineration technologies, the Department has embarked on a project utilising the spinning fluidised bed technology. The experimental rig is needed to conduct research activities to determine the effectiveness and suitability of the system to cater for various types of wastes while conforming to stringent environmental regulations. Once proven, the system has the potential to be commercialised to cater for small-scale on-site waste disposal.

FAKULTI KEJURUTERAAN KIMIA DAN KEJURUTERAAN SUMBER ASLI UNIVERSITI TEKNOLOGI MALAYSIA
JADUAL PENENTUAN TEKNIKAL JABATAN : KEJURUTERAAN KIMIA, FAKULTI KEJURUTERAAN KIMIA DAN KEJURUTERAAN SUMBER ASLI
Bil. Nama dan Alat-alat Penentuan Spesifikasi Penender 1.0 1.1 1.1.1 1.1.2
SPECIFICATION: GENERAL SUPPLY AND DELIVERY This tender includes the supply, delivery from the tenderer and commissioning on-site at Block N12 of Faculty of Chemical Engineering & Natural Resources Engineering, UTM Skudai, Johor of a Spinning Bed Combustor System. Tenderer is requested to specify the earliest delivery and commissioning date. In addition, the tenderer should submit a detail work schedule showing how the project is going to be executed to meet the stipulated time frame.
Comply 12 – 24 weeks

FAKULTI KEJURUTERAAN KIMIA DAN KEJURUTERAAN SUMBER ASLI UNIVERSITI TEKNOLOGI MALAYSIA
JADUAL PENENTUAN TEKNIKAL JABATAN : KEJURUTERAAN KIMIA, FAKULTI KEJURUTERAAN KIMIA DAN KEJURUTERAAN SUMBER ASLI
Bil. Nama dan Alat-alat Penentuan Spesifikasi Penender 1.1.3 1.1.4 1.1.5 1.1.6
If the successful tenderer has not completed the supply, installation, testing and eventual handing over of the equipment within the said time and if UTM have not cancelled the contract under the power conferred on it by the General Tendering Conditions of the specifications, the successful tenderer should pay, as liquidated damages, an amount based on the formula given in the tender condition. The amount so calculated may be deducted from any money payable to successful vendor by UTM. UTM reserves the right to accept or reject any extension of the period required for the delivery and/or competion of the work. If the tenderer is an equipment supplier and not the manufacturer of the equipment, the supplier and the major manufacturer will be jointly and severally liable for fulfilling all the terms, conditions and guarantees entered into in the contract for supply. The tenderer is required to provide an original certified true copy of the manufacturing/supplying warranty certificate for the hardware/software provided.
Comply Comply Comply Comply

FAKULTI KEJURUTERAAN KIMIA DAN KEJURUTERAAN SUMBER ASLI UNIVERSITI TEKNOLOGI MALAYSIA
JADUAL PENENTUAN TEKNIKAL JABATAN : KEJURUTERAAN KIMIA, FAKULTI KEJURUTERAAN KIMIA DAN KEJURUTERAAN SUMBER ASLI
Bil. Nama dan Alat-alat Penentuan Spesifikasi Penender 1.1.7 1.1.8 1.1.9
The tenderer is requested to justify their competency for executing the job successfully. The tenderer is required to submit the company’s past experience in handling this kind of job. All government regulations, law pertaining to the importation, supply and delivery of the equipment must be followed by the tenderer. Insurance cover costs during the course of executing the job will be borne by the tenderer.
Comply Comply Comply

FAKULTI KEJURUTERAAN KIMIA D AN KEJURUTERAAN SUMBER ASLI UNIVERSITI TEKNOLOGI MALAYSIA
JADUAL PENENTUAN TEKNIKAL JABATAN : KEJURUTERAAN KIMIA, FAKULTI KEJURUTERAAN KIMIA DAN KEJURUTERAAN SUMBER ASLI
Bil. Nama dan Alat-alat Penentuan Spesifikasi Penender 1.2 1.2.1 1.2.2 1.2.3 1.2.4
INSTALLATION AND COMMISSIONING All items of equipment shall be installed on site by the successful tenderer at no extra cost to UTM. The successful tenderer shall undertake to install and commission the hardware and software on site (Block N12 of Faculty of Chemical Engineering & Natural Resources Engineering, UTM Skudai) by a qualified Engineer. Such commission includes setting of equipment, testing according to an acceptable standards and test run of the softwares. All costs related to the above work shall be borne by the tenderer. If the work carried in item 1.2.2 is not satisfactory, UTM has the right NOT to accept the handing over. UTM has the right to call other professional parties to complete the job satisfactorily. The cost shall be borne by the tenderer. All government regulations and procedures must be followed during the installation and commissioning work. Approval from any government authorities wherever applicable will be under the responsibility of the tenderer.
Comply Comply Comply Comply

FAKULTI KEJURUTERAAN KIMIA DAN KEJURUTERAAN SUMBER ASLI UNIVERSITI TEKNOLOGI MALAYSIA
JADUAL PENENTUAN TEKNIKAL JABATAN : KEJURUTERAAN KIMIA, FAKULTI KEJURUTERAAN KIMIA DAN KEJURUTERAAN SUMBER ASLI
Bil. Nama dan Alat-alat Penentuan Spesifikasi Penender 1.3 1.3.1
STAFF TRAINING The successful tenderer shall provide proper and satisfactory on job training at the tenderer’s own cost. All cost related to the training i.e. training fees, transportation, appropriate subsistence fees (Malaysian Government rates), accommodation (where applicable), refreshment, courseware etc., will be borne by the tenderer. All related training cost must be separately quoted from the equipment supplied but inclusive in the tender price. The minimum training required are as follows: Training of nominated UTM personnel on-site at UTM. The training period must not be less than three (3) working days or to the specification of UTM and must include, but not limited to the followings: Training on the proper handling and operation of the
spinning fluidised bed testing rig. Training on routine maintenance, general trouble-
shooting and repair. Training on the use of the auxiliary equipment for a
complete system of “field to finish”.
Comply

FAKULTI KEJURUTERAAN KIMIA DAN KEJURUTERAAN SUMBER ASLI UNIVERSITI TEKNOLOGI MALAYSIA
JADUAL PENENTUAN TEKNIKAL JABATAN : KEJURUTERAAN KIMIA, FAKULTI KEJURUTERAAN KIMIA DAN KEJURUTERAAN SUMBER ASLI
Bil. Nama dan Alat-alat Penentuan Spesifikasi Penender 1.3.2 1.4 1.4.1 1.4.2 1.4.3
The medium of instruction, including all training materials which must be provided, during the whole duration of the training period must be in English of Bahasa Malaysia. WARRANTY PERIOD The tenderer shall state the warranty period of all equipment supplied. The warranty period must not be less than one (1) year from the date of complete handing over. Any equipment/material defects or faulty operation due to manufacturer or installation shall be the responsibility of the suppliers who shall immediately make good and/or replace any such defect or faulty components. All labour and materials needed during the warranty period shall be supplied free of charge. Any exclusion should be clearly specified in the tender.
Comply Comply (warrant is valid for 1 calendar year under normal operations within the stated manufacturer specification) Comply, except for fragile items such as heater, sensors and motors which will covers for a period of 3 calendar months from date of commissioned)

FAKULTI KEJURUTERAAN KIMIA DAN KEJURUTERAAN SUMBER ASLI UNIVERSITI TEKNOLOGI MALAYSIA
JADUAL PENENTUAN TEKNIKAL JABATAN : KEJURUTERAAN KIMIA, FAKULTI KEJURUTERAAN KIMIA DAN KEJURUTERAAN SUMBER ASLI
Bil. Nama dan Alat-alat Penentuan Spesifikasi Penender 1.5 1.6
MAINTENANCE Full maintenance support of the equipment must be available locally. The engineering/maintenance support shall be provided by competent personnel. The tenderer will have to indicate how he intends to meet this requirement, including naming the facilities available at their locations. MANUALS & DOCUMENTATION The successful tenderer must provide at least two (2) sets (Comprising of one (1) set of original & one (1) set of duplicate) of the following items: a) User’s Guide for the combustor system b) Maintenance/ Technical Manual c) Other manuals available (please specify) The tenderer must clearly specify the relevant manuals for each individual element of the system. All documents listed above must be in English or Bahsa Malaysia.
Comply with technical staff and workshop available at manufacturer location Comply with English manuals

FAKULTI KEJURUTERAAN KIMIA DAN KEJURUTERAAN SUMBER ASLI UNIVERSITI TEKNOLOGI MALAYSIA
JADUAL PENENTUAN TEKNIKAL JABATAN : KEJURUTERAAN KIMIA, FAKULTI KEJURUTERAAN KIMIA DAN KEJURUTERAAN SUMBER ASLI
Bil. Nama dan Alat-alat Penentuan Spesifikasi Penender 1.7
OTHERS The tenderer shall guarantee the availability of a good after sales service for all the equipment supplied. UTM reserves the right not to consider and automatically reject tenderer’s offer which fails to show any of the above mentioned items.
Comply

FAKULTI KEJURUTERAAN KIMIA DAN KEJURUTERAAN SUMBER ASLI UNIVERSITI TEKNOLOGI MALAYSIA
JADUAL PENENTUAN TEKNIKAL JABATAN : KEJURUTERAAN KIMIA, FAKULTI KEJURUTERAAN KIMIA DAN KEJURUTERAAN SUMBER ASLI
Bil. Nama dan Alat-alat Penentuan Spesifikasi Penender 2.0 2.1
TECHNICAL SPECIFICATIONS OF TOTAL SPINNING FLUIDISED BED COMBUSTOR SYSTEM The combustor system comprises the following features and subassemblies:- stainless steel rotating fluidised bed as per illustrated
attached drawings. The combustion chambers of the spinning bed shall be able to withstand temperatures of up to 1200oC.
rotating jacketed body c/w insulation monitoring thermocouples with jacketed sleeving to the
fluidised bed customized inlet assembly for heated air bearing assembly for the spinning bed assembly screw conveyor inside the spinning bed c/w jacketed pipe
for secondary air. The screw conveyor system shall be suitable for feeding different types of sludge and solid waste.
customized insulation clamper for rotary motion and shall be able to seal the air, so that pressurised air of up to 4 m H2O could be supplied into the spinning combustion chamber.
primary burner for high pressure air (up to 4 m H2O)
The general construction of the combustor will follow closely to the drawings attached in the tender documents with modifications as and when in accordance to engineering safety requirements. Comply with stainless steel construction. The unit is expected to have a core temperature of 1200oC with graduated temperature gradient towards the stainless steel walls. Generally, the unit walls are expected to experience a temperature range of 600 – 800oC. Comply Comply Comply Comply Comply for certain sludge and solids as informed but not for all types Comply Comply

FAKULTI KEJURUTERAAN KIMIA DAN KEJURUTERAAN SUMBER ASLI
UNIVERSITI TEKNOLOGI MALAYSIA JADUAL PENENTUAN TEKNIKAL
JABATAN : KEJURUTERAAN KIMIA, FAKULTI KEJURUTERAAN KIMIA DAN KEJURUTERAAN SUMBER ASLI
Bil. Nama dan Alat-alat Penentuan Spesifikasi Penender 2.2
secondary burner unit for fluidised bed to maintain combustion temperatures of up to 1200oC
variable speed motor assembly for the spinning bed assembly capable of rotation up to 1000 rpm
variable speed motor assembly for the screw conveyor primary high pressure blower with capacity up to 1200
m3/hr at ambient temperature (30oC) and pressure head of 4 m H2O
secondary air blower the frame and chassis assembly for the spinning bed
unit c/w ash pit and weir control panel and electronic housing for the above
system The tenderer shall submit detailed design calculations and drawings of the system. The design calculations should illustrate the sizing of the blowers, pumps, burners and motors. The detailed drawings should include the blueprint of the system complete with its three dimensional views.
Comply Variable speed motor assembly is capable of only up to 100 rpm Comply Comply Comply Comply Comply Comply